Embed Size (px)
Citation preview

Reference Interval Validation American Society for Clinical Laboratory
Science – Michigan 2016 Annual Meeting
April 1, 2016
Jennifer Thomas DVM, PhD, DACVP
Section Chief, Clinical Pathology
Diagnostic Center for Population and
Animal Health
What are reference intervals (RIs)? Distribution of numerical
test results expected in representative population of healthy individuals
Used to make medical decisions about diagnosis, treatment & prognosis
Population based RIs most commonly used
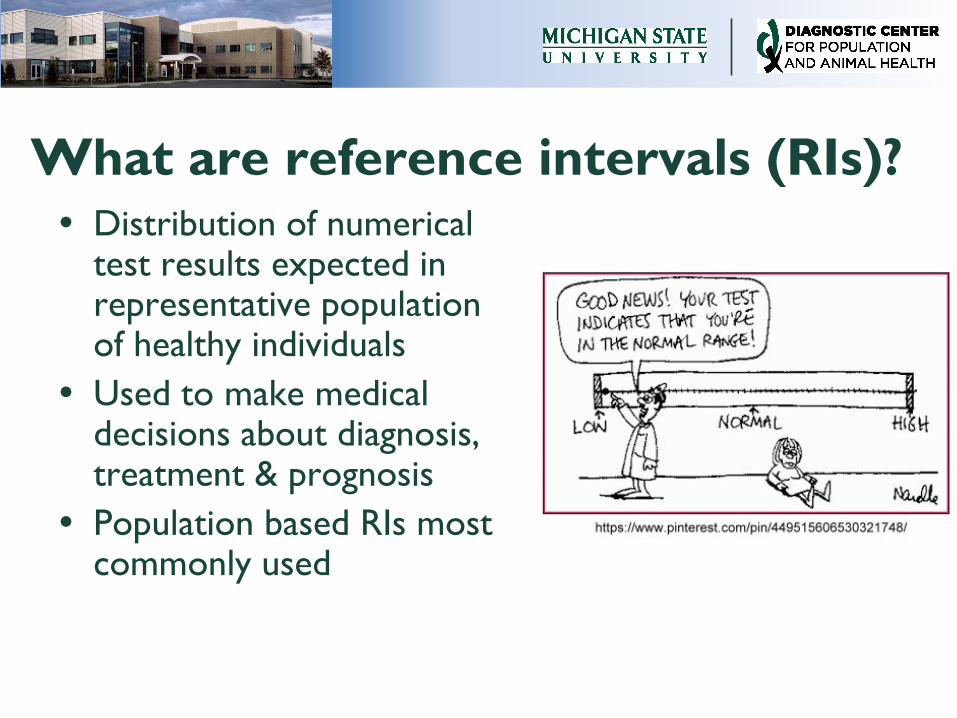
Can RI be shared? RIs are specific to laboratory
– Can be significant differences in results from the
same sample analyzed by different labs
Validation required to use RI from another
source
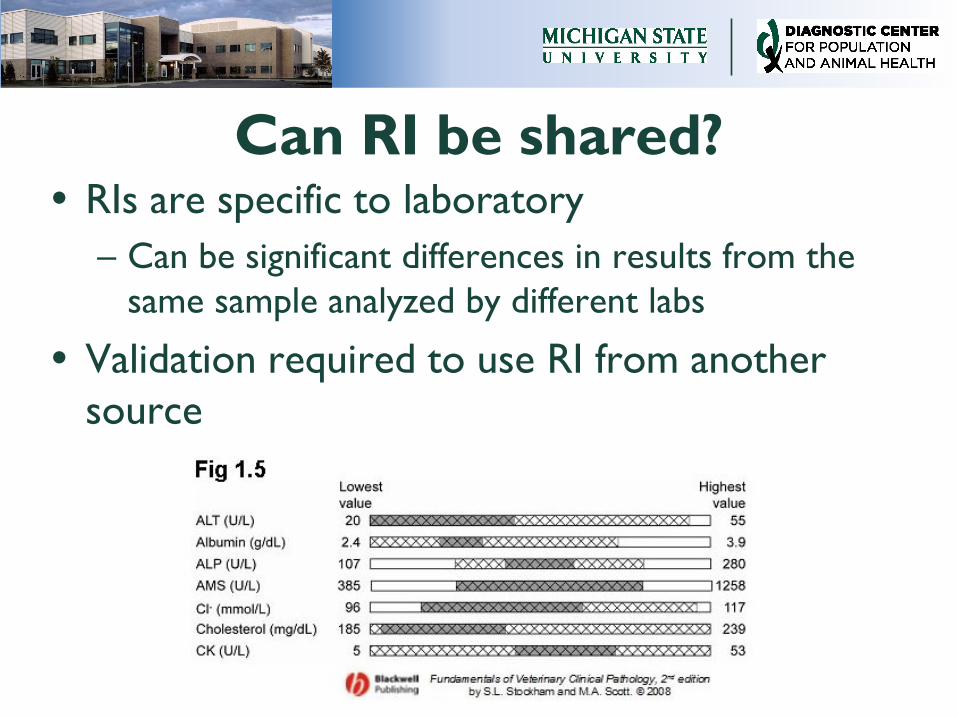
How should RIs be used clinically? RIs do not determine health or illness
– Common in healthy individual to have value(s)
outside reference limits in panel of tests
– Value within RI may not be normal
RI ≠ decision limit
– Decision limit = threshold at which result above or
below value triggers medical decision

Road map for presentation De novo generation of population
based RI
– Steps to develop RI
– Advantages and disadvantages
Alternatives to de novo generation
of population based RI
– Transference & validation
– Multicenter studies
– Advantages and disadvantages
Subject-based RI
Population based RI
1970: IFCC formed Expert Panel on Reference Values that proposed standards for determination of RI – Adopted by groups including CLSI
Updated by CLSI in 2008 to include: – Methods to transfer and validate RI from
other labs or sources
– Recommendations for use of robust methods to determine RI using small sample sizes
Step for de novo RI determination Literature search
Define reference population
Questionnaire to ID reference individuals
Determine # of individuals in reference population
Select reference individuals
Collect samples
Analyze samples
Histogram to evaluate data
ID outliers
Determine distribution of reference data
Statistical analysis to determine upper & lower reference limits
Determine if need to partition data
Document all steps used and create summary report

Reference Population
Sources of reference
individuals: direct
Preferred method
Use set of defined criteria to select reference
individuals from reference population – A priori – inclusion criteria applied before collection
– A posteriori – inclusion criteria applied post-collection
Collect samples from individuals specifically to
generate de novo RIs
Sources of reference
individuals: indirect
Mining of reference values from database:
sample collected for reasons other than RI
determination – Determination of reference individuals based upon
mathematical assumptions used to define “normal”
– Can be improved if selection of values incorporates
clinical information in database
Higher risk of including values from unhealthy
individuals
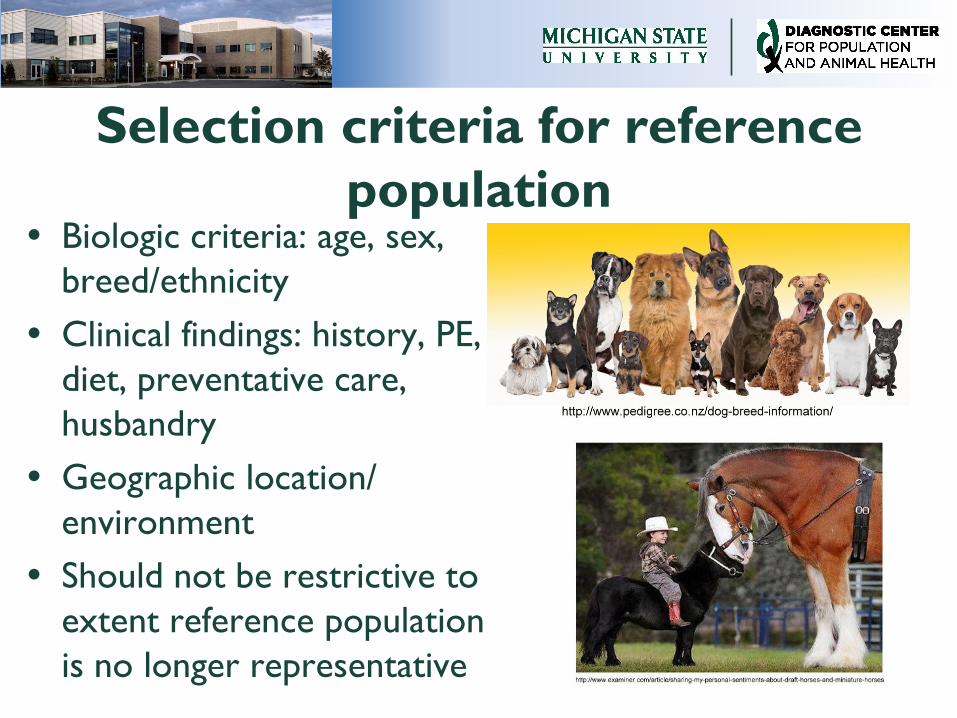
Selection criteria for reference
population Biologic criteria: age, sex,
breed/ethnicity
Clinical findings: history, PE,
diet, preventative care,
husbandry
Geographic location/
environment
Should not be restrictive to
extent reference population
is no longer representative
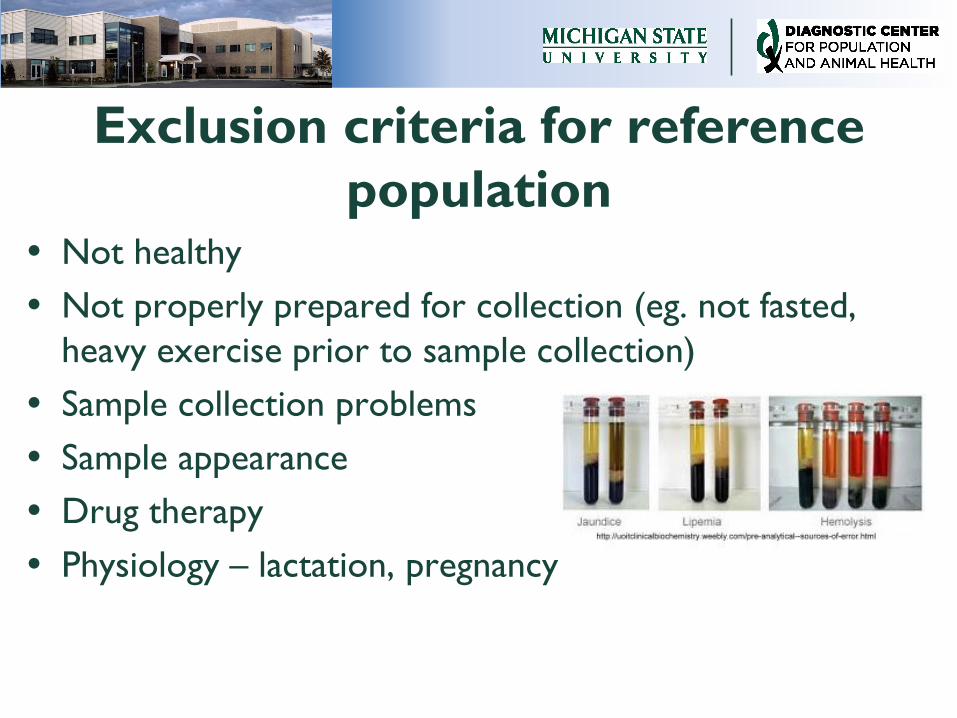
Exclusion criteria for reference
population Not healthy
Not properly prepared for collection (eg. not fasted,
heavy exercise prior to sample collection)
Sample collection problems
Sample appearance
Drug therapy
Physiology – lactation, pregnancy
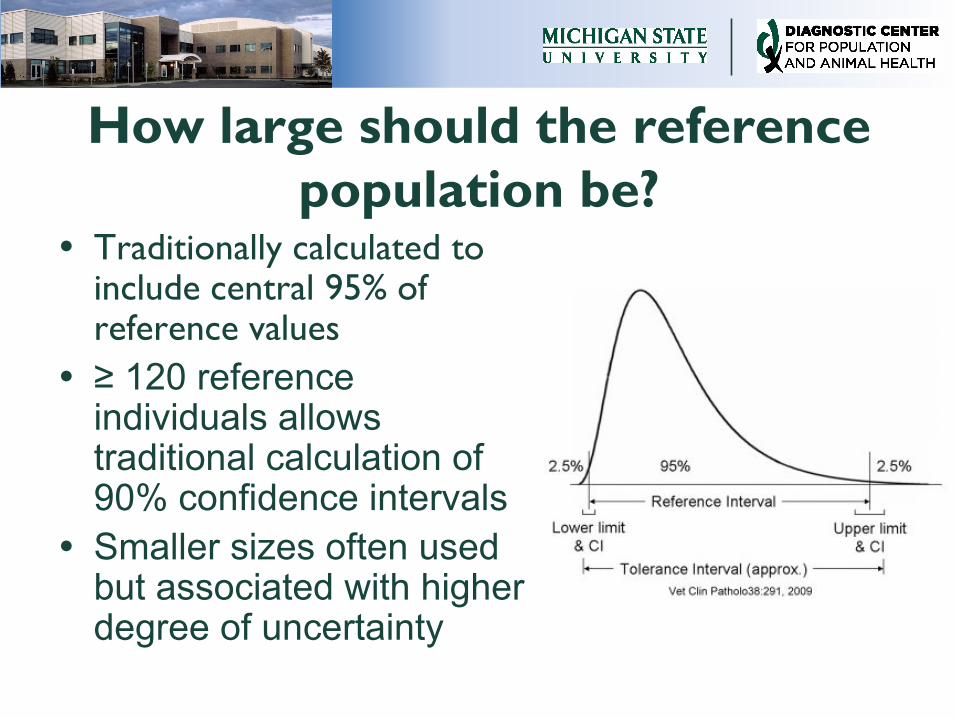
How large should the reference
population be? Traditionally calculated to
include central 95% of reference values
≥ 120 reference individuals allows traditional calculation of 90% confidence intervals
Smaller sizes often used but associated with higher degree of uncertainty
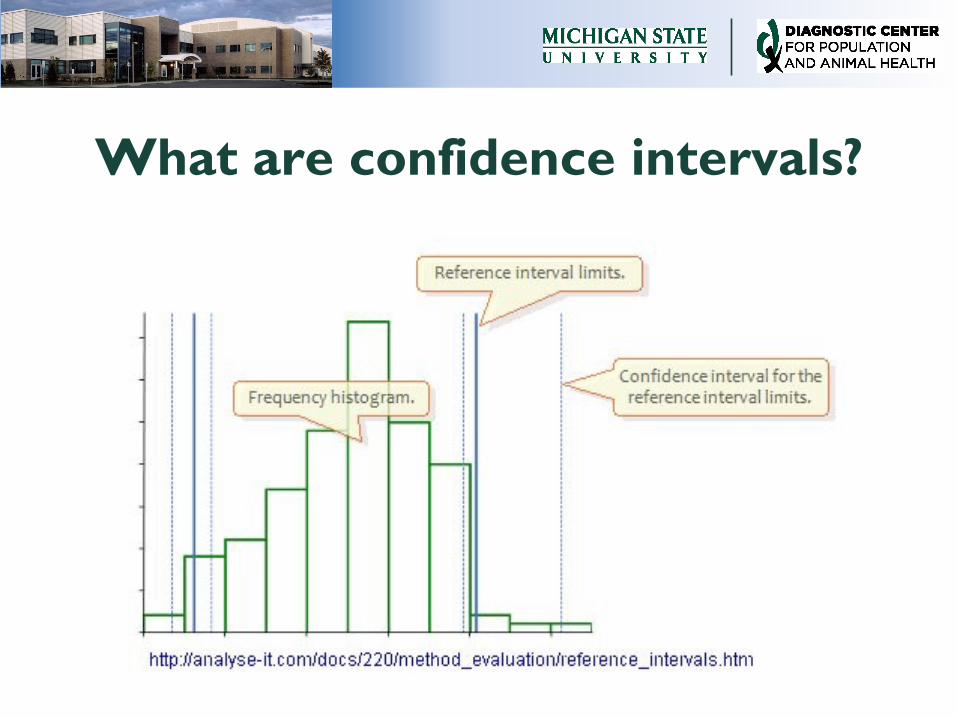
What are confidence intervals?
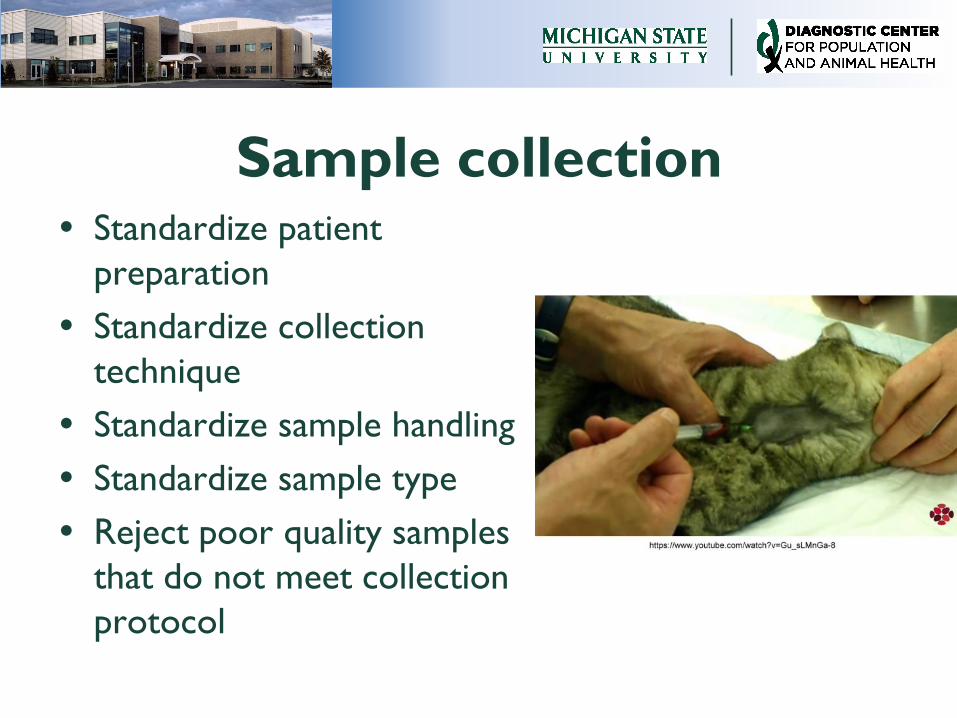
Sample collection Standardize patient
preparation
Standardize collection
technique
Standardize sample handling
Standardize sample type
Reject poor quality samples
that do not meet collection
protocol
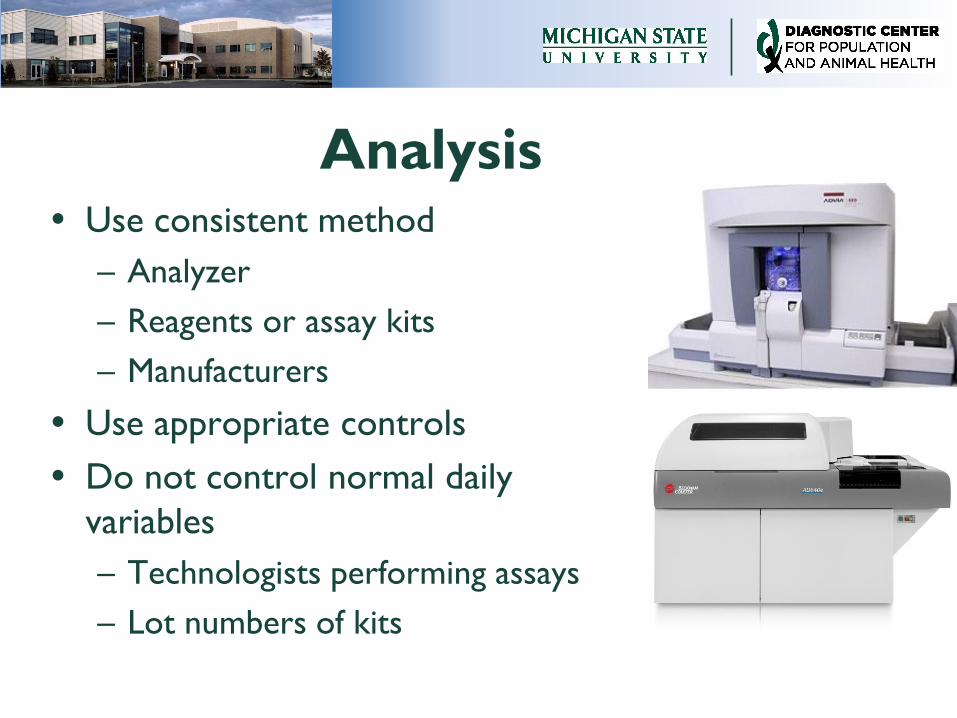
Analysis Use consistent method
– Analyzer
– Reagents or assay kits
– Manufacturers
Use appropriate controls
Do not control normal daily
variables
– Technologists performing assays
– Lot numbers of kits
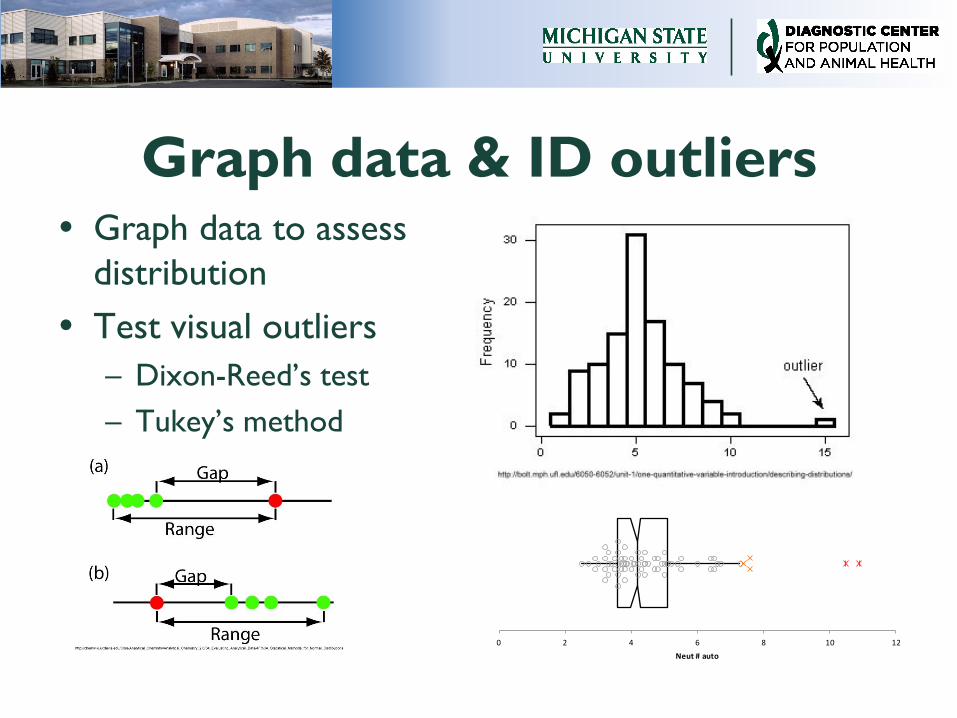
Graph data & ID outliers Graph data to assess
distribution
Test visual outliers
– Dixon-Reed’s test
– Tukey’s method
0 2 4 6 8 10 12
Neut # auto

What is an outlier?
Value that is discordant from majority of
reference values and does not belong
Arise from inclusion of unhealthy
individuals, recording errors, collection/
handling issues, analytic errors, or
biologic variation
Minimized by rigorous adherence to
population selection criteria, pre-
analytic protocols, & analytic protocols
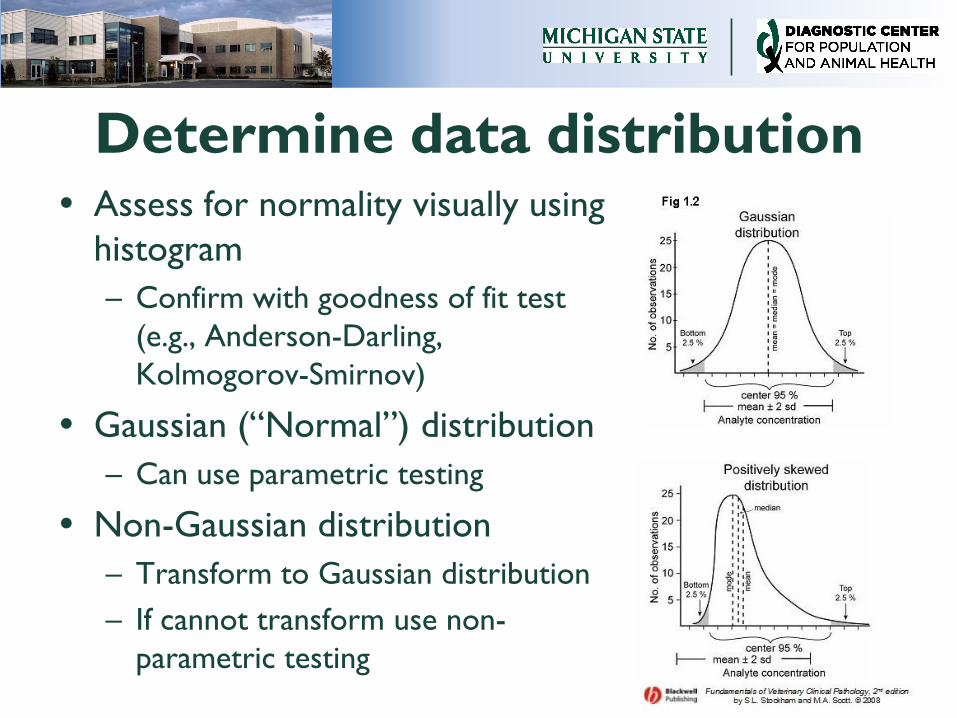
Determine data distribution Assess for normality visually using
histogram
– Confirm with goodness of fit test
(e.g., Anderson-Darling,
Kolmogorov-Smirnov)
Gaussian (“Normal”) distribution
– Can use parametric testing
Non-Gaussian distribution
– Transform to Gaussian distribution
– If cannot transform use non-
parametric testing
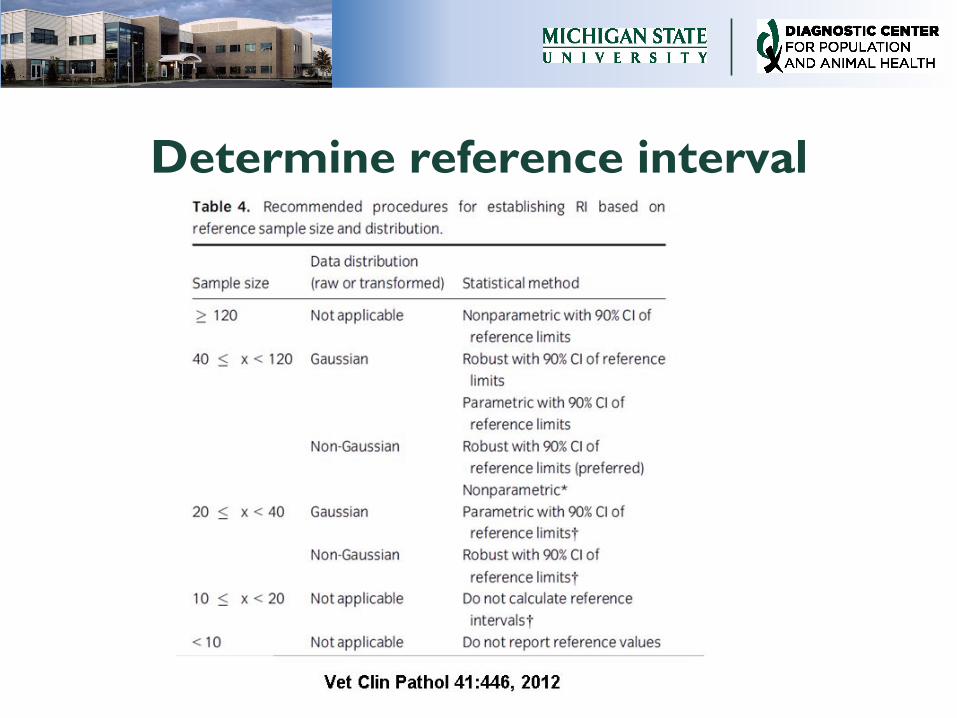
Determine reference interval
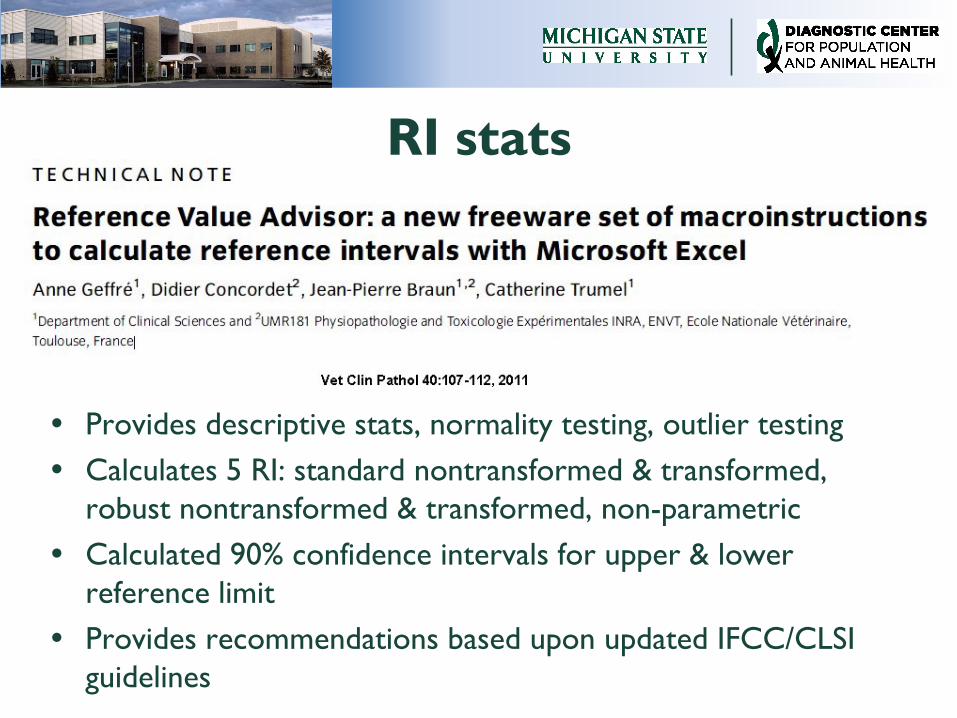
RI stats
Provides descriptive stats, normality testing, outlier testing
Calculates 5 RI: standard nontransformed & transformed,
robust nontransformed & transformed, non-parametric
Calculated 90% confidence intervals for upper & lower
reference limit
Provides recommendations based upon updated IFCC/CLSI
guidelines
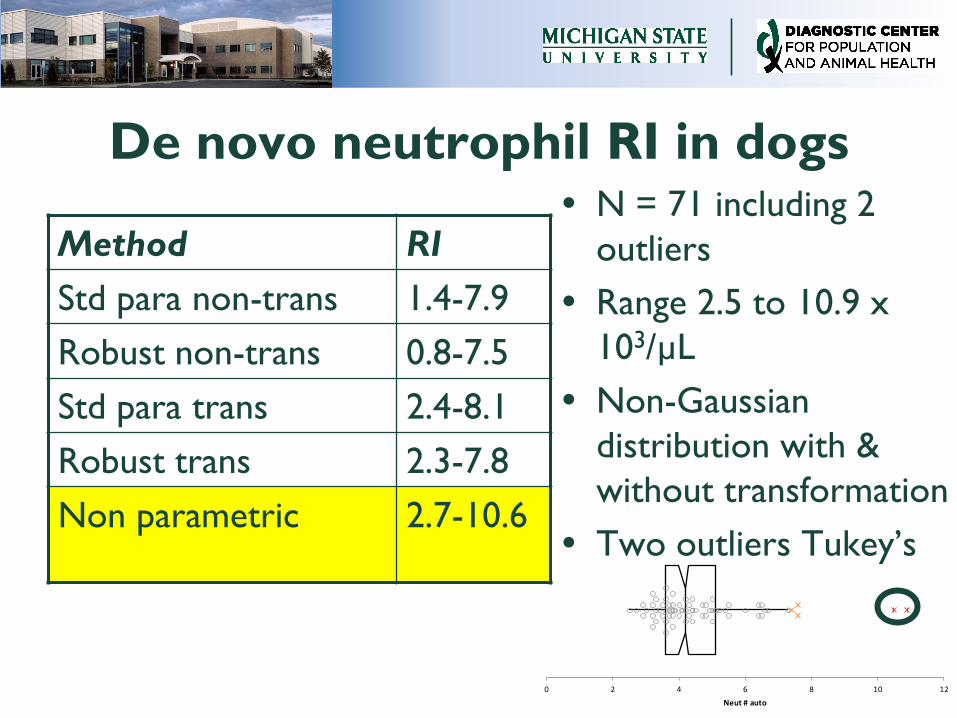
De novo neutrophil RI in dogs
Method RI
Std para non-trans 1.4-7.9
Robust non-trans 0.8-7.5
Std para trans 2.4-8.1
Robust trans 2.3-7.8
Non parametric 2.7-10.6
N = 71 including 2
outliers
Range 2.5 to 10.9 x
103/µL
Non-Gaussian
distribution with &
without transformation
Two outliers Tukey’s
0 2 4 6 8 10 12
Neut # auto
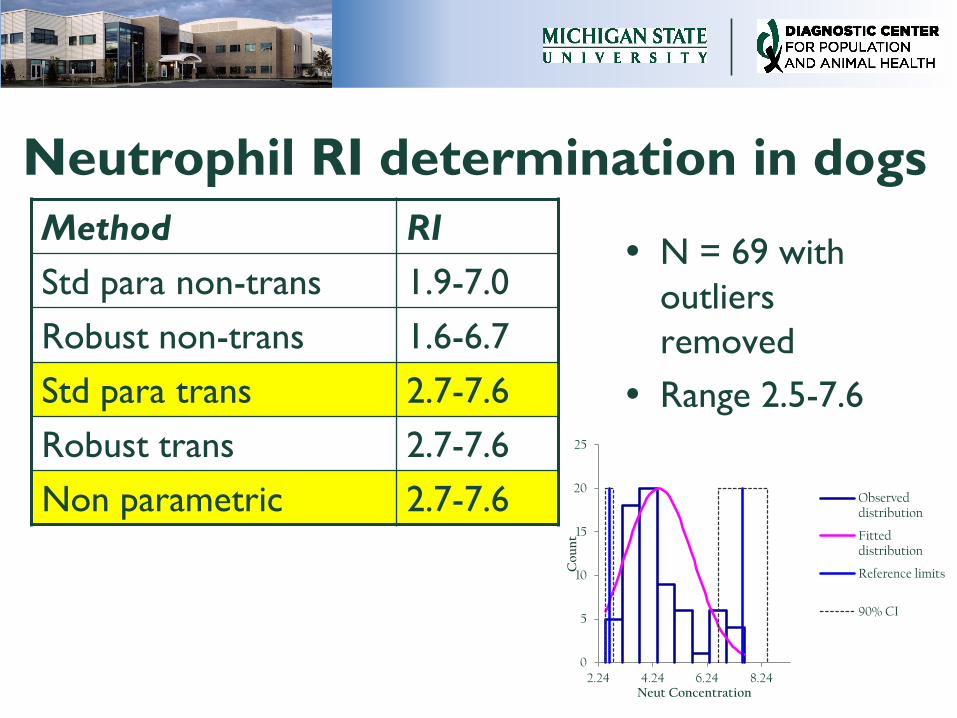
Neutrophil RI determination in dogs
Method RI
Std para non-trans 1.9-7.0
Robust non-trans 1.6-6.7
Std para trans 2.7-7.6
Robust trans 2.7-7.6
Non parametric 2.7-7.6
N = 69 with
outliers
removed
Range 2.5-7.6
0
5
10
15
20
25
2.24 4.24 6.24 8.24
Co
un
t
Neut Concentration
Observed distribution
Fitted distribution
Reference limits
90% CI
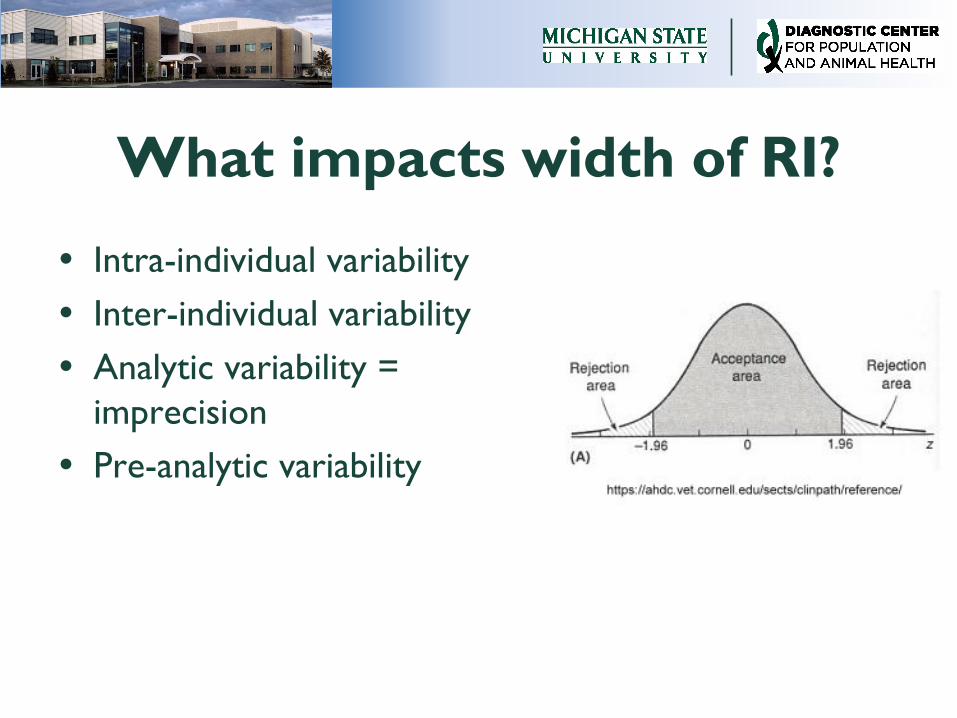
What impacts width of RI?
Intra-individual variability
Inter-individual variability
Analytic variability =
imprecision
Pre-analytic variability
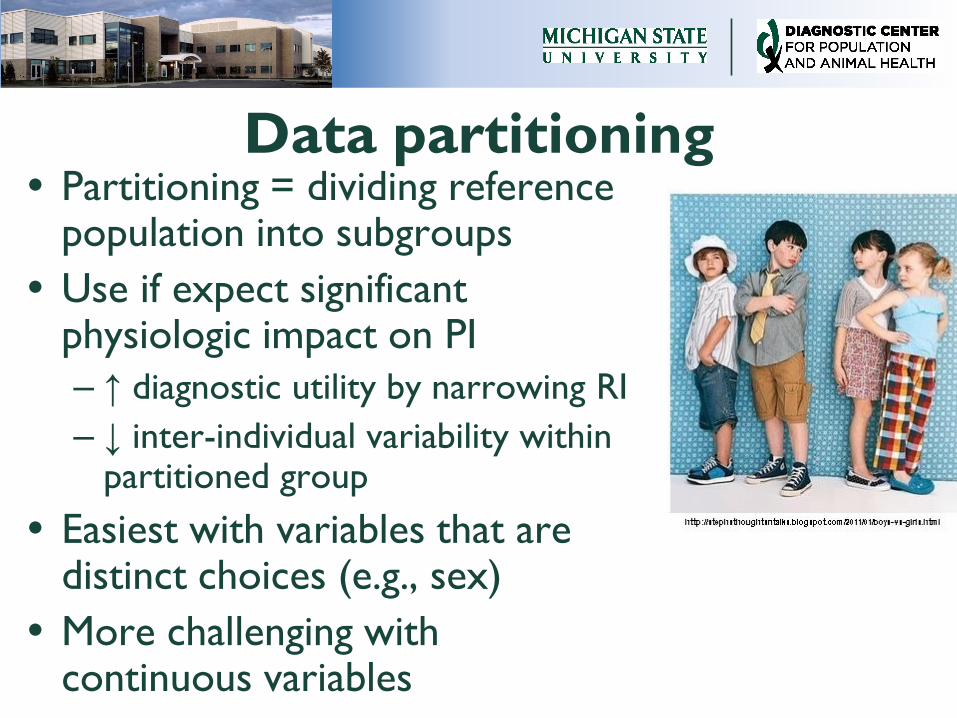
Data partitioning Partitioning = dividing reference
population into subgroups
Use if expect significant physiologic impact on PI
– ↑ diagnostic utility by narrowing RI
– ↓ inter-individual variability within partitioned group
Easiest with variables that are distinct choices (e.g., sex)
More challenging with continuous variables
Data partitioning
Create different RI for each subgroup within reference population
Minimum of 40 in each partitioned group
Various methods to determine if partitioning of value
– Calculate the significance of the difference between the means of the subgroups
– Partition if >4% or <0.9% of values in subgroup fall outside RI of non-partitioned group
Document RI process
Information about reference
population
Pre-analytic preparations
Specifics about analysis
Data analysis methods
Report should be available to clients
Problems with de novo RI determination
Expensive & time consuming
High inter-individual variability decreases usefulness
No universal definition of “healthy”
Challenging to collect sufficient numbers of reference individuals
– Almost impossible to randomly recruit reference individuals
RI review and revalidation
Should be routinely reviewed and revalidated at minimum of every 3-5 years
Critical anytime change methodology or sample preparation/ handling
Consider review if clinicians note excess false positives and false negatives
Transference & validation of RI Allows adaptation of RI from
manufacturer or other sources
Requires:
– Similar reference population
– Similar sample handling & collection protocols
– Similar methodology
Ideally same analyzer but may be acceptable if use similar methodology & different analyzer
Presence of bias will prevent direct RI transfer
Transference & validation of RI
Depends upon correct initial determination of RI
Information from the RI must be available & reviewed by the laboratory adopting RI
– Should include patient demographics, pre-analytic protocols, analytic procedures, and statistics used
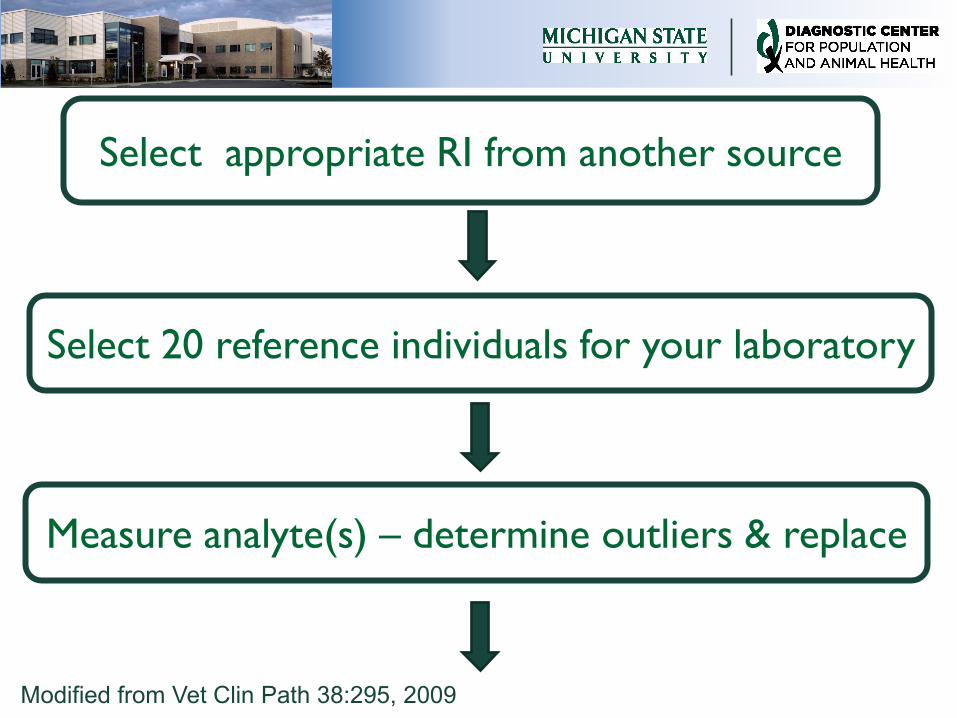
Select appropriate RI from another source
Select 20 reference individuals for your laboratory
Measure analyte(s) – determine outliers & replace
Modified from Vet Clin Path 38:295, 2009
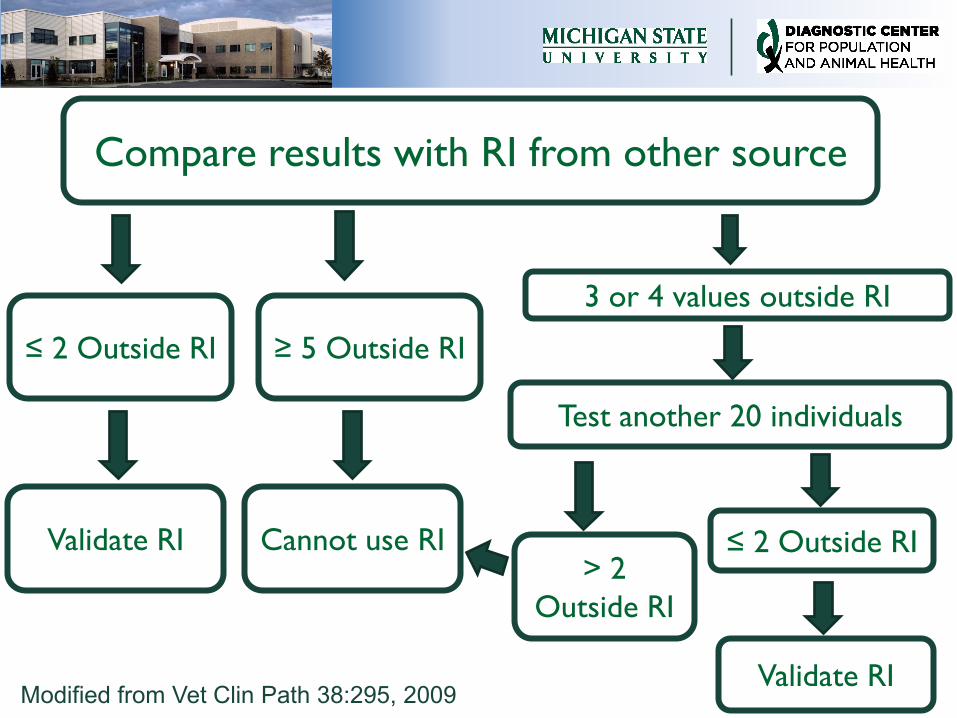
Compare results with RI from other source
3 or 4 values outside RI
Modified from Vet Clin Path 38:295, 2009
≤ 2 Outside RI
Validate RI
≥ 5 Outside RI
Cannot use RI
Test another 20 individuals
> 2
Outside RI
≤ 2 Outside RI
Validate RI
Transference pros and cons
Cons
– Relies on original correct RI
determination
– Validation procedure does not
determine if RI too wide to be
useful
Pros
– Relatively inexpensive & easy to do
– Limited # reference individuals
needed

Multicenter RI
Centers should have
– Similar patient populations
– Uniform selection criteria & sample
collection/handling protocols
– Use same QC materials to ↑ standardization
Requires excellent communication between
centers
Multicenter RI Ideally use same analyzer and
methods but can be different if:
– Calibrated to produce similar results
using international traceable standards
or shared pooled specimen
– Uniform criteria for precision and
allowable bias
– Rigorous QC monitoring to detect
deviations
Multicenter RI pros & cons
Cons
– Requires good communication
between centers to reach consensus
– Assumes strict adherence to pre-
analytic & analytic protocols
Pros
– Relatively inexpensive to obtain
– Larger # reference individuals
– Flexibility for patients to use multiple
labs
Potential problems with
population based RI High inter-individual variability
– Leads to wide RI
– May be difficult to detect changes in an individual
Sources of variability
– Preanalytic – issues with collection or handling
– Analytic – imprecision of assay
– Random variation within individual or between individuals
When are population based RI
least useful? High inter-individual variability
Low intra-individual variability
– Little variation of repeated testing in any given individual
– Average value from individual may be close to LRL, mean or
URL
– Placement in RI determines degree of shift needed to be
detected as “abnormal”
– Deviation from individual average may indicate disease yet
never be outside RI
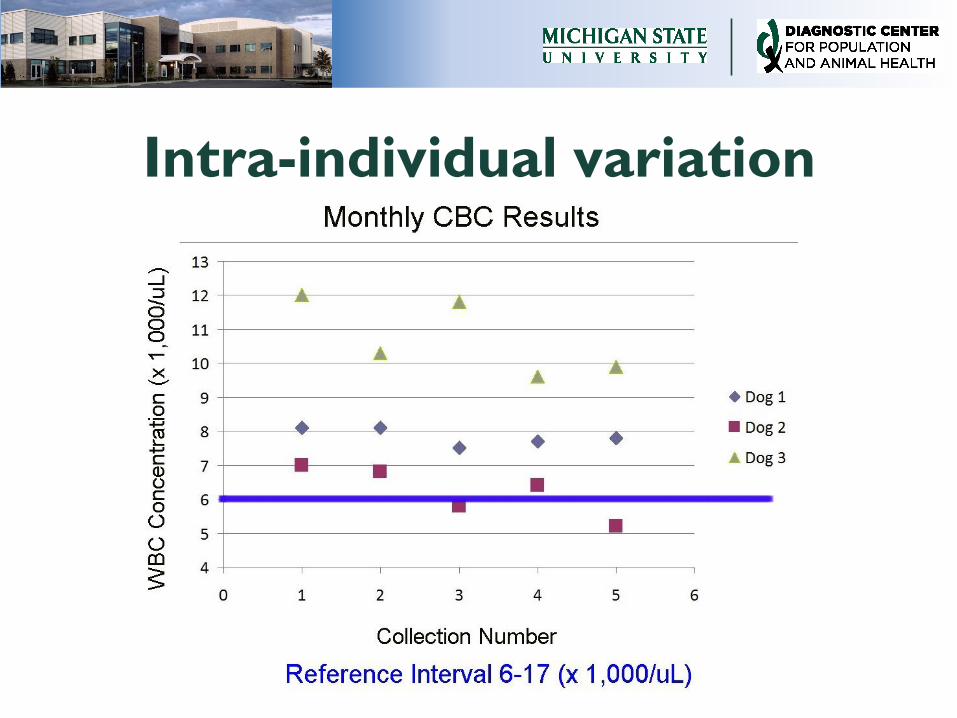
Intra-individual variation
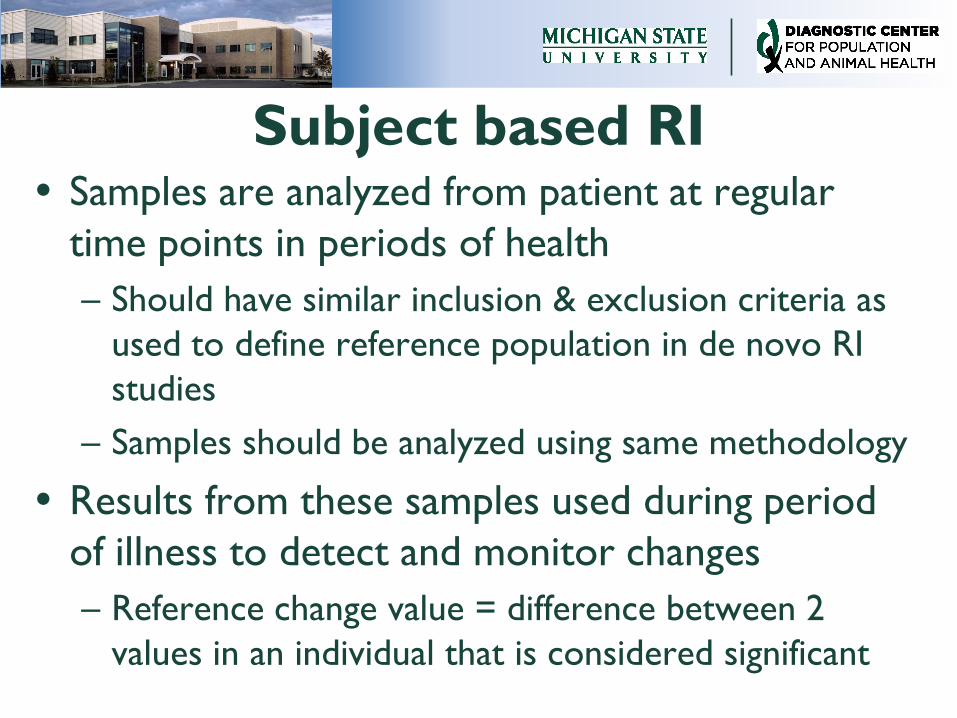
Subject based RI Samples are analyzed from patient at regular
time points in periods of health
– Should have similar inclusion & exclusion criteria as
used to define reference population in de novo RI
studies
– Samples should be analyzed using same methodology
Results from these samples used during period
of illness to detect and monitor changes
– Reference change value = difference between 2
values in an individual that is considered significant
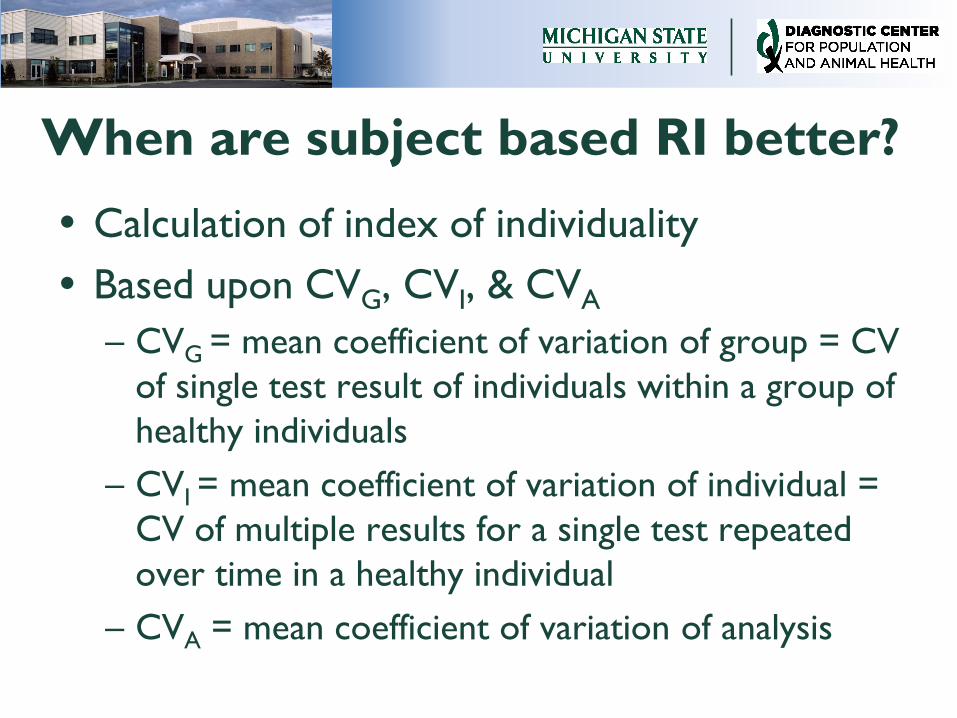
When are subject based RI better?
Calculation of index of individuality
Based upon CVG, CVI, & CVA
– CVG = mean coefficient of variation of group = CV
of single test result of individuals within a group of
healthy individuals
– CVI = mean coefficient of variation of individual =
CV of multiple results for a single test repeated
over time in a healthy individual
– CVA = mean coefficient of variation of analysis
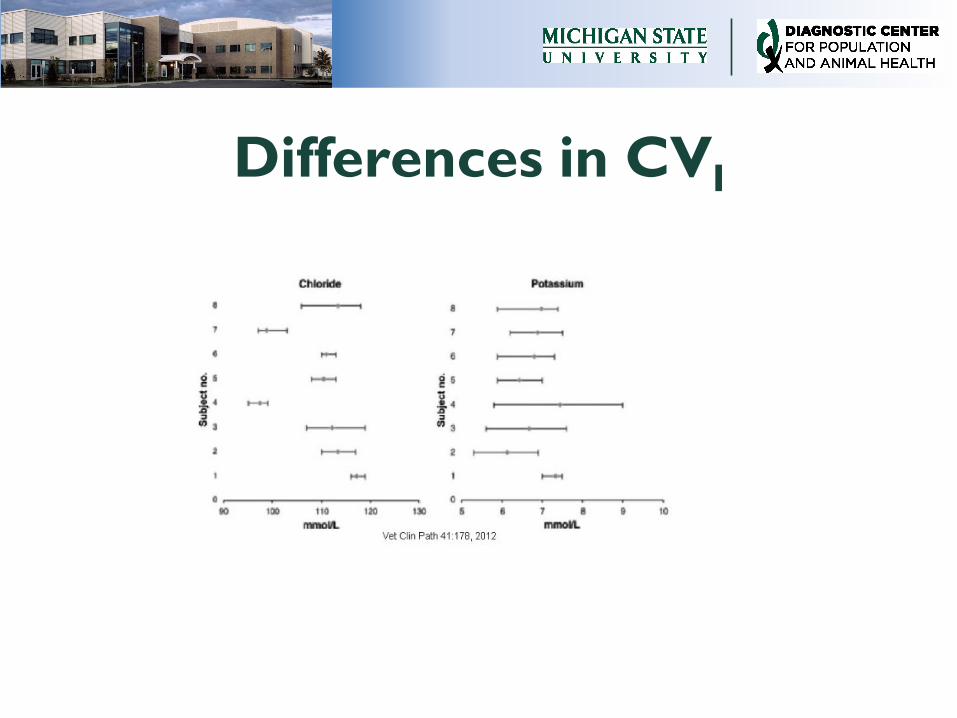
Differences in CVI
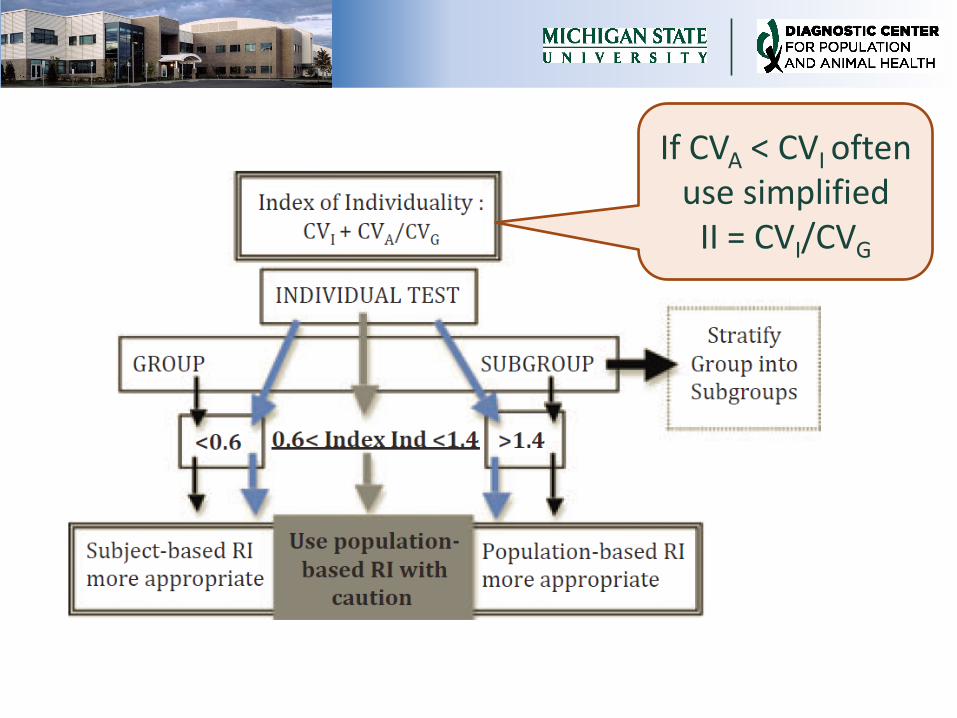
If CVA < CVI often use simplified
II = CVI/CVG
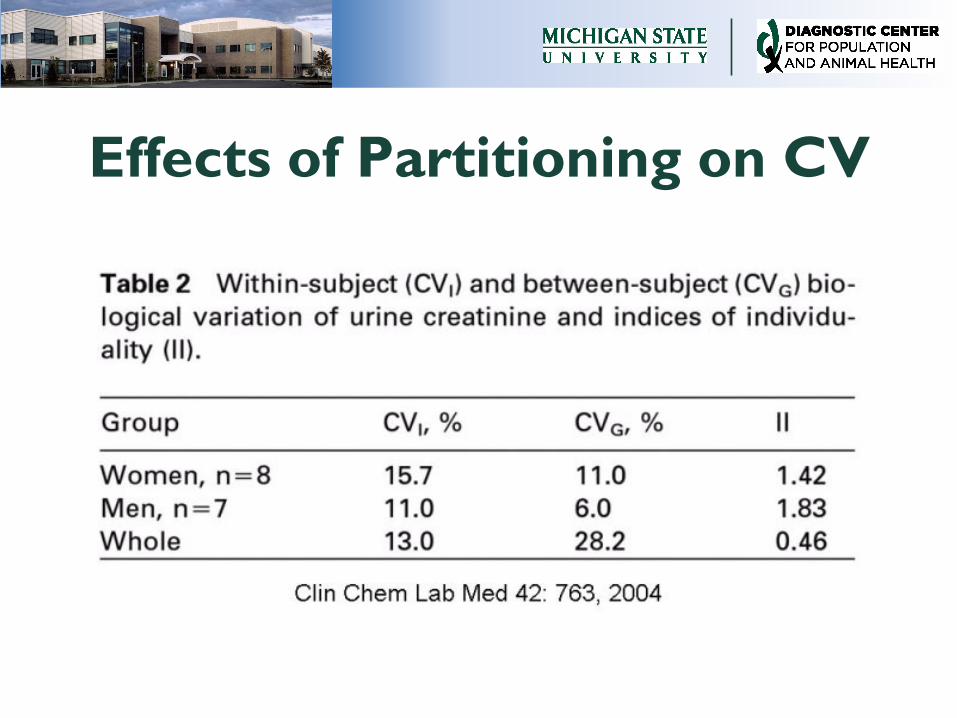
Effects of Partitioning on CV

References Ceriotti F, Hinzmann R, Panteghini M. Reference intervals: the way forward. Ann Clin Biochem
46:8-17, 2009
CLSI. Defining, establishing, and verifying reference intervals in the clinical laboratory: approved
guidelines. 3rd ed. Wayne, PA: CLSI; 2008
Friedrichs KR, Harr KE, Freeman KP, et al. ASVCP reference interval guidelines: determination
of de novo reference intervals in veterinary species and other related topics. Vet Clin Pathol 41:
441–453, 2012
Geffré A, Concorde D, Braun JP, et al. Reference value advisor: a new set of macroinstructions
to calculate reference intervals with Microsoft Excel. Vet Clin Pathol 40:107-112, 2011
Geffré A, Friedrichs K, Harr K, et al. Reference values: a review. Vet Clin Pathol 38:288-298,
2009
Horowitz GL: Establishment and use of reference values. In: Clinical Chemistry and Molecular
Diagnostics, 5th ed. Eds: Burtis CA, Ashwood ER, Bruns DE. St. Louis: Elsevier Saunders; 2012,
95-118
Sikaris KA. Physiology and its Importance for Reference Intervals. Clin Biochem Rev 35:3-14,
2014
Tate JR, Yen T, Jones GRD. Transference and validation of reference intervals. Clin Chem
61:1012-1015, 2015
Walton RM. Subject based reference values: biologic variation, individuality, and reference
change values. Vet Clin Pathol 41:175-181, 2012