Embed Size (px)
Citation preview
REFERENCE BUILDINGSFOR COST-OPTIMAL ANALYSIS
Bruxelles, March 8, 2012S.P. Corgnati*, E. Fabrizio§, M. Filippi** Politecnico di Torino § University of Torino
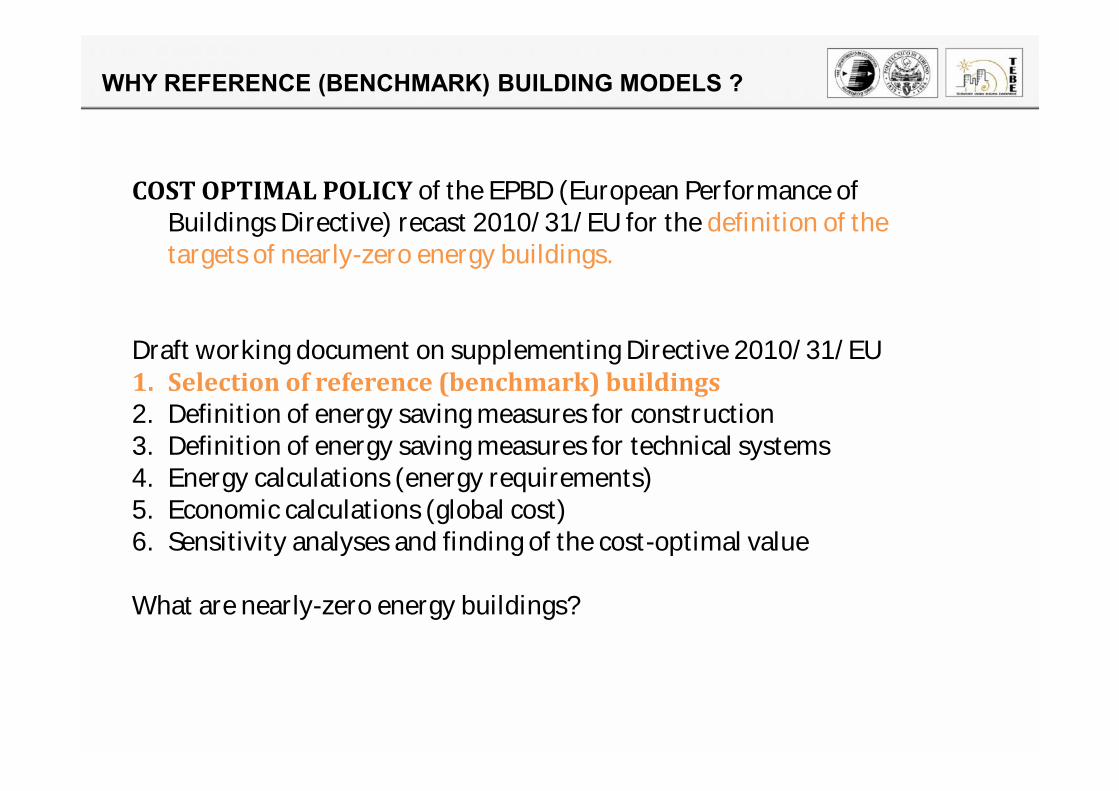
WHY REFERENCE (BENCHMARK) BUILDING MODELS ?
COST OPTIMAL POLICY of the EPBD (European Performance ofBuildings Directive) recast 2010/31/EU for the definition of thetargets of nearly-zero energy buildings.Draft working document on supplementing Directive 2010/31/EU1. Selection of reference (benchmark) buildings2. Definition of energy saving measures for construction3. Definition of energy saving measures for technical systems4. Energy calculations (energy requirements)5. Economic calculations (global cost)6. Sensitivity analyses and finding of the cost-optimal valueWhat are nearly-zero energy buildings?
REFERENCE BUILDINGS FOR COST-OPTIMAL ANALYSIS
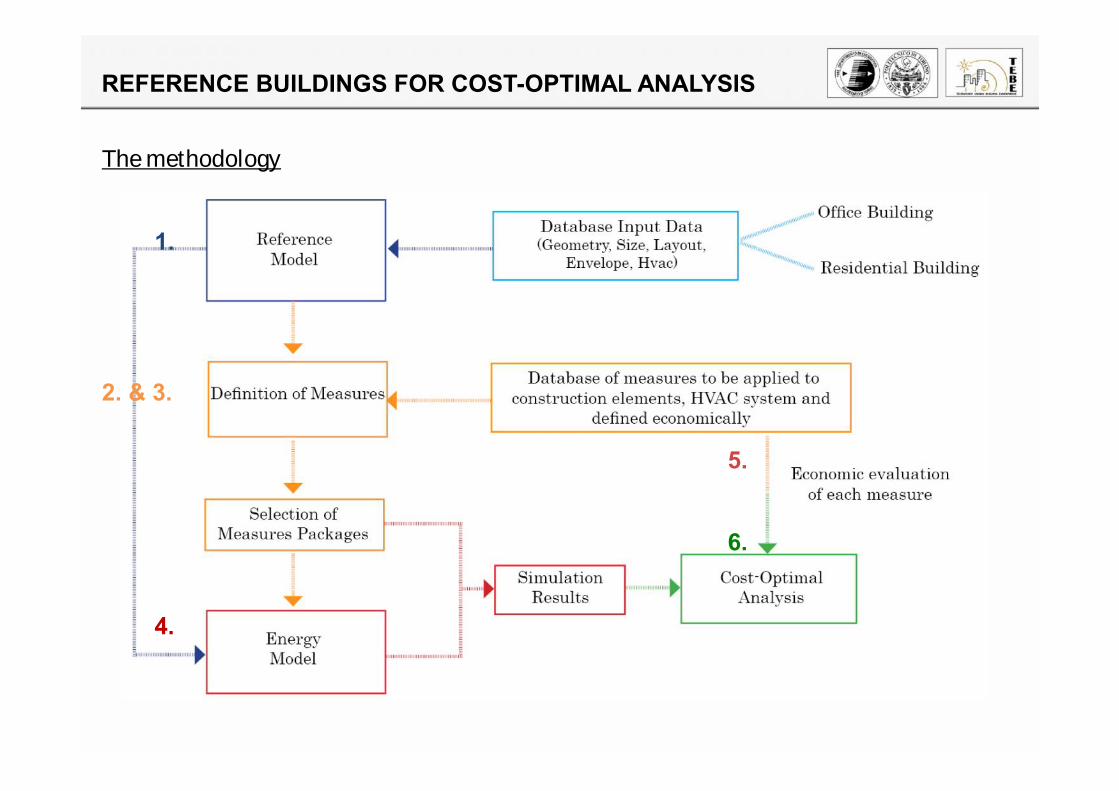
1.
2. & 3.
4.
6.
The methodology
5.
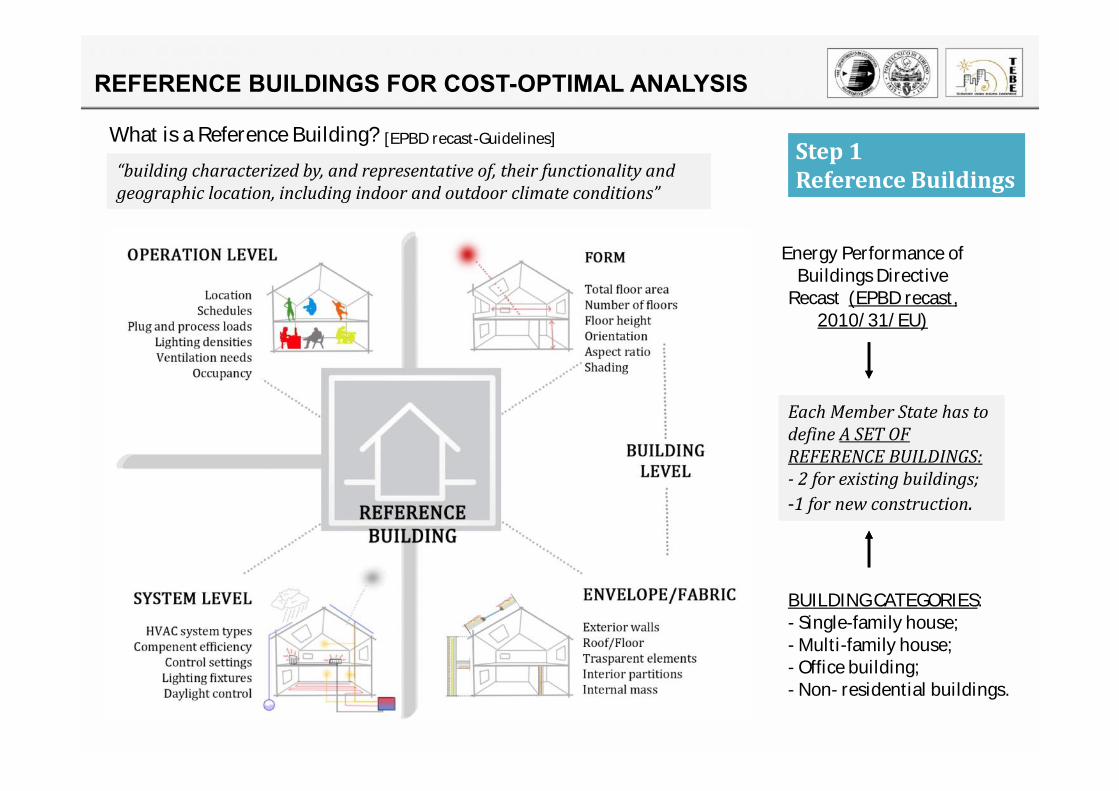
What is a Reference Building?REFERENCE BUILDINGS FOR COST-OPTIMAL ANALYSIS
Step 1Reference BuildingsStep 1Reference Buildings“building characterized by, and representative of, their functionality and
geographic location, including indoor and outdoor climate conditions”
[EPBD recast-Guidelines]
Each Member State has todefine A SET OFREFERENCE BUILDINGS:- 2 for existing buildings;-1 for new construction.
Energy Performance ofBuildings DirectiveRecast (EPBD recast,2010/31/EU)
BUILDING CATEGORIES:- Single-family house;- Multi-family house;- Office building;- Non- residential buildings.
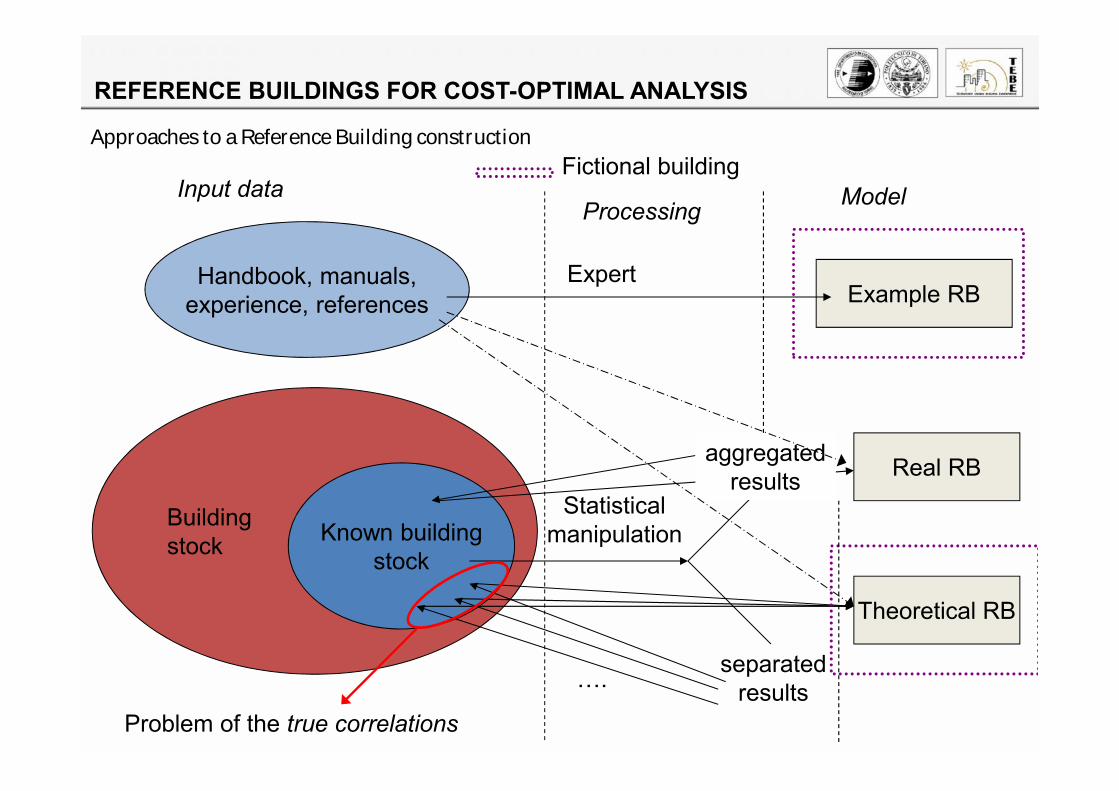
REFERENCE BUILDINGS FOR COST-OPTIMAL ANALYSISApproaches to a Reference Building constructionHandbook, manuals,
experience, references
Buildingstock Known building
stock
ExpertExample RB
Statisticalmanipulation
separatedresults
Real RB
….
Theoretical RB
aggregatedresults
Fictional buildingInput data
Processing Model
Problem of the true correlations
REFERENCE BUILDINGS FOR COST-OPTIMAL ANALYSIS
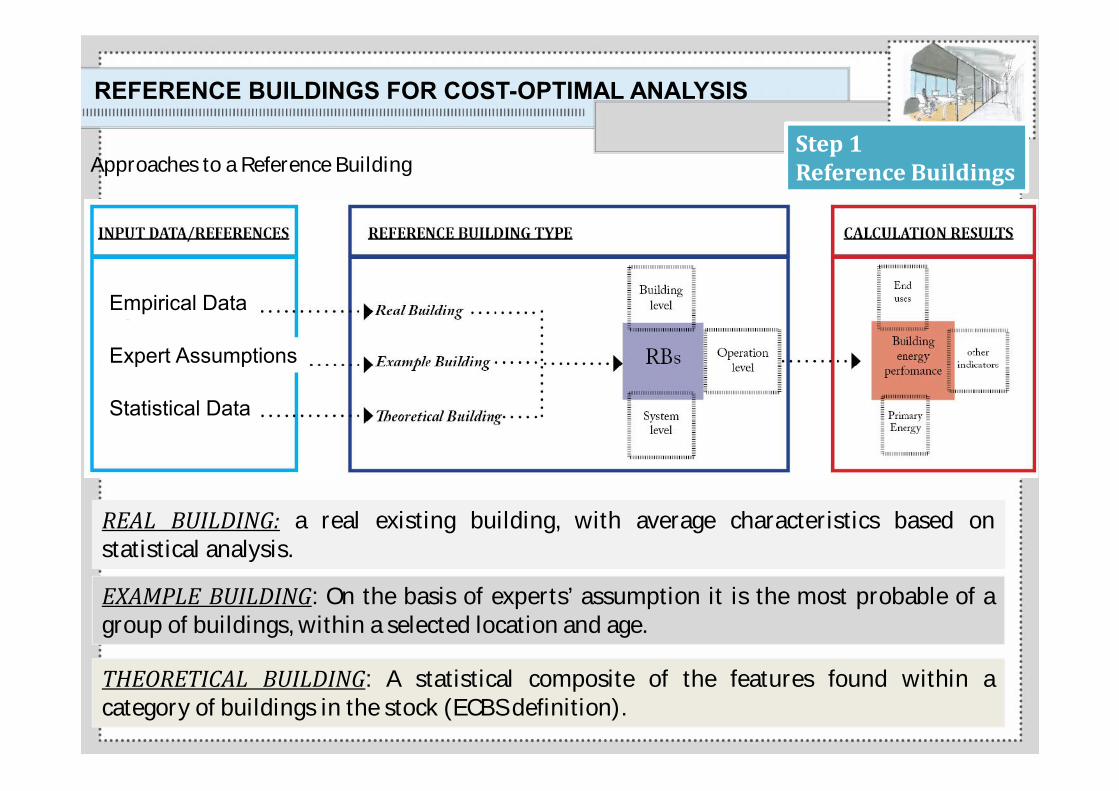
Approaches to a Reference Building Step 1Reference BuildingsStep 1Reference Buildings
REAL BUILDING: a real existing building, with average characteristics based onstatistical analysis.EXAMPLE BUILDING: On the basis of experts’ assumption it is the most probable of agroup of buildings, within a selected location and age.THEORETICAL BUILDING: A statistical composite of the features found within acategory of buildings in the stock (ECBS definition).
Empirical Data
Expert Assumptions
Statistical Data
Step 1Reference BuildingsStep 1Reference Buildings
REFERENCE BUILDINGS FOR COST-OPTIMAL ANALYSIS
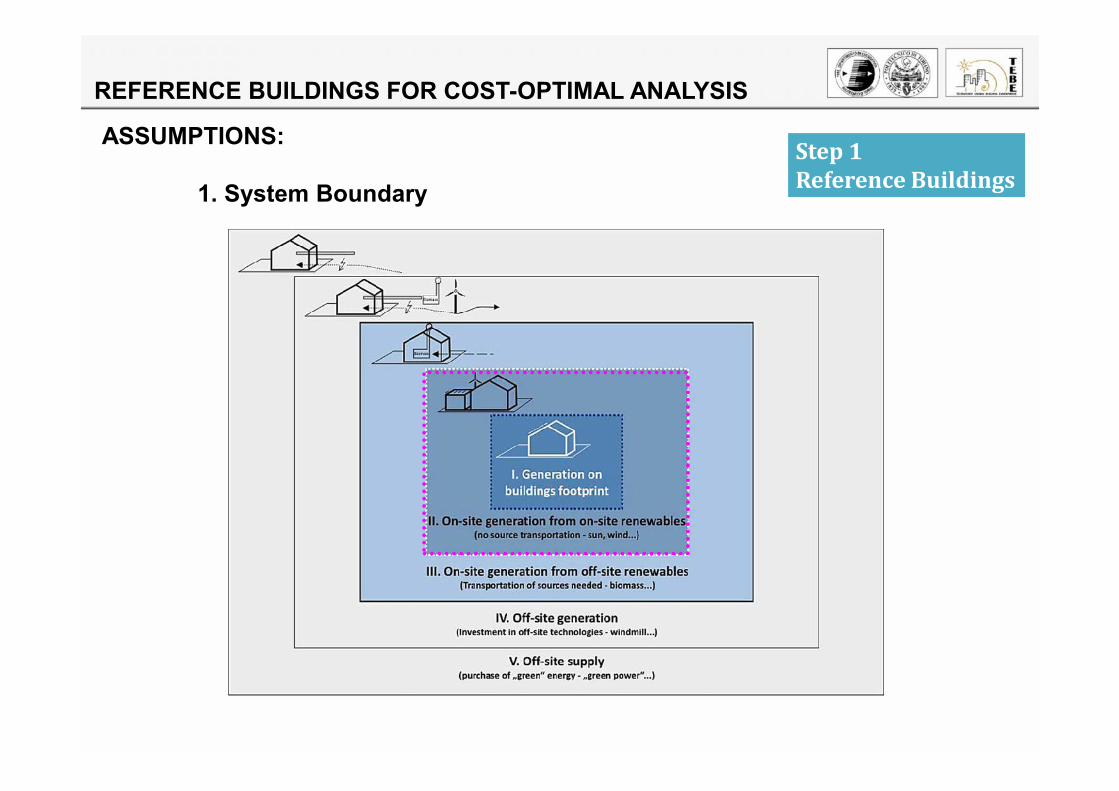
ASSUMPTIONS:
1. System Boundary
Step 1Reference BuildingsStep 1Reference Buildings
REFERENCE BUILDINGS FOR COST-OPTIMAL ANALYSIS
ASSUMPTIONS:
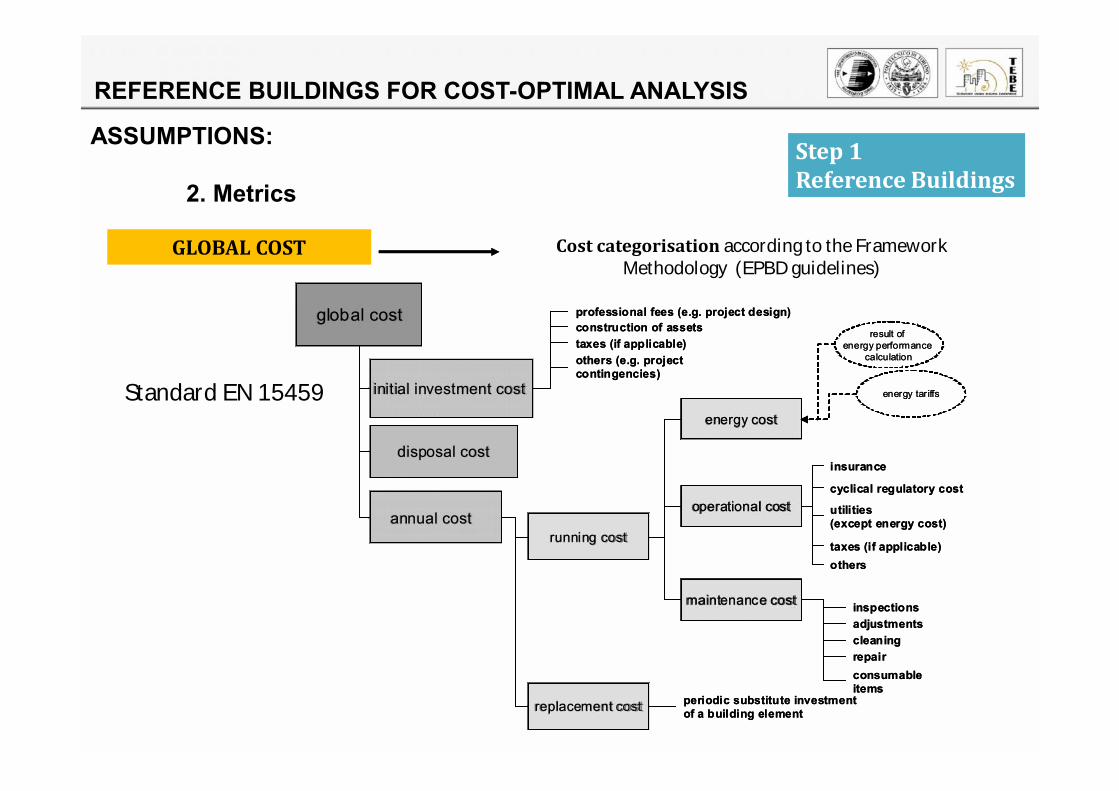
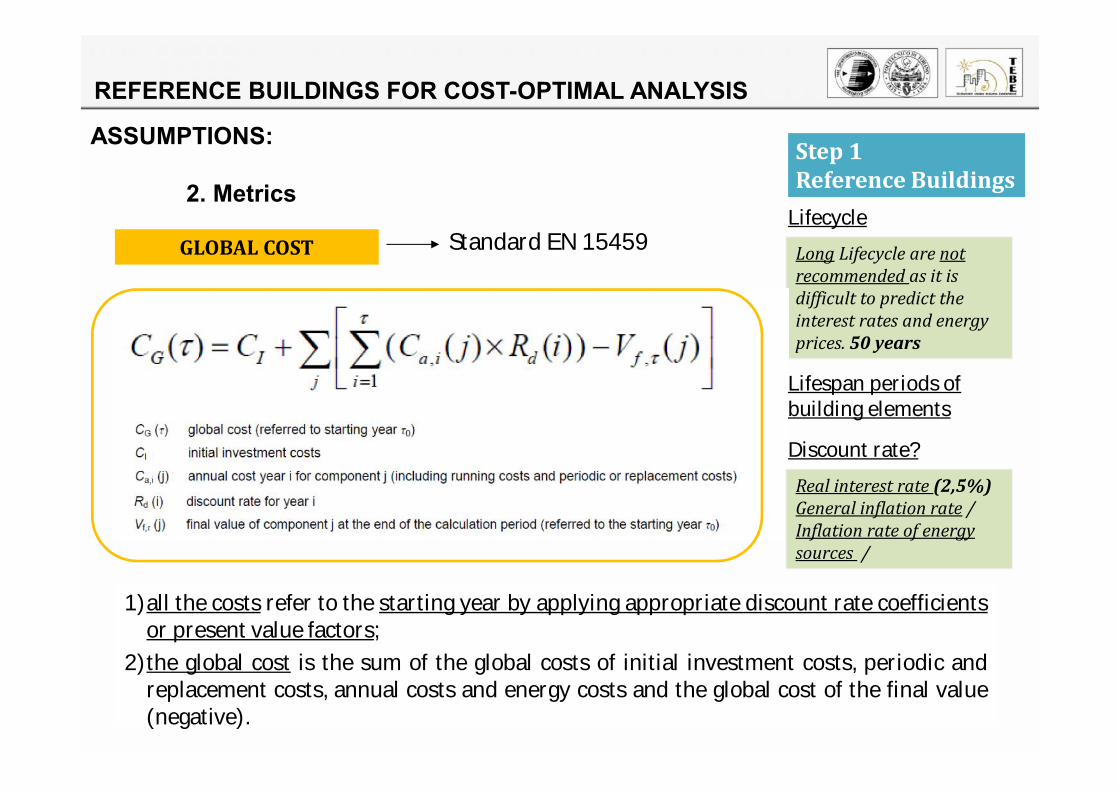
2. Metrics
GLOBAL COST
consumableitems
cyclical regulatory cost
utilities(except energy cost)
global cost
initial investment cost
annual cost
disposal cost
running cost
professional fees (e.g. project design)construction of assetstaxes (if applicable)others (e.g. projectcontingencies)
energy cost
operational cost
maintenance cost
periodic substitute investmentof a building element
result ofenergy performance
calculation
energy tariffs
replacement cost
adjustmentsinspections
cleaningrepair
insurance
taxes (if applicable)others
Cost categorisation according to the FrameworkMethodology (EPBD guidelines)Standard EN 15459
Step 1Reference BuildingsStep 1Reference Buildings
REFERENCE BUILDINGS FOR COST-OPTIMAL ANALYSIS
ASSUMPTIONS:
2. Metrics
GLOBAL COSTLifecycleLong Lifecycle are notrecommended as it isdifficult to predict theinterest rates and energyprices. 50 years
Standard EN 15459
1)all the costs refer to the starting year by applying appropriate discount rate coefficientsor present value factors;2)the global cost is the sum of the global costs of initial investment costs, periodic andreplacement costs, annual costs and energy costs and the global cost of the final value(negative).
Discount rate?Real interest rate (2,5%)General inflation rate /Inflation rate of energysources /
Lifespan periods ofbuilding elements
Step 1Reference BuildingsStep 1Reference Buildings
REFERENCE BUILDINGS FOR COST-OPTIMAL ANALYSIS
ASSUMPTIONS:
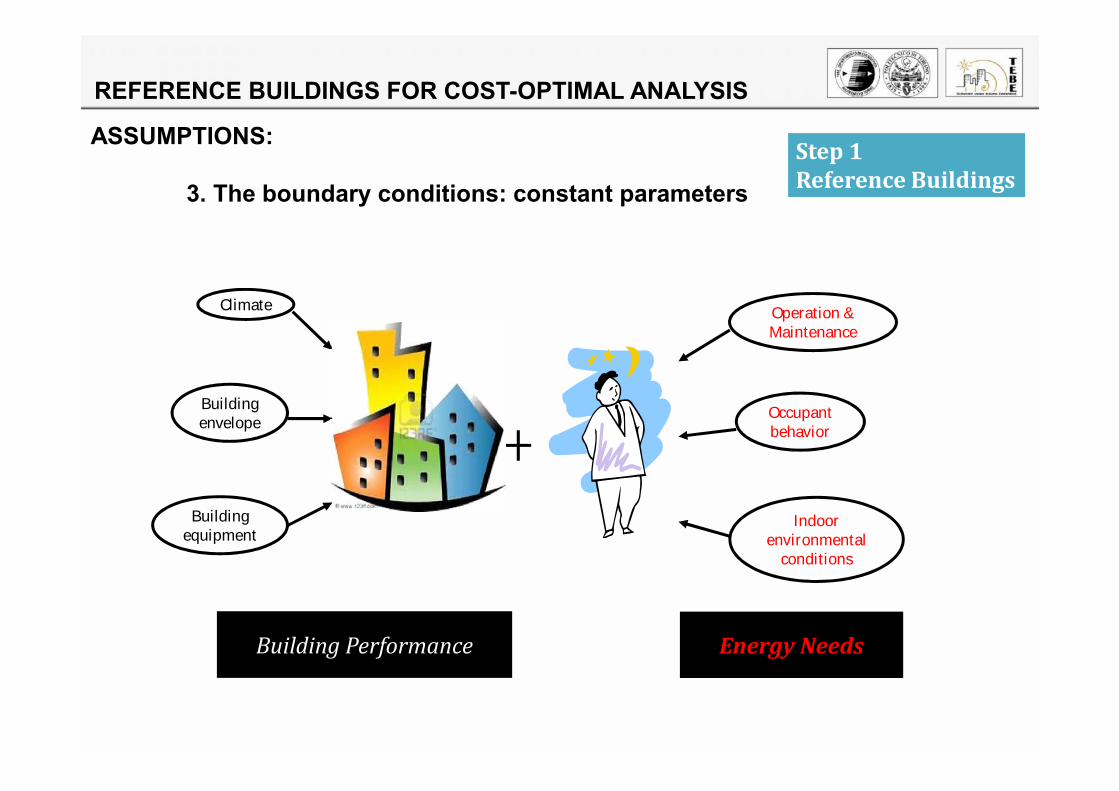
3. The boundary conditions: constant parameters
ClimateBuildingenvelope
Buildingequipment
Operation &MaintenanceOccupantbehavior
IndoorenvironmentalconditionsBuilding Performance Energy Needs
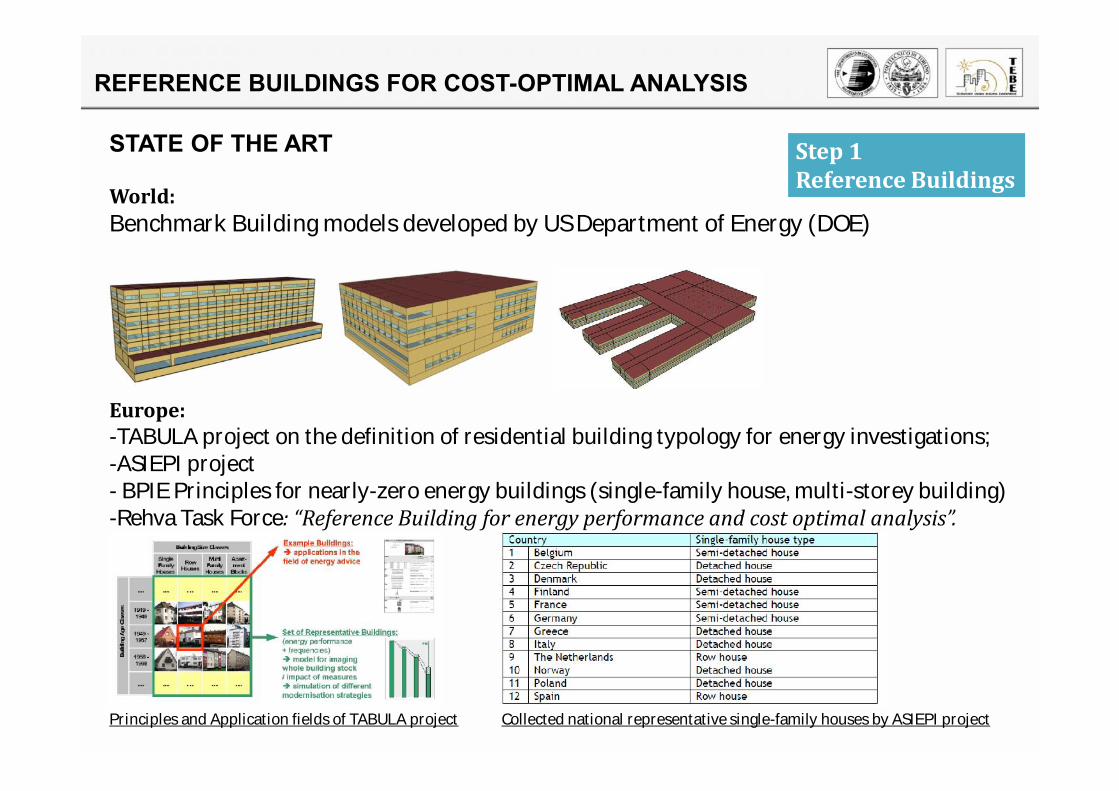
STATE OF THE ART
World:Benchmark Building models developed by US Department of Energy (DOE)
Europe:-TABULA project on the definition of residential building typology for energy investigations;-ASIEPI project- BPIE Principles for nearly-zero energy buildings (single-family house, multi-storey building)-Rehva Task Force: “Reference Building for energy performance and cost optimal analysis”.
REFERENCE BUILDINGS FOR COST-OPTIMAL ANALYSIS
Step 1Reference BuildingsStep 1Reference Buildings
Principles and Application fields of TABULA project Collected national representative single-family houses by ASIEPI project
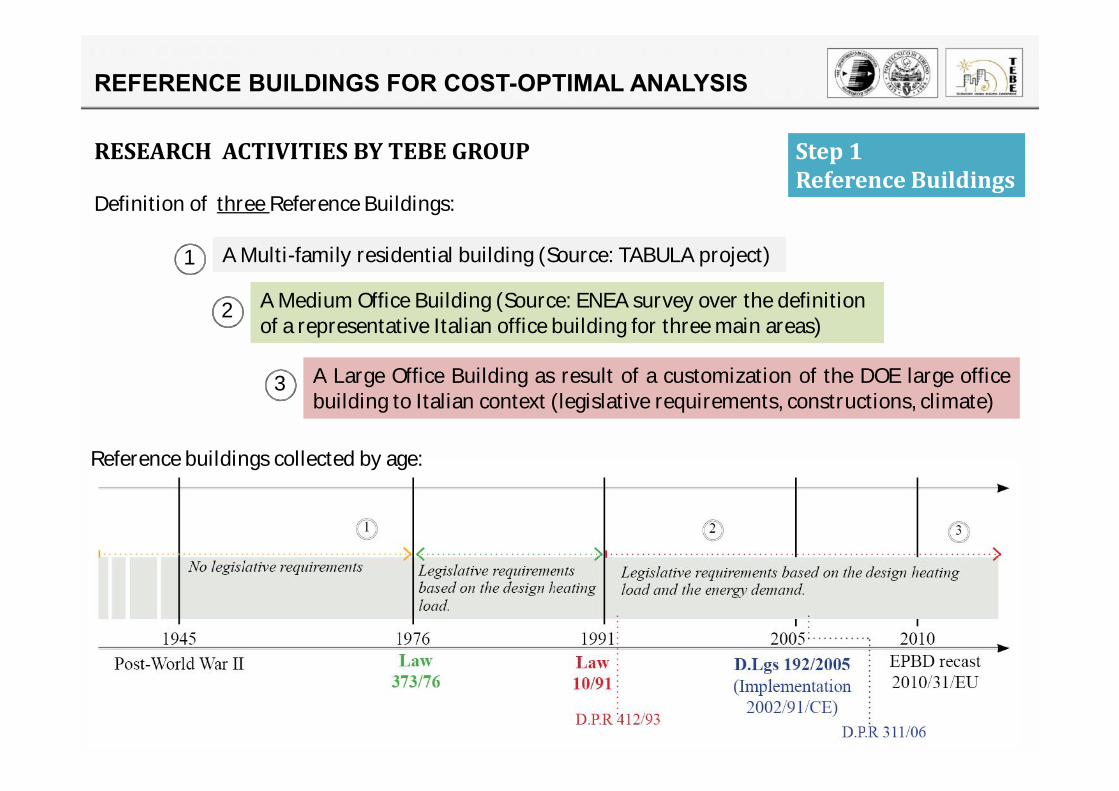
RESEARCH ACTIVITIES BY TEBE GROUPDefinition of three Reference Buildings:REFERENCE BUILDINGS FOR COST-OPTIMAL ANALYSIS
Step 1Reference BuildingsStep 1Reference Buildings
A Multi-family residential building (Source: TABULA project)A Medium Office Building (Source: ENEA survey over the definitionof a representative Italian office building for three main areas)A Large Office Building as result of a customization of the DOE large officebuilding to Italian context (legislative requirements, constructions, climate)Reference buildings collected by age:
1 23
REFERENCE BUILDINGS FOR COST-OPTIMAL ANALYSIS
Step 1Reference BuildingsStep 1Reference Buildings
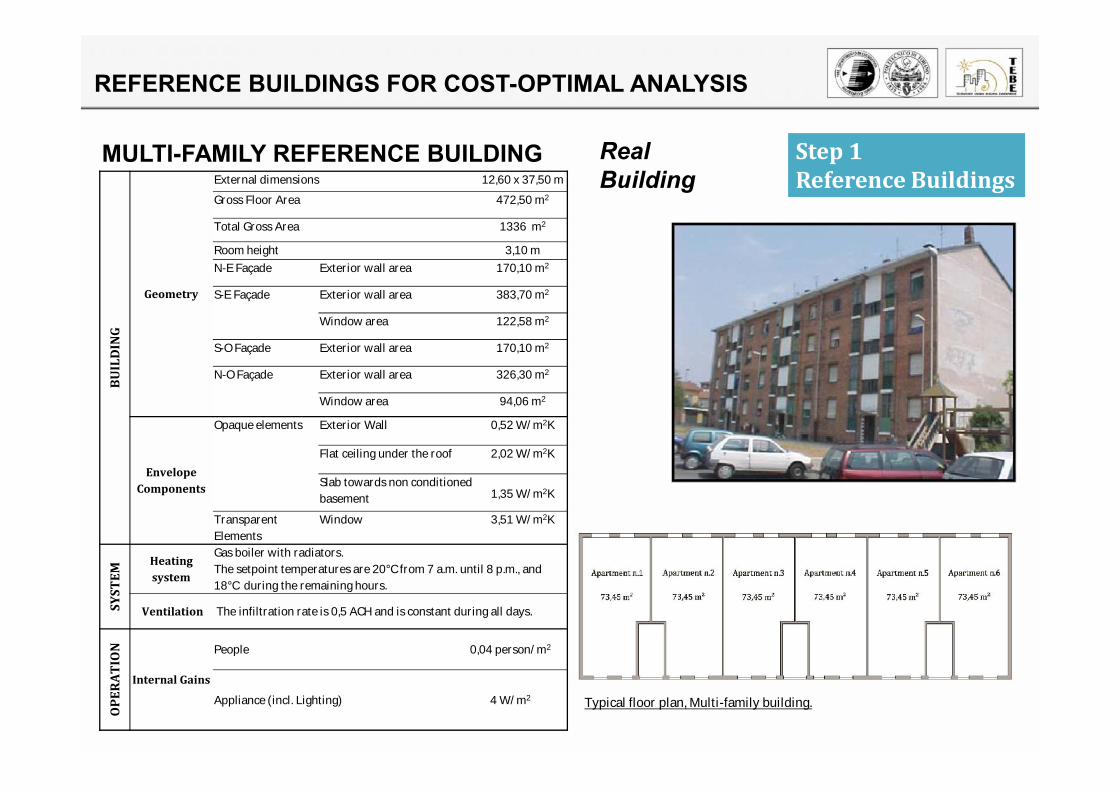
MULTI-FAMILY REFERENCE BUILDING
Typical floor plan, Multi-family building.
BUIL
DIN
G
Geometry
External dimensions 12,60 x 37,50 mGross Floor Area 472,50 m2Total Gross Area 1336 m2Room height 3,10 mN-E Façade Exterior wall area 170,10 m2S-E Façade Exterior wall area 383,70 m2Window area 122,58 m2S-O Façade Exterior wall area 170,10 m2N-O Façade Exterior wall area 326,30 m2Window area 94,06 m2
EnvelopeComponents
Opaque elements Exterior Wall 0,52 W/m2KFlat ceiling under the roof 2,02 W/m2KSlab towards non conditionedbasement 1,35 W/m2KTransparentElements Window 3,51 W/m2K
SYST
EM
Heatingsystem
Gas boiler with radiators.The setpoint temperatures are 20°C from 7 a.m. until 8 p.m., and18°C during the remaining hours.Ventilation The infiltration rate is 0,5 ACH and is constant during all days.
OPE
RATI
ON
Internal Gains
People 0,04 person/m2Appliance (incl. Lighting) 4 W/m2
RealBuilding
REFERENCE BUILDINGS FOR COST-OPTIMAL ANALYSIS
Step 1Reference BuildingsStep 1Reference Buildings
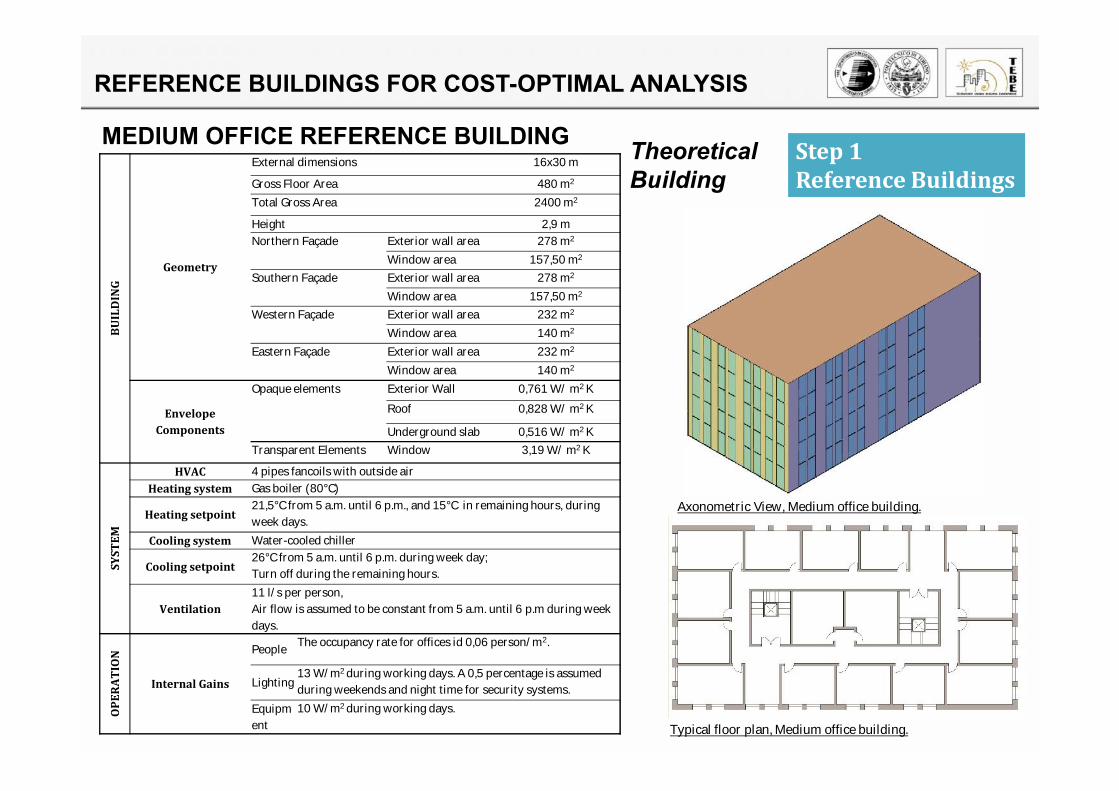
MEDIUM OFFICE REFERENCE BUILDINGBU
ILD
ING
Geometry
External dimensions 16x30 mGross Floor Area 480 m2Total Gross Area 2400 m2Height 2,9 mNorthern Façade Exterior wall area 278 m2Window area 157,50 m2Southern Façade Exterior wall area 278 m2Window area 157,50 m2Western Façade Exterior wall area 232 m2Window area 140 m2Eastern Façade Exterior wall area 232 m2Window area 140 m2Envelope
Components
Opaque elements Exterior Wall 0,761 W/ m2 KRoof 0,828 W/ m2 KUnderground slab 0,516 W/ m2 KTransparent Elements Window 3,19 W/ m2 K
SYST
EM
HVAC 4 pipes fancoils with outside airHeating system Gas boiler (80°C)
Heating setpoint21,5°C from 5 a.m. until 6 p.m., and 15°C in remaining hours, duringweek days.
Cooling system Water-cooled chillerCooling setpoint
26°C from 5 a.m. until 6 p.m. during week day;Turn off during the remaining hours.Ventilation
11 l/s per person,Air flow is assumed to be constant from 5 a.m. until 6 p.m during weekdays.
OPE
RATI
ON
Internal Gains
People The occupancy rate for offices id 0,06 person/m2.Lighting 13 W/m2 during working days. A 0,5 percentage is assumedduring weekends and night time for security systems.Equipment 10 W/m2 during working days.
Axonometric View, Medium office building.
Typical floor plan, Medium office building.
TheoreticalBuilding
REFERENCE BUILDINGS FOR COST-OPTIMAL ANALYSIS
Step 1Reference BuildingsStep 1Reference Buildings
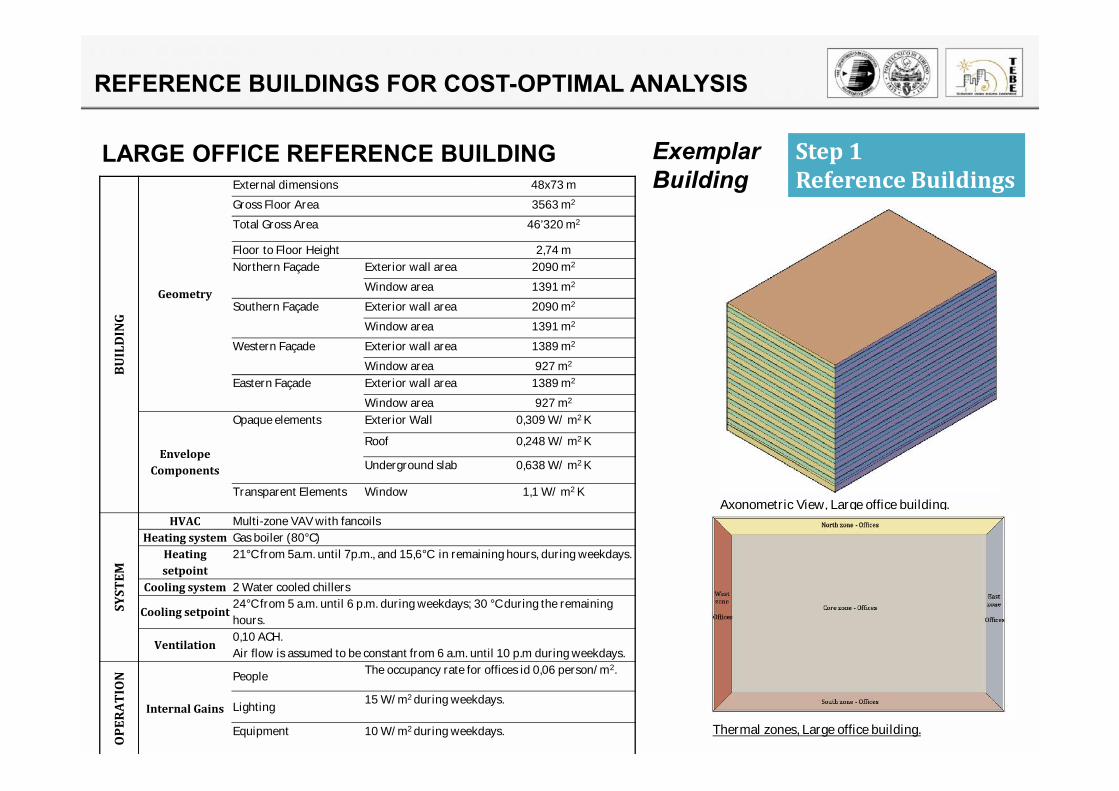
LARGE OFFICE REFERENCE BUILDING
Axonometric View, Large office building.
Thermal zones, Large office building.
ExemplarBuilding
BUIL
DIN
G
Geometry
External dimensions 48x73 mGross Floor Area 3563 m2Total Gross Area 46’320 m2Floor to Floor Height 2,74 mNorthern Façade Exterior wall area 2090 m2Window area 1391 m2Southern Façade Exterior wall area 2090 m2Window area 1391 m2Western Façade Exterior wall area 1389 m2Window area 927 m2Eastern Façade Exterior wall area 1389 m2Window area 927 m2Envelope
Components
Opaque elements Exterior Wall 0,309 W/ m2 KRoof 0,248 W/ m2 KUnderground slab 0,638 W/ m2 KTransparent Elements Window 1,1 W/ m2 K
SYST
EM
HVAC Multi-zone VAV with fancoilsHeating system Gas boiler (80°C)
Heatingsetpoint
21°C from 5a.m. until 7p.m., and 15,6°C in remaining hours, during weekdays.Cooling system 2 Water cooled chillers
Cooling setpoint24°C from 5 a.m. until 6 p.m. during weekdays; 30 °C during the remaininghours.
Ventilation0,10 ACH.Air flow is assumed to be constant from 6 a.m. until 10 p.m during weekdays.
OPE
RATI
ON
Internal Gains
People The occupancy rate for offices id 0,06 person/m2.Lighting 15 W/m2 during weekdays.Equipment 10 W/m2 during weekdays.
REFERENCE BUILDINGS FOR COST-OPTIMAL ANALYSIS
Step 2&3MeasuresStep 2&3Measures
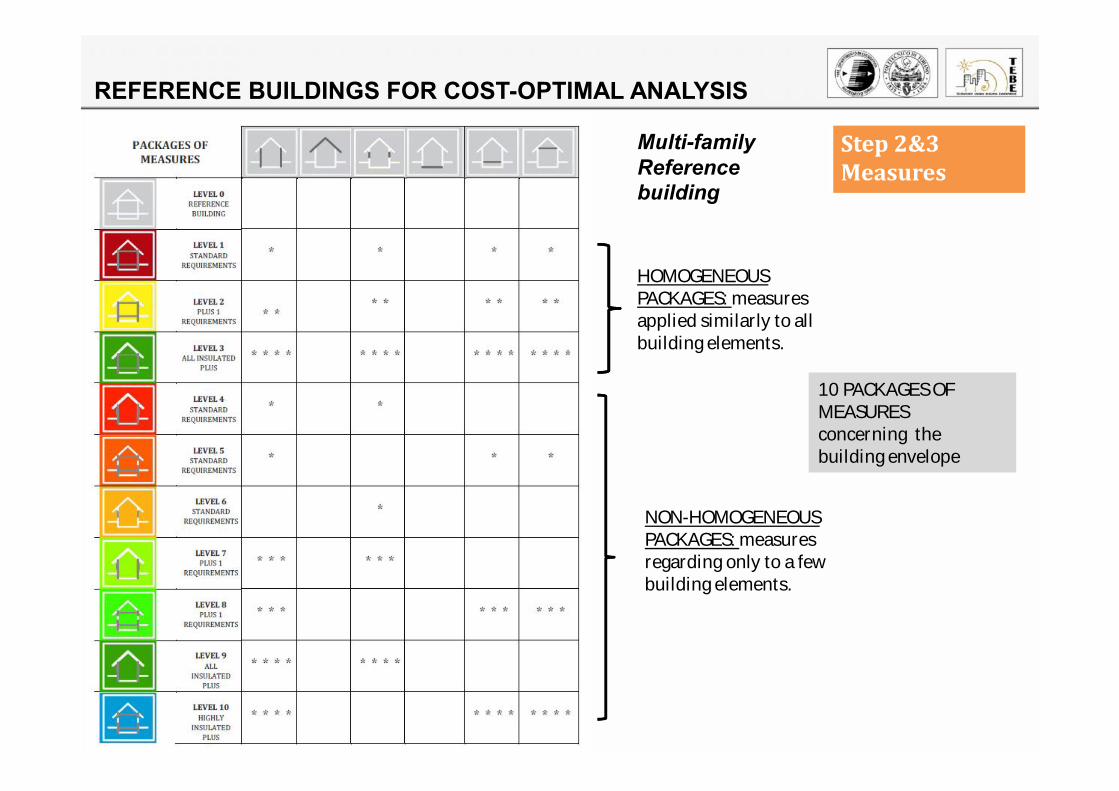
PACKAGES OF MEASURES Multi-familyReferencebuilding
10 PACKAGES OFMEASURESconcerning thebuilding envelopeNON-HOMOGENEOUSPACKAGES: measuresregarding only to a fewbuilding elements.
HOMOGENEOUSPACKAGES: measuresapplied similarly to allbuilding elements.
REFERENCE BUILDINGS FOR COST-OPTIMAL ANALYSIS
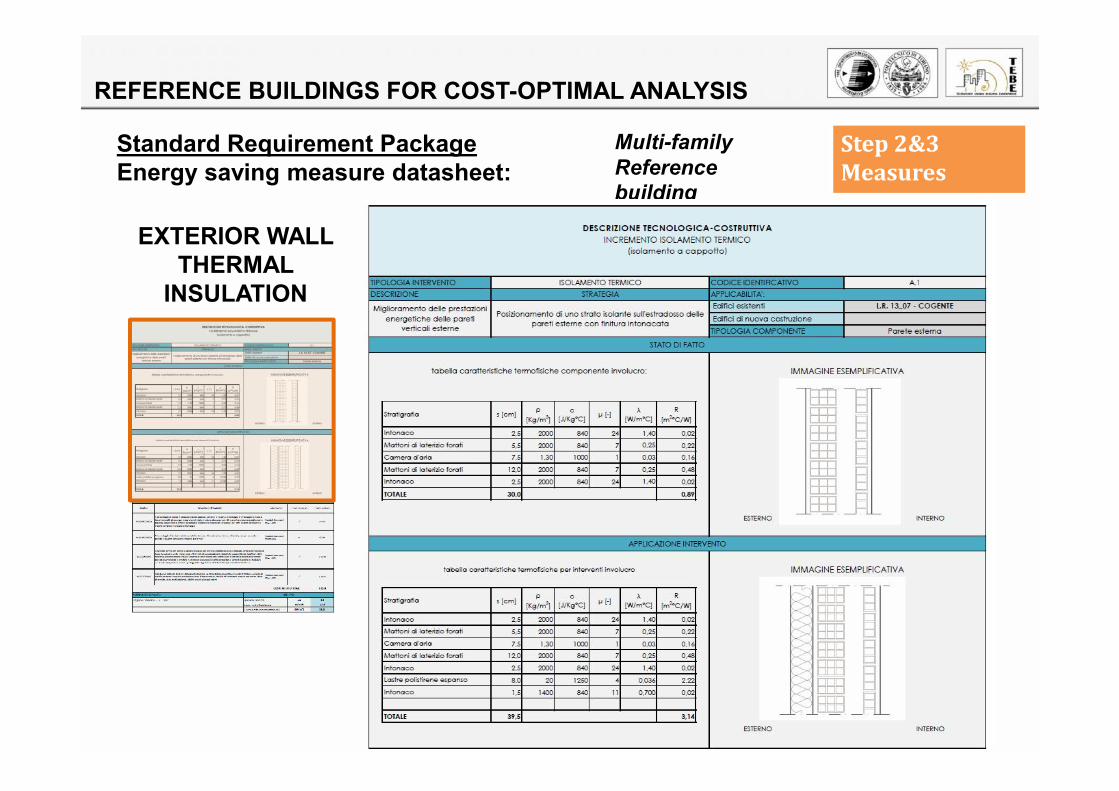
EXTERIOR WALLTHERMAL
INSULATION
Step 2&3MeasuresStep 2&3Measures
Multi-familyReferencebuilding
Standard Requirement PackageEnergy saving measure datasheet:
REFERENCE BUILDINGS FOR COST-OPTIMAL ANALYSIS
Step 2&3MeasuresStep 2&3Measures
Multi-familyReferencebuilding
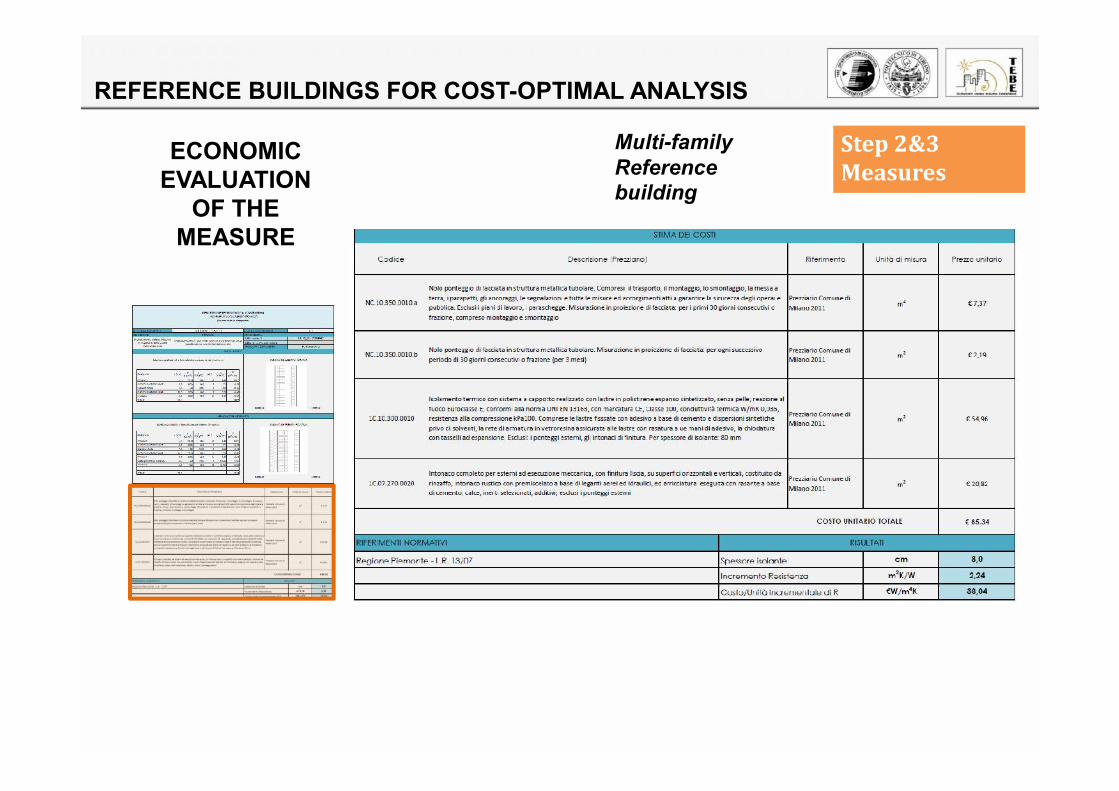
ECONOMICEVALUATION
OF THEMEASURE
REFERENCE BUILDINGS FOR COST-OPTIMAL ANALYSIS
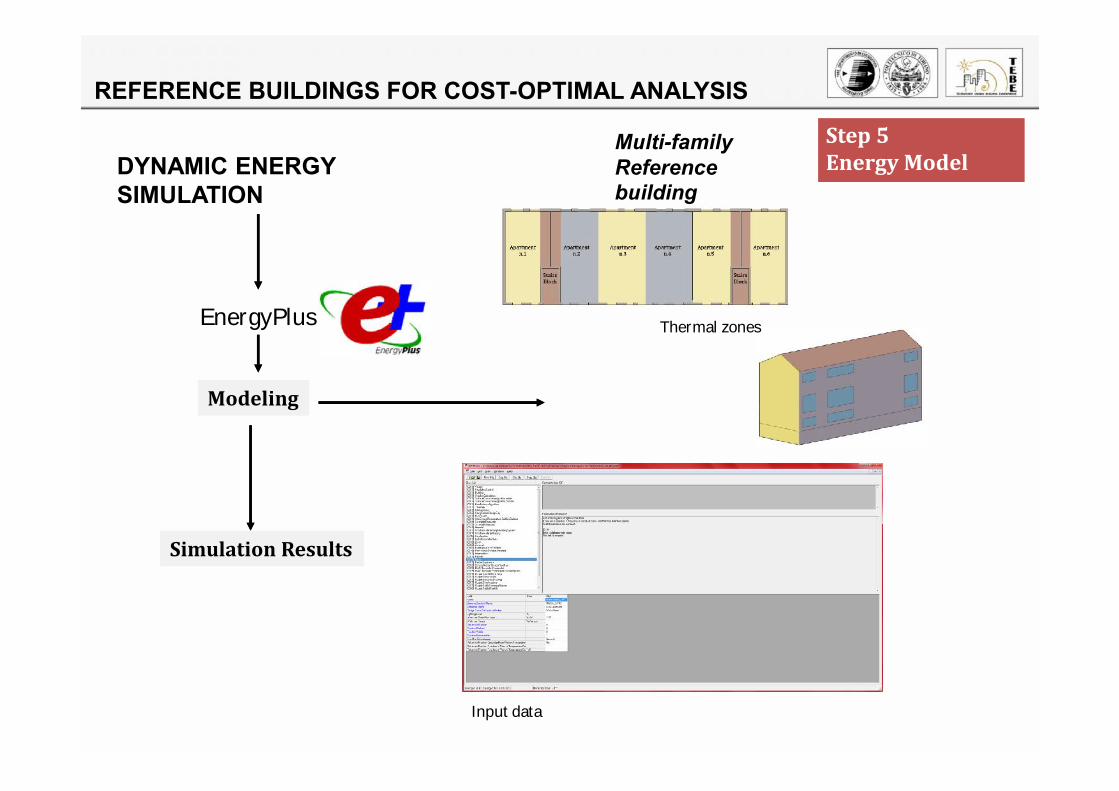
Step 5Energy ModelStep 5Energy ModelDYNAMIC ENERGY
SIMULATION
Multi-familyReferencebuilding
EnergyPlusModeling
Simulation Results
Thermal zones
Input data
REFERENCE BUILDINGS FOR COST-OPTIMAL ANALYSIS
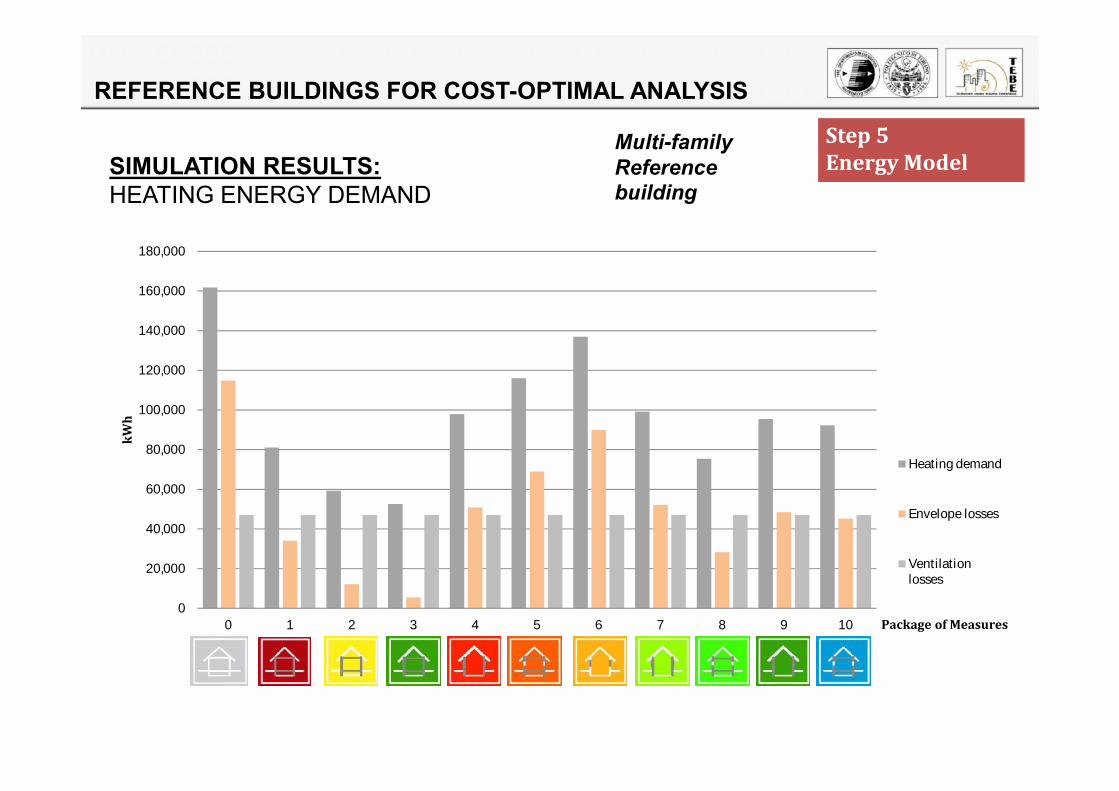
SIMULATION RESULTS:HEATING ENERGY DEMAND
Multi-familyReferencebuilding
020,00040,00060,00080,000
100,000120,000140,000160,000180,000
0 1 2 3 4 5 6 7 8 9 10
kWh
Package of Measures
Heating demandEnvelope lossesVentilationlosses
Step 5Energy ModelStep 5Energy Model
REFERENCE BUILDINGS FOR COST-OPTIMAL ANALYSIS
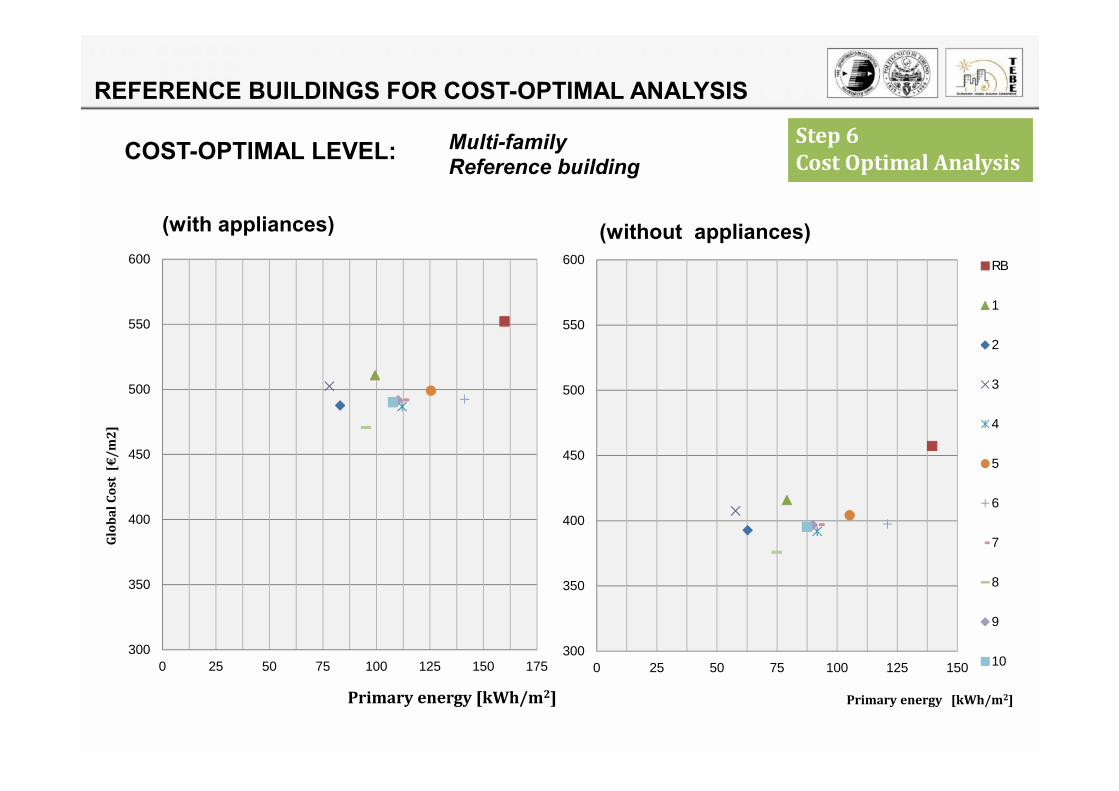
Step 6Cost Optimal AnalysisStep 6Cost Optimal AnalysisCOST-OPTIMAL LEVEL:
(with appliances) (without appliances)
Multi-familyReference building
300350400450500550600
0 25 50 75 100 125 150Primary energy [kWh/m2]
RB12345678910300
350400450500550600
0 25 50 75 100 125 150 175
Glob
al C
ost
[€/m
2]
Primary energy [kWh/m2]
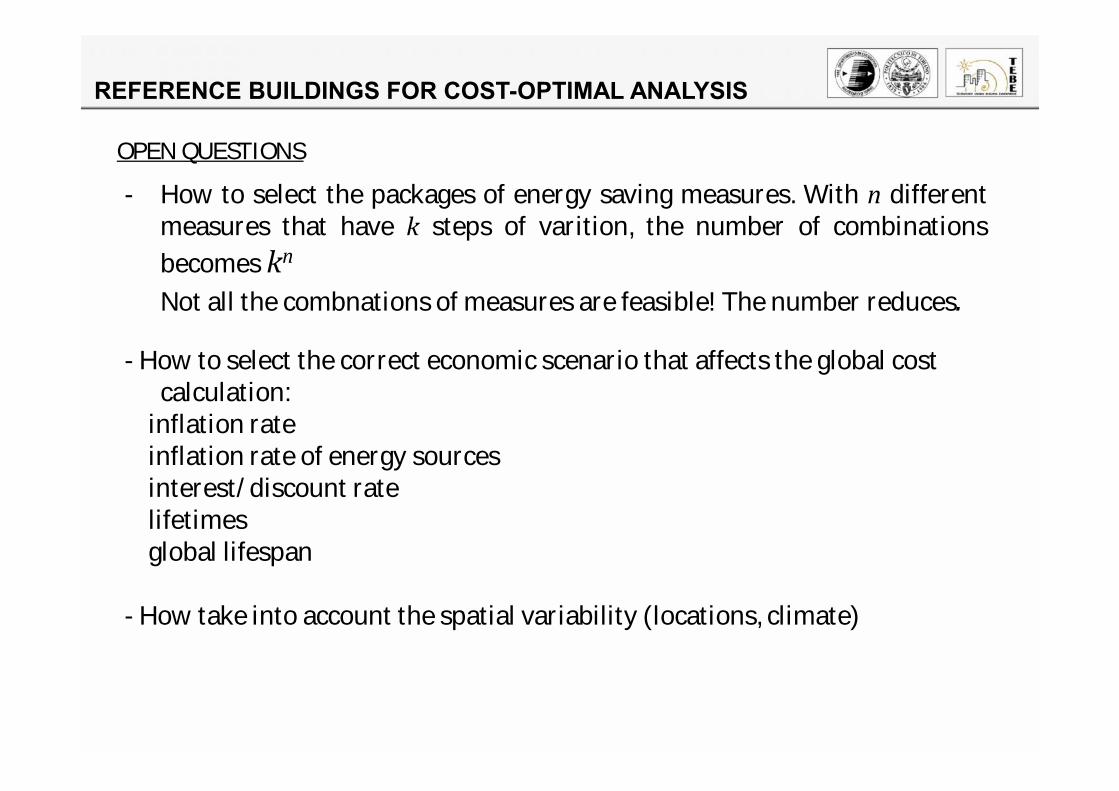
REFERENCE BUILDINGS FOR COST-OPTIMAL ANALYSISOPEN QUESTIONS- How to select the packages of energy saving measures. With n differentmeasures that have k steps of varition, the number of combinationsbecomes knNot all the combnations of measures are feasible! The number reduces.- How to select the correct economic scenario that affects the global costcalculation:inflation rateinflation rate of energy sourcesinterest/discount ratelifetimesglobal lifespan- How take into account the spatial variability (locations, climate)
REFERENCE BUILDINGS FOR COST-OPTIMAL ANALYSIS
REFERENCESBallarini, I. Corgnati, S.P. Corrado, V. Talà, N. Definition of building typologies for energy
investigations on residential sector by TABULA IEE-project: application to italian casestudies, In: RoomVent 2011, Trondheim, 19-22 June 2011.Ballarini I., Corgnati S.P., Corrado V., Tala' N. (2011) Improving energy modeling of largebuilding stock through the development of archetype buildings., In: Building Simulation2011, Sydney (Australia), 14-16 November 2011. pp. 2874-2881E. Fabrizio, D. Guglielmino, V. Monetti, Italian benchmark building models: the officebuilding, in V. Soebarto, H. Bennetts, P. Bannister, P.C. Thomas, D. Leach (a cura di), “Drivingbetter design through simulation”, IBPSA Australia & AIRAH, Melbourne, 2011, pp. 1981-1988 (ISBN 978-0-646-56510-1).C. Becchio, D. Guglielmino, E. Fabrizio, M. Filippi, Whole cost analysis of building envelopetechnologies according to the European Standard EN 15459, Climamed ’11 VI CongresoMediterraneo de Climatizacion, Madrid 2-3 giugno 2011, ATECYR, pp. 291-306 (ISBN 978-84-95010-41-4).
Thank youforyour attention