Embed Size (px)
Citation preview
Reduction of Greenhouse Gas Emissions through Underground CO2 Sequestration in Texas Oil and Gas
Reservoirs
GCCC Digital Publication Series #99-01
Mark H. Holtz Peter K. Nance Robert J. Finley
Keywords: CO2 Flooding, Texas- Oil, Gas Displacement Recovery, Oil and Gas Reservoirs, CO2 Effluent, CO2 EOR- Screening Criteria, Carbon Sequestration- Economics
Cited as: Holtz, M. H., Nance, P., and Finley, R. J., 1999, Reduction of greenhouse gas emissions through underground CO2 sequestration in Texas oil and gas reservoirs: The University of Texas at Austin, Bureau of Economic Geology, final report prepared for the Electrical Power Research Institute (EPRI), EPRI Technical Report No. WO4603-04, 68 p. + figures. GCCC Digital Publication Series #99-01.

EPRI Technical Report Reduction of Greenhouse Gas Emissions through Underground CO2 Sequestration in Texas Oil and Gas Reservoirs
TR-XXXXXX
WO4603-04 Final Report, August 1999

ii
Citations
This report was prepared by
Bureau of Economic Geology The University of Texas at Austin University Station, Box X Austin, Texas 78713-8924
Principal Investigator Robert J. Finley
This report describes research sponsored by EPRI through the U.S. Department of Energy.
Reduction of Greenhouse Gas Emissions through Underground CO2 Sequestration in Texas Oil and Gas Reservoirs; EPRI, Palo Alto, CA: 1999.
iii
Abstract
Today, energy and environmental questions are often viewed from conflicting perspectives. However, perhaps there are solutions to some of these problems that can satisfy multiple objectives. This report explores the technical feasibility and economic potential for capturing CO2 from coal- or lignite-fired utility boilers and applying the CO2 as an enhanced oil recovery (EOR) process in the mature oil provinces of Texas. This capture accomplishes twin goalssequestering a substantial amount of CO2 for an extended period and increasing the efficiency of oil recovery.
The types of CO2 sources are diverse. To mitigate the impact of these, a number of management strategies are available, ranging from effluent reduction to capture and sequestration. One alternative is to utilize mature oil reservoirs to form a set of sequestration reservoirs. From the oil production side, one challenge for the domestic oil industry during the next millennium will be to profitably employ advanced technology to increase resources from existing reservoirs. Many advanced recovery strategies hold potential for accomplishing this goal. One promising area is enhanced oil recovery through the use of CO2 flooding. The potential incremental oil production from these methods is significant.
The electricity generation industry is currently a major source of atmospheric CO2 emissions. One industry challenge in the coming decades may be to profitably employ advanced technology that reduces CO2 output while maintaining generation availability and reliability. There are likely to be many different strategies applied to new generation additions. However, the numbers of viable alternatives for existing facilities are relatively limited. CO2 capture and sequestration in mature oil reservoirs appear to be one important management alternative for the existing generating unit.
Original oil in place in existing, discovered Texas reservoirs is estimated at 197 billion stock-tank barrels (BSTB), of which 147 BSTB of oil remains in place. Reserves total 7 BSTB, leaving 140 BSTB of remaining mobile and residual oil. This 140 BSTB is the target for additional reservoir development including CO2 EOR.
Previous research has indicated that a primary target for EOR is estimated at 74 BSTB of residual oil. This study finds that 8 BSTB of this resource is within a 90-mi (145-km) radius of the candidate coal- or lignite-fired plants in Texas.
Additional oil resources beyond this 8 BSTB are also available from oil fields located near natural-gas-fired facilities. However, additional CO2 effluent management issues need to be addressed with these facilities. Factors influencing the recovery of these resources include CO2 production cost and availability, generation unit characteristics, transportation cost, environmental regulations, and oil prices.
Modeling conducted in this study indicates that CO2 flooding can produce oil that would not otherwise be recovered, at an incremental cost between $6.00 and $16.00 per stock-tank barrel (STB). The upper end of this range exceeds current (December 1998) posted crude oil prices
iv
($/STB). In addition, it is likely that between 12 and 20 years of CO2 production from the candidate lignite- or coal-fired boilers can be sequestered from these generation facilities.
Preliminary analyses indicate that CO2 capture for lignite- and coal-fired plants in Texas may be cost-effective when compared with fuel-switching these same boilers to natural gas. From a policy standpoint, it may be desirable to encourage CO2 capture retrofit initially, as opposed to fuel switching, because this results in overall lower levels of CO2 emissions at a comparable cost.
We conclude that there is substantial potential for using utility plant boiler effluent as a CO2 supply source for flooding and using mature oil reservoirs for CO2 sequestration. Development of this potential resource base may be facilitated through further research and policy initiatives. Major unresolved issues remain, however, that include:
• Total CO2 sequestration potential in Texas and U.S. hydrocarbon reservoirs.
• Consideration of projected generation capacity additions expected during the next several decades.
• Development of a longitudinally consistent supply-and-demand balance.
• Development of an integrated CO2 supply network that minimizes pipeline costs and considers CO2 storage costs to determine if CO2 can be made available on a large scale.
• An engineering and performance audit of the existing CO2 floods in Texas to better determine oil recovery efficiencies that can be expected by depositional system type.
• An engineering and performance evaluation of potential CO2 sequestration management issues that might allow for overpressuring reservoirs (compared with initial pressure).
• An engineering and economic examination of CO2 capture and transportation and for flue gas capture and transportation (as a potential lower cost alternative to CO2 capture) for natural-gas-fired plants.
• An engineering and economic examination of potential CO2 sequestration management issues that might be associated with variable output plants (peaking facilities and intermediate load plants). For effective enhanced oil recovery processes, dedicated CO2 storage facilities that can release CO2 to other underground reservoirs following the EOR process needs may be suggested.
• Alternatively, partial load (and conceivably full load) operation of generation facilities may suggest that unprocessed effluent be stored with CO2 separation conducted during off-peak periods when prices of power are relatively low. During on-peak periods when prices of power are relatively high, CO2 separation may be deferred through storage of CO2-rich (but “unrefined”) effluent.
• Further analysis of the costs of compression, transportation, and the capacity constraints that these developments may project onto the existing electrical grid.
• Additional work on developing potential applications for CO2 usage to ensure long-term sequestration is needed. Topics of concern include metallurgy and corrosion issues, reservoir seal integrity, and impacts on subterranean ecosystems.

v
Acknowledgments
This work was completed on behalf of the Electric Power Research Institute, under agreement number WO4603-04, Mr. Richard Rhudy, Project Manager. This agreement was, in turn, supported by the U.S. Department of Energy under cooperative agreement DE-FC22-96 PC9622. Graphics were prepared by Nancy Cottington, John Eary, and Scott Schulz under the supervision of Joel L. Lardon, Graphics Manager. Nina Redmond edited the report under the direction of Susann Doenges. Susan Lloyd did the word processing.

vi
vii
Table of Contents Abstract ........................................................................................................................iii
Acknowledgments ....................................................................................................... v
IntroductionFactors Affecting CO2 Sequestration ................................................1
Objectives of Study................................................................................................ 1
Current CO2 Supply ............................................................................................... 1
West Texas CO2 Supply..................................................................................... 1
Additional CO2 Supply in Other Regions of Texas ............................................. 5
Fossil-Fired Generation Units as Sources of CO2 Effluent ................................. 5
CO2 Effluent from Coal and Lignite Generation Plants............................................7
Factors Controlling the Volume of CO2 Output ........................................................7
Costs of Carbon Dioxide Removal...........................................................................10
Electrical Load Requirements............................................................................. 12
Variable Capture............................................................................................... 12
CO2 Storage and Disposal Costs ..................................................................... 12
Power Plant Life ................................................................................................... 12
Sequestration Management ................................................................................ 13
Oil and Gas Reservoir Characteristics Influencing CO2 Sequestration ...............13
General Oil and Gas Reservoir Characteristics ................................................ 13
Reservoir Depth................................................................................................ 13
Temperature ..................................................................................................... 13
Pressure ........................................................................................................... 14
Reservoir Drive Mechanism.............................................................................. 14
Geological Characteristics.................................................................................. 14
viii
Structure and Reservoir Seal............................................................................ 14
Diagenesis/Mineralogy...................................................................................... 15
Engineering and Reservoir Development Characteristics ............................... 15
Well Spacing..................................................................................................... 15
Well-Bore Integrity ............................................................................................ 15
Waterflooding ................................................................................................... 16
Reservoir Pressure Depletion ........................................................................... 16
Production Voidage .......................................................................................... 16
Rock-Fluid Property Characteristics .................................................................. 16
Oil and Gas Gravity .......................................................................................... 16
Porosity............................................................................................................. 17
Permeability ...................................................................................................... 17
Irreducible Water Saturation............................................................................. 17
Residual Oil Saturation ..................................................................................... 17
Relative Permeability ........................................................................................ 18
Injectivity ........................................................................................................... 18
Characteristics Controlling the Use of CO2 in Enhanced Oil Recovery.......... 18
Evaluation of Gas Displacement Recovery .............................................................21
Methodology......................................................................................................... 21
Data Sources and Project Definition................................................................. 21
Overview of Flooding Strategies ........................................................................ 22
Reservoir Controlling Parameters and Flood Design Controls ....................... 23
Geologic Characteristics of Previous and Current CO2 EOR Projects ........... 23
Engineering Characteristics of Gas Displacement Projects ............................ 24
Petrophysical Properties................................................................................... 33
ix
Fluid and Depth Characteristics........................................................................ 36
Design of Gas Displacement Recovery and Sequestration Projects ................ 38
Oil Production from Gas Displacement Recovery Projects............................... 39
Project Economics for Carbon Dioxide Miscible Flooding......................................41
Initial Capital Expenditures.......................................................................................41
Field Operating Costs ...............................................................................................42
Modeling CO2 Flooding Cost ....................................................................................42
Screening Texas for Candidate CO2 EOR Reservoirs............................................42
Screening Criteria ................................................................................................ 43
Oil Reservoir Screening Constraints................................................................. 43
General Generation Plant Screening Constraints............................................. 45
Location of Utility-Owned Generation Plants and Oil Reservoirs ................... 45
Results—Estimated Target Recoverable Oil from CO2 EOR............................ 45
Estimated Resource Base within 30 mi (48 km) of the Candidate Power Plants .....................................................................................47
Estimated Resource Base within 60 mi (97 km) of the Candidate Power Plants .....................................................................................47
Estimated Resource Base within 90 mi (145 km) of the Candidate Power Plants .....................................................................................48
Results—Estimated CO2 Recovery Costs ......................................................... 48
Costs of CO2 Capture and Transportation......................................................... 48
Economic Potential for CO2 Recovery and Transportation ...................................49
Near-Term Economic Potential ........................................................................... 49
Long-Term Economic Potential .......................................................................... 49
Conclusions ...............................................................................................................53
Phase 2 Objectives and Possible Tasks ............................................................ 55
x
Glossary of Terms .....................................................................................................56
References .................................................................................................................57
Reference List............................................................................................................59
Annotated Bibliography....................................................................................... 59
Enhanced Oil Recovery References ........................................................................62
Introduction Articles ............................................................................................ 62
CO2 Process ......................................................................................................... 63
CO2 Field Experience........................................................................................... 64
CO2 Simulation..................................................................................................... 65
EOR Economics ................................................................................................... 65
Tax and Regulations ............................................................................................ 66
R&D ....................................................................................................................... 66
Geologic Influences ............................................................................................. 66
SPE Enhanced Oil Recovery Field Reports ............................................................67
CO2 Capture .......................................................................................................... 67

xi
List of Figures Figure 1. Volume of CO2 supplied from four source areas to enhanced oil recovery operators in southwest United States (from Shell CO2 Company, Ltd, 1998) .................2
Figure 2. Major pipelines supplying CO2 to enhanced oil recovery operations in the Permian Basin of West Texas (from Shell CO2 Company, Ltd, 1998) ............................3
Figure 3. The pipeline distribution system in the Permian Basin of West Texas is centered at Denver City, Texas, and currently serves more than 40 fields under CO2 flood in the basin (from Shell CO2 Company, Ltd, 1998) ................................................4
Figure 4. Location of major CO2 sources in Texas..........................................................6
Figure 5. Utility plant CO2 capture and transport costs .................................................10
Figure 6. (a) Supply and demand factors controlling CO2 usage, and (b) design considerations at the reservoir level in CO2 usage for enhanced oil and gas recovery.20
Figure 7. Forcasted additional oil production from existing CO2 EOR projects .............22
Figure 8. Enhanced oil recovery projects in deep water chert reservoirs of West Texas ...................................................................................................................25
Figure 9. Enhanced oil recovery projects in San Andres platform carbonate reservoirs of West Texas ...................................................................................................................26
Figure 10. Enhanced oil recovery projects in the Horsehoe Atoll trend of West Texas.27
Figure 11. Enhanced oil recovery projects in platform carbonate reservoirs in the north part of the Permian Basin, West Texas.........................................................................28
Figure 12. Enhanced oil recovery projects in the Delaware Basin submarine fan (sandstone) play of the Permian Basin, West Texas ....................................................29
Figure 13. Enhanced oil recovery projects in Frio barrier/strandplain reservoirs, Texas Gulf Coast .....................................................................................................................30
Figure 14. Enhanced oil recovery projects in the Frio salt dome trend of the northern Gulf Coast Basin, Texas................................................................................................31
Figure 15. Enhanced oil recovery projects in the East Texas Basin..............................32
Figure 16. Porosity characteristics of sandstone enhanced oil recovery reservoirs ......34
Figure 17. Porosity characteristics of carbonate enhanced oil recovery reservoirs.......34
xii
Figure 18. Initial water saturation characteristics for sandstone enhanced oil recovery reservoirs.......................................................................................................................35
Figure 19. Initial water saturation characteristics for carbonate enhanced oil recovery reservoirs.......................................................................................................................35
Figure 20. Residual oil saturation characteristics of sandstone reservoirs from enhanced oil recovery projects......................................................................................36
Figure 21. Residual oil saturation characteristics of carbonate reservoirs from enhanced oil recovery projects.......................................................................................................37
Figure 22. Depth versus oil gravity of sandstone reservoirs from enhanced oil recovery projects..........................................................................................................................37
Figure 23. Depth versus oil gravity of carbonate reservoirs from enhanced oil recovery projects..........................................................................................................................38
Figure 24. Recovery efficiency of sandstone reservoirs from enhanced oil recovery projects..........................................................................................................................40
Figure 25. Recovery efficiency of carbonate reservoirs from enhanced oil recovery projects..........................................................................................................................41
Figure 26. Locations of utility plants and oil reservoirs, Gulf Coast and East Texas .....44
Figure 27. Locations of utility plants and oil reservoirs, Panhandle and West Texas....46
List of Tables Table 1. Total Texas System (with 1% diversity) net system capacity by source (MW) as reported to the Public Utility Commission of Texas (1995). Data beyond 1993 are projections .......................................................................................................................8
Table 2. Total Texas System net generation by fuel type (MWH) as reported to the Public Utility Commission of Texas (1995). Data beyond 1993 are projections ..............9
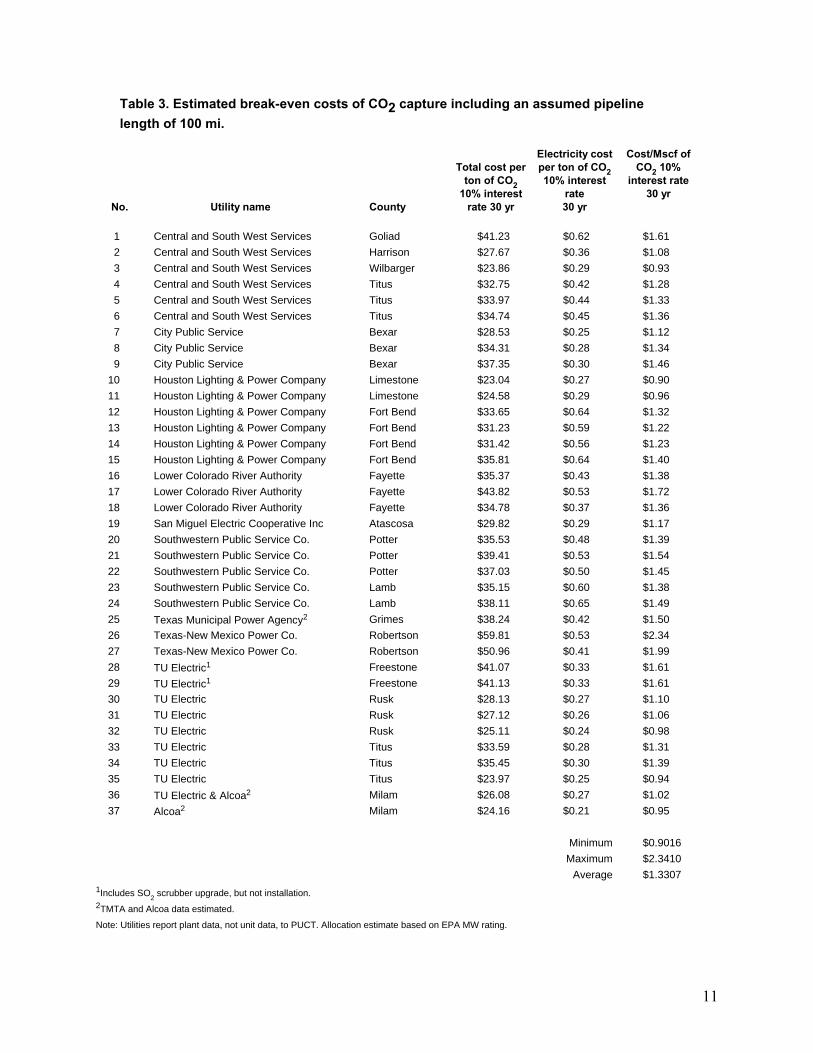
Table 3. Estimated break-even costs of CO2 capture including an assumed pipeline length of 100 mi.............................................................................................................11
Table 4. Effective injectivity in Texas oil reservoirs described by depositional system..19
1
IntroductionFactors Affecting CO2 Sequestration Objectives of Study
This study addresses the feasibility of reducing CO2 power plant emissions in Texas by using the emissions for CO2 enhanced oil recovery. To test this feasibility an understanding of the current state of CO2 supply and costs is undertaken. The literature is extensively reviewed and evaluated to determine the key engineering and geologic characteristics influencing CO2 sequestration. Another objective was to evaluate the characteristics of previous and current gas-displacement recovery projects, Texas oil and gas reservoirs, and Texas power plants. These characteristics were then used to determine candidate reservoirs that have the potential and the feasibility to use power plant CO2 emissions for enhanced oil recovery.
Current CO2 Supply
West Texas CO2 Supply
To understand how CO2 from power plants may be used for enhanced oil recovery an understanding is needed as to how current supplies are being managed. In the early1970s, Permian Basin oil reservoirs were maturing to the point that producers became interested in pursuing tertiary recovery methods to enhance oil recovery. Large quantities of CO2-saturated natural gas were produced nearby, and large quantities of CO2 were being extracted from natural gas and vented into the atmosphere. A Chevron affiliate conceived and developed the first CO2 flood in the area (Sacroc), and Canyon Reef Carriers (“CRC”) constructed a 220-mi (354-km) CO2 pipeline from four CO2 extraction plants (Shell−Terrell, Valero−Grey Ranch, Northern−Mitchell, and Warren−Puckett) to the field to be flooded (Sacroc).
With the success of Chevron’s flood, high oil prices, and many old oil fields to be flooded, the demand for CO2 was so high that major oil companies built three long-haul (500-, 403-, and 210-mi [804-, 648-, and 338-km]) CO2 pipelines into the Permian Basin in the early to mid-1980s sustaining a large volume of input into the Permian Basin area (fig. 1). Distribution pipelines were built in the area, including the 143-mi (230-km) Central Basin Pipe Line (CBPL), which extends from Denver City, Texas (where the three long-haul pipelines converged), to the Yates Field. Most of these pipelines were built on the strength of long-term CO2 purchase contracts.
Currently three major pipelines are supplying West Texas with carbon dioxide from natural sources (fig. 2). Two pipelines transport CO2 from the McElmo Dome. The 502-mi (808-km), 30-in. (76-cm) Cortez Pipeline carries CO2 to the Denver City Hub in West Texas, and the smaller 40-mi, 8-in. McElmo Creek Pipeline supplies Mobil’s McElmo Creek Unit in Utah. Cortez has a capacity of 1 billion standard cubic feet per day (Bscf/d) to 4 Bscf/d, currently delivering up to 1.1 Bscf/d of 98% pure CO2. McElmo Creek can carry approximately 60 million cubic feet per day (MMcf/d). The McElmo Dome is one of the largest known CO2 supplies in the United States, containing more than 10 trillion cubic feet (Tscf) of CO2. Primarily owned by Shell (the operator) and Mobil, the McElmo Dome produces from the Leadville Formation at 8000 ft (2438 m) with 44 wells that produce at individual rates up to 100 MMcf/d. Ironically, while one industry has spent substantial capital producing CO2, another industry has a disposal problem.

2
1800
1600
1400
1200
1000
800
400
200
01984 1986 1988 1990 1992 1994 1996
CO
2 R
ate
(MM
CF
D)
McElmo domeMcElmo domeMcElmo dome
Sheep MountainSheep MountainSheep Mountain
Bravo domeBravo domeBravo dome
Val Verde
600
QAc4305cYear
Figure 1. Volume of CO2 supplied from four source areas to enhanced oil recovery operators in southwest United States (from Shell CO2 Company, Ltd, 1998).
Sheep Mountain is located in south-central Colorado (fig. 2). This reservoir provides 97% pure CO2 to West Texas. The Sheep Mountain pipeline runs 184 mi (296 km) southeast to the Rosebud connection to the Bravo Dome Source Field. This 20-in. (51-cm) line has a capacity of 330 MMcf/d. A separate 24-in. (61-cm) line with a capacity of 480 MMcf/d runs 224 mi (360 km) south to the Denver City Hub and onward to the Seminole San Andres Unit. ARCO and Exxon own the north part of Sheep Mountain, and ARCO, Exxon, and Amerada Hess own the line south of Bravo Dome. ARCO operates both sections of this pipeline. The Sheep Mountain Field, owned by ARCO and Exxon, is the smallest CO2 source field serving the Permian Basin, having published initial reserve estimates of 2 to 3 Tcf. ARCO is the operator of this field, which produces from 6000 ft (1829 m) in the Dakota and Entrada formations in Huerfano County, Colorado.
Bravo Dome is located in northeastern New Mexico. This reservoir provides more than 400 MMcf/d of 99% pure CO2 from more than 350 wells. Recent developments include more than 40 new wells, as well as an upgrade to the compression plant. The CO2 production is delivered to West Texas via the 20-in. (51-cm), 210-mi (338-km) pipeline. Bravo Pipeline, owned by Amoco, Shell, and Crosstimbers, runs 218 mi (351 km) to the Denver City Hub and has a capacity of 382 MMcf/d, delivering CO2 at 1800 to 1900 psi (127 to 134 km/cm2). Major delivery points along the line include the Slaughter field in Cochran and Hockley Counties, Texas, and the Wasson field in Yoakum County, Texas. Amoco operates this pipeline. In 1996, Transpetco began operation of the Transpetco/Bravo pipeline to the Mobil-operated Postle field near Guymon, Oklahoma. This 120-mi (193-km), 12.75-in. (32-cm) line has a capacity of 175 million standard cubic feet per day (MMscf/d). Initially holding reserves of approximately 8 Tcf, Bravo Dome covers an area of more than 1400 mi2 (3624 km2). Production here comes from the Tubb Sandstone at 2300 ft (701 m). The participants are Shell, Amoco, and Amerada Hess.

3
0 400 mi
400 km0
Sheep Mountain pipeline
Cortez pipeline and McElmo Creek pipeline
Bravo pipeline
QAc4308c
San Antonio
Ft. Worth Dallas
El Paso
Albuquerque
Roswell
Houston
Topeka
Wichita
Tulsa
Oklahoma City
Amarillo
Phoenix
Salt Lake City
Ogden
ColoradoSprings
Pueblo
Denver
Santa Fe
Boulder
Wichita Falls
Austin
San Angelo
Tucson
Provo
Laredo
NM
TX
OK
KS
CO
UT
AZ
BrownsvilleBrownsvilleBrownsville
Figure 2. Major pipelines supplying CO2 to enhanced oil recovery operations in the Permian Basin of West Texas (from Shell CO2 Company, Ltd, 1998).
4
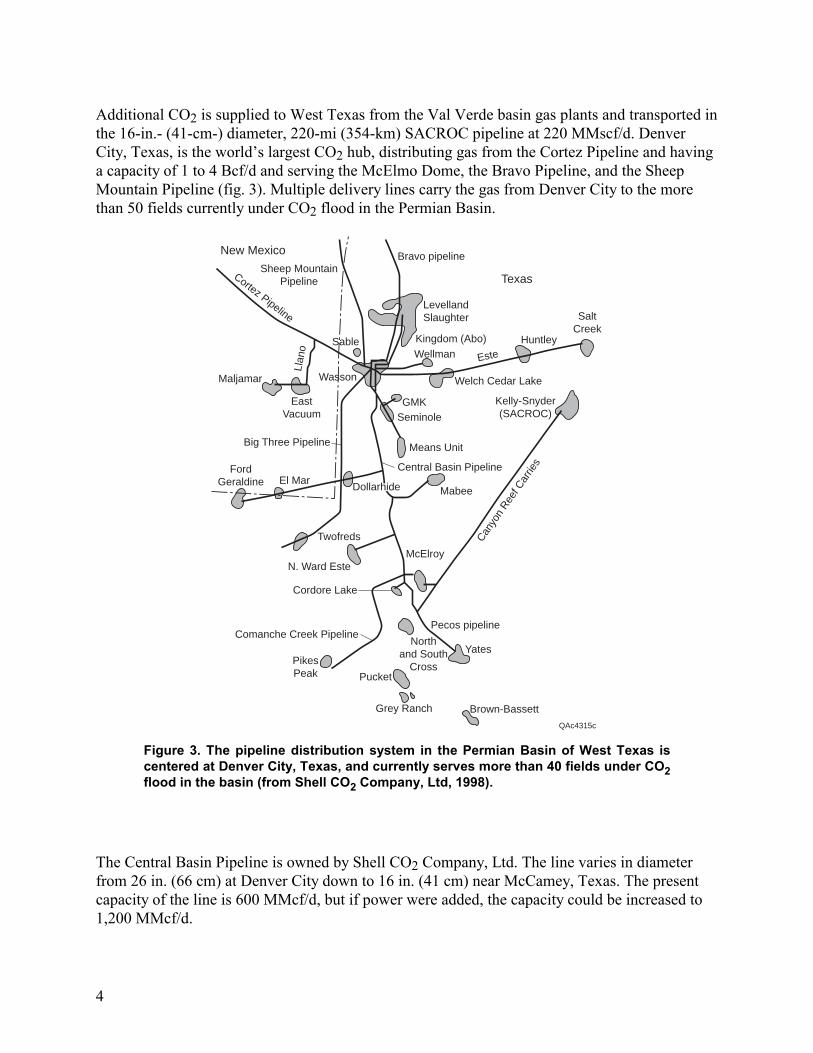
Additional CO2 is supplied to West Texas from the Val Verde basin gas plants and transported in the 16-in.- (41-cm-) diameter, 220-mi (354-km) SACROC pipeline at 220 MMscf/d. Denver City, Texas, is the world’s largest CO2 hub, distributing gas from the Cortez Pipeline and having a capacity of 1 to 4 Bcf/d and serving the McElmo Dome, the Bravo Pipeline, and the Sheep Mountain Pipeline (fig. 3). Multiple delivery lines carry the gas from Denver City to the more than 50 fields currently under CO2 flood in the Permian Basin.
New Mexico Bravo pipeline
Brown-BassettGrey Ranch
Northand South
CrossPucket
Yates
Pecos pipeline
PikesPeak
Comanche Creek Pipeline
N. Ward Este
Twofreds
McElroy
Cordore Lake
Can
yon
Ree
f Car
ries
Mabee
Means Unit
GMKSeminole
Maljamar
EastVacuum
FordGeraldine El Mar
Texas
SaltCreek
Huntley
LevellandSlaughter
Kelly-Snyder(SACROC)
Kingdom (Abo)Wellman Este
Wasson
Llan
o
Sable
Central Basin Pipeline
Big Three Pipeline
Welch Cedar Lake
Cortez Pipeline
Sheep MountainPipeline
QAc4315c
Dollarhide
Figure 3. The pipeline distribution system in the Permian Basin of West Texas is centered at Denver City, Texas, and currently serves more than 40 fields under CO2 flood in the basin (from Shell CO2 Company, Ltd, 1998).
The Central Basin Pipeline is owned by Shell CO2 Company, Ltd. The line varies in diameter from 26 in. (66 cm) at Denver City down to 16 in. (41 cm) near McCamey, Texas. The present capacity of the line is 600 MMcf/d, but if power were added, the capacity could be increased to 1,200 MMcf/d.
5
The Este Pipeline is 119 mi (191 km) long and 12 to 14 in. (30 to 36 cm) in diameter, and it is operated by Mobil. Other major owners in the line include Amoco, Conoco, and Occidental. The capacity of the line is 250 MMcf/d at Denver City and 150 MMcf/d at the Salt Creek terminus. Mobil operates the Slaughter Pipeline, which is a 12-in. (30-cm) line with a capacity of approximately 160 MMcf/d. The line runs 40 mi (64 km) from Denver City to Hockley County, Texas.
Air Liquide owns and operates the West Texas Pipeline and the Llano lateral. The West Texas Pipeline extends from the Denver City Hub 127 mi (204 km) south to Reeves County, Texas. The Llano lateral runs 53 mi (85 km) off the Cortez main line. Both pipelines vary from 8 to 12 in. (20 to 30 cm) in diameter and have capacities of approximately 100 MMcf/d.
The CRC pipeline, constructed in 1972, is the oldest CO2 pipeline in West Texas. The CRC pipeline extends 140 mi (225 km) from McCamey, Texas, to Pennzoil’s SACROC field. This pipeline is 16 in. (41 cm) in diameter and has a capacity of approximately 240 MMcf/d.
All of these pipelines transport CO2 at pressures between 1069 and 2500 psig (75 and 176 kg/cm2). This maintains the CO2 above its critical point and results in single-phase flow. Together, they currently bring more than 1.77 Bscf/d of CO2 into the Permian Basin. This extensive pipeline network demonstrates a mature technology and the willingness to apply it if economically feasible.
Additional CO2 Supply in Other Regions of Texas
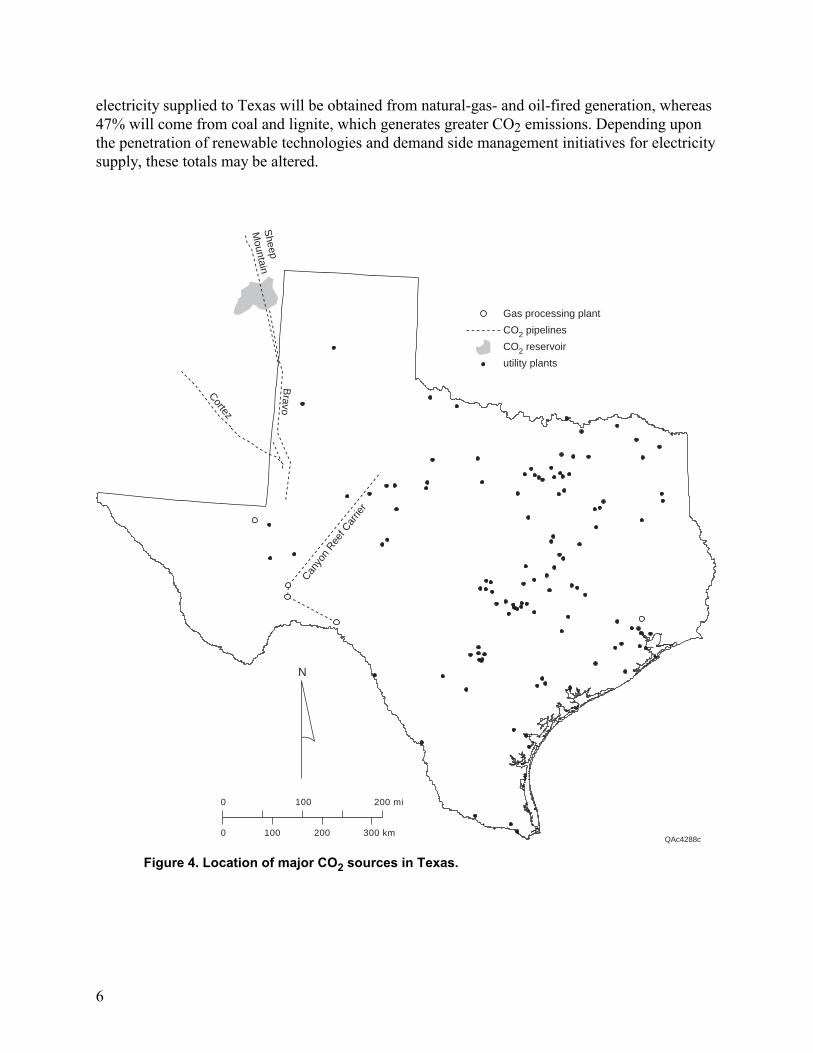
In the rest of Texas, the established CO2 distribution infrastructure is considerably less well developed. Consequently, if CO2 is sequestered outside of the areas described in West Texas, substantial additional pipeline investment is likely to be needed, either through conversion of existing pipeline facilities, or construction of new facilities. Nevertheless, substantial potential exists for CO2 sequestration in other parts of the state where existing generation is located, and where naturally occurring sources of CO2 exist (fig. 4). Naturally occurring sources in Texas are from hydrocarbon gas reservoirs that contain a high content of CO2.
Fossil-Fired Generation Units as Sources of CO2 Effluent
To assess the technical feasibility for additional cost-effective CO2 supply, various production and separation processes for power plant emissions were reviewed. Promising separation technologies and power plants were identified and ranked using multiple criteria. High-concentration monoethanolamine (MEA) recovery is considered as an attractive technological approach for coal- or lignite-fired plants. High-concentration MEA and total effluent capture were noted as promising technological approaches for gas-fired plants.
In 1996, Texas was the single largest producer of electricity in the United States, with an installed electricity generation base of more than 65,000 megawatts (MW). Of this generation base, approximately 60% was capable of gas/oil firing, and 28% was coal/lignite capable. By the year 2000, the installed capacity is expected to grow to more than 66,000 MW. With current price and tax expectations, the implication is that in 2000 approximately 33% of summer
6
electricity supplied to Texas will be obtained from natural-gas- and oil-fired generation, whereas 47% will come from coal and lignite, which generates greater CO2 emissions. Depending upon the penetration of renewable technologies and demand side management initiatives for electricity supply, these totals may be altered.
N
100 200 mi0
300 km0 100 200
Gas processing plant
CO2 pipelines
CO2 reservoir
utility plants
Sheep
Mountain
Cortez
Bravo
Canyo
n Ree
f Car
rier
QAc4288c Figure 4. Location of major CO2 sources in Texas.
7
CO2 Effluent from Coal and Lignite Generation Plants
Initially, the focus was on all generating plants in Texas. However, most natural-gas-fired plants have lower net dependable capacities and relatively low capacity factors (many under 10%). This means that they produce widely varying amounts of CO2, depending on electricity demand, thereby introducing complications for using the CO2 effluent for EOR processes. Also, these intermediate and peaking plants are predominantly gas fired, producing substantially lower CO2 emissions per megawatt hour than base-load coal- and lignite-fired facilities.
For a given megawatt-hour of power generated (a so-called busbar analysis), natural-gas-fired plants emit perhaps 50 to 60% of the CO2 effluent that a comparable coal-fired plant does. So, in general, gas-fired plants are smaller, and they do not operate as many hours per year as coal- or lignite-fired plants. Further, even when they do, they generate substantially lower amounts of CO2.
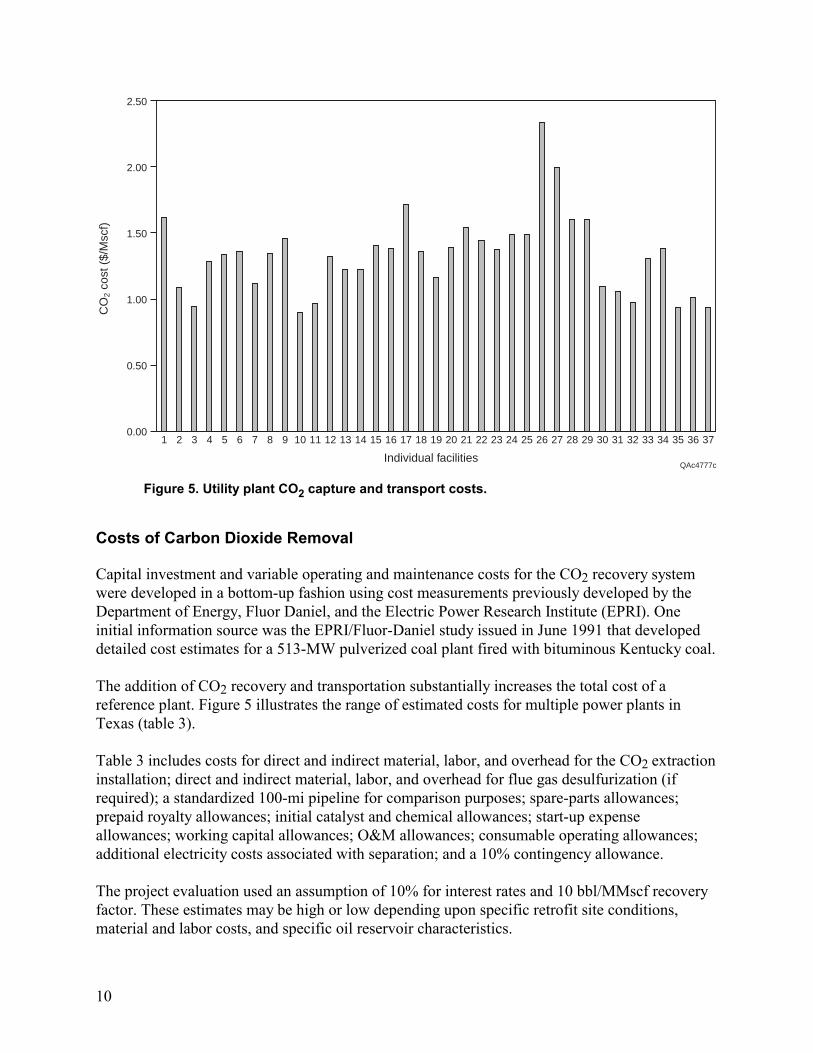
In light of these general characteristics, the installed generation base in addition to near-term expected capacity additions was screened. These sources are described in tables 1 and 2. CO2 emissions from these facilities as reported to the Environmental Protection Agency (EPA) and/or calculated on the basis of energy production data supplied to the Public Utilities Commission of Texas (PUCT) are summarized in figure 5.
A group of 37 candidate coal- and lignite-fired plants was determined to represent the best potential for CO2 capture on the basis of installed capacity, expected annual capacity factors, fuel sources, and plant characteristics. These traditionally have high capacity factors (average about 75% in the mid 1990s) and are base loaded in the electrical grid. The combined installed net dependable capacity (NDC) is approximately 18,843 MW. For each of these plants, a CO2 capture and transportation system was considered on the basis of capture of 90% of the CO2 effluent.
Important factors for CO2 supply include the anticipated purity, term of availability, reliability, and characteristics of supply, transportation mechanisms, and expected production costs. So it should be noted that some natural-gas-fired plants may also represent candidates for contributing to greater recovery of Texas oil resources. It is not clear from this study whether CO2 capture or flue gas capture from these plants represents a better technological and economic approach to meeting the environmental goal of reducing effluents. Since natural-gas-fired plants are most likely to be affected first by any major changes in grid electrical load, it may be desirable to undertake additional operational simulations using system dispatch, revised loads, and alternate capture technologies in the future.
Factors Controlling the Volume of CO2 Output
To analyze CO2 supply and demand in an integrated fashion, potential production rates were established on a total cycle basis through historical capacity factors, analysis of actual plant-by-plant fuel mixes, and actual emissions as reported to the United States Environmental Protection Agency. Near-term plant-specific generation additions were considered, and CO2 emissions for
8
these plants were estimated on the basis of knowledge of current fuel procurement practices and information obtained from the Texas Air Control Board, the Texas Public Utility Commission, the Environmental Protection Agency, and Resource Data International.
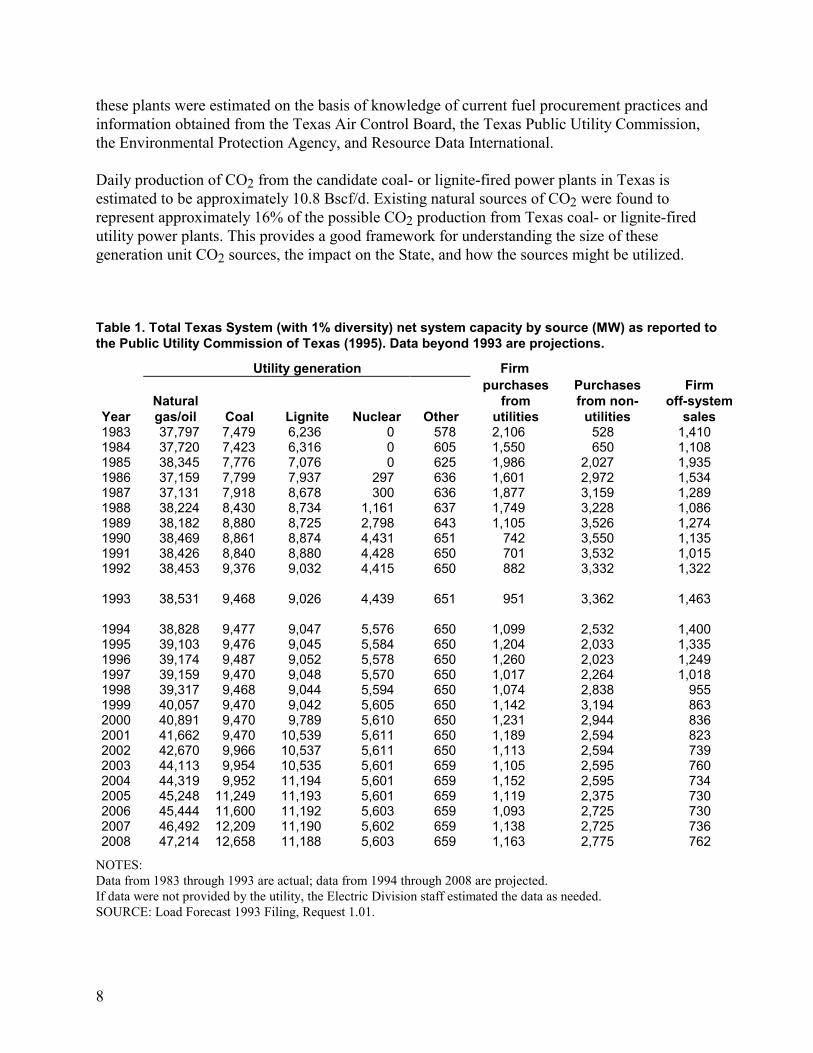
Daily production of CO2 from the candidate coal- or lignite-fired power plants in Texas is estimated to be approximately 10.8 Bscf/d. Existing natural sources of CO2 were found to represent approximately 16% of the possible CO2 production from Texas coal- or lignite-fired utility power plants. This provides a good framework for understanding the size of these generation unit CO2 sources, the impact on the State, and how the sources might be utilized.
Table 1. Total Texas System (with 1% diversity) net system capacity by source (MW) as reported to the Public Utility Commission of Texas (1995). Data beyond 1993 are projections.
Utility generation Firm
Year
Natural gas/oil
Coal
Lignite
Nuclear
Other
purchases from
utilities
Purchases from non-
utilities
Firm off-system
sales 1983 37,797 7,479 6,236 0 578 2,106 528 1,410 1984 37,720 7,423 6,316 0 605 1,550 650 1,108 1985 38,345 7,776 7,076 0 625 1,986 2,027 1,935 1986 37,159 7,799 7,937 297 636 1,601 2,972 1,534 1987 37,131 7,918 8,678 300 636 1,877 3,159 1,289 1988 38,224 8,430 8,734 1,161 637 1,749 3,228 1,086 1989 38,182 8,880 8,725 2,798 643 1,105 3,526 1,274 1990 38,469 8,861 8,874 4,431 651 742 3,550 1,135 1991 38,426 8,840 8,880 4,428 650 701 3,532 1,015 1992 38,453 9,376 9,032 4,415 650 882 3,332 1,322
1993 38,531 9,468 9,026 4,439 651 951 3,362 1,463
1994 38,828 9,477 9,047 5,576 650 1,099 2,532 1,400 1995 39,103 9,476 9,045 5,584 650 1,204 2,033 1,335 1996 39,174 9,487 9,052 5,578 650 1,260 2,023 1,249 1997 39,159 9,470 9,048 5,570 650 1,017 2,264 1,018 1998 39,317 9,468 9,044 5,594 650 1,074 2,838 955 1999 40,057 9,470 9,042 5,605 650 1,142 3,194 863 2000 40,891 9,470 9,789 5,610 650 1,231 2,944 836 2001 41,662 9,470 10,539 5,611 650 1,189 2,594 823 2002 42,670 9,966 10,537 5,611 650 1,113 2,594 739 2003 44,113 9,954 10,535 5,601 659 1,105 2,595 760 2004 44,319 9,952 11,194 5,601 659 1,152 2,595 734 2005 45,248 11,249 11,193 5,601 659 1,119 2,375 730 2006 45,444 11,600 11,192 5,603 659 1,093 2,725 730 2007 46,492 12,209 11,190 5,602 659 1,138 2,725 736 2008 47,214 12,658 11,188 5,603 659 1,163 2,775 762
NOTES: Data from 1983 through 1993 are actual; data from 1994 through 2008 are projected. If data were not provided by the utility, the Electric Division staff estimated the data as needed. SOURCE: Load Forecast 1993 Filing, Request 1.01.

9
Table 2. Total Texas System net generation by fuel type (MWH) as reported to the Public Utility Commission of Texas (1995). Data beyond 1993 are projections.
Year
Natural gas/oil
Coal Lignite
Nuclear
Hydro
Alternative energy
sources
Total 1983 108,472,667 44,315,291 39,557,746 0 420,649 423,908 193,190,262 1984 116,750,478 46,030,355 41,889,563 0 412,697 388,102 205,471,194 1985 115,169,766 48,762,812 43,340,608 5,348 507,663 433,080 208,219,275 1986 105,354,612 44,721,955 51,325,397 2,408,112 827,995 441,060 205,079,132 1987 99,915,790 47,724,889 54,008,209 3,856,481 1,013,902 538,515 207,057,786 1988 99,005,075 51,955,633 55,703,331 9,188,699 492,368 539,720 216,884,827 1989 96,447,813 54,411,637 57,178,803 12,164,231 501,542 669,022 221,373,049 1990 93,018,621 54,741,953 57,455,949 20,113,273 701,829 785,825 226,817,450 1991 92,187,964 54,946,407 57,973,525 24,939,688 730,979 800,966 231,579,529 1992 87,317,589 55,226,951 57,775,272 28,460,345 1,239,625 780,495 230,800,280
1993 99,680,917 64,036,411 58,249,971 16,896,714 636,743 827,199 240,327,955
1994 88,548,160 63,008,926 55,195,335 35,703,484 649,923 866,028 243,971,854 1995 93,416,323 62,582,666 58,177,256 36,187,308 651,946 865,057 251,880,555 1996 97,147,837 64,825,477 57,772,118 35,561,915 657,910 871,781 256,837,037 1997 99,294,498 65,620,365 58,565,721 37,017,404 651,757 872,019 262,021,766 1998 104,432,650 65,924,261 57,773,714 37,608,781 663,806 881,565 267,284,776 1999 112,434,016 68,464,536 55,817,008 36,477,016 678,074 883,508 274,754,158 2000 111,388,761 73,433,871 59,134,864 37,540,417 674,950 896,116 283,068,980 2001 114,075,461 76,827,618 60,171,538 37,329,563 681,618 896,032 289,981,829 2002 119,368,869 81,420,229 58,086,854 36,460,238 681,864 897,953 296,916,007 2003 124,270,630 84,161,145 57,734,294 37,471,251 676,784 899,824 305,213,927 2004 127,728,567 87,727,143 59,000,177 37,352,885 677,646 902,024 313,388,442 2005 129,283,782 92,581,340 59,122,776 36,262,497 667,401 902,364 318,830,159 2006 131,849,298 92,606,926 62,560,513 37,965,976 677,314 903,473 326,563,499 2007 136,222,644 98,331,459 59,711,742 37,627,843 678,979 904,720 333,477,387 2008 140,182,725 104,521,221 58,231,797 37,059,978 678,126 906,978 341,580,823
(1): 2.2 2.8% -0.1% 8.3% 0.6% 0.8% 2.4%
NOTES: Data from 1983 through 1993 are actual; data from 1994 through 2008 are projected. If data were not provided by the utility, the Electric Division staff estimated the data as needed. (1) Compound growth rate for 1993−2003 period. The growth rate for nuclear is exceptionally large because of the 1993
extended outage for STP. SOURCE: Load Forecast 1993 Filing, Request 2.01.
10
0.00
0.50
1.00
1.50
2.00
2.50C
O2
cost
($/
Msc
f)
Individual facilitiesQAc4777c
1 2 3 4 5 6 7 8 9 10 11 12 13 14 15 16 17 18 19 20 21 22 23 24 25 26 27 28 29 30 31 32 33 34 35 36 37
Figure 5. Utility plant CO2 capture and transport costs.
Costs of Carbon Dioxide Removal
Capital investment and variable operating and maintenance costs for the CO2 recovery system were developed in a bottom-up fashion using cost measurements previously developed by the Department of Energy, Fluor Daniel, and the Electric Power Research Institute (EPRI). One initial information source was the EPRI/Fluor-Daniel study issued in June 1991 that developed detailed cost estimates for a 513-MW pulverized coal plant fired with bituminous Kentucky coal.
The addition of CO2 recovery and transportation substantially increases the total cost of a reference plant. Figure 5 illustrates the range of estimated costs for multiple power plants in Texas (table 3).
Table 3 includes costs for direct and indirect material, labor, and overhead for the CO2 extraction installation; direct and indirect material, labor, and overhead for flue gas desulfurization (if required); a standardized 100-mi pipeline for comparison purposes; spare-parts allowances; prepaid royalty allowances; initial catalyst and chemical allowances; start-up expense allowances; working capital allowances; O&M allowances; consumable operating allowances; additional electricity costs associated with separation; and a 10% contingency allowance.
The project evaluation used an assumption of 10% for interest rates and 10 bbl/MMscf recovery factor. These estimates may be high or low depending upon specific retrofit site conditions, material and labor costs, and specific oil reservoir characteristics.
11
Table 3. Estimated break-even costs of CO2 capture including an assumed pipeline length of 100 mi.
No.
Utility name
County
Total cost per
ton of CO2 10% interest
rate 30 yr
Electricity cost per ton of CO2 10% interest
rate 30 yr
Cost/Mscf of CO2 10%
interest rate 30 yr
1 Central and South West Services Goliad $41.23 $0.62 $1.61
2 Central and South West Services Harrison $27.67 $0.36 $1.08
3 Central and South West Services Wilbarger $23.86 $0.29 $0.93
4 Central and South West Services Titus $32.75 $0.42 $1.28
5 Central and South West Services Titus $33.97 $0.44 $1.33
6 Central and South West Services Titus $34.74 $0.45 $1.36
7 City Public Service Bexar $28.53 $0.25 $1.12
8 City Public Service Bexar $34.31 $0.28 $1.34
9 City Public Service Bexar $37.35 $0.30 $1.46
10 Houston Lighting & Power Company Limestone $23.04 $0.27 $0.90
11 Houston Lighting & Power Company Limestone $24.58 $0.29 $0.96
12 Houston Lighting & Power Company Fort Bend $33.65 $0.64 $1.32
13 Houston Lighting & Power Company Fort Bend $31.23 $0.59 $1.22
14 Houston Lighting & Power Company Fort Bend $31.42 $0.56 $1.23
15 Houston Lighting & Power Company Fort Bend $35.81 $0.64 $1.40
16 Lower Colorado River Authority Fayette $35.37 $0.43 $1.38
17 Lower Colorado River Authority Fayette $43.82 $0.53 $1.72
18 Lower Colorado River Authority Fayette $34.78 $0.37 $1.36
19 San Miguel Electric Cooperative Inc Atascosa $29.82 $0.29 $1.17
20 Southwestern Public Service Co. Potter $35.53 $0.48 $1.39
21 Southwestern Public Service Co. Potter $39.41 $0.53 $1.54
22 Southwestern Public Service Co. Potter $37.03 $0.50 $1.45
23 Southwestern Public Service Co. Lamb $35.15 $0.60 $1.38
24 Southwestern Public Service Co. Lamb $38.11 $0.65 $1.49
25 Texas Municipal Power Agency2 Grimes $38.24 $0.42 $1.50
26 Texas-New Mexico Power Co. Robertson $59.81 $0.53 $2.34
27 Texas-New Mexico Power Co. Robertson $50.96 $0.41 $1.99
28 TU Electric1 Freestone $41.07 $0.33 $1.61
29 TU Electric1 Freestone $41.13 $0.33 $1.61
30 TU Electric Rusk $28.13 $0.27 $1.10
31 TU Electric Rusk $27.12 $0.26 $1.06
32 TU Electric Rusk $25.11 $0.24 $0.98
33 TU Electric Titus $33.59 $0.28 $1.31
34 TU Electric Titus $35.45 $0.30 $1.39
35 TU Electric Titus $23.97 $0.25 $0.94
36 TU Electric & Alcoa2 Milam $26.08 $0.27 $1.02
37 Alcoa2 Milam $24.16 $0.21 $0.95
Minimum $0.9016
Maximum $2.3410
Average $1.3307 1Includes SO
2 scrubber upgrade, but not installation.
2TMTA and Alcoa data estimated.
Note: Utilities report plant data, not unit data, to PUCT. Allocation estimate based on EPA MW rating.
12
For a typical 513-MW plant, the cost increased from $580 million to approximately $1.2 billion, assuming a 300-mi (483-km) pipeline. The incremental cost is approximately $620 million, or 107% of the cost of the base plant. Note that these costs varied substantially, depending primarily upon the size of the generating plant, because economies of scale exist. Existing infrastructure and available pipeline capacity can also influence cost dramatically.
Electrical Load Requirements
Variable Capture
As electricity demand varies, generation unit output is varied to meet load plus various transmission criteria. For this project, history was used as a guide to develop an estimate of unit load factor. The assumptions contained in this data choice may be either conservative or liberal because a dynamic simulation was not undertaken. Also, if absolute capture is not required continuously because of generation needs on a real-time basis, compression activities may be considered to be somewhat flexible. For the 513-MW reference plant, approximately 110 MW is needed for these compression activities. Therefore, these additional electrical load requirements are not necessarily trivial. Flexibility and possibly storage of CO2 effluent may hold considerable potential for meeting EOR needs, meeting overall sequestration targets, and meeting consumer electricity demand.
CO2 Storage and Disposal Costs
If CO2 storage is assumed, it is possible that compression activities could be modified to follow electrical load requirements, thus reducing capacity constraints and the potential need for additional peaking requirements. Dual fuel compression capability, or compression served by natural gas with storage back-up, could also be a viable approach.
For the purpose of this investigation, no additional CO2 disposal costs were considered. These are assumed to be represented by the field redevelopment costs included in the EOR field project costs.
Power Plant Life
In this study, it was necessary to assume an economic life for the power plant supplying effluent and the capture portion of the project. These assumptions raise a major issue: “What is the proper definition of the ‘economic life’ of the ‘project’?” Is this to be viewed from an “environmental” perspective as to how much CO2 can be sequestered, or from an oil “revenue” perspective? From an environmental perspective, the design life of power plant generation equipment and related devices is usually 30 years. However, it was also recognized that the history of such a plant and its equipment has been that it is “repowered” and often used for a much longer period. Nevertheless, initial simulations were undertaken using this 30-year value.
Subsequent demand/supply balancing efforts indicated that the shortest life that might be expected for the capture/compression equipment was how long the CO2 was required for enhanced recovery. Original reservoir pressure was assumed to represent the shortest life for these reservoirs as CO2 sinks. However, it was also recognized that these reservoirs might be
13
“overpressured” compared with their estimated initial pressures. To simulate this physical original reservoir pressure criteria, additional sensitivities were undertaken assuming a 10-year life and a 20-year life for the reservoir (and, therefore, the project).
Sequestration Management
Sequestration management is a concept that applies to improvements that result from the use of multiple storage reservoirs having multiple CO2 effluent sources. The management process also includes matching of CO2 source production profiles with the needs of the CO2 reservoirs on a daily operational basis, reflecting an attempt to balance operational supply and demand constraints. Finally, the management process also includes a matching of long-term supply and demand. Once the CO2 capacity of a particular reservoir is fully utilized, an appropriate management process will have identified the next reservoir to be filled.
The major tools that are utilized in an effective management effort include CO2 pipelines, CO2 storage reservoirs, real-time pricing, variable volume production strategies, separation cycling, and other tools. Production strategies are closely linked to characteristics of the target reservoir.
Oil and Gas Reservoir Characteristics Influencing CO2 Sequestration
A wide range of oil and gas reservoir characteristics was found to be important in CO2 EOR miscibility projects and sequestration. General and geologic characteristics describe the setting in which a reservoir lies. Engineering and rock-fluid characteristics describe dynamics of fluid movement and the effects of reservoir development on the current and future state of the reservoir. Characteristics controlling the usage of CO2 delineate how socioeconomic factors combine with reservoir characteristics.
General Oil and Gas Reservoir Characteristics
Reservoir Depth
Reservoir depth is a very important factor because start-up and field operating costs increase with depth. Deeper wells result in greater drilling costs and greater operating costs to inject and pump out fluids. Reservoir temperature increases with depth, resulting in a higher minimum miscibility pressure. Consequently, a larger volume of CO2 could be required to achieve the same CO2 mobile pore volume slug (Flanders and Shatto, 1993). However, the effectiveness of the EOR projects depends on pressure, and deeper reservoirs are therefore preferred because minimum miscibility pressure is more likely to be reached. Miscible CO2 displacement results in approximately 22% higher recovery, whereas immiscible displacement achieves approximately 10% higher recovery (Haskin and Alston, 1989). Additionally, note that all CO2 miscible projects in the United States are at depths of greater than 2000 ft (610 m).
Temperature
Reservoir temperature has a direct influence on the physical properties of CO2 and therefore in the applicability of CO2 floods. The CO2 critical temperature is 88°F (31°C). Because most reservoirs exhibit temperatures above this point, CO2 behaves as a vapor under these conditions.
14
CO2 density increases with pressure at temperatures above critical conditions (Klins and Bardon, 1991). These properties mean that CO2, from the standpoint of availability, cost, and operational handling, is the most practical of solvent gases in terms of miscibility. Also, as reservoir temperature increases under a specific level of pressure, the viscosity of CO2 decreases and its compressibility increases. That implies that reservoirs with sufficient temperature levels (100 to 170°F [38 to 77°C]) will be adequate for CO2 miscible floods.
Pressure
This is one of the most important factors to determine CO2 miscibility in oil. According to Klins and Bardon (1991), it is possible to achieve a different level of miscibilities, ranging from immiscible (low-pressure reservoirs) through intermediate- to high-pressure applications (miscible displacement). The minimum miscibility pressure has a wide range of values (Holm and O’Brien, 1970; Pontious and Tham, 1978; Hunter and others, 1982; Winzinger and Patel, 1989; El-Saleh, 1996) depending on depth, temperature, and crude oil composition. A minimum of 1500 psi is generally regarded as a target reservoir pressure at which to conduct a successful CO2 flood. This condition imposes an important restriction related to the current level of reservoir pressure for a miscible CO2 flood. Because a significant number of reservoirs in Texas fall below this level, the CO2 flood is typically implemented after waterflooding and has increased the current pressure.
Reservoir Drive Mechanism
The reservoir drive mechanism is the mechanism that supplies the energy for hydrocarbon production. The reservoir drive mechanism has a direct impact on what is occupying the pore volume. Solution-gas or pressure-depletion drive usually result in hydrocarbon gas occupying the pores as well as water and oil. Aquifer drive can result in just oil and water occupying the pore volume if the water drive mechanism is strong enough to keep the pressure high so that the hydrocarbon gas stays dissolved in the oil. The pore space occupied by invading water during production of the reservoir affects CO2 miscibility and increases pressure requirements in order to achieve adequate injectivity. Gas-cap-expansion drive results in that portion of the reservoir high on structure containing a high hydrocarbon gas fraction within the pores. Solution gas is the most typical drive mechanism where CO2 flooding is applied; this applies particularly to the major carbonate reservoirs of West Texas. Many reservoirs in the Texas Gulf Coast have strong water drives combined with low residual oil saturations and, therefore, are less unsuitable for CO2 injection as an EOR mechanism.
Geological Characteristics
Structure and Reservoir Seal
The presence of a good seal determines the integrity of the reservoir for oil recovery and CO2 sequestration. Adequate CO2 floods require, to the greatest extent possible, isolated reservoir structures where potentially leaking boundaries, such as faults, are not present in order to prevent the loss of CO2. The absence of leaking boundaries is also important to prevent the possibility of contamination of adjacent reservoir (or even nonreservoir) intervals. A good understanding of the
15
structural geology of the reservoir has to be developed before starting a CO2 sequestration and/or enhanced oil recovery project. In particular, faults may be sealing or nonsealing, a question that is often difficult to answer.
Diagenesis/Mineralogy
Diagenesis controls the dynamics of the CO2 flood and the available pore volume and strongly contributes to the heterogeneity of the reservoir. Porosity reductions and areal changes in horizontal or vertical permeability are frequent effects of diagenetic processes, the impact of which can be evaluated through reservoir characterization. Understanding the history of diagenesis can help predict flow pathways within the reservoir. Diagenesis and mineralogy affect the rock wettability and effective porosity, which, in turn, influence the EOR recovery. Wettability refers to whether oil or water is in contact with the rock. Wettability influences the relative ability of each fluid to flow through the rock.
Engineering and Reservoir Development Characteristics
Well Spacing
Well spacing, the distance between wells and the acreage they cover, shows a range of distribution from 10 to 40 acres per well (40,470 to 161,880 m2/well) for most oil fields (Beike and Holtz, 1996). Numerous factors including regulations, economics, reservoir size, API gravity of the oil crude, structural heterogeneity, depositional system, and the nature of the exploitation process determine well spacing. In many CO2 flood projects, infill drilling is conducted to reduce well spacing to improve pattern uniformity. CO2 projects may also require reallocation of water injector wells to achieve optimal reservoir pressure, improvement in injection profiles, and a closer monitoring of producing wells. Reduction of well spacing can improve the sweep efficiency of the CO2 and may improve the economics of the CO2 injection project (Hadlow, 1992). However, additional reservoir engineering work, such as simulation models and work-over activities to improve CO2 injection profiles, must frequently be done in order to avoid or reduce early breakthrough as a consequence of well spacing reductions.
Well-Bore Integrity
Well-bore integrity, the mechanical condition of the well and the quality of the cement jobs performed when the well was initially completed, depends on the age of the well and how well it was maintained. A leaking well-bore annulus can be a source for CO2 migration to unexpected areas in the stratigraphic sequence encountered by the well (aquifers, adjacent reservoir zone, and other areas). This can contribute to economic loss, reduction of CO2 flood efficiency, and potential compromise of the field for sequestration. Commonly, a detailed logging program for checking well-bore integrity is conducted for the operator to protect aquifers and prevent reservoir cross-flow. In older fields, well-bore integrity must always be evaluated because it can always compromise any enhanced recovery or sequestration efforts.

16
Waterflooding
Waterflooding is the production strategy of injecting water into an oil reservoir to displace and repressurize the oil. When waterflooding occurs it leaves behind the residual oil that is the target of CO2 EOR miscibility projects. Water injection is applied in the vast majority of fields in Texas that do not have a strong natural water-drive mechanism (Pontious and Tham, 1978; SPE-EOR, 1986; SPE-EOR, 1989; Winzinger and Patel, 1989; SPE-EOR, 1991; El-Saleh, 1996). The most important purpose of waterflooding in terms of CO2 EOR miscibility projects is repressurization of the reservoir after primary depletion. A high level of reservoir pressure will make the CO2 miscible in oil, thereby increasing the oil recovery efficiency. Normally, CO2 injection starts after an advanced phase of waterflooding.
Reservoir Pressure Depletion
As oil is produced from a reservoir the initial pressure is normally reduced. In order to have successful implementation of CO2 EOR miscibility projects, one frequently redesigns the project by changing injection rates or well patterns to increase the reservoir pressure level in mature reservoirs (SPE-EOR, 1991; Kirkpatrick and others, 1985; Flanders and Shatto, 1993). Variations in reservoir vertical and areal depleted pressure will potentially affect the sweep efficiency of the CO2 flood and the amount of CO2 that can ultimately be sequestered. A highly pressure depleted reservoir may be a poor candidate for CO2 EOR miscibility projects but could have large potential for sequestration.
Production Voidage
For oil recovery, an excessive production voidage vertically or areally within the reservoir is the origin of early CO2 breakthrough and a rapid reduction in reservoir pressure. Many CO2 floods in Texas are based on adequate replacement factors that incorporate balanced production-injection plans. An additional set of issues may be present for sequestration where excessive injection is employed. The volumetric balance of any potential sequestration reservoir must be well understood.
Rock-Fluid Property Characteristics
Oil and Gas Gravity
Oil gravity, a measure of the density of oil and the hydrocarbon component makeup, plays an important role in CO2 flooding for oil recovery and sequestration because oil character affects CO2 solubility. Most of the benefits CO2 conveys for oil recovery, such as oil swelling and viscosity reduction, are highly influenced by the oil’s API gravity (Klins and Bardon, 1991). There are widely varying screening criteria related to oil API and CO2 flooding (Kirkpatrick and others, 1985; Haskin and Alston, 1989; Klins and Bardon, 1991; Bradley; Taber et al.). In a general sense, the API gravity must not be less than 13° API nor greater than 55° API. Very heavy oils or very volatile oils have historically resulted in poor sweep efficiencies. However, more study is needed to determine how various oil characteristics will affect CO2 sequestration characteristics.

17
Porosity
Porosity, the void space within rock that can hold oil, gas, or water, is the fundamental contributor to reservoir storage capacity. Porosity values vary widely for different depositional systems, but they generally range between 11 and 30% (Beike and Holtz, 1996). The type of porosity, as well as the amount, is important. Well-connected porosity of similar size is the best type for both CO2 EOR miscibility projects and sequestration. It is common to compare projects on the basis of porosity acre-feet per active well. Greater porosity, with all other properties being equal, increases the viability of sequestration.
Permeability
Permeability, the ease at which fluid flows through a rock, determines the fluid dynamics of the reservoir. High permeability will allow high volumes of CO2 to be injected into a single well, thus reducing cost. High permeability will also allow CO2 to move out more quickly into the reservoir, which is also favorable to sequestration. Though this factor is sometimes not considered a critical one in CO2 EOR miscibility projects, large permeability variation can be a potential contributor to unsuccessful CO2 floods and to sequestration, especially in depositional systems with high vertical and horizontal variability in permeability. Strata with high values of permeability will induce the CO2 to have early breakthrough, reducing oil sweep efficiency. In this situation, a program of water-after-gas (WAG), profile injection improvement and modification may be applied to diminish the effect of permeability variation.
Irreducible Water Saturation
Irreducible water saturation (Swi), the immovable water held in the rock by capillary forces and interfacial tension, fills part of the pore volume. Low values are thus preferred because more oil is contained in the rock to be produced by a CO2 EOR miscibility project and more pore volume is available for sequestering CO2 . The movable oil volume (MOV), or the theoretical amount of oil that can be removed in a water or gas flood, is a function of Swi and can be expressed as MOV= PV × (1-Sor-Swi) (Dake, 1978), where PV is pore volume and Sor is residual oil saturation. Additional studies are needed to determine what CO2 volume may be sequestered in the irreducible water saturation.
Residual Oil Saturation
Residual oil saturation, that portion of the oil that is not displaceable by water, has high variability and depends on the heterogeneity of the depositional system, capillary pressure, wettability, and the connectivity and character of the pore space. Residual oil saturation is a property of the reservoir rock that is strongly affected by rock wettability. Residual oil saturation is the main target for a CO2 EOR miscibility project. It will also have an impact on sequestration volumes. If sequestration alone is applied without prior CO2 EOR miscibility recovery, the residual oil saturation will occupy a portion of the pore volume, decreasing the total volume that can be sequestered.

18
Relative Permeability
Relative permeability, the permeability of one phase relative to another, determines the mobility ratio of the CO2 flood displacement. Defined as the ratio of the displacing to the displaced mobility, the overall efficiency of miscible displacement may be lowered by the effect of an unfavorable mobility ratio. Relative permeability occurs because the rock porosity contains multiple phases including oil, water, and gas. Relative permeability affects the injectivity of CO2 and, therefore, is an important factor in the rate at which CO2 will be sequestered.
Injectivity
Injectivity, the ability to pump fluid or gas into a rock, is directly related to effective transmissibility (permeability - thickness) of the injection zones. In this sense, one of the major concerns in CO2 flooding is the loss of injectivity. Because a large number of projects are developed in reservoirs having an average permeability of less than 10 md, loss of injectivity has a significant impact on the economic viability of the project. However, successful projects in reservoirs having low values of permeability are frequent in Texas (Holm and O’Brien, 1970; Hunter and others, 1982; and Flanders and Shatto, 1993). Periodic reservoir stimulation and changes in injection parameters frequently help to decrease the effect of loss of injectivity. Table 4 shows effective injectivity in Texas oil reservoirs categorized by depositional systems.
Carbonate projects generally show injectivity levels lower than the sandstone group. Carbonate injectivity ranges from 25 millidarcy-feet (md-ft) to a maximum of about 1100 md-ft. Open shelf platform carbonates with extensive diagenesis and restricted platform carbonates with shoaling cycle reefs show the higher values of injectivity (>600 md-ft). Reef banks, shelf edge carbonate reefs, and dolomitized restricted platform carbonates are generally characterized by injectivity levels lower than 300 md-ft.
The sandstone projects generally show injectivities higher than 1100 md-ft. Fluvial-dominated deltas, sand-rich strandplains, and proximal delta front depositional systems demonstrate injectivities greater than 9000 md-ft. Wave-dominated deltas and fan deltas have the lowest sandstone injectivity, having values between 1100 to 1800 md-ft. The greater the injectivity the fewer wells will be needed, reducing the cost of sequestration.
Characteristics Controlling the Use of CO2 in Enhanced Oil Recovery
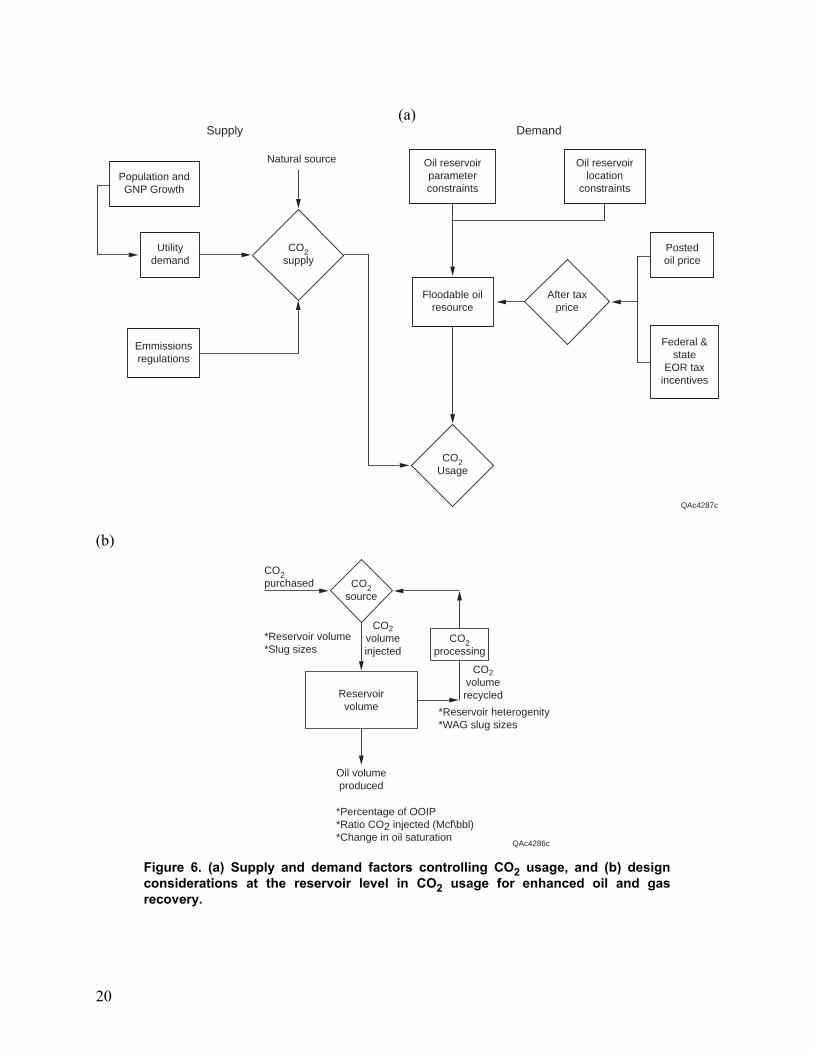
In a broad sense, the supply of and demand for CO2 are functions of a number of variables. Some of these are related to engineering. Others are related to factors and events that occur in the economy at large (fig. 6a). The future supply of CO2 will largely be a function of utility demand and emission regulations. The supply of CO2 can continue to increase with more utility demand and/or stronger regulations regardless of the demand side.
Although these broad factors are important, it is also important to understand how CO2 might actually be used in a CO2 EOR project. A CO2 EOR project is managed by first purchasing CO2 and then injecting it into the reservoir. Next, the CO2 is produced along with oil and hydrocarbon gas. The CO2 is stripped from the hydrocarbon gas so that the gas can be sold and the CO2

19
Table 4. Effective injectivity in Texas oil reservoirs described by depositional system.
Depositional system
G
eometric m
ean perm
eability (md)
Average net pay thickness (ft)
Average permeability-
thickness (md-ft)
Num
ber of sam
ples C
arbonate group
O
pen shelves, platforms, and ram
ps highly fractured 0.4
62.3 25
17 S
ubmarine slope/fan/canyon fill, silty to m
uddy 2.6
29.1 75
19 R
eef bank 2.0
40.0 80
1 S
lope/fan/canyon fill (sandy) 2.0
71.0 142
1 S
helf edge carbonate reef 9.5
24.0 228
1 O
pen shelves, platforms, ram
ps 3.7
65.2 244
17 R
estricted platform, shoaling cycles (dolom
itized) 5.4
48.3 261
139 O
pen shelves, platforms, extensive diag. overprint
13.0 25.0
325 1
Open shelves, platform
s 5.0
75.0 375
1 S
ubmarine slope/fan/canyon fill, sandy
24.4 19.9
486 45
Shelf sands, m
ixed ss & carb
18.4 27.6
508 33
Shelf edge reef system
9.1
60.0 546
1 D
eep water siliceous shales/chert
7.4 74.3
552 25
Tidal deposit
34.9 17.1
594 19
Open shelves, platform
s, ramps, extensive diagenesis
11.4 56.9
651 83
Open shelves, platform
s, ramps, m
ounds/patch reefs 15.6
43.0 670
28 R
estricted platform, shoaling cycles, reefs
46.6 22.6
1,053 7
Sandstone group
Fan delta
47.4 23.1
1,093 20
Restricted platform
, shoaling cycles, extensive dis. 35.1
34.8 1,220
12 U
nconformity related
62.2 22.5
1,399 10
Atolls, pinnacle reefs (sm
all and large) 24.6
63.6 1,568
55 W
ave-dominated delta
56.8 32.2
1,828 6
Shelf edge: reefs, drapes
35.4 55.0
1,945 2
Wave-m
odified delta 168.6
29.1 4,905
44 K
arst overprint 36.1
170.8 6,162
43 B
ack barrier 452.4
17.5 7,933
54 F
luvial dominated delta
422.8 21.4
9,056 127
Barrier shoreface
385.0 26.5
10,196 27
Sand-rich strandplain
496.4 20.7
10,259 9
Proxim
al delta front 319.9
37.1 11,861
68 B
arrier core 808.9
20.6 16,660
106 B
raided stream
2,699.9 44.3
119,694 3
20
(a)Supply
Natural source
Population andGNP Growth
CO2supply
Utilitydemand
Emmissionsregulations
Oil reservoirparameterconstraints
Demand
Oil reservoirlocation
constraints
Postedoil price
After taxprice
Federal &state
EOR taxincentives
Floodable oilresource
CO2Usage
QAc4287c
(b)
*Percentage of OOIP*Ratio CO2 injected (Mcf\bbl)*Change in oil saturation
Oil volumeproduced
Reservoirvolume
CO2volumeinjected
CO2purchased
CO2volumerecycled
*Reservoir heterogenity*WAG slug sizes
*Reservoir volume*Slug sizes
CO2source
CO2processing
QAc4286c Figure 6. (a) Supply and demand factors controlling CO2 usage, and (b) design considerations at the reservoir level in CO2 usage for enhanced oil and gas recovery.
21
reinjected (fig. 6b). The amount of CO2 purchased in this process depends on the reservoir pore volume size, the flood design, and the amount recycled. Thus CO2 usage must be calculated on a project-by-project basis.
Evaluation of Gas Displacement Recovery
The evaluation of gas displacement recovery was conducted developing and analyzing a database of present and past projects. An overview of the strategies was undertaken followed by determining what influenced the implementation of various strategies. Next, both the geologic and engineering characteristics were analyzed followed by an overview of the EOR project economics. By understanding the application of previous and current gas displacement projects the applicability of CO2 recovery from power plant effluent can better be assessed.
Methodology
Data Sources and Project Definition
Five sources were used to collect data on EOR projects in Texas. These sources were (1) selected biannual EOR surveys by the Oil and Gas Journal (Oil and Gas Journal, Biannual EOR Surveys 1976 through 1998); (2) SPE-EOR field reports (SPE-EOR Field Reports, 1982−1992); (3) an EOR sourcebook (Cox and Schubert, 1986); (4) a survey of secondary and enhanced recovery operations in Texas to 1982 (Railroad Commission of Texas, 1984); and (5) a DOE enhanced oil recovery projects data base (Pautz and others, 1992). These sources often had conflicting information concerning the data reported. The authors screened the data, removing outliers and anomalies. A total of 57 projects were determined to be successful. A project was defined by the authors to be economically successful according to four criteria:
1. the technology applied had to fall into the definition of gas displacement recovery, rather than just disposal or pressure maintenance,
2. the application went beyond the pilot stage, to filter out of the database purely test applications
3. a project was confined to the same reservoir, and
4. the same broad process was either applied to the same reservoir or was defined as a separate project to filter out duplicate entries of data from the same project but from a different reporting source.
This process definition allowed screening of the numerous data sources so that a data set free of duplication and inconsistencies could be analyzed.
The distribution of successful start-up projects per year indicates a concentration of successful start-ups in the years from 1981 through 1985 and in the mid-1990s as technology has matured. Forty out of fifty-seven successful gas displacement recovery (GDR) projects were started in the 1981−85 period. This coincides with developments in oil prices, which peaked in 1981 and
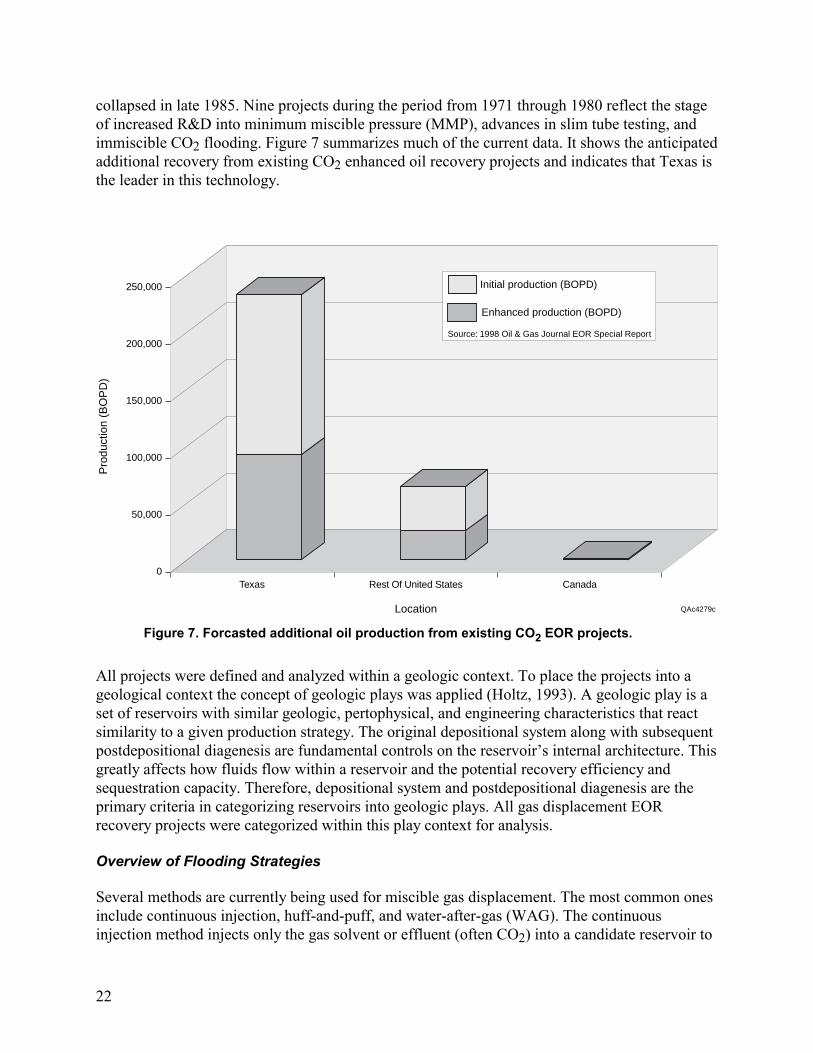
22
collapsed in late 1985. Nine projects during the period from 1971 through 1980 reflect the stage of increased R&D into minimum miscible pressure (MMP), advances in slim tube testing, and immiscible CO2 flooding. Figure 7 summarizes much of the current data. It shows the anticipated additional recovery from existing CO2 enhanced oil recovery projects and indicates that Texas is the leader in this technology.
0
50,000
100,000
150,000
200,000
250,000
Pro
duct
ion
(BO
PD
)
Texas Rest Of United States Canada
Location
Initial production (BOPD)
Enhanced production (BOPD)
Source: 1998 Oil & Gas Journal EOR Special Report
QAc4279c Figure 7. Forcasted additional oil production from existing CO2 EOR projects.
All projects were defined and analyzed within a geologic context. To place the projects into a geological context the concept of geologic plays was applied (Holtz, 1993). A geologic play is a set of reservoirs with similar geologic, pertophysical, and engineering characteristics that react similarity to a given production strategy. The original depositional system along with subsequent postdepositional diagenesis are fundamental controls on the reservoir’s internal architecture. This greatly affects how fluids flow within a reservoir and the potential recovery efficiency and sequestration capacity. Therefore, depositional system and postdepositional diagenesis are the primary criteria in categorizing reservoirs into geologic plays. All gas displacement EOR recovery projects were categorized within this play context for analysis.
Overview of Flooding Strategies
Several methods are currently being used for miscible gas displacement. The most common ones include continuous injection, huff-and-puff, and water-after-gas (WAG). The continuous injection method injects only the gas solvent or effluent (often CO2) into a candidate reservoir to
23
mobilize the residual oil. The injected gas is miscible; it mixes with the oil, giving it more favorable flow characteristics. This method is most successful in reservoirs where geologic heterogeneity is the lowest. The huff-and-puff method utilizes intermittent injections of gas to mobilize the oil. When gas is not being injected, the injector wells are used for production of oil. Water-after-gas alternates slugs of miscible gas and water injection to mobilize the target oil.
Reservoir Controlling Parameters and Flood Design Controls
For this initial screening study, the sources of reservoir data described previously were used to develop a set of characteristics for the target reservoirs located close to the existing fossil-fuel-fired power plants. Then, on the basis of example reservoirs, a prospective set of parameters was developed. These parameters included:
• reservoir heterogeneity
• reservoir hydrocarbon pore volume (HCPV)
• fluid properties
• reservoir temperature and pressure
• flood type
• well pattern
• half-cycle slug size
• half-cycle gas-water ratio
• ultimate slug size
Forecasts of CO2 use in the candidate reservoirs were then developed on the basis of the carbon dioxide requirements of the existing projects in Texas.
Geologic Characteristics of Previous and Current CO2 EOR Projects
To understand the results obtained from existing CO2-based enhanced oil recovery projects, a review of these projects was undertaken. The expectation was that this review would confirm the success/failure rate and help detail a classification system that might be useful in categorizing attractive sequestration project candidates.
Texaco operations at Port Neches are worthy of note. Texaco, as a partner in the Department of Energy’s oil recovery field demonstration program, is combining an enhanced recovery technologyCO2 floodingwith horizontal drilling, in order to boost production from the sandstone oil reservoirs of southeastern Texas.
By injecting CO2 through a horizontal well, operators hope to contact more of the oil left in the reservoir, moving it to production wells. The demonstration site, the Port Neches Field, contains reservoirs that today produce mostly water and very little oil. The target reservoir is the Marginulina sand approximately 6000 ft (1829 m) deep. Two CO2 injection wells were drilled; one was a horizontal well running through nearly 1500 ft (457 m) of the target reservoir. Twelve
24
existing vertical wells will serve as production wells. A 4.5-mi (7.24-km) pipeline will be installed to transport CO2 to the field. Saltwater will be injected into the field to raise reservoir pressures to nearly 3400 lb/in.2 (239 kg/cm2), the point where CO2 miscibility begins to occur. The project began in June 1993 and continued through the end of 1997.
Port Neches belongs to a geologic class called “fluvial-dominated deltaic reservoirs,” which the Department of Energy’s Office of Fossil Energy designated as its first priority in a program to demonstrate improved technologies that can prolong the life of these fields. In the project area, the two production technologies could increase the amount of oil recovered from the target reservoir by nearly 20%. As much as 2.2 MMbbl of crude oil is anticipated to be produced from the Marginulina sand reservoir with these processes compared with the 200,000 bbl that would be expected if only waterflooding continued.
CO2 EOR projects have historically been implemented in reservoirs represented by numerous geologic depositional systems. More than one-third (21 projects) of all projects were located in the restricted to open carbonate platform depositional environment. About 20% (11 projects) were in a fluvial/deltaic depositional environment. Two have been undertaken in karst-modified systems. Five to eight projects have been conducted in other depositional systems. In addition to the Permian Basin, these projects exist in the Gulf Coast and East Texas basins (figs. 8 to 15).
The flooding processes and well patterns were also investigated and summarized for each depositional environment. This impacts both the recovery efficiency of oil and the potential sequestration capacity. In fluvial/deltaic reservoirs, enhanced recovery using CO2 was commonly implemented after primary recovery as a WAG and/or continuous injection with an irregular or peripheral well pattern. Barrier strandplain reservoirs commonly had CO2 recovery mechanisms implemented after primary production with a huff-and-puff process. All submarine fan reservoirs had enhanced recovery implemented after waterflood with a continuous or WAG process with either a five-spot or line-drive well pattern. All restricted to open platform carbonate reservoirs had miscible displacement implemented after waterflood with WAG injection and either an inverted nine-spot or a five-spot well pattern. Projects in reservoirs with reef depositional settings were implemented mainly after waterflood with both WAG and continuous injection in inverted nine-spot, crestal, or peripheral well patterns. Deep-water chert reservoirs were implemented after primary and waterflood normally with continuous injection in inverted nine- or five-spot well patterns. Generally continuous or WAG injection was the dominating injection strategy and the majority of projects (40 projects, representing 70%) were waterflooded before gas displacement recovery was applied.
Engineering Characteristics of Gas Displacement Projects
To augment the geologic categorization of existing GDR projects, engineering characteristics were also examined. Most of the existing gas displacement projects were initiated following waterflooding, with the exception of projects in West Texas deep-water chert reservoirs and in the Gulf Coast deltaic and strandplain sandstone reservoirs. The majority of gas displacement
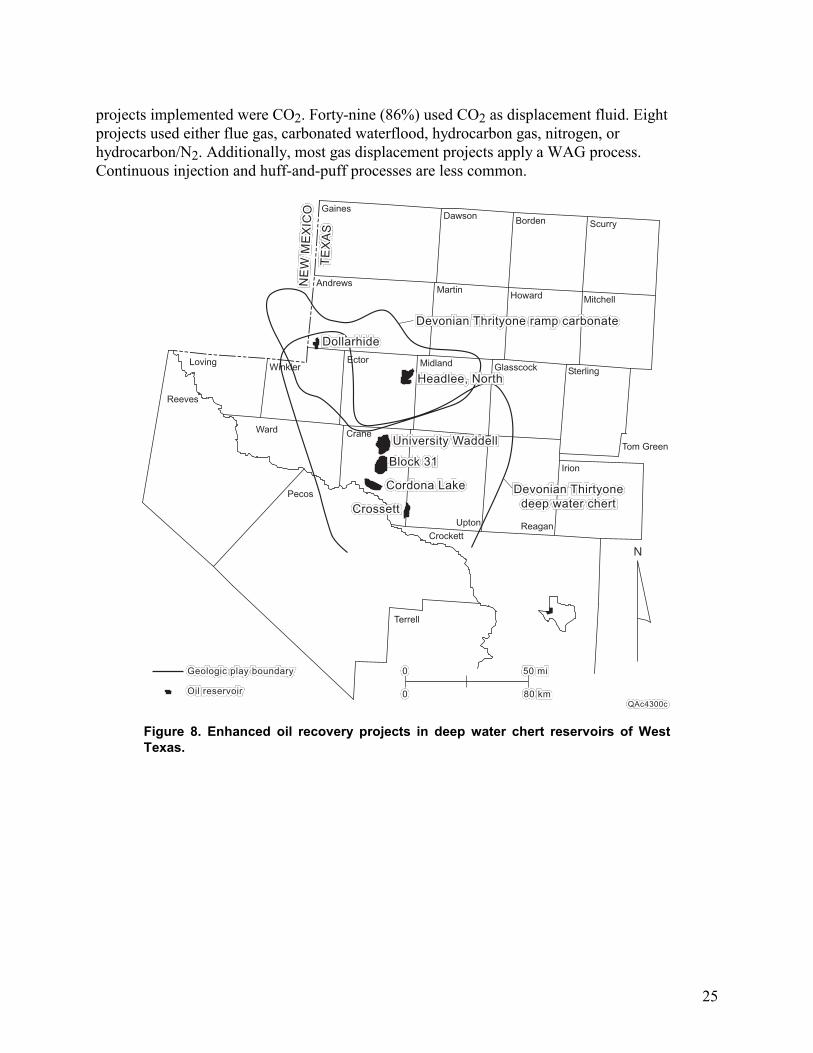
25
projects implemented were CO2. Forty-nine (86%) used CO2 as displacement fluid. Eight projects used either flue gas, carbonated waterflood, hydrocarbon gas, nitrogen, or hydrocarbon/N2. Additionally, most gas displacement projects apply a WAG process. Continuous injection and huff-and-puff processes are less common.
N
Andrews
GainesDawson Borden Scurry
MitchellHowardMartin
Loving
Reeves
WinklerEctor Midland Glasscock Sterling
Tom Green
Irion
CrockettReaganUpton
CraneWard
Pecos
Terrell
50 mi50 mi50 mi000
000 80 km80 km80 kmQAc4300cQAc4300cQAc4300c
Devonian Thrityone ramp carbonateDevonian Thrityone ramp carbonateDevonian Thrityone ramp carbonate
DollarhideDollarhideDollarhide
Headlee, NorthHeadlee, NorthHeadlee, North
University WaddellUniversity WaddellUniversity Waddell
Block 31Block 31Block 31
Cordona LakeCordona LakeCordona Lake
CrossettCrossettCrossett
Devonian ThirtyoneDevonian ThirtyoneDevonian Thirtyonedeep water chertdeep water chertdeep water chert
TE
XA
ST
EX
AS
TE
XA
S
NE
W M
EX
ICO
NE
W M
EX
ICO
NE
W M
EX
ICO
Oil reservoirOil reservoirOil reservoir
Geologic play boundaryGeologic play boundaryGeologic play boundary
Figure 8. Enhanced oil recovery projects in deep water chert reservoirs of West Texas.
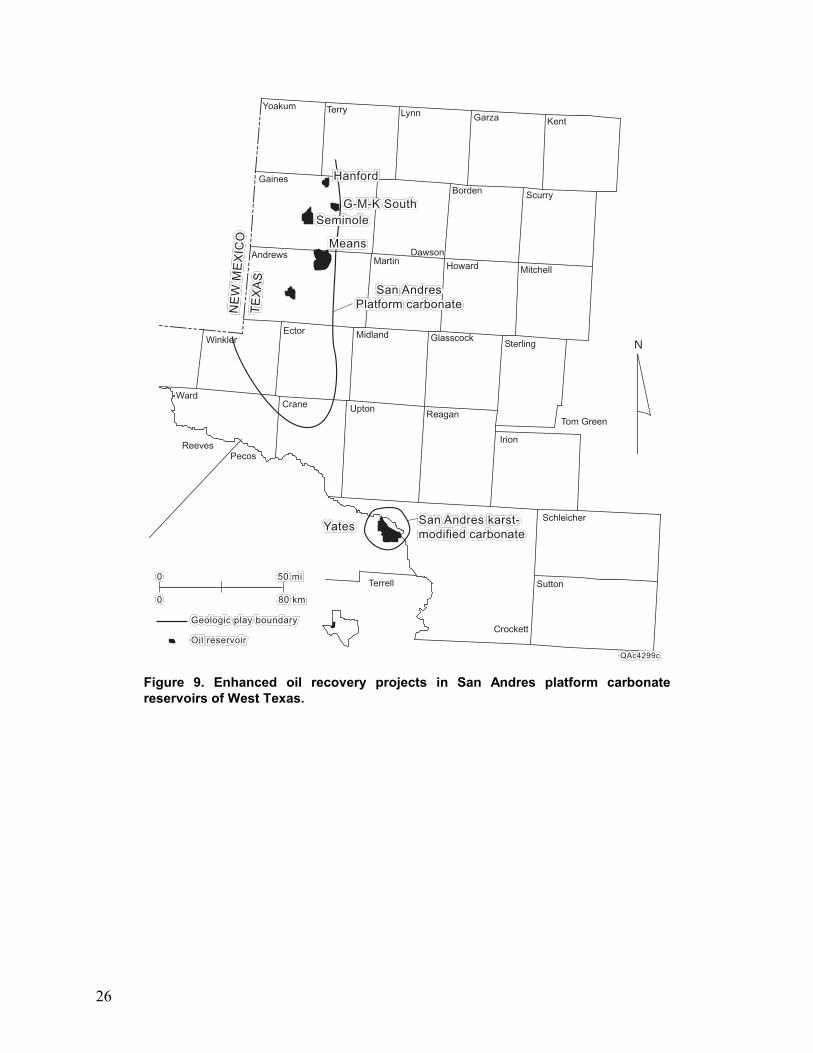
26
N
50 mi50 mi50 mi000
000 80 km80 km80 km
QAc4299cQAc4299cQAc4299c
AndrewsMartin Howard Mitchell
ScurryBorden
Dawson
Gaines
Yoakum Terry Lynn Garza Kent
SterlingGlasscockMidlandEctor
Winkler
WardCrane Upton
Reagan
Irion
Tom Green
Schleicher
Sutton
Crockett
Pecos
Terrell
Reeves
San Andres karst-San Andres karst-San Andres karst-modified carbonatemodified carbonatemodified carbonate
YatesYatesYates
San AndresSan AndresSan AndresPlatform carbonatePlatform carbonatePlatform carbonate
HanfordHanfordHanford
G-M-K SouthG-M-K SouthG-M-K SouthSeminoleSeminoleSeminole
MeansMeansMeansT
EX
AS
TE
XA
ST
EX
AS
NE
W M
EX
ICO
NE
W M
EX
ICO
NE
W M
EX
ICO
Oil reservoirOil reservoirOil reservoir
Geologic play boundaryGeologic play boundaryGeologic play boundary
Figure 9. Enhanced oil recovery projects in San Andres platform carbonate reservoirs of West Texas.
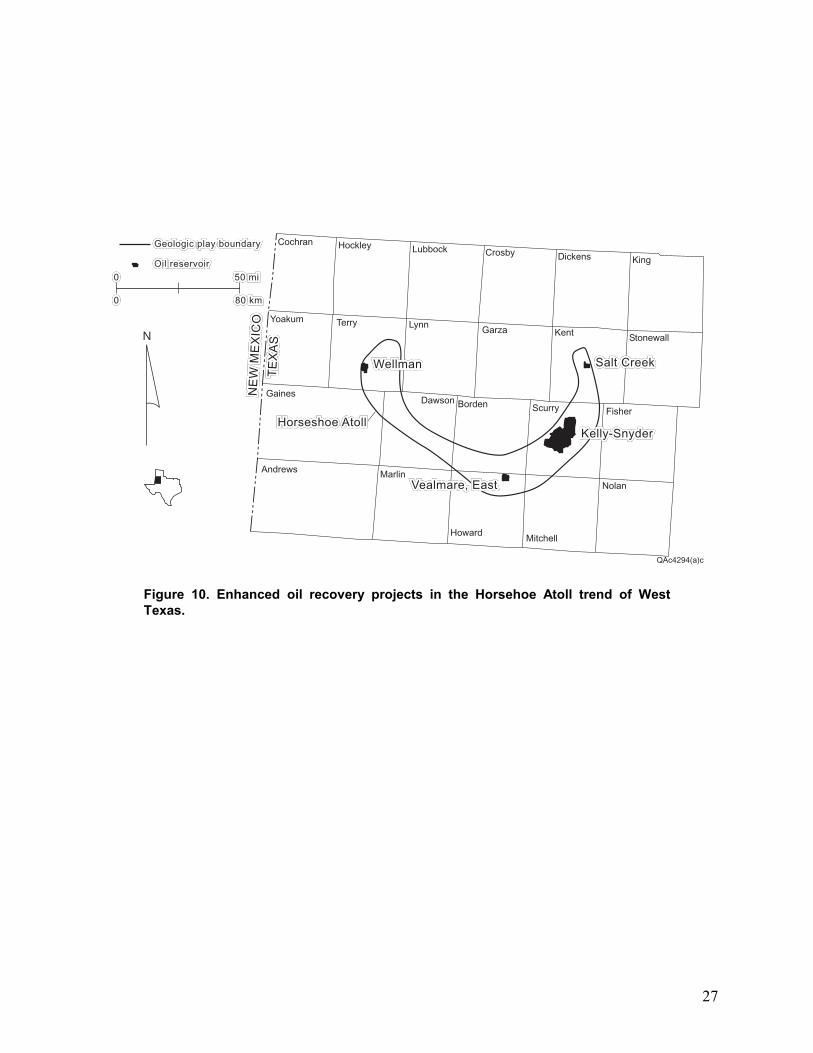
27
N
50 mi50 mi50 mi000
000 80 km80 km80 km
Salt CreekSalt CreekSalt Creek
Kelly-SnyderKelly-SnyderKelly-Snyder
Vealmare, EastVealmare, EastVealmare, East
WellmanWellmanWellman
Horseshoe AtollHorseshoe AtollHorseshoe Atoll
TE
XA
ST
EX
AS
TE
XA
S
NE
W M
EX
ICO
NE
W M
EX
ICO
NE
W M
EX
ICO
Oil reservoirOil reservoirOil reservoir
Geologic play boundaryGeologic play boundaryGeologic play boundary
Andrews
Gaines
Yoakum
Cochran Hockley Lubbock Crosby Dickens King
StonewallKentGarza
Paluxy fault line sandstonePaluxy fault line sandstoneLynnTerry
Dawson Borden Scurry Fisher
Nolan
MitchellHoward
Marlin
QAc4294(a)c
Figure 10. Enhanced oil recovery projects in the Horsehoe Atoll trend of West Texas.
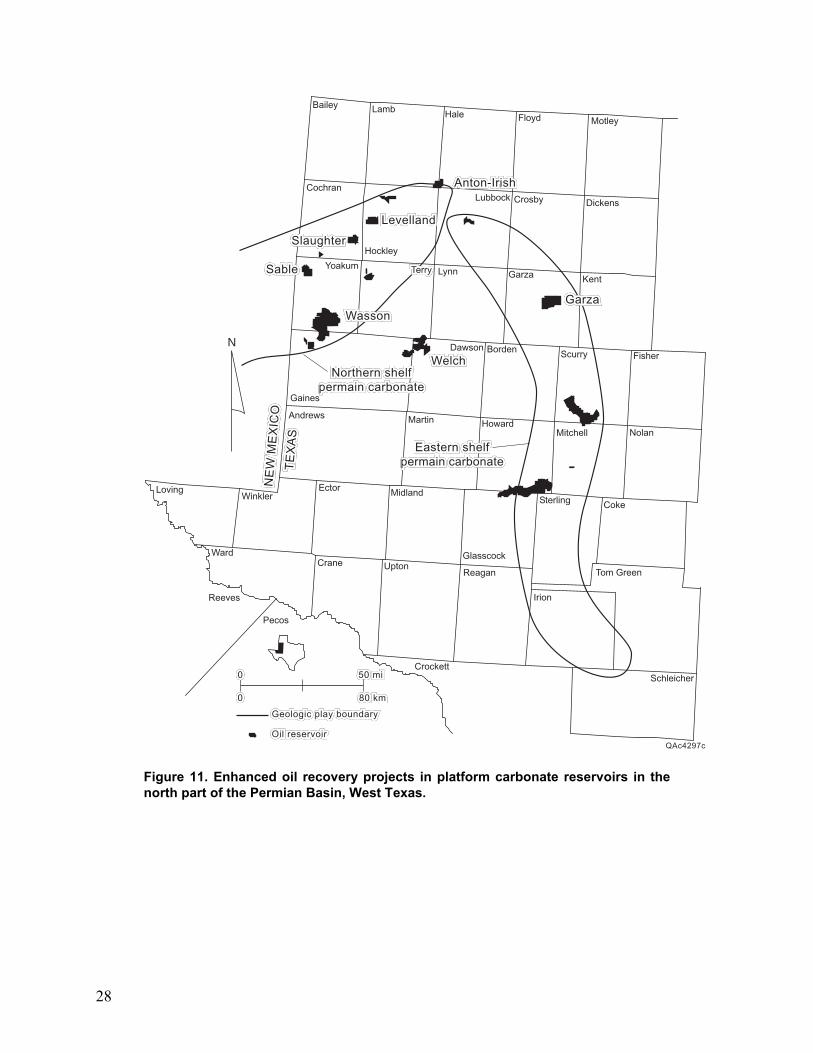
28
N
50 mi50 mi50 mi000
000 80 km80 km80 km
QAc4297c
Andrews
Gaines
Yoakum
Cochran
Bailey Lamb Hale Floyd Motley
DickensCrosbyLubbock
Hockley
TerryTerryTerry Lynn Garza Kent
Dawson Borden Scurry Fisher
NolanMitchellHowardMartin
WinklerLoving Ector Midland
Glasscock
Sterling Coke
Tom Green
Irion
ReaganUptonCrane
Ward
Reeves
Pecos
CrockettSchleicher
Northern shelfNorthern shelfNorthern shelfpermain carbonatepermain carbonatepermain carbonate
Anton-IrishAnton-IrishAnton-Irish
LevellandLevellandLevelland
SlaughterSlaughterSlaughter
SableSableSable
WassonWassonWassonGarzaGarzaGarza
Eastern shelfEastern shelfEastern shelfpermain carbonatepermain carbonatepermain carbonate
WelchWelchWelch
TE
XA
ST
EX
AS
TE
XA
S
NE
W M
EX
ICO
NE
W M
EX
ICO
NE
W M
EX
ICO
Oil reservoirOil reservoirOil reservoir
Geologic play boundaryGeologic play boundaryGeologic play boundary
Figure 11. Enhanced oil recovery projects in platform carbonate reservoirs in the north part of the Permian Basin, West Texas.
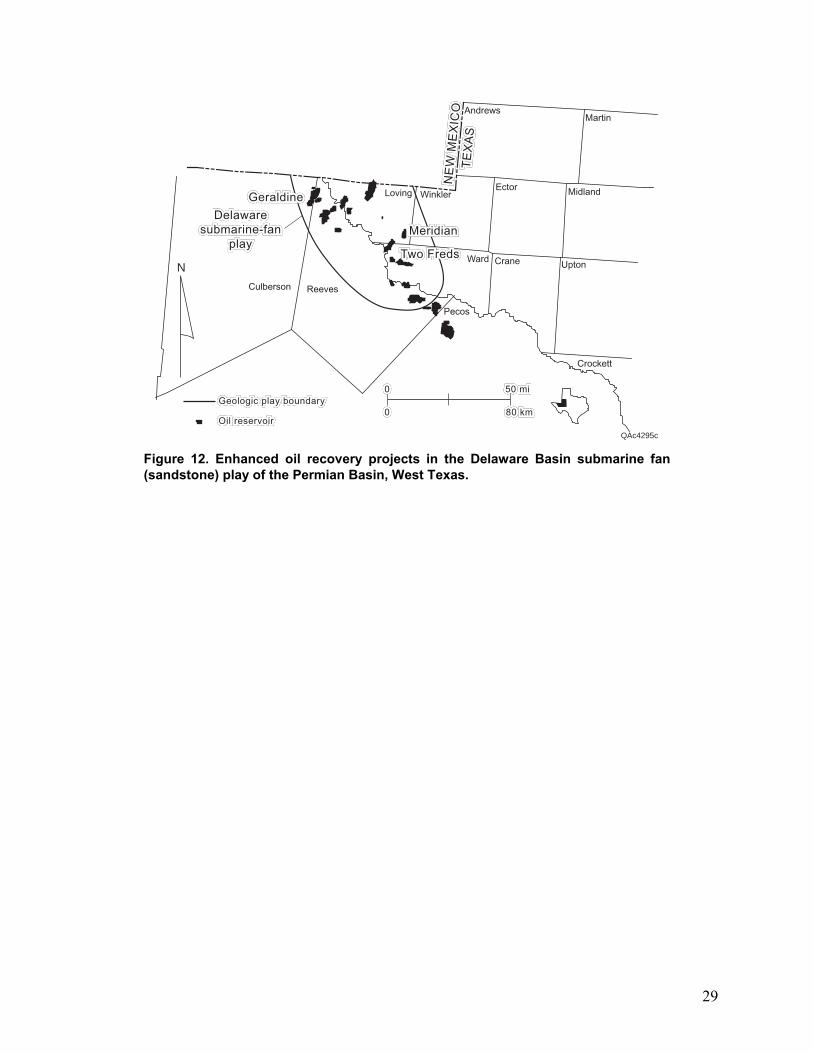
29
QAc4295c
N
50 mi50 mi50 mi000
000 80 km80 km80 km
AndrewsMartin
MidlandEctorWinklerLoving
ReevesCulberson
Ward Crane Upton
Crockett
Pecos
GeraldineGeraldineGeraldine
MeridianMeridianMeridian
Two FredsTwo FredsTwo Freds
NE
W M
EX
ICO
NE
W M
EX
ICO
NE
W M
EX
ICO
TE
XA
ST
EX
AS
TE
XA
S
DelawareDelawareDelawaresubmarine-fansubmarine-fansubmarine-fan
playplayplay
Oil reservoirOil reservoirOil reservoir
Geologic play boundaryGeologic play boundaryGeologic play boundary
Figure 12. Enhanced oil recovery projects in the Delaware Basin submarine fan (sandstone) play of the Permian Basin, West Texas.
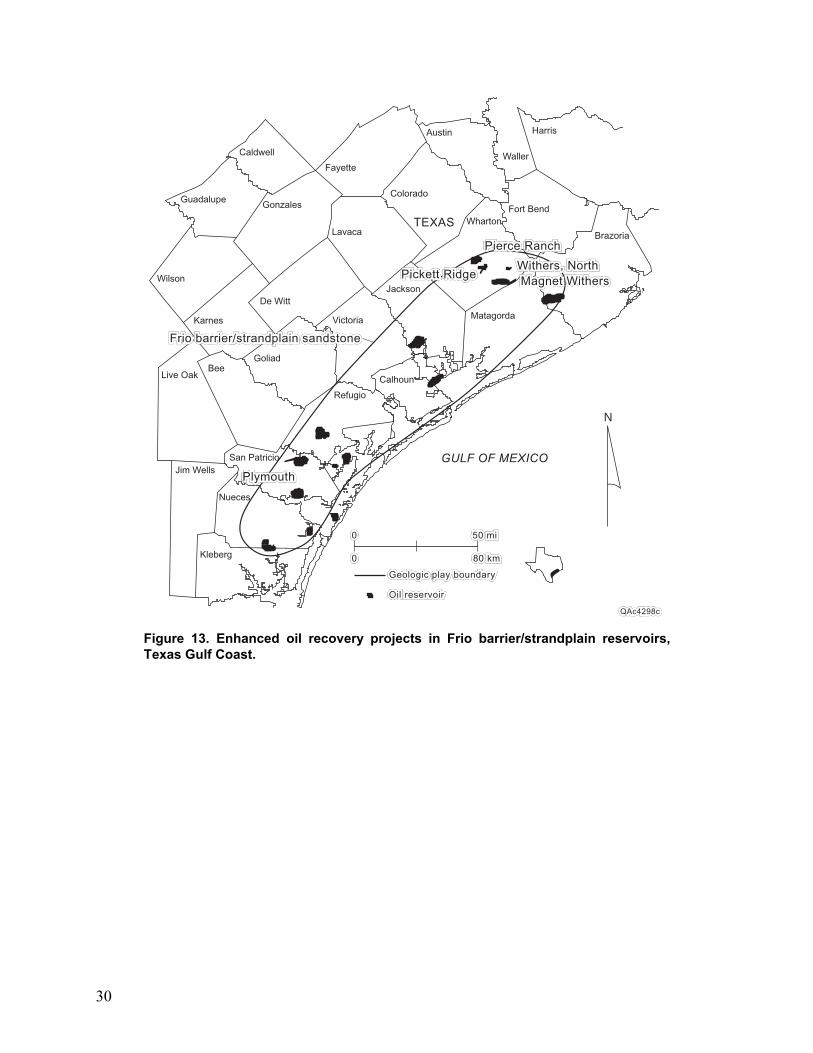
30
N
50 mi50 mi50 mi000
000 80 km80 km80 km
QAc4298cQAc4298cQAc4298c
Brazoria
Matagorda
Fort BendWharton
Jackson
Victoria
Calhoun
Refugio
GoliadBee
San Patricio
Nueces
Kleberg
Jim Wells
Live Oak
Karnes
Wilson
Guadalupe
Caldwell
Gonzales
De Witt
Lavaca
Colorado
Fayette
Austin
Waller
Harris
TEXAS
GULF OF MEXICO
PlymouthPlymouthPlymouth
Pickett RidgePickett RidgePickett Ridge
Pierce RanchPierce RanchPierce Ranch
Withers, NorthWithers, NorthWithers, NorthMagnet WithersMagnet WithersMagnet Withers
Frio barrier/strandplain sandstoneFrio barrier/strandplain sandstoneFrio barrier/strandplain sandstone
Oil reservoirOil reservoirOil reservoir
Geologic play boundaryGeologic play boundaryGeologic play boundary
Figure 13. Enhanced oil recovery projects in Frio barrier/strandplain reservoirs, Texas Gulf Coast.
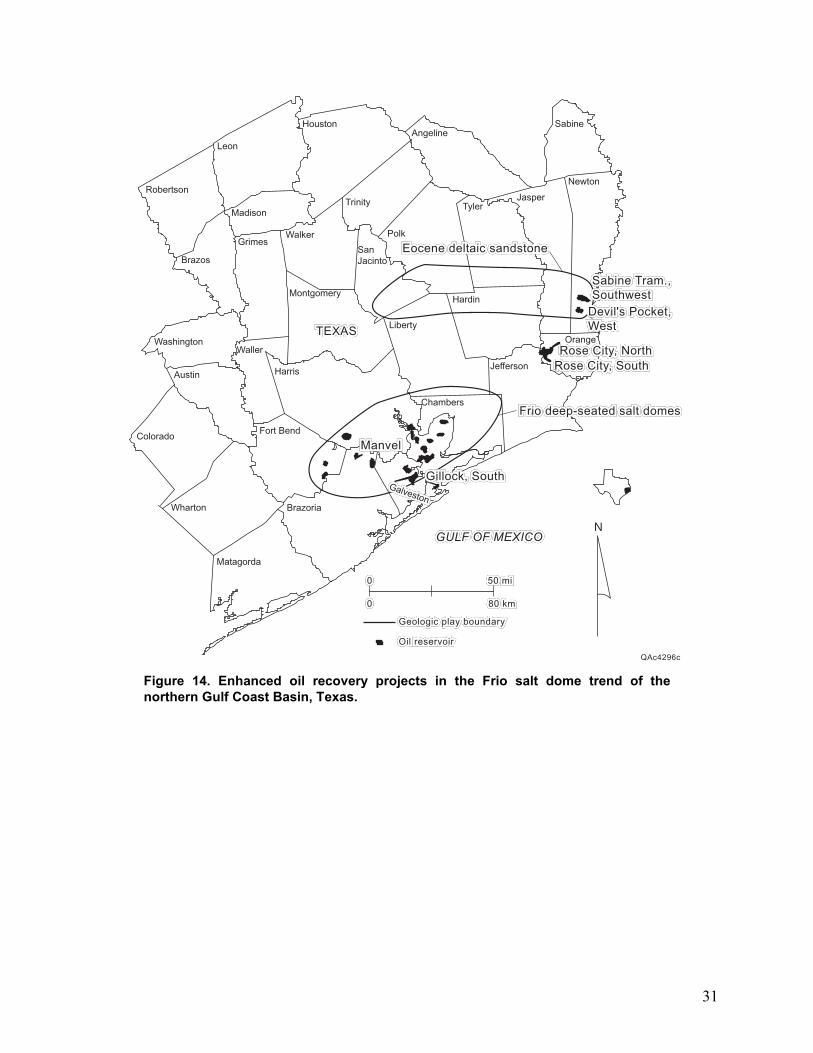
31
50 mi50 mi50 mi000
000 80 km80 km80 km
QAc4296c
Jefferson
Orange
Hardin
Liberty
Chambers
GalvestonGalvestonGalveston
Brazoria
Matagorda
Wharton
Colorado
Austin
WashingtonWaller
Harris
Grimes
Montgomery
Brazos
Robertson
Leon
Houston
Trinity
Walker
Madison
SanJacinto
Polk
Jasper
Newton
SabineAngeline
Fort Bend
Tyler
Rose City, SouthRose City, SouthRose City, SouthRose City, NorthRose City, NorthRose City, North
Devil's Pocket,Devil's Pocket,Devil's Pocket,WestWestWest
Sabine Tram.,Sabine Tram.,Sabine Tram.,SouthwestSouthwestSouthwest
ManvelManvelManvel
Gillock, SouthGillock, SouthGillock, South
TEXASTEXASTEXAS
GULF OF MEXICOGULF OF MEXICOGULF OF MEXICON
Eocene deltaic sandstoneEocene deltaic sandstoneEocene deltaic sandstone
Frio deep-seated salt domesFrio deep-seated salt domesFrio deep-seated salt domes
Oil reservoirOil reservoirOil reservoir
Geologic play boundaryGeologic play boundaryGeologic play boundary
Figure 14. Enhanced oil recovery projects in the Frio salt dome trend of the northern Gulf Coast Basin, Texas.
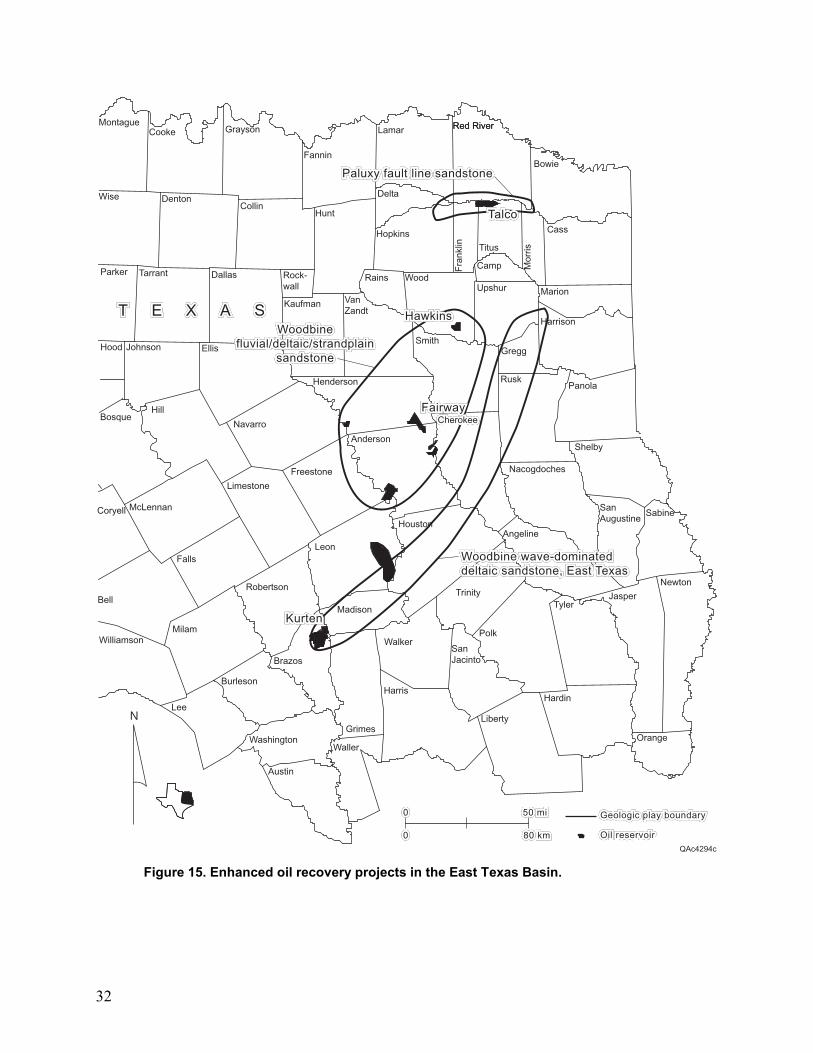
32
QAc4294c
N
50 mi50 mi50 mi000
000 80 km80 km80 km
Bowie
Red RiverLamar
Fannin
GraysonCookeMontague
Wise DentonCollin
Hunt
Delta
Hopkins
Fra
nklin Titus
Mor
ris
Cass
Marion
Camp
UpshurWoodRainsRock-
wallDallasTarrantParker
Hood Johnson Ellis
Kaufman VanZandt
SmithGregg
Harrison
PanolaRusk
CherokeeCherokeeCherokee
Anderson
Henderson
Navarro
HillBosque
Coryell McLennan
Limestone
Freestone
Shelby
Nacogdoches
Houston
Leon
Robertson
MilamWilliamson
Bell
Falls
SabineSanAugustine
Angeline
Trinity
Polk
TylerJasper
Newton
Orange
Hardin
Liberty
Harris
SanJacinto
Walker
Madison
Grimes
Brazos
Burleson
Lee
Washington
Austin
Waller
Red River
TalcoTalcoTalco
WoodbineWoodbineWoodbinefluvial/deltaic/strandplainfluvial/deltaic/strandplainfluvial/deltaic/strandplain
sandstonesandstonesandstone
HawkinsHawkinsHawkins
FairwayFairwayFairway
KurtenKurtenKurten
Woodbine wave-dominatedWoodbine wave-dominatedWoodbine wave-dominateddeltaic sandstone, East Texasdeltaic sandstone, East Texasdeltaic sandstone, East Texas
T E X A ST E X A ST E X A S
Paluxy fault line sandstonePaluxy fault line sandstonePaluxy fault line sandstone
Oil reservoirOil reservoirOil reservoir
Geologic play boundaryGeologic play boundaryGeologic play boundary
Figure 15. Enhanced oil recovery projects in the East Texas Basin.

33
The outcomes of existing projects have demonstrated that the characteristics of the injected solvent (CO2 effluent) are critical for success. Typically, injected gas compositions have ranged from 97 to 99% purity. Other characteristics that may impact oil recovery and sequestration capability include liquid content of the subsurface effluent (since this can lead to the formation of acids, which could impact the integrity of the reservoir seals); the mix of water and CO2 used to increase sweep efficiency (which can lead to early breakthrough of the effluent, reduced recoveries, and greater need for corrosion-resistant metallurgy, such as stainless steel subsurface components); the presence of particulates (since this can affect injectivity and near-well-bore integrity); and the presence of sulfur compounds (which can create both injectivity and integrity issues).
Petrophysical Properties
A review of the petrophysical properties of existing gas displacement projects was undertaken as part of the engineering assessment. Average porosity characteristics of sandstone reservoirs in fluvial/deltaic systems range from low to upper mid-range (10 to 30%), with a higher frequency on the lower end of the range (fig. 16). Barrier strandplain systems show a porosity distribution from 20 to 35%, with a higher frequency between 25 and 30%. Submarine fans also cover the 20 to 35% range but are centered more on both ends.
Average porosity for carbonate GDR reservoirs is low (fig. 17). Porosity ranges from 5 to 20%. The largest group is represented by open to restricted platform, ranging from 5 to 20%, with a distinct concentration at the 10% level. Reefs concentrate at the 5 to 10% level. Deep-water chert reservoirs are evenly distributed over a 5 to 20% porosity range, while karst is represented at the 5 to 20% interval.
Another important characteristic governing enhanced oil recovery and CO2 sequestration capability in sandstone reservoirs is initial water saturation. This parameter ranges from 10 to 45% (fig. 18). Fluvial/deltaic systems are represented over the entire range, with a concentration in the 25 to 45% range. The submarine fan system category ranges from 20 to 40%, with a concentration in the upper half of that range. The barrier strandplain systems are concentrated in the 25 to 35% range.
Initial water saturation for carbonate gas displacement projects ranged from 15 to 40% (fig. 19). The restricted to open platform system was spread over the entire range, with a clear concentration in the 15 to 25% range. Reefs are concentrated in the 15 to 25% range. The karst-modified system is represented at the 25 to 40% level. Deep-water cherts are represented from the 20 to 40% range, with a concentration at the higher end.
Another important characteristic governing enhanced oil recovery and CO2 sequestration capability in sandstone reservoirs is average residual oil saturation. Average residual oil saturation values for sandstones range from 15 to 55% (fig. 20). Fluvial/deltaic systems are represented over the entire range, with a concentration at the 25 to 30% range. Barrier strandplain projects are relatively evenly distributed between 15 and 35%. Submarine fan projects are represented at the 35% level.
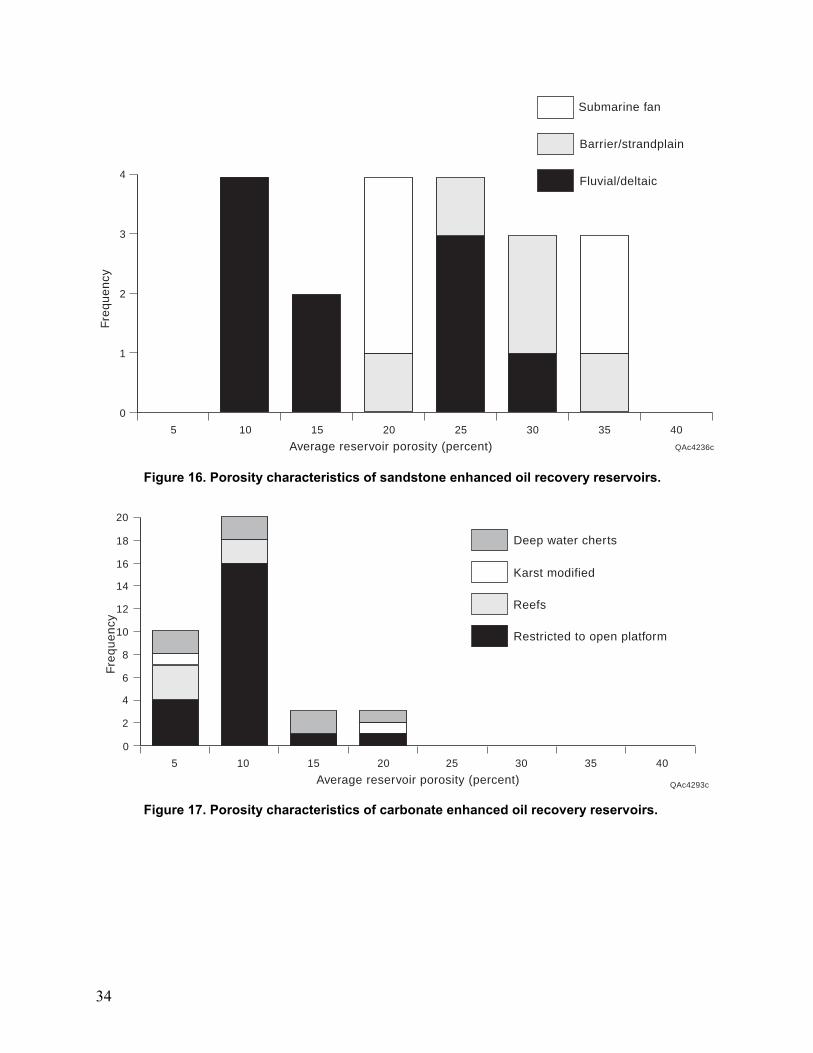
34
0
1
2
3
4
Fre
qu
en
cy
5 10 15 20 25 30 35 40
Average reservoir porosity (percent)
Submarine fan
Barrier/strandplain
Fluvial/deltaic
QAc4236c Figure 16. Porosity characteristics of sandstone enhanced oil recovery reservoirs.
QAc4293c
Restricted to open platform
Reefs
Karst modified
Deep water cherts
0
2
20
Fre
qu
en
cy
10 15 20 25 30 35 40
Average reservoir porosity (percent)
4
6
8
10
12
14
16
18
5
Figure 17. Porosity characteristics of carbonate enhanced oil recovery reservoirs.

35
Submarine fan
Barrier/strandplain
Fluvial/deltaic
QAc4238c
0
1
2
3
4F
req
ue
ncy
10 15 20 25 30 35 40
Average reservoir initial water saturation (percent)45
Figure 18. Initial water saturation characteristics for sandstone enhanced oil recovery reservoirs.
QAc4239c
0
1
2
3
11
Fre
qu
en
cy
10 15 20 25 30 35 40
Average reservoir initial water saturation (percent)45
4
5
6
7
8
9
10
Restricted to open platform
Reefs
Karst modified
Deep water cherts
Figure 19. Initial water saturation characteristics for carbonate enhanced oil recovery reservoirs.
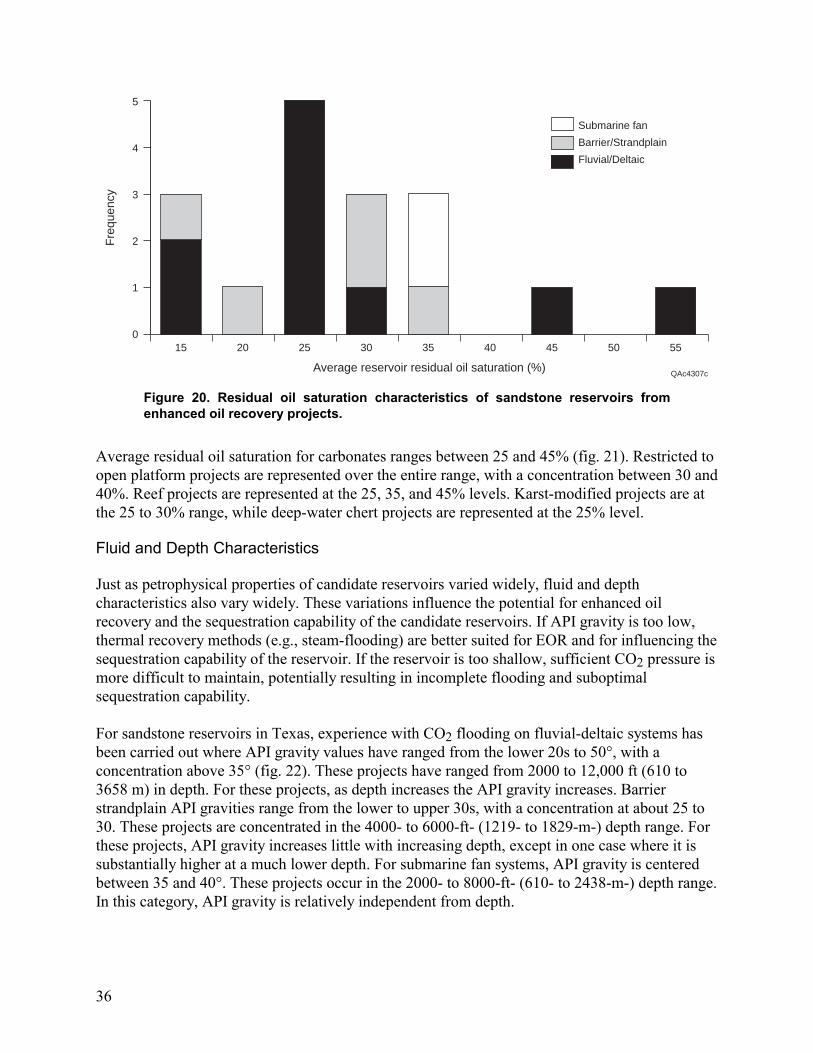
36
Fre
quen
cy
Average reservoir residual oil saturation (%)
15 20 25 30 35 40 45 50 550
1
2
3
4
5
Submarine fan
Barrier/Strandplain
Fluvial/Deltaic
QAc4307c Figure 20. Residual oil saturation characteristics of sandstone reservoirs from enhanced oil recovery projects.
Average residual oil saturation for carbonates ranges between 25 and 45% (fig. 21). Restricted to open platform projects are represented over the entire range, with a concentration between 30 and 40%. Reef projects are represented at the 25, 35, and 45% levels. Karst-modified projects are at the 25 to 30% range, while deep-water chert projects are represented at the 25% level.
Fluid and Depth Characteristics
Just as petrophysical properties of candidate reservoirs varied widely, fluid and depth characteristics also vary widely. These variations influence the potential for enhanced oil recovery and the sequestration capability of the candidate reservoirs. If API gravity is too low, thermal recovery methods (e.g., steam-flooding) are better suited for EOR and for influencing the sequestration capability of the reservoir. If the reservoir is too shallow, sufficient CO2 pressure is more difficult to maintain, potentially resulting in incomplete flooding and suboptimal sequestration capability.
For sandstone reservoirs in Texas, experience with CO2 flooding on fluvial-deltaic systems has been carried out where API gravity values have ranged from the lower 20s to 50°, with a concentration above 35° (fig. 22). These projects have ranged from 2000 to 12,000 ft (610 to 3658 m) in depth. For these projects, as depth increases the API gravity increases. Barrier strandplain API gravities range from the lower to upper 30s, with a concentration at about 25 to 30. These projects are concentrated in the 4000- to 6000-ft- (1219- to 1829-m-) depth range. For these projects, API gravity increases little with increasing depth, except in one case where it is substantially higher at a much lower depth. For submarine fan systems, API gravity is centered between 35 and 40°. These projects occur in the 2000- to 8000-ft- (610- to 2438-m-) depth range. In this category, API gravity is relatively independent from depth.
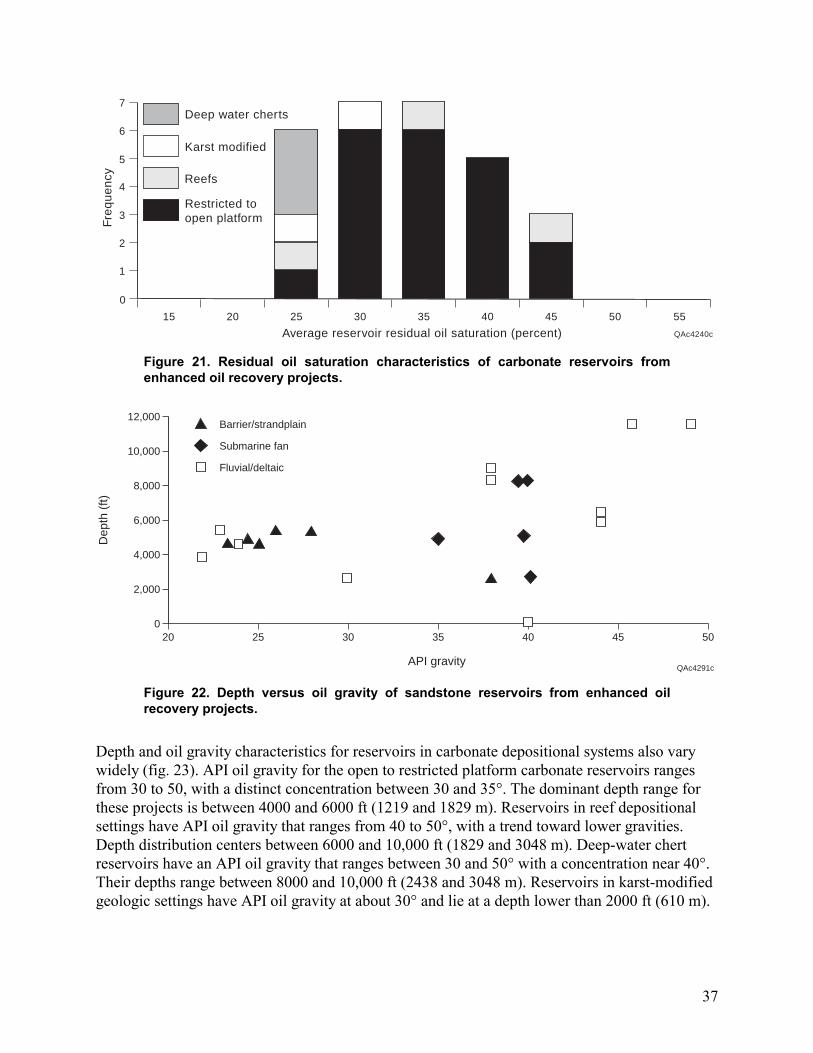
37
Restricted toopen platform
Reefs
Karst modified
Deep water cherts
QAc4240c
0
1
2
3
Fre
qu
en
cy
15 20 25 30 35 40
Average reservoir residual oil saturation (percent)45
4
5
6
7
50 55
Figure 21. Residual oil saturation characteristics of carbonate reservoirs from enhanced oil recovery projects.
Dep
th (
ft)
API gravity
20 25 30 35 40 45 50
12,000
10,000
8,000
6,000
4,000
2,000
0
QAc4291c
Barrier/strandplain
Submarine fan
Fluvial/deltaic
Figure 22. Depth versus oil gravity of sandstone reservoirs from enhanced oil recovery projects.
Depth and oil gravity characteristics for reservoirs in carbonate depositional systems also vary widely (fig. 23). API oil gravity for the open to restricted platform carbonate reservoirs ranges from 30 to 50, with a distinct concentration between 30 and 35°. The dominant depth range for these projects is between 4000 and 6000 ft (1219 and 1829 m). Reservoirs in reef depositional settings have API oil gravity that ranges from 40 to 50°, with a trend toward lower gravities. Depth distribution centers between 6000 and 10,000 ft (1829 and 3048 m). Deep-water chert reservoirs have an API oil gravity that ranges between 30 and 50° with a concentration near 40°. Their depths range between 8000 and 10,000 ft (2438 and 3048 m). Reservoirs in karst-modified geologic settings have API oil gravity at about 30° and lie at a depth lower than 2000 ft (610 m).
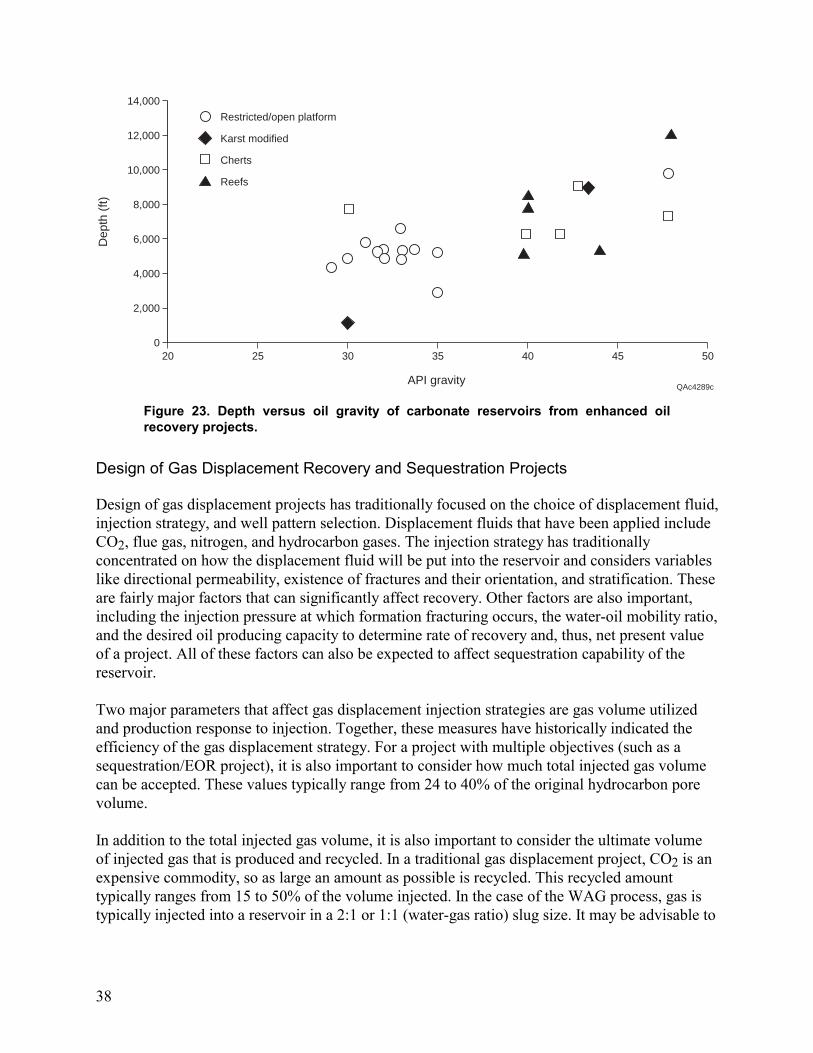
38
Dep
th (
ft)
API gravity
20 25 30 35 40 45 50
14,000
12,000
10,000
8,000
6,000
4,000
2,000
0
Restricted/open platform
Karst modified
Cherts
Reefs
QAc4289c Figure 23. Depth versus oil gravity of carbonate reservoirs from enhanced oil recovery projects.
Design of Gas Displacement Recovery and Sequestration Projects
Design of gas displacement projects has traditionally focused on the choice of displacement fluid, injection strategy, and well pattern selection. Displacement fluids that have been applied include CO2, flue gas, nitrogen, and hydrocarbon gases. The injection strategy has traditionally concentrated on how the displacement fluid will be put into the reservoir and considers variables like directional permeability, existence of fractures and their orientation, and stratification. These are fairly major factors that can significantly affect recovery. Other factors are also important, including the injection pressure at which formation fracturing occurs, the water-oil mobility ratio, and the desired oil producing capacity to determine rate of recovery and, thus, net present value of a project. All of these factors can also be expected to affect sequestration capability of the reservoir.
Two major parameters that affect gas displacement injection strategies are gas volume utilized and production response to injection. Together, these measures have historically indicated the efficiency of the gas displacement strategy. For a project with multiple objectives (such as a sequestration/EOR project), it is also important to consider how much total injected gas volume can be accepted. These values typically range from 24 to 40% of the original hydrocarbon pore volume.
In addition to the total injected gas volume, it is also important to consider the ultimate volume of injected gas that is produced and recycled. In a traditional gas displacement project, CO2 is an expensive commodity, so as large an amount as possible is recycled. This recycled amount typically ranges from 15 to 50% of the volume injected. In the case of the WAG process, gas is typically injected into a reservoir in a 2:1 or 1:1 (water-gas ratio) slug size. It may be advisable to
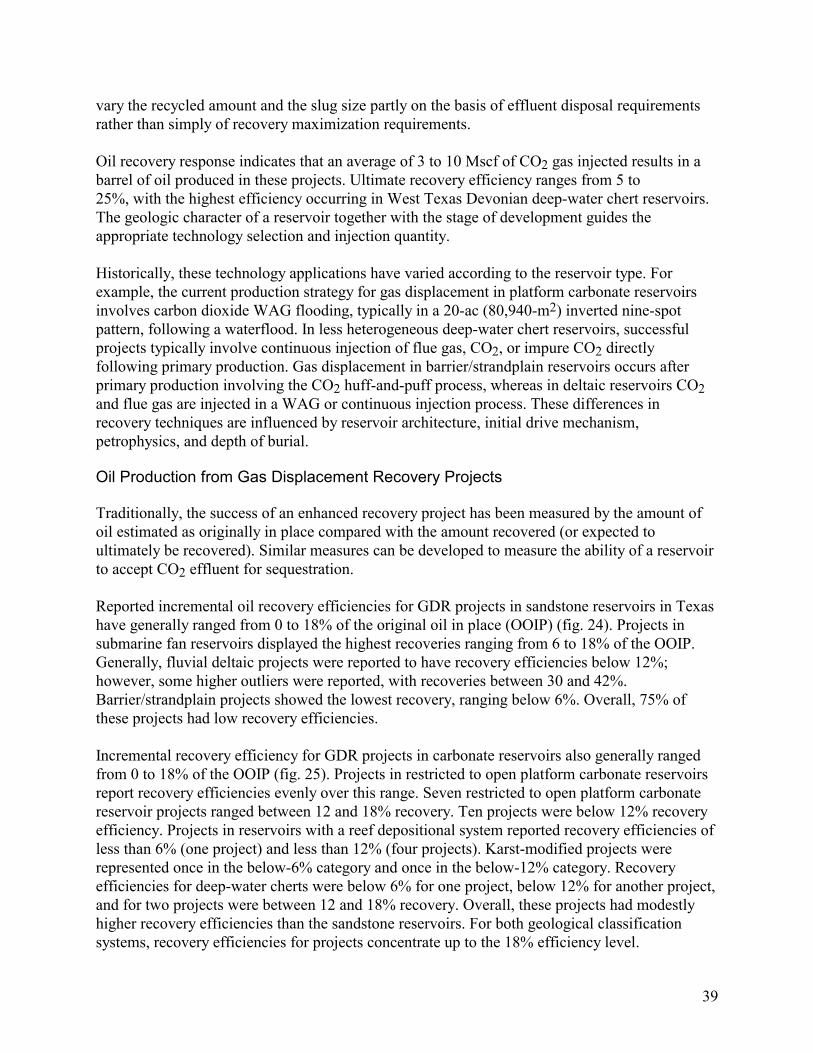
39
vary the recycled amount and the slug size partly on the basis of effluent disposal requirements rather than simply of recovery maximization requirements.
Oil recovery response indicates that an average of 3 to 10 Mscf of CO2 gas injected results in a barrel of oil produced in these projects. Ultimate recovery efficiency ranges from 5 to 25%, with the highest efficiency occurring in West Texas Devonian deep-water chert reservoirs. The geologic character of a reservoir together with the stage of development guides the appropriate technology selection and injection quantity.
Historically, these technology applications have varied according to the reservoir type. For example, the current production strategy for gas displacement in platform carbonate reservoirs involves carbon dioxide WAG flooding, typically in a 20-ac (80,940-m2) inverted nine-spot pattern, following a waterflood. In less heterogeneous deep-water chert reservoirs, successful projects typically involve continuous injection of flue gas, CO2, or impure CO2 directly following primary production. Gas displacement in barrier/strandplain reservoirs occurs after primary production involving the CO2 huff-and-puff process, whereas in deltaic reservoirs CO2 and flue gas are injected in a WAG or continuous injection process. These differences in recovery techniques are influenced by reservoir architecture, initial drive mechanism, petrophysics, and depth of burial.
Oil Production from Gas Displacement Recovery Projects
Traditionally, the success of an enhanced recovery project has been measured by the amount of oil estimated as originally in place compared with the amount recovered (or expected to ultimately be recovered). Similar measures can be developed to measure the ability of a reservoir to accept CO2 effluent for sequestration.
Reported incremental oil recovery efficiencies for GDR projects in sandstone reservoirs in Texas have generally ranged from 0 to 18% of the original oil in place (OOIP) (fig. 24). Projects in submarine fan reservoirs displayed the highest recoveries ranging from 6 to 18% of the OOIP. Generally, fluvial deltaic projects were reported to have recovery efficiencies below 12%; however, some higher outliers were reported, with recoveries between 30 and 42%. Barrier/strandplain projects showed the lowest recovery, ranging below 6%. Overall, 75% of these projects had low recovery efficiencies.
Incremental recovery efficiency for GDR projects in carbonate reservoirs also generally ranged from 0 to 18% of the OOIP (fig. 25). Projects in restricted to open platform carbonate reservoirs report recovery efficiencies evenly over this range. Seven restricted to open platform carbonate reservoir projects ranged between 12 and 18% recovery. Ten projects were below 12% recovery efficiency. Projects in reservoirs with a reef depositional system reported recovery efficiencies of less than 6% (one project) and less than 12% (four projects). Karst-modified projects were represented once in the below-6% category and once in the below-12% category. Recovery efficiencies for deep-water cherts were below 6% for one project, below 12% for another project, and for two projects were between 12 and 18% recovery. Overall, these projects had modestly higher recovery efficiencies than the sandstone reservoirs. For both geological classification systems, recovery efficiencies for projects concentrate up to the 18% efficiency level.
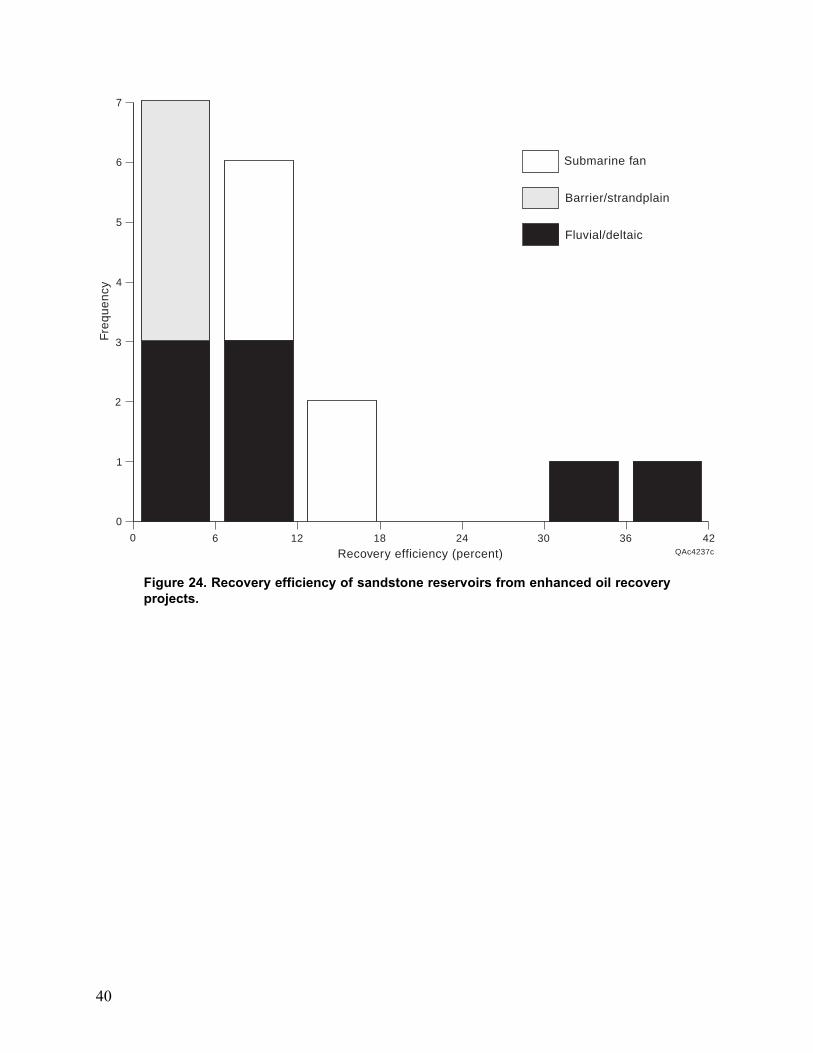
40
Submarine fan
Barrier/strandplain
Fluvial/deltaic
QAc4237c
0
2
3
4
Fre
qu
en
cy
0 6 12 18 24 30 36 42
Recovery efficiency (percent)
1
5
6
7
Figure 24. Recovery efficiency of sandstone reservoirs from enhanced oil recovery projects.
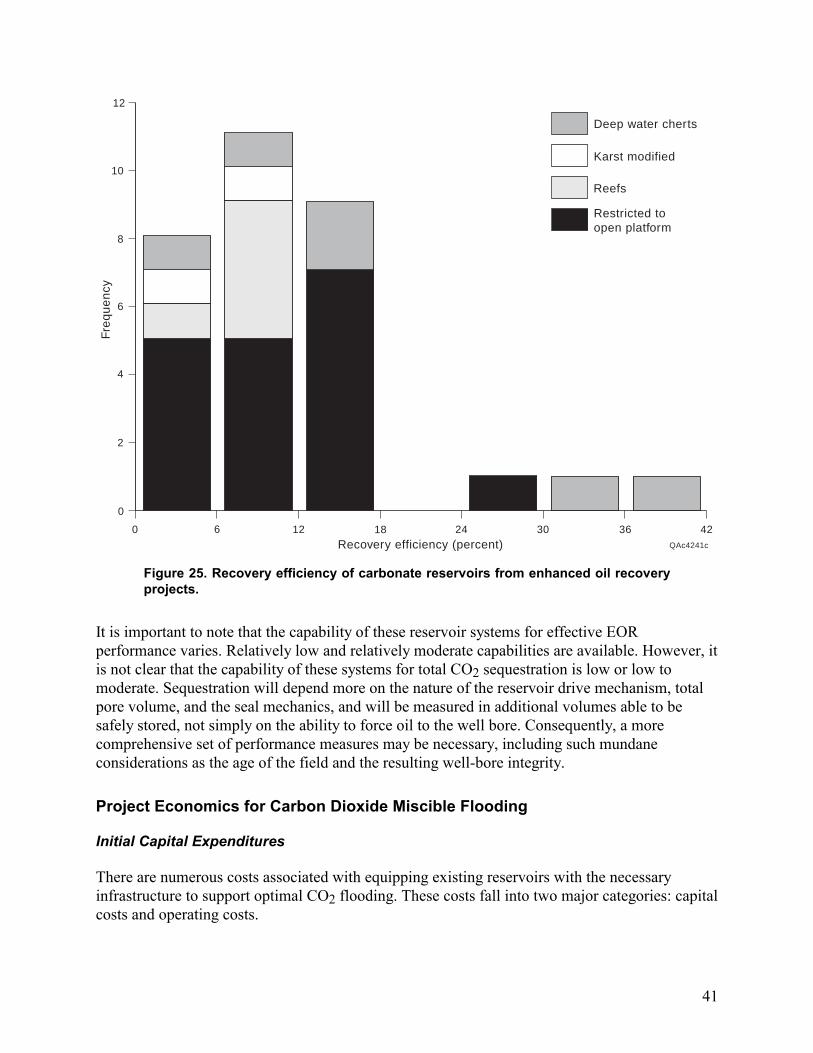
41
Restricted toopen platform
Reefs
Karst modified
Deep water cherts
QAc4241c
0
2
Fre
qu
en
cy
0 6 12 18 24
Recovery efficiency (percent)30
4
6
8
36 42
10
12
Figure 25. Recovery efficiency of carbonate reservoirs from enhanced oil recovery projects.
It is important to note that the capability of these reservoir systems for effective EOR performance varies. Relatively low and relatively moderate capabilities are available. However, it is not clear that the capability of these systems for total CO2 sequestration is low or low to moderate. Sequestration will depend more on the nature of the reservoir drive mechanism, total pore volume, and the seal mechanics, and will be measured in additional volumes able to be safely stored, not simply on the ability to force oil to the well bore. Consequently, a more comprehensive set of performance measures may be necessary, including such mundane considerations as the age of the field and the resulting well-bore integrity.
Project Economics for Carbon Dioxide Miscible Flooding
Initial Capital Expenditures
There are numerous costs associated with equipping existing reservoirs with the necessary infrastructure to support optimal CO2 flooding. These costs fall into two major categories: capital costs and operating costs.
42
Generally, the largest single operating cost for an existing EOR field operator is the initial cost of CO2, as well as the cost of recirculating CO2 at the reservoir. Other major capital costs include (but are not limited to) the following:
• field operating costs
• costs of reservoir data gathering (this includes seismic shoots, reprocessing, and well logging)
• infill injectors and producers (injectors may need corrosion-resistant-alloys)
• workovers
• injection header(s)
• automatic well-test facilities
• CO2 effluent production costs
• existing power plant modifications
• flue gas desulfurization (if not currently employed)
• CO2 recovery equipment (MEA catalyst process)
• CO2 transportation pipeline (from power plant to field)
• power for CO2 separation and compression activities
Field Operating Costs
Recovering and separating CO2 from produced hydrocarbon gas can represent a major portion of field operating costs. Typically, CO2 cost is broken into initial purchase price and recycling cost. Under many existing agreements, the initial purchase price for an operator varies as a function of oil price above a floor price.
Modeling CO2 Flooding Cost
Most of the reservoir and CO2 flooding costs are modeled as a function of oil price. Previous work (SPE-EOR Field Reports [1982−1992]) has demonstrated that historical annual operating costs in West Texas for a given year are related to the average oil price in the previous year. Analyzing this relationship of oil price to operating costs helps build a database of development and operating costs usable under future oil price scenarios. This is particularly true given the oil price variability of 1998. Land, lease, royalty, and acquisition costs are highly variable throughout the state.
Screening Texas for Candidate CO2 EOR Reservoirs
A feasibility study was undertaken to determine the applicability of using CO2 power plant effluent for CO2 enhanced oil recovery. Texas oil reservoirs were screened to determine if reservoir characteristics and production status warranted CO2 enhanced oil recovery. The localities of candidate reservoirs were then integrated with power plant locations to assess the feasibility and target resource of using CO2 power plant effluent.
43
Screening Criteria
To assess the EOR resource base and additional incremental recovery potential, geologic and engineering characteristics were examined for all significant oil reservoirs (n = 3000) in Texas defined as those that have produced more than 1 million stock-tank barrels of oil. Screening criteria include oil characteristics, rock properties, reservoir temperature, reservoir mechanics, and reservoir pressure (fig. 26) (see Factors Controlling the Use of CO2 in Sequestration and Oil Recovery). Approximately 1730 reservoirs satisfied the screening criteria. This candidate reservoir oil resource then becomes the oil resource that could help defray the cost of sequestering CO2 from existing power generation sources of effluent in Texas. Additionally power plants were screened on the basis of fuel used and output variability.
Oil Reservoir Screening Constraints
The general reservoir screening constraints were applied to cull out reservoirs that were not yet at the stage of their production life where CO2 would be the proper option. Reservoirs that are candidates for CO2 EOR are those that are at an advanced stage of waterflooding or aquifer encroachment. At this production stage most of the mobile oil has been produced and the remaining significant volume of oil is residual oil that cannot be produced without EOR. To identify reservoirs at an advanced stage of production screening constraints that were grounds for rejection from the candidate set included:
• reservoirs that were not initially water driven;
• reservoirs that were at an early stage of waterflooding; and
• reservoirs that had not yet been waterflooded.
However, previous waterflooding was not applied as a requirement for large deep reservoirs where vaporizing gas drive miscibility can be achieved (SPE-EOR Field Reports [1982−1992]). The literature shows that these reservoirs have had gas displacement EOR applied directly after primary production.
There are three broad reservoir characteristics that can be applied as screening criteria to determine the feasibility of CO2 EOR. These criteria include minimum miscibility pressure (MMP), injectivity, and reservoir heterogeneity. The most critical detailed constraint for the applicability of miscible CO2 EOR is the MMP. Minimum miscibility pressure is a function of oil properties, reservoir temperature, reservoir pressure, and the purity of the CO2 injected. Other screening criteria include injectivity, which is an indicator of permeability and storage capacity (porosity) and control the rate at which CO2 can be put into the reservoir. Geologic heterogeneity affects both early CO2 breakthrough and thus volume of CO2 recycled. For determining candidate reservoirs MMP was the only reservoir characteristic applied. No reservoirs were included as candidates for CO2 EOR unless the MMP was less than the initial reservoir pressure.
Several other reservoir properties are important to consider in the screening and process design phases. Broadly speaking, oil viscosity, oil API gravity, reservoir depth, reservoir oil saturation, and reservoir heterogeneity are among the most important. Carcoana (Cox and Schubert, 1986) suggests oil viscosity values of 1 cp or less and an API gravity of greater than 30°. Stalkup
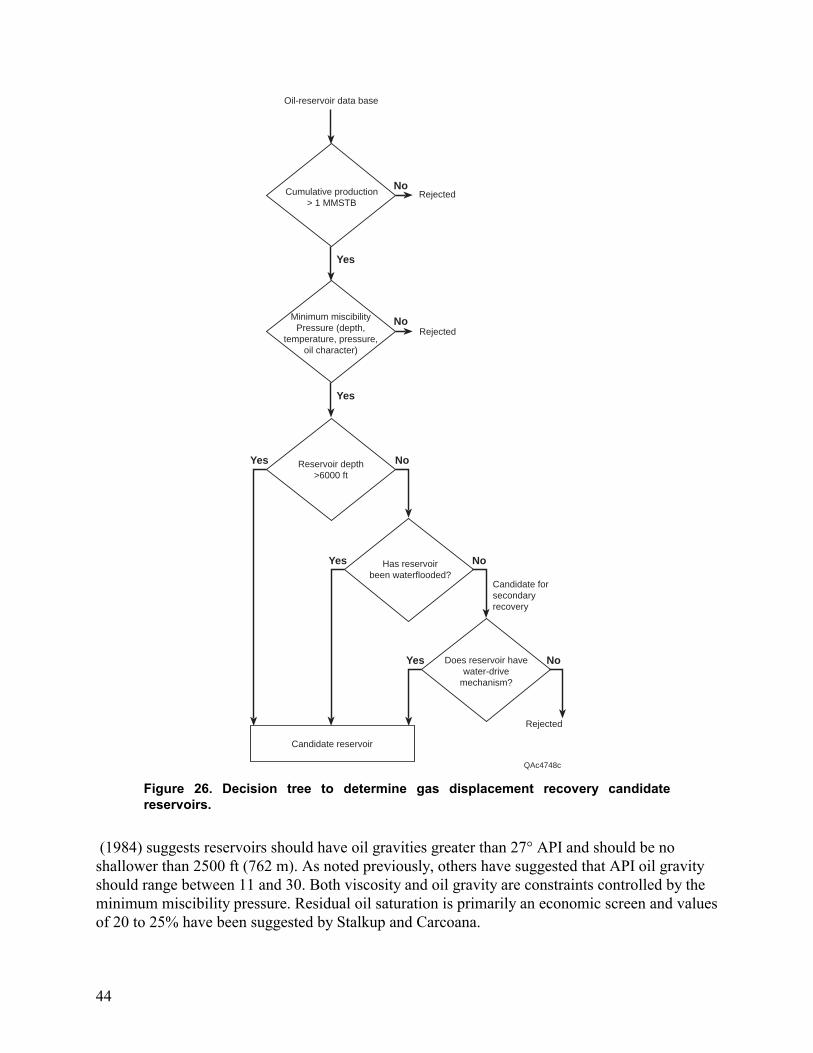
44
Cumulative production> 1 MMSTB
Oil-reservoir data base
NoRejected
Yes
Minimum miscibilityPressure (depth,
temperature, pressure,oil character)
NoRejected
Yes
Reservoir depth>6000 ft
NoYes
Has reservoirbeen waterflooded?
No
Candidate forsecondaryrecovery
Does reservoir havewater-drive
mechanism?
NoYes
Yes
Candidate reservoir
QAc4748c
Rejected
Figure 26. Decision tree to determine gas displacement recovery candidate reservoirs.
(1984) suggests reservoirs should have oil gravities greater than 27° API and should be no shallower than 2500 ft (762 m). As noted previously, others have suggested that API oil gravity should range between 11 and 30. Both viscosity and oil gravity are constraints controlled by the minimum miscibility pressure. Residual oil saturation is primarily an economic screen and values of 20 to 25% have been suggested by Stalkup and Carcoana.
45
General Generation Plant Screening Constraints
Screening constraints that were grounds for rejection from the candidate set included:
• a plant with a widely varying electrical output that was designed to follow load. These plants were rejected because the economic benefit to CO2 reduction was expected to be less than that of a base-load facility.
• a plant fired by natural gas. These plants were rejected because of the nonsteady flow of CO2 from natural-gas-fired plants, as noted previously.
Location of Utility-Owned Generation Plants and Oil Reservoirs
The locations of the candidate coal- and lignite-fired power plants and the associated oil reservoirs are shown in figures 27 and 28. These maps were made with the help of an integrated geographic information system (GIS). Candidate reservoirs are located within a 90-mi (145-km) radius of the coal/lignite-fired generation plants. The GIS maps also show how potentially difficult it can be to distribute the CO2 output to all of the reservoirs within the target radius. In a broad development scenario, the proper design and routing of a pipeline network will most likely present a major challenge.
Two notable clusters of candidate reservoirs exist: the platform carbonates of West Texas, and the fluvial deltaic reservoirs of East Texas. The coal and lignite plants in the eastern part of the State are generally located along the Wilcox and Jackson lignite belts that crop out in a belt stretching from South Texas well into East Texas and western Louisiana. It is important to note that some of the largest existing reservoirs in the State are located adjacent to these eastern plants. However, they are not included in the target candidate reservoir list or plotted on these maps. This is because they have experienced high recovery efficiencies and have low residual oil saturations and, hence, are considered to be unlikely candidates for gas displacement recovery. It may be possible to alter this assumption with further investigation and testing, and certainly they may possess a large opportunity for sequestration.
Results—Estimated Target Recoverable Oil from CO2 EOR
To determine the target of recoverable oil, reservoir volumetrics were carried out for each candidate reservoir. Volumetrics include the calculation of the original oil in place, the remaining mobile oil, and the residual oil. The residual oil is the target volume for the CO2 EOR process.
One of the major costs associated with the capture and transportation alternatives is the cost of the pipeline for CO2 transportation. Generally, the closer the oil resource is to the existing plants, the lower the overall cost of the CO2 capture and transportation project. Therefore, the oil volumetrics were grouped, by applying GIS, into sets of reservoirs dependent on their distance from a power plant. The volumetrics were then summed to give the following results in terms of distance from a candidate power plant:

46
NSearch area
Oil reservoir
Utility plant
100 mi0
0 150 km
QAc4301c
GULF OF MEXICO
TEXASTEXASTEXAS
Figure 27. Locations of utility plants and oil reservoirs, Gulf Coast and East Texas.
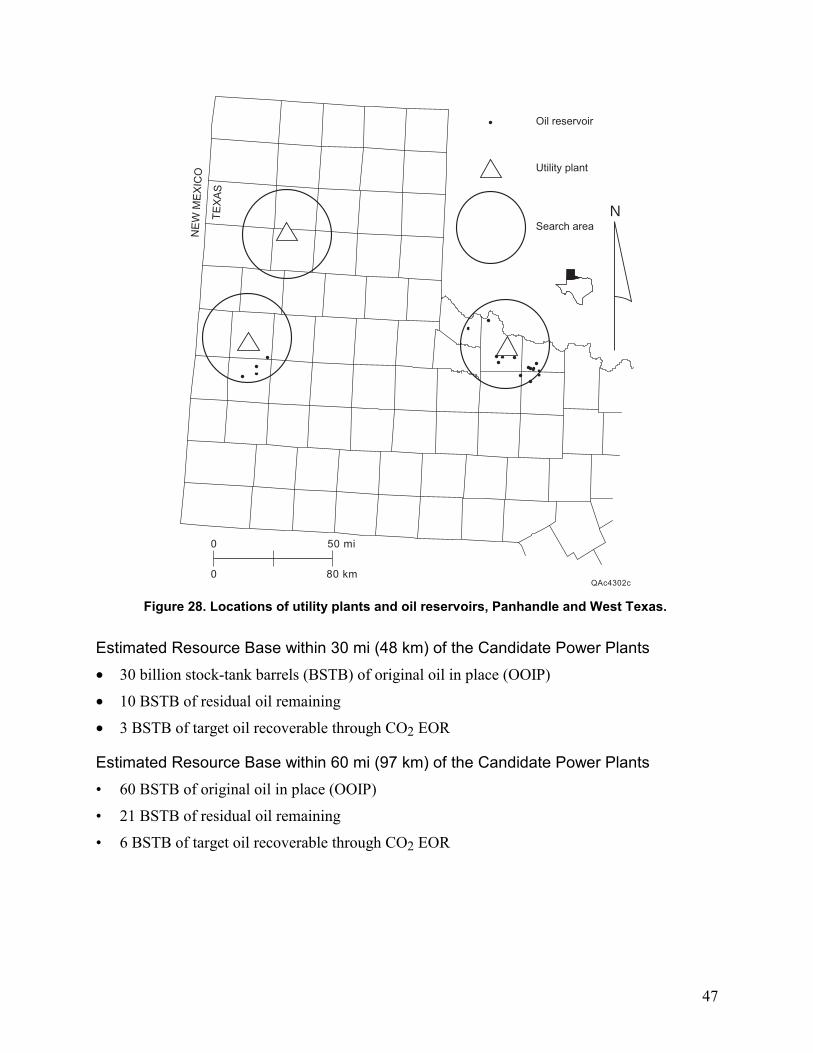
47
N
50 mi0
0 80 kmQAc4302c
Search area
Oil reservoir
Utility plant
TE
XA
S
NE
W M
EX
ICO
Figure 28. Locations of utility plants and oil reservoirs, Panhandle and West Texas.
Estimated Resource Base within 30 mi (48 km) of the Candidate Power Plants • 30 billion stock-tank barrels (BSTB) of original oil in place (OOIP)
• 10 BSTB of residual oil remaining
• 3 BSTB of target oil recoverable through CO2 EOR
Estimated Resource Base within 60 mi (97 km) of the Candidate Power Plants • 60 BSTB of original oil in place (OOIP)
• 21 BSTB of residual oil remaining
• 6 BSTB of target oil recoverable through CO2 EOR
48
Estimated Resource Base within 90 mi (145 km) of the Candidate Power Plants • 80 BSTB of original oil in place (OOIP)
• 31 BSTB of residual oil remaining
• 8 BSTB of target oil recoverable through CO2 EOR
Figures 27 and 28 illustrate the location of the candidate base-load power plants and the estimated resource base graphically. Note that multiple generation units are sometimes located at a single site. The target residual oil resource doubles when the search radii was doubled from 30 (48 km) to 60 mi (97 km). Increasing the search radii another 30 mi (48 km) resulted in an additional 2 BSTB target. Importantly the target resource is not clumped at the longer distance, making the idea of staged pipeline construction feasible.
In addition to these oil resource totals, a substantial amount of CO2 sequestration capacity exists within these areas. For purposes of this initial investigation, we have assumed that the capacity for CO2 sequestration is equal to the estimated amount of CO2 needed for oil recovery from the candidate reservoirs. Given the nature of the physical controls described previously and the possibility that overpressuring (compared with initial reservoir pressure) was ignored, it is most likely that the CO2 use (sequestration) estimate is conservative.
Results—Estimated CO2 Recovery Costs
Recovery costs for CO2 are highly dependent upon the demand requirement for the effluent. Since a major economic benefit of this approach for CO2 effluent mitigation relates to the “value” received for the additional oil produced, the larger the resource base to be flooded, the longer the “economic” life of the CO2 recovery process.
Initial estimates indicate that the candidate reservoirs may require carbon dioxide representing a 12- to 20-year supply of carbon dioxide output from the candidate fossil-fuel-fired plants. Therefore, costs of CO2 supply may be as follows (see table 3):
Costs of CO2 Capture and Transportation
10-year project life: $1.12 to $2.71; average $1.62
20-year project life: $0.94 to $2.41; average $1.39
30-year project life: $0.90 to $2.34; average $1.33
(Note: Transportation of 100 mi (161 km) assumed for comparison purposes)
49
Economic Potential for CO2 Recovery and Transportation
Near-Term Economic Potential
The analysis indicates that several plants are initial candidates for CO2 capture at oil prices close to current or above. In general, the industry currently considers $0.50/Mscf to be a target price of interest. Substantial resource could be delivered at prices close to and slightly above this level.
In fairness, simply on the basis of the value of the additional incremental production of oil, the returns are not especially compelling at oil prices of $15/bbl when one considers the large capital expenditures and operational uncertainties involved. For the most part, these projects are long-term, capital-intensive ones, requiring significant investment and considerable engineering and geologic experience to develop efficiently. Since pipeline costs are so substantial, further network design may be warranted for specific least-cost plants. For the majority, development is a prospect for the future.
Long-Term Economic Potential
The medium- and long-term perspective for these candidate plants is substantially brighter for CO2 capture and transportation, however. Since some energy companies are planning with some consideration for assigning costs to selected environmental externalities, an additional impetus for abatement is established. Depending upon how these externalities are internalized, CO2 capture and transportation could be a viable compliance strategy. The most discussed operational strategy is fuel switching from coal (or lignite) to natural gas. In this section, we will also compare fuel switching to CO2 capture and transportation.
Considering the pros and cons of capture and sequestering, it is important to recognize that “sequestering” requires a large, stable set of reservoirs. As previously noted, a 12- to 20-year demand for CO2 exists around the candidate coal- and lignite-fired plants. These demands are based on CO2 requirements of 6 to 10 Mscf/bbl of oil to be recovered. In addition, this demand estimate assumes that the reservoirs can accept as much CO2 as the plants can deliver, whenever the plants wish to deliver it. Clearly, prudent reservoir management practice will require more control and “service” than this. If implemented, a large-scale effort is likely to require balancing and storage services.
Without considering the value of the additional oil to be produced, the costs of CO2 capture and transportation over 100 mi (161 km) for the candidate plants range from approximately $23/t to $60/t of CO2. These costs do include an estimate for disposal costs, which are essentially the costs of oil field redevelopment.
If the “value” of the CO2 is taken to be a reference $0.75/Mscf, costs of capture and transportation are reduced to a range of $8/t to $41/t of CO2, based on a 30-year project life. For capital recovery only, it may also be appropriate to assume a 10-year project life. In this case, the costs range from $13 to $50/t of CO2.
50
These values form a range of values for CO2 taxes, should those be considered, that might be necessary to ensure that CO2 capture and transportation takes place. It is easy to see that if a tax were structured so that it were not imposed except on effluent, this range of break-even costs forms a target range for policy consideration. Conceivably, a fuel input tax or a tradable permit program that gave offset credit for effluent mitigation could also successfully encourage CO2 capture and transportation. Previously debated carbon tax levels$15 to $25/t of CO2could potentially result in substantial subsidy of CO2 for oil recovery, or substantial income for either CO2 producer or consumer.
What about the costs of the most discussed mitigation optionfuel switching from coal (or lignite) to natural gas? A first-order approximation of the costs to retrofit and operate a typical 513-MW subbituminous coal-fired boiler in Central Texas was undertaken. The costs were examined over a 30-year life on a levelized basis with a 10% real discount rate. They indicate that total costs over a 30-year study period range between $6 and $10/t of CO2. Given the relatively limited nature of this analysis and the favorable location of the plant (near several existing gas pipeline options), the costs on a state-wide basis for both of these approaches can initially be thought of as close to equal. Subsequent analyses are necessary to validate this observation.
In a qualitative sense, however, we do not believe that the risk profiles of the two approaches are the same. From a straightforward economic perspective, the overall cost of the fuel-switching option is primarily determined by the relationship and ratio between gas and coal prices in the future. Typically, consensus forecasts over the next 30 years (as flawed as these may be) project a 1 to 2% annual increase in real prices (not including inflation). For real gas prices, this range is typically higher. In addition, gas prices are considerably more volatile than coal prices.
Today, and for the near future, a fairly substantial price advantage exists for coal and lignite on a busbar evaluation basis (not considering any costs for environmental externalities). In a declining marginal cost market, such as the one that exists today, continuing to burn coal and lignite has considerable economic appeal. In addition, substantial lignite resources are available in Texas. To the extent that these resources are utilized, native natural gas is freed for export to other states and Mexico. If a resource short market were to reoccur, this “baseload coal and export higher value products” strategy also has considerable appeal.
Unlike fuel switching, the overall cost of the CO2 capture and transportation option is driven by real oil prices. The primary project risk develops if oil prices fall below the current range of $15 to $20, as they recently (December 1998) have. In other words, if oil prices decrease in real terms, or remain depressed at levels of $10 to $12/bbl, the viability of the CO2 capture and transportation project is at risk. The performance of prices in 1998 illustrates these risks well, in spite of the fact that many consensus forecasts foresee oil prices escalating in the range of 1 to 4% annually over the next 20 years. However, there is one additional uncertainty associated with the CO2 capture and transportation optionthe CO2 injected may not recover any additional oil. This reduces the revenue available to offset project costs.
51
So, the costs associated with the two options can be thought of as “close.” Substantial uncertainty is present with regard to fuel prices and CO2 flood design. An examination of the environmental issues remains to determine which strategy might be more desirable.
Risk cannot be defined only as price risk, however. For natural gas fuel switching, there are also issues with system leakage and the radiative forcing effects of methane compared with CO2. In addition, there are questions of appropriate timeframe evaluation that apply for both switching and sequestration alternatives. The amount of total mitigation, the reservoir stability of sequestration mitigation, and the potential emissions under each alternative are appropriate areas for further investigation.
Some initial examination of the potential emissions under each alternative may be useful. For a 513-MW reference plant, the hourly emission rate is approximately 969,000 lb/hr (439,538 kg/hr) of CO2. Using the capture and transportation option, the amount emitted into the atmosphere can be reduced by 90% to approximately 107,666 lb/hr (48,837 kg/hr). The fuel-switching option only reduces this amount by approximately 58%, to a level of 562,020 lb/hr (254,932 kg/hr) of CO2.
Assuming a 75% capacity factor and a 1-year period, the total CO2 emitted for the base coal case (no capture or fuel switching) is approximately 7.1 billion lb, or 71 billion lb over 10 years. For the fuel-switching option, the total is approximately 4.1 billion lb in 1 year, or 41 billion tons in 10 years. For the coal-fired capture/transportation option, the total CO2 emitted to atmosphere is approximately 0.7 billion lb in 1 year, or 7.1 billion lb in 10 years. In other words, the capture and transportation option can be expected to emit approximately 17.3% of the CO2 that the fuel-switching option will.
Even with this substantial advantage in favor of capture and transportation, it is consistent and reasonable to note that the demand function for CO2 is potentially limited to the remaining life of the reservoir, which might range from 5 to 15 years. An argument can be made that capture is only a viable environmental option as long as the CO2 is sequestered in oil reservoirs. What happens when gas displacement has recovered all the oil that it can? More importantly, what happens in the future when all of the economically and technically targetable resource has been extracted?
In the case where a particular reservoir or group of reservoirs is depleted, it is likely that the depleted reservoirs may be used to sequester more CO2 for storage. Since CO2 is highly compressible, substantial additional volumes can be sequestered as fairly small volumes of oil and water are produced. In the larger context, there are many additional oil reservoirs located outside of the 90-mi (145-km) radius of the plants noted herein. Since the problem is one of disposal and additional resource at the margin, it is quite conceivable that pipeline extensions may be built subsequent to the initial pipeline work to capture these additional resources. On an incremental basis, these capital investments should be a fraction of the initial ones.
In the worst case, substantial CO2 oversupply may eventually exist at some point in the future. Or, relative fuel prices may shift such that natural gas becomes less expensive than coal. In either case, at the future point in time, it may be viable to switch the retrofitted plants from coal to

52
natural gas. This would reduce the CO2 emission rate to approximately 56,202 lb/hr (25,493 kg/hr).
This compound option of capture/transportation and fuel switching would be more difficult to judge if it were carried out completely today. Certainly, it is more capital intensive, and it does not reinforce an incremental philosophy. From an environmental perspective, this approach would roughly double CO2 mitigation costs in the present price environment, but it would also cut CO2 emissions to about 6% of their current level. If a CO2 tax (or tradable emissions permit program) is in place with a relatively high price level, this approach could make sense. The political viability of such an approach is not considered here, however.
This compound option has several potential advantages in a tax or permit environment. First of all, the nature of the price uncertainty the project is exposed to is potentially closer to neutral. If oil prices and natural gas prices rise, consumers pay more for fuel, but obtain higher return for oil that is sold. Nationally, oil imports are potentially reduced, and drilling for natural gas may be increased to locate additional reserves. Major problems could arise, however, if additional oil resources were not produced and natural gas prices escalated rapidly.
There is an additional argument often advanced in favor of fuel substitution: the “economic development” argument. It recognizes that in a resource short market, additional incremental demand for natural gas will cause prices to rise and stimulate exploration and drilling to meet it. To the extent that this additional exploration and drilling is carried out in Texas, it has the potential to create jobs, and provide severance taxes and royalties to the State.
The “capture and transportation” option also has the potential to reinforce economic development. To the extent that additional oil resource is extracted, this would also help create jobs, and provide severance taxes and royalties to the State. It is beyond the scope of this preliminary analysis to quantify the differences in economic development.
However, one point should be noted. Current conventional wisdom for natural gas markets considers them to be in rough equilibrium. For approximately 10 years, a declining marginal cost market has existed. These factors may tend to delay additional economic development stimulus (i.e., expanded drilling programs) until more evidence emerges that the market has transitioned from declining marginal cost to a resource short one. In the industry’s vernacular, if oversupply (or the threat of oversupply) continues, additional incremental demand will be met from existing production, reducing the need for (and the economic benefits of) additional drilling.
On the other hand, the compound option is reinforced by encouraging the capture and transportation first, instead of fuel switching. The compound option (capture/transportation today, fuel switching tomorrow) is probably best thought of as a financial “option” with a potential future payoff if the strike price is reached. It minimizes current cost and uncertainty, and maintains strategic choice and future flexibility. These are desirable features when encouraging wide-scale adoption of new technology.
53
Conclusions
This study investigated the possibilities for CO2 sequestration within oil reservoirs in Texas. The study screened more than 1700 oil reservoirs, and grouped prospects for sequestration into geologic plays. Engineering controls on recovery were also identified. In addition, the study investigated the possibility of targeting certain plays and reservoirs within geographic proximity to existing base-load coal- and lignite-fired power plants. Order-of-magnitude CO2 capture and transportation costs were developed for each site to review the feasibility of undertaking such a development program.
There is technical and economic potential in Texas for capture and sequestering of CO2 emitted from existing fossil-fuel-fired plants and using the CO2 for enhanced oil recovery. These methods may be reasonable with oil prices in the $20 to $25/bbl, and prices for CO2 in the $1.00 to $2.00/Mcf range. Given appropriate market prices for oil and CO2, there may be substantial potential for CO2 abatement through a capture and transportation strategy. With appropriate incentives, this strategy may be accelerated.
Capture and sequestration was identified as an expensive process. Further analysis of the costs of compression, transportation, and the electricity capacity constraints that this may project onto the existing electrical grid might help identify additional measures that could increase the attractiveness of this alternative. Fortunately, substantive technical experience in handling CO2 processes exists within Texas. This means that certain issues, such as early corrosion of well-bore and transportation materials due to carbonic acid formation, might be addressed easily and in a straightforward manner.
From an environmental perspective, CO2 capture and transportation has the potential to reduce effluent levels to perhaps 10% of their current value for some of the largest coal- and lignite-fired plants in the state. It is estimated conservatively that demand for these CO2 supplies may exist for a period of 12 to 20 years for selected projects. In general, preliminary analysis demonstrates that capture and transportation may be preferable to fuel switching, reducing CO2 effluent to 18% of that obtained under a fuel-switching strategy. A compound option of capture plus fuel switching is considerably more difficult to evaluate given the substantial uncertainties of fuel markets and reservoir engineering.
How might such a capture and sequestration strategy be operationalized? Where would efforts most likely begin? How might a project implementation plan look? The future potential for oil reserve growth from CO2-based enhanced oil recovery in Texas appears large. To come to grips with some of these issues, an initial screening of significant-sized reservoirs on the basis of reservoir characteristics was conducted.
This effort demonstrated that approximately 1700 reservoirs are possible candidates for this type of EOR. These candidate reservoirs represent 80 BSTB of original oil in place, of which 31 BSTB is residual oil. The largest part of this resource lies in platform carbonate and fluvial-deltaic reservoirs. A number of issues remain unresolved with regard to the long-term effects of CO2 reinjection and repressurization on reservoir seal integrity for different types of depositional systems. Effects of overpressurization are not clear, so the total capacity of these reservoirs to
54
sequester CO2 is yet unknown. Much of the CO2 flood performance information contained in this report is based on publicly available sources that are not necessarily comprehensive. Detailed engineering and performance audits of the existing CO2 floods in Texas could help to better determine oil recovery efficiencies.
A target oil resource of 8 BSTB lies within 90 mi (145 km) of the candidate coal- and lignite-fired power plants. Substantial oil resources are also located outside of these areas. Many of these additional oil resources may be candidates for CO2 capture or direct flue gas injection, especially if the effluent is from gas-fired power plants. Incremental costs of $6 to $12/bbl are expected today.
Substantially greater opportunity for CO2 capture and sequestration may exist. The researchers assumed that certain large water-drive reservoirs were not appropriate for CO2 EOR processes. These assumptions may be conservative, and if relaxed, they could result in a larger technical potential for CO2 capture and sequestration in Texas. A better understanding of the oil resource base might identify additional candidates for enhanced recovery.
The CO2 capture and transportation infrastructure itself may be a candidate for cost reduction. An engineering and economic examination of CO2 capture and transportation and of flue gas capture and transportation (as a potential lower cost alternative to CO2 capture) might be useful for developing the environmental and cost impacts of such an approach, so that it might be balanced against other alternatives.
Natural gas and electricity network considerations are likely to play a role in the development of a CO2 storage program. Issues regarding integrating such a system with the advent of real-time wholesale pricing for electricity are likely to remain. The concepts of peak versus off-peak electricity pricing in addition to the large blocks of power that can be brought to the grid if separation and compression activities are temporarily suspended may help reduce network costs.
Development of an integrated CO2 supply network might be another solution to help minimize pipeline costs as the system is expanded over time. Documentation of some of the existing infrastructure is made within this report; however, CO2 storage costs may need to be reduced if CO2 is to be made available on a large scale. CO2 storage issues may be analogous to natural gas storage issues, with which the industry already has substantial experience.
The potential for these projects depends greatly on a number of economic, technical, and policy factors. To implement these on a large scale today, oil prices higher than the current (December 1998) $10 to $12/bbl may be needed; however, our initial screening indicates that project costs are plant specific. The technical and economic potential for capture and sequestration may be larger if multiple scenarios, including projected generation capacity additions expected in Texas during the next 10 years, were included. It is a complex undertaking to develop such a longitudinally consistent supply-and-demand balance. Sequestration and capture for enhanced oil recovery is only one potential solution for reducing the cost of any mitigation effort; it will be a combination of different solutions that will most likely result in effective management.
55
Phase 2 Objectives and Possible Tasks
The next phase of analyzing Texas CO2 sequestration potential is a second-tier investigation of using CO2 emissions for gas displacement enhanced oil recovery and sequestering them in the to-be-abandoned reservoirs. More in-depth data should be collected, and greater precision should be applied in calculations. Such a project would determine the total sequestration potential in Texas oil reservoirs.
This phase should focus on determining Texas state-wide total sequestration potential in oil reservoirs by developing and applying a geologic, engineering, and economically based model. Enhancement of the Texas oil reservoir, Texas gas displacement recovery, and the Texas power plant databases will result in the greater detail needed for this modeling. A suggested list of tasks for this next phase includes:
1. Determine current Texas state-wide total sequestration potential in oil reservoirs including previously abandoned reservoirs.
2. Analyze field abandonment rates and gas displacement recovery potential to abate abandonment.
3. Upgrade CO2 EOR database with additional detailed information. An engineering and performance audit of the existing CO2 floods in Texas and adjacent areas is needed to better determine oil recovery efficiencies that can be expected.
4. Identify and rank reservoirs with CO2 EOR potential outside the power plant search radii used in phase 1.
5. Conduct literature search and performance audit of hydrocarbon gas storage design and implementation with respect to sequestration.
6. Model field discoveries and field life to project future sequestration potential.
7. Develop a detailed geologic, economic, and engineering database on oil reservoirs to evaluate full CO2 EOR and sequestration potential.
8. Construct a Texas sequestration model.
9. Simulate CO2 sequestration in Texas, determining near-, mid-, and long-term sequestration strategies.
56
Glossary of Terms
Barrier strandplain reservoirs Reservoirs that were originally deposited in an ocean beach setting. Reservoirs deposited in this depositional setting are categorized into the same geologic play.
Carbonate platform reservoirs Reservoirs that were originally deposited in an ocean depositional environment setting of shallow warm water where carbonate forms. Reservoirs deposited in this depositional setting are categorized into the same geologic play.
Connectivity of pore space The degree to which pores within a rock are connected by void space.
Deep water chert reservoirs A depositional environment in deep ocean water where very little land-derived sediment falls. Instead, siliceous material is precipitated. Reservoirs deposited in this depositional setting are categorized into the same geologic play.
Depositional system The physical system in which sediment is deposited which in turn will in time turn into rock.
Diagenesis The physical and chemical process that causes sediment to turn into consolidated rock or to change the composition and character of rock during and after burial.
Exploitation process The strategy designed by the petroleum engineer to produce hydrocarbons from a reservoir.
Fluvial-deltaic reservoirs Reservoirs that are made of rock that were originally deposited in a setting where rivers spills into a large body of water such as a lake or ocean. Reservoirs deposited in this depositional setting are categorized into the same geologic play.
Geologic play A set of hydrocarbon reservoirs that have similar geologic and engineering characteristics.
Heterogeneity The variability of rock characteristics spatially within a rock bed and/or formation.
Infill drilling The drilling of wells between already producing wells.
Infill injectors Wells that are drilled between wells already producing hydrocarbons with the propose of using them to inject fluid or gas.
Injectivity The ability of gas or fluids to be injected into the rock.
Inverted nine spot A well pattern of injectors and producers spread across the reservoir used to sweep oil from injectors to producers.
57
Minimum miscibility pressure The pressure at which CO2 will mix with oil.
Mobility ratio The ratio of how mobile one fluid is in the rock compared to another.
Oil gravity A measure of the density of oil.
Peripheral pattern A well pattern of injectors distributed around the downdip structurally low margin of the reservoir with producers higher on structure.
Production voidage The volume of fluid or gas taken from a reservoir.
Reef depositional setting A depositional setting where carbonate organisms build reef structures in warm shallow water. Reservoirs deposited in this depositional setting are categorized into the same geologic play.
Reservoir drive mechanism The mechanism that supplies energy to the reservoir to cause the fluid and gas to flow.
Solution gas Gas that is dissolved in a fluid, such as natural gas dissolved in oil.
Stratigraphic sequence A succession of sedimentary rock beds of interregional extent that was deposited in a similar geologic depositional setting and arranged chronologically with the older strata below and the younger strata above.
Submarine fan reservoirs Reservoirs that were deposited in a deep water setting with the sediments being deposited by turbidity currents. Reservoirs deposited in this depositional setting are categorized into the same geologic play.
Transmissibility A measure of how easily a fluid moves through the rock.
Ultimate recovery efficiency A measure of the ultimate volume of hydrocarbons that can be produced in a reservoir relative to the original volume.
Volumetric balance The balance between the volume fluids and gas taken out of a reservoir versus the volume injected back in.
References
D. K. Beike and M. H. Holtz, “Integrated geologic, engineering, and financial assessment of gas displacement recovery in Texas,” Paper No. 35167, Society of Petroleum Engineers (1996).
Biannual EOR surveys, Oil and Gas Journal, 1876−1992. Pennwell Publishing Co., Tulsa, Oklahoma.
B. Cox and J. Schubert. EOR project sourcebook. Pasha Publications Inc., Arlington, VA, 1986, 440 p.
58
L. P. Dake. Fundamentals of Reservoir Engineering. Elsevier Scientific Publishing Company Inc., New York, NY, 1978, 443 p.
M. El-Saleh, “Analogy procedure for the evaluation of CO2 flooding potential for reservoirs in the Permian and Delaware Basins,” Paper No. 35391, Society of Petroleum Engineers/Department of Energy (1996).
W. A. Flanders and A. G. Shatto, “CO2 EOR economics for small-to-medium-size fields,” Paper No. 26391, Society of Petroleum Engineers (1993).
W. E. Galloway, T. E. Ewing, C. M. Garrett, Noel Tyler, and D. G. Bebout. Atlas of major Texas oil reservoirs. The University of Texas at Austin, Bureau of Economic Geology, Austin, Texas 1984, 139 p.
R. E. Hadlow, “Update of industry experience with CO2 injection,” Paper No. 24928, Society of Petroleum Engineers (1992).
H. Haskin and R. Alston, “An evaluation of CO2 huff ‘n’ puff tests in Texas,” Journal of Petroleum Technology (1989).
M. H. Holtz, “Estimating oil reserve variability by combining geologic and engineering parameters,” Paper No. 25827, Society of Petroleum Engineers (1993).
M. H. Holtz, Noel Tyler, and C. M. Garrett, Jr., “Assessment of hydrocarbon resources on University of Texas Lands: future reservoir growth potential,” in D. H. Mruk and B. C. Curran, eds., Permian Basin exploration and production strategies: applications of sequence stratigraphic and reservoir characterization concepts, West Texas Geological Society Publication. No. 92-91, p. 170−189 (1992).
L. W. Holm and L. J. O’Brien, “Carbon dioxide test at the Mead-Strawn Field,” Paper No. 3103, Society of Petroleum Engineers–American Institute of Mining Engineering Transactions (1970).
G. Hunter, D. York, and J. Ader, “Slaughter Estate Unit tertiary pilot performance,” Paper No. 9796, Society of Petroleum Engineers–American Institute of Mining Engineering Transactions (1982).
A. V. Kane, “Performance review of a large-scale CO2-WAG enhanced recovery project: SACROC Unit−Kelly−Snyder Field,” Society of Petroleum Engineers–American Institute of Mining Engineering Transactions (1979).
R. K. Kirkpatrick, W. A. Flanders, and R. M. Depauw, “Performance of the Twofreds CO2 injection project,” Paper No. 14439, Society of Petroleum Engineers (1985).
M. Klins and C. P. Bardon, “Carbon dioxide flooding,” Institut Francais du Pétrole (1991).
59
U.S. Department of Energy. J. F. Puatz, C. A. Sellers, C. Sellers, and E. Allison, Enhanced oil recovery projects data base, 1992.
S. B. Pontious and M. J. Tham, “North Cross (Devonian) Unit CO2 flood review of flood performance and numerical simulation model,” Society of Petroleum Engineers–American Institute of Mining Engineering Transactions (1978).
Public Utility Commission of Texas. Statewide electrical energy plan, 1995.
Railroad Commission of Texas. A survey of secondary and enhanced recovery operations in Texas to 1982, 1984. Bulletin 82.
“Enhanced oil recovery field reports,” Society of Petroleum Engineers (1982−1992).
“Geraldine Ford Field, CO2 miscible flooding injection project: Midland, Texas,” first report, Society of Petroleum Engineers–Enhanced Oil Recovery (1986).
“Denver (San Andres) Unit, CO2 miscible flooding project: Houston, Texas,” Enhanced Oil Recovery Operations Questionnaire, Society of Petroleum Engineers–Enhanced Oil Recovery (1989).
“Dollarhide (Devonian) Field, CO2 miscible injection project: Midland, Texas,” first report, Society of Petroleum Engineers–Enhanced Oil Recovery (1991).
Taber et al., “EOR screening revisited,” presented at the Society of Petroleum Engineers/Department of Energy 10th Enhanced Oil Recovery Congress.
R. Winzinger and K. S. Patel, “Design of a major CO2 flood, North Ward Estes Field, Ward County, Texas,” Paper No. 19654, Society of Petroleum Engineers (1989).
Reference List
Annotated Bibliography
• Beike, D.K. and Holtz M.H., Integrated Geologic, Engineering, and Financial Assessment of Gas Displacement Recovery in Texas, SPE 35167, 1996.
Reservoir and petrophysical data of 57 commercially viable gas-displacements projects is analyzed to study the design of these projects with emphasis on patterns, spacing and production processes. The authors concluded that the potential for reserve additions from CO2 in Texas is significant and meanly supported by restricted-to-open platform carbonate reservoir in West Texas.
Bellavance, J.F.R., Dollarhide Devonian CO2 Flood: Project Performance Review 10 Years Later, SPE 35190, 1996.
CO2 flood behaviors are analyzed in the five phases of the project after 10 years of performance. Authors conclude that WAG process is detrimental to productivity and recovery. They established to make individual pattern monitoring due to the variability of
60
the reservoir quality and its faulted nature. To date the incremental recovery is estimated at 16 MMbbl (8% of the OOIP).
Bergman, P., Winter, E. and Chen Z.Y., Disposal of Power Plant CO2 in Depleted Oil and Gas Reservoirs in Texas, Energy Convers. Mgmt, Vol. 38, 1997.
Paper discusses economics of CO2 factors related to CO2 capture, costs of CO2 recovery for coal-fired and natural gas-fired plants, gas reservoir purchase and development. Technical factors are discussed on the base of corrosion, CO2 chemical reactivity, injection depth, etc., and regulatory concerns.
El-Saleh, M., Analogy Procedure for the Evaluation of CO2 Flooding Potential for Reservoirs in the Permian and Delaware Basins, SPE/DOE 35391, 1996.
This paper presents a methodology to evaluate the oil recovery for analogous and mature fields in the Permian and Delaware Basins, through the use of curves of incremental oil recovery vs. HCPV of CO2. These curves can be utilized to evaluate CO2 potential for analogous formations or zones.
Flanders, W.A., and Shatto A.G., CO2 EOR Economics for Small-to-Medium-Size Fields, SPE 26391, 1993.
The paper investigates the economic viability of conducting CO2 EOR operations in small to medium-size field under actual production data from a representative CO2 project, current costs to equip the field for CO2 operations, and operating costs in the actual range of ongoing projects. One important conclusion of this paper was that vastly different CO2 projects exhibit similar EOR production responses.
Grigg, R., and Schechter, D., State of the Industry in CO2 Floods, SPE 38849, 1997. Review of CO2 floods as a maturing EOR process to assess advantages/disadvantages to identify research opportunities and to develop correlation between problems encountered and solutions developed. The paper is base on a survey of 25 projects with several vital questions about the process.
Hadlow, R.E., Update of Industry Experience with CO2 Injection, SPE 24928, 1992. This paper uses current industry experience to evaluate the performance to date of miscible CO2 injection projects. It includes also a summary of innovations being implemented by industry to improve recovery from existing CO2 projects.
Haskin, H. and Alston R., An Evaluation of CO2 Huff ‘n’ Puff Tests in Texas, Journal of Petroleum Technology, February 1989.
Field experience in 28 Texas CO2 huff ‘n’ puff projects is discussed. Two methods are presented for estimating incremental oil recovery. One of these methods was developed for the Texas reservoirs and its application is recommended because is based only on fluid properties. The authors concluded that oil swelling and viscosity reduction appear to be the important oil recovery mechanism.
Holm, L.W., and O’Brien L.J., Carbon Dioxide Test at the Mead-Strawn Field, SPE-AIME 3103, 1970.
Discusses a field report project conducted to test the effectiveness of CO2 as an oil recovery agent in a primary depleted reservoir. They concluded that the low permeability of this field caused the flood life to be extended and the economics of the recovery process to be adversely affected.
Hunter, G., York, D., and Ader, J., Slaughter Estate Unit Tertiary Pilot Performance, SPE 9796, 1982.
61
Presents Amoco’s evaluation of a CO2 miscible displacement in the SEU. Because of difficulties in obtaining a reliable source of pure CO2, a solvent gas stream consisting of 72% CO2 and 28% Hydrogen Sulfide was used in the project. After starting the injection in 1976, about 15% of the OOIP had been recovered. The SEU tertiary pilot was conducted so that both secondary and tertiary recovery factor could be delineated clearly by actually measuring oil in the tank. They concluded that although the injected solvent gas stream contained about 28% of H2S, the tertiary recovery has been excellent. It shows that the the multiple-contact miscible gas process is the same as that expected for pure CO2 in this type of reservoir.
Kane, A.V., Performance Review of a Large-Scale CO2-WAG Enhanced Recovery Project, SACROC Unit-Kelly-Snyder Field, SPE-AIME 7091, 1979.
This paper reviews the behavior of the CO2-WAG project conducted at the SACROC unit since 1972. The OOIP was used for the evaluation and design of the CO2 miscible flood and for early estimates of incremental oil recovery. Important aspects as the CO2 supply system, pattern-area injection system, injection performance, production response in the different phases of the project are discussed in detail. They concluded that the dominant factor controlling oil recovery by CO2 flood at the SACROC is the geology of the system. An additional 8% of the OOIP is expected to recover.
Kirkpatrick R.K.,Flanders W.A., and Depauw R.M., Performance of the Twofreds CO2 Injection Project, SPE 14439, 1985.
The continuos CO2 injection started on 1974. The Twofreds CO2 project became the first field-scale tertiary CO2 injection project in a sandstone formation in Texas. The paper reviews the reservoir performance during primary, secondary and tertiary operations. A detail evaluation is made of the field response to CO2 injection. Until 1985 the tertiary recovery had been estimated at 5% of the OOIP.
Linn, L.R., CO2 Injection and Production Field Facilities Design Evaluation and Considerations, SPE 16830, 1987.
This paper presents initial design and installation considerations, design criteria, and initial installation problems associated with Amoco’s four West Texas CO2 projects (Slaughter Estate Unit, Central Mallet Unit, Frazier Unit, Wasson ODC Unit). Special considerations will be given to design details and material specifications that are often overlooked. They concluded that the problems that had occurred since 1984 have been addressed quickly with prompt. The successful operations have been based on clear designs, cooperative engineering and operations efforts.
Mussig, S., Possibilities for Reduction of Emissions-in Particular the Greenhouse Gases CO2 and CH4 – in the Oil and Gas Industry, SPE 25041, 1992.
Combined cycle processes, heat pumps, fuel cells are studied as measures to increase efficiency of combustion processes. CO2 disposal in depleted reservoirs is considered. Special techniques are discussed for CO2 emission reductions in the oil and gas industry.
Ormiston R.M., and Luce M.C., Surface Processing of Carbon Dioxide in EOR Projects, SPE 15916, 1986.
This review paper describes surface processing considerations for CO2 EOR projects in light of the unique properties of the CO2. The effects of CO2 density, water content, hydrate formation conditions, solvent properties
Pontious, S.B. and Tham M.J., North Cross (Devonian) Unit CO2 Flood-Review of Flood Performance and Numerical Simulation Model, SPE-AIME 6390, 1978.
62
Presents a study of the different stages of the CO2 project that has been implemented in the field. The initial flood design and the general CO2 flood performance is studied in detail. Also a numerical simulation is performed.
Talwar, M., and Parsons R., Process for CO2 Production for EOR Applications, SPE 14048, 1985.
This paper establishes that current emphasis EOR is toward CO2 miscible flooding (1985). CO2 requirement could range from 5,000 to 30,000 scf/bbl of tertiary oil. This means that economics of CO2 is heavily dependent upon the CO2 cost. A 0.50 $ increase in the CO2 price per 100 scf could mean as much as 5.00 $ extra cost of incremental oil. The paper propose a low cost and reliable concept of producing CO2. It involves the principles of cogeneration plant plus the CO2 separation technology.
Winzinger, R., and Patel K.S., Design of a Major CO2 Flood, North Ward Estes Field, Ward County, Texas, SPE 19654, 1989.
Reservoir engineering aspects of the design of a major West Texas CO2 project are presented. The design includes: (1) a detailed fieldwide geologic study. (2) CO2 injectivity test. (3) Oil-CO2 phase behavior laboratory study. (4) Reservoir simulation to predict flood performance. It is predicted a recovery of an additional 8% of the OOIP.
Enhanced Oil Recovery References
Introduction Articles
Brashear, J.P., Biglarbigi, K., Becker, A.B., Ray, R.M.: “Effect of Well Abandonments on EOR Potential,” JPT (Dec. 1991) 1496-1501.
Carcoana, Aurel, Applied Enhanced Oil Recovery, Prentice Hall, New Jersey, 1992, p. 292.
Cronquist, C., Carbon Dioxide Dynamic Miscibility with Light Reservoir Oils, Proc., Fourth Annual U.S. DOE Symposium, Tulsa Ok., Vol. 1b-Oil, 1978.
Doscher, T.M., Wise, F.A.: “Enhanced Crude Oil Recovery Potential - An Estimate,” JPT (May 1976) 575-585.
Elkins, L.F.,: “Discussion of The 1984 Natl. Petroleum Council Studies on EOR,” JPT (Aug. 1988) 1079-1085.
Gentile, R.,: “The Role of Fossil Energy in the National Energy Strategy,” The Interstate Oil & Gas Compact & Committee Bulletin, volume 4, number 1 June 1990.
Green, D.W.: “Status of EOR Research in the U.S.,” The Interstate Oil & Gas Compact & Committee Bulletin, volume 4, number 1 June 1990.
Klins, M. and Bardon C.P., Carbon Dioxide Flooding, Institut Francais du Pétrole, 1991.
Kovarik, F.S., “Transferring New Recovery Technology To Independent Producers,” The Interstate Oil & Gas Compact & Committee Bulletin, volume 4, number 2, December 1990.
63
Lake, L. W., Enhanced Oil Recovery, Englewood Cliffs, New Jersey, Prentice-Hall, 1989, 550 pp.
National Petroleum Council: “Enhanced Oil Recovery,” 1984.
Payne, J.L.: “Let’s Move Ahead by Learning from the Past History Shows That the Time for a National Energy Policy Is Now,” The Interstate Oil & Gas Compact & Committee Bulletin, volume 4, number 2 December 1990.
Robl, F.W., Emanuel, A.S., Van Meter Jr.,O.E.: “The 1984 Natl. Petroleum Council Estimate of Potential EOR for Miscible Processes,” JPT (Aug. 1986).
Skov, A. M.: “A View of Improved Oil Recovery Potential in the US,” The Interstate Oil & Gas Compact & Committee Bulletin, volume 4, number 2 December 1990.
Sommers, H.A., The Manufacture and Distribution of Carbon Dioxide, Chemical Engineering Progress, Vol. 49, No. 7, July, 1933.
Taber, J.J., “Environmental Improvements and Better Economics in EOR Operations,” Annual Workshop of the IEA Collaborative Project on Enhanced Oil Recovery, Palo Alto October 4-6, 1989.
Foushee, M.: “Future of Domestic Oil and Gas Industry and Implications for Economics of the States and the Nation,” The Interstate Oil & Gas Compact & Committee Bulletin, volume 4, number 1 June 1990.
CO2 Process
Arnold, C.W.: “The Status of CO2 Flooding in the United States,” The Interstate Oil & Gas Compact & Committee Bulletin, volume 3, number 1, June 1989.
Griffith, J.D.: “The Role of Miscible Gas Drives in Oil Recovery Processes,” The Economic Complexity of Enhanced Recovery.
Holm, L.W.: “Evolution of the Carbon Dioxide Flooding Processes,” JPT (Nov. 1987) 245-252.
Lasater, J. A., Bubble Point Pressure Correlation, Transactions, AIME, 1958, p. 379.
Martin, F.D., Taber, J.J., “Carbon Dioxide Flooding,” JPT (April 1992) 396-400.
Ormiston, R.M., “Surface Processing of Carbon Dioxide in EOR Projects,” JPT (Aug.1986) 823-828.
Stalkup, F.I., “Miscible Flooding With Hydrocarbons, Flue Gas, and Nitrogen,” NMT 890027.
Stalkup Jr., F.I., “Miscible Displacement,” SPE of AIME, Monograph volume 8, 1984.

64
CO2 Field Experience
Barbe, J.A., Schnoebelen, D.J.: “Quantitative Analysis of Infill Performance: Robertson Clearfork Unit,” JPT (Dec.1987) 1593-1601.
Bowker, K.A., Shuler, P.J.: “Carbon Dioxide Injection and Resultant Alteration of the Weber Sandstone, Rangely Field, Colorado,” AAPG Bulletin, (Sep. 1991) v.75 number 9.
Brownlee, M.H., Sugg, L.A.: “East Vacuum Grayburg-San Andres Unit CO2 Injection Project: Development and Results to Date” SPE 16721, 62 Annual Technical Conference and Exhibition of the Society of Petroleum Engineers, Dallas Sept. 27-30, 1987.
Brannan, G., Whitington, H.M. Enriched-Gas Miscible Flooding: A Case History of the Levelland Unit Secondary Miscible Project, SPE-AIME 5826, 1976.
Christiansen, R.L.: “Gas Flooding Experiments for the East Side of the Yates Field Unit,” SPE 16986, 62 Annual Technical Conference and Exhibition of the Society of Petroleum Engineers, Dallas Sept. 27-30, 1987.
Dicharry, R.M., Perryman, T.L., Ronquille, J.D.: “Evaluation and Design of a CO2 Miscible Flood Project - Sacroc Unit, Kelly-Snyder Field,” JPT (Nov. 1973) 1309-1318.
Haskin, H.K., Alston, R.B.: “An Evaluation of CO2 Huff ‘n’ Puff Tests in Texas,” JPT (Feb. 1989) 177-184.
Hunter, J.K., Bryan, L.A.: “LaBarge Project: Availability of CO2 for Tertiary Projects,” JPT (Nov. 1987)1407-1410.
Hsle, J.C., Moore, J.S.: “The Quarantine Bay 4RC CO2 WAG Pilot Project: A Postflood Evaluation,” SPE Reservoir Engineering (Aug. 1988) 809-814.
Kleinsteiber, S.W.: “The Wertz Tensleep CO2 Flood: Design and Initial Performance,” JPT (May 1990) 630-636.
Lin, E.C., Poole, E.S.: “Numerical Evaluation of Single-Slug, WAG, and Hybrid CO2 Injection Processes, Dollarhide Devonian Unit, Andrews County, Texas,” SPE Reservoir Engineering (Nov. 1991) 415-420.
Magruder, J.B., Stiles, L.H., Yelverton, T.D.: “A Review of the Means San Andres Unit Full-Scale CO2 Tertiary Project,” SPE/DOE 17349, SPE/DOE Enhanced Oil Recovery Symposium, Tulsa, OK, April 17-20, 1988.
Merritt, M. B., and Groce, J. F. A Case History of the Hanford San Andres Miscible CO2 Project, SPE JPT Vol. 44, No. 8, August 1992, p. 924-929.
65
Pittaway, K.R., Rosato, R.J.: “The Ford Geraldine Unit CO2 Flood - Update 1990,” JPT (Nov.1991) 410-414.
Pittaway, K.R., Runyan, E.E.: “The Ford Geraldine Unit CO2 Flood: Operating History,” SPE 17278, SPE Permian Basin Oil and Gas Recovery Conference, Midland, TX, March 10-11, 1988.
Oil and Gas Journal, 1998 Enhanced Oil Recovery Special Report, April 20, 1998, pp. 60-77.
Poole, E.S.: “Evaluation and Implementation of CO2 Injection at the Dollarhide Devonian Unit,” SPE 17277, SPE 17278, SPE Permian Basin Oil and Gas Recovery Conference, Midland, TX, March 10-11, 1988.
Spivak, A., Garrison, W.H., Nguyen, J.P.: “Review of an Immiscible CO2 Project, Tar Zone, Fault Block V, Wilmington Field, California,” SPE Reservoir Engineering (May 1990) 155-162.
Winzinger, R., Brink, J.L., Patel, K.S., Davenport, C.B., Patel, Y.R., Thakur, G.C.: “Design of a Major CO2 Flood, North Ward Estes Field, Ward County, Texas,” SPE Reservoir Engineering (Feb. 1991) 11-16.
CO2 Simulation
Chang, Y., Lim, M.T., Pope, G.A., Sephenoori, K.: “Carbon Dioxide Flow Patterns Under Multiphase Flow, Heterogeneous Field Scale Conditions,” SPE 22654, SPE Annual Technical Conference and Exhibition, Dallas, TX, October 6-9, 1991.
EOR Economics
Anada, H.R., M.D. Fraser, D.F. King, A.P. Seskus, and J.T. Sears, Economics of By-Product CO2 Recovery and Transportation For EOR, Energy Progress, Vol. 3, No. 4, p.233, December, 1983.
Anonymous: “New Mexico CO2 project under way,” OGJ (Feb.6, 1989) 18-20.
Anonymous: “Shell Western Enlarging CO2 flood in Wasson field,” OGJ (Feb. 26, 1990) 106.
Brummert, A.C., Ammer, J.R., Watts, R.J., King, P., Boone, D.A.: “Economic Evaluation of a CO2 EOR Flood at the Rock Creek Field, Roane County West Virginia,” SPE Reservoir Engineering (Aug. 1988) 829-834.
Holtz, M.H.and Beike, D., Drilling and Development Costs in Texas, The Bureau of Economic Geology, 1991.
Kessel, D.G., Volz, H., Maitin, B.: “Economics of Polymer Flooding - A Sensitivity Study,” The Economic Complexity of Enhanced Recovery.
66
MacDonald, R.C., Campbell, J.E.: “Valuation of Supplemental and Enhanced Oil Recovery Projects with Risk Analysis” JPT (Jan. 1986) 57-69.
Necmettin Mungan: “Enhanced Recovery under Constrained Conditions,” JPT (Aug. 1990) 962-964.
Perry, C.W.: “The Economics of Enhanced Oil Recovery and Its Position Relative to Synfuels,” SPE 9562, SPE Economics and Evaluation Symposium, Dallas, TX, Feb. 25-27, 1981.
Tomich, J.F., Laplante, D.L., Snow, T.M.: “Technical and Economic Complexities Associated with Surfactant Flooding,” The Economic Complexity of Enhanced Recovery.
Wolsky, A.M., Jankowski, D.J., “The Value of CO2: Framework and Results,” JPT (Sep. 1986) 987-994.
Tax and Regulations
Anonymous: “API: Policies are driving oil industry from the U.S.,” OGJ (Nov. 25, 1991).
Brashear, J.P., Becker, A., Khosrow Biglarbigi, Ray, R.M. “Incentives, Technology, and EOR: Potential for Increased Oil Recovery at Lower Oil Prices” JPT (Feb.1989) 164-170.
Brashear, J.P., Biglarbigi, K.,: “Impact of Recent Federal Tax and R&D Initiatives on Enhanced Oil Recovery,” SPE 22622, SPE 66th Annual Fall Technical Conference and Exhibition of the Society of Petroleum Engineers of AIME, Dallas, TX, Oct. 6-9, 1991.
Godec, M.L., Khosrow Biglarbigi: “Economic Effects of Environmental Regulations on Finding and Developing Crude Oil in the U.S.,” JPT (Jan. 1991).
Mandelker, P.: “Tax Credit, bills may expand EOR opportunities in U.S.,” OGJ (Feb. 24, 1992) 69-72.
Sharp, J.: “Enhanced Oil and Gas Recovery Incentives for Texas,” The Interstate Oil & Gas Compact & Committee Bulletin, volume 4, number 1, June 1990, 24-27.
R&D
Stosur, G.J. “Analysis of Petroleum Recovery Research Trends in the United States” The Interstate Oil & Gas Compact & Committee Bulletin, volume 3, number 1, June 1989, 59-64.
Geologic Influences
Venuto, P.B.: “Tailoring EOR processes to geologic environments,” World Oil (Nov.1989) 61-68.
67
SPE Enhanced Oil Recovery Field Reports
Denver (San Andres) Unit. CO2 Miscible Flooding Project. Houston, Texas. Enhanced Oil Recovery Operations Questionnaire. SPE-EOR.
Dollarhide (Devonian) Field. CO2 Miscible Injection Project. Midland, Texas. First Report. SPE-EOR.
Geraldine Ford Field. CO2 Miscible Flooding Injection Project. Midland, Texas. First Report. SPE-EOR.
Kelly Snyder Field. CO2 WAG Flood Project. Scurry County, Texas.
CO2 Capture
Benson, L.B., Development and Commercialization of the Thiosorbic Lime Wet Scrubbing Process for Flue Gas Desulfurization, in Lime for Environmental Uses, ASTM STP 931, Philadelphia, Pa., 1987, pp. 20-31.
Brady, J.D., Flue Gas Scrubbing Process for Sulfur Dioxide and Particulate Emissions Preceding CO2 Adsorption, Environmental Progress, Vol. 6, No. 1, February, 1987.
Cairncross, Francis, Costing the Earth, Harvard Business School Press, 1992, 341 pp.
Center For Transportation Research, Argonne National Laboratory, U.S. Department of Energy, Emissions of Greenhouse Gases from the Use of Transportation Fuels and Electricity, Volume 1, Report ANL/ESD/TM-22, Volume 1, November, 1991.
Electric Power Research Institute, Coproduction of Carbon Dioxide (CO2) and Electricity, Report AP-4827, Palo Alto, Ca., November, 1986.
Electric Power Research Institute, Full Scale Scrubber Conversion Characterization of Conesville Unit 5, Report CS-2525, Palo Alto, Ca.
Electric Power Research Institute, TAG-Technical Assessment Guide, Report P-4463-SR, Palo Alto, Ca., 1986.
Energy Information Administration, Emissions of Greenhouse Gases in the United States 1987-1994, Report EIA-0573(87-94), October, 1995.
Fluor Daniel, Engineering and Economic Evaluation of CO2 Removal from Fossil-Fuel Fired Power Plants, Volume 1: Pulverized Coal Fired Power Plants, IE-7365, Vol. 1, Electric Power Research Institute, June, 1991.

68
Fluor Daniel, Engineering and Economic Evaluation of CO2 Removal from Fossil-Fuel Fired Power Plants, Volume 2: Coal Gasification Combined Cycle Power Plants, IE-7365, Vol. 2, Electric Power Research Institute, June, 1991.
Herzog H., Drake, E and Adams E., CO2 Capture, Reuse, and Storage Technologies for Mitigating Global Climate Change, Energy Laboratory Massachusetts Institute of Technology, 1997.
Holt, J and Lindeberg E., Underground Storage of CO2 in Aquifers and Oil Reservoirs, Energy Conver. Mgmt., Vol 36, No 6-9, 1995.
Horner, W.N., Carbon Dioxide from Flue Gas, Unpublished Master’s Thesis, The University of Calgary, September, 1983, 120 pp.
Intergovernmental Panel on Climate Change, Scientific Assessment of Climate Change, IPCC Report, May 25, 1990.
Steinberg, M., Cheng, H.C., and Horn, F., Systems Study for the Removal, Recovery, and Disposal of Carbon Dioxide from Fossil Fuel Power Plants in the U.S., the United States Department of Energy Contract Number AC02-76CH00016, December, 1984.
U.S. Department of Energy, Global Climate Change: A Fossil Energy Perspective, Contract W-31-109-Eng-38, 1989.
U.S. Department of Energy, Global Climate Change: A Fossil Energy Perspective, Contract W-31-109-Eng-38, 1989.
Van der Meer L.G.H., CO2 Transport in the Subsurface, Proceedings of the International Symposium on CO2 Fixation and Efficient Utilization of Energy, 1993.


![Greenhouse Gas Emissions and Emissions Trading in North … · 2020. 2. 23. · 2002] Stephenson-Greenhouse Gas Emissions, Kyoto and U.S. Response 45 greenhouse gas molecules. This](https://img.pdfslide.us/doc/110x75/60facf56e286b02f9b10de99/greenhouse-gas-emissions-and-emissions-trading-in-north-2020-2-23-2002-stephenson-greenhouse.jpg)