Embed Size (px)
Citation preview
REDUCINGRURALPOVERTYINVIETNAM
Issues,Policies,Challenges
Ngo Ha Quyen
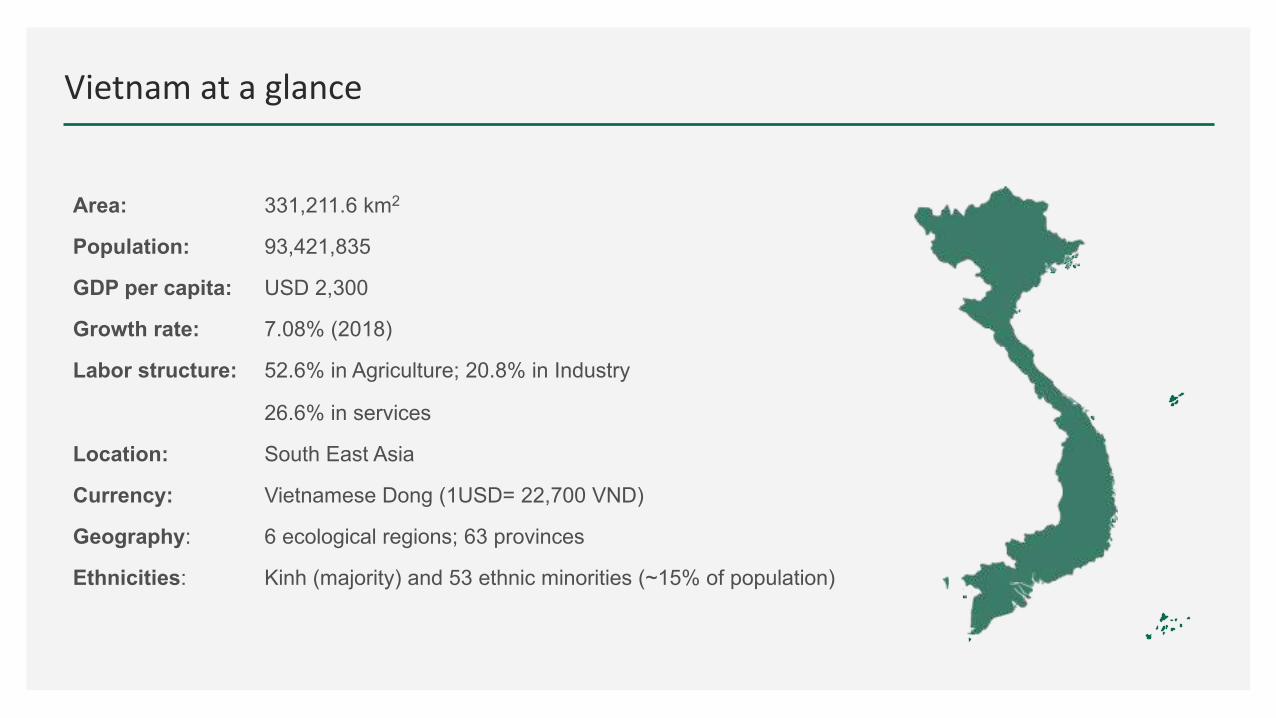
Vietnamataglance
Area: 331,211.6 km2
Population: 93,421,835
GDP per capita: USD 2,300
Growth rate: 7.08% (2018)
Labor structure: 52.6% in Agriculture; 20.8% in Industry
26.6% in services
Location: South East Asia
Currency: Vietnamese Dong (1USD= 22,700 VND)
Geography: 6 ecological regions; 63 provinces
Ethnicities: Kinh (majority) and 53 ethnic minorities (~15% of population)
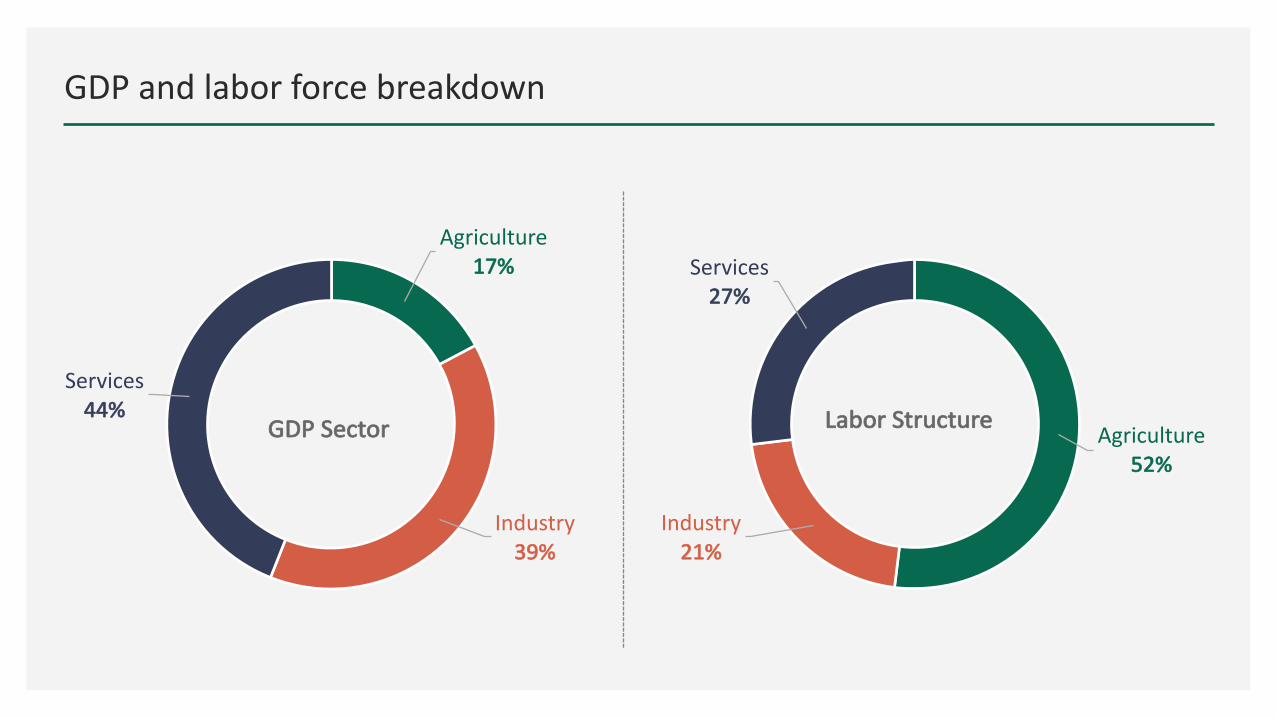
GDPandlaborforcebreakdown
Agriculture
17%
Industry
39%
Services
44%GDPSector Agriculture
52%
Industry
21%
Services
27%
LaborStructure
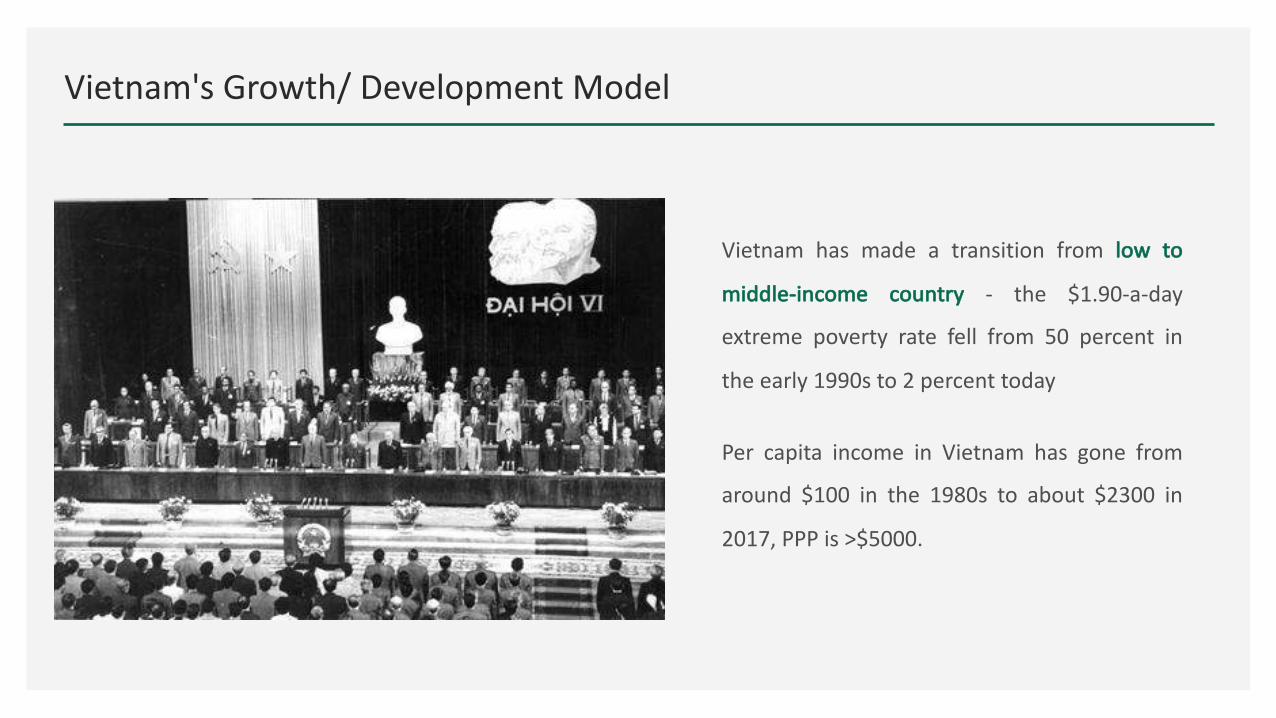
Vietnam'sGrowth/DevelopmentModel
Vietnam has made a transition from low to
middle-income country - the $1.90-a-day
extreme poverty rate fell from 50 percent in
the early 1990s to 2 percent today
Per capita income in Vietnam has gone from
around $100 in the 1980s to about $2300 in
2017, PPP is >$5000.
Vietnam'sGrowth/DevelopmentModel
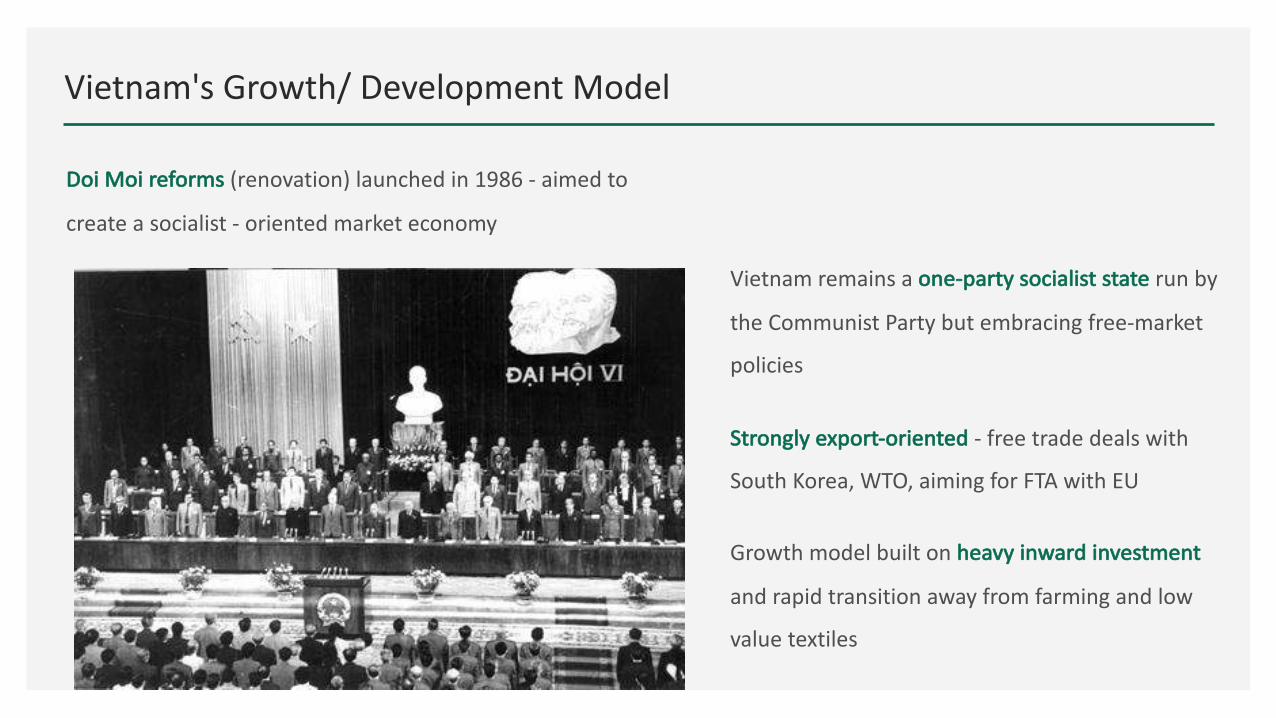
DoiMoireforms (renovation)launchedin1986- aimedto
createasocialist- orientedmarketeconomy
Vietnamremainsaone-partysocialiststate runby
theCommunistPartybutembracingfree-market
policies
Stronglyexport-oriented - freetradedealswith
SouthKorea,WTO,aimingforFTAwithEU
Growthmodelbuiltonheavyinwardinvestment
andrapidtransitionawayfromfarmingandlow
valuetextiles
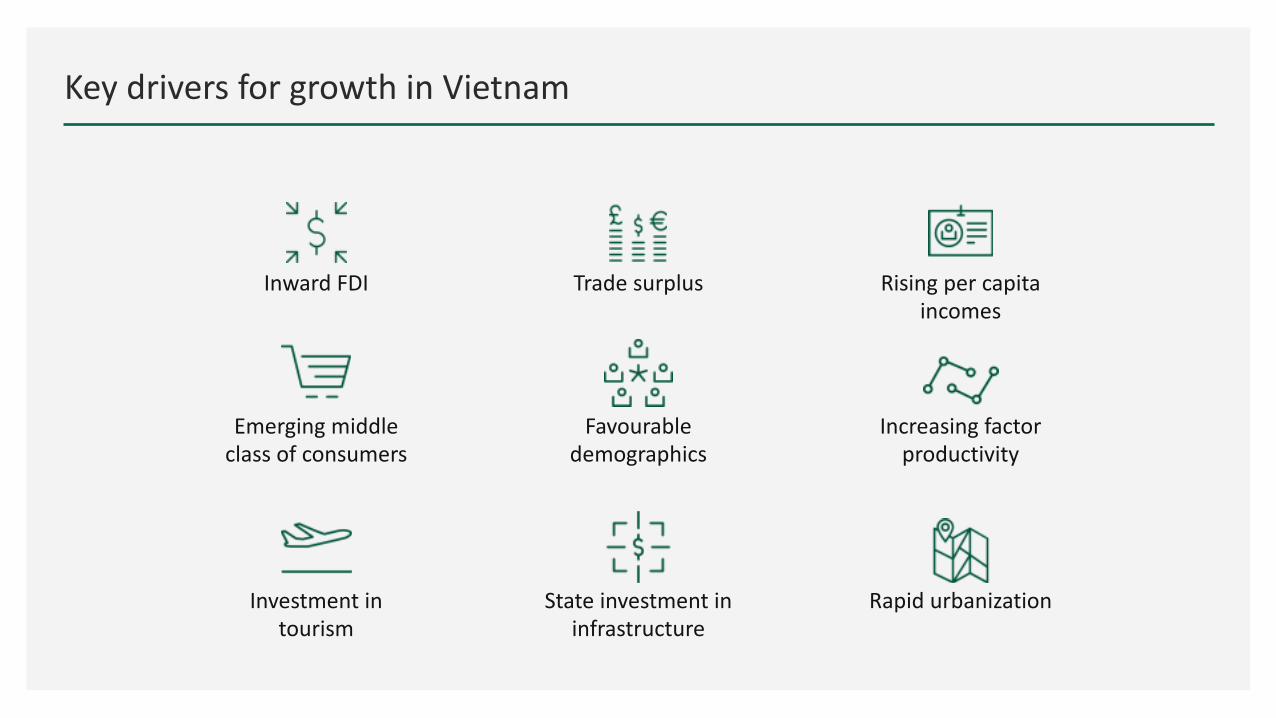
KeydriversforgrowthinVietnam
InwardFDI Tradesurplus Risingpercapita
incomes
Emergingmiddle
classofconsumers
Favourable
demographics
Increasingfactor
productivity
Stateinvestmentin
infrastructure
RapidurbanizationInvestmentin
tourism
PovertyReduction
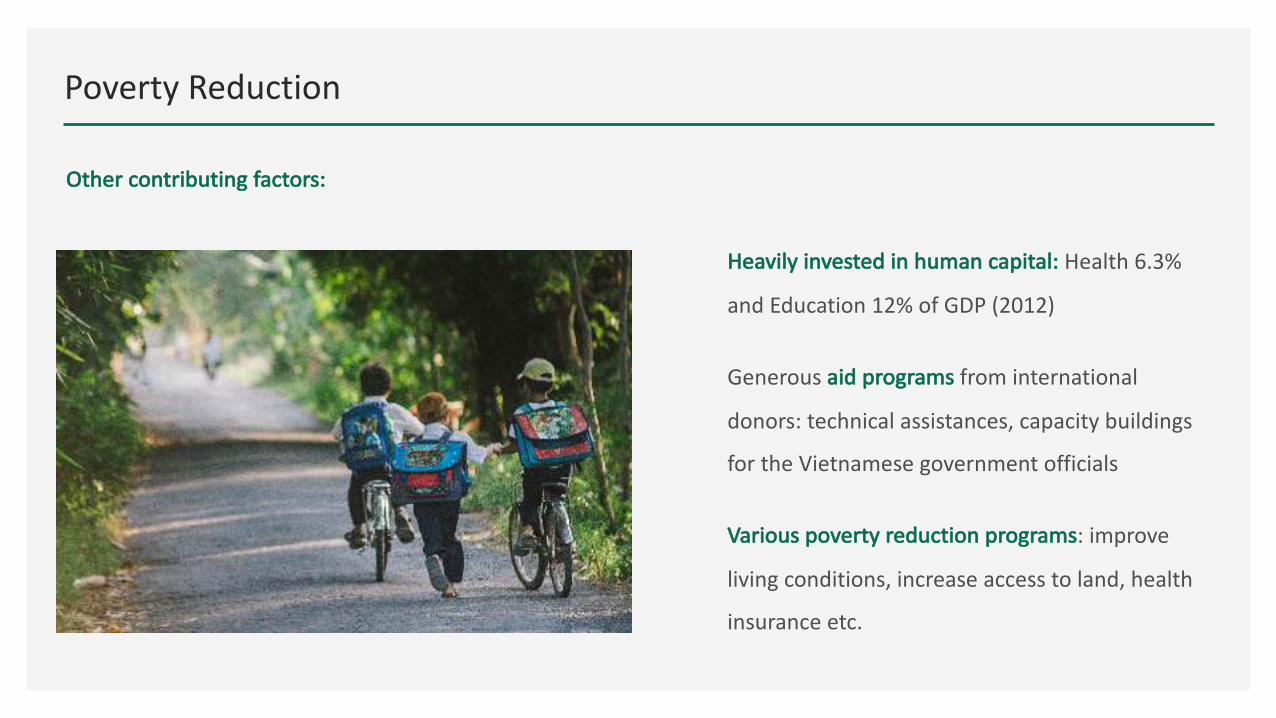
Othercontributingfactors:
Heavilyinvestedinhumancapital:Health6.3%
andEducation12%ofGDP(2012)
Generousaidprogramsfrominternational
donors:technicalassistances,capacitybuildings
fortheVietnamesegovernmentofficials
Variouspovertyreductionprograms:improve
livingconditions,increaseaccesstoland,health
insuranceetc.
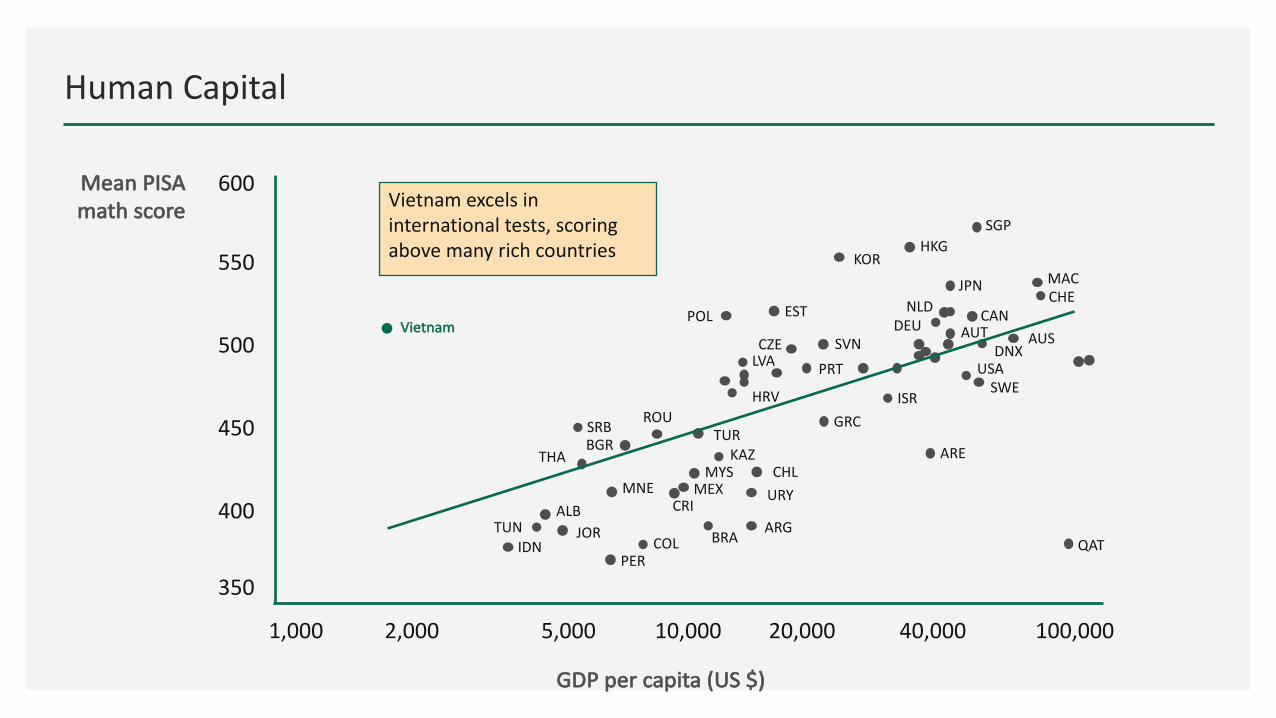
HumanCapital
Vietnamexcelsin
internationaltests,scoring
abovemanyrichcountries
GDPpercapita(US$)
MeanPISA
mathscore
POL EST
KORHKG
SGP
NLD
DEU
JPN MAC
CHE
AUSDNX
CAN
SWE
USA
ISR
GRC
ARE
SVN
PRT
CZELVA
HRV
AUT
ROUSRBBGR
THA
MNE
TUR
KAZCHL
URY
MYSMEX
CRI
ARGBRACOL
PER
JOR
ALBTUN
IDN
Vietnam
QAT
100,00040,00020,00010,0005,0002,0001,000
600
550
500
450
400
350
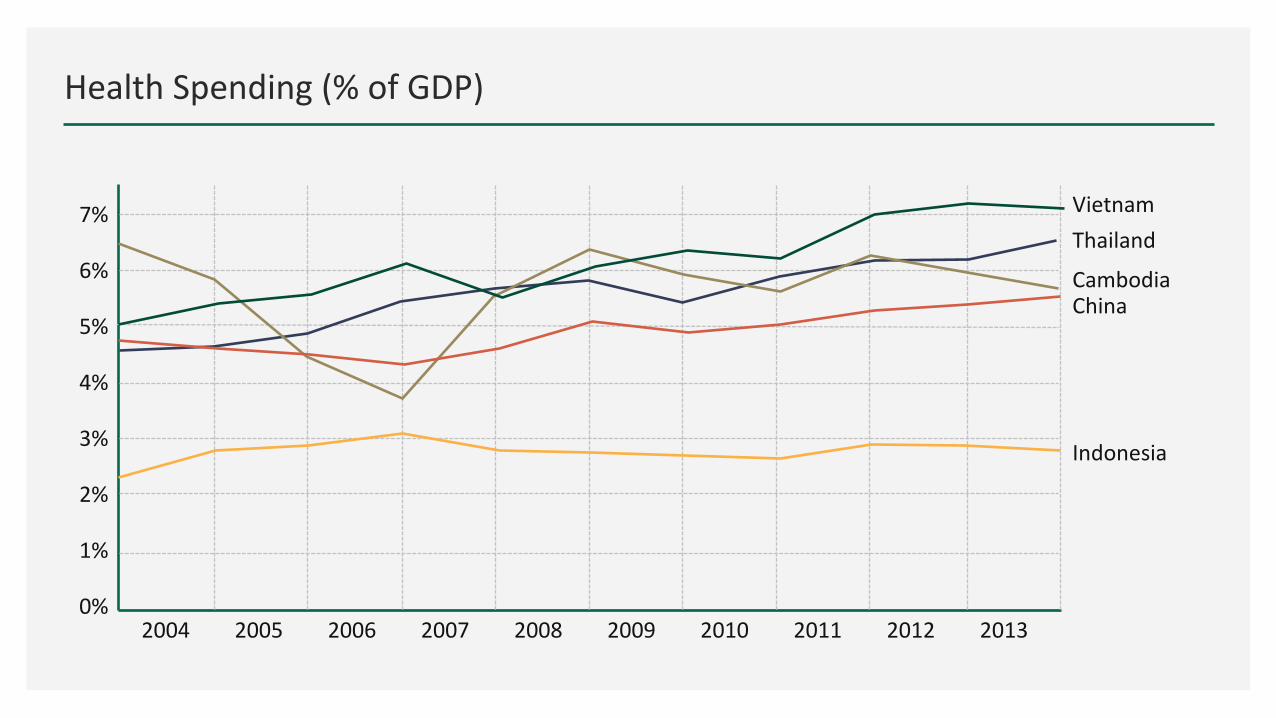
HealthSpending(%ofGDP)
Vietnam
Thailand
CambodiaChina
Indonesia
2004 2005 2006 2007 2008 2009 2010 2011 2012 20130%
1%
2%
3%
4%
5%
6%
7%
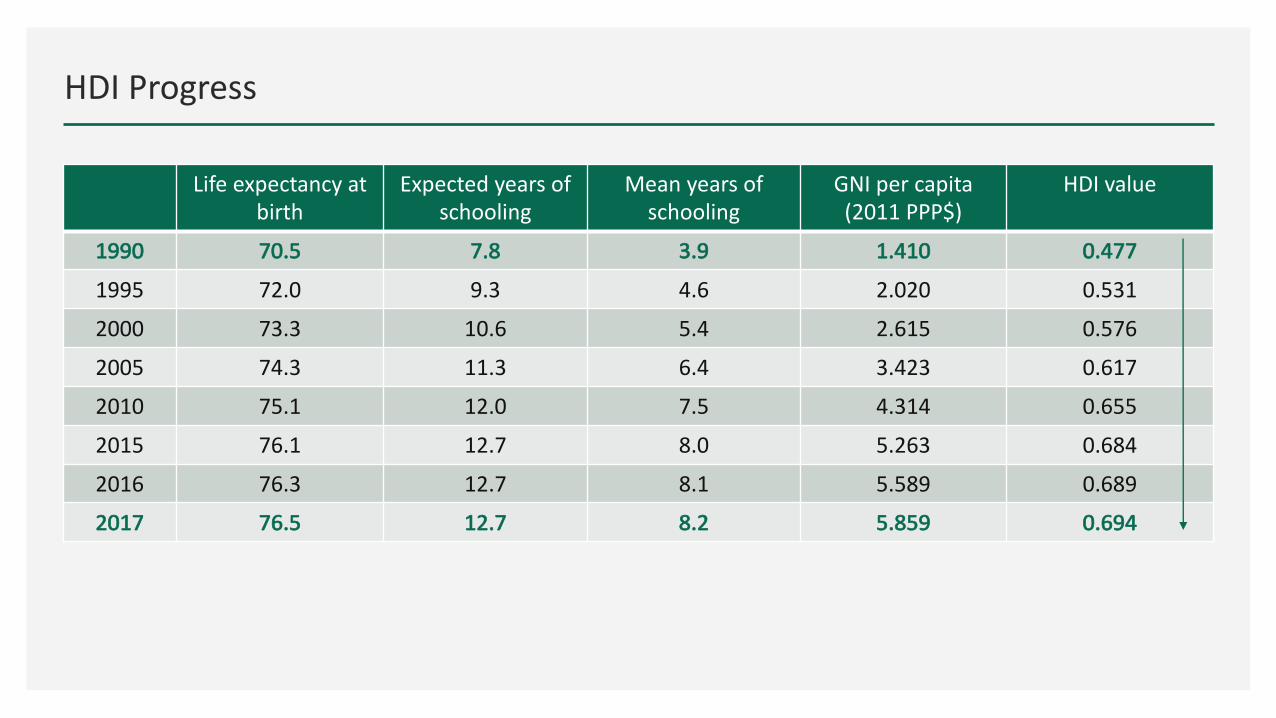
HDIProgress
Life expectancyat
birth
Expectedyearsof
schooling
Meanyearsof
schooling
GNIpercapita
(2011PPP$)
HDIvalue
1990 70.5 7.8 3.9 1.410 0.477
1995 72.0 9.3 4.6 2.020 0.531
2000 73.3 10.6 5.4 2.615 0.576
2005 74.3 11.3 6.4 3.423 0.617
2010 75.1 12.0 7.5 4.314 0.655
2015 76.1 12.7 8.0 5.263 0.684
2016 76.3 12.7 8.1 5.589 0.689
2017 76.5 12.7 8.2 5.859 0.694
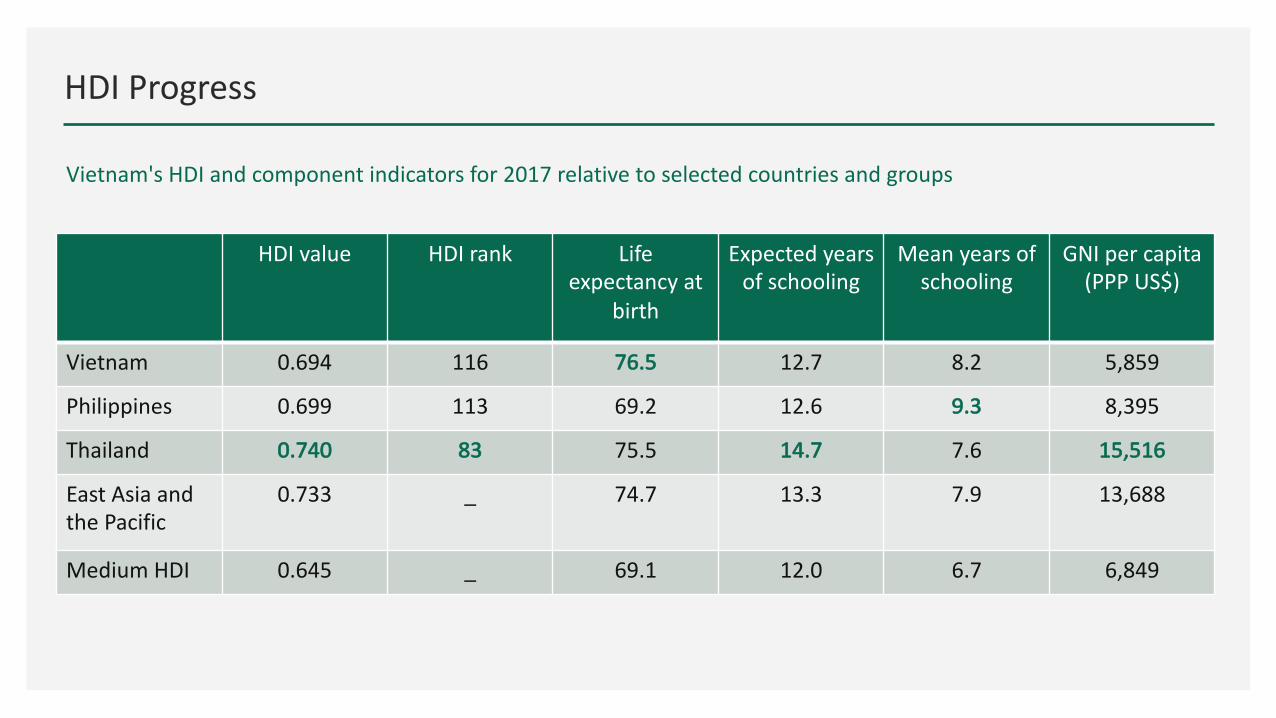
HDIProgress
HDIvalue HDIrank Life
expectancyat
birth
Expectedyears
ofschooling
Meanyearsof
schooling
GNIpercapita
(PPPUS$)
Vietnam 0.694 116 76.5 12.7 8.2 5,859
Philippines 0.699 113 69.2 12.6 9.3 8,395
Thailand 0.740 83 75.5 14.7 7.6 15,516
EastAsiaand
thePacific
0.733 _ 74.7 13.3 7.9 13,688
MediumHDI 0.645 _ 69.1 12.0 6.7 6,849
Vietnam'sHDIandcomponentindicatorsfor2017relativetoselectedcountriesandgroups
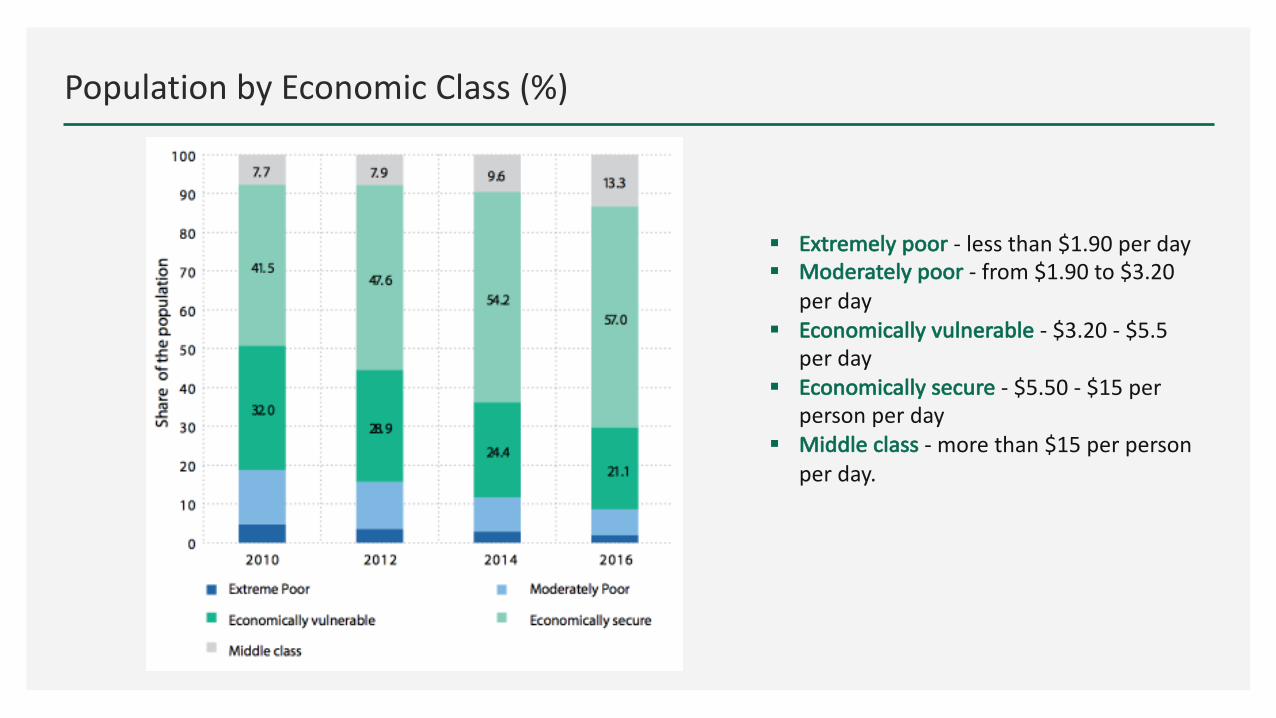
PopulationbyEconomicClass(%)
§ Extremelypoor - lessthan$1.90perday
§ Moderatelypoor - from$1.90to$3.20
perday
§ Economicallyvulnerable - $3.20- $5.5
perday
§ Economicallysecure - $5.50- $15per
personperday
§ Middleclass - morethan$15perperson
perday.
Povertyreductionremainsanissue…
Whoarethepoor?
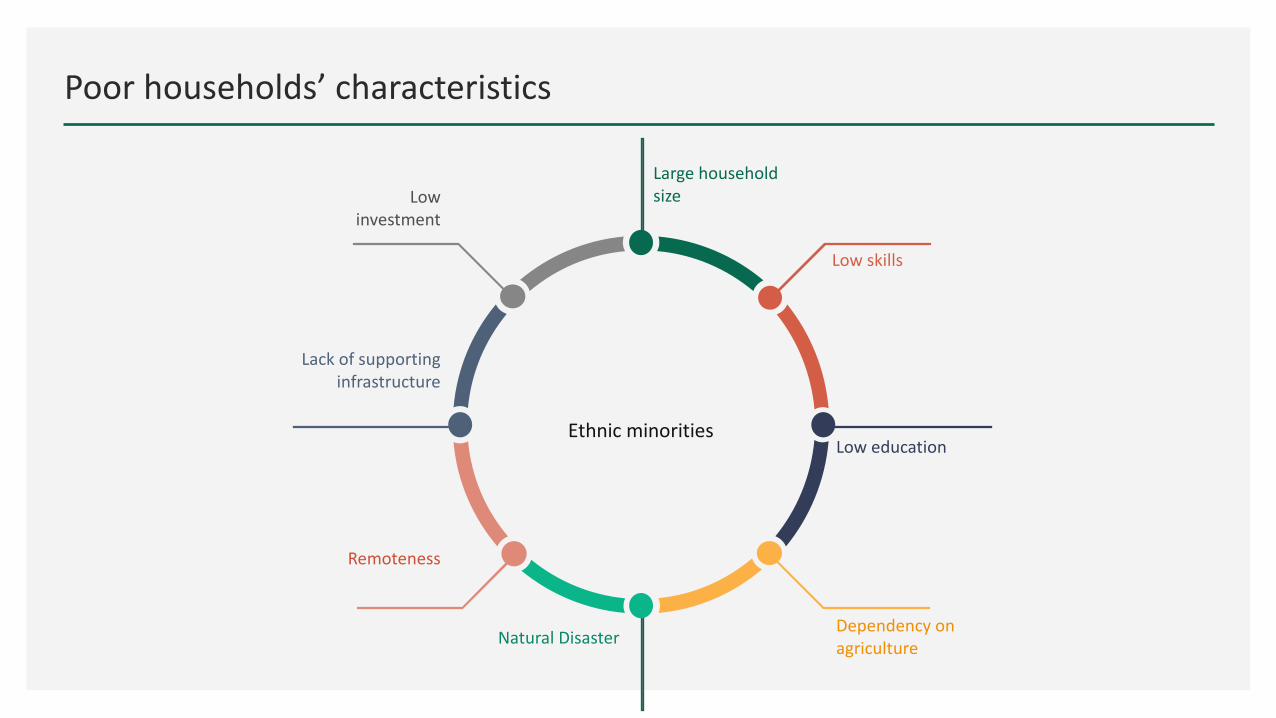
Poorhouseholds’characteristics
Largehousehold
size
Lowskills
Loweducation
Dependencyon
agricultureNaturalDisaster
Remoteness
Lackofsupporting
infrastructure
Low
investment
Ethnicminorities
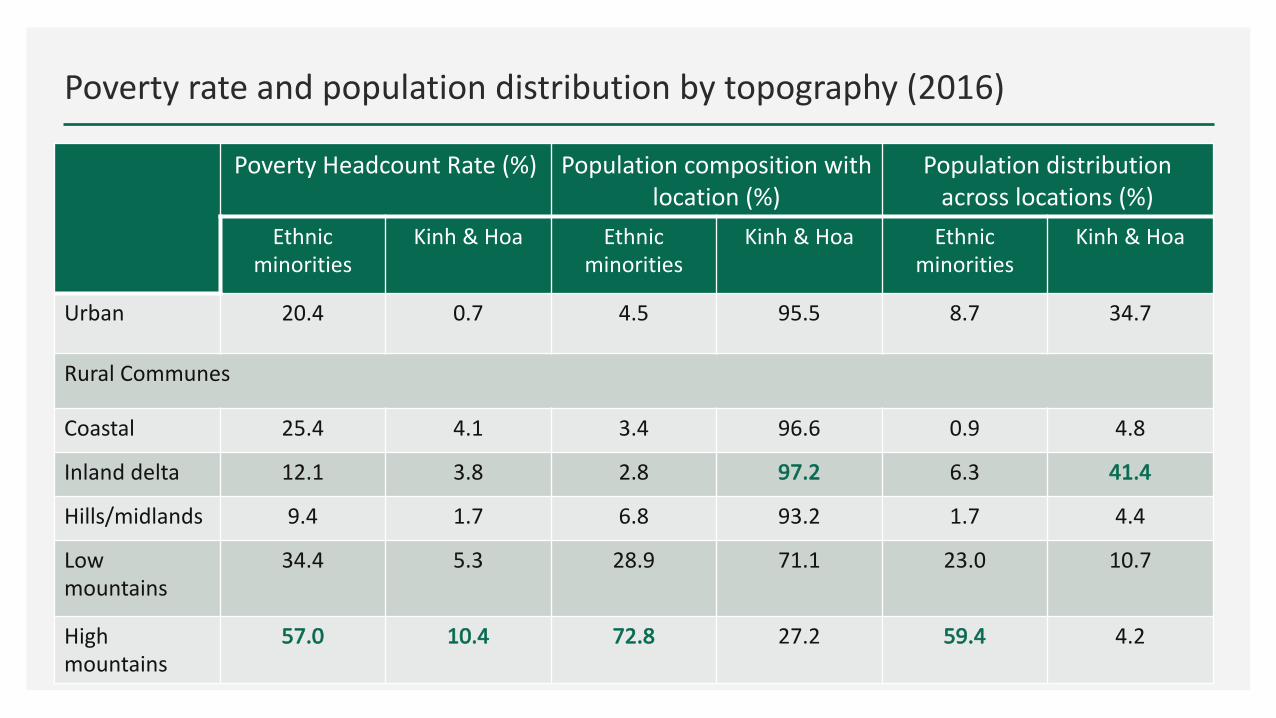
Povertyrateandpopulationdistributionbytopography(2016)
Source:Pimhidzai (2018)
PovertyHeadcountRate(%) Populationcompositionwith
location(%)
Population distribution
acrosslocations(%)
Ethnic
minorities
Kinh &Hoa Ethnic
minorities
Kinh &Hoa Ethnic
minorities
Kinh &Hoa
Urban 20.4 0.7 4.5 95.5 8.7 34.7
RuralCommunes
Coastal 25.4 4.1 3.4 96.6 0.9 4.8
Inlanddelta 12.1 3.8 2.8 97.2 6.3 41.4
Hills/midlands 9.4 1.7 6.8 93.2 1.7 4.4
Low
mountains
34.4 5.3 28.9 71.1 23.0 10.7
High
mountains
57.0 10.4 72.8 27.2 59.4 4.2
Issues,ChallengesandPolicies
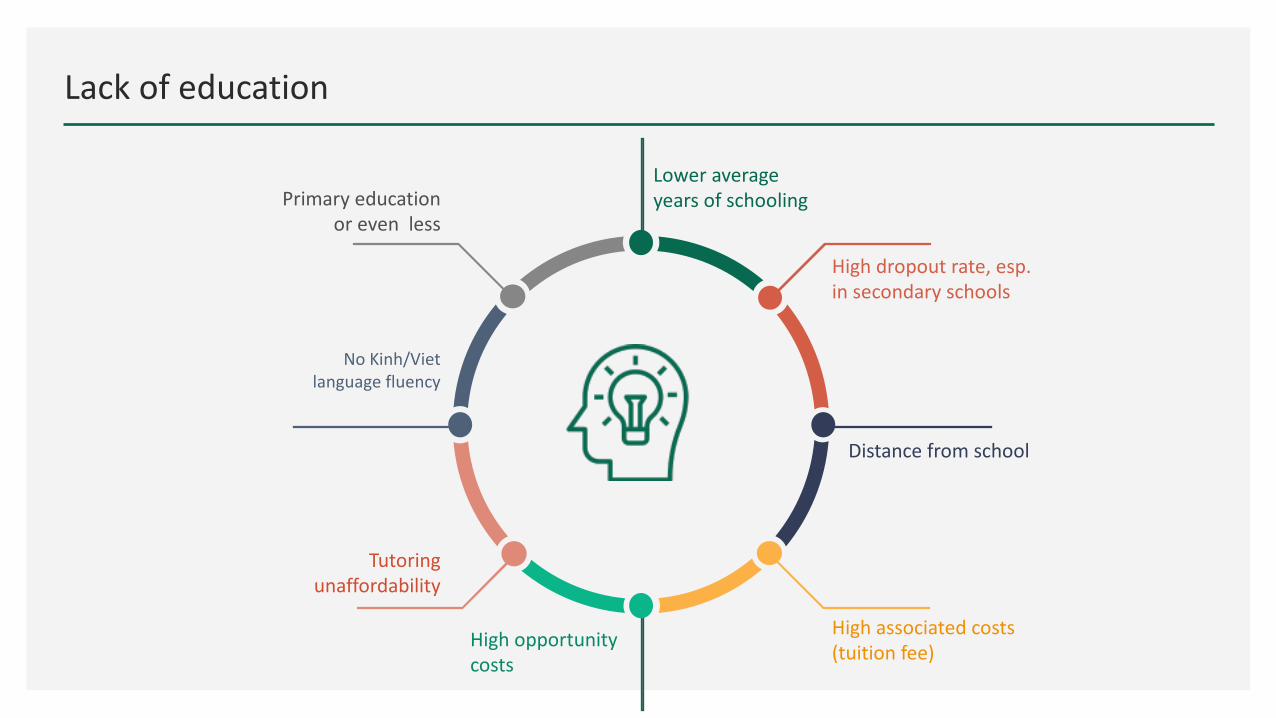
Lackofeducation
Loweraverage
yearsofschooling
Highdropoutrate,esp.
insecondaryschools
Distancefromschool
Highassociatedcosts
(tuitionfee)Highopportunity
costs
Tutoring
unaffordability
NoKinh/Viet
languagefluency
Primaryeducation
orevenless
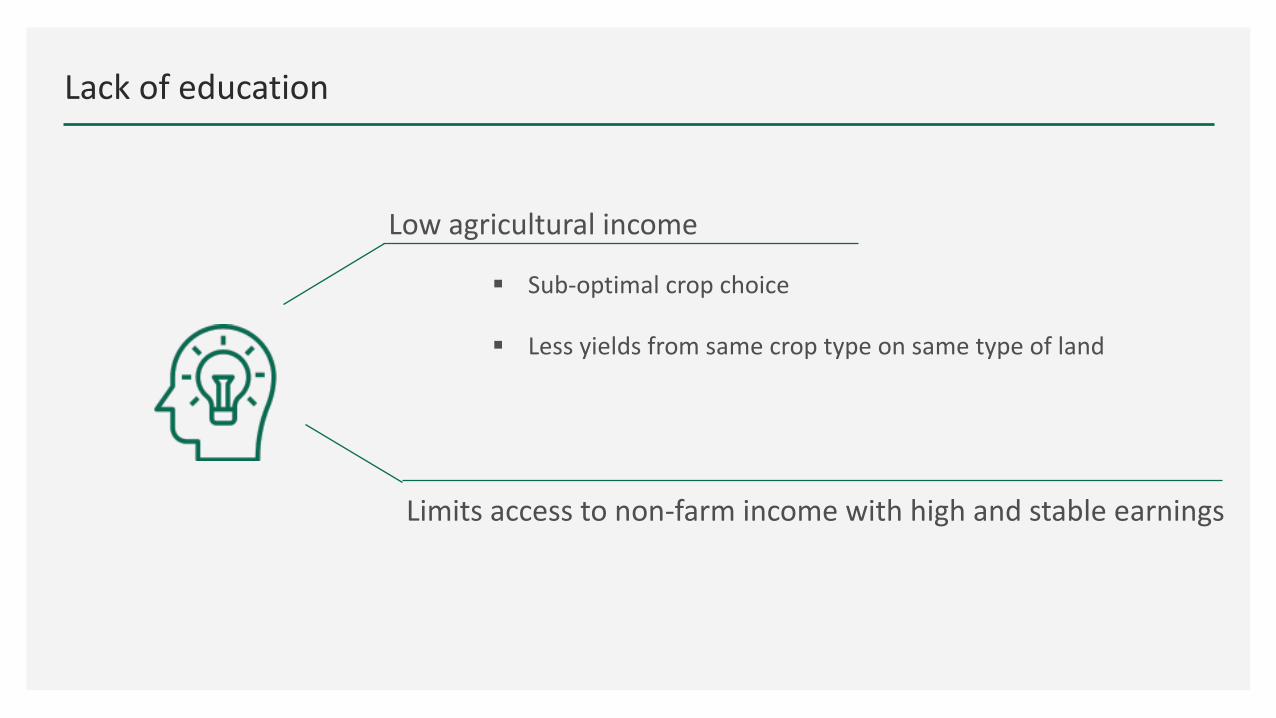
Lackofeducation
Limitsaccesstonon-farmincomewithhighandstableearnings
Lowagriculturalincome
§ Sub-optimalcropchoice
§ Lessyieldsfromsamecroptypeonsametypeofland
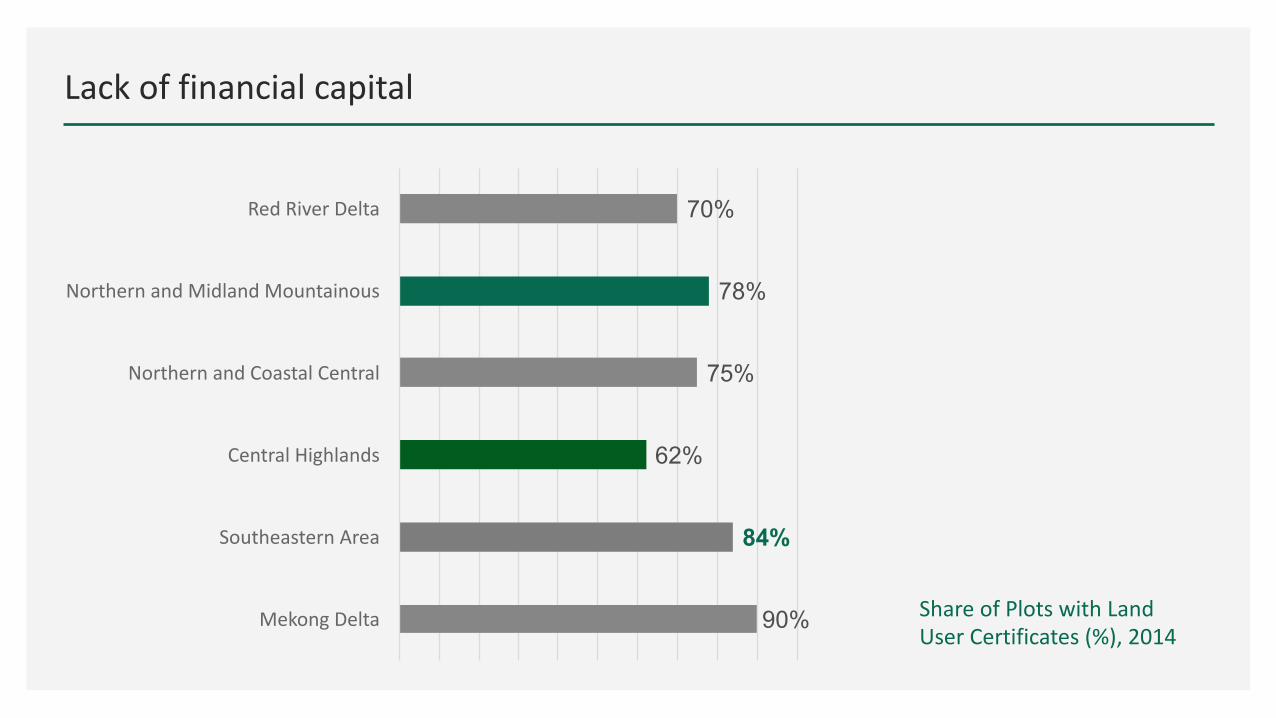
Lackoffinancialcapital
90%
84%
62%
75%
78%
70%
MekongDelta
SoutheasternArea
CentralHighlands
NorthernandCoastalCentral
NorthernandMidlandMountainous
RedRiverDelta
ShareofPlotswithLand
UserCertificates(%),2014
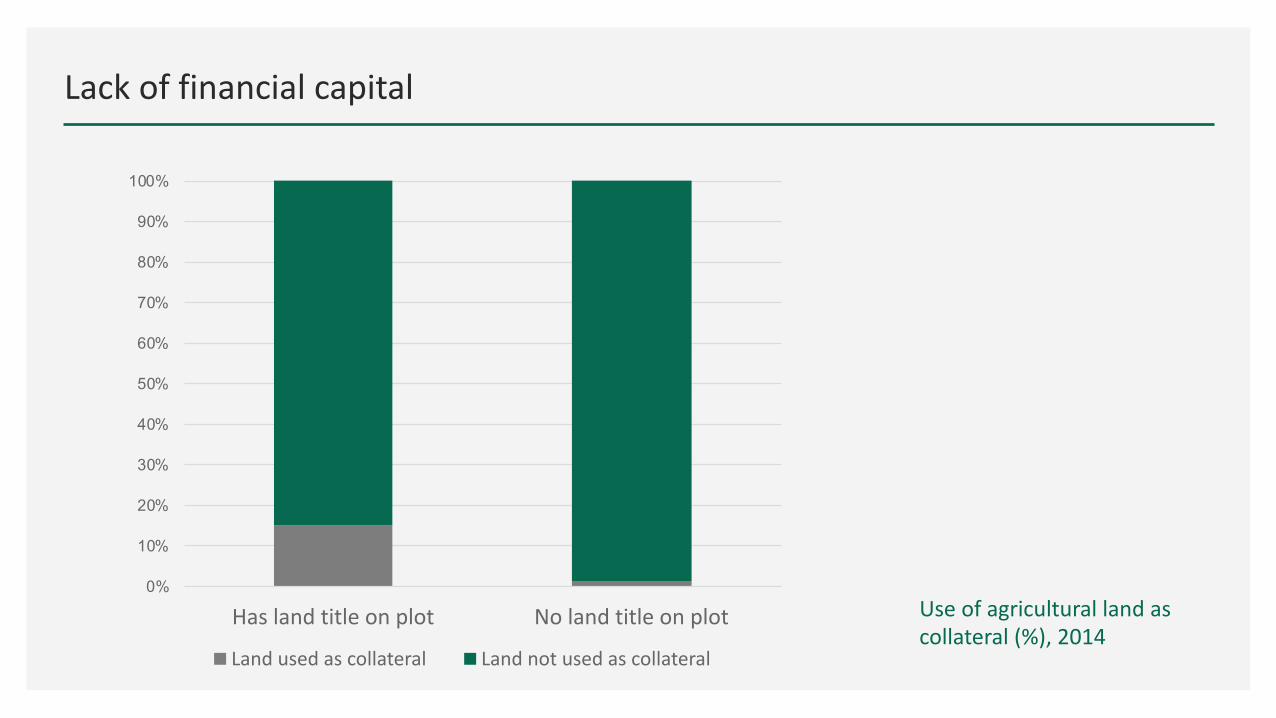
Lackoffinancialcapital
Useofagriculturallandas
collateral(%),2014
0%
10%
20%
30%
40%
50%
60%
70%
80%
90%
100%
Haslandtitleonplot Nolandtitleonplot
Landusedascollateral Landnotusedascollateral
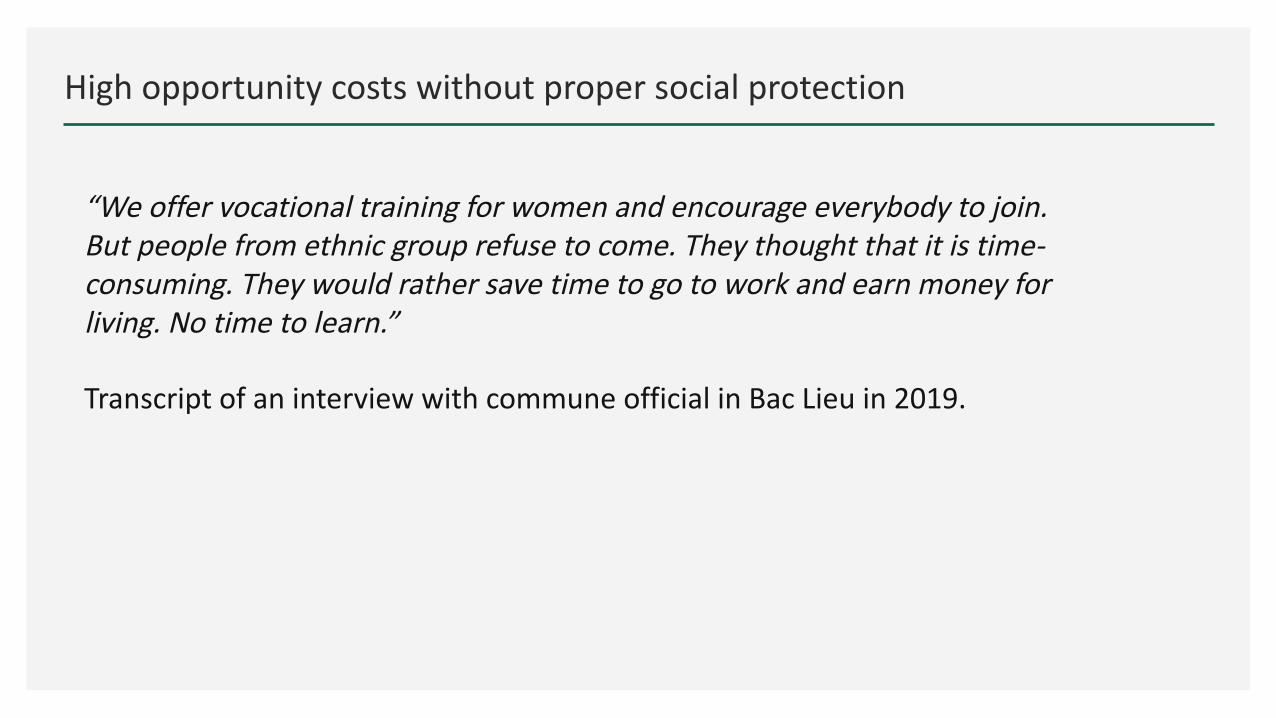
Highopportunitycostswithoutpropersocialprotection
“Weoffervocationaltrainingforwomenandencourageeverybodytojoin.
Butpeoplefromethnicgrouprefusetocome.Theythoughtthatitistime-
consuming.Theywouldrathersavetimetogotoworkandearnmoneyfor
living.Notimetolearn.”
TranscriptofaninterviewwithcommuneofficialinBacLieuin2019.
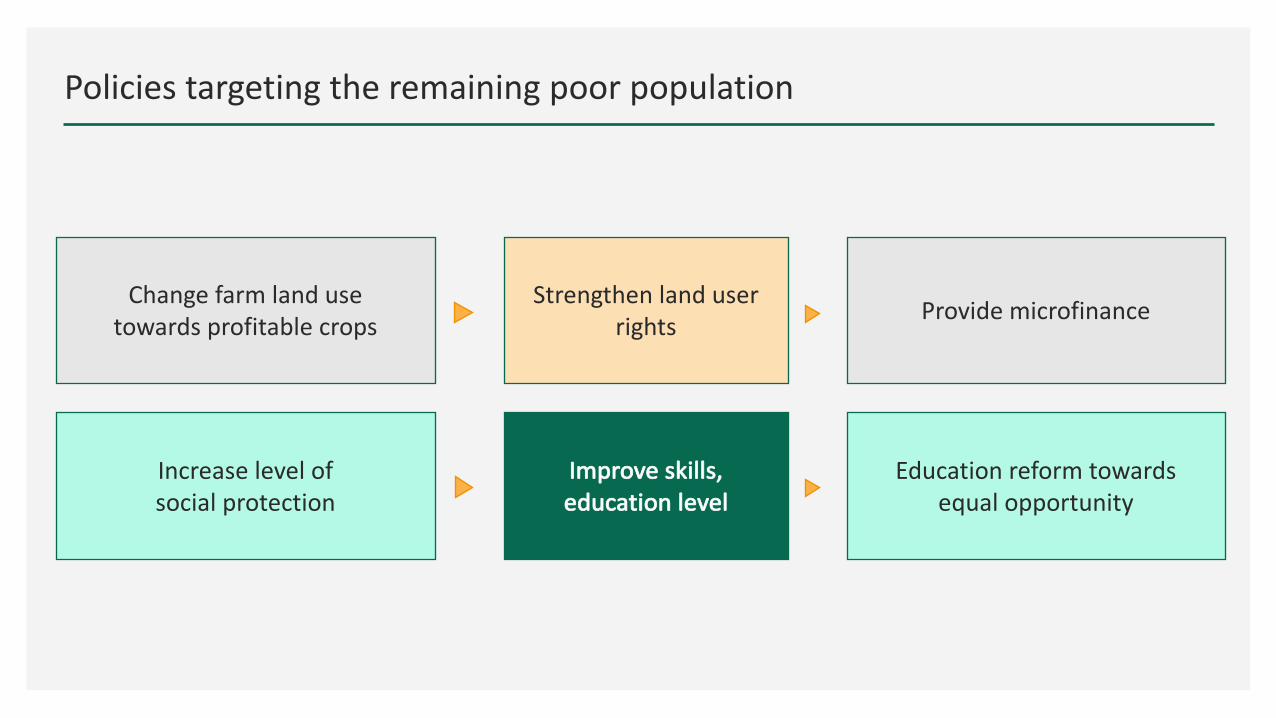
Policiestargetingtheremainingpoorpopulation
Changefarmlanduse
towardsprofitablecropsProvidemicrofinance
Increaselevelof
socialprotection
Educationreformtowards
equalopportunity
Strengthenlanduser
rights
Improveskills,
educationlevel
THANK YOU!