Embed Size (px)
Citation preview
1
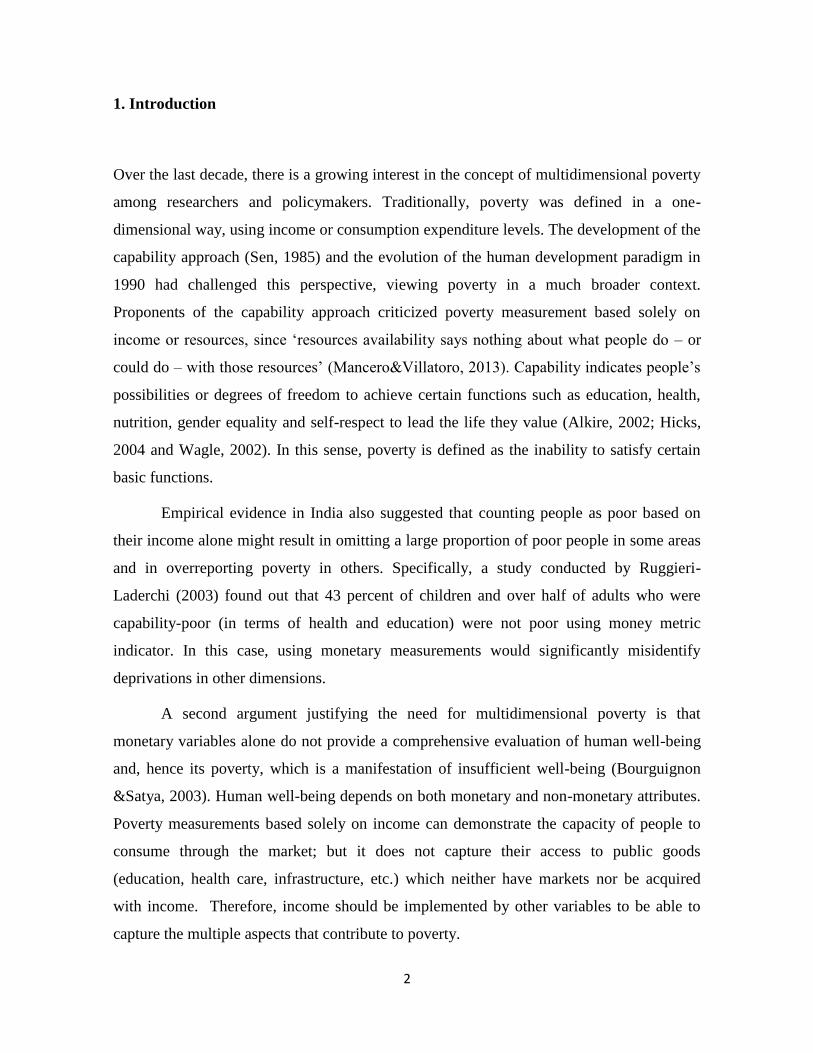
MULTIDIMENSIONAL POVERTY: EVIDENCE FROM VIETNAM
Ha Viet Le
Cuong Viet Nguyen
Tung DucPhung
Abstract
This study examines multidimensional poverty in Vietnam using the method of Alkire and
Foster (2007, 2011)and household data from Vietnam Household Living Standard Surveys
2010 and 2012. The poverty is analyzed in five dimensions includinghealth, education,
insurance and social support, living condition, and social participation. The result shows
that multidimensional poverty has decreased slightlyduring the 2010-2012 period. There is
a large difference between multidimensional poverty and expenditure/income based
poverty. While Northern Mountain isthe poorest region in terms of income or expenditure,
Mekong River Delta is the poorest region in terms ofmultidimensional poverty.The
decomposition analysis shows that the ethnic minority group has a small proportion of
population but contributes largely to the national multidimensional poverty. We also
decompose the total multidimensional poverty into the contribution of five dimensions. It
finds that the deprivation of dimension „Social insurance and social assistance‟ contributes
the most to the total poverty, while the deprivation of dimension „Living conditions‟
contributes the least to the total poverty.
Keywords: Multidimensional Poverty; Poverty; Food poverty; Household survey; Vietnam
JEL classification: I31, I32, O12
-------------
Authors are from Mekong Development Research Institute, Hanoi, Vietnam.
Email: [email protected]; [email protected]; [email protected]
2
1. Introduction
Over the last decade, there is a growing interest in the concept of multidimensional poverty
among researchers and policymakers. Traditionally, poverty was defined in a one-
dimensional way, using income or consumption expenditure levels. The development of the
capability approach (Sen, 1985) and the evolution of the human development paradigm in
1990 had challenged this perspective, viewing poverty in a much broader context.
Proponents of the capability approach criticized poverty measurement based solely on
income or resources, since „resources availability says nothing about what people do – or
could do – with those resources‟ (Mancero&Villatoro, 2013). Capability indicates people‟s
possibilities or degrees of freedom to achieve certain functions such as education, health,
nutrition, gender equality and self-respect to lead the life they value (Alkire, 2002; Hicks,
2004 and Wagle, 2002). In this sense, poverty is defined as the inability to satisfy certain
basic functions.
Empirical evidence in India also suggested that counting people as poor based on
their income alone might result in omitting a large proportion of poor people in some areas
and in overreporting poverty in others. Specifically, a study conducted by Ruggieri-
Laderchi (2003) found out that 43 percent of children and over half of adults who were
capability-poor (in terms of health and education) were not poor using money metric
indicator. In this case, using monetary measurements would significantly misidentify
deprivations in other dimensions.
A second argument justifying the need for multidimensional poverty is that
monetary variables alone do not provide a comprehensive evaluation of human well-being
and, hence its poverty, which is a manifestation of insufficient well-being (Bourguignon
&Satya, 2003). Human well-being depends on both monetary and non-monetary attributes.
Poverty measurements based solely on income can demonstrate the capacity of people to
consume through the market; but it does not capture their access to public goods
(education, health care, infrastructure, etc.) which neither have markets nor be acquired
with income. Therefore, income should be implemented by other variables to be able to
capture the multiple aspects that contribute to poverty.
3
Multidimensional poverty has gained prominence not only in academic discussion
but also in policy agenda, both nationally and internationally. For instance, in 2009,
Mexico‟s National Council for the Evaluation of Social Policy (CONEVAL) adopted a
multidimensional approach to measure the national poverty. In 2011, a five-dimensional
poverty reduction strategy was employed by the Government of Colombia, using a variant
of the Alkire and Foster (2011a) method to quantify progress (Ferreira & Lugo, 2012). At
international level, the UNDP started introducing multidimensional poverty in its 1997
Human Development Report. The Millennium Declaration and the Millennium
Development Goals also highlighted multidimensional poverty in the agenda since 2000
(United Nations, 2000). Recently, the UNDP has used the Multidimensional Poverty Index
(MPI) to measure poverty of 104 countries in its 2010 Human Development Report.
Since the pioneering works of Sen and Bourguignon &Satya, the literature on
multidimensional poverty has blossomed quickly, featuring a number of approaches to
measure or analyze poverty in more than one dimension of Gordon et al. (2003); Wagle
(2008); Maasoumi& Lugo (2008); Ravallion (2011) and Alkire& Foster (2011a), among
others. Most of the studies used education, health and living standards to define
multidimensional poverty. However, those studies differed in how they measure
multidimensional poverty. While some scholars, such as Bourguignon (2003), employed
the union approach (poor in any dimension), others advocated the intersection approach
(poor in two or more dimension) (Gordon et al, 2003) or relative approach (Wagle, 2008) in
defining the poverty line. Furthermore, while scholars like Alkire& Foster (2011a) and
Massoumi& Lugo (2008) favored the scalar indices which seek to combine, in a single
number, information from various poverty dimensions, Ravallion (2011), on the other hand,
proposed a dashboard approach, which emphasized the development of „the best possible
distinct measures of the various dimensions of poverty […] aiming for a credible set of
„multiple indices‟ rather than a single „multidimensional index‟‟‟ (Ravallion, 2011, p.13).
Viet Nam has been very successful in economic growth and poverty reduction over
the last decade. The poverty rate decreased from 58.1 percent in 1993 to 14.5 percent in
2008 and to about 10 percent in 2012. Poverty rate has declined in all population groups,
both in urban and rural areas, among the Kinh majority and the ethnic minorities, and in all
geographical regions. The poverty rate decreased from 58.1 percent in 1993 to 14.5 percent
4
in 2008 and to about 10 percent in 2012. The depth of poverty, measured by the poverty
gap index and poverty severity index, also decreased remarkably for the whole country as
well as different population groups and geographic areas (World Bank, 2013).
Despite of successes in poverty reduction, there are still a large number of
challenges for Vietnam in sustaining the achieved results in poverty reduction. Firstly,
poverty rate remains very high in remote areas where there is a high proportion of ethnic
minorities. In some areas, more than 80 percent of people remain to live below the poverty
line (Lanjouw et al., 2013; Nguyen et al., 2015). Secondly, poverty is not
sustainable.According to the Vietnam Household Living Standard Surveys 2010 and 2012,
the proportion of non-poor households in 2010 falling back into poverty in 2012account for
around 30 percent of the total number of poor households in 2012 (Nguyen et al.,
2014).Thirdly, there are poverty issues in urban areas, where there are a large number of
migrants working in informal sector. They are vulnerable to poverty, but not supported by
social assistance programs (Nguyen et al., 2012).
To reduce the poverty sustainably, there has been an increasing attention in the
approach of multidimensional poverty in Vietnam. It is consistently agreed among
researchers and policy makers in Viet Nam that poverty is a multi-faceted phenomena and
insufficient income is not perfectly coincident with the multidimensional poverty. For
example, a significant number of children in non-poor households by the income poverty
line have not attended schools. According to VHLSS 2012 statistics, about 66% of children
who already left out of school belong to non-poor households. Poverty can be more
sustainably reduced if all the dimensions of the poverty such as education, healthcare, and
living conditions are taken into account in measuring and designing social assistance
policies.
In Viet Nam, the multidimensional poverty has been studied in few studies.
UNICEF (2008) measures to measure child poverty in a multidimensional approach using
Multiple Indicator Cluster Surveys (MICS). UNDP (2010) estimate Multidimensional
Poverty Index using data from the Urban Poverty Survey in Ha Noi and Ho Chi Minh City
in 2009-2010.
5
In this study, we will examine the multidimensional poverty in Vietnam using the
Vietnam Household Living Standard Surveys 2010 and 2012. We will apply a widely-used
method of Alkire and Foster(2007, 2011).Compared with previous studies on
multidimensional poverty in Vietnam, this study has several different aspects. Firstly, we
will the nationally representative surveys (VHLSSs) to examine the multidimensional
poverty of the whole country and different geographic regions and population groups over
the period 2010-2012. Previous studies tend to focus the analysis of multidimensional
poverty for specific regions (for example for Hanoi and Ho Chi Minh city in UNDP (2010))
or groups of population (for example for children in UNICEF (2008)). Secondly, we
conduct a decomposition analysis to examine the contribution to the total multidimensional
poverty of different regions and groups of population. Thirdly, we investigate the difference
in the estimate of multidimensional poverty and the estimates of income and expenditure
poverty.
The paper comprises of five sections. The second section introduces data sets used
in this study. The third section presents the estimation method ofAlkire and Foster(2007,
2011). The fourth section presents the empirical results. Finally, conclusion and policy
recommendations are presented in the fifth section.
2. Data set
In this study, to measure the multidimensional poverty in Vietnam, we use Vietnam
Household Living Standards Survey (VHLSSs) in 2010 and 2012. The surveys was
conducted by the General Statistics Office of Vietnam (GSO) every two years. The most
recent VHLSS were conducted in 2010 and 2012. Each survey covered 9,399 households.
The sample is representative for the whole country, rural and urban areas, and six
geographic regions.
The VHLSSs are widely used in Vietnam for poverty and living standard analysis.
The VHLSSs contain detailed data on household living standards including basic
demography, employment and labor force participation, education, health, income,
6
expenditure, housing, fixed assets and durable goods, participation of households in
poverty alleviation programs.
3. Alkire-Foster’s Method
Recently, the Alkire and Foster method has attracted a great international attention for it is
a simple tool for measuring and ranking multi-dimensional poverty(Alkireand Foster, 2007,
2011). The method have been applied to analyze poverty in a large number of countries.
The method is started with identifying number of dimensions included in multidimensional
poverty analysis. Basic dimensions may include health, education, living standards etc.
Each dimension is measured by component indicators (denoted as Ik). The next step is to
define threshold of deprivation of each component indicator. When thresholds of
deprivation of component indicators are available, we can estimate deprivation score of
household i with the formula of:
K
k
kiki Iwc1
(1)
Where wk is weight of component indicator Iki, Iki is value of component k of household i,
and K is number of total components. Component Ikiis defined as a binary indicator with 1
denoted deprivation and 0 otherwise.Values of weights depends on number of dimensions
and numbers of component indicators within each dimension. Weights are often sumed to
be 1, 11
K
k
kw .
Higher value of the deprivation score c means the higher level of deprivation or
higher multidimensional poverty.To estimate the poverty rate under the method of Alkire
and Foster (2007, 2011), we need to define the poverty cut-off, denoted as L. A household
is regarded as poor if its poverty score is higher than the cut-off, i.e Lci . For instance,
Alkire and Foster (2007, 2011) have employed a threshold of 1/3: households having the
deprivation score below this thresholds are classified as the multidimensional poor.
7
After calcuating the number of multidimensionally poor households, proportion of
the poor is estimated (normally called as headcount ratio, denoted as H):
n
qH (2)
Where q and n are the numbers of poor and total households respectively. Simply, the
poverty rate is calcuated by dividing the total poor people by the total population.
The headcount ratio cannot reflect the level or the depth of deprivation of poor
households as households deprived in all dimensions or households deprived in 1/L
dimensions are all regarded as the poor. The headcount ratio does not take into account
numbers of deprived dimensions of poor households. Consequently, Alkire and Foster
(2007, 2011) propose estimation of multidimensional poverty intensity A as:
n
Lc
A
n
i
i 1
)(
(3)
Where )(Lci is censored deprivation score, with:
ii cLc )( if the household is poor, Lci
0)( Lci if the household is non-poor, Lci
Finally, we have the Multidimensional Poverty Index (or adjusted headcount ratio)
as a product of the headcount ratio H and Poverty Intensity A:
MPI = H × A. (4)
The higher MPI, the higher level of multidimensional poverty. The MPI is different
from the headcount ratio H as it not only reflect the poverty ratio but also the deprivation
depth of the poor. Put differently, according to Alkire and Foster (2007, 2011), the MPI
reflect the ratio of multidimensionally poor population adjusted by the poverty intensity.
There is nostandard procedureindeterminingweightsforMDP
dimensionsandindicators. TheMDPmeasuresusingthe weightsdepend on
theprioritiesofnational, regional, provincial, basedontheextensive discussionandpolitical
consensus. It can be allocatedequalordifferent weights for poverty dimensions and
8
indicators ofeach dimension. Inthatwaythe allocation ofequallyweighted is common
methodusedinthecountry today. The advantage ofthismethodiseasy tointerpretandpresent
results. Therefore, inthe phase of research andinitial analysis, thedimensionalweightwillbe
distributedequally. Similarlyineach dimensionindicator‟sweights areequallydistributed.
4. Emprical analysis
4.1. Estimation of multidimensional poverty
A key challenge in multidimensional poverty analysis is to determine poverty dimensions
and poverty measurement indicators. In this study, we use several criteria to select
measurement indicators including (i) Directly reflect the needs of poor household/people;
(ii) Reflects welfare outcomes; (iii) Simple, easy to measure and feasibility of data
collection; (iv) Sensitivity to changing of policies; (v) There is international comparability.
After reviewing the legal documents in Vietnam and other emprical studies on
multidimensional poverty in other countries (for example see Alkire and Foster, 2007, 2011
for review), we select 5 dimensions for multidimensional poverty analysis as follows:
o Health
o Education
o Social insurance and social assistance
o Living conditions
o Access to information and social participation
The dimensions of Health, Education, Social insurance and social assistance, Living
conditionsreflect the access to basic social services of households. In addition, we also
propose the dimension of information access and social participation, since better access to
information and social network can increase other opportunities in employment and social
services for households.
Especially, there are no data from VHLSSs on indicators of the dimension „access
to information and social participation‟. Thus, we use private transfer receipt as a proxy
9
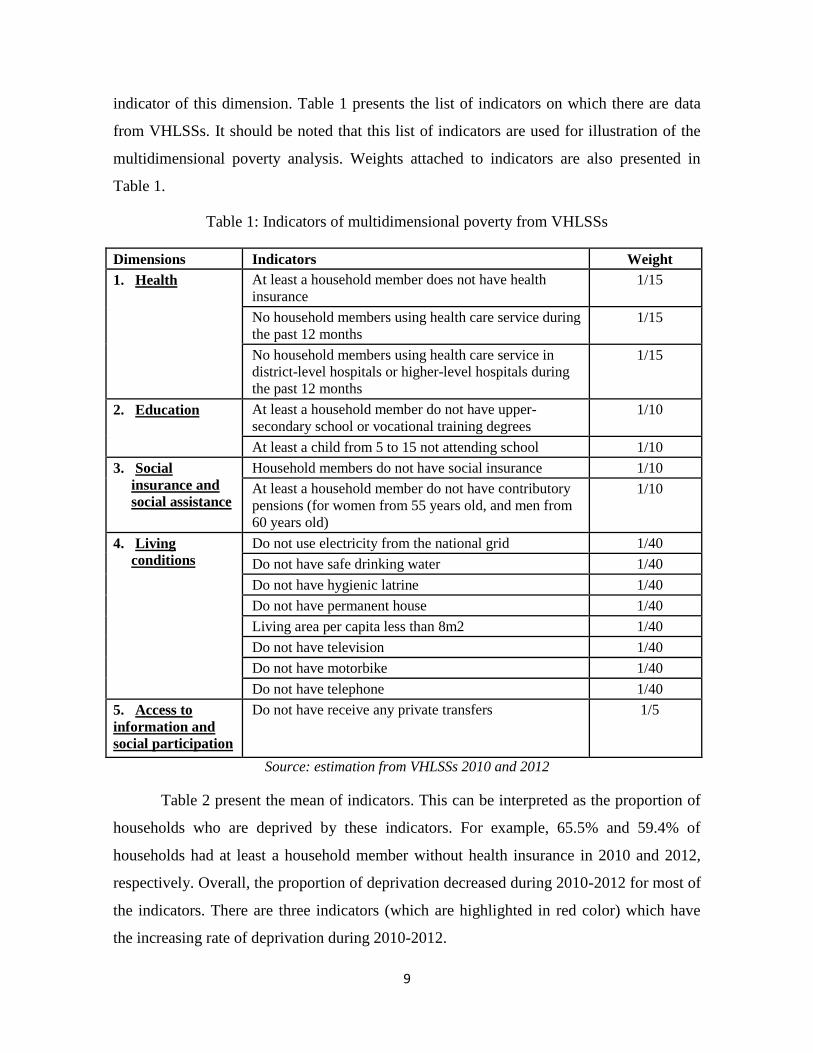
indicator of this dimension. Table 1 presents the list of indicators on which there are data
from VHLSSs. It should be noted that this list of indicators are used for illustration of the
multidimensional poverty analysis. Weights attached to indicators are also presented in
Table 1.
Table 1: Indicators of multidimensional poverty from VHLSSs
Dimensions Indicators Weight
1. Health
At least a household member does not have health
insurance
1/15
No household members using health care service during
the past 12 months
1/15
No household members using health care service in
district-level hospitals or higher-level hospitals during
the past 12 months
1/15
2. Education
At least a household member do not have upper-
secondary school or vocational training degrees
1/10
At least a child from 5 to 15 not attending school 1/10
3. Social
insurance and
social assistance
Household members do not have social insurance 1/10
At least a household member do not have contributory
pensions (for women from 55 years old, and men from
60 years old)
1/10
4. Living
conditions
Do not use electricity from the national grid 1/40
Do not have safe drinking water 1/40
Do not have hygienic latrine 1/40
Do not have permanent house 1/40
Living area per capita less than 8m2 1/40
Do not have television 1/40
Do not have motorbike 1/40
Do not have telephone 1/40
5. Access to
information and
social participation
Do not have receive any private transfers 1/5
Source: estimation from VHLSSs 2010 and 2012
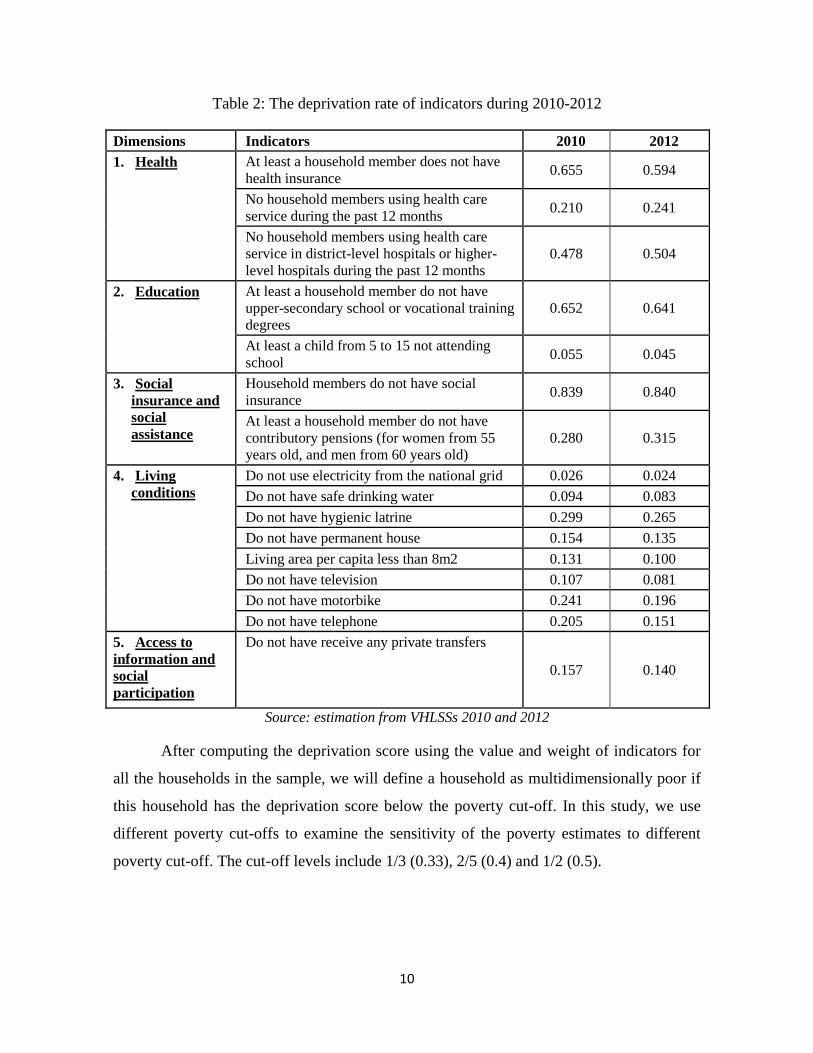
Table 2 present the mean of indicators. This can be interpreted as the proportion of
households who are deprived by these indicators. For example, 65.5% and 59.4% of
households had at least a household member without health insurance in 2010 and 2012,
respectively. Overall, the proportion of deprivation decreased during 2010-2012 for most of
the indicators. There are three indicators (which are highlighted in red color) which have
the increasing rate of deprivation during 2010-2012.
10
Table 2: The deprivation rate of indicators during 2010-2012
Dimensions Indicators 2010 2012
1. Health
At least a household member does not have
health insurance 0.655 0.594
No household members using health care
service during the past 12 months 0.210 0.241
No household members using health care
service in district-level hospitals or higher-
level hospitals during the past 12 months
0.478 0.504
2. Education
At least a household member do not have
upper-secondary school or vocational training
degrees
0.652 0.641
At least a child from 5 to 15 not attending
school 0.055 0.045
3. Social
insurance and
social
assistance
Household members do not have social
insurance 0.839 0.840
At least a household member do not have
contributory pensions (for women from 55
years old, and men from 60 years old)
0.280 0.315
4. Living
conditions
Do not use electricity from the national grid 0.026 0.024
Do not have safe drinking water 0.094 0.083
Do not have hygienic latrine 0.299 0.265
Do not have permanent house 0.154 0.135
Living area per capita less than 8m2 0.131 0.100
Do not have television 0.107 0.081
Do not have motorbike 0.241 0.196
Do not have telephone 0.205 0.151
5. Access to
information and
social
participation
Do not have receive any private transfers
0.157 0.140
Source: estimation from VHLSSs 2010 and 2012
After computing the deprivation score using the value and weight of indicators for
all the households in the sample, we will define a household as multidimensionally poor if
this household has the deprivation score below the poverty cut-off. In this study, we use
different poverty cut-offs to examine the sensitivity of the poverty estimates to different
poverty cut-off. The cut-off levels include 1/3 (0.33), 2/5 (0.4) and 1/2 (0.5).
11
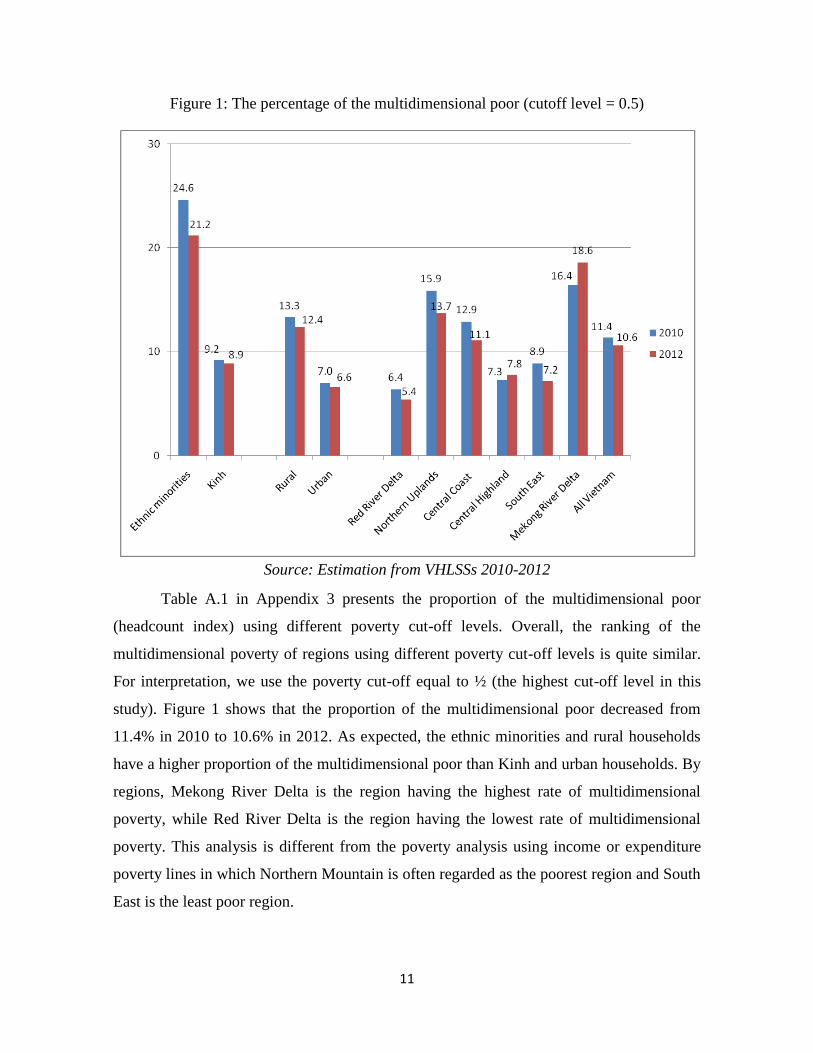
Figure 1: The percentage of the multidimensional poor (cutoff level = 0.5)
Source: Estimation from VHLSSs 2010-2012
Table A.1 in Appendix 3 presents the proportion of the multidimensional poor
(headcount index) using different poverty cut-off levels. Overall, the ranking of the
multidimensional poverty of regions using different poverty cut-off levels is quite similar.
For interpretation, we use the poverty cut-off equal to ½ (the highest cut-off level in this
study). Figure 1 shows that the proportion of the multidimensional poor decreased from
11.4% in 2010 to 10.6% in 2012. As expected, the ethnic minorities and rural households
have a higher proportion of the multidimensional poor than Kinh and urban households. By
regions, Mekong River Delta is the region having the highest rate of multidimensional
poverty, while Red River Delta is the region having the lowest rate of multidimensional
poverty. This analysis is different from the poverty analysis using income or expenditure
poverty lines in which Northern Mountain is often regarded as the poorest region and South
East is the least poor region.

12
As mentioned from the methodology section, the multidimensional poverty (or
headcount index) does not reflect the deprivation level or the depth of multidimensional
poverty. Thus, we compute the multidimensional poverty index (MPI) which is also called
the adjusted headcount index. In Appendix, Tables A.1, A.2 and A.3 present the headcount
index (H), the poverty intensity index (A), and the adjusted headcount index MPI under
different poverty cut-off levels. In Figure 2, we present the MPI using the cutoff level of ½.
By regions, Mekong River Delta is still the region having the highest MPI, followed by the
Northern Mountains and Uplands. Red River Delta has the lowest MPI. Ethnic minorities
and rural households have higher MPI than Kinh and urban households. However, the gap
between the urban and rural households as well as between ethnic minorities and Kinh is
much larger in the MPI than in the headcount index.
Figure 2: The multidimensional poverty index (MPI) (cutoff level = 0.5)
Source: Estimation from VHLSSs 2010-2012
13
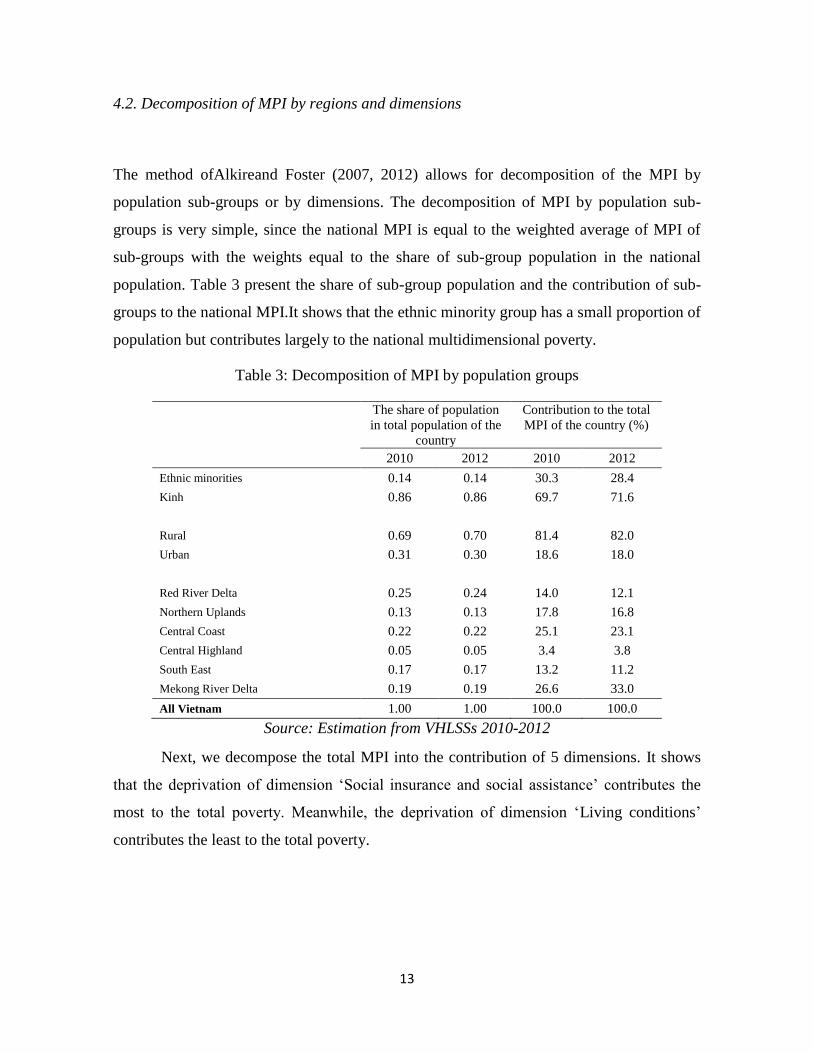
4.2. Decomposition of MPI by regions and dimensions
The method ofAlkireand Foster (2007, 2012) allows for decomposition of the MPI by
population sub-groups or by dimensions. The decomposition of MPI by population sub-
groups is very simple, since the national MPI is equal to the weighted average of MPI of
sub-groups with the weights equal to the share of sub-group population in the national
population. Table 3 present the share of sub-group population and the contribution of sub-
groups to the national MPI.It shows that the ethnic minority group has a small proportion of
population but contributes largely to the national multidimensional poverty.
Table 3: Decomposition of MPI by population groups
The share of population
in total population of the
country
Contribution to the total
MPI of the country (%)
2010 2012 2010 2012
Ethnic minorities 0.14 0.14 30.3 28.4
Kinh 0.86 0.86 69.7 71.6
Rural 0.69 0.70 81.4 82.0
Urban 0.31 0.30 18.6 18.0
Red River Delta 0.25 0.24 14.0 12.1
Northern Uplands 0.13 0.13 17.8 16.8
Central Coast 0.22 0.22 25.1 23.1
Central Highland 0.05 0.05 3.4 3.8
South East 0.17 0.17 13.2 11.2
Mekong River Delta 0.19 0.19 26.6 33.0
All Vietnam 1.00 1.00 100.0 100.0
Source: Estimation from VHLSSs 2010-2012
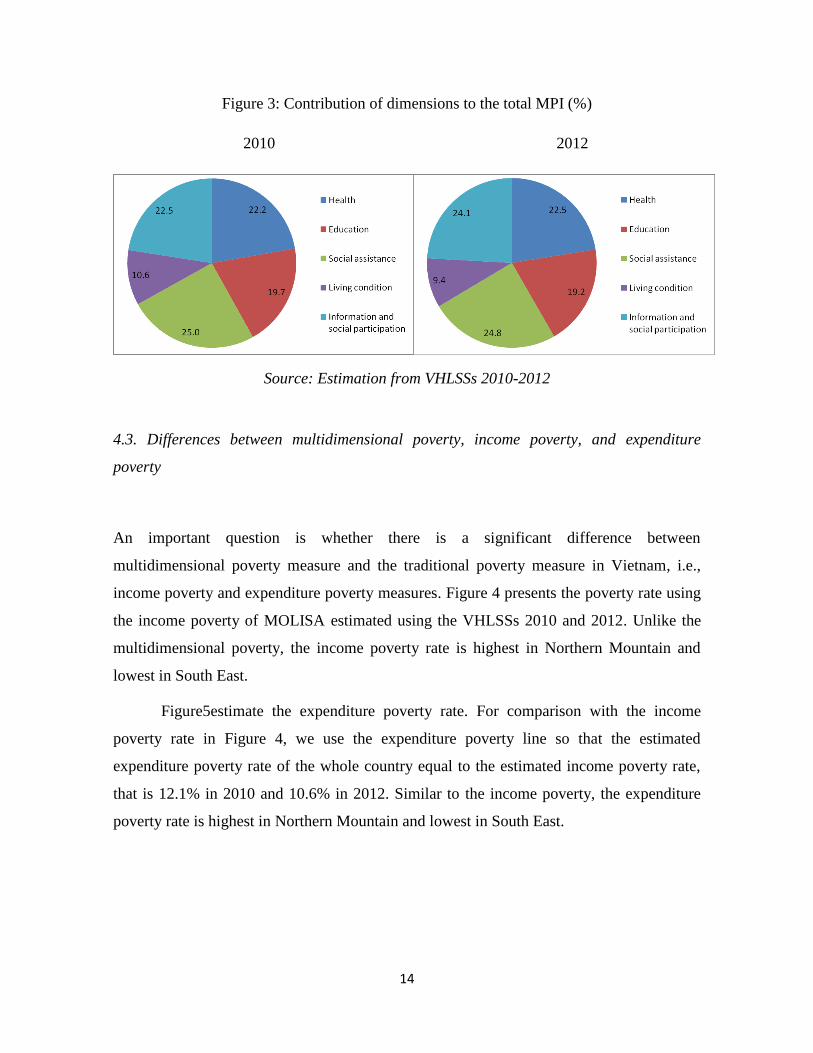
Next, we decompose the total MPI into the contribution of 5 dimensions. It shows
that the deprivation of dimension „Social insurance and social assistance‟ contributes the
most to the total poverty. Meanwhile, the deprivation of dimension „Living conditions‟
contributes the least to the total poverty.
14
Figure 3: Contribution of dimensions to the total MPI (%)
2010 2012
Source: Estimation from VHLSSs 2010-2012
4.3. Differences between multidimensional poverty, income poverty, and expenditure
poverty
An important question is whether there is a significant difference between
multidimensional poverty measure and the traditional poverty measure in Vietnam, i.e.,
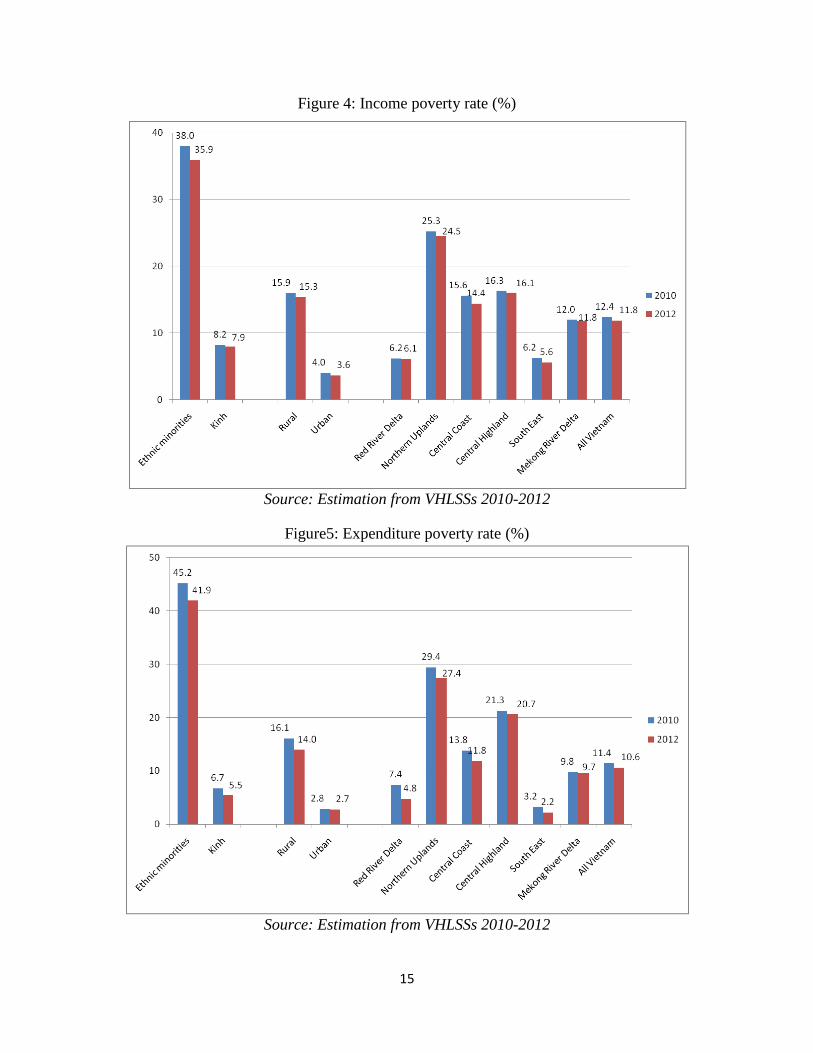
income poverty and expenditure poverty measures. Figure 4 presents the poverty rate using
the income poverty of MOLISA estimated using the VHLSSs 2010 and 2012. Unlike the
multidimensional poverty, the income poverty rate is highest in Northern Mountain and
lowest in South East.
Figure5estimate the expenditure poverty rate. For comparison with the income
poverty rate in Figure 4, we use the expenditure poverty line so that the estimated
expenditure poverty rate of the whole country equal to the estimated income poverty rate,
that is 12.1% in 2010 and 10.6% in 2012. Similar to the income poverty, the expenditure
poverty rate is highest in Northern Mountain and lowest in South East.
15
Figure 4: Income poverty rate (%)
Source: Estimation from VHLSSs 2010-2012
Figure5: Expenditure poverty rate (%)
Source: Estimation from VHLSSs 2010-2012

16
Figure 6 presents the comparison of the poverty classification using the income
poverty approach and the multidimensional poverty approach (using the cut-off level of ½).
There is a remarkable difference between the income poor and the multidimensional poor.
More specifically, only 2.2% of households are classified as the poor by both the income
approach and the multidimensional approach. This group should be supported by poverty
reduction and vocational training programs. Around 9.6% of households are classified as
the poor by the income approach but non-poor by the multidimensional approach. This
group can be provided with vocational training and other measures to support production
and employment. On the other hand, about 8.4% of households are classified as the poor by
the multidimensional approach but having income above the income poverty line. Programs
that increase access to basic social services should be provided for this group.
Figure6: Classification of household by multidimensional poverty and income poverty
Source: Estimation from VHLSSs 2010-2012
5. Conclusion
The poverty is a multidimensional phenomenon in which the income or expenditure
poverty is just one of many deprivations that the poor have to face. For example, there are
17
many children living in non-poor income or expenditure households but are still not in
school. Many non-poor income households but do not have safe water resources or
hygienic sanitation to use. The multidimensional poverty approach is consistent with
policies and practices of poverty in Viet Nam. The multidimensional poverty can sever to
identify objects for poverty reduction programs as well as monitoring the status of the
country and local‟s poverty reduction.
The method of Alkire and Foster (2007, 2011) is widely used to analyse
multidimensional poverty. According this method, poor people or poor households are
determined based on deprivation levels on poverty dimensions. Based on the data
availability from the 2010 and 2012 VHLSSs, five selected dimensions include Health care,
Education, Insurance and social support, Living condition, Information approach and social
participation. These dimensions are measured by 14 component indicators.
The result shows that multidimensional poverty has decreased in the 2010-2012
period. If we use the poverty cut-off equal to 0.5, the proportion of the multidimensional
poor decreased from 11.4% in 2010 to 10.6% in 2012. By regions, Mekong River Delta is
the region having the highest rate of multidimensional poverty, while Red River Delta is
the region having the lowest rate of multidimensional poverty. This analysis is different
from the poverty analysis using income or expenditure poverty lines in which Northern
Mountain is often regarded as the poorest region and South East is the least poor region.
The decomposition analysis shows that the ethnic minority group has a small
proportion of population but contributes largely to the national multidimensional poverty.
We also decompose the total multidimensional poverty into the contribution of 5
dimensions. It shows that the deprivation of dimension „Social insurance and social
assistance‟ contributes the most to the total poverty. Meanwhile, the deprivation of
dimension „Living conditions‟ contributes the least to the total poverty.
The analysis result also indicates that there is significant difference between
multidimensional poverty and income poverty (as well as expenditure poverty). Households
being poor by multidimensional poverty but not poor by income (and vice versa) accounted
for a large proportion, while households being poor in both multidimensional poverty and
18
income poverty were only a small proportion. This confirms income or expenditure only
reflectone-dimension in the needs of poor households.
The findings also indicate gaps of poverty reduction policies when the policies
support for health, education and living conditions have not covered all the deprivation
objects in these dimensions.The combination of identifying beneficiaries can rely on both
income and multidimensional poverty measure. The poor householdsin both income and
multidimensional are the poorest group, they need to be supported by many poverty
reduction policies including employment support and access to basic social services. The
group of households is classified as poor in income but not poor in multidimensional
poverty can be supported by policies to improve income as job training and job seeking
assistance. In contrast, the multidimensional poverty households but not poor in income can
get help by supporting policies to improve access to basic social services.
19
References
Alkire, S. (2002), Valuing Freedoms: Sen‟s Capability Approach and Poverty Reduction,
Oxford University Press.
Alkire, S. and Foster, J. E. (2007), „Counting and Multidimensional Poverty Measures‟,
Working Paper 7, Oxford, Poverty and Human Development Initiative, University of
Oxford.
Alkire, S. and Foster, J. E. (2011a), „Counting and Multidimensional Poverty
Measurement‟, Journal of Public Economics, Vol. 95, 476-487.
Alkire, S., J. Roche, M. Santos, and S. Seth (2011), “Multidimensional Poverty Index 2011:
Brief Methodological Note”, The Oxford Poverty and Human Development Initiative
(OPHI), Oxford Department of International Development Queen Elizabeth House,
University of Oxford
Bourguignon, F. &Satya, R.C. (2003), „The measurement of multidimensional poverty‟,
Journal of Economic Inequality, Vol 1(1), pp 25-49.
Chakravarty, S., Joseph. D, and Jacques, S. (2008), „On the Watts Multidimensional
Poverty Index and its Decomposition‟, World Development, Vol 36(6), pp. 1067-1077.
Dang, V., Do, T., Nguyen, C., Phung, T., and Phung, T., 2013. "Achievements and
challenges in the progress of reaching millennium development goals of Vietnam," MPRA
Paper 54207, University Library of Munich, Germany.
Deutsch, J. & Silber, J. (2005), „Measuring multidimensional poverty: An empirical
comparison of various approaches‟, Review of Income and Wealth, Vol 51(1), pp. 145-174.
Duclos, J.Y, Sahn, D. and Younger, S. (2006), „Robust multidimensional poverty
comparisons’, Economic Journal, Vol 116(514), pp. 943-968.
Ferreira, F. & Lugo, M.A. (2012), „Multidimensional Poverty Analysis: Looking for a
Middle ground‟, IZA Policy Paper No.45.
Gordon, D., Namdy, S., Pantazis, C., Pemberton, S., & Townsend, P. (2003), „The
distribution of child poverty in the developing world‟, Bristol: Centre for International
Poverty Research.
Hicks, D.A. (2004), „Inequalities, agency, and well-being: Conceptual Linkages and
Measurement Challenges in Development‟, WIDER Research Paper #31.
20
Lanjouw, P., Marra, M., and Nguyen, C. 2013. "Vietnam's evolving poverty map: patterns
and implications for policy," Policy Research Working Paper Series 6355, The World
Bank.
Maasoumi, E. & Lugo, M.A. (2008), „The information basis of Multivariate Poverty
Assessments’, in Quantitative Approaches to Multidimensional Poverty Measurement,
Kakwani& Silber (eds), Palgrave Macmillan.
Mancero, X. &Villatoro, P. (2013), „The multidimensional measurement of poverty‟, 12th
Meeting of the Executive Committee of the Statistical Conference of the Americas of the
Economic Commission for Latin America and the Caribbean.
Nguyen, C., Phung, T. and Westbrook, D., (2015) “Do the Poorest Ethnic Minorities
Benefit from a Large-Scale Poverty Reduction Program? Evidence from Vietnam', The
Quarterly Review of Economics and Finance, 56, 3-14.
Nguyen, C., Phung, T., and Tran, T. (2014), “Poverty reduction in Vietnam in the economic
slowdown”, Research report.
Nguyen, C., Vu, L., and Nguyen, T. 2012. "Urban poverty in Vietnam: determinants and
policy implications," International Journal of Development Issues, Emerald Group
Publishing, vol. 12(2), pages 110-139, June.
Ravallion, M. (2011), „On multidimensional indices of poverty‟, Journal of Economic
Inequality, Vol 9(2), pp. 235-248.
Ruggieri-Laderchi, C., Saith R., and Stewart, F. (2003), „Does it matter that we do not
agree on the definition of Poverty? A comparison of four approaches?’, Oxford
Development Studies, 31, 243-274.
Sen, A. (1985), Commodities and Capabilities, Oxford University Press.
UNDP (1997), Human Development Report, New York: Oxford University Press.
UNDP (2000), Human Development Report: The real wealth of nations: Pathways to
human development, New York: Palgrave Macmillan.
UNDP (2010), “Urban Poverty Assessment in Hanoi and Ho Chi Minh City”, the United
Nations Development Programmes (UNDP), the Hanoi People‟s Committee and the Ho
Chi Minh City People‟s Committee, Vietnam.
21
UNICEF (2008), „Children in Viet Nam – who and where are the poor?‟, UNICEF, Hanoi,
Vietnam.
United Nations (2000), UN Millennium Declarations, Resolutions A/RES/55/2, United
Nations, New York.
Wagle, U.R. (2002), „Rethinking Poverty: Definition and Measurement‟,
InternationalSocial Science Journal, 54(171), pp. 155-165.
Wagle, U.R. (2008), „Multidimensional Poverty: An Alternative Measurement Approach
for the United States?‟,Social Science Research, 37, pp 559-580.
World Bank (2013), “Well Begun, Not Yet Done: Vietnam's Remarkable Progress on
Poverty Reduction and the Emerging Challenges”, The Work Bank.
22
APPENDIX
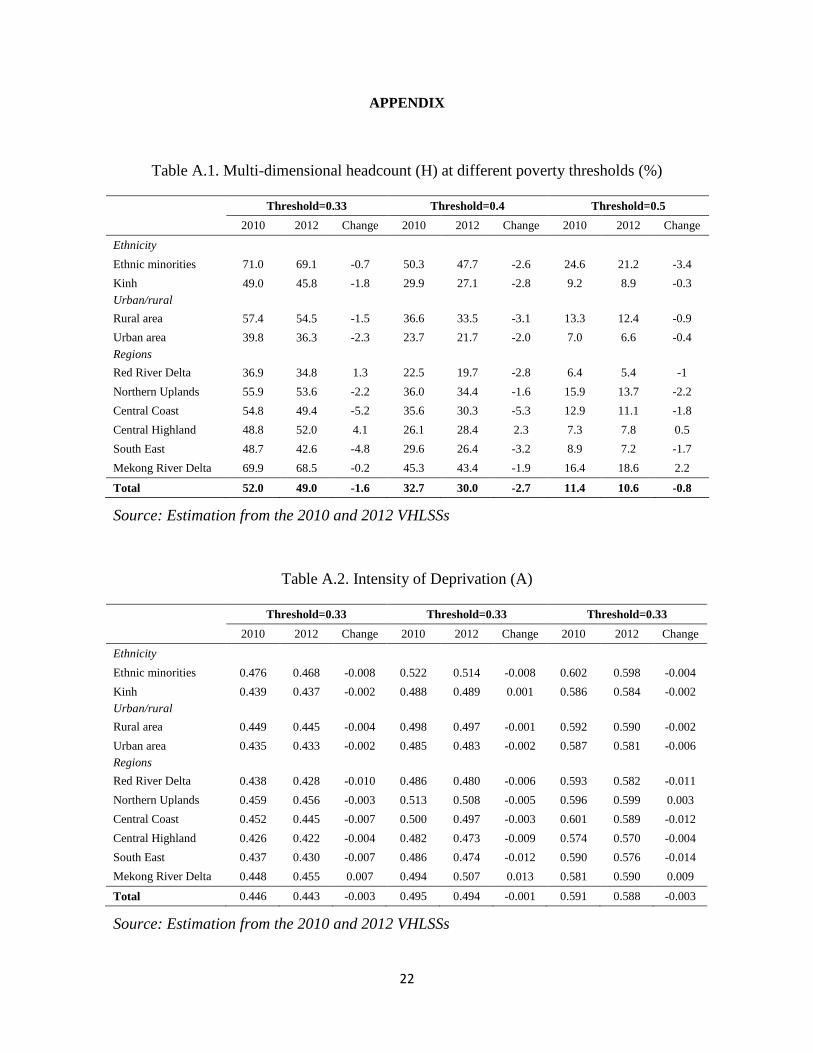
Table A.1. Multi-dimensional headcount (H) at different poverty thresholds (%)
Threshold=0.33 Threshold=0.4 Threshold=0.5
2010 2012 Change 2010 2012 Change 2010 2012 Change
Ethnicity
Ethnic minorities 71.0 69.1 -0.7 50.3 47.7 -2.6 24.6 21.2 -3.4
Kinh 49.0 45.8 -1.8 29.9 27.1 -2.8 9.2 8.9 -0.3
Urban/rural
Rural area 57.4 54.5 -1.5 36.6 33.5 -3.1 13.3 12.4 -0.9
Urban area 39.8 36.3 -2.3 23.7 21.7 -2.0 7.0 6.6 -0.4
Regions
Red River Delta 36.9 34.8 1.3 22.5 19.7 -2.8 6.4 5.4 -1
Northern Uplands 55.9 53.6 -2.2 36.0 34.4 -1.6 15.9 13.7 -2.2
Central Coast 54.8 49.4 -5.2 35.6 30.3 -5.3 12.9 11.1 -1.8
Central Highland 48.8 52.0 4.1 26.1 28.4 2.3 7.3 7.8 0.5
South East 48.7 42.6 -4.8 29.6 26.4 -3.2 8.9 7.2 -1.7
Mekong River Delta 69.9 68.5 -0.2 45.3 43.4 -1.9 16.4 18.6 2.2
Total 52.0 49.0 -1.6 32.7 30.0 -2.7 11.4 10.6 -0.8
Source: Estimation from the 2010 and 2012 VHLSSs
Table A.2. Intensity of Deprivation (A)
Threshold=0.33 Threshold=0.33 Threshold=0.33
2010 2012 Change 2010 2012 Change 2010 2012 Change
Ethnicity
Ethnic minorities 0.476 0.468 -0.008 0.522 0.514 -0.008 0.602 0.598 -0.004
Kinh 0.439 0.437 -0.002 0.488 0.489 0.001 0.586 0.584 -0.002
Urban/rural
Rural area 0.449 0.445 -0.004 0.498 0.497 -0.001 0.592 0.590 -0.002
Urban area 0.435 0.433 -0.002 0.485 0.483 -0.002 0.587 0.581 -0.006
Regions
Red River Delta 0.438 0.428 -0.010 0.486 0.480 -0.006 0.593 0.582 -0.011
Northern Uplands 0.459 0.456 -0.003 0.513 0.508 -0.005 0.596 0.599 0.003
Central Coast 0.452 0.445 -0.007 0.500 0.497 -0.003 0.601 0.589 -0.012
Central Highland 0.426 0.422 -0.004 0.482 0.473 -0.009 0.574 0.570 -0.004
South East 0.437 0.430 -0.007 0.486 0.474 -0.012 0.590 0.576 -0.014
Mekong River Delta 0.448 0.455 0.007 0.494 0.507 0.013 0.581 0.590 0.009
Total 0.446 0.443 -0.003 0.495 0.494 -0.001 0.591 0.588 -0.003
Source: Estimation from the 2010 and 2012 VHLSSs
23
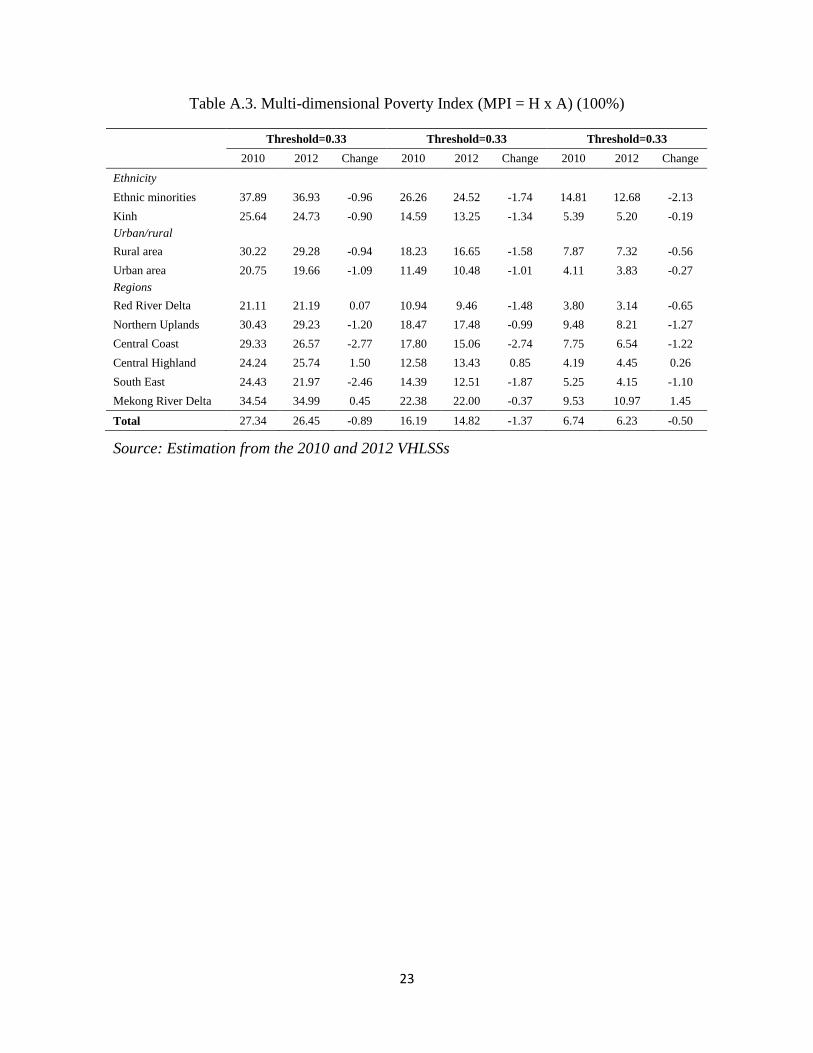
Table A.3. Multi-dimensional Poverty Index (MPI = H x A) (100%)
Threshold=0.33 Threshold=0.33 Threshold=0.33
2010 2012 Change 2010 2012 Change 2010 2012 Change
Ethnicity
Ethnic minorities 37.89 36.93 -0.96 26.26 24.52 -1.74 14.81 12.68 -2.13
Kinh 25.64 24.73 -0.90 14.59 13.25 -1.34 5.39 5.20 -0.19
Urban/rural
Rural area 30.22 29.28 -0.94 18.23 16.65 -1.58 7.87 7.32 -0.56
Urban area 20.75 19.66 -1.09 11.49 10.48 -1.01 4.11 3.83 -0.27
Regions
Red River Delta 21.11 21.19 0.07 10.94 9.46 -1.48 3.80 3.14 -0.65
Northern Uplands 30.43 29.23 -1.20 18.47 17.48 -0.99 9.48 8.21 -1.27
Central Coast 29.33 26.57 -2.77 17.80 15.06 -2.74 7.75 6.54 -1.22
Central Highland 24.24 25.74 1.50 12.58 13.43 0.85 4.19 4.45 0.26
South East 24.43 21.97 -2.46 14.39 12.51 -1.87 5.25 4.15 -1.10
Mekong River Delta 34.54 34.99 0.45 22.38 22.00 -0.37 9.53 10.97 1.45
Total 27.34 26.45 -0.89 16.19 14.82 -1.37 6.74 6.23 -0.50
Source: Estimation from the 2010 and 2012 VHLSSs