Embed Size (px)
Citation preview

21 Recycling of Nitrogen Through LandApplication of Agricultural, FoodProcessing, and Municipal Wastes'
J. H. SMITH
Snake River Conservation Research CenterAgricultural Research Service, USDAKimberly, Idaho
J. R. PETERSON
Research & Development LaboratoryMetropolitan Sanitary District of Greater ChicagoCicero, Illinois
I. INTRODUCTION
Crop residues, animal, municipal, and more recently, food processingwastes are among the many materials applied to soil as fertilizer or for dis-posal. Before waste treatment systems were developed, most food process-ing and municipal wastes were discharged to rivers, lakes, and oceans, oftenseverely polluting these waters and wasting fertilizer nutrients. Many in-novations in waste management have been developed and considerable re-search is underway on the beneficial use of wastes for crop growth whilegiving cost-effective disposal.
The objective of this chapter is to summarize and evaluate available in-formation on the value and management of agricultural, food processing,and municipal wastes as they are applied to land for N fertilization of grow-ing crops.
II. AGRICULTURAL WASTES
A. Crop Residues
1. CROP RESIDUE DECOMPOSITION ANDNITROGEN MINERALIZATION
Crop residues are a valuable natural resource. Approximately 363 mil-lion metric tons of crop residues are produced annually in the USA and
Contribution from the Agricultural Research Service, USDA, and the Metropolitan Sani-tary District of Greater Chicago (CRIS no. 5704-20790-002).
Copyright 1982 © ASA-CSSA-SSSA, 677 South Segoe Road, Madison, WI 53711, USA.Nitrogen in Agricultural Soils—Agronomy Monograph no. 22,
791

792 SMITH & PETERSON
Table 1—Annual crop residue yields and N contents in the USA (Larson et al., 1978).
Residue Total yield Nitrogen content
104 metric tons % 10' metric tons
Corn (tea mays L.) andSorghum (Syricum granum L.) 154 1.1 1.69
Cereal grain.t 96 0.7 0.67Soybeans (Glycine max L.) 53 2.2 1.17Rice (Oryza sativa L.) 4.7 0.6 0.03
t Wheat (Triticum aestivum), barley (Hordeum vulgare), oats (Avena sativa), and rye(Secak cereals].
these residues contain approximately 4 million metric tons of N (Larson etal., 1978). Most crop residues are returned to the soil following harvest.
Yield and N content figures provide perspective on crop residue valueand management problems associated with crop residues in the USA (Table1). The N content of residues varies widely. For example, wheat straw Nmay range from 0.2 to 1.0% or higher.
Nitrogen transformations in decomposing crop residues in soil are rea-sonably well understood. Bartholomew (1965) prepared a comprehensivereview of the subject and this section is intended to describe and evaluatesubsequent research developments (See also Chapt. 6, S. L. Jansson and J.Persson).
When crop residues are incorporated into soil, the N requirements for amaximum decomposition rate depend upon many factors. The environ-mental factors were discussed in some detail by Bartholomew (1965) andwill not be dealt with here. One point, however, that should be considered isthe fact that environmental conditions are frequently less than optimum inthe field, resulting in slower decomposition rates than those observed in thelaboratory. Under these conditions, less N is required for crop residuedecomposition in the field than in the laboratory. We shall emphasize fieldresults.
After crop residues are incorporated into the soil the initial phases ofdecomposition proceed rapidly. In a field experiment with wheat straw,Smith and Douglas (1971) observed 20% straw weight loss in 10 weeks inthe fall while soil temperatures decreased to 4°C. During 13 months 75%straw weight loss occurred. Jenkinson (1971) surveyed the literature onplant residue decomposition and reported that the proportion of crop resi-dues decomposed under different climatic conditions with different plantmaterials was remarkably similar. Excluding acid soils, approximately one-third of the residue remained after 1 year and one-fifth remained after 5•years. He reported that even fresh green plant materials behave in this way,contrary to the widespread belief that such residues decompose rapidly andcompletely in the soil.
Previous cropping history and soil fertility have considerable impact oncrop residue decomposition and N mineralization. The N requirements ofsubsequent crops also can be important. Smith and Douglas (1968) notedthat while residual N from previous cropping had little influence on wheat
RECYCLING OF N THROUGH WASTES 793
straw decomposition in the field, straw buried in plots increased in N per-centage in relation to previous N fertilization. Further, yields of non-N re-sponsive Pinto beans (Phaseolus vulgaris L.) were not influenced by strawapplications, while sugar beet (Beta vulgaris L.) yields decreased due toaddition of straw residues. Soil and crop analyses showed that N im-mobilization was essentially completed in the fall. The addition of 7.5 kgN/metric ton of straw, with N applied in the spring for growing the sugarbeet crop, compensated for straw-immobilized soil N (Smith et al., 1973).
Studies in Iowa to determine the long-term effects of crop residue addi-tions on soil organic matter and on N immobilization and mineralization,showed that after the addition of 16 tons/ha per year of cornstalk residuesfor 11 years, soil organic N increased by 32%. Alfalfa residue additionincreased soil organic N by 41%. Calculated break-even point values formaintaining soil organic matter and N at the original levels indicated that 6metric tons/ha per year of either alfalfa or corn residues were required(Larson et al., 1972).
Many laboratory experiments have been run in which researchers at-tempted to develop threshold values for N immobilization and release.Generally, crop residues containing 1.5% N or more will decompose at"normal" rates without bringing about a net immobilization of soil N.Crop residues containing < 1.5% N are considered deficient in N and willlead to depletion of available forms of soil N during decomposition. Suchresidues are often amended with N to compensate for net immobilizationand to hasten crop residue decomposition. In most cases, this is an un-economical, wasteful practice based on a false premise. Nitrogen additionseldom accelerates plant residue decomposition (Allison, 1973). Nitrogenaddition did not change the amount of straw remaining in soil after 3 yearscropping under dryland conditions in Montana and Nebraska (Greb et al.,1974).
Nitrogen fertilizer use, soil fertility levels, and crop productivity haveincreased since many of the original laboratory experiments on N im-mobilization were performed. As a result, the impact of N on crop residuedecomposition has changed. Field experiments by Brown and Dickey (1970)on nonirrigated soils in Montana showed that 95% of the buried wheatstraw decomposed in 18 months and the residue increased from 0.3 to 1.2%N without added N. Similar results were found by Smith and Douglas(1971) in irrigated soils in Idaho, who found that 70% of the applied N (tobring the straw N to 1.5%) was lost in the first few weeks of incubation andthat straw N was mineralized at N concentrations < 1.0% (See Fig. 1).Under field conditions, with irrigation or rainfall, leaching as well as thenumerous factors that limit decomposition rates apparently decrease theamount of N required for maximum decomposition. Evidently, decomposi-tion proceeds at some rate that is not limited by N when N percentages inthe crop residues are below the theoretical equilibrium value of 1.5%.
Several reports are available on the influence of above-ground cropresidues on soil organic matter and N transformations, but few deal withroots. Powers (1968) reported that the effect of N content of bromegrass(Bromus Mermis L.) on the rate of decomposition was similar to that of

+ Straw Wt. +Nn Straw Wt -Nx Straw No Straw N -N
794 SMITH & PETERSON
400
r
25
20
300 cr
to
200 al01--
100 z
Mar. 22 May 22TIME
Fig. 1—Weight of Nugaines wheat straw remaining in soil at indicated dates, and N contentof straw. Points associated with different letters are different at the 0.05 significance level(from Smith and Douglas, 1971).
most other crop residues. Roots containing 0.8% N immobilized some soilN for a time while roots containing 1.4 07o N caused little or no N im-mobilization. Smith (1966) using "C-labeled plant parts of corn, wheat, andsoybeans (Glycine max L.), showed that roots decomposed more slowlythan tops. He also reported that corn roots decomposing in soil decreasedthe decomposition of soil organic matter by almost 50%a. This protective ef-fect would also decrease the rate of soil N mineralization and, therefore,corn may be grown continuously when adequately fertilized.
With other low N plant materials such as wood chips, sawdust, orwood bark, the decomposition rate and N mineralization is limited by com-position. Wood products contain less soluble carbohydrates and higherlignin concentration than most crop plants, and thus, have lower decom-position rates. Most of the wood products investigated by Allison (1965)contained an average of 0.1 07o N, and the decomposition rates of most ofthe 28 wood species investigated were not influenced by N addition. Thesewood materials would not be expected to mineralize enough N to supplygrowing crops for a long time after incorporation into soil and would onlyslowly decompose in the soil.
The importance of rice straw (Oryza saliva L.) as a crop residue and itsimpact on soil fertility worldwide have been largely overlooked until recent-ly. In the past 10 years, several definitive publications pointing out the dif-ferences between rice straw and wheat straw management have appeared.
5
°Sept. 7 Nov.15
0Oct. 3
RECYCLING OF N THROUGH WASTES 795
While rice culture in the USA produces a relatively insignificant 4.7million metric tons of residue annually, the remainder of the world prob-ably produces more rice residues than any other cultivated crop residue. InAsia, excluding mainland China, the annual production of rice straw is ap-proximately 454 million metric tons (Tanaka, 1973). Rice straw contains anaverage of 0.5% N and a total of approximately 2.3 million metric tons ofN. Rice straw is used for a variety of purposes including building materialsand furnishings, paper, fuel, animal feed, culture media, and composts, butits major use is for incorporation in soil to provide plant nutrients. Rice cul-ture included both lowland (flooded) and highland (nonflooded) rice. Thisdistinction is made because there is a striking difference between straw de-composition and N requirements under these two conditions.
Williams et al. (1968) determined that under lowland field conditions,net immobilization of N, as determined by yield responses, occurred at0.54% N in the original straw. Straw with higher N content increased yieldson N deficient soils, while straw with lower N content decreased yields.They reported that under upland conditions, N requirements for rice strawdecomposition were similar to that of wheat straw.
Rao and Mikkelsen (1976) in laboratory experiments found that ricestraw immobilized about half as much N as wheat straw. Sain and Broad-bent (1977) enclosed rice straw in nylon bags and buried the bags in the soil.Decomposition of the buried rice straw was influenced very little by N addi-tions. Yoneyama and Yoshida (1977a, 1977b, 1977c) conducted a series ofexperiments using "N to trace N transformations during rice straw decom-position. They reported that the N percentage in the rice straw increasedduring the first 2 weeks because of N immobilization while further increasesin percentage of N resulted from C loss. The mature rice plants grown onsoils enriched with ' 5 1%1-labeled rice straw derived approximately 6% of theirN from the straw. Sampling with stage of growth showed that the percent-age of N in the plants derived from straw was relatively constant. Theseauthors also observed that N mineralization and immobilization by plantresidues appears to be simultaneous, beginning at an early stage of decom-position even when the N content of the residue is low and net mineraliza-tion is not detectable.
Thus, N addition to rice straw for decomposition under lowland con-ditions is neither necessary nor desirable and, as found by Williams et al.(1968), sometimes N may suppress rice straw decomposition or cause yielddepression. Most rice straw contains adequate N for decomposition and willprovide part of the N needed to grow succeeding rice crops.
Krantz et al. (1968) have summarized the practical considerations inhandling crop residues in the field. Early crop residue incorporation intomoist soil was regarded as a key factor in residue management. Further,fertilizing the growing crop at the time N is needed by the crop is much moreefficient than fertilizing the crop residue. When N is added to crop residues,part of the N is immobilized, but has little effect on decomposition rates.Nitrogen immobilization by decomposing crop residues decreases N use ef-ficiency because losses occur in each subsequent turnover. A portion of theimmobilized N is remineralized during the immediate cropping year and be-

796 SMITH & PETERSON
comes available to growing crops. The balance of the immobilized N miner-alizes at about the same rate as the native soil N in subsequent years.
2. DENITRIFICATION
Four factors must be present simultaneously for denitrification to oc-cur in the field (see Chapt. 8, M. K, Firestone). They are (i) anoxic condi-tions, (ii) an organic energy source, (iii) presence of denitrifying microor-ganisms, and (iv) presence of NO 2 -.
Crop residues decomposing in soil may promote conditions contribu-tory to denitrification. This depends primarily on the nature of the cropresidue. Most crop residues, when mixed with warm moist soil, will decom-pose rapidly enough to deplete 0 2 and, thus, lower the redox potential in theimmediate area. Soil water content and texture will probably determinewhether or not the threshold conditions for denitrification will be reached.Crop residues low in N that are not fertilized with N will not yield NO,-during the stage of rapid decomposition and NO 3 - in the soil at the time ofresidue incorporation will probably be mostly immobilized. Therefore, de-nitrification is unlikely in the presence of low N crop residue, providing Nfertilizer has not been added. Approximately 85% of the crop residues pro-duced in the USA are low enough in N that denitrification of the residue Nwill be minimal. One exception is soybean straw, which contains an averageof 2.2% N. Incorporating this residue in a warm, moist soil will cause rapiddecomposition, and nitrification is likely. With irrigation or rainfall, the re-dox potentials will be lowered and some denitrification could occur. Howfrequently this will happen in the field is open to speculation. The sameconditions would develop with plowdown of green manure crops, alfalfa,bean or pea straw, or other high N crop residues.
Crop residues decomposing in soil can either decrease or increaseground water pollution by NO 2 -. For example, Smith and Douglas (1971)showed that approximately 70% of the N added to straw in the field wasleached out of the straw into the soil. Nitrogen not immobilized will be sus-ceptible to leaching. If the field is irrigated or rainfall is greater than the soilwater holding capacity, the applied N may leach below the root zone andultimately reach the ground water causing pollution. The potential forpollution is similar to that of low rate fertilizer N as described by Schumanet al. (1975).
Low N crop residues in soil may also decrease pollution potential byacting as a sink and immobilizing excess fertilizer N or mineralized soil N,retaining it in a nonmobile form until later when it will become available togrowing crops.
High N crop residues, returned to the soil when N is not needed bygrowing crops, may pose a pollution hazard. Soybean straw, edible beanstraw, pea (Pisum sativum L.) residue, or alfalfa (Medicago saliva L.) whenincorporated into soil will decompose rapidly and the N will be subject tonitrification. This NO,-, like any fertilizer N that is applied at the wrongtime, can leach and pollute ground water (Burwell et al., 1976; Letey et al.,1977). Crop residues can and should be managed to minimize N pollutionhazards.

RECYCLING OF N THROUGH WASTES 797
B. Animal Manures
1. ANIMAL MANURE DECOMPOSITION AND NITROGENMINERALIZATION
Domestic animals in the USA produce over 1 billion metric tons offecal wastes each year. Liquid effluents amount to over 360 million metrictons. Used bedding, paunch manure from slaughtering facilities, and deadcarcasses make the total annual animal waste production close to 2 billionmetric tons (Wadleigh, 1968). For centuries, animal wastes have been usedas fertilizers for crop production. With the advent of low-cost commercialfertilizers, the use of animal manures became less cost effective. Since 1973,energy shortages have increased commercial fertilizer costs and made ma-nure use more economical.
Modern animal feeding practices, where thousands of animals are con--centrated in small areas, have made manure handling difficult. Waste mustbe stored so that its application corresponds with favorable weather, crop,and land conditions. Nutrient loss, especially NH,, can occur during storageand can cause some social and economic problems. However, with carefulmanagement, the benefits outweigh the problems, making animal manure avaluable resource (Elliott & Swanson, 1976).
Many pathways are followed by N during animal waste use and con-version (Fig. 2). The processes affecting these conversions are physical,chemical, and biological. Microorganisms play a major role in N conver-sions in decomposing manure in the feedlot and soil.
The N forms in fresh excreta are mainly urea, NH,, organic, and frombirds, uric acid, with virtually no NO 3 -. Manure composition will vary withfeed ration composition and with the animal species. For example, the Ncontent of fresh chicken manure is much higher than that of the other ani-mals (Table 2). Even though these variabilities exist, many manure decom-position pathways are common to all types of manure (Fig. 2).
When manure and urine are deposited, their composition changes im-mediately. For instance, urine contains large quantities of urea, which isconverted rapidly to CO 2 and NH,* by the enzyme urease. The N in urinecomprises 21% (hog), 35.5% (horse), 52% (cattle), and 63% (sheep) of thetotal N excreted (Elliott & McCalla, 1973).
Mathers et al. (1972) determined the N concentration in manure from23 Texas high plain feedlots. The N percentage ranged from 1.16 to 1.96%and averaged 1.34%. The way manure is handled affects its chemical con-tent. As decomposition proceeds, the mineral percentage in the manure in-creases, and the mineralized N is converted to NO,-. When excessive ratesof manure are added to soil, (100 metric tons/ha or more) NH, tends to ac-cumulate in the soil, temporarily slowing NO 3 - formation.
Mathers et al. (1972, 1975) and Mathers and Stewart (1970), in a seriesof experiments where varying rates of manure were applied to soil, foundthat manure applications up to 22 metric tons/ha supplied enough N forgrowing corn or sorghum without excess NO,- in the soil profile. Higher

0C
OC
*a.
6
ino .0
ca
+ .4t
5N
••r-0N
to•0 0C 4113 4.IX 41
M
2
8
0 .0 C 4-
= 7
4r4
ou roa
co 21 3e,IS 0 1-
0 0 iro 4Z o
798 SMITH & PETERSON
*S.
00- ON
• 0 I 0)0 C 4- I. 4I' • 00,.z•.. • 4.-0. x --- —4.0E°202 Z re e
• 2c
a
I
° o .-
-o
0
a •0 N
n
2%1
a so s
4.)o
C0
E0
0.
52
8
2
•041 •
L4 '0 c E•••
0 0 ix 0 o▪ .0• E o °a0. • 2 u t41( 0 o
0

RECYCLING OF N THROUGH WASTES 799
Table 2—Average moisture and N content of animal manures (from Elliottand McCalla, 1973).
Moisture in N/animal
fresh manure N in fresh manure Total dry solids per day
kg/ kg/animal % gmetric ton per day
Dairy cattle 79 1.0 10 3.7 4.6 172Beef cattle 80 0.9 9 4.1 4.5 186Swine 75 1.6 18 0.32 6.4 20Horse 60 0.7 7 6.4 1.8 118Sheep 65 1.7 17 0.5 4.6 21Broiler 80 5.2 52 0.03 6.9 2.2Hen 75-80 4.3 43 0.03 6.2 1.7
rates caused NO,- accumulation with up to 1,200 kg of NO 3 --N/ha in 180cm of soil when 224 metric tons/ha manure were applied.
Nitrate pollution of surface or ground water is one of the major con :terns in concentrated livestock holding areas or in soils receiving largeamounts of manure (Gilmour et al., 1977). Mielke et al. (1974) describedthree layers in the soil profile under cattle feedlots. The surface layer ismanure overlaying a mixed layer of organic and mineral material. Belowthis is the top of the mineral soil. The two upper layers are relatively im-permeable when moist and allow little downward movement of NO 3 -. Theseauthors reported higher NO 3 - concentrations to 1.7 m in one feedlot profilethan in adjacent cropland, but little NO3 - occurred in another location inthe same feedlot. Some ammonification and nitrification occurs in feedlots.Adriano et al. (1971) found higher NO 3 - concentrations under Californiadairy corrals than under irrigated pastures or cropland at the 3- to 6-mdepths. Marriott and Bartlett (1972) in Pennsylvania applied up to 85 metrictons/ha of manure and found relatively high NO3 - concentrations in the soilto depths of 1.5 m when more than 17 metric tons of manure/ha wereapplied.
The literature on manure application to soils is voluminous. Pertinentrecent references concerned with the probability of high soil NO,- con-centrations accumulating with large applications of animal manure include:Webber and Lane (1969); Olsen et al. (1970); Concannon and Genetelli(1971); Hensler et al. (1971); Mathers and Stewart (1971); Peterson et al.(1971); Carlile (1972); Kimble et al. (1972); MacMillan et aI. (1972, 1975);Murphy et at. (1972); Weeks et al. (1972); Bielby et al. (1973); Walter et al.(1974); Meek et al. (1974); Stewart and Chaney (1975); Loehr et al. (1976);and Pratt et al. (1976).
Although wastes have been used for centuries as nutrient sources forplant growth, a rational basis for their use has not been developed. Applica-tion rates have been based on experience and little information has beenavailable about decomposition rates or nutrient availability. In recent years,renewed interest in using manure for its fertilizer value has led to several ex-periments to obtain information on decomposition rates and to develop a

800 SMITH & PETERSON
rational basis for using manure. Pratt et al. (1973) proposed a theoreticalbasis for matching manure applications with crop needs. This theory isbeing tested by them and others to evaluate and refine estimates of N avail-ability.
Organically combined N must be mineralized before it can becomeavailable to plants. Therefore, the mineralization rate is the key to the appli-cation rate of any given material. The yearly mineralization rates are ex-pressed as a series of fractional mineralizations of any given application, orthe residual of that application. These will be referred to hereafter as thedecay series. For example, the decay series, 0.30, 0.10, 0.05, means that forany given application, 30% is mineralized the first year, 10% of the un-mineralized residual is mineralized the second year, and 5% of the residualis mineralized the third and all subsequent years. The same series is appliedindividually to each yearly application of organic N (Pratt et al., 1973).
Constant annual manure applications that will supply enough N for thepresent crop will ultimately cause excessive fertilization. Therefore, to meetannual crop N requirements with manure applications, decreasing amountsshould be applied each year. For example, based on 1.5% N, 30% moisture,and a 0.35, 0.15, 0.10, 0.05 decay series, to supply 200 kg of available N/haeach year, it would be necessary to add 54 metric tons the 1st year, and de-crease the rate to < 27 metric tons for the 20th year (Pratt et al., 1973).
Decomposition patterns of manures differ, requiring development ofseveral decay series. The decay series 0.90, 0.10, 0.05 is typical of organicwastes such as chicken manure containing N, primarily in the rapidly miner-alized urea and uric acid forms. The N in these materials is nearly as avail-able as inorganic N. The decay series 0.75, 0.15, 0.10, 0.05 represents ma-terials in which about 50010 of the N is present as urea or uric acid and thebalance is slowly mineralizable organic compounds. Fresh wastes fromdairy or beef cattle are in this category. Other decay series are used to repre-sent more stable organic materials such as accumulated dried dairy or beefcattle manure found in corrals (Pratt et al., 1973).
Table 3-Ratiot of yearly N input to annual N mineralization rate of organic wastesat constant yearly mineralization rate for five decay series for various times
after initial application (Pratt et al., 1973).
Time, years
Decay series Typical materiaLt 1 2 3 4 5 10 15 20
N input/mineralization rate
0.90, 0.10, 0.050.75, 0.15, 0.10, 0.05
0.40, 0.25, 0.06
0.35.0.15, 0.10, 0.05
0.20, 0.10, 0.05
Chicken manure 1.11 1.10 1.09 1.09 1.08 1.06 1.05 1.04Fresh bovine waste,1.33 1.27 1.23 1.22 1.20 1.15 1.11 1.06
3.6% NDry corral manure, 2.50 1.82 1.74 1.58 1.54 1.29 1.16 1.06
2.6% NDry corral manure, 2.86 2.06 1.83 1.82 1.72 1.40 1.23 1.13
1.5% NDry corral manure, 6.00 3.00 2.90 2.44 2.17 1.38 1.13 1.04
1.0% N
t This ratio equals kg of N required to produce 1 kg of available N annually.t The N content is on a dry weight basis.

RECYCLING OF N THROUGH WASTES 801
The decay series can be used to obtain a constant N output each year ora particular N output in the current year by adjusting the manure applica-tions. A constant annual N output can be obtained by using Table 3 whichpresents the ratio of yearly inputs to the annual N mineralization rate, at aconstant yearly mineralization rate for five decay series for 20 years. In thiscase the application for any specific year can be obtained by multiplying theratio for that year times the yearly mineralization rate desired. For example,if a constant yearly mineralization rate of 100 kg N/ha were desired, using adecay series of 0.40, 0.25, 0.06, the input rates would be 250, 182, 154, and109 kg/ha of manure N each year, respectively, for the 1st, 2nd, Sth, and20th years. Nitrogen input rates for years not listed will be between thoselisted. Using these ratios, the required amounts of any of the five manurescan be calculated if the N and water contents are known (Pratt et al., 1973).
The decay series used in Table 3 were largely the results of the com-bined judgments of Pratt, Broadbent, and Martin, except the decay series0.40, 0.25, 0.06, which was taken from a field trial in the Coachella Valley,in which the availability of the N was compared with the availability of inor-ganic sources. These series should be tested further for verification or modi-fication.
Nitrogen losses in manure handling are an important considerationwhen determining the fertility value of the manure. Turner (1976) evaluatedN loss in various storage, treatment, and handling systems (Table 4). Nitro-gen losses in storage and handling ranged from 10 to 84%. Managementsystems can be used that will increase N losses when large quantities ofmanure are available to spread on limited land areas or can be minimized incases where efficient N use for growing crops is desired.
Turner (1976) developed a less complicated approach to manure Navailability than the decay series previously discussed. His availability co-efficient A indicates that portion of the total soil-incorporated manure Nthat is, or becomes available. The value of A is influenced by the portion ofthe total N that is already in the inorganic form when the manure is incorpo-rated, the amount of organic N in the current-year application that is miner-
Table 4—Nitrogen remaining after accounting for storage, treatment andhandling losses (Turner, 1976).
Manure storage, treatment, and handling system
N remaining, %
Oxidation ditch, anaerobic lagoon, irrigation or liquid spreading 16Anaerobic lagoon, irrigation or liquid spreading 22Deep pit storage, liquid spreading 34Aerobic lagoon, irrigation or liquid spreading 40Open lot surface storage, solid spreading
40
Roofed storage in manure pack, solid spreading 65Fresh manure, directly field spread:
(time between application and incorporation)1-4 days; warm, dry soil
657 days or more; warm dry soil
50
1-4 days; warm, wet soil
857 days or more; warm, wet soil
70
7 days or more; cool, wet soil
90
802 SMITH & PETERSON
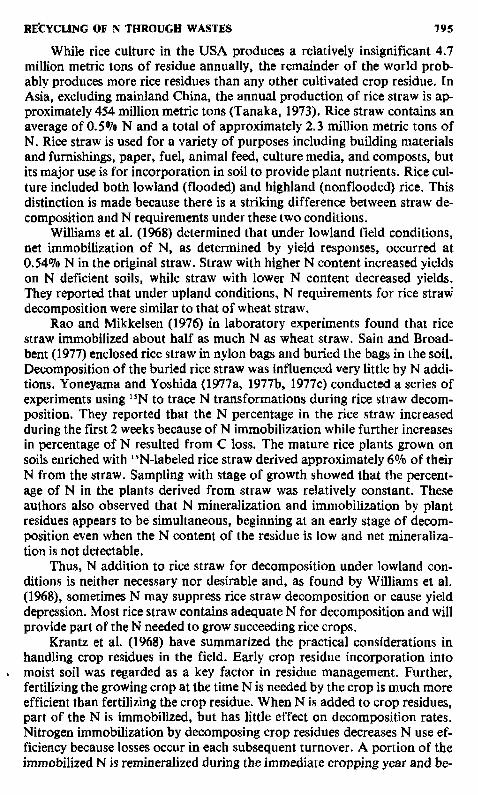
Table 5-Availability coefficient A for the first 5 application years (Turner, 1976).
Type of manure
Availability coefficient for theyear of application
1 2 3 4 5
Poultry, fresh 0.75 0.80 0.85 0.90 0.93Poultry, aged, covered 0.60 0.75 0.80 0.84 0.87Dairy, fresh 0.50 0.65 0.70 0.74 0.78Dairy, liquid manure tank (1-3 weeks storage) 0.42 0.54 0.60 0.64 0.68Dairy, anaerobic lagoon storage 0.30 0.38 0.45 0.50 0.53Beef, feedlot stockpiled 0.35 0.45 0.50 0.53 0.55
alized during the year, and the amount of residual organic N from previousapplications that is mineralized during the current year. Estimated valuesfor A (Table 5) are based on the assumption that manure will be appliedeach year on the same land for an indefinite number of years. The avail-ability coefficient, therefore, approaches 1.0 with time.
In the case of poultry waste and fresh bovine waste, the initial year re-covery rates proposed by Turner (1976) appear to be lower than those ofPratt et a!. (1973). This may be partly explained by the climatic differencesbetween the Pacific Northwest and California. This also points to the neces-sity of obtaining data from other areas to enable more precise evaluation ofmanure fertilization requirements in areas of widely differing climates.
Other approaches have been made to estimate the amount of availableN from manure. Walter et al. (1974) prepared a computer model for pre-dicting the soil profile NO distribution resulting from heavy applicationrates of anaerobic liquid dairy waste to coarse-textured soil. Gilmour et al.(1977) introduced a half-life concept of manure decomposition. The half-life is the time required for 50% of the manure incorporated into the soil todecompose. The half-life increases with stage of decomposition and time asthe more resistant materials remain in the soil. They described this relation-ship with the equation:
0.693 t1/2
k x (M2/M1 ) x 0.933 - [(Annual heat units/365) - (7-2- T,)]
wheret i„ = manure decomposition half-life in days;
k = reaction velocity constant at optimum temperature (27°C);= soil moisture for optimum mineralization (070 of water-holding
capacity, WHC);M2 -7= actual soil moisture (% of WHC);T2 = experimental reference temperature, °C; andT, = 5°C = temperature at which annual heat units = 0.
The factor 0.933 applies when the velocity of the reaction is decreased50% for each 10°C temperature decrease.
This mathematical model was developed to predict C loss during or-ganic matter decomposition in soil, but because C loss and N mineralizationare closely related in waste materials with narrow C/N ratio, as in animal
RECYCLING OF N THROUGH WASTES 803
manures, it should also be useful for predicting N mineralization. Addition-al testing in the field will determine how useful mathematical models may befor predicting N availability from manures.
Meek et al. (1975) prepared guidelines for manure use and disposal inthe western USA. The first objective of manure application should be de-signed to minimize pollution and maximize plant nutrient conservation.
2. DENITRIFICATION
Fresh manure contains very little NO:-N, therefore, the potential forN loss through denitrification is nearly zero initially. However, soon aftermanure is incorporated into the soil, decomposition begins, and with largeapplications of manure, the NO,- concentration in the soil sometimes in-creases to high levels. Denitrification of NO from animal manures isaffected by the same factors that were discussed earlier in this chapter andin Chapter 8 (M. K. Firestone).
Larson and Gilley (1976) stated that considerable N will be lost by de--nitrification in moist soils after application of manures, sewage sludges, andsewage effluents. Rolston and Broadbent (1977) found that denitrificationwas greater in manured plots than in similar nonmanured cropped fieldplots, probably because of an abundant energy source. Carlile (1972)studied the transformation and movement of N from slurry manure appliedto soil. He developed a system for denitrifying soil solutions containingNO by adding energy materials. Two such materials that worked success-fully were methanol and milk, either of which removed up to 90% !of theNO,- in 1 hour retention time in his anaerobic filter. There is an interest indenitrifying excess NO,- under field conditions without the use of additives.
Guenzi et al. (1978) conducted greenhouse investigations in which theystudied nitrification and denitrification with 45- and 90-metric ton/hamanure rates and with "N-labeled N sources. They determined that oxygenlevels in the soil were decreased, but not completely depleted by manure de-composition. However, anaerobic microsites were developed whichpermitted denitrification to occur. They showed that nitrification anddenitrification were proceeding simultaneously. In field experiments, Con-cannon and Genetelli (1971) showed that soluble organic matter frommanure applied to soil was leached 90 cm or deeper. This organic matterprovided energy for denitrification. Murphy et al. (1972) reported greaterNO,- concentrations in fields that had received one manure application thanafter two annual treatments. They attributed this to leaching of organicmaterials to greater depths and in greater concentrations with additionalmanure applications, resulting in enhanced denitrification.
Kimble et al. (1972) attempted to estimate denitrification by measuringleached NO,- and the NO,-/C1 ratios in plots receiving 66 metric tons/ha ofmanure. The ratio decreased with depth to 182 cm, indicating that denitrifi-cation had occurred. Meek et al. (1974) showed that with 180 metrictons/ha manure, soluble organic C leached to 80 cm or deeper. Nitrate wasleached to considerable depths in the soil and denitrified, and the disappear-ance of NO,- correlated with the appearance of soluble manganese. They

804 SMITH & PETERSON
Table 6—Denitrification coefficient for four drainage conditions (Turner, 1976).
Degree of soil drainage Denitrification coefficient
Excessive or somewhat excessiveWell to moderately drained
0.85
Somewhat poorly to poorly drained
0.70Very poorly drained
0.60
also measured redox potentials and correlated them with NO,- loss bydenitrificat ion.
This research has provided background for greater quantification ofnitrification and denitrification of manure N in soil. Further, Turner (1975,1976) developed a denitrification coefficient. This coefficient indicates thatportion of the available inorganic N remaining in the soil after accountingfor denitrification loss. Aeration, one of the main factors in denitrification,is related to soil drainage. Therefore, excessively drained soils show little orno denitrification potential and this potential increases as soil drainage de-creases to the very poorly drained soils (Table 6).
Nitrogen loss from denitrification following manure applications toland will probably be associated primarily with systems where manure isapplied at high rates. In summarizing available data, manure applicationrates below 20 metric tons/ha will probably produce fairly low NO con-centrations in soil and low concentrations of leached organic material belowthe manure mixing layer. Therefore, denitrification losses would be ex-pected to be less than at high disposal rates (100 or more metric tons/ha)where high concentrations of leached organic materials, high NO concen-trations, and low redox potentials resulting from intensive microbiologicalactivity would maximize denitrification. This is a favorable factor in de-creasing ground water and soil pollution from NO in manure disposal sitesand under corrals.
3. NITROGEN POLLUTION POTENTIAL FROM ANIMAL MANURES
During decomposition of manure, NO,- is the main end product fromthe nitrogenous portions of the manure, and NO,- may accumulate to veryhigh concentrations in the soil. Several unfavorable conditions may developin soil and ground water as a result of high NO concentrations. High NO,-in the soil may result in high to very high NO,- concentrations in forage,feed, or food. High NO concentrations can be toxic to animals or humansconsuming the products grown on land. Nitrate concentrations in theground water may increase above the limits set by the U.S. Public HealthService (see Chapt. 16, D. R. Keeney). The movement of NO,- through thesoil profile varies with soil, climate, and management (Chapt. 11, D. R.Nielsen and J. W. Biggar). Generally, NO,- will move through porous, well-drained soils with water from either rainfall or irrigation. Although the rateof movement varies, Adriano et al. (1971) suggested that with 18 to 25 cm ofdrainage water per year, NO may reach a water table at a 30-m depth in10-50 years. Nitrate does not readily move through tight soils, uncleanedanimal yards that have become sealed, or in low rainfall nonirrigated areas.
RECYCLING OF N THROUGH WASTES 805
Stagnant water or poorly aerated soil layers encourage denitrification andmuch of the NO,- is lost rather than moved into the ground water (Meek etal., 1975).
We will discuss a few animal waste disposal related experiments thatpoint out the problems associated with NO,- leaching. Bielby et al. (1973)treated lysimeters with slurry manure to provide 560, 1,120, and 1,685 kgN/ha, and found that in 2 years of cropping to corn, 26.6, 26.2, and 24.0%of the added N leached out of the lysimeters. Concannon and Genetelli(1971) applied manure to field plots at rates of 0, 33, 66, and 99 metrictons/ha and found that the 66 and 99 metric ton rates produced N0,--Nconcentrations above 10 mg/liter in the soil solution for August or Octoberapplications, but not for June applications. Marriott and Bartlett (1972)found that manure applications containing 250-1,460 kg N/ha producedNO,--N concentrations in the soil solution ranging from 3 to 140 mg/liter.
In evaluating soil and water pollution potential from manure applica-tions, the greatest need is to determine leaching losses for various manure.rates for specific cropping sequences, water management systems, soils, andclimates. When soils are loaded with large amounts of manure, denitrifica-tion is the key mechanism in preventing or decreasing NO,- leaching beyondthe root zone. Pratt et al. (1976) indicated that organic loading was moreimportant than water management in creating 0 1 -deficient systems neces-sary for denitrification. They also reported that the NO concentration inthe unsaturated zone and the amount of NO,- leached were linearly relatedto available N in the soil and also to the amount of dry or liquid manureadded. High organic loading favors denitrification and adds a bufferingeffect to NO leaching from high manure applications. In most well-aerated soils, this buffering probably is not sufficient to prevent large leach-ing losses and high NO,- concentrations in drainage waters from large ma-nure applications. Conversely, in heavy, poorly drained soils, there isevidence that denitrification will greatly decrease or eliminate NO,- leachinglosses when large amounts of animal manure are applied. When annual ap-plications cease, the lower soil profile becomes aerated, denitrificationstops, and NO leaches from the profile until the added organic source isdepleted. In a humid area with 125 cm of annual precipitation, Fordhamand Giddens (1974) found that feedlots remained wet on the surface most ofthe time, which was conducive to denitrification, and they found only 3mg/liter N0,--N at the 120-cm depth under the feedlot.
Of nuisances related to manures, odor is probably the most readilynoticeable, but the least definable and the most difficult to control. Al-though manure odors can be characterized chemically, odor nuisance judge-ments are subjective. The odor of fresh livestock manure is inoffensive tomost people, but odors produced by anaerobic bacterial activity duringfermentation of wet manure can be offensive (McCalla et al., 1977).
Ammonia from manures is usually not as offensive as anaerobicallyproduced volatile non-N compounds. Stewart (1970) in soil column studiesshowed that 25% of the applied urine-N was lost as NH, from wet and 90%from dry soil surfaces. Peters and Reddell (1976) reported a 10-20% loss oftotal N as volatilized NH, from heavy manure applications on soil columns.
806 SMITH & PETERSON
Adriano et aI. (1974a) found that manure application rate did not affectNH, loss, but showed volatile losses approaching 50% of manure N.McCalla et al. (1970) in a laboratory experiment showed up to 90% of sur-face-applied urine N was lost by volatilization of NH 3 .
Hutchinson and Viets (1969) measured NH, concentrations in the airdownwind from a 90,000 cattle feedlot. They postulated potential waterpollution of nearby lakes with NH,. Luebs et al. (1973) measured NH, con-centrations in the air in a high concentration dairy area of California andcalculated that a lake in that area could absorb up to 190 kg N/ha of lakesurface annually. In a 6-m-deep lake this would constitute enough N tomake an NH 3 concentration of 0.75 mg/liter. This is in excess of the U.S.Environmental Protection Agency (USEPA, 1973) recommended permis-sable NH 3 level for public water systems of 0.5 mg/liter. Rainfall in theseareas also contributes additional NH,-N to soil and water and increases thepollution potential from high concentrations of livestock. These observa-tions suggest that large livestock enterprises, with their associated pollutionproblems from odors and NH 3 , should not be located in highly populatedareas.
III. FOOD PROCESSING WASTES
A. The Nature and Composition of Food Processing Wastes
Food processing wastes may be liquid as in the cases of effluents fromprocessing potatoes, sugar beets, vegetables, fruits, meats, or dairyproducts or they may be solid or semisolid materials such as soil, rocks, peelwastes, pulps, or paunch manure. They vary in composition from very lownutrient liquid wastes from dairy washing operations to very high nutrientconcentrations from whey or meat processing. Almost all food processingwaste effluents may be used for irrigating agricultural land to supply waterand nutrients for growing crops. Waste water containing a high salt or Naconcentration that would damage crops and soil cannot be used for irriga-tion.
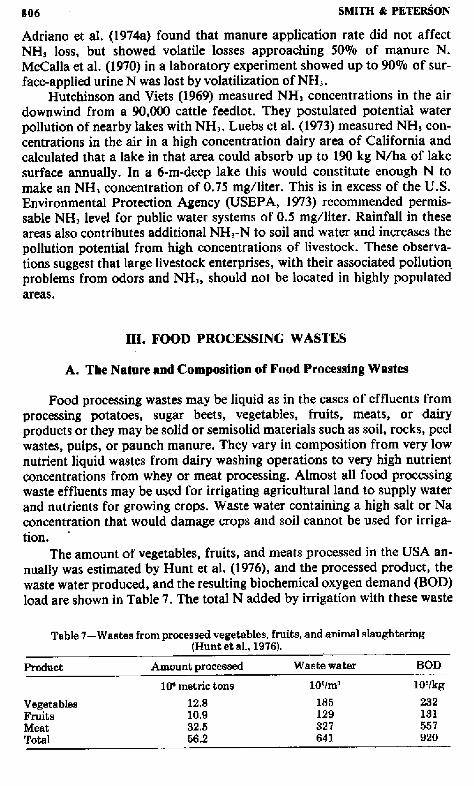
The amount of vegetables, fruits, and meats processed in the USA an-nually was estimated by Hunt et al. (1976), and the processed product, thewaste water produced, and the resulting biochemical oxygen demand (BOD)load are shown in Table 7. The total N added by irrigation with these waste
Table 7—Wastes from processed vegetables, fruits, and animal slaughtering(Hunt et al., 1976).
Product Amount processed Waste water BOD
106 metric tons 10'im' 1O'/kg
Vegetables 12.8 186 232Fruits 10.9 129 131Meat 32.5 327 557Total 56.2 641 920

RECYCLING OF N THROUGH WASTES 807
waters is significant, ranging from 6,500 metric tons N/year for vegetableprocessing wastes, somewhat less from fruit processing, and 2,400 metrictons annually from meat-processing wastes.
1. VEGETABLE PROCESSING WASTES
Large volumes of water are used for washing, transporting, blanching,and cooking vegetables. Each of these processes extracts some vegetableconstituents, enriching the water with organic material and plant nutrients.As water is used and recycled to lower level steps in the vegetable process-ing, its nutrient and organic concentration increases and its quality de-creases until the water can no longer be used for processing. Then it is dis-carded. Table 8, compiled from several publications on waste water quality,shows NO 3 -, total N, and chemical oxygen demand (COD) concentrationsin the waste waters from processing several vegetables. Nitrate-N concentra-tions are generally low ( <3 mg/Iiter) in vegetable-processing waste waters.However, the organic N in the waste water will be converted to NO 3 --N dur-ing treatment or in the soil when it is used for irrigation. When usingvegetable processing waste water for irrigation, the organic N must be con-sidered as the main N component and evaluated as fertilizer for crops andfor its soil and ground-water pollution potential.
The total N content of the vegetable-processing waste waters reportedin Table 8 range from 6 to 66 mg/liter with tomato (Lycopersicon esculen-t= Mill.) and brussels-sprouts (Brassica oleracea Gemmifera) processingproducing low N waste water and potato (Solanum tuberosum L.), corn,
Table 8—Nitrogen and COD composition of vegetable processing wastes.
Crop NO,--N Total N COD
In wastewater
mg/liter
Snap beans t 0.9 31.2 176Sweet corn t 1.7 61.9 1,043Brussels-sproutat 0.4 5.7 15Beets t 2.9 66.4 854Peas t 0.1 44.7 707Tomatoes t 0.6 6.3 95Cabbage t 1.6 31.3 229Tomatoes 0.4 6.8 47Corn..1 trace 27.3 316Potatoes§ 0.9 55.0 1,680
In solid waste
%N
Tomatol 2.33
t Shannon at al., 1968.Stanley Assoc., 1977; values are biochemical oxygen demand, BOD.
§ Smith et al., 1977.Timm, H., N. B. Akesson, M. O'Brien, W. J. Flocker, and G. York. 1976. Soil andcrop response to variable loading of canning wastes. Presented at Am. Soc. of Agric.Eng. Meeting, Davis, Calif., June 1976.

8 08 SMITH & PETERSON
cabbage (Brassica oleracea Capitata), and beet (Beta vulgaris L.) processingrelatively high N waste waters. The COD concentration of the waste water isalso included because in some waste materials, the COD and N concentra-tions have some interesting relationships. For example, potato-processingwaste waters have a COD/N ratio in the range of 25:1 to 30:1 representingfrom 3.3 to 4.0% N in the organic waste materials. Other vegetable pro-cessing wastes may have predictable COD/N ratios, but these data are notavailable.
Applying food processing waste water to land can supply largeamounts of N. Smith et al. (1975, 1978) and Smith (1976) showed thatpotato processors applied from 160 to 490 cm of waste water annually,which supplied from 1,080 to 2,200 kg N/ha. Potatoes are processed mostof the year and large amounts of waste water are discharged from the pro-cessing plants. Daily discharge ranges from 1.9 to 19 million liters. Thislong processing season often results in excessive N applications to the landused for waste water discharge. Other vegetables such as peas, green beans,sweet corn, tomatoes, and brussels-sprouts are processed for a much shorteiseason each year. Waste water from these processing operations is dis-charged to the land for only a few months, therefore, their fertilizer po-tential is much less than that from potato processing. The actual fertilizer Nobtained from processing these other vegetables is not known, but can becalculated from the general data in Table 8 if the amount of water availablefrom their processing is known.
Another factor related to N fertilization with waste water from vegeta-ble processing is the efficiency of conversion from the organic to availableN. De Haan et al. (1973) stated that waste water applications must be ad-justed so that plant nutrient as well as purification requirements are met. Tomeet plant nutrient requirements, the availability of plant nutrients in thewaste water must be known. They developed a "relative efficiency index"for N and other nutrients utilizing potato starch waste. The "relative ef-ficiency index" of potato starch waste N compared to commercial fertilizerN was as follows: potatoes, 0.5; beets, 0.5; cereals, 0.2; and grass, 0.8.These values need further verification in other climatic areas and with othersoils, waste waters, and crops than those in The Netherlands, but the con-cept is good.
Some vegetable processing operations generate a large quantity of solidor semisolid waste. In the potato processing industry, several kinds of solidwaste are generated. Waste water from the processing plants is usuallypassed through a primary clarifier, where the settleable solids are removedfrom the clarifier underflow and concentrated on a vacuum filter. Thesewastes contain from 6 to 15% dry matter with a N concentration similar tothat of the soluble COD that passes through the filter. The filter cake isusually fed to livestock as a substantial part of the fattening ration. Somepotato processors do not use a clarifier, but apply the solid wastes directlyto the fields. In this case, organic C and N loading is increased by the addi-tional solid materials resulting in a higher rate of N addition than withclarified waste effluent alone. Additional land should be used to assimilatethe additional nutrients. Other solid wastes include substandard products

RECYCLING OF N THROUGH WASTES 809
that must be discarded, soil, rock, and mud from transporting and washingthe potatoes. These waste materials are fed to livestock or are discarded onland or in landfills as appropriate. Other solid wastes encountered in vegeta-ble processing include peels from tomatoes and other vegetables, andpomace or pulp from tomato juice processing, or other similar materials.These are generally disposed of on land and contribute substantially to Nfertilization because they contain relatively high N concentrations. For ex-ample, Timm et al. (see footnote Table 8) reported that tomato wastescontain 2.3 0/o N on a dry weight basis.
2. SUGAR BEET PROCESSING LIQUID WASTES
Sugar beet processing waste water is being evaluated for irrigation useby Smith and others in Idaho (Smith & Hayden, 1980). Preliminary data arepresented in Table 9. In Idaho, sugar beets are processed mostly during thewinter season. Organic materials in the waste water pass through the soil.more readily than do potato processing wastes and the N also readilyleaches through the soil. Additional research is underway to improvecleanup and utilization of the sugar beet waste waters. The concentration ofwaste constituents in the waste water depends in part on the type of process-ing operation; however, the N rates in all these applications are high, butwhen divided by two or three seasons of fertilization they do not give ex-cessively high N fertilization rates.
3. FRUIT PROCESSING WASTES
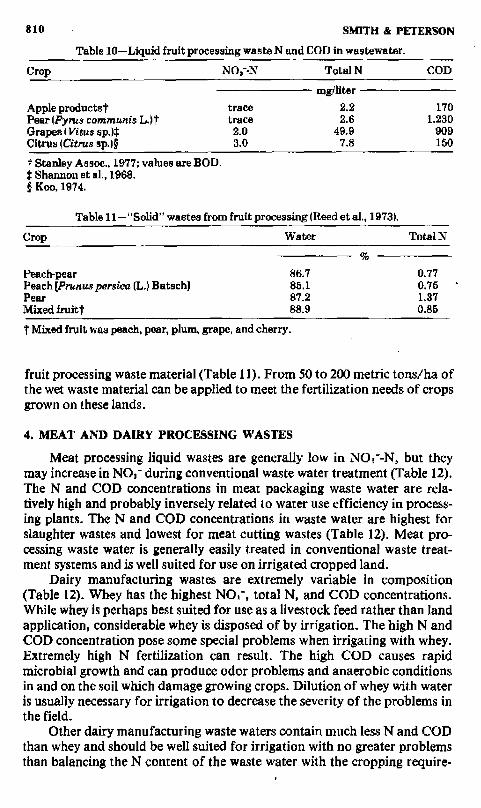
Fruit processing waste water data are rather scarce, but those few avail-able data indicate that except for grape wastes, these wastes are usually lowin N (Table 10).
Solid wastes from the fruit processing industry consist of fruit peels,pits, pomace, seeds, and stems. These wastes as applied to land for disposalare high in water. The N concentrations range from 0.77 to 1.37% andwhen applied to land, will supply from 1.2 to 1.8 kg N/metric ton of the wet
Table 9—Sugar beet processing plant waste water applied October 1975 toDecember 1977 /Smith et al., 1977; and unpublished data).
ProcessingWaste water
applied COD applied Nitrogen applied
cm mg/liter kg/ha mg/liter kg/ha
Twin Falls, Idaho
Sugar beets 142 3,580 42,930 104 1,330Juice - 1,990 53
Rupert, Idaho
Sugar beets 111 1,616 20,830 65 717Nampa, Idaho
Sugar beets 170 1,758 24,238 55 719Juice 660 14
810 SMITH & PETERSON
Table 10—Liquid fruit processing waste N and COD in wastewater.
Crop Total N COD
mg/liter
Apple productst trace 2.2 170Pear (Pyres cont►raunis L.)t trace 2.6 1,230Grapes ( Vitus sp4Citrus (Citrus sp.)§
2.03.0
49.97.8
909150
t Stanley Assoc., 1977; values are BOD.Shannon at al., /968.
§ Koo, 1974.
Table 11—"Solid" wastes from fruit processing (Reed et al., 1973).
'
Crop Water Total N
Peach-pear 86.7 0.77Peach [Prunus persica (L.) Batschl 85.1 0.75Pear 87.2 1.37Mixed fruit'[ 88.9 0.85
Mixed fruit was peach, pear, plum, grape, and cherry.
fruit processing waste material (Table 11). From 50 to 200 metric tons/ha ofthe wet waste material can be applied to meet the fertilization needs of cropsgrown on these lands.
4. MEAT AND DAIRY PROCESSING WASTES
Meat processing liquid wastes are generally low in NO,--N, but theymay increase in NO,- during conventional waste water treatment (Table 12).The N and COD concentrations in meat packaging waste water are rela-tively high and probably inversely related to water use efficiency in process-ing plants. The N and COD concentrations in waste water are highest forslaughter wastes and lowest for meat cutting wastes (Table 12). Meat pro-cessing waste water is generally easily treated in conventional waste treat-ment systems and is well suited for use on irrigated cropped land.
Dairy manufacturing wastes are extremely variable in composition(Table 12). Whey has the highest NO,-, total N, and COD concentrations.While whey is perhaps best suited for use as a livestock feed rather than landapplication, considerable whey is disposed of by irrigation. The high N andCOD concentration pose some special problems when irrigating with whey.Extremely high N fertilization can result. The high COD causes rapidmicrobial growth and can produce odor problems and anaerobic conditionsin and on the soil which damage growing crops. Dilution of whey with wateris usually necessary for irrigation to decrease the severity of the problems inthe field.
Other dairy manufacturing waste waters contain much less N and CODthan whey and should be well suited for irrigation with no greater problemsthan balancing the N content of the waste water with the cropping require-

RECYCLING OF N THROUGH WASTES 811
Table 12—Meat and dairy processing waste N and COD concentrations.
Source NON Total N
COD
mg/liter
In meat packing wastes
Catch basin effluenttExtended aeration influent*Extended aeration effluentsSlaughter waste, nontreated§Slaughter waste, treated§Custom meat cutting§
0.42.600.40
1249210691020
4,1801,630
1222,029
139139
Whey§Fresh milk packaging§Curds (waste not whey)§Condensed milk§Ice cream§
In dairy manufacturing wastes
7.8002.50
6852418
11
53,2252,290
7259621
f Tarquin et al., 1974.Witherow. 1975.J. H. Smith, Kimberly, Idaho. USDA-ARS, unpublished data from 24 meat and dairyprocessing plants in Idaho.
ments. Nitrogen efficiency factors for meat and dairy processing wastewater N are not yet available.
Paunch manure is probably the major waste from livestock slaughter-ing that would be used for fertilizer. According to Baumann (1971) paunchmanure contains approximately 2% total N on a dry weight basis. Thismaterial can be applied to fields and would be expected to produce an al-most immediate fertilizer benefit. Values for availability of paunch manureN should be similar to those of fresh livestock manure discussed earlier.There are no solid wastes associated with dairy manufacturing that wouldnormally be used for fertilizer.
B. Irrigating Agricultural Land
Application systems for food processing waste water fall into threedifferent categories:
1) Irrigation—Irrigating agricultural land to produce crops is the sys-tem most often used and has the advantage of conserving and usingat least part of the nutrients contained in the waste water. The watermay be applied by surface methods or by sprinkling. Surface appli-cation lessens NH, volatilization compared to sprinkling and can beused on some soils even in midwinter, as the heat in the water thawsthe soils and maintains infiltration. Sprinkling increases volatileNH, losses and creates some aerosol problems without utilizing thetemperature advantages of surface application.
2) High-rate Infiltration—When large volumes of waste water areapplied to sandy or gravelly soil where infiltration and percolation
812 SMITH & PETERSON
rates are very high, many nutrients are lost by percolation and plantnutrients are used inefficiently.
3) Overland Flow—This is a method of water application where soilsare relatively impermeable and the water is purified to some extentby contact with the growing vegetation, the organic matter laying onthe surface, and by limited contact with the soil. This method hasbeen studied by Gilde et al. (1971).
The most desirable waste water application method will be determinedby several factors that must be evaluated at each site when the systems aredesigned. The system used will influence nutrient recovery and the utiliza-tion of N. Two concepts of waste handling in relation to the nutrient con-tent are the disposal concept (the main consideration in infiltration-percola-tion systems), and the recycling-reuse concept. The recycling-reuse conceptis becoming much more important with developing energy shortages andincreased fertilizer cost. Many food processing waste treatment and dis-posal systems were designed to utilize the maximum rate of water and nutri-ents. Frequently, there was no other consideration than that a crop could begrown to keep the area looking acceptable and to avoid waste water applica-tions that would create nuisance situations such as ponding and objection-able odor. High land cost and proximity, and the necessity for landlevelingand water retention or recycling on the disposal and treatment site have ledto the concept of applying as much waste water as possible. In many cases,N loading is extremely excessive and pollution of soil and ground water andthe production of high NO 3 - forage results.
C. Nitrogen Loading and Utilization on Land
When food processing waste water is applied to agricultural land fortreatment and disposal, the first limiting factor in the system design is usual-ly the N application rate. Reasonable predictions of acceptable loading ratescan be made for a given site if soil conditions, type of crop to be grown,depth to water table, frequency and intensity of rainfall, and similar per-tinent information is available (Loehr, 1974). Nitrogen concentrations infood processing waste water varies widely, as discussed earlier. When de-signing or evaluating a food processing waste water irrigation field it isnecessary to obtain data on N concentrations in the waste water and theamount of water being applied.
Loading rates for food processing waste water irrigation are availablefor a few cases. Smith et al. (1975) studied waste disposal at five potato pro-cessing waste water irrigation systems in Idaho and calculated N applicationrates for the fields. Nitrogen applications ranged from 800 to 2,200 kg/haannually. These values are higher than the grass crops grown on the fieldscan be expected to utilize and will increase soil NO 3 - and possibly polluteground water under the fields. Adriano et al. (1974b, 1975) measured Nfertilization and utilization at two sites in lower Michigan. At one sitevegetables, fruit, and occasionally meats were processed for 20 years beforethe study was initiated and the waste water was applied to land that grew
RECYCLING OF N THROUGH WASTES 813
quackgrass (Agropyron repens (L.) Beauv.) that was clipped but notharvested. Average annual N application was 365 kg/ha. At the other site,dairy products were processed and the waste also applied to a field that grewquackgrass. Annual N application was 359 kg/ha. These application rateswere not excessive if the grass had been harvested and removed from thefields.
While N loading should be a primary consideration in designing foodprocessing waste water irrigation systems, the question of organic loadingshould also be considered. If the limits of N application are the amount ofN that can be utilized by crops, then organic matter application rates willseldom be excessive. Organic matter applications in waste water should belimited to the amount that will decompose during the time between applica-tions. The exception to this is wintertime irrigation with warm water whenthe organic matter accumulates. Jewell (1976) and Jewell and Loehr (1975)in field and laboratory experiments showed that under favorable condi-tions, soils that are conditioned to receive waste water containing organicmatter can utilize high loading rates. In laboratory experiments, they foundthat at 26°C removal efficiency was nearly 100% at a vegetable processingwaste water application rate of 19,000 kg COD/ha per day. Field samplingof waste water at two vegetable processing plant spray irrigation fields indi-cated that loadings up to 9,000 kg COD/ha per day were removed withX99% efficiency. While these removal rates may not be widely obtainable,the reports showed that food processing wastes are readily treated in thefield and that the capacity of the soil to assimilate these types of organicwastes is very large.
The data reported earlier showed that most food processing wastewater contains highly variable concentrations of NH 4* and organic N.During waste treatment or decomposition in soil, the organic N is convertedto NH 4 *. The capacity of soils to absorb NH 4 + is generally considered to bequite high. However, in cases where large amounts of NI4 4+ or readilymineralized organic wastes are applied to soil, the exchange capacity of thesoil may be exceeded and NI-14 • may migrate. Lance (1972) developed amethod for calculating potential NH 4 migration in soil and related it to theN114 4 adsorption ratio (AAR). This relationship is similar to the Na adsorp-tion ratio that is used extensively in evaluating Na movement in soils. TheAAR is calculated as:
NH 4 *AAR — [ 1/2 (Ca') + 1/2 (Mg2+)1 1"
where concentrations are expressed in meq/liter. As this ratio increases theexchangeable NH4 + percentage increases. In high infiltration rate soils, theadsorption of NH4* is not a very important N removal factor because thesoils are soon saturated with NH 4*. But in agricultural soils that have a highCEC, most of the NI-1 4 +-N can be removed from the waste water used for ir-rigating crops. The NI-1 4 • will subsequently be converted to NO,- in theaerated soil between waste water irrigations.

814 SMITH & PETERSON
D. Nitrification and Denitrification
The organic materials contained in the waste water from vegetable andfruit processing are mostly water soluble, readily decomposable, and have arelatively low molecular weight. Before application, much of the wastewater is filtered leaving only the soluble and reflocculated organic materi-als. This is evident in the extremely rapid decomposition rates observed byJewell (1976) with vegetable processing waste water organic materials. Asthese organic materials rapidly decompose, the organic N is also rapidlyconverted to NH 4* and then to NO,-. Ammonification is seldom a rate-limiting step and crops grown on the waste water treated fields will usuallyhave adequate or excessive N. The waste water organic matter is usuallyadequate to high in N and decomposition is seldom slowed by N deficiency.
Excessive amounts of N are often added in food processing wastewater, indicating that denitrification must also be considered. Smith et al.(1976) determined the potential for denitrification in a field irrigated withpotato processing waste water. About 2,400 kg N/ha was applied during 2years of irrigation. The saturated zone in the soil rose from below 140 cm tothe 65-cm depth. Anaerobic conditions were measured at the 65-cm depthby platinum electrodes. The soluble organic material that leached to 65 cmprovided energy for the denitrifying microorganisms, and denitrification re-moved nearly all of the NO,-. In another experiment with a deep water table( > 25 m), Smith et al. (1978) showed that denitrification could be enhancedby irrigating with high organic waste water at strategic times during thewarm season. This lowered redox potentials and promoted denitrification.All irrigations lowered redox potentials, but only irrigations with high or-ganic waste water during warm weather lowered the redox potentialsufficiently that denitrification occurred. These studies showed that denitri-fication can be managed and used as a tool to regulate leaching and loss ofN to the ground water in waste water treatment and disposal fields.
E. Pollution Potential
Irrigating with food processing waste water in many cases applies Ngreatly in excess of that required for growing crops and management be-comes the key to pollution control. Adriano et aI. (1974b, 1975) measured Nleaching in the study cited previously and found that when the grass grownon the fields treated with waste water was not harvested and removed, mostof the applied N was leached. For fields receiving 365 kg and 359 kg N/haper year, 76 and 69% of the added N was leached, respectively. Much of theleaching loss probably represented N that had been returned to the field inunharvested quackgrass.
In contrast to Adriano's experience, Smith et al. (1976) showed that or-ganic matter from potato processing waste water applied to soil the previouswinter decomposed as soil temperatures increased in the summer, releasingN that was utilized by growing grass. The excess N was denitrified as it

RECITLING OF N THROUGH WASTES 815
leached into the anaerobic zone near the water table. In this case, a largeexcess of N was disposed of without polluting the ground water. Whenirrigating with relatively high organic waste water, it is possible to managethe soil redox potentials to develop occasional low redox conditions thatwill denitrify any excess NO,- when needed, even in soil without a highwater table. Temporary artificial water tables develop in the soil at soilparticle size phase changes such as a change from silt loam to gravel, andthese can be made anaerobic rather readily by irrigating with water with ahigh oxygen demand.
In a well-managed system in California, Meyer (1974) reported NO,-buildup in the soil at depths to 90 cm when irrigating with waste water fromfruit and vegetable processing. He was able to grow a winter cereal crop inaddition to the summer vegetation and remove most of the residual N fromthe soil profile that had accumulated during waste water irrigation. This de-creased NO leaching and ground water pollution.
Timm et al. (see footnote Table 8) applied large quantities of tomatoprocessing waste solids to fields at rates from 448 to 1,792 metric tons/ha.This applied 1,461-5,844 kg N/ha which created a lodging problem whengrowing barley. Excessive NO,--N accumulated (up to 8,700 Aglig in thegrowing crop), with severe potential for NO leaching through the soil andinto the ground water.
IV. MUNICIPAL WASTES
A. Sewage Effluent
In an effort to provide clean rivers and lakes the U.S. Congress passedPublic Law 92-500 in 1972 requiring fishable and swimmable waters by1983. The cost of doing this with conventional waste water treatment meth-ods will be very high. This law created a renewed interest in using soil torenovate waste water. Secondary benefits of this system include water andplant nutrient conservation. Basically there are three methods of using landfor renovating waste water: (i) high-rate infiltration, (ii) overland flow, and(iii) crop irrigation.
1. HIGH-RATE INFILTRATION
High-rate infiltration relies on the physical, chemical, and biologicalproperties of the soil profile to remove impurities from waste water. Anintensive study of this method was started at Phoenix, Arizona in 1967(Bouwer et al., 1974b). This site is in the Salt River Valley with a fine loamysand (0-0.9 m) underlain with layers of sand, gravel, boulders, and traces ofclay 75 m deep, where there was an impermeable clay layer. The static watertable was at 3 m.
Secondary effluent was applied to the infiltration bed for 10-30 daysfollowed by a 10- to 20-day drying period. The maximum hydraulic loadingwas 122 m/year using a 20- to 30-day effluent loading and a 10- and 20-day

816 SMITH & PETERSON
drying period for summer and winter, respectively. However, Bouwer et al.(1974a) found that a loading of 91 m effluent/year resulted in removal of30% of the applied N. The effluent contained 20-40 mg NH 4*-N, 0-3 mg
0-1 mg NO,--N, and 1-6 mg organic N/liter which resulted in a Naddition of about 28,000 kg/ha. The wet-dry cycle used was 10 days wet and10-20 days of drying. Oxygen and organic C were the limiting factors fordenitrification. The effluent from the infiltration basin was suitable forunrestricted crop irrigation and recreation in Arizona.
Satterwhite et al. (1976) reported on a year-round rapid infiltration sys-tem at Fort Deven, Mass. which has been receiving unchlorinated Imhoffeffluent since 1942. The infiltration beds were underlain with silty sand tosandy gravel with 10 to 15% silt and clay. The annual effluent applicationwas 27.1 m with a 2-day application and a 14-day drying period. A total-Nbalance showed a 60-80% reduction in total N, primarily by denitrification.The ground water in the immediate area contained from 10 to 20 mg NO,--N/liter.
In comparing the warm-arid and the cold-humid locations from thepreviously noted studies, the cold-humid site had a greater N reduction.This may possibly have been caused by higher organic C in the Imhoff efflu-ent, lower loading rate, and long drying cycles, which allowed more time forN mineralization at the cold-humid site. Bouwer et al. (1974a) showed80-90% denitrification when glucose was added to the system to supply or-ganic C. In both of these locations the ground water quantity and qualitywere affected. The NO,- concentration of the ground water was increased,but this impact was ameliorated by lateral NO movement at the FortDeven site and pumping NO containing water to the surface for crop irri-gation and nutrient utilization by growing plants at Phoenix.
High-rate infiltration is best suited to areas where water conservation isessential and the soil is deep and permeable. Control of the ground water atthe site is necessary and this can be done using tile drains or recovery pumps(Reed, 1972). This high-rate infiltration system may also be suited to someseasonal operations such as canners or summer camps. With propermanagement, this system can be very successful. The N in this treated wateris readily available to growing crops.
2. OVERLAND FLOW
Overland flow systems rely on the controlled release of waste water ef-fluent onto sloping land. The water ideally should flow in sheets through agrass cover. This system is suitable for very slowly permeable soils. Pre-cision grading is advisable to optimize the renovation process. Hunt (1972)stated that there are five primary mechanisms of stripping N from wastewater during overland flow: (i) removal by plants, (ii) immobilization in thecells of the expanding aerobic heterotrophic microbial population, (iii)gaseous loss of NH, on alkaline soils, (iv) micosite-slime layer denitrifica-tion, and (v) the conversion of N into stable organic matter.
The N removal by plant harvesting can be quite significant. At Paris,Texas, 42% of the applied N was removed with the harvested forage crop
RECYCLING OF N THROUGH WASTES 817
(Hunt, 1972). However, in a sparse pine forest little N was removed by thevegetation and no improvement was realized on frozen ground (Sopper,1968). The immobilization of N by the expanding microbial population andthe conversion of N into stable organic matter may be significant during thestartup of an overland flow site, but when the system reaches steady-statethese two mechanisms are of minor significance.
Slime layer denitrification tends to occur on wet areas where the wastewater is repeatedly applied. This process is similar to a trickling filter withits slime-layer on the media.
Raw waste water from Melbourne, Australia is treated in the winter byoverland flow through Italian ryegrass (Lolium perenne L.). The retentiontime of the field is about 2 days and the ryegrass is grazed during thesummer when the site is not being treated. Seabrook (1975) estimated 60%total N removal with this system. The raw waste water contained 14.3 mgorganic N, 35 mg NH 4'-N, 0.75 mg NO 2 --N, and q NO 3--N/liter. Dailyapplication during the winter was about 1.9 cm.
The overland flow system can handle more effluent than the crop irri-gation system, and the treated water goes to surface streams with someevaporation and percolation. The N removal is primarily by plant uptakeand denitrification. Overland flow can be a viable means of waste waterrenovation if the system is managed properly and the waste water applica-tion rate does not exceed the removal capacity of the soil and crop pro-duced.
3. CROP IRRIGATION
Crop irrigation maximizes both water renovation and plant nutrientconservation. The effluent is generally applied to crops by overhead sprink-ler or flooding at rates of 0.6-2.4 m/year.
The success of waste water renovation will be dependent on the cropselected. Long season high-yielding sod crops utilize more N than annualcrops. Hook and Kardos (1977) reported reed canarygrass (Phalarisarundinacea L.) receiving effluent daily at a rate of 5 cm/week provided57-71% removal by forage harvest and the concentration of NO 3 --N in theground water was generally below 10 mg/liter. An effluent ratio of NH4 +-N/N0,--N of 2:1 resulted in less NO 3 --N loss to recharge water than whenthe sewage treatment plant produced effluent having a NI-14 •-N/NO 3 --Nratio from 1:2 to 1:5. At Hanover, New Hampshire Iskandar et al. (1976)observed the NI-14 •-N remained in the top 45 cm of the soil profile during thewinter. In the summer, almost all the NH4` was nitrified to NO 3 -.
In a study by Clapp et al. (1977) in Minnesota, forages utilized Nthroughout the growing season better than did corn. Over the entire grow-ing season, less NO 3 - and NH„ •-N were present in the soil water (60- and125-cm depth) when 415 kg N/ha from effluent than when 341 kg N/hafrom inorganic fertilizer was applied.
Irrigation of trees with sewage effluent appears most promising on ayoung, fast growing forest because N uptake is greatest during this growthtime. Sapper (1968) reported the renovation efficiency of the forest de-

818 SMITH & PETERSON
creases with time because there is no annual harvest. During the early stagesof effluent application, the N content of the tree leaves, the soil biomass,and the soil organic matter increases; however, this condition eventuallyreaches a new steady state, and the N utilization and water renovation de-creases unless the trees are harvested. Sopper (1968) reported a mixed hard-wood forest site in Pennsylvania which was capable of renovating sewageeffluent for ground water recharge. Hook and Kardos (1977) reported no Nrenovation was observed on this same site during 1973 after 8 years of year-round operation.
The selection of crops to be irrigated with sewage effluent is limited.Baler and Fryer (1973) reported stone fruits, citrus, grapes, sugar beets,potatoes, avocados, apples, melons, and squash were of lower quality whenfertilized with sewage effluent, as compared with chemical fertilization andirrigation. They attributed this, in part, to the continuous addition of Nthroughout the growing season. Since the N is only needed for vegetativeplant growth, this problem could have been reduced if an alternate watersource were used during the period of fruit set. Day and Tucker (1959) re-ported that sewage effluent-irrigated wheat and oats produced 263 and249 0/13 more pasture forage, respectively, than did check plots that receivedonly pump water. Barley was more sensitive than wheat to the detrimentaleffects of sewage effluent. Corn yields may be reduced from effluent irriga-tion because the effluent N concentration is not high enough during thecritical period of corn growth, unless supplemented by N fertilizer. Hookand Kardos (1 977) observed the greater N leaching with corn because thehighest rainfall occurs in the spring and fall when the cropped land is notirrigated. They also found that double-cropping or no-till planting can re-duce the movement of NO 3 - to the ground water. This system of using theplant to hold the NO in the surface soil has the added benefit of reducingsoil erosion. The management of a no-till system is more difficult than con-ventional tillage and with some soils periodic deep tillage is needed tomaintain the infiltration capacity.
Treated sewage effluents can be effectively used as a source of N forgrowing crops if the crop N requirements are considered and N is either sup-plemented or withheld as the need develops. In addition, sewage effluentwill be further purified, ground water can be recharged, and excess wastewater disposed by this efficient method.
B. Sewage Sludge
I. SLUDGE PROPERTIES
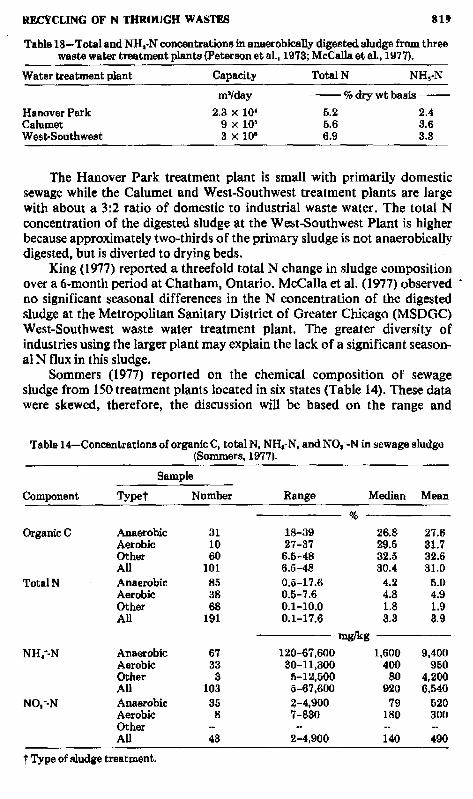
Sewage sludge is obtained from waste water treatment. The N contentof the sewage sludge depends on the nature of the waste water, type and ex-tent of waste water treatment, type of sludge stabilization, and age of thesludge. Table 13 gives N concentrations of the anaerobically digested sludgefrom three sewage treatment plants with primary and waste-activatedsecondary waste water treatment.
RECVCLING OF N THROUGH WASTES 819
Table 13—Total and NI-1.-N concentrations in anaerobically digested sludge from threewaste water treatment plants (Peterson at aL, 1973; McCalla et aL, 1977).
Water treatment plant
Capacity Total N
mgclay % dry wt basis
Hanover ParkCalumetWest-Southwest
2.3 x 10'9 x 10'3 x 10°
5.2 2.45.6 3.66.9 3.3
The Hanover Park treatment plant is small with primarily domesticsewage while the Calumet and West-Southwest treatment plants are largewith about a 3:2 ratio of domestic to industrial waste water. The total Nconcentration of the digested sludge at the West-Southwest Plant is higherbecause approximately two-thirds of the primary sludge is not anaerobicallydigested, but is diverted to drying beds.
King (1977) reported a threefold total N change in sludge compositionover a 6-month period at Chatham, Ontario. McCalla et al. (1977) observed 'no significant seasonal differences in the N concentration of the digestedsludge at the Metropolitan Sanitary District of Greater Chicago (MSDGC)West-Southwest waste water treatment plant. The greater diversity ofindustries using the larger plant may explain the lack of a significant season-al N flux in this sludge.
Sommers (1977) reported on the chemical composition of sewagesludge from 150 treatment plants located in six states (Table 14). These datawere skewed, therefore, the discussion will be based on the range and
Table 14—Concentrations of organic C, total N, NH,-N, and NO„--N in sewage sludge(Sommers, 1977).
Sample
Component Typet Number Range Median Mean
Organic C Anaerobic 31 18-39 26.8 27.6Aerobic 10 27-37 29.5 31.7Other 60 6.5-48 32.5 32.6All 101 6.5-48 30.4 31.0
Total N Anaerobic 85 0.5-17.6 4.2 5.0Aerobic 38 0.5-7.6 4.8 4.9Other 68 0.1-10.0 1.8 1.9AU 191 0.1-17.6 3.3 3.9
mgikg
NH,'-N Anaerobic 67 120-67,600 1,600 9,400Aerobic 33 30-11,300 400 950Other 3 5-12,500 80 4,200All 103 5-67,600 920 6,540
NO.--N Anaerobic 35 2-4,900 79 520Aerobic 8 7-830 180 300Other --AU 43 2-4,900 140 490
t Type of sludge treatment.

8 2 0 SMITH & PETERSON
median values only. The NH4 -N constituted 28% of the total N present inanaerobically digested sludges. King (1977) reported 29% of the total N inanaerobic sludge was NH.'-N, ranging from 15 to 59%.
The organic C concentration in the sludges of unspecified treatmentswas the highest and the N concentration was the lowest. The resulting C/Nratio was 18. The C/N ratios of the anaerobic and aerobic sludges were 6.4and 6.1, respectively. Peterson et al. (1973) reported 21% of the volatilesolids were hexane-soluble materials. Varanka et al. (1976) reported that19% of the total organic fraction of anaerobically digested sludge was fats,oils, and waxes. The other organic C materials include polysaccharides andproteinaceous constituents (Sommers, 1977).
The presence of NO,--N in sewage sludge is a function of sludge ageand moisture content. Nitrate is not present in anaerobic sludge freshlydrawn from a digester. However, during storage in an open lagoon the solidfraction settles, and the liquid fraction, which contains most of the NH,*, isoxygenated by wave action and nitrification can occur.
2. SLUDGE NITROGEN REACTIONS IN SOIL
When sewage sludge is applied to land, the following physical andmicrobiological processes occur: decomposition, ammonification, nitrifica-tion, immobilization, volatilization, and denitrification. Additions ofsludge to the soil cause a rapid growth of zymogenous microorganisms thatthrive on the sludge organic fraction.
The biological activity of a sludge-amended Blount silt loam soil (fine,illitic, mesic Aerie Ochraqualfs) was studied by Varanka et al. (1976). Thesoil had been receiving liquid digested sewage sludge for 6 years and was incontinuous corn production. The total accumulative sludge application (drywt) ranged from 0 to 369 metric tons/ha. Table 15 presents the concentra-tions of the major organic matter fractions found in the soil during the sixthyear of sludge application and in the sludge used in 1973 and 1974.
The soil concentration of fats, waxes, and oils increased most withthese sludge additons. This fraction is rather stable in soils. The total or-ganic C nearly doubled with the addition of 180 metric tons organic matterfrom the sludge. About 50% of this C was evolved during the 6 years.
Soils were collected on three dates in 1974 for bioassays. Liquid sludgewas first applied (15 July) after the second sampling (Varanka et al., 1976).Their data showed no clear proof of restrictions in microbial populationsand enzyme activities. The percentage of denitrifiers and the protease andamylase activities increased as a result of sludge additions and invertase andurease activities were unaffected by sludge treatments. The actinomycetespopulation increased with rate of sludge additions after the 15 July sludgeapplication. Also, the soil was drier at the last sampling (29 August). Thisfavored actinomycetes growth over fungi and bacteria. The CO, evolutionwas always positively correlated with the amount of sludge applied.
The decomposition rate of digested sludge in soil was studied by Miller(1974) at 1/3 bar and saturated soil water contents and at application ratesof 90 and 224 metric tons dry sludge/ha for I, 3, and 6 months. Incubation
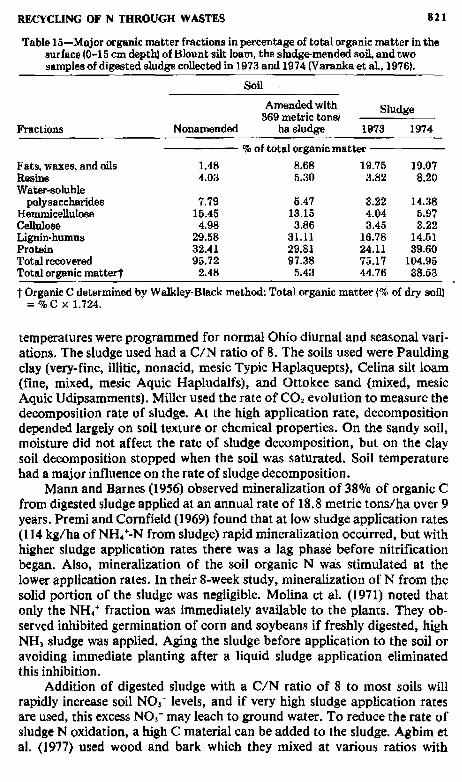
RECYCLING OF N THROUGH WASTES 821
Table 15-Major organic matter fractions in percentage of total organic matter in thesurface (0-15 cm depth) of Blount silt loam, the sludge-mended soil, and twosamples of digested sludge collected in 1973 and 1974 (Varanka et al., 1976).
Soil
Fractions Nonamended
Amended with369 metric tons/
ha sludge
Sludge
1973 1974
% of total organic matter
Fats, waxes, and oils L48 8.68 19.75 19.07Resins 4.03 5.30 3.82 8.20Water-soluble
polysaccharides 7.79 5.47 3.22 14.38Hemmicellulose 15.45 13.15 4.04 5.97Cellulose 4.98 3.86 3.45 3.22Lignin-humus 29.58 31.11 16.78 14.51Protein 32.41 29.81 24.11 39.60Total recovered 95.72 97.38 75.17 104.96Total organic mattert 2.48 5.43 44.76 38.53
t Organic C determined by Walkley-Black method; Total organic matter (% of dry soil)% C x 1.724.
temperatures were programmed for normal Ohio diurnal and seasonal vari-ations. The sludge used had a C/N ratio of 8. The soils used were Pauldingclay (very-fine, illitic, nonacid, mesic Typic Haplaquepts), Celina silt loam(fine, mixed, mesic Aquic Hapludalfs), and Ottokee sand (mixed, mesicAquic Udipsamments). Miller used the rate of CO, evolution to measure thedecomposition rate of sludge. At the high application rate, decompositiondepended largely on soil texture or chemical properties. On the sandy soil,moisture did not affect the rate of sludge decomposition, but on the claysoil decomposition stopped when the soil was saturated. Soil temperaturehad a major influence on the rate of sludge decomposition.
Mann and Barnes (1956) observed mineralization of 38% of organic Cfrom digested sludge applied at an annual rate of 18.8 metric tons/ha over 9years. Premi and Cornfield (1969) found that at low sludge application rates(114 kg/ha of NH,'-N from sludge) rapid mineralization occurred, but withhigher sludge application rates there was a lag phase before nitrificationbegan. Also, mineralization of the soil organic N was stimulated at thelower application rates. In their 8-week study, mineralization of N from thesolid portion of the sludge was negligible. Molina et al. (1971) noted thatonly the NH,' fraction was immediately available to the plants. They ob-served inhibited germination of corn and soybeans if freshly digested, highNH, sludge was applied. Aging the sludge before application to the soil oravoiding immediate planting after a liquid sludge application eliminatedthis inhibition.
Addition of digested sludge with a C/N ratio of 8 to most soils willrapidly increase soil NO,- levels, and if very high sludge application ratesare used, this excess NO may leach to ground water. To reduce the rate ofsludge N oxidation, a high C material can be added to the sludge. Agbim etal. (1977) used wood and bark which they mixed at various ratios with

8 2 2 SMITH & PETERSON
sludge to regulate the rate of CO, evolution. The greatest rate of CO,evolution was with sludge alone, and as the ratio of either wood or a wood-bark mix was increased, the rate of CO, evolution decreased. The net resultsare that by proper management of this sludge-wood mixture, sludge can beapplied at higher application rates, the soil organic content will be in-creased, the crop will have a more uniform supply of NO 3 -, and the excessNO,- will be less apt to leach.
Composted sludge and wood chips were studied in soil by Tester et al.(1977) in a laboratory incubation experiment. The evolved CO, and NH,were measured, as well as the remaining C and N fractions in the soil. In 64days of incubation, 16% of the sludge-compost C was evolved and NH,volatilization was minimal, regardless of soil texture. Approximately 6% ofthe compost N in the loam sand treatment had mineralized after 54 days.Evidence of interlattice NI-1 4 + fixation was noted in the silt loam and siltyclay soils. Ryan and Keeney (1975) reported that when waste water sludgewas applied to the soil surface, 11-60% of the applied NH,-N was lost byvolatilization. These losses decreased as the clay content of the soil in-creased. Volatilization rate increased with increasing rate of sludge applica-tion and with repeated application of sludge.
Gilmour and Gilmour (1979) developed a computer simulation modelof sludge decomposition. The model used first-order kinetics and con-sidered temperature and water content changes during decomposition.Sludge was considered to have a rapid and a slow decomposing phase.Model output showed sludge half-life to be 13-51 months depending ontemperature and moisture regimes. The month of sludge addition to the soilhad little effect on sludge half-life. Monthly temperature and moisture datagave better values of half-life than annual average data. When "optimum"data were inserted into the model, half-life was reduced by a factor of 2 to 7and they concluded that laboratory studies under "optimum" conditionswould greatly underestimate half-life under field conditions.
Peterson et al. (1973)2 studied NH, volatilization and NH,* fixation bysludge fertilized calcareous strip-mined spoil material (pH 7.8). During this2-week laboratory experiment, fixed, exchangeable, and water-solubleNH4 + were measured. The highest liquid sludge treatment was equivalent to89.6 metric tons/ha dry solids (1,622 kg NH4 4-N/ha). This spoil materialhad a 28% clay content. The dominant clay mineral was illite (54%).Kaolinite, chlorite, and vermiculite were estimated to be 28, 8, and 11% ofthe total clay fraction, respectively. The surface area of the clay fractionwas 138 m2 /g which indicated a small quantity of expandable clay minerals.This experiment indicated that 35% of the added NF14 + was fixed by the clayminerals. After 2 weeks of incubation, up to 14.7% of the added NH 4+ waswater-soluble and 8.7% was exchangeable. By difference, the NH,volatilization was calculated to be about 50%, regardless of sludge applica-tion rate, with most of this loss occurring during the first week. No NO or
J. R. Peterson, 3, Gschwind, L. Papp-Vary, and R. L. Jones. 1973. Ammonia volatiliza-tion and ammonium fixation by sludge fertilized strip-mined spoil material. Agron. Abstr. p,180.
RECYCLING OF N THROUGH WASTES 823
NO was detected in the soil after the first or second week of the experi-ment.
Keeney et al. (1975) estimated that 15-.20% of the sludge N is miner-alized the first year and, after initial application, about 6, 4, and 2% of theremaining N is released for the 3 subsequent years.
King (1973) found that in 18 weeks 22% of the surface-applied and38% of he incorporated sludge N was mineralized. Surface application ofsludge resulted in 36% of the applied N being lost and incorporation re-sulted in a 22% loss in 18 weeks. Only a small part of this loss was NH,volatilization. King concluded that denitrification was the major pathwayof N loss. The large addition of organic materials provides the energysource required for denitrification and causes an 0, depletion with the risein microbial activities. Using this concept, weekly or biweekly addition ofliquid sludge on cropland should increase the denitrification rate just asBouwer et al. (1974b) observed with waste water.
The Illinois Environmental Protection Agency' has proposed NH, -volatilization rates of 50% of the sludge NH 4 + on sandy and nonsandy soilsand a 75% volatilization rate on clay-type soil if the sludge is left on the soilsurface. They estimated a 50% loss on sandy soils and a 20% loss on silt andclay-type soils if the sludge is applied by shallow incorporation, such asdiscing. If the sludge is applied by deep incorporation, such as plowing, thevolatilization rate was estimated at 50% on sandy soils and zero on finertextured soils.
To conserve the sludge N, the liquid sludge should be promptly in-corporated into the soil. Conversely, to apply the maximum amount ofsludge without exceeding the capacity of the crop-soil system and losingNO,- to the aquifer, the sludge should be aged, dewatered, and surfaceapplied. The NH, volatilization rate will approach 50% with NH, surfaceapplication and with sludge incorporation the gaseous NH, losses will de-crease as the depth increases and the soil texture becomes finer. The miner-alization rate of the organic N in the sludge is greater at warmer soiltemperatures.
3. PLANT RESPONSES TO SLUDGE NITROGEN
To the agronomist, the use of sewage sludge on land must result in anincrease in crop quality and quantity. To this end a great deal of researchhas been done. Kelling et al. (1977b) reported optimum rye and sorghum-sudan (Sorghum bicolor x S. Sudanese) forage yield with the application of7.5 metric tons/ha sludge solids on Plano silt loam (fine-silty, mixed, mesicTypic Argiudolls) and with 15 metric tons/ha on Warsaw sandy loam (fine-loamy over sandy or sandy-skeletal, mixed, mesic Typic Argiudolls) duringthe year of application. Yield of the first crop following the application of30- and 60-metric tons/ha sludge was depressed, possibly because of excesssoluble salts present in the sludge. The residual effects of the sludge were
' Design criteria for municipal sludge utilization on agricultural land—draft copy-2nd ed.Tech. Policy WPC-3. Illinois EPA, Springfield. 1977.35 p.
824 SMITH & PETERSON
observed in the crop yield for at least 3 years. Over the 4-year period, 50%of the available N was recovered by the crops at the lower sludge treatmentrates and 14% of the available N was recovered at the 60-metric ton/haapplication rate.
Coker (1966) observed grass-clover yield increases of 15.2 kg/ha dryforage, for sludge applied at a low rate (70 kg N/ha), and 11 kg dry forage/kg N when applied at a high rate (132 kg N/ha). Stewart et al. (1975) re-covered 12% of the sludge N in the corn crop with an application of 400 kgsludge N/ha. Higher rates of sludge application resulted in a less efficientutilization of the sludge N by the corn.
Hinesly et al. (1979) studied the residual effect of digested sludge oncorn. Sludge had been applied for 5 years with a maximum total applicationof 61.1 metric tons/ha of sludge solids for an average of 12 metric tons/haper year. From 1974 to 1977, corn was grown on these plots without addingmore sludge. In 1976 and 1977 significantly higher corn yields were ob-tained with the highest sludge application. During the years of sludge appli:cation, corn yields were higher at all rates of sludge application compared toinorganic fertilizer. The total N and organic C concentration of the 0- to 15-cm soil depth increased with increasing sludge application and the residualtotal N and organic C remained stable 4 years after the sludge applicationstopped.
If high sludge application rates are necessary for the operation of asludge disposal site and if the climate is warm and humid, coastal bermuda-grass (Cynodon dactylon L. Pers.) with a winter rye (Secale cereale L.)cover crop may prove to be the best user of sludge N. King and Morris(1972) reported 63% of the sludge-applied N was used by this croppingcombination. The sludge supplied 724 kg N/ha per year. The N concentra-tion of the forage increased with increasing rates of sludge application. Thelonger the growing season of the crop, the less chance NO has to leach be-low the root zone.
The renewed interest in sludge use on land was not primarily because ofits fertilizer potential, but rather as an alternative to other methods ofsludge disposal. Ecologically, all methods have good and bad points. In themid-1970's, because of the oil embargo and threats of future oil shortages, agreat deal of the organic fertilizer stockpile was reduced. Depending on thequality of the waste, some sources, such as animal manures, were com-pletely cleared. Sewage sludges in the smaller cities were often used for theirfertilizer value. In the large cities this also occurred, but owing to the size ofthe stockpiles, the distance, and the nature of some of the sludges, completeremoval of all sludges has not occurred.
4. POLLUTION
This discussion will be limited to N. The application of sludge on landmay cause N enrichment of surface and ground waters. If rates and time ofapplication of sludge on cropland are properly managed, the amount of Nreaching surface and ground water can be held to a reasonable level.

RECYCLING OF N THROUGH WASTES 825
At high sludge application rates, better management is necessary tohold surplus N in the soil and in the root zone. The practices of double crop-ping (King & Morris, 1972; Hook & Kardos, 1977) adding wood products(Agbim et al., 1977), composting with carbonaceous wastes (Epstein et al.,1978), or intermittent applications of liquid sewage sludge with dry cyclesbetween application (Bouwer et al., 1974a) can effectively immobilize orvolatilize a part of the sludge N added to the soil. The ideal situation is to re-tain N in the root zone.
Kelling et al. (1977a) reported improved soil aggregation and increasedinfiltration with sludge application to the soil. Runoff water from a sludge-treated soil slightly increased in organic N but organic N and sediment loadwere decreased. Peterson et al. (1979) observed no change in total N concen-tration of runoff water after 5 years of sludge application in two water-sheds. A decrease of NH.'-N in one watershed and no change in the otherwas observed after 5 years. An increase from 0.09 to 1.61 mg (NO2 - +NO,-)-N/liter in one watershed and from 0.04 to 0.88 mg (NO,- + NO,-)-N/liter in the other watershed was observed after 5 years of sludge applica-tion.
Atmospheric NH, concentration over a sludge-fertilized field wasstudied by Beauchamp et al. (1978). They observed the maximum NH, fluxoccurred about midday. The half-life or time necessary to lose 50% of theammoniacal N (NH,-N and exchangeable NH, +-N) in the sludge was 3.6days in May and 5.0 days in October. During the 5-day experiment in May,60% of the 150 kg/ha ammoniacal N applied in the sludge was volatilized,while during the 7-day experiment in October 56% of the 89 kg/ha am-moniacal N applied was volatilized. The gaseous NH, may be absorbed bythe surrounding vegetation, surface water, or soil (Denmead et al., 1976).
Y. SUMMARY
Crop residues produced annually in the USA amount to approximately208 million metric tons, which contain 3.56 million metric tons of N. Mostof the residues are returned to the soil to supply plant nutrients and organicmatter. Turnover in the organic waste materials depends upon their originalN percentage and a number of other factors with N release from low Nresidues being slow and from higher N residues relatively rapid. Rice resi-dues produced outside the USA amount to 454 million metric tons annually;they contain 2.3 million metric tons N. In lowland rice culture, the riceresidues containing approximately 0.5% N, have adequate N for optimumdecomposition rate, and will supply some of the N needed for the succeed-ing crop of rice. With the exception of highly acid soils, most organic wastesdecompose rapidly with 33% remaining after 1 year and 20% after 5 years.
Animal manure production in the USA is approximately 2 billion tonsannually. Manure decomposes fairly rapidly in soil releasing some of thecontained N at relatively predictable rates depending upon composition.Several models have been developed for manure decomposition and N re-

8 26 SMITH & PETERSON
lease. Large amounts of manure may be applied for disposal or smallamounts for growing crops, the latter is preferred. Pollution of soil andwater will probably result from high manure applications, but is not likely ifthe rates are below 20 metric tons/ha.
A wide variety of vegetables, fruits, meats, and dairy products,amounting to an estimated 56 million metric tons/year are processed thatproduce large amounts of solid and liquid waste materials containing about35,000 metric tons N. Most of these waste materials are suited for use onland for fertilization and irrigation of crops. The organic matter in thewastes decomposes rapidly in soil, releasing the N. Most food processingwastes contain high enough N concentrations that they readily serve assources of fertilizer nutrients. Decomposition is seldom limited by Ndeficiency in food processing wastes. Overfertilization and potential forpollution of soil and ground water can be a problem with many food pro-cessing wastes. Dairy manufacturing and meat packing wastes may needpretreatment or special handling because of unusually high COD and Nconcentrations in the waste materials to avoid soil and ground-water pollu-tion and other problems such as odors.
Municipal waste effluents are being used extensively for irrigation andfertilization of agricultural crops or for reclamation on land. Distributionmethods include high-rate infiltration, overland flow, and crop irrigation.The choice of methods of water distribution is site dependent. Some of themethods are capable of recharging surface and ground water, and providingwater and nutrients for growing plants. Nitrogen in these previously treatedwaste waters is usually NH4* or NO and is readily available to growingplants. Nitrogen fertilization can be efficient and turnover rates rapid withirrigation using municipal waste water. Nitrogen mineralization in sewagesludge is relatively slow compared with municipal effluents and other wastematerials.
LITERATURE CITED
Adriano, D. C., A. C. Chang, and R. Sharpless. 1974a. Nitrogen loss from manure as in-fluenced by moisture and temperature. J. Environ. Qual. 3:258-261.
Adriano, D. C., A. E. Erickson, A. R. Wolcott, and B. G. Ellis. 1974b. Certain environmentalproblems associated with longterm land disposal of food processing wastes. p. 222-244.In Process Manage. Agric. Wastes Proc., 6th Cornell Agric. Waste Manage. Conf.
Adriano, D. C., L. T. Novak, A. E. Erickson, A. R. Wolcott, and B. G. Ellis. 1975. Effects oflong-term land disposal by spray irrigation of food processing wastes on some chemicalproperties of the soil and subsurface water. J. Environ. Qual. 4:242-248.
Adriano, D. C„ P. F. Pratt, and S. E. Bishop. 1971. Fate of inorganic forms of nitrogen andsale from land-disposal manures from dairies. p. 243-246. In Livestock waste manage-ment and pollution abatement. Am. Soc. of Agric. Eng., St. Joseph, Mich.
Agbim, N. N., B. R. Sabey, and D. C. Markstrom. 1977. Land application of sewage sludge:V. Carbon dioxide production as influenced by sewage sludge and wood waste mixtures.J. Environ. Qual. 6:446-451.
Allison, F. B. 1965. Decomposition of wood and bark sawdust in soil, nitrogen requirements,and effects on soil. USDA, Bull. 1332.58 p.
Allison, F. E. 1973. Soil organic matter and its role in crop production. Elsevier ScientificPubl. Co., New York. 637 p.

REtYCLING OF N THROUGH WASTES 827
Baler, D. C., and W. B. Fryer. 1973. Undesirable plant responses with sewage irrigation. Am.Soc. of Chem. Eng. J. Irrig. and Drain. Div. (June). p. 133-141.
Bartholomew, W. V. 1965. Mineralization and immobilization of nitrogen in the decomposi-tion of plant and animal residues. In W. V. Bartholomew and F. E. Clark (ed.) Soil nitro-gen. Agronomy 10:285-306. Am. Soc. Agron., Madison, Wis.
Baumann, D. J. 1971. Dehydration of cattle rumen and whole blood. p. 313-322. In Proc.2nd Natl. Symp. on Food Processing Wastes. Denver, Colo. 23-26 March 1971.
Beauchamp, E. G., G. E. Kidd, and G. Thurtell. 1978. Ammonia volatilization from sewagesludge applied in the field. J. Environ. Qual. 7:141-146.
Bielby, D. G., M. H. Miller, and L. R. Webber. 1973. Nitrate content of percolates frommanured lysimeters. J. Soil Water Conserv. 28:124-126.
Bouwer, H., .1. C. Lance, and M. S. Riggs. 1974a. High-rate land treatment H: Water qualityand economic aspects of the Flushing Meadows project. J. Water Pollut. Control Fed. 46:844-859.
Bouwer, H., R. C. Rice, and E. D. Escarcega. I974b. High-rate land treatment I: Infiltrationand hydraulic aspects of the Flushing Meadows project. J. Water Pollut. Control. Fed.46:834-843.
Brown, P. L., and D. D. Dickey. 1970. Losses of wheat straw residue under simulated fieldconditions. Soil Sci. Soc. Am. J. 34:118-121.
Burwell, R. E., G. E. Schumann, K. E. Saxton, and H. G. Heinemann. 1976. Nitrogen in sub-surface discharge from agricultural watersheds. J. Environ. Qual. 5:325-329.
Carlile, B. L. 1972. Transformation, movement, and disposal of nitrogen from animal manurewastes applied to soils.. Unpublished Ph.D. Dissertation, Washington State Univ., Pull-man, 70 p. (Livestock and the Environ.: EPA-600/2-77-092, May 1977 Abstract no. 2448-A8).
Clapp, C. E., D. R. Linden, W. E. Larsen, G. C. Marten, and J. R. Nylund. 1977. Nitrogenremoval from municipal wastewater effluent by crop irrigation system. p. 139-150. InR. C. Loehr (ed.) Land as a waste management alternative. Proc. 1976 Cornell Agric.Waste Manage. Conf. Ann Arbor Sci. Publ., Ann Arbor, Mich.
Coker, E. G. 1966. The value of liquid sewage sludge 1. The effect of liquid sewage sludge ongrowth and composition of grass-clover swards in south-east England. J. Agric. Sci. 67:91-97.
Concannon, T. J. Jr., and Emil J. Genetelli. 1971. Groundwater pollution due to high organicmanure loadings, p. 249-253. In Livestock waste management and pollution abatement.Am. Soc. of Agric. Eng. Proc., St. Joseph, Mich.
Day, A. D., and T. C. Tucker. 1959. Production of small grain pasture forage using sewageeffluent as a source of irrigation water and plant nutrients. Agron. J. 51:569-572.
De Haan, F. A. M., G. J. Hoogeveen, and F. Reim Vis. 1973. Aspects of agricultural use ofpotato starch wastewater. Neth. J. Agric. Sci. 21:85-92.
Denmead, O. T., J. R. Freney, and J. R. Simpson. 1976. A closed ammonia cycle within aplant canopy. Soil Biol. Biochem. 8:161-164.
Elliott, L. F., and T. M. McCalla. 1973. The fate of nitrogen from animal wastes. p. 86-110.In Conf. Proc. Nitrogen in Nebraska Environ.
Elliott, L. F., and N. P. Swanson. 1976. Land use of animal wastes. p. 80-90. In Land appli-cation of waste materials. Soil Conserv. Soc. Am. Ankeny, Iowa.
Epstein, E., D. B. Keane, J. J. Meisinger, and J. O. Legg. 1978. Mineralization of nitrogenfrom sewage sludge and sludge compost. J. Environ. Qual. 7:217-221.
Fordham, H. W., and J. Giddens. 1974. Soil pollution from feedlots in Georgia. GeorgiaAgric. Res. 15(4):17-19.
Gilmour, C. M., F. E. Broadbent, and S. M. Beck. 1977. Recycling of carbon and nitrogenthrough land disposal of various wastes. p. 171-174. In L. F. Elliott and F. J. Stevenson(ed.) Soils for management of organic wastes and wastewaters. Am. Soc. of Agron.,Madison, Wis.
Gilmour, J. T., and C. M. Gilmour. 1979. A simulated model for sludge carbon decomposi-tion in soil. J. Environ. Qual. 9:194-199.
Glide, L. C., A. S. Kester, J. P. Law, C. H. Neeley, and D. M. Parmelee. 1971. A spray irriga-tion system for treatment of cannery wastes. .1. Water Pollut. Control Fed. 43:2011-2025.
Greb, B. W., A. L. Black, and D. E. Smika. 1974. Straw buildup in soil with stubble mulch fal-low in the semi-arid great plains. Soil Sci. Soc. Am. J. 38:135-136.
Guenzi, W. D., W. E. Beard, F. S. Watanabe, S. R. Olsen, and L. K. Porter. 1978. Nitrifica-tion and denitrification in cattle manure-amended soil. J. Environ. Qual. 7:196-202.
828 SMITH & PETERSON
Hensler, R. F., W. H. Erhardt, and L. M. Walsh. 1971. Effect of manure handling systems onplant nutrient cycling. p. 254-257. In Livestock Waste Management and Pollution Abate-ment. Am. Soc. of Agric. Eng. Proc., St. Joseph, Mich.
Hinesly, T. D,, E. L. Ziegler, and G. L. Barrett. 1979. Residual effects of irrigated corn withdigested sewage sludge. J. Environ. Qual. 8:35-38.
Hook, J. E., and L. T. Kardos. 1977. Nitrate relationships in the Penn State "Living Filter"system. p. 181-198. In R. C. Loehr (ed.) Land as a waste management alternative. Proc.1976 Cornell Agric. Waste Management Conf., Ann Arbor Sci. Publ., Ann Arbor, Mich.
Hunt, P. 1972. Microbiological responses to the land disposal of secondary-treated municipal-industrial wastewater. p. 77-93. Chap. 5. In Wastewater management by disposal on theland. Spec. Rep. 171. Corps of Eng., U.S. Army, Cold Regions Res. and Eng. Lab., Han-over, N.H.
Hunt, P. G., L. C. Gilde, and N. R. Francingues. 1976. Land treatment and disposal of foodprocessing wastes. p. 112-135. In Land application of waste materials. Soil Conserv. Soc.Am. Ankeny, Iowa.
Hutchinson, 0. L., and F. G. Viets, Jr. 1969. Nitrogen enrichment of surface water by absorp-tion of ammonia volatilized from cattle feedlots. Science 166:514-515.
Iskandar, I. K., R. S. Sletten, D. C. Leggett, and T. F. Jenkins. 1976. Wastewater renovationby a prototype slow infiltration land treatment system. Corps. of Eng., U.S. Army, ColdRegions Res. and Eng. Lab., Hanover, N.H. 44 p.
Jenkinson, D. S. 1971. Studies on the decomposition of 14-C labelled organic matter in soil..Soil Sci. 111:64-70.
Jewell, W. J. 1976. Organic assimilation capacities of land treatment systems receiving vegeta-ble processing wastewaters. In 31st Annu. Purdue Univ. Ind. Waste Conf. West Lafay-ette, Ind. 38 p.
Jewell, W. J., and R. C. Loehr. 1975. Land treatment of food processing wastes. Paper no. 75-2513. Presented at Winter Meetings Am. Soc. of Agric. Eng., Chicago, Ill. Dec. 1975.38 p.
Keeney, D. R., K. W. Lee, and L. M. Walsh. 1975. Guidelines for the application of waste-water sludge to agricultural land in Wisconsin. Tech. Bull. no. 88, Dep. of NaturalResour., Madison, Wis.
Kelling, K. A., A. E. Peterson, and L. M. Walsh. 1977a. Effect of wastewater sludge on soilmoisture relationship and surface runoff. J. Water Pollut. Control Fed. 49:1698-1703.
Kelling, K. A., A. E. Peterson, L. M. Walsh, J. A. Ryan, and D. R. Keeney. 1977b. A fieldstudy of the agricultural use of sewage sludge: I. Effects on crop yield and uptake of Nand P. J. Environ. Qual. 6:339-345.
Kimble, J. M., R. J. Bartlett, J. L. McIntosh, and K. E. Varney. 1972. Fate of nitrate frommanure and inorganic nitrogen in a clay soil cropped to continuous corn. J. Environ.Qual. 1:413-415.
King, L. D. 1973. Mineralization and gaseous loss of nitrogen in soil applied liquid sewagesludge. J. Environ. Qual. 2:356-358,
King, L. D. 1977. Fate of nitrogen from municipal sludges. p. 161-165. In Disposal residues onland. Proc. Natl. Conf. on Disposal of Residues on Land. Information Transfer, Inc.,Rock vi tie , Md.
King, L. D,, and H. D. Morris. 1972. Land disposal of liquid sewage sludge: I. The effect onyield, in vivo digestibility, and chemical composition of coastal bermudagrass (Cynodondactylon L. Pers.). J. Environ. Qual. 1:325-329.
Koo, R. C. J. 1974. Irrigation of citrus with citrus processing wastewater. Pub. no. 28, FloridaWater Resour. Res. Center. 73 p.
Krantz, B. A., F. E. Broadbent, W. A. Williams, K. G. Baghott, K. H. Ingebretsen, and M. E.Stanley. 1968. Research with nitrogen fertilizer emphasizes. . .Fertilize crop-not cropresidue. Calif. Agric. 22(8):6-8.
Lance, J. C. 1972. Nitrogen removal by soil mechanisms. J. Water Pollut. Control Fed. 44:1352-1361.
Larson, W. E. C. E. Clapp, W. H. Pierre, and Y. B. Morachan. 1972. Effects of increasingamounts
E., organic residues on continuous corn: H. Organic carbon, nitrogen, phosphor-
us, and sulphur. Agron. J. 64:204-208.Larson, W. E., and J. R. Gilley. 1976. Soil-climate-crop considerations for recycling organic
wastes. Trans. Am. Soc. of Agric. Eng. 19(1):85-89, 96.Larson, W. E., R. F. Holt, and C. W. Carlson. 1978. Residue for soil conservation. In Proc.
Symp. Crop Residue Manage.: I. Effect on Soil. Am. Soc. of Agron.Letey, J., J. W. Blair, Dale Devitt, L. J. Lund, and P. Nash. 1977. Nitrate-nitrogen in ef-
fluent from agricultural tile drains in California. Hilgardia 45:289-319.
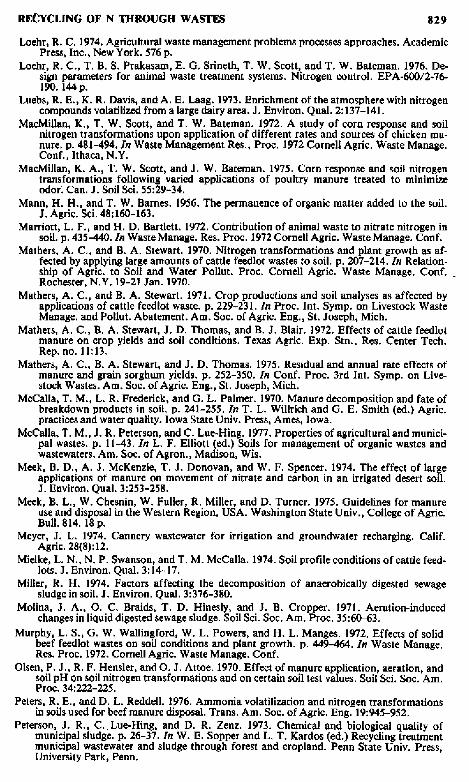
RECYCLING OF N THROUGH WASTES 829
Loehr, R. C. 1974. Agricultural waste management problems processes approaches. AcademicPress, Inc., New York. 576 p.
Loehr, R. C., T. B. S. Prakasam, E. G. Srineth, T. W. Scott, and T. W. Bateman. 1976. De-sign parameters for animal waste treatment systems. Nitrogen control. EPA-600/2-76-190.144 p.
Luebs, R. E., K. R. Davis, and A. E. Laag. 1973. Enrichment of the atmosphere with nitrogencompounds volatilized from a large dairy area. J. Environ. Qual. 2:137-141.
MacMillan, K., T. W. Scott, and T. W. Bateman. 1972. A study of corn response and soilnitrogen transformations upon application of different rates and sources of chicken ma-nure. p. 481-494. In Waste Management Res., Proc. 1972 Cornell Agric. Waste Manage.Conf., Ithaca, N.Y.
MacMillan, K. A., T. W. Scott, and J. W. Bateman. 1975. Corn response and soil nitrogentransformations following varied applications of poultry manure treated to minimizeodor. Can. J. Soil Sci. 55:29-34.
Mann, H. H., and T. W. Barnes. 1956. The permanence of organic matter added to the soil.J. Agric. Sci. 48:160-163.
Marriott, L. F., and H. D. Bartlett. 1972. Contribution of animal waste to nitrate nitrogen insoil. p. 435-440. In Waste Manage. Res. Proc. 1972 Cornell Agric. Waste Manage. Conf.
Mathers, A. C., and B. A. Stewart. 1970. Nitrogen transformations and plant growth as af-fected by applying large amounts of cattle feedlot wastes to soil. p. 207-214. In Relation-ship of Agrtc. to Soil and Water Pollut. Proc. Cornell Agric. Waste Manage. Conf. _Rochester, N.Y. 19-21 Jan. 1970.
Mathers, A. C., and B. A. Stewart. 1971. Crop productions and soil analyses as affected byapplications of cattle feedlot waste. p. 229-231. In Proc. Int. Symp. on Livestock WasteManage. and Pollut. Abatement. Am. Soc. of Agric. Eng., St. Joseph, Mich.
Mathers, A. C., B. A. Stewart, J. D. Thomas, and B. J. Blair. 1972. Effects of cattle feedlotmanure on crop yields and soil conditions. Texas Agric. Exp. Stn., Res. Center Tech.Rep. no. 11:13.
Mathers, A. C., B. A. Stewart, and J. D. Thomas. 1975. Residual and annual rate effects ofmanure and grain sorghum yields. p. 252-350. In Conf. Proc. 3rd Int. Symp. on Live-stock Wastes. Am. Soc. of Agric. Eng., St. Joseph, Mich.
McCalla, T. M., L. R. Frederick, and G. L. Palmer. 1970. Manure decomposition and fate ofbreakdown products in soil. p. 241-255. In T. L. Willrich and G. E. Smith (ed.) Agric.practices and water quality. Iowa State Univ. Press, Ames, Iowa.
McCalla, T. M., J. R. Peterson, and C. Lue-Hing. 1977. Properties of agricultural and munici-pal wastes. p. 11-43. In L. F. Elliott (ed.) Soils for management of organic wastes andwastewaters. Am. Soc. of Agron., Madison, Wis.
Meek, B. D., A. J. McKenzie, T. J. Donovan, and W. F. Spencer. 1974. The effect of largeapplications of manure on movement of nitrate and carbon in an irrigated desert soil.J. Environ. Qual. 3:253-258.
Meek, B. L., W. Chesnin, W. Fuller, R. Miller, and D. Turner. 1975. Guidelines for manureuse and disposal in the Western Region, USA. Washington State Univ., College of Agric.Bull. 814.18 p.
Meyer, J. L. 1974. Cannery wastewater for irrigation and groundwater recharging. Calif.Agric. 28(8):12.
Mielke, L. N., N. P. Swanson, and T. M. McCalla. 1974. Soil profile conditions of cattle feed-lots. J. Environ. Qual. 3:14-17.
Miller, R. H. 1974. Factors affecting the decomposition of anaerobically digested sewagesludge in soil. J. Environ. Qual. 3:376-380.
Molina, J. A., 0. C. Braids, T. D. Hinesly, and J. B. Cropper. 1971. Aeration-inducedchanges in liquid digested sewage sludge. Soil Sci. Soc. Am. Proc. 35:60-63.
Murphy, L. S., G. W. Wallingford, W. L. Powers, and H. L. Manges. 1972. Effects of solidbeef feedlot wastes on soil conditions and plant growth. p. 449-464. In Waste Manage.Res. Proc. 1972. Cornell Agric. Waste Manage. Conf.
Olsen, P. J., R. F. Hensler, and O.J. Attoe. 1970. Effect of manure application, aeration, andsoil pH on soil nitrogen transformations and on certain soil test values. Soil Sci. Soc. Am.Proc. 34:222-225.
Peters, R. E., and D. L. Reddell. 1976. Ammonia volatilization and nitrogen transformationsin soils used for beef manure disposal. Trans. Am. Soc. of Agric. Eng. 19:945-952.
Peterson, J. R., C. Lue-Hing, and D. R. Zenz. 1973. Chemical and biological quality ofmunicipal sludge. p. 26-37. In W. E. Sopper and L. T. Kardos (ed.) Recycling treatmentmunicipal wastewater and sludge through forest and cropland. Penn State Univ. Press,University Park, Penn.

83 0 SMITH & PETERSON
Peterson, J. R., T. M. McCalla, and G. E. Smith. 1971. Human and animal wastes as ferti-lizers. p. 557-595. In R. A. Olson et al. (ed.) Fertilizer technology and use. 2nd ed. SoilSci. Soc. Am., Madison, Wis.
Peterson, J. R., R. 1. Pieta, and C. Lue-Hing. 1979. Water, soil, and crop quality of Illinoiscoal mine spoils amended with sewage sludge. p. 359-368. In W. E. Sopper and S. N.Kerr (ed.) Symp. Wastewater and Sludge Recycling on Forest Land and Disturbed Land.Penn State Univ. Press, University Park, Penn.
Powers, J. F. 1968. Mineralization of nitrogen in grass roots. Soil Sci. Soc. Am. Proc. 32:673-674.
Pratt, P. F., F. E. Broadbent, and J. P. Martin. 1973. Using organic wastes as nitrogenfertilizer. Calif. Agric. 27(6):10-13.
Pratt, P. F., S. Davis, and R. G. Sharpless. 1976. A four-year field trial with animal manures.I. Nitrogen balances and yields. II. Mineralization of nitrogen. Hilgardia 44:99-125.
Premi, P. R., and A. H. Cornfield. 1969. Incubation study of nitrification of digested sewagesludge added to soil. Soil Biol. Biochem. 1:1-4.
Rao, D. N., and D. S. Mikkelsen. 1976. Effect of rice straw incorporation on rice plant growthand nutrition. Agron. 3.68:752-755.
Reed, S. 1972. Wastewater management by disposal on the land. Cold Regions Res. and Eng.Lab., Corps of Eng., U.S. Army. Spec. Rep. 171, Hanover, N.1-1. p. 2-34,
Reed, A. D. W. E. Wildman, W. S. Seyman, R. S. Auyers, J. D. Prato, and R. S. Rausch-kolb. 1973. Soil recycling of cannery wastes. Calif. Agric. 27(3):6-9. -
Rolston, D. E., and F. E. Broadbent. 1977. Field measurement of denitrification. EPA-600/2-77-233.75 p.
Ryan, J. A., and D. R. Keeney. 1975. Ammonia volatilization from surface-applied waste-water sludge. J. Water Pollut. Control Fed. 47:386-393.
SaM, P., and F. E. Broadbent. 1977. Decomposition of rice straw in soils as affected by somemanagement factors. J. Environ. Qual. 6:96-100.
Satterwhite, M. B., G. L. Stewart, B. J. Condike, and E. Vlach. 1976. Rapid infiltration ofprimary sewage effluent at Fort Deven, Mass. Corps of Eng., U.S. Army, Cold Res. andEng. Lab., Hanover, N.H. 34 p.
Schuman, G. E., T. M. McCalla, K. E. Saxton, and H. T. Knox. 1975. Nitrate movement andits distribution in the soil profile of differentially fertilized corn watersheds. Soil Sci. Soc.Am. Proc. 29:1192-1197.
Seabrook, B. L. 1975. Land application of wastewater in Australia. The land treatment systemat Werribee, Victoria. USEPA-430/9-75-017, MCD 16.54 p.
Shannon, S., M. T. Vittum, and G. H. Gibbs. 1968. Irrigating with wastewater from process-ing plants. New York State Agric. Exp. Stn. Res. Circ. no. 10,9 p.
Smith, J. H. 1966. Some inter-relationships between decomposition of various plant residuesand loss of soil organic matter as measured by carbon-14 labeling. p. 223-233. In Theuse of isotopes in soil organic matter studies. Pergamon Press. Rep. FAO/IAEA Tech.Meet. Brunswick-Volkenrode. 1963.
Smith, J. H. 1976. Treatment of potato processing wastewater on agricultural land. J.Environ. Qual. 5:113-116.
Smith, J. H., and C. L. Douglas. 1968. Influence of residual nitrogen on wheat straw decom-position in the field. Soil Sci. 106:456-459.
Smith, J. H., and C. L. Douglas. 1971. Wheat straw decomposition in the field. Soil Sci. Soc.Am. Proc. 35:269-272.
Smith, J. H., C. L. Douglas, and M. J. LeBaron. 1973. Influence of straw application rates,plowing dates, and nitrogen applications on yield and chemical composition of sugar-beets. Agron. J. 65:797-800.
Smith, J. H., R. G. Gilbert, and J. B. Miller. 1976. Redox potentials and denitrification in acropped potato processing wastewater disposal field. J. Environ. Qual. 5:397-399.
Smith, .1. H., R. G. Gilbert, and J. B. Miller. 1978. Redox potentials in a cropped potato pro-cessing wastewater disposal field with a deep water table. J. Environ. Qual. 7:571-574.
Smith, J. H., C. W. Robbins, J. A. Bondurant, and C. W. Hayden. 1977. Treatment of potatoprocessing wastewater on agricultural land: Water and organic loading, and the fate ofapplied plant nutrients. p. 769-781. In R. C. Loehr (ed.) Land as a Waste ManagementAlternative. Proc. 1976 Cornell Agric. Waste Manage, Ann Arbor Sci, Publ., Ann Arbor,Mich.
Smith, J. H., C. W. Robbins, J. A. Bondurant, and C. W. Hayden. 1978. Treatment and dis-posal of potato processing wastewater by irrigation. USDA-SEA, Conserv. Res. Rep.22.43 p.

RECYCLING OF N THROUGH WASTES 831
Smith, J. H., and C. W. Hayden. 1980. Irrigating with sugarbeet processing wastewater. J.Am. Soc. Sugar Beet Technol. 20(5):484-502.
Smith, J. H., C. W. Robbins, and C. W. Hayden. 1975. Plant nutrients in potato processingwastewater used for irrigation. p. 159-165. In Proc. 26th Ann. Pacific Northwest Ferti-lizer Conf., 15-17 July 1975, Salt Lake City, Utah.
Sommers, L. E. 1977. Chemical composition of sewage sludge and analysis of their potentialuse as fertilizer, J, Environ. Qual. 6:225-232.
Sopper, W. E. 1968. Wastewater renovation for reuse: Key to optimum use of water resources.Water Res. 2:471-480.
Stanley Associates Engineering Ltd. 1977. Review of treatment technology in the fruit andvegetable processing industry in Canada. EPX 3-WP-77-5. p. 176-178.
Stewart, B. A. 1970. Volatilization and nitrification of nitrogen from urine under simulatedcattle feedlot conditions. Environ. Sci. Technol. 4:579-582.
Stewart, B. A., and R. L. Chaney. 1975. Wastes: Use or discard? p. 160-166. In Proc. 30thAnnu. Meeting. Soil Conserv. Soc. of Am. 10-13 Aug. 1975, San Antonio, Texas.
Stewart, N. E., E. G. Beauchamp, C. T. Corke, and L. R. Webber. 1975. Nitrate nitrogen dis-tribution in corn land following applications of digested sewage sludge. Can. J. Soil Sci55:287-294.
Tanaka, A. 1973. Methods handling the rice straw in various countries. Int. Rice Comm.Newsl. 22(2):120 Food and Agric. Organ., Bangkok, Thailand.
Tarquin, A., H. Applegate, F. Rizzo, and L. Jones. 1974. Design considerations for treatmentof meatpacking plant wastewater by land application. p. 107-113. In Proc. 5th Natl.Symp. on Food Processing Wastes. Syracuse, N.Y., 13-15 Jan. 1969. EPA-660/2/-74-058.
Tester, C. F., L. J. Sikora, J. M. Taylor, and J, F. Parr. 1977. Decomposition of sewagesludge compost in soil: 1, Carbon and nitrogen transformation. J. Environ, Qual. 6:459-463.
Turner, D. 0. 1975. On-the-farm determination of animal waste disposal rates for crop pro-duction. Conf. Proc. 3rd Int. Symp. on Livestock Wastes. Am. Soc. of Agric. Eng., St.Joseph, Mich.
Turner, D. 0. 1976. Guidelines for manure application in the Pacific Northwest. Coop. Ext.Serv. College of Agric., Wash. State Univ., Pullman, Wash., EM 4009.25 p.
USEPA. 1973. Water quality criteria. 1972. A report of the committee on water quality cri-teria. Environ. Studies Board, Natl. Acad. of Sci., Natl. Acad. of Eng., Washington,D.C. 594 p.
Varanka, M. W., Z. M. Zablocki, and T. D. Hinesly. 1976. The effect of digester sludge onsoil biological activity. J. Water Pollut. Control Fed. 48:1728-1740.
Wadleigh, C. H. 1968. Wastes in relation to agriculture and forestry. USDA Misc. Pub. 1065.U.S. Govt. Printing Off., Washington, D.C. 112 p.
Walter, M. F., G. D. Bubenzer, and J. C. Converse. 1974. Movement of manurial nitrogenin cool, humid, climates. Paper no. 74-2018. 67th Annu. Meeting. Am. Soc. of Agric.Eng., Oklahoma State Univ., Stillwater. 21 p. (Livestock and the Environ. EPA 600/2-77-092. May 1977, Abstr. no. 1712-Al).
Webber, L. R., and T. H. Lane. 1969. The nitrogen problem in the land disposal of liquidmanure. p. 124-130. In Animal Waste Manage. Proc. Cornell Univ. Conf. on Agric.Waste Manage. Syracuse, N.Y.
Weeks, M. E., M. E. Hill, S. Karczmarczk, and A. Blackmer. 1972. Heavy manure applica-tions: benefit or waste? p. 441-447. In Waste Manage. Res. Proc. 1972 Cornell Agric.Waste Manage. Conf.
Williams, W. A., D. S. Mikkelsen, K. E. Mueller, and J. E. Ruckman. 1968. Nitrogen im-mobilization by rice straw incorporated in lowland rice production. Plant Soil 28:49-60.
Witherow, J. L. 1975. Small meat-packer waste treatment systems II. Purdue Univ. Ind.30th Waste Conf., Lafayette, Ind. 942 p.
Yoneyama, T., and T. Yoshida. 1977a. Decomposition of rice residue in tropical soils. 1.Nitrogen uptake by rice plants from straw incorporated, fertilizer (ammonium sulfate),and soil. Soil Sci. Plant Nutr. (Tokyo) 23:33-40.
Yoneyama, T., and T. Yoshida. 1977b. Decomposition of rice residue in tropical sails. II. Im-mobilization of soil and fertilizer nitrogen by intact rice residue in soil. Soil Sci. PlantNutr. (Tokyo) 23:41-48.
Yoneyama, T., and T. Yoshida. 1977c. Decomposition of rice residue in tropical soils.Nitrogen mineralization and immobilization of rice residue during its decomposition insoil. Soil Sci. Plant Nutr. (Tokyo) 23:175-183.