Embed Size (px)
Citation preview
CBP/TRS 148/96EPA 903-R-96-006
Recommended Guidelines forSampling and Analyses in the
Chesapeake BayMonitoring Program
August 1996
Chesapeake Bay Program
Recommended Guidelines forSampling and Analyses in the
Chesapeake BayMonitoring Program
August 1996
Chesapeake Bay Program
Printed by the U.S. Environmental Protection Agency for the Chesapeake Bay Program
August 1996
i
TABLE OF CONTENTSTABLE OF CONTENTS . . . . . . . . . . . . . . . . . . . . . . . . . . . . . . . . . . . . . . . . . . . . . . . . . . . . . . . . . . . . . . . . . . . . i
LIST OF FIGURES (List is omitted from electronic version) . . . . . . . . . . . . . . . . . . . . . . . . . . . . . . . . . . . . . . . vi
LIST OF TABLES . . . . . . . . . . . . . . . . . . . . . . . . . . . . . . . . . . . . . . . . . . . . . . . . . . . . . . . . . . . . . . . . . . . . . . . . . .iv
CHAPTER I - INTRODUCTION
Section A. Overview . . . . . . . . . . . . . . . . . . . . . . . . . . . . . . . . . . . . . . . . . . . . . . . . . . . . . . . . . . I-21. Purpose of the SOW. . . . . . . . . . . . . . . . . . . . . . . . . . . . . . . . . . . . . . . . . . . . . . . . . . I-22. Organization of the SOW . . . . . . . . . . . . . . . . . . . . . . . . . . . . . . . . . . . . . . . . . . . . . I-23. Quality Assurance considerations . . . . . . . . . . . . . . . . . . . . . . . . . . . . . . . . . . . . . . . . I-34. Health and Safety considerations . . . . . . . . . . . . . . . . . . . . . . . . . . . . . . . . . . . . . . . I-35. Other Federal and State Requirements . . . . . . . . . . . . . . . . . . . . . . . . . . . . . . . . . . . . I-46 Future considerations . . . . . . . . . . . . . . . . . . . . . . . . . . . . . . . . . . . . . . . . . . . . . . . . I-4
Section B. Summary of Requirements . . . . . . . . . . . . . . . . . . . . . . . . . . . . . . . . . . . . . . . . . . . I-51. SOW Task Areas. . . . . . . . . . . . . . . . . . . . . . . . . . . . . . . . . . . . . . . . . . . . . . . . . . .. . . I-52. Personnel Requirements . . . . . . . . . . . . . . . . . . . . . . . . . . . . . . . . . . . . . . . . . . . . . . . .I-73. Facilities . . . . . . . . . . . . . . . . . . . . . . . . . . . . . . . . . . . . . . . . . . . . . . . . . . .. . . . . . . . I-124. Instrumentation and Equipment . . . . . . . . . . . . . . . . . . . . . . . . . . . . . . . . . . . . . . . . . I-13
CHAPTER II - QUALITY ASSURANCE
Section A. Introduction. . . . . . . . . . . . . . . . . . . . . . . . . . . . . . . . . . . . . . . . . . . . . . . . . . .. . . . . . II-3
Section B. General QA/QC Requirements. . . . . . . . . . . . . . . . . . . . . . . . . . . . . . . . . . . . . . . . . . II-41. Reporting . . . . . . . . . . . . . . . . . . . . . . . . . . . . . . . . . . . . . . . . . . . . . . . . . . . . . . . . . . II-42. Chain-of-Custody . . . . . . . . . . . . . . . . . . . . . . . . . . . . . . . . . . . . . . . . . . . . . . . . . . . II-63. Participation in Technical Meetings . . . . . . . . . . . . . . . . . . . . . . . . . . . . . . . . . . . . . II-64. Procedural Change Authorization . . . . . . . . . . . . . . . . . . . . . . . . . . . . . . . . . . . . . . . II-7
Section C. Field QA/QC Procedures . . . . . . . . . . . . . . . . . . . . . . . . . . . . . . . . . . . . . . . . . . . . . .II-91. Annual Calibration . . . . . . . . . . . . . . . . . . . . . . . . . . . . . . . . . . . . . . . . . . . . . . . . . . II-92. Calibration Check . . . . . . . . . . . . . . . . . . . . . . . . . . . . . . . . . . . . . . . . . . . . . . . . . . . . II-93. Check Sample. . . . .. . . . . . . . . . . . . . . . . . . . . . . . . . . . . . . . . . . . . . . . . . . . . . . . . . . II-9
Section D. Laboratory QA/QC Procedures. . . . . . . . . . . . . . . . . . . . . . . . . . . . . . . . . . . . . . . . . . II-101. Method Blank . . . . . . . . . . . . . . . . . . . . . . . . . . . . . . . . . . . . . . . . . . . . . . . . . . . . . . . II-102. Matrix Spike . . . . . . . . . . . . . . . . . . . . . . . . . . . . . . . . . . . . . . . . . . . . . . . . . . . . . . . . II-10
3. Laboratory Replicates . . . . . . . . . . . . . . . . . . . . . . . . . . . . . . . . . . . . . . . . . . . . . . . . II-11 4. Check Standard . .. . . . . . . . . . . . . . . . . . . . . . . . . . . . . . . . . . . . . . . . . . . . . . . . . . . . II-12
5. Glassware Cleaning . . . . . . . . . . . . . . . . . . . . . . . . . . . . . . . . . . . . . . . . . . . . . . . . . . II-12
August 1996
ii
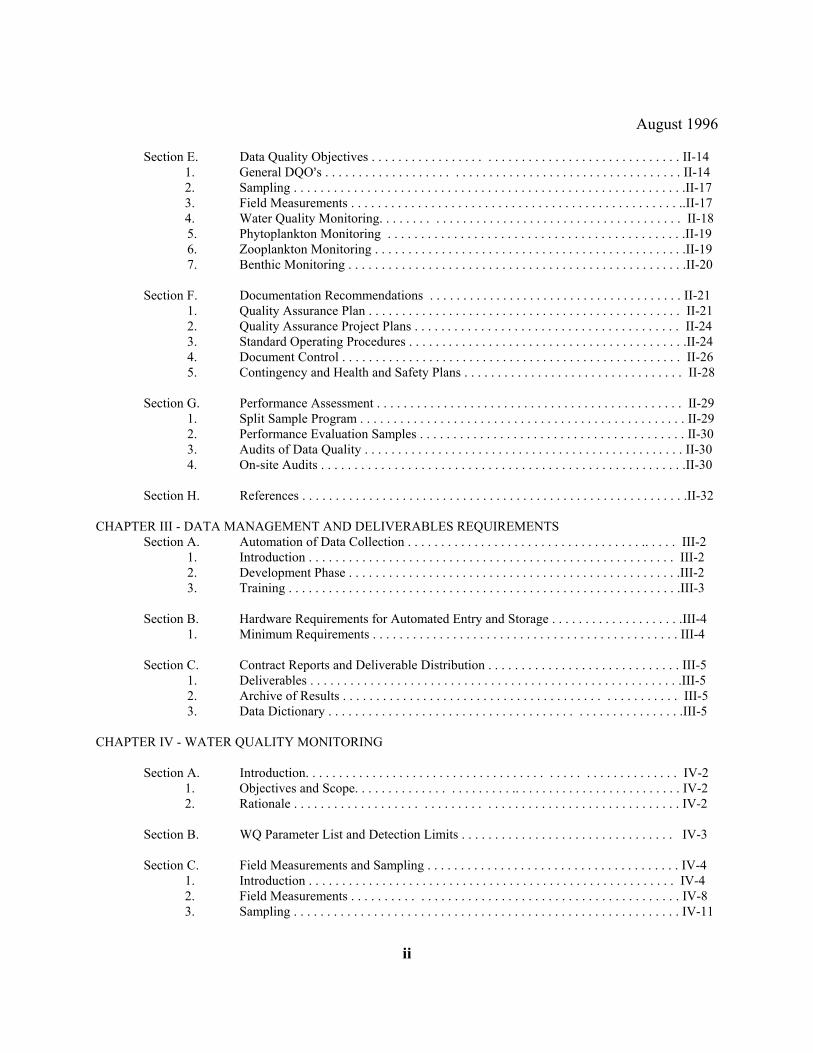
Section E. Data Quality Objectives . . . . . . . . . . . . . . . . . . . . . . . . . . . . . . . . . . . . . . . . . . . . . . II-141. General DQO=s . . . . . . . . . . . . . . . . . . . . . . . . . . . . . . . . . . . . . . . . . . . . . . . . . . . . . II-142. Sampling . . . . . . . . . . . . . . . . . . . . . . . . . . . . . . . . . . . . . . . . . . . . . . . . . . . . . . . . . . .II-173. Field Measurements . . . . . . . . . . . . . . . . . . . . . . . . . . . . . . . . . . . . . . . . . . . . . . . . . ..II-174. Water Quality Monitoring. . . . . . . . . . . . . . . . . . . . . . . . . . . . . . . . . . . . . . . . . . . . . II-18
5. Phytoplankton Monitoring . . . . . . . . . . . . . . . . . . . . . . . . . . . . . . . . . . . . . . . . . . . . .II-19 6. Zooplankton Monitoring . . . . . . . . . . . . . . . . . . . . . . . . . . . . . . . . . . . . . . . . . . . . . . .II-19 7. Benthic Monitoring . . . . . . . . . . . . . . . . . . . . . . . . . . . . . . . . . . . . . . . . . . . . . . . . . . .II-20
Section F. Documentation Recommendations . . . . . . . . . . . . . . . . . . . . . . . . . . . . . . . . . . . . . . II-21 1. Quality Assurance Plan . . . . . . . . . . . . . . . . . . . . . . . . . . . . . . . . . . . . . . . . . . . . . . . II-21 2. Quality Assurance Project Plans . . . . . . . . . . . . . . . . . . . . . . . . . . . . . . . . . . . . . . . . II-24 3. Standard Operating Procedures . . . . . . . . . . . . . . . . . . . . . . . . . . . . . . . . . . . . . . . . . .II-24 4. Document Control . . . . . . . . . . . . . . . . . . . . . . . . . . . . . . . . . . . . . . . . . . . . . . . . . . . II-26 5. Contingency and Health and Safety Plans . . . . . . . . . . . . . . . . . . . . . . . . . . . . . . . . . II-28
Section G. Performance Assessment . . . . . . . . . . . . . . . . . . . . . . . . . . . . . . . . . . . . . . . . . . . . . . II-29 1. Split Sample Program . . . . . . . . . . . . . . . . . . . . . . . . . . . . . . . . . . . . . . . . . . . . . . . . . II-29 2. Performance Evaluation Samples . . . . . . . . . . . . . . . . . . . . . . . . . . . . . . . . . . . . . . . . II-30 3. Audits of Data Quality . . . . . . . . . . . . . . . . . . . . . . . . . . . . . . . . . . . . . . . . . . . . . . . . II-30 4. On-site Audits . . . . . . . . . . . . . . . . . . . . . . . . . . . . . . . . . . . . . . . . . . . . . . . . . . . . . . .II-30
Section H. References . . . . . . . . . . . . . . . . . . . . . . . . . . . . . . . . . . . . . . . . . . . . . . . . . . . . . . . . . .II-32
CHAPTER III - DATA MANAGEMENT AND DELIVERABLES REQUIREMENTSSection A. Automation of Data Collection . . . . . . . . . . . . . . . . . . . . . . . . . . . . . . . . . . . .. . . . . III-2 1. Introduction . . . . . . . . . . . . . . . . . . . . . . . . . . . . . . . . . . . . . . . . . . . . . . . . . . . . . . . III-2 2. Development Phase . . . . . . . . . . . . . . . . . . . . . . . . . . . . . . . . . . . . . . . . . . . . . . . . . .III-2 3. Training . . . . . . . . . . . . . . . . . . . . . . . . . . . . . . . . . . . . . . . . . . . . . . . . . . . . . . . . . . .III-3
Section B. Hardware Requirements for Automated Entry and Storage . . . . . . . . . . . . . . . . . . . .III-4 1. Minimum Requirements . . . . . . . . . . . . . . . . . . . . . . . . . . . . . . . . . . . . . . . . . . . . . . III-4
Section C. Contract Reports and Deliverable Distribution . . . . . . . . . . . . . . . . . . . . . . . . . . . . . III-5 1. Deliverables . . . . . . . . . . . . . . . . . . . . . . . . . . . . . . . . . . . . . . . . . . . . . . . . . . . . . . . .III-5 2. Archive of Results . . . . . . . . . . . . . . . . . . . . . . . . . . . . . . . . . . . . . . . . . . . . . . . . . . III-5 3. Data Dictionary . . . . . . . . . . . . . . . . . . . . . . . . . . . . . . . . . . . . . . . . . . . . . . . . . . . . .III-5
CHAPTER IV - WATER QUALITY MONITORING
Section A. Introduction. . . . . . . . . . . . . . . . . . . . . . . . . . . . . . . . . . . . . . . . . . . . . . . . . . . . . . . IV-21. Objectives and Scope. . . . . . . . . . . . . . . . . . . . . . . .. . . . . . . . . . . . . . . . . . . . . . . . . IV-22. Rationale . . . . . . . . . . . . . . . . . . . . . . . . . . . . . . . . . . . . . . . . . . . . . . . . . . . . . . . . . IV-2
Section B. WQ Parameter List and Detection Limits . . . . . . . . . . . . . . . . . . . . . . . . . . . . . . . . IV-3
Section C. Field Measurements and Sampling . . . . . . . . . . . . . . . . . . . . . . . . . . . . . . . . . . . . . . IV-41. Introduction . . . . . . . . . . . . . . . . . . . . . . . . . . . . . . . . . . . . . . . . . . . . . . . . . . . . . . . IV-42. Field Measurements . . . . . . . . . . . . . . . . . . . . . . . . . . . . . . . . . . . . . . . . . . . . . . . . . IV-83. Sampling . . . . . . . . . . . . . . . . . . . . . . . . . . . . . . . . . . . . . . . . . . . . . . . . . . . . . . . . . . IV-11
August 1996
iii
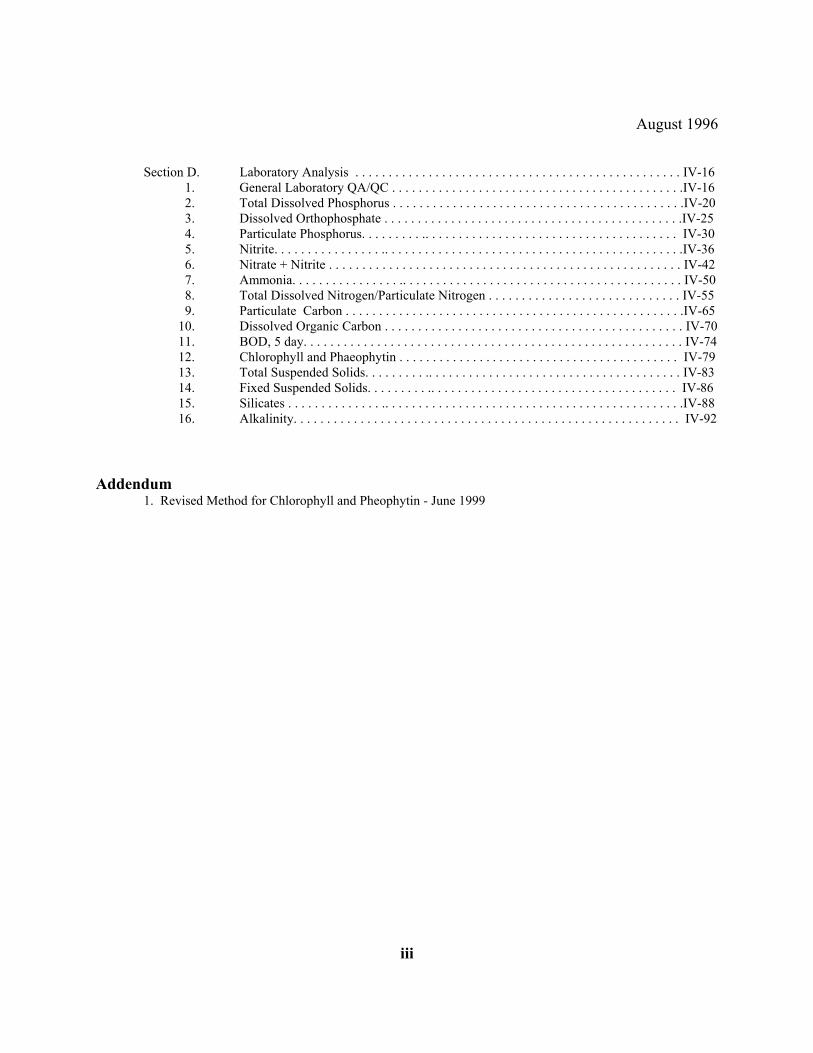
Section D. Laboratory Analysis . . . . . . . . . . . . . . . . . . . . . . . . . . . . . . . . . . . . . . . . . . . . . . . . . IV-161. General Laboratory QA/QC . . . . . . . . . . . . . . . . . . . . . . . . . . . . . . . . . . . . . . . . . . . .IV-162. Total Dissolved Phosphorus . . . . . . . . . . . . . . . . . . . . . . . . . . . . . . . . . . . . . . . . . . . .IV-203. Dissolved Orthophosphate . . . . . . . . . . . . . . . . . . . . . . . . . . . . . . . . . . . . . . . . . . . . .IV-254. Particulate Phosphorus. . . . . . . . . .. . . . . . . . . . . . . . . . . . . . . . . . . . . . . . . . . . . . . . IV-305. Nitrite. . . . . . . . . . . . . . . . .. . . . . . . . . . . . . . . . . . . . . . . . . . . . . . . . . . . . . . . . . . . . .IV-366. Nitrate + Nitrite . . . . . . . . . . . . . . . . . . . . . . . . . . . . . . . . . . . . . . . . . . . . . . . . . . . . . IV-427. Ammonia. . . . . . . . . . . . . . . . .. . . . . . . . . . . . . . . . . . . . . . . . . . . . . . . . . . . . . . . . . . IV-508. Total Dissolved Nitrogen/Particulate Nitrogen . . . . . . . . . . . . . . . . . . . . . . . . . . . . . IV-559. Particulate Carbon . . . . . . . . . . . . . . . . . . . . . . . . . . . . . . . . . . . . . . . . . . . . . . . . . . .IV-65
10. Dissolved Organic Carbon . . . . . . . . . . . . . . . . . . . . . . . . . . . . . . . . . . . . . . . . . . . . . IV-70 11. BOD, 5 day. . . . . . . . . . . . . . . . . . . . . . . . . . . . . . . . . . . . . . . . . . . . . . . . . . . . . . . . . IV-74 12. Chlorophyll and Phaeophytin . . . . . . . . . . . . . . . . . . . . . . . . . . . . . . . . . . . . . . . . . . IV-79 13. Total Suspended Solids. . . . . . . . . .. . . . . . . . . . . . . . . . . . . . . . . . . . . . . . . . . . . . . . IV-83
14. Fixed Suspended Solids. . . . . . . . . .. . . . . . . . . . . . . . . . . . . . . . . . . . . . . . . . . . . . . IV-8615. Silicates . . . . . . . . . . . . . . .. . . . . . . . . . . . . . . . . . . . . . . . . . . . . . . . . . . . . . . . . . . . .IV-8816. Alkalinity. . . . . . . . . . . . . . . . . . . . . . . . . . . . . . . . . . . . . . . . . . . . . . . . . . . . . . . . . . IV-92
Addendum1. Revised Method for Chlorophyll and Pheophytin - June 1999
August 1996
iv
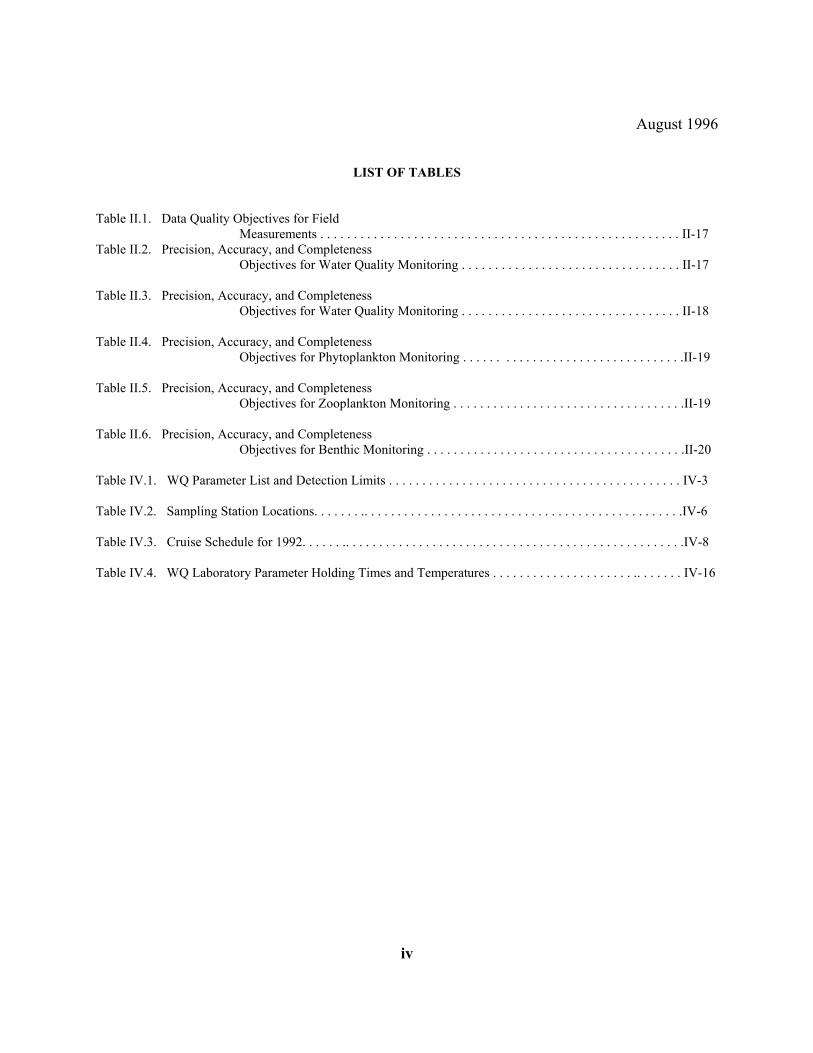
LIST OF TABLES
Table II.1. Data Quality Objectives for FieldMeasurements . . . . . . . . . . . . . . . . . . . . . . . . . . . . . . . . . . . . . . . . . . . . . . . . . . . . . . II-17
Table II.2. Precision, Accuracy, and CompletenessObjectives for Water Quality Monitoring . . . . . . . . . . . . . . . . . . . . . . . . . . . . . . . . . II-17
Table II.3. Precision, Accuracy, and CompletenessObjectives for Water Quality Monitoring . . . . . . . . . . . . . . . . . . . . . . . . . . . . . . . . . II-18
Table II.4. Precision, Accuracy, and CompletenessObjectives for Phytoplankton Monitoring . . . . . . . . . . . . . . . . . . . . . . . . . . . . . . . . .II-19
Table II.5. Precision, Accuracy, and CompletenessObjectives for Zooplankton Monitoring . . . . . . . . . . . . . . . . . . . . . . . . . . . . . . . . . . .II-19
Table II.6. Precision, Accuracy, and CompletenessObjectives for Benthic Monitoring . . . . . . . . . . . . . . . . . . . . . . . . . . . . . . . . . . . . . . .II-20
Table IV.1. WQ Parameter List and Detection Limits . . . . . . . . . . . . . . . . . . . . . . . . . . . . . . . . . . . . . . . . . . . . IV-3
Table IV.2. Sampling Station Locations. . . . . . . .. . . . . . . . . . . . . . . . . . . . . . . . . . . . . . . . . . . . . . . . . . . . . . . .IV-6
Table IV.3. Cruise Schedule for 1992. . . . . . .. . . . . . . . . . . . . . . . . . . . . . . . . . . . . . . . . . . . . . . . . . . . . . . . . . .IV-8
Table IV.4. WQ Laboratory Parameter Holding Times and Temperatures . . . . . . . . . . . . . . . . . . . . . .. . . . . . . IV-16
Chapter IIntroductionAugust 1996
I-1
CHAPTER I
INTRODUCTION
Section A. Overview
1. Purpose of the document2. Organization of the document3. Quality Assurance Considerations4. Health and Safety Considerations5. Other Federal and State Requirements
Section B. Summary of Requirements
1. Document Task Areas2. Personnel Requirements3. Facilities4. Instrumentation and Equipment

Chapter IIntroductionAugust 1996
I-2
SECTION A
INTRODUCTION1. Purpose of this document
The purpose of this document is to provide field and laboratory methods and associated quality control (QC)procedures and criteria that will result in the generation of data of known and documented quality for use in theChesapeake Bay Monitoring Program. Under this document, the Participant will conduct field measurements andcollect and analyze water and sediment samples for specific physical, chemical, and biological parameters that are inaccordance with Appendix F and previous data collection efforts. These monitoring data will be used incharacterizing the health of the Chesapeake Bay and its tributaries, identifying long term trends, and providing dataand guidance to managers and modelers during the restoration phase.
2. Organization of the document
2.1 This document includes the requirements and procedures for field measurements, field sampling, andlaboratory analysis in support of the Chesapeake Bay Monitoring Program. The first chapters providegeneral information regarding technical and contractual requirements, and the remaining chapters have beenorganized so as to correspond chronologically with the field and laboratory activities performed.
2.2 Specifically, this document has been organized as follows:
2.2.1 Chapter I provides a summary of the technical and management requirements established to ensureattainment of Program objectives.
2.2.2 Chapter II defines the Quality Assurance (QA) protocols and procedures that have been developedfor this document including specific requirements for QA procedures. It outlines the chain-of-custody and document control procedures which shall be followed with every sample.
2.2.3 Chapter III specifies all reporting requirements, data management procedures, and softwareprocedures. It provides the deliverables and turnaround times required by this Scope of Work(SOW).
2.2.4 Chapter IV presents specific methods and procedures for water quality monitoring includingsampling, field measurements, and analysis and the associated QC requirements.
3. Quality Assurance Considerations
3.1 The Participant must be aware of the importance of maintaining the integrity of the data generated underthis contract, as the data may be used to make important decisions regarding the characterization andrestoration of the Chesapeake Bay. Data integrity is defined as ensuring that data are complete, consistent,and without errors, and ensuring the prevention of information corruption and unauthorized datamodification.
Chapter IIntroductionAugust 1996
I-3
3.2 Participants will adhere to generally acceptable field and laboratory practices and good automated field andlaboratory practices. Good automated practices for this SOW comprise the data management proceduresdescribed in Chapter III of this SOW. All procedures shall be carried out by qualified field laboratorypersonnel to ensure the quality and integrity of the monitoring data being produced. By following thespecific analytical and reporting procedures outlined in this document, the Participant will producemonitoring data of known and documented quality. Additional requirements for maintaining generallyacceptable practices and good automated practices are provided throughout this SOW.
4. Health and Safety Considerations
4.1 The samples to be collected and analyzed by the Participants' are from the Chesapeake Bay mainstem andtributaries and may contain hazardous materials which could present a risk to human health and a hazard tofield and laboratory instrumentation/equipment. The Participant should be aware of the potential hazardsassociated with the handling and analyses of these samples. It is the Participants' responsibility to take allnecessary measures to ensure the health and safety of its employees, and to maintain its analyticalinstruments in good working condition.
4.2 The Participant will comply with all applicable Occupational Safety and Health Administration (OSHA)requirements.
4.3 The Participant will comply with the applicable requirements as stated in "Health and Safety Protocols forEPA Vessels," which has been included as an appendix to this SOW. This document will become a chapterof the EPA Health and Safety Manual. All contractors are expected to comply with all EPA health andsafety requirements. However, the contractor should develop their own Manual to reflect their operatingconditions.
4.4 All vessels used to collect samples from the Chesapeake Bay mainstem monitoring stations will be in fullcompliance with state and federal regulations regarding the use of tributyltin (TBT) anti-fouling paints. Regulations ban the use of paint containing TBT to marine contractors and boatyards.
4.5 All vessels used to collect samples will be in compliance with Section 312 of the Water Quality Act of 1987which requires the installation of marine sanitation device (MSD) on all vessels with installed toiletsoperating in the navigable waters of the United States. Type III MSDs, which are designed to prevent thedischarge of human waste from boats in any form, will be used.
5. Other Federal and State Requirements
5.1 The Participant will comply with all relevant State and Federal laws and regulations, including theResource Conservation Recovery Act (RCRA) and the Clean Water Act (CWA).
5.2 Because some substance used in the sample preparation and analysis procedures described in this SOW arehazardous (e.g., formalin and inorganic acids), appropriate state and federal regulations must be followedfor their handling and disposal both in the laboratory and in the field.
Chapter IIntroductionAugust 1996
I-4
SECTION B
SUMMARY OF REQUIREMENTS1. Document Task Areas
1.1 For each sample, the Participant will perform certain tasks. These tasks are: (1) development of a samplingschedule; (2) performance of field measurements; (3) collection, preparation, and transport of field samples;(4) laboratory receipt and preparation of field samples; (5) chemical and biological analyses of fieldsamples; (6) adherence to QA/QC procedures outlined in this document; and (7) data management andreporting.
1.2 These tasks are specifically outlined as follows.
1.2.1 Task 1. Development of a sampling schedule.
1.2.1.1 The Participant will develop a sampling schedule that complies with the frequency andlocation requirements established in this document. This schedule shall be developed inclose coordination with the VADEQ, the CBPO, and the State of Maryland.
1.2.1.2 The Participant will ensure compliance with the sampling schedule through thedevelopment and use of contingency plans.
1.2.1.3 The Participant will visit each sampling station as specified in Chapter IV, and verify andrecord site location according to procedures specified in each Chapter.
1.2.1.4 The Participant will transport the sampling crew and all necessary sampling and fieldmeasurement equipment and ensure that they are capable of meeting the specified dataquality objectives.
1.2.2 Task 2. Performance of field measurements.
1.2.2.1 The Participant will measure physical and chemical parameters as defined in Chapter IV.
1.2.3 Task 3. Collection, preparation, and transport of field samples.
1.2.3.1 The Participant will develop and implement field chain-of-custody procedures asdescribed in Chapter II.
1.2.3.2 The Participant will collect samples as described in Chapter IV.
1.2.3.3 The Participant will prepare and preserve samples as described in Chapter IV.
1.2.3.4 The Participant will transport samples as described in Chapter IV.
1.2.4 Task 4. Laboratory receipt and preparation of field samples.
Chapter IIntroductionAugust 1996
I-5
1.2.4.1 The Participant will develop and implement laboratory chain-of-custody procedures asdescribed in Chapter II.
1.2.4.2 All CBP monitoring samples shall be received and logged by the sample custodian.
1.2.4.3 The Participant will provide adequate storage for CBP samples awaiting analysis.
1.2.4.4 The Participant will follow the applicable sample preparation procedures outlined in thisdocument.
1.2.5 Task 5. Chemical and biological analyses of field samples.
1.2.5.1 Samples shall be analyzed by the techniques described in the methodologies given inChapters IV through VII for the target parameters listed.
1.2.5.2 Samples must be analyzed within the maximum specified holding times.
1.2.6 Task 6. Adherence to QA/QC procedures outlined in this SOW.
1.2.6.1 The Participant will adhere to all QA procedures described in Chapter II and all specificQC procedures described in Chapters IV, V, VI, and VII. Records documenting the useof the specified QC protocols shall be maintained in accordance with the documentcontrol procedures described in Chapter II.
1.2.6.2 The Participant will establish a Quality Assurance Plan (QAP) with the objective ofproviding sound monitoring data. This program shall incorporate the QC procedures, anynecessary corrective action, and all documentation required during data collection, as wellas the quality assessment measures performed by management to ensure acceptable dataproduction.
1.2.6.3 Additional QC may be conducted in the form of the analysis of Performance Evaluation(PE) check samples submitted to the Participant by the CBPO. The results of all suchcontrol or PE check samples may be used for performance evaluation. "Compliantperformance" is defined as that which yields correct compound identification andconcentration values as determined by the CBPO, as well as meeting the methodrequirements for analysis, quality assurance/quality control, data reporting and otherdeliverables; including sample custody, sample documentation, and SOP documentation.
1.2.7 Task 7. Data management and reporting.
1.2.7.1 Samples will be analyzed and the data reported to EPA within the turnaround times of 3months from the last day of sampling. The Participant will prepare electronic andhardcopy data according to the procedures outlined in Chapter II and will reportelectronic and hardcopy data according to the formats, order, and turnaround timesaccording to this document.

Chapter IIntroductionAugust 1996
I-6
2. Personnel Requirements
2.1 The Participant will provide technical expertise for this contract.
2.2 The Participant will designate and use key personnel to perform the functions described below. TheVADEQ and the CBPO reserve the right to review personnel qualifications and experience, and takecontract action as appropriate.
2.3 The Participant should have an organization with well-defined responsibilities for each individual in themanagement system to ensure sufficient resources for this contract and to maintain a successful operation. To establish this capability, the Participant will designate personnel to carry out the followingresponsibilities for this contract. Functions include, but are not limited to, the following:
2.3.1 Project Manager
Responsible for all aspects of this contract (from sample collection through data delivery) and shallbe the primary contact for the VADEQ and CBPO. The project manager shall be responsible forthe technical and management aspects of the contract and shall ensure that all contractualrequirements are met.
Qualifications:
Education:
Minimum of Masters degree in chemistry, biology, or any scientific/engineeringdiscipline.
Experience:
Minimum of 2 years of field experience, 2 years of laboratory experience, and 1 year ofproject management experience.
2.3.2 Field Supervisor
Responsible for all field activities performed under this contract.
Qualifications:
Education:
Minimum of Bachelor's degree in chemistry, biology, or any scientific/engineeringdiscipline.
Experience:
Minimum of 4 years of field experience, including at least one year of supervisoryexperience.
Chapter IIntroductionAugust 1996
I-7
2.3.3 Water Quality Laboratory Supervisor
Responsible for all technical efforts of the water quality laboratory to meet all terms andconditions of this contract.
Qualifications:
Education:
Minimum of Bachelor's degree in chemistry or any scientific/engineering discipline.
Experience:
Minimum of 4 years of water quality laboratory experience, including at least one year ofsupervisory experience.
2.3.4 Phytoplankton Laboratory Supervisor
Responsible for all technical efforts of the phytoplankton laboratory to meet all terms andconditions of this contract.
Qualifications:
Education:
Minimum of Bachelor's degree in biology or any life science discipline.
Experience:
Minimum of 4 years of phytoplankton laboratory experience, including at least one yearof supervisory experience.
2.3.5 Zooplankton Laboratory Supervisor
Responsible for all technical efforts of the zooplankton laboratory to meet all terms and conditionsof this contract.
Qualifications:
Education:
Minimum of Bachelor's degree in biology or any life science discipline.
Experience:
Minimum of 4 years of zoological laboratory experience, including at least one year ofsupervisory experience.
2.3.6 Benthic Laboratory Supervisor

Chapter IIntroductionAugust 1996
I-8
Responsible for all technical efforts of the benthic laboratory to meet all terms and conditions ofthis contract.
Qualifications:
Education:
Minimum of Bachelor's degree in biology or any life science discipline.
Experience:
Minimum of 4 years of benthic laboratory experience, including at least one year ofsupervisory experience.
2.3.7 Quality Assurance Officer
Responsible for overseeing the quality assurance aspects of contract data and reporting directly toupper management to meet all terms and conditions of this contract.
Qualifications:
Education:
Minimum of Bachelor's degree in chemistry or any scientific/engineering discipline.
Experience:
Minimum of 3 years of field and laboratory experience, including at least one year ofapplied experience with QA principles and practices in sampling and analyticalprocedures.
2.3.8 Sample Custodian
Responsible for receiving the EPA samples (logging, handling, and storage).
Qualifications:
Education:
Minimum High School Diploma with four or more science courses.
Experience:
Minimum of 2 years experience receiving and logging scientific samples.
2.3.9 Data Systems ManagerResponsible for the management and quality control of all computing systems (hardware, software,documentation, and procedures), generating, updating, and quality controlling automateddeliverables to meet all terms and conditions of this contract.
Chapter IIntroductionAugust 1996
I-9
Qualifications:
Education:
Minimum of Bachelor's degree with four or more intermediate courses in programming,information management, database management systems, or systems requirementsanalysis.
Experience:
Minimum of 3 years experience in data or systems management or programmingincluding one year of experience with software utilized for data management andgeneration of data deliverables.
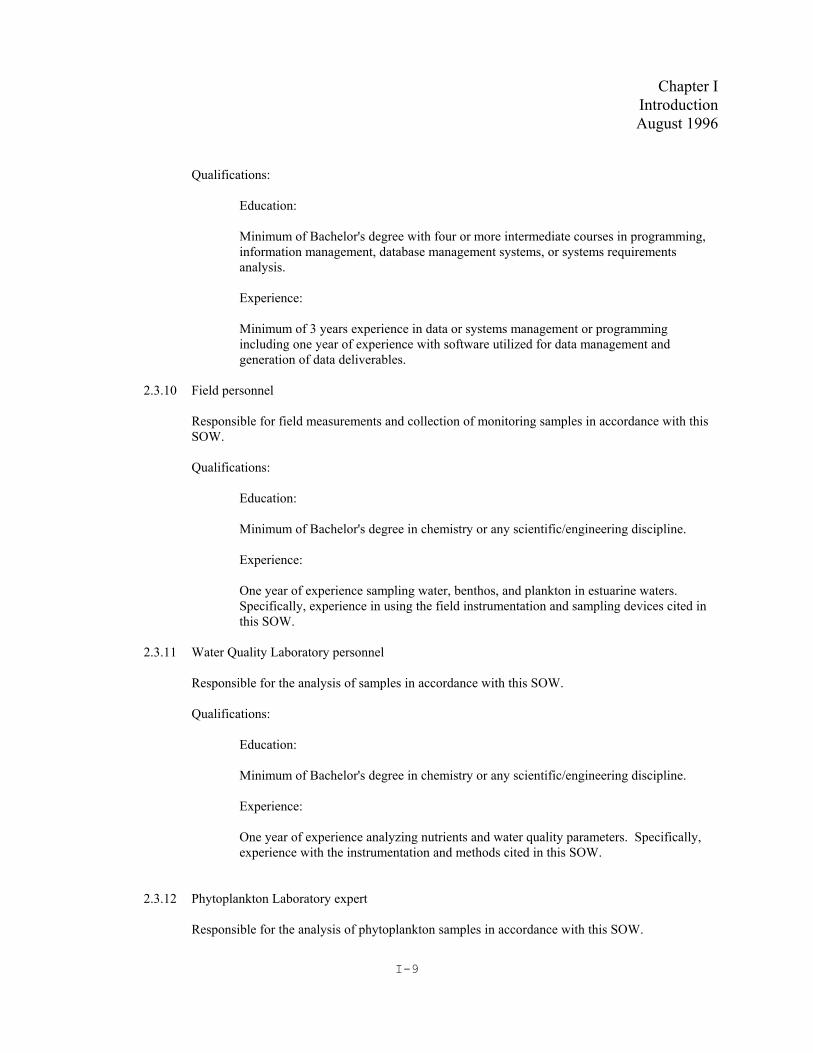
2.3.10 Field personnel
Responsible for field measurements and collection of monitoring samples in accordance with thisSOW.
Qualifications:
Education:
Minimum of Bachelor's degree in chemistry or any scientific/engineering discipline.
Experience:
One year of experience sampling water, benthos, and plankton in estuarine waters. Specifically, experience in using the field instrumentation and sampling devices cited inthis SOW.
2.3.11 Water Quality Laboratory personnel
Responsible for the analysis of samples in accordance with this SOW.
Qualifications:
Education:
Minimum of Bachelor's degree in chemistry or any scientific/engineering discipline.
Experience:
One year of experience analyzing nutrients and water quality parameters. Specifically,experience with the instrumentation and methods cited in this SOW.
2.3.12 Phytoplankton Laboratory expert
Responsible for the analysis of phytoplankton samples in accordance with this SOW.
Chapter IIntroductionAugust 1996
I-10
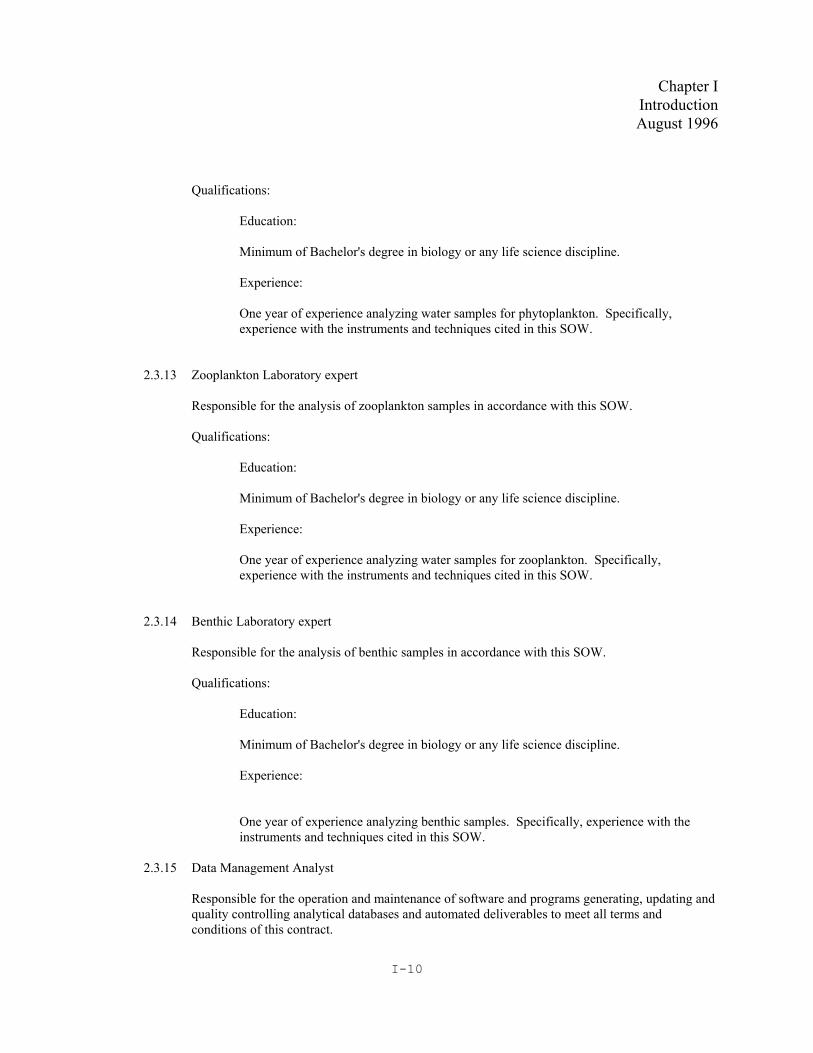
Qualifications:
Education:
Minimum of Bachelor's degree in biology or any life science discipline.
Experience:
One year of experience analyzing water samples for phytoplankton. Specifically,experience with the instruments and techniques cited in this SOW.
2.3.13 Zooplankton Laboratory expert
Responsible for the analysis of zooplankton samples in accordance with this SOW.
Qualifications:
Education:
Minimum of Bachelor's degree in biology or any life science discipline.
Experience:
One year of experience analyzing water samples for zooplankton. Specifically,experience with the instruments and techniques cited in this SOW.
2.3.14 Benthic Laboratory expert
Responsible for the analysis of benthic samples in accordance with this SOW.
Qualifications:
Education:
Minimum of Bachelor's degree in biology or any life science discipline.
Experience:
One year of experience analyzing benthic samples. Specifically, experience with theinstruments and techniques cited in this SOW.
2.3.15 Data Management Analyst
Responsible for the operation and maintenance of software and programs generating, updating andquality controlling analytical databases and automated deliverables to meet all terms andconditions of this contract.
Chapter IIntroductionAugust 1996
I-11
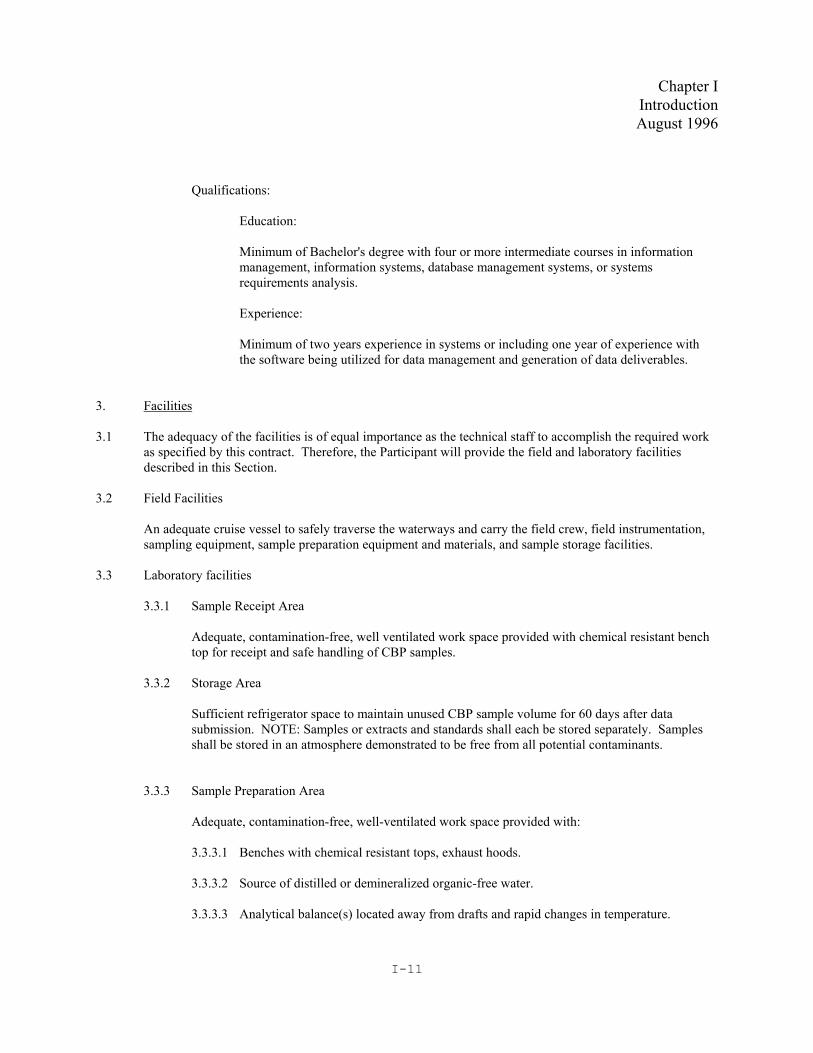
Qualifications:
Education:
Minimum of Bachelor's degree with four or more intermediate courses in informationmanagement, information systems, database management systems, or systemsrequirements analysis.
Experience:
Minimum of two years experience in systems or including one year of experience withthe software being utilized for data management and generation of data deliverables.
3. Facilities
3.1 The adequacy of the facilities is of equal importance as the technical staff to accomplish the required workas specified by this contract. Therefore, the Participant will provide the field and laboratory facilitiesdescribed in this Section.
3.2 Field Facilities
An adequate cruise vessel to safely traverse the waterways and carry the field crew, field instrumentation,sampling equipment, sample preparation equipment and materials, and sample storage facilities.
3.3 Laboratory facilities
3.3.1 Sample Receipt Area
Adequate, contamination-free, well ventilated work space provided with chemical resistant benchtop for receipt and safe handling of CBP samples.
3.3.2 Storage Area
Sufficient refrigerator space to maintain unused CBP sample volume for 60 days after datasubmission. NOTE: Samples or extracts and standards shall each be stored separately. Samplesshall be stored in an atmosphere demonstrated to be free from all potential contaminants.
3.3.3 Sample Preparation Area
Adequate, contamination-free, well-ventilated work space provided with:
3.3.3.1 Benches with chemical resistant tops, exhaust hoods.
3.3.3.2 Source of distilled or demineralized organic-free water.
3.3.3.3 Analytical balance(s) located away from drafts and rapid changes in temperature.

Chapter IIntroductionAugust 1996
I-12
3.3.4 Standards and reagents
The Participant will have in-house appropriate standards and reagents to perform the procedures inthis SOW.
4. Instrumentation and Equipment
4.1 The Participant will have the field and laboratory instrumentation and equipment described in this Section.
4.2 All equipment and instrumentation specified in this document are recommended and should be in thepossession of the Participant and in good condition at all times during the length of the grant. TheParticipant will ensure that, in the event of instrument or equipment failure, backup instrumentation orequipment in good condition are available to perform field measurements, and sample collection,preparation, and analysis. It is recommended that surge protectors and a temporary backup power supplysource are installed in order to protect analytical instruments, PCs, and other equipment in the event of atemporary electrical disruption or power surge.
4.3 In addition, the Participant should have an in-house stock of instrument parts to ensure continuousoperation to meet contract-specified holding and turnaround times.
4.4 At a minimum, the Participant should have the following instruments and equipment operative.
4.4.1 Field Instrumentation and equipment
4.4.1.1 Secchi disk.
4.4.1.2 CTD device, equipped with pH probe, DO probe, depth sensor, bottom sensor, lightattenuation sensors.
4.4.1.3 Sample collection bottles.
4.4.1.4 System to collect below surface samples.
4.4.1.5 Plankton nets.
4.4.1.6 Stationary Bongo dropnet.
4.4.1.7 Diaphragm pump system.
4.4.1.8 Spade-type coring device.
4.4.2 Water Quality analyses
4.4.2.1 Continuous flow automated analytical system equipped with an autosampler, manifold,proportional pump, colorimeter, phototube, recorder or computer based data system, and heatingbath (e.g., Technicon AutoAnalyzer).
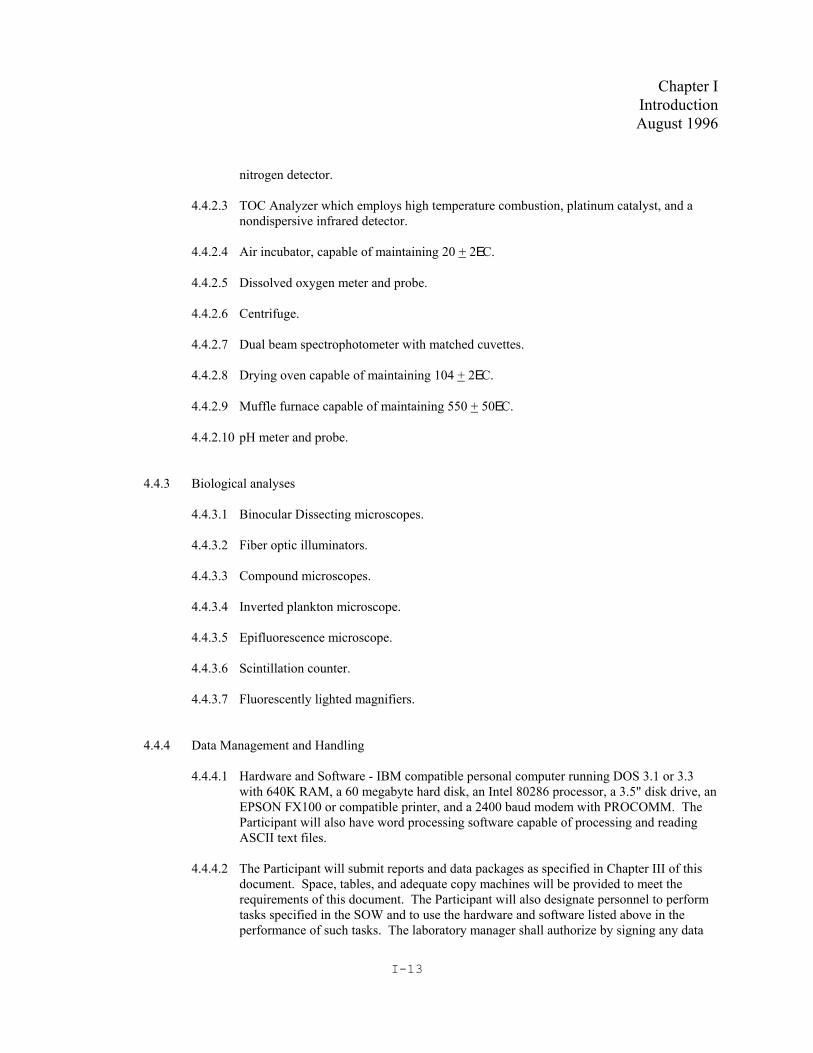
4.4.2.2 Nitrogen Analyzer equipped with a combustion tube, reduction tube, water trap, and
Chapter IIntroductionAugust 1996
I-13
nitrogen detector.
4.4.2.3 TOC Analyzer which employs high temperature combustion, platinum catalyst, and anondispersive infrared detector.
4.4.2.4 Air incubator, capable of maintaining 20 + 2EC.
4.4.2.5 Dissolved oxygen meter and probe.
4.4.2.6 Centrifuge.
4.4.2.7 Dual beam spectrophotometer with matched cuvettes.
4.4.2.8 Drying oven capable of maintaining 104 + 2EC.
4.4.2.9 Muffle furnace capable of maintaining 550 + 50EC.
4.4.2.10 pH meter and probe.
4.4.3 Biological analyses
4.4.3.1 Binocular Dissecting microscopes.
4.4.3.2 Fiber optic illuminators.
4.4.3.3 Compound microscopes.
4.4.3.4 Inverted plankton microscope.
4.4.3.5 Epifluorescence microscope.
4.4.3.6 Scintillation counter.
4.4.3.7 Fluorescently lighted magnifiers.
4.4.4 Data Management and Handling
4.4.4.1 Hardware and Software - IBM compatible personal computer running DOS 3.1 or 3.3with 640K RAM, a 60 megabyte hard disk, an Intel 80286 processor, a 3.5" disk drive, anEPSON FX100 or compatible printer, and a 2400 baud modem with PROCOMM. TheParticipant will also have word processing software capable of processing and readingASCII text files.
4.4.4.2 The Participant will submit reports and data packages as specified in Chapter III of thisdocument. Space, tables, and adequate copy machines will be provided to meet therequirements of this document. The Participant will also designate personnel to performtasks specified in the SOW and to use the hardware and software listed above in theperformance of such tasks. The laboratory manager shall authorize by signing any data
Chapter IIntroductionAugust 1996
I-14
that have been manually edited.

Chapter IIQuality Assurance
August 1996
II-1
CHAPTER IIQUALITY ASSURANCE
Section A. Introduction
Section B. General QA/QC Requirements
1. Reporting2. Chain-of-Custody3. Participation in Technical Meetings4. Procedural Change Authorization
Section C. Field QA/QC Procedures
1. Annual Calibration2. Calibration Check3. Check Sample
Section D. Laboratory QA/QC Procedures
1. Method Blank2. Matrix Spike3. Laboratory Replicate4. Check Standard5. Glassware Cleaning
Section E. Data Quality Objectives
1. General DQOs2. Sampling3. Field Measurements4. Water Quality Monitoring5. Phytoplankton Monitoring6. Zooplankton Monitoring7. Benthic Monitoring
Section F. Documentation Recommendations
1. Quality Assurance Plan2. Quality Assurance Project Plans3. Standard Operating Procedures4. Document Control5. Contingency and Health and Safety Plans
Chapter IIQuality Assurance
August 1996
II-2
Section G. Performance Assessment
1. Split Sample Program2. Performance Evaluation Samples3. Audits of Data Quality4. On-Site Audits
Section H. References
Chapter IIQuality Assurance
August 1996
II-3
SECTION A
INTRODUCTION
The Chesapeake Bay Program (CBP) was established by Congressional directive with the objectives ofcharacterizing the state of the Chesapeake Bay, identifying long term trends, and providing data and guidance tomanagers and modelers during the restoration phase. The Chesapeake Bay Program Office (CBPO) has developedand integrated into all phases of the monitoring and measurement activities under its purview a scheme of qualityassurance (QA) practices. These practices, as defined in the CBP QA Program Plan (QAPP), are focused onensuring that all data generated through the CBP are scientifically valid, defensible, of known quality, and designedto meet data user requirements.
A QA program shall be developed and implemented within the participants' organization that is in accordance withthe procedures and recommendations of this document. The purpose of this chapter is to define therecommendations of the participants' QA program. Section B provides an overview of the programmatic QA andquality control (QC) recommendations. Method-specific QC recommendations are provided within each fieldmeasurement, sampling, and analytical procedure. Section C provides information on the program's Data QualityObjectives, Section D provides documentation recommendations, Section E provides for initial and continuousperformance assessment, and Section F provides a list of relevant references.
Chapter IIQuality Assurance
August 1996
II-4
SECTION B
GENERAL QA/QC REQUIREMENTS
1. Reporting
1.1 Field data and laboratory analysis information should be entered into an automated data entry and qualityassurance program that will be provided by the Chesapeake Bay Program. This Program will provide a firstlevel of statistical range checking, quality control checking and output as recommended by this document.
1.2 Cruise event data collected at the cruise location may be entered on location. Cruise event data pointsrelevant to laboratory analysis should be entered using the guidelines as outlined in the CBP DataManagement Plan (DMP).
1.3 Hardcopy records and source documents for both the cruise event data and the laboratory analysis datashould be kept for a period of 5 years after the last day of the cruise.
1.4 The CBPCC will provide training for up to 4 employees on the use of the CBP-supplied program, when thesoftware is installed. Henceforth, it will be the responsibility of the Participants to train their staffmembers.
1.5 The Participants shall keep electronic media backups of the cruise data, for the period of the grant. At theend of the grant, this data must be relinquished to the CBPO.
1.6 The Participants will submit a Cruise Report at the end of each cruise within approximately two days afterthe end of the cruise.
1.7 The Participants shall submit a complete data package for each cruise. This submission must comprise allfield measurement, analytical, and all relevant QC data from all stations sampled during the cruise. Thisinformation must adhere to the requirements outlined in the Data Management Plan (DMP).
1.8 The Participants will be provided with a PC based program that can be utilized for entry, verification, andsubmission of data to the CBPO.
1.8.1 Data may be entered in one of two ways: using manual data entry screens for each type of data; orthe program will accept input from another computer or instrument if data are submitted in EPAstandard format (ESF).
1.8.2 The program has data entry screens for each type of data. These screens are used to enter the data. While data are being entered, range checks will be run on each item. When an item is out ofcritical or warning range, the user will be notified.
1.8.3 The program can accept data from another computer via floppy disk that is in ESF format. Whenthese data are input, they will be run through range checks as described in item 1.8.2.
1.8.4 After all data are entered by one of the above methods, the program will print out a number ofgraphic plots of the data. The Participants will examine the plots, and the laboratory director is
Chapter IIQuality Assurance
August 1996
II-5
required to sign each plot indicating that the data have been examined and appear to be correct.
1.8.5 The program will print out a listing of all values that are above or below warning and criticallimits. The laboratory director is required to examine this listing and sign that it is correct.
1.8.6 The program will print out a list of missing values for the cruise. The designated person in chargeof the laboratory is required to enter a reason for each of the missing values and print out the list.
1.8.7 The program will write out a disk in accordance to the DMP format that must be submitted to theCBPCC.
1.8.8 The Participant shall provide a cover letter for each submittal indicating, and not limited to:
1.8.8.1 Cruise number.
1.8.8.2 Time period covered by the submitted data.
1.8.8.3 Type of data, i.e., Mainstem Monitoring.
1.8.8.4 A synopsis of major problems, if any.
1.8.8.5 A statement of any changes since the last data submission, if any (a restatement of anyissues previously recorded on the "Procedure Change Tracking Form" that affect thissubmission).
1.8.8.6 A statement indicating Participant willingness to ensure corrections to the data for aperiod of five years.
1.9 The required submission must include the following:
1.9.1 The data disk (results, QC data, and data summary file);
1.9.2 The plots created under section 1.8.4;
1.9.3 The list of range values created in section 1.8.5;
1.9.4 The list of missing values created in section 1.8.6; and,
1.9.5 A cover letter as described in Section 1.8.8.
1.10 The Participants shall be responsible for correcting any errors found by the CBPCC and resubmitting thedata in the required format to the CBPO. The Participants shall be required to correct any errors found forno additional cost for a period of 5 years after sample collection.
2. Chain-of-Custody
2.1 Procedures should be established that ensure that samples are properly collected and preserved from thetime the samples are collected until the corresponding data are submitted to the CBPCC.
Chapter IIQuality Assurance
August 1996
II-6
2.2 A system for assuring positive identification of samples and documentation of all samples must beoperational. To ensure sample integrity, chain-of-custody procedures including procedures for sampleidentification, sample receiving, and sample tracking, should be developed and instituted.
2.2.1 Sample Identification
2.2.1.1 To assure traceability of samples while in possession, there should be a specified methodfor maintaining identification of samples in the field and throughout the laboratory.
2.2.1.2 Each sample and sample preparation container should be labeled with a unique identifierthat is cross-referenced with the corresponding documentation.
2.2.2 Sample Receiving
2.2.2.1 A sample custodian (and an alternate) responsible for receiving all samples should bedesignated.
2.2.2.2 The condition of the shipping and sample containers should be inspected and documentedupon receipt by the sample custodian or his/her representative.
2.2.2.3 The sample custodian or his/her representative should sign and date all formsaccompanying the samples at the time of sample receipt.
2.2.3 Sample Tracking
2.2.3.1 Records documenting all phases of sample handling from collection to final analysisshould be maintained.
3. Participation in Technical Meetings
3.1 Attendance of Monitoring Subcommittee meetings, Analytical Methods and Quality Assurance Workgroup(AMQAW) meetings, and miscellaneous technical meetings as required, is recommended by the CBPO.
3.2 The CBP Monitoring Subcommittee coordinates multi-jurisdictional efforts to monitor the Chesapeake Baybasin system. It manages and ensures continued accessibility of the resultant environmental data andpromotes multi-disciplinary interpretation and reporting of the data on a jurisdiction and program-widebasis. The Monitoring Subcommittee oversees implementation of new and innovative monitoring programs(water quality, living resources, toxics and ecosystem processes) and techniques. It reevaluates existingprograms to ensure that environmental data necessary to support implementation of a comprehensivequality assurance program (as part of components of the various monitoring programs) are collected. Emphasis is placed on ensuring collection and management of comparable environmental data of knownquality through continued communication and transfer of technologies between the agencies and institutionsinvolved in the Chesapeake Bay Monitoring Program.
3.3 AMQAW comprises technical advisors to the Monitoring Subcommittee concerning field and analytical methodology andquality assurance issues. These advisors include laboratory directors from the mainstem and tributary laboratories, fieldmanagers, and State managers conducting work for the Chesapeake Bay Program. The workgroup's goal is to discussanalytical and field protocols, identify discrepancies (the issues are usually identified by reviewing the data), and takemeasures to improve the situation. The workgroup provides a forum for exchange of technical information focused onmoving towards standardization of methods/use of comparable methods throughout the Chesapeake Bay Monitoring Program.
The forum allows the different organizations to share the way they do things and individuals to present new and innovativeideas, potentially for their use.
3.4 AMQAW reviews issues pertaining to the CBP Coordinated Split Sampling Program (CSSP). As directed by the CBPO andAMQAW, the Participants shall conduct follow-up investigations to determine possible causes of inter-organizationdifferences in CSSP results. Funding may be applied for from the Monitoring Subcommittee for special studies to improvethe quality of field and laboratory methods.
4. Procedural Change Authorization
4.1 Any substantial or long-term changes to a procedure or method, either in the field or laboratory, should be submitted to theCBP Quality Assurance Officer. These types of changes may include items such as modifications to detection limits,instrument type or sampling stations. All actual and proposed modifications should be documented using the ChesapeakeBay Monitoring Program Procedure Modification Tracking Form (PMTF) (Figure II-1).
4.2 The completed PMTF should be submitted to the CBP QAO within 30 days after the last day of the cruise.
4.3 Minor events occurring in the laboratory should be documented in the data summary file, associated with the data in thediskette.
4.4 At the conclusion of the cruise, a Monitoring Cruise Report should be completed and submitted to the State agency, who willthen forward it to the CBPO. The Chesapeake Bay Monitoring Program Cruise Report is shown in Figure II-2.
4.5 Modifications due to emergencies during a sampling cruise are authorized by the Chief Scientist with priorities for safety andcompletion of the cruise. Modifications should be reported after the cruise. Depending on size or amount of impact on thedata the deviation has, the change should be documented in either the PMTF or the Monitoring Cruise Report.
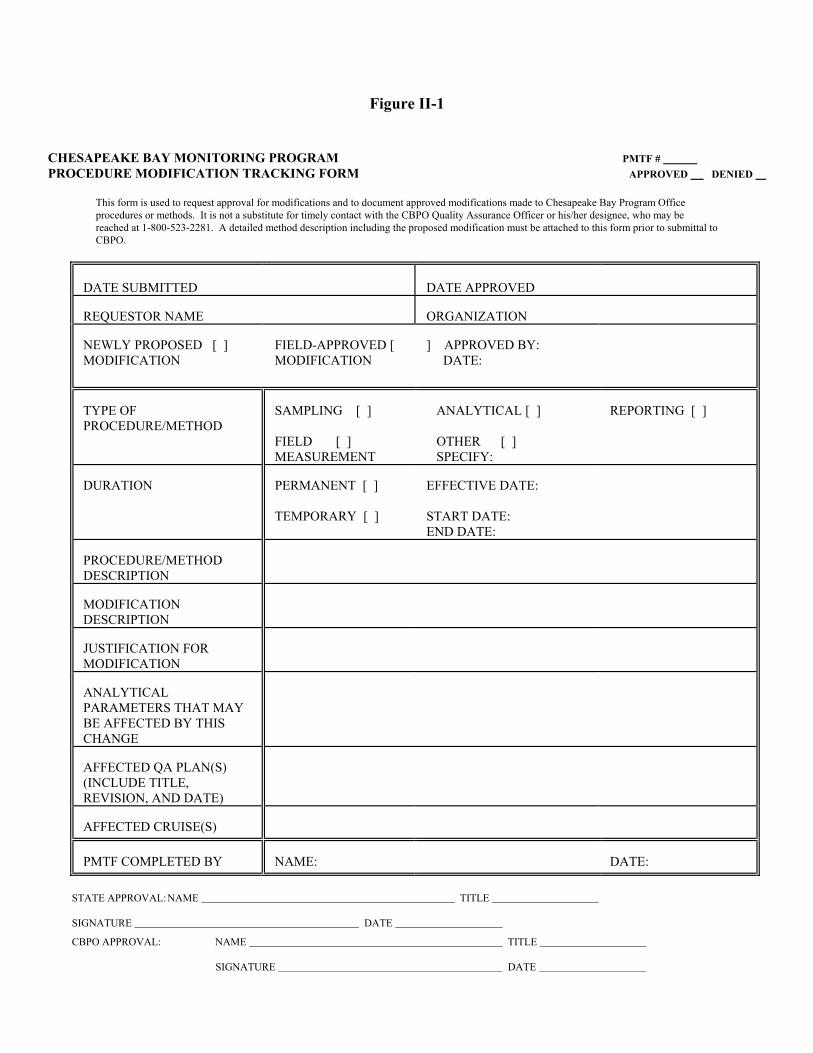
Figure II-1
CHESAPEAKE BAY MONITORING PROGRAM PMTF # PROCEDURE MODIFICATION TRACKING FORM APPROVED DENIED
This form is used to request approval for modifications and to document approved modifications made to Chesapeake Bay Program Officeprocedures or methods. It is not a substitute for timely contact with the CBPO Quality Assurance Officer or his/her designee, who may bereached at 1-800-523-2281. A detailed method description including the proposed modification must be attached to this form prior to submittal toCBPO.
DATE SUBMITTED DATE APPROVED
REQUESTOR NAME ORGANIZATION
NEWLY PROPOSED [ ] MODIFICATION
FIELD-APPROVED [MODIFICATION
] APPROVED BY: DATE:
TYPE OFPROCEDURE/METHOD
SAMPLING [ ]
FIELD [ ]MEASUREMENT
ANALYTICAL [ ]
OTHER [ ] SPECIFY:
REPORTING [ ]
DURATION PERMANENT [ ]
TEMPORARY [ ]
EFFECTIVE DATE:
START DATE:END DATE:
PROCEDURE/METHODDESCRIPTION
MODIFICATIONDESCRIPTION
JUSTIFICATION FORMODIFICATION
ANALYTICALPARAMETERS THAT MAYBE AFFECTED BY THISCHANGE
AFFECTED QA PLAN(S)(INCLUDE TITLE,REVISION, AND DATE)
AFFECTED CRUISE(S)
PMTF COMPLETED BY NAME: DATE:
STATE APPROVAL:NAME TITLE
SIGNATURE DATE
CBPO APPROVAL: NAME TITLE
SIGNATURE DATE

Chapter IIQuality Assurance
August 1996
II-9
SECTION C
FIELD QUALITY ASSURANCE PROCEDURES
1. Annual Calibration
1.1 An annual calibration is an extensive and thorough calibration using standards or instruments relating backto certified (e.g. National Institute of Standards and Technologies) instruments or standards to ensure theparameter precision.
1.2 These calibrations will be performed on each instrument at least annually.
2. Calibration Check
2.1 A calibration check is a verification performed before and after each cruise to ensure that the instrumentresponse is comparable that which existed at the annual calibration.
2.2 Calibration checks are performed before and after each cruise.
2.3 Calibration by standard operating procedures should include measurements against a reference standard ormeter.
2.4 When the calibration check indicates a significant change during a cruise, the instrument should be re-calibrated as described in the annual calibration.
3. Check Sample
3.1 A check sample is a water sample that is collected simultaneously with an in-situ measurement and returnedto the laboratory for analysis.
Chapter IIQuality Assurance
August 1996
II-10
SECTION D
LABORATORY QUALITY ASSURANCE PROCEDURES
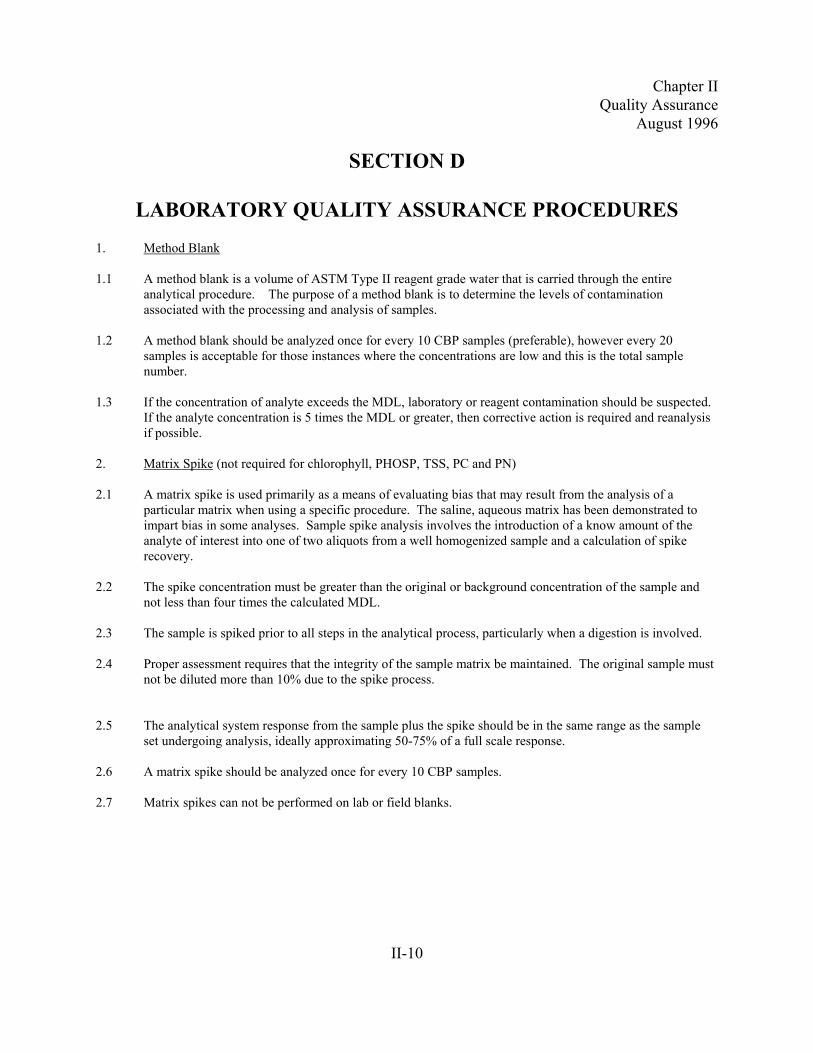
1. Method Blank
1.1 A method blank is a volume of ASTM Type II reagent grade water that is carried through the entireanalytical procedure. The purpose of a method blank is to determine the levels of contaminationassociated with the processing and analysis of samples.
1.2 A method blank should be analyzed once for every 10 CBP samples (preferable), however every 20samples is acceptable for those instances where the concentrations are low and this is the total samplenumber.
1.3 If the concentration of analyte exceeds the MDL, laboratory or reagent contamination should be suspected. If the analyte concentration is 5 times the MDL or greater, then corrective action is required and reanalysisif possible.
2. Matrix Spike (not required for chlorophyll, PHOSP, TSS, PC and PN)
2.1 A matrix spike is used primarily as a means of evaluating bias that may result from the analysis of aparticular matrix when using a specific procedure. The saline, aqueous matrix has been demonstrated toimpart bias in some analyses. Sample spike analysis involves the introduction of a know amount of theanalyte of interest into one of two aliquots from a well homogenized sample and a calculation of spikerecovery.
2.2 The spike concentration must be greater than the original or background concentration of the sample andnot less than four times the calculated MDL.
2.3 The sample is spiked prior to all steps in the analytical process, particularly when a digestion is involved.
2.4 Proper assessment requires that the integrity of the sample matrix be maintained. The original sample mustnot be diluted more than 10% due to the spike process.
2.5 The analytical system response from the sample plus the spike should be in the same range as the sampleset undergoing analysis, ideally approximating 50-75% of a full scale response.
2.6 A matrix spike should be analyzed once for every 10 CBP samples.
2.7 Matrix spikes can not be performed on lab or field blanks.
Chapter IIQuality Assurance
August 1996
II-11
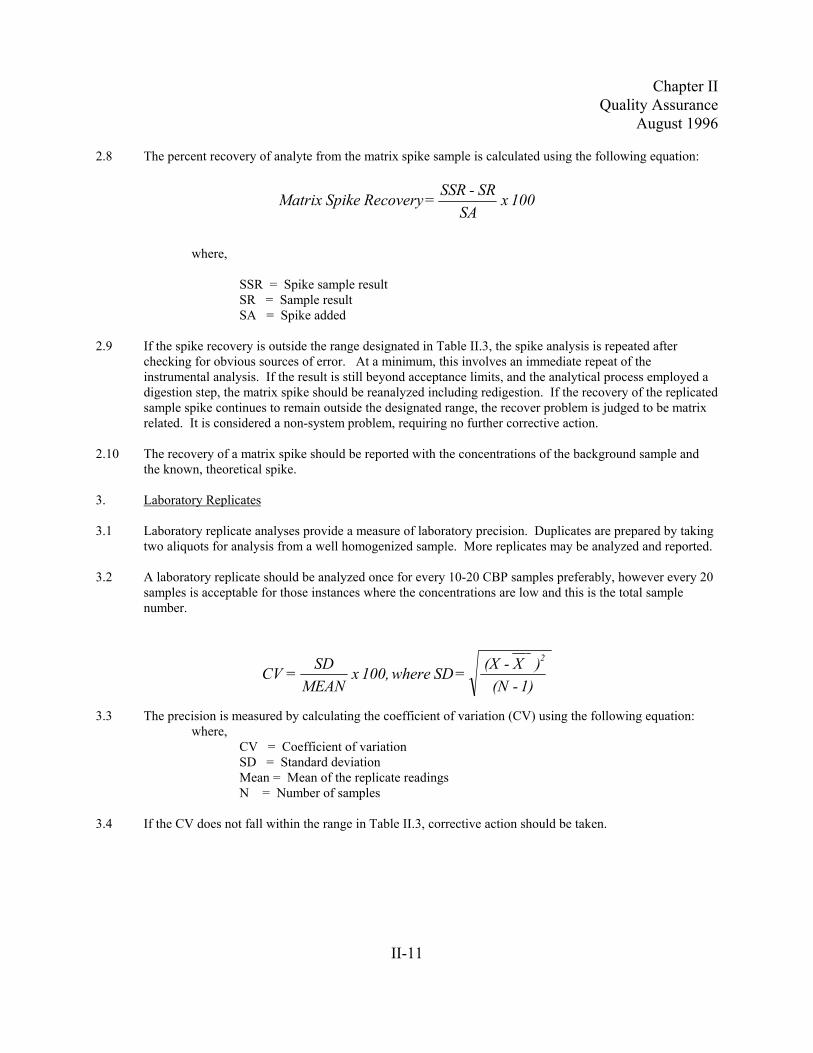
2.8 The percent recovery of analyte from the matrix spike sample is calculated using the following equation:
where,
SSR = Spike sample resultSR = Sample resultSA = Spike added
2.9 If the spike recovery is outside the range designated in Table II.3, the spike analysis is repeated afterchecking for obvious sources of error. At a minimum, this involves an immediate repeat of theinstrumental analysis. If the result is still beyond acceptance limits, and the analytical process employed adigestion step, the matrix spike should be reanalyzed including redigestion. If the recovery of the replicatedsample spike continues to remain outside the designated range, the recover problem is judged to be matrixrelated. It is considered a non-system problem, requiring no further corrective action.
2.10 The recovery of a matrix spike should be reported with the concentrations of the background sample andthe known, theoretical spike.
3. Laboratory Replicates
3.1 Laboratory replicate analyses provide a measure of laboratory precision. Duplicates are prepared by takingtwo aliquots for analysis from a well homogenized sample. More replicates may be analyzed and reported.
3.2 A laboratory replicate should be analyzed once for every 10-20 CBP samples preferably, however every 20samples is acceptable for those instances where the concentrations are low and this is the total samplenumber.
3.3 The precision is measured by calculating the coefficient of variation (CV) using the following equation:where,
CV = Coefficient of variationSD = Standard deviationMean = Mean of the replicate readingsN = Number of samples
3.4 If the CV does not fall within the range in Table II.3, corrective action should be taken.
100 x SA
SR- SSR =Recovery SpikeMatrix
1) - (N
) X-(X = SD where100, x MEAN
SD = CV2
Chapter IIQuality Assurance
August 1996
II-12
4. Check Standard
4.1 An accurately prepared chemical standard is analyzed every 10 CBP samples preferably, however every 20samples is acceptable for those instances where the concentrations are low and this is the total samplenumber. The results are compared to the known analyte concentration. If the determined concentration forknown analysis is not within 90-110% of the known analyte concentration, a second check standard isprepared and analyzed to confirm or deny the initial "out of control" analysis. If the reanalyzed checkstandard is within acceptance limits, sample analysis proceeds; however, if the reanalyzed check standardfails the acceptable limits, the instrument must be recalibrated. All the samples between that check standardand the previous standard must be reanalyzed.
5. Glassware Cleaning
5.1 Standard and Reagent Glassware should be rinsed with 10% HCl once and then rinsed 3 times with reagentgrade water.
5.2 Sample Containers should be rinsed with tap water, 10% HCl and then rinsed 4 times with reagent water. Then, before use they should be rinsed 3 times with sample.
5.3 AutoAnalyzer Cups should be rinsed three times with the sample, and then filled.

Chapter IIQuality Assurance
August 1996
II-13
SECTION E
DATA QUALITY OBJECTIVES (DQO)
1. General DQOs
1.1 Data Quality Objectives are qualitative and quantitative statements that specify the quality of data requiredto support specific CBPO decisions. DQOs also specify the level of uncertainty that a decision maker iswilling to accept in results derived from monitoring data, when the results are used in a regulatory orprogrammatic decision, such as establishing analytical method requirements, establishing samplingprotocols, and revision or development of industry standards.
1.2 The DQOs defined in this Section were developed by the CBPO using existing performance information onthe methods and procedures contained in this document. DQOs are established through an iterative process,these values may be adjusted by the CBP QAO as a result of evaluations of performance data generatedduring this program.
1.3 The main objective of this document is to provide monitoring data of known and consistent quality to theCBPO. This data will be used in characterizing the state of the Chesapeake Bay, identifying long termtrends, and providing data and guidance to managers and modelers during the restoration phase.
1.4 The domain of concern for the Chesapeake Bay Monitoring Program comprises the chemical and biologicalcharacterization of the waters and sediment of the Chesapeake Bay and its tributaries.
1.5 The levels of quality of sampling activities are expressed in terms of comparability, representativeness,precision, accuracy, and completeness using the following criteria.
1.5.1 Following the sampling procedures and sample locations recommended in this document mayensure sampling comparability and representativeness of data generated to meet the CBP needs.
1.5.2 Overall precision (sampling and analytical) is assessed through field replicatemeasurements/analyses, and is expressed as coefficient of variation (CV). Sampling precision canbe evaluated by comparing overall precision to measurement/analytical precision.
1.5.3 Overall accuracy is assessed through field spike analyses, and is expressed as percent recovery. Sampling accuracy can be evaluated by comparing overall accuracy to measurement/analyticalaccuracy. However, these are not recommended.
1.5.4 Sampling completeness is calculated based on the ratio of samples collected to samples that wereplanned, and is expressed as percent completeness.
1.6 The levels of quality of measurement and analytical data are expressed in terms of comparability,representativeness, precision, accuracy, completeness, and method detection limits (MDL) using thefollowing criteria.
1.6.1 Measurement/analytical comparability and representativeness of data generated will be ensuredthrough adherence to the measurement and analytical procedures described methods document.
Chapter IIQuality Assurance
August 1996
II-14
1.6.2 Precision, expressed as coefficient of variation (CV), for measurement and analytical data iscalculated based on replicate measurements/analyses.
1.6.3 Accuracy, expressed as percent of reference value, of measurement data is calculated based onmeasurements of standard reference materials (where available) and calibrating referencetechniques.
1.6.4 Accuracy, expressed as percent recovery, of analytical data is calculated based on the analysis ofspiked samples and reference materials.
1.6.5 Completeness of measurement data is calculated based on the ratio of measurements made tomeasurements planned, and is expressed as percent completeness.
1.6.6 Completeness of analytical data is calculated based on the ratio of samples that are analyzed to thenumber of samples collected, and is expressed as percent completeness.
1.6.7 Method detection limits should be determined for all parameters using the proceduresrecommended by the AMQAW as described below.
1.6.7.1 Samples used in the determination of MDLs should be environmental samples collectedonce each year during winter, or whenever that analyte's concentration is lowest for theyear. The sampling location most appropriate and representative for MDL analysesshould be determined before collection.
1.6.7.2 MDL values should be determined as 3 times the standard deviation of seven replicatemeasurements/analyses of the same sample.
1.6.7.3 MDLs should be verified for each parameter on an annual basis or whenever a change ismade in the measurement or analytical methodology.
1.6.7.4 A table of MDLs values and all supporting documentation should be maintained by theParticipant and made available for review as requested by a CBPO representative. Whenvalues change, the revised table of MDL values should be included with each datapackage.
1.7 Real-time quality control charts for precision and accuracy should be developed and maintained for eachparameter and each concentration level, using the most recent 25 points, at least. More points may be usedif deemed necessary. The CBPO will provide further information on a PC-based software package tofacilitate the calculations and to ensure consistency in the development of the control charts.
1.7.1 Control charts are centered at the arithmetic mean. Unless otherwise specified in the method, theupper and lower control limits are defined at + 3 standard deviations from the mean and the upperand lower warning limits are defined at + 2 standard deviations from the mean.
1.7.2 Precision and accuracy acceptance windows for implementation during the development phase ofthe control charts are provided within each method and in Sections 2, 3, 4, 5, and 7.
1.7.3 Once control charts have been established, they should be used to determine if a given analyticalor measurement process is in control.
Chapter IIQuality Assurance
August 1996
II-15
1.7.3.1 A process is out of control if 3 or more data points are outside either control limit.
1.7.3.2 Immediate corrective action is recommended for any process identified as being out ofnormal control limits. Where possible, this should include reanalysis.
1.7.3.3 A warning of possible systematic error is indicated if 7 successive data points fall awayfrom the mean on the same side of the center line, if 7 or more data points fall outside ofeither warning limit, or if a discernible trend develops.
Chapter IIQuality Assurance
August 1996
II-16
2. Sampling
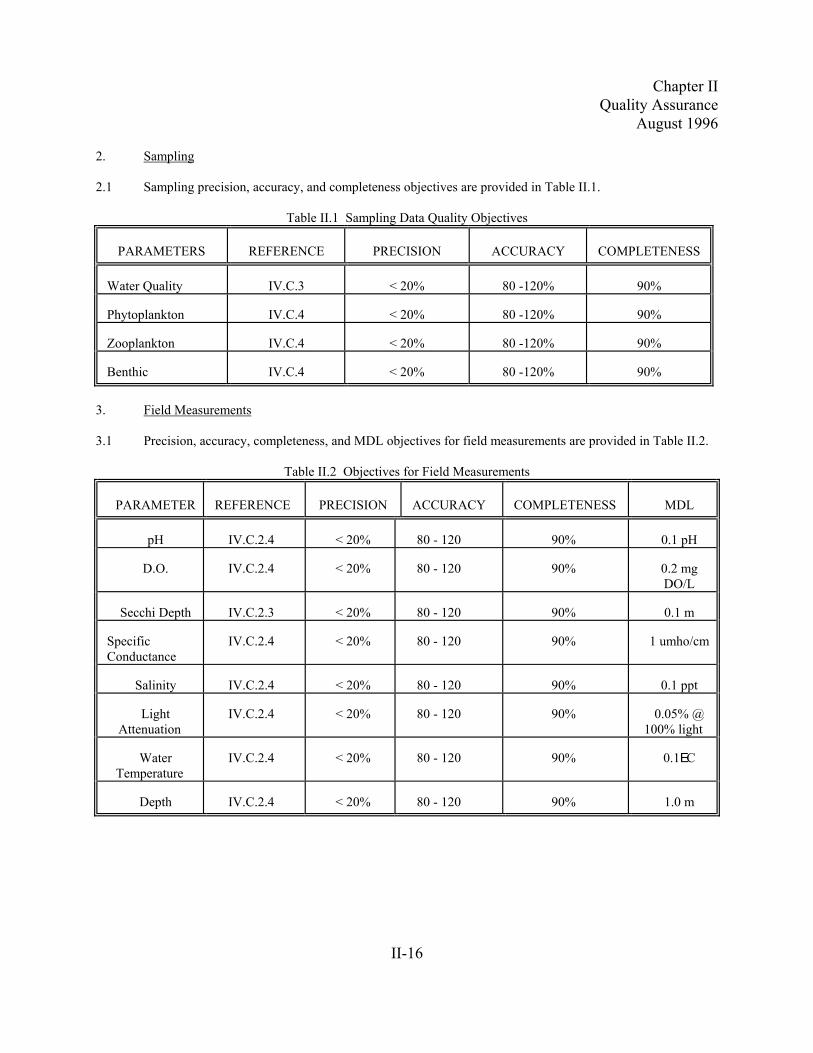
2.1 Sampling precision, accuracy, and completeness objectives are provided in Table II.1.
Table II.1 Sampling Data Quality Objectives
PARAMETERS REFERENCE PRECISION ACCURACY COMPLETENESS
Water Quality IV.C.3 < 20% 80 -120% 90%
Phytoplankton IV.C.4 < 20% 80 -120% 90%
Zooplankton IV.C.4 < 20% 80 -120% 90%
Benthic IV.C.4 < 20% 80 -120% 90%
3. Field Measurements
3.1 Precision, accuracy, completeness, and MDL objectives for field measurements are provided in Table II.2.
Table II.2 Objectives for Field Measurements
PARAMETER REFERENCE PRECISION ACCURACY COMPLETENESS MDL
pH IV.C.2.4 < 20% 80 - 120 90% 0.1 pH
D.O. IV.C.2.4 < 20% 80 - 120 90% 0.2 mgDO/L
Secchi Depth IV.C.2.3 < 20% 80 - 120 90% 0.1 m
SpecificConductance
IV.C.2.4 < 20% 80 - 120 90% 1 umho/cm
Salinity IV.C.2.4 < 20% 80 - 120 90% 0.1 ppt
LightAttenuation
IV.C.2.4 < 20% 80 - 120 90% 0.05% @100% light
WaterTemperature
IV.C.2.4 < 20% 80 - 120 90% 0.1EC
Depth IV.C.2.4 < 20% 80 - 120 90% 1.0 m
Chapter IIQuality Assurance
August 1996
II-17
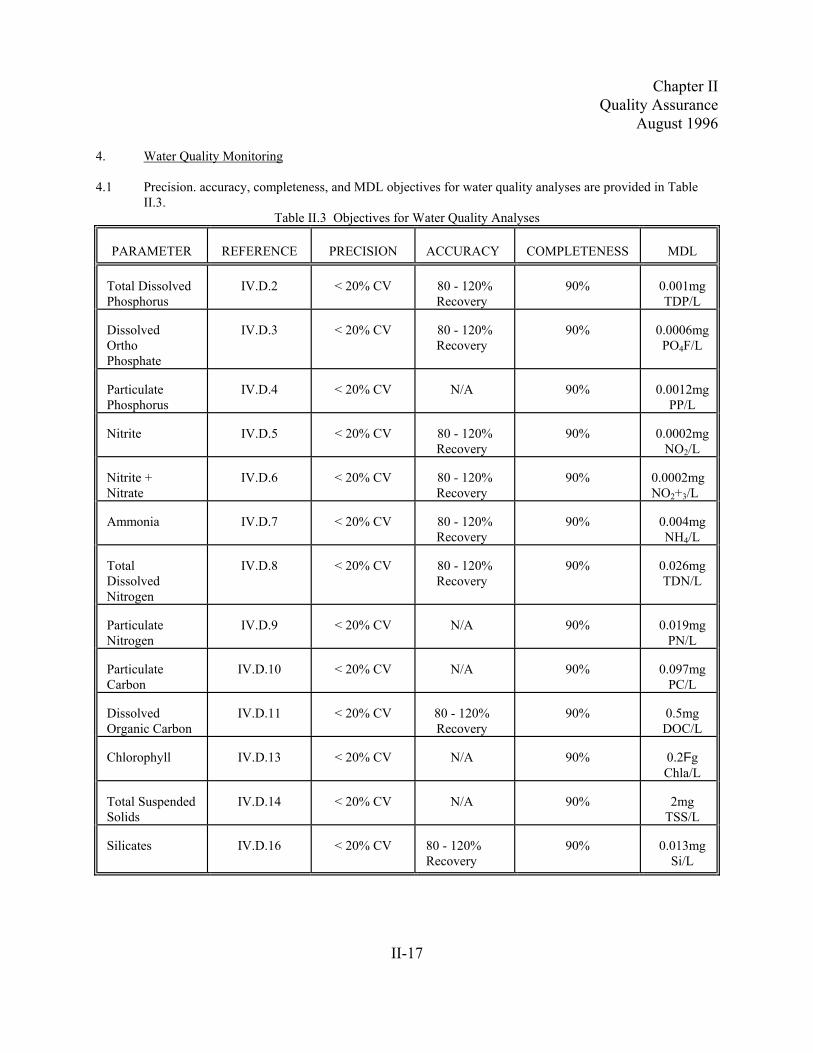
4. Water Quality Monitoring
4.1 Precision. accuracy, completeness, and MDL objectives for water quality analyses are provided in TableII.3.
Table II.3 Objectives for Water Quality Analyses
PARAMETER REFERENCE PRECISION ACCURACY COMPLETENESS MDL
Total DissolvedPhosphorus
IV.D.2 < 20% CV 80 - 120%Recovery
90% 0.001mgTDP/L
DissolvedOrthoPhosphate
IV.D.3 < 20% CV 80 - 120%Recovery
90% 0.0006mgPO4F/L
ParticulatePhosphorus
IV.D.4 < 20% CV N/A 90% 0.0012mgPP/L
Nitrite IV.D.5 < 20% CV 80 - 120%Recovery
90% 0.0002mgNO2/L
Nitrite +Nitrate
IV.D.6 < 20% CV 80 - 120%Recovery
90% 0.0002mgNO2+3/L
Ammonia IV.D.7 < 20% CV 80 - 120%Recovery
90% 0.004mgNH4/L
TotalDissolvedNitrogen
IV.D.8 < 20% CV 80 - 120%Recovery
90% 0.026mgTDN/L
ParticulateNitrogen
IV.D.9 < 20% CV N/A 90% 0.019mgPN/L
ParticulateCarbon
IV.D.10 < 20% CV N/A 90% 0.097mgPC/L
DissolvedOrganic Carbon
IV.D.11 < 20% CV 80 - 120%Recovery
90% 0.5mgDOC/L
Chlorophyll IV.D.13 < 20% CV N/A 90% 0.2FgChla/L
Total SuspendedSolids
IV.D.14 < 20% CV N/A 90% 2mgTSS/L
Silicates IV.D.16 < 20% CV 80 - 120%Recovery
90% 0.013mgSi/L

Chapter IIQuality Assurance
August 1996
II-18
5. Phytoplankton Monitoring
5.1 Precision, accuracy, and completeness objectives for phytoplankton analyses are provided in Table II.4.
Table II.4 Objectives for Phytoplankton Analyses
PARAMETER REFERENCE PRECISION ACCURACY COMPLETENESS
PhytoplanktonEnumeration
V.D.3.3 < 20% < 20% 95%
PhytoplanktonIdentification
V.D.3.3 < 10% < 10% 90%
PhytoplanktonBiomass
V.D.3.4 90%
PicoplanktonEnumeration
V.D.4.3 < 20% < 20% 95%
PicoplanktonIdentification
V.D.4.3 < 10% < 10% 90%
PicoplanktonBiomass
V.D.4.4 90%
Productivity V.D.5 90%
6. Zooplankton Monitoring
6.1 Precision, accuracy, and completeness objectives for Zooplankton analyses are provided in Table II.5.
Table II.5 Objectives for Zooplankton Analyses
PARAMETER REFERENCE PRECISION ACCURACY COMPLETENESS
Enumeration VI.D.3.3 < 5% < 5% 95%
Identification VI.D.3.3 < 10% < 10% 90%
Biomass VI.D.3.4 90%
Chapter IIQuality Assurance
August 1996
II-19
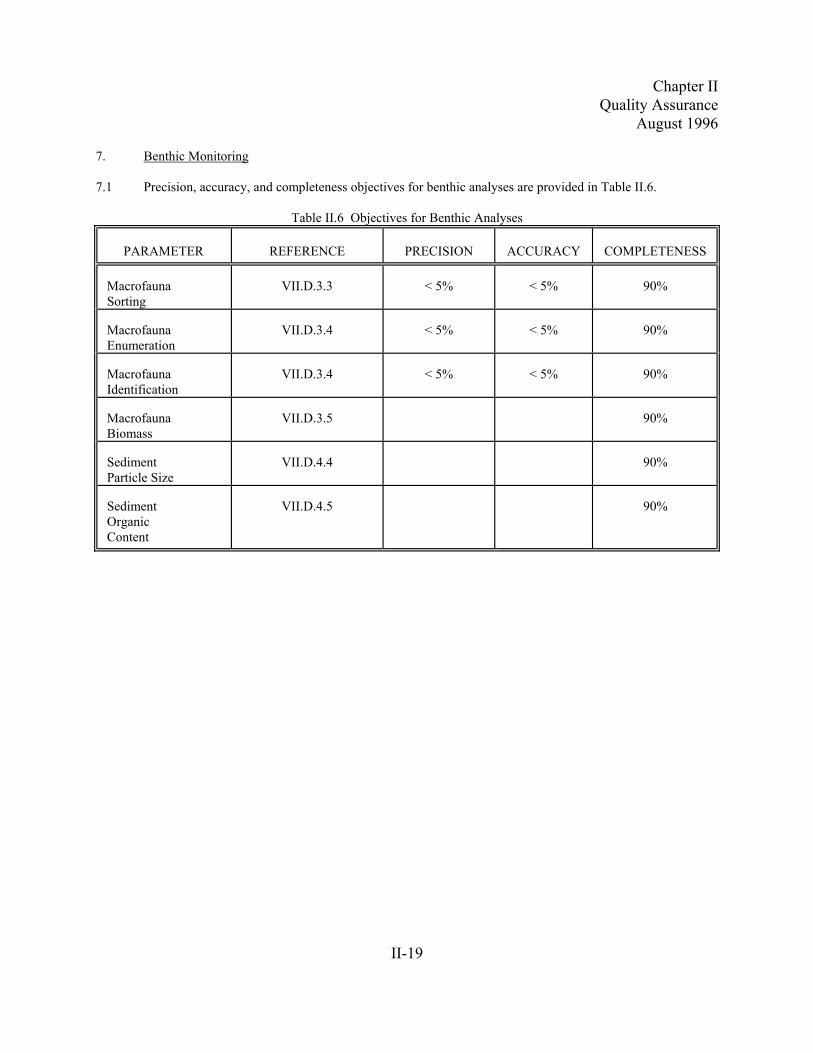
7. Benthic Monitoring
7.1 Precision, accuracy, and completeness objectives for benthic analyses are provided in Table II.6.
Table II.6 Objectives for Benthic Analyses
PARAMETER REFERENCE PRECISION ACCURACY COMPLETENESS
MacrofaunaSorting
VII.D.3.3 < 5% < 5% 90%
MacrofaunaEnumeration
VII.D.3.4 < 5% < 5% 90%
MacrofaunaIdentification
VII.D.3.4 < 5% < 5% 90%
MacrofaunaBiomass
VII.D.3.5 90%
SedimentParticle Size
VII.D.4.4 90%
SedimentOrganicContent
VII.D.4.5 90%
Chapter IIQuality Assurance
August 1996
II-20
SECTION F
DOCUMENTATION RECOMMENDATIONS
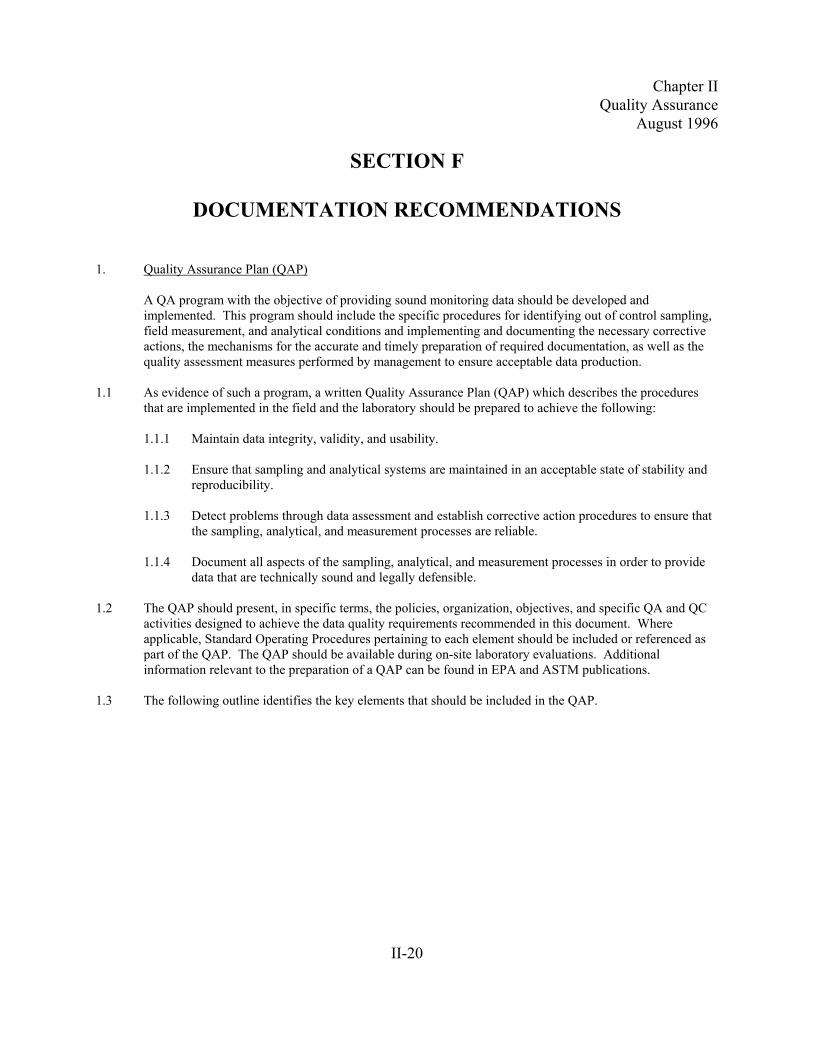
1. Quality Assurance Plan (QAP)
A QA program with the objective of providing sound monitoring data should be developed andimplemented. This program should include the specific procedures for identifying out of control sampling,field measurement, and analytical conditions and implementing and documenting the necessary correctiveactions, the mechanisms for the accurate and timely preparation of required documentation, as well as thequality assessment measures performed by management to ensure acceptable data production.
1.1 As evidence of such a program, a written Quality Assurance Plan (QAP) which describes the proceduresthat are implemented in the field and the laboratory should be prepared to achieve the following:
1.1.1 Maintain data integrity, validity, and usability.
1.1.2 Ensure that sampling and analytical systems are maintained in an acceptable state of stability andreproducibility.
1.1.3 Detect problems through data assessment and establish corrective action procedures to ensure thatthe sampling, analytical, and measurement processes are reliable.
1.1.4 Document all aspects of the sampling, analytical, and measurement processes in order to providedata that are technically sound and legally defensible.
1.2 The QAP should present, in specific terms, the policies, organization, objectives, and specific QA and QCactivities designed to achieve the data quality requirements recommended in this document. Whereapplicable, Standard Operating Procedures pertaining to each element should be included or referenced aspart of the QAP. The QAP should be available during on-site laboratory evaluations. Additionalinformation relevant to the preparation of a QAP can be found in EPA and ASTM publications.
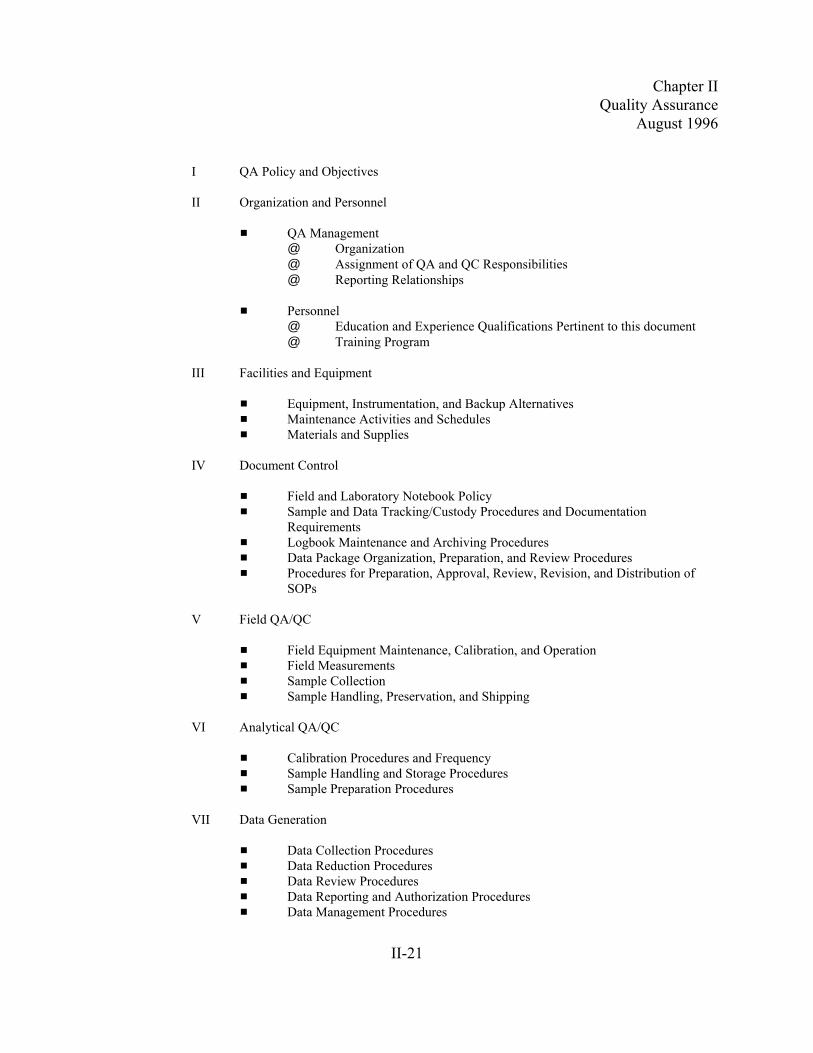
1.3 The following outline identifies the key elements that should be included in the QAP.
Chapter IIQuality Assurance
August 1996
II-21
I QA Policy and Objectives
II Organization and Personnel
# QA Management@ Organization@ Assignment of QA and QC Responsibilities@ Reporting Relationships
# Personnel@ Education and Experience Qualifications Pertinent to this document@ Training Program
III Facilities and Equipment
# Equipment, Instrumentation, and Backup Alternatives# Maintenance Activities and Schedules# Materials and Supplies
IV Document Control
# Field and Laboratory Notebook Policy# Sample and Data Tracking/Custody Procedures and Documentation
Requirements# Logbook Maintenance and Archiving Procedures# Data Package Organization, Preparation, and Review Procedures# Procedures for Preparation, Approval, Review, Revision, and Distribution of
SOPs
V Field QA/QC
# Field Equipment Maintenance, Calibration, and Operation# Field Measurements# Sample Collection# Sample Handling, Preservation, and Shipping
VI Analytical QA/QC
# Calibration Procedures and Frequency# Sample Handling and Storage Procedures# Sample Preparation Procedures
VII Data Generation
# Data Collection Procedures# Data Reduction Procedures# Data Review Procedures# Data Reporting and Authorization Procedures# Data Management Procedures
Chapter IIQuality Assurance
August 1996
II-22
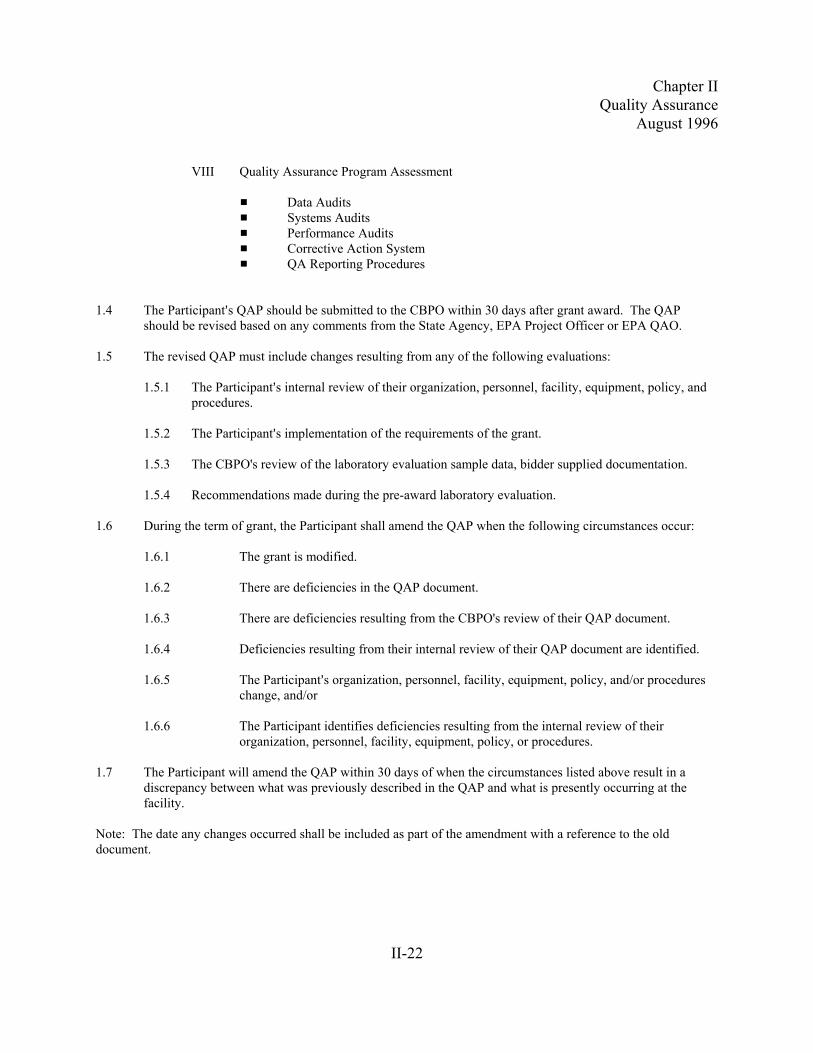
VIII Quality Assurance Program Assessment
# Data Audits# Systems Audits# Performance Audits# Corrective Action System# QA Reporting Procedures
1.4 The Participant=s QAP should be submitted to the CBPO within 30 days after grant award. The QAPshould be revised based on any comments from the State Agency, EPA Project Officer or EPA QAO.
1.5 The revised QAP must include changes resulting from any of the following evaluations:
1.5.1 The Participant=s internal review of their organization, personnel, facility, equipment, policy, andprocedures.
1.5.2 The Participant=s implementation of the requirements of the grant.
1.5.3 The CBPO's review of the laboratory evaluation sample data, bidder supplied documentation.
1.5.4 Recommendations made during the pre-award laboratory evaluation.
1.6 During the term of grant, the Participant shall amend the QAP when the following circumstances occur:
1.6.1 The grant is modified.
1.6.2 There are deficiencies in the QAP document.
1.6.3 There are deficiencies resulting from the CBPO's review of their QAP document.
1.6.4 Deficiencies resulting from their internal review of their QAP document are identified.
1.6.5 The Participant=s organization, personnel, facility, equipment, policy, and/or procedureschange, and/or
1.6.6 The Participant identifies deficiencies resulting from the internal review of theirorganization, personnel, facility, equipment, policy, or procedures.
1.7 The Participant will amend the QAP within 30 days of when the circumstances listed above result in adiscrepancy between what was previously described in the QAP and what is presently occurring at thefacility.
Note: The date any changes occurred shall be included as part of the amendment with a reference to the olddocument.

Chapter IIQuality Assurance
August 1996
II-23
2. Quality Assurance Project Plans
2.1 The Chesapeake Bay Quality Assurance Program requires the development and implementation of a QualityAssurance Project Plan (QAPjP) for each of its monitoring activities. The QAPjPs shall address specificactivities to be performed and procedures to be used by the Participant.
2.2 The major goals of the QAPjPs are (1) to ensure that the level of needed data quality will be determined andstated before the data collection efforts begin, and (2) to ensure that all monitoring data generated andprocessed will reflect the quality and integrity established by the QAPjPs.
2.3 The QA Project Plans shall include all information covered by the sixteen points required by QAMS-005/80(listed below).
# Title Page -- with provision for approval signatures# Table of Contents
# Project Description # Project Organization and Responsibilities # QA Objectives for Measurement Data # Sampling Procedures # Sample Custody # Calibration Procedures and Frequency # Analytical Procedures
# Internal Quality Control Checks# Performance and Systems Audits# Preventive Maintenance# Data Reduction, Validation, and Reporting Procedures -- including specific procedures for
assessing data precision, accuracy, completeness, representativeness, and comparability.# Data Review Procedures and Criteria# Corrective Actions# Quality Assurance Reports to Management
2.4 Review and Approval of QAPjPs
2.4.1 The CBPO (EPA PO and QAO) and the State agency will review all QAPjPs at least to the"Conditional Approval Recommended" level (all technical issues having been resolved to thesatisfaction of the CBPO and VADEQ) prior to data collection. The QAPjPs shall be reviewed andapproved in the context of the Program's DQOs.
2.4.2 The CBP QAO shall review and evaluate the implementation of the plans during the operational phaseof the monitoring activity. The CBP QAO shall also assess the actual performance of the plannedactivity and subsequent results according to the criteria described in the QAPjPs.
3. Standard Operating Procedures
3.1 In order to obtain reliable results, adherence to recommended methodology is important. In any operation thatis performed on a repetitive basis, reproducibility is best accomplished through the use of Standard OperatingProcedures (SOPs). An SOP is a written document which provides directions for the step-by-step execution ofan operation, test, or action which is commonly accepted as the method for performing certain routine orrepetitive tasks. These tasks include such operations as sampling, sample tracking, analysis, glasswarepreparation, instrument calibrations, preventive and corrective maintenance, and data reduction and analysis.
Chapter IIQuality Assurance
August 1996
II-24
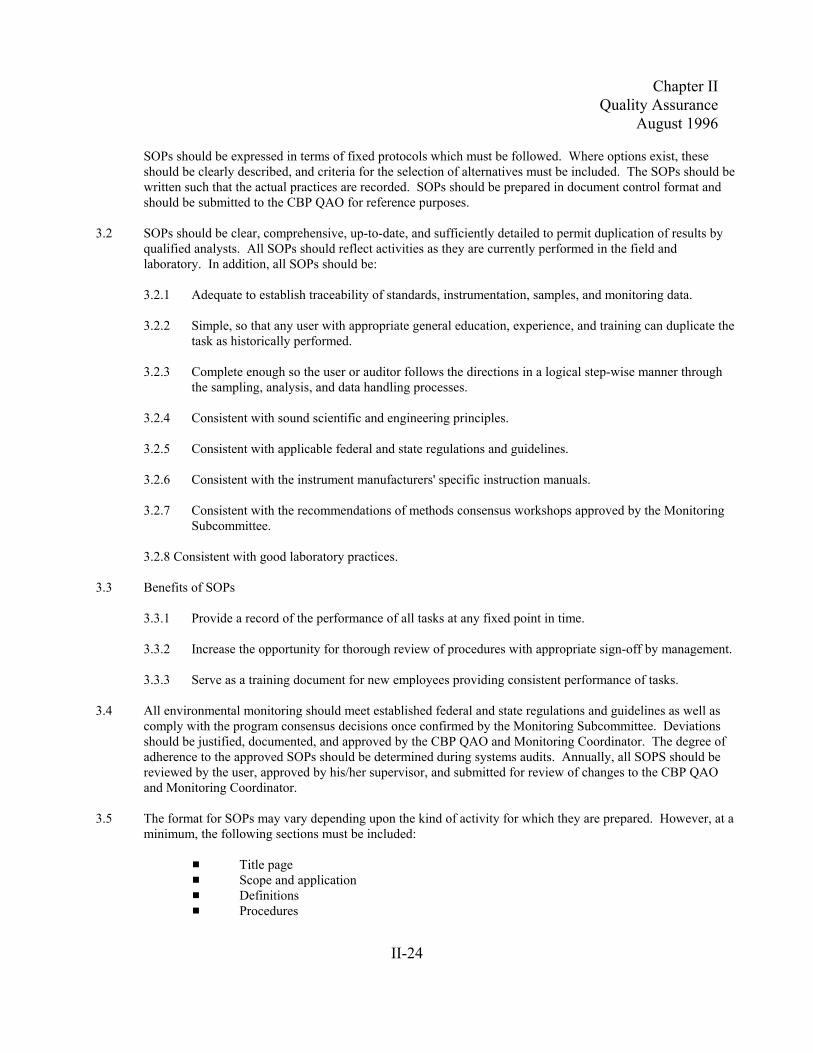
SOPs should be expressed in terms of fixed protocols which must be followed. Where options exist, theseshould be clearly described, and criteria for the selection of alternatives must be included. The SOPs should bewritten such that the actual practices are recorded. SOPs should be prepared in document control format andshould be submitted to the CBP QAO for reference purposes.
3.2 SOPs should be clear, comprehensive, up-to-date, and sufficiently detailed to permit duplication of results byqualified analysts. All SOPs should reflect activities as they are currently performed in the field andlaboratory. In addition, all SOPs should be:
3.2.1 Adequate to establish traceability of standards, instrumentation, samples, and monitoring data.
3.2.2 Simple, so that any user with appropriate general education, experience, and training can duplicate thetask as historically performed.
3.2.3 Complete enough so the user or auditor follows the directions in a logical step-wise manner throughthe sampling, analysis, and data handling processes.
3.2.4 Consistent with sound scientific and engineering principles.
3.2.5 Consistent with applicable federal and state regulations and guidelines.
3.2.6 Consistent with the instrument manufacturers' specific instruction manuals.
3.2.7 Consistent with the recommendations of methods consensus workshops approved by the MonitoringSubcommittee.
3.2.8 Consistent with good laboratory practices.
3.3 Benefits of SOPs
3.3.1 Provide a record of the performance of all tasks at any fixed point in time.
3.3.2 Increase the opportunity for thorough review of procedures with appropriate sign-off by management.
3.3.3 Serve as a training document for new employees providing consistent performance of tasks.
3.4 All environmental monitoring should meet established federal and state regulations and guidelines as well ascomply with the program consensus decisions once confirmed by the Monitoring Subcommittee. Deviationsshould be justified, documented, and approved by the CBP QAO and Monitoring Coordinator. The degree ofadherence to the approved SOPs should be determined during systems audits. Annually, all SOPS should bereviewed by the user, approved by his/her supervisor, and submitted for review of changes to the CBP QAOand Monitoring Coordinator.
3.5 The format for SOPs may vary depending upon the kind of activity for which they are prepared. However, at aminimum, the following sections must be included:
# Title page# Scope and application# Definitions# Procedures
Chapter IIQuality Assurance
August 1996
II-25
# QC limits# Internal review procedures, including procedures for secondary review of information being
generated# Corrective action procedures# Documentation description and example forms# Miscellaneous notes and precautions# References
3.6 A typical SOP should include detailed procedures on the following topics, as they apply:
# Specific sampling site selection# Sampling methodology# Analytical methodology; flow charts# Special precautions and requirements, such as holding times and preservation; interferences# State and Federal reference, equivalent, and alternate test procedures# Instrumentation selection and use# Calibration and standardization# Preventive and remedial maintenance# Replicate sampling and analysis# Blind and spiked samples# Quality control procedures such as inter- and intra-laboratory or field activities# Split sample protocols# Documentation, sample custody, transportation, and handling procedures# Sample custody and handling procedures# Sample transportation# Data management and evaluation procedures; calculations# Service contracts# Specific quantitative determinations of precision, accuracy, completeness, representativeness,
and comparability# Document control# Safety# References
4. Document Control
4.1 The goal of the document control program is to assure that all documents and electronically stored informationfrom a specified cruise are accountable, secure, and completely retrievable. Document control is recommendedfor each activity to include electronic as well as hardcopy documentation. Accountable documents shouldinclude but not be limited to field and laboratory logbooks, chain-of-custody records, sample work sheets,bench sheets, and other documents relating to the sample or sample analyses. The following document controlprocedures have been established to assure that all field and laboratory records are assembled and stored fordelivery to the CBPO or are available upon request from the CBPO prior to the delivery schedule.
4.2. Preprinted Forms and Logbooks
4.2.1 All documents produced which are directly related to the sampling, preparation, and analysis of CBPOsamples should be maintained for inspection by the CBPO. All observations and results recorded byfield and laboratory staff but not on preprinted forms should be entered into permanent logbooks. When all data from a cruise are compiled, all original field and laboratory forms and copies of all
Chapter IIQuality Assurance
August 1996
II-26
cruise-related logbook entries should be included in the documentation package.
4.2.2 Pre-printed field and laboratory forms should contain the name of the field crew/laboratory and bedated (month/day/year) and signed by the person responsible for performing the activity at the time anactivity is performed.
4.2.3 Logbook entries should be dated (month/day/year) and signed by the person responsible forperforming the activity at the time an activity is performed.
4.2.4 Logbook entries should be in chronological order.
4.2.5 Pages in both bound and unbound logbooks should be sequentially numbered.
4.2.6 Data sheets or logs should be maintained to enable a reconstruction of the sample collection oranalysis in question.
4.2.7 Corrections to supporting documents and raw data should be made by drawing a single line throughthe error and entering the correct information. Corrections and additions to supporting documents andraw data should be dated and initialed. No information should be obliterated or rendered unreadable. All notations should be recorded in ink. Unused portions of documents shall be crossed out.
4.3 Consistency of Documentation
4.3.1 A document control officer responsible for the organization and assembly of the data package shouldbe assigned.
4.3.2 All copies of field and laboratory documents should be complete and legible.
4.3.3 Before releasing test results, the document control officer should assemble and cross-check theinformation on sample tags, custody records, laboratory bench sheets, personnel and instrument logs,and other relevant data to ensure that data pertaining to each particular sample or sample deliverygroup is consistent throughout the data package.
4.3.4 All documents relevant to each cruise, including logbook pages, bench sheets, screening records, re-preparation records, records of failed or attempted tests, and custody records should be inventoried.
4.4 Storage of Files
4.4.1 Field and laboratory documents will be maintained in a secure location for a period of five years fromthe date of sample delivery.
5. Contingency and Health and Safety Plans
5.1 The Participant should develop and implement the following additional plans:
5.1.1 A contingency plan covering the availability and/or plan for a backup vessel.
5.1.2 A contingency plan for key field instrumentation failure.
Chapter IIQuality Assurance
August 1996
II-27
5.1.3 A Health and Safety Plan in accordance with all applicable State and Federal regulations.
SECTION G
PERFORMANCE ASSESSMENT
1. Split Sample Program
1.1 Background and Objectives
The Chesapeake Bay Coordinated Split Sample Program (CSSP) was established in June 1989 byrecommendation of AMQAW, to the Monitoring Subcommittee. The major objective of this program is toestablish a measure of comparability between sampling and analytical operations for water quality monitoringbasin-wide. A secondary objective is to evaluate the in-matrix dilution of standard EPA reference materials. These standard reference materials are analyzed in appropriate matrix, fresh to saline, and concentration levelto match the sample. All laboratories participating in basin-wide data collection programs are also required toparticipate in the CSSP.
1.2 Summary of Criteria
1.2.1 The Participant will participate in the applicable component(s) of the CSSP.
1.2.2 The SOPs that are developed and used should be in accordance with the Chesapeake Bay CoordinatedSplit Sample Program Implementation Guidelines CBP/TRS 58/91, May 1991 plus any revisionsspecified by the CBP QAO.
1.2.3 For each of the Virginia and Maryland CSSP stations and on a quarterly basis, the Participant willreceive and analyze three sub-samples. Treating each sub-sample as a discrete sample, participatinglaboratories are generally required to perform only those analyses which they routinely perform insupport of basin-wide data collection programs. One of the three sub-samples should be used togenerate laboratory duplicates and a laboratory spike. These QC samples should be analyzedconcurrently with the associated CSSP sub-samples.
1.2.4 The routine submission of split sample data is the responsibility of each laboratory and its in-housedata management organization.
1.2.5 To supplement the analyses of the three sub-samples and the respective QC sample, EPA standardreference material (SRM) for each parameter should be analyzed where available. The analysis ofstandard reference materials provides a strong measure of comparability between all laboratories andwithin one laboratory's analytical system over time. Quarterly analysis of SRMs is the mostindependent evaluation of laboratory performance available at this time. It is a critical element of anydiagnostic efforts associated with the CSSP.
Chapter IIQuality Assurance
August 1996
II-28
2. Performance Evaluation Samples
2.1 Performance evaluation (PE) samples are distributed annually to the laboratories participating in the MainstemMonitoring Program for Water Quality. Where available, EPA audit samples for nutrient and demandparameters, as well as solids are distributed. An effort is made to adjust PE sample preparation instructions toallow analysis in low concentration ranges more appropriate to the program's ambient monitoring levels.
3. Audits of Data Quality
3.1 Field blank and field duplicate data will be reviewed in order to assess the quality of sampling activities.
3.2 Analytical and measurement data should be reviewed in order to assess the quality of measurement andanalytical activities, respectively.
3.3 The CBP-provided software will electronically verify the data quality for every submittal or the data reviewcriteria will be implemented.
3.4 The Participant will prepare and submit a summary with each data set. The summary must include anexplanation for each data point that did not meet the QC criteria established for each method, and deviationsthat occurred during the generation of the data.
3.5 The Participant will be informed if any of the submitted data do not fall within the prescribed QC limits. Anyerrors found will be corrected by the Participant at no additional cost to the CBPO.
3.6 The CBP Grant Project Officer has the ultimate responsibility to accept or reject each data submittal.
4. On-Site Audits
4.1 The CBP QAO will conduct annual on-site evaluations of field and laboratory activities. The frequency ofthese on-site audits may be increased depending on the Participant's performance. On-site evaluations arecarried out to monitor their ability to collect and analyze samples according to the DQOs established by theCBP Monitoring Program.
4.2 The CBP QAO and a State representative will inspect the Participant's field and laboratory facilities to verifythe adequacy and maintenance of instrumentation, the continuity of personnel meeting experience and/oreducation requirements, and the acceptable performance of analytical and QC procedures. The Participantshould expect that items to be monitored will include but not be limited to the following:
# Size and appearance of the facility.# Quantity, condition, availability, and scheduled maintenance and performance of
instrumentation.# Availability, appropriateness, and use of field and laboratory SOPs.# Field and laboratory staff qualifications, experience, and personnel training programs.# Reagents and sample storage facilities.# Reagent and test solutions preparation logbooks and raw data.# Field and laboratory bench sheet and logbook maintenance and review.# Review of the sample analysis/data package inspection procedures.
Chapter IIQuality Assurance
August 1996
II-29
4.3 Prior to an on-site evaluation, various documentation pertaining to performance of the specific Participant isintegrated in a profile package for discussion during the evaluation. Items that may be included are previouson-site reports, laboratory evaluation sample scores, review of data, QA materials, and data trend reports.
4.4 The CBP QAO will discuss his/her findings with the Participant in the presence of a representative from theState agency. During the debriefing, the auditor will present his/her findings and recommendations forcorrective actions to field and laboratory personnel.
4.5 Following an on-site evaluation, audit reports which discuss deficiencies found during the on-site evaluationwill be forwarded to the Participant. The Participant must respond to the audit report within 30 days of thereport and, concurrently, the report must be sent to the CBP QAO and the State representative.
4.5.1 If the Participant fails to take appropriate corrective action to resolve the deficiencies discussed in theon-site reports, any further sampling or analytical activities will not be conducted.
Chapter IIQuality Assurance
August 1996
II-30
SECTION H
REFERENCES
U.S. Environmental Protection Agency. 1983. Chesapeake Bay: A Framework for Action, Appendix F -- A Monitoring and Research Strategy to Meet Management Objectives. Chesapeake Bay Liaison Office, Annapolis, MD.
U.S. Environmental Protection Agency. 1986. Quality Assurance Program Plan for the Chesapeake Bay Program. Region 3, Chesapeake Bay Liaison Office, Annapolis, MD.
U.S. Environmental Protection Agency. 1991. Chesapeake Bay Coordinated Split Sample Program Implementation Guidelines, Revision 3, CBP/TRS 58/91. Analytical Methods and Quality Assurance Workgroup of the Chesapeake Bay Program Monitoring Subcommittee, Chesapeake Bay Program Office, Annapolis, MD.
Chapter IIIData Management
August 1996
III-1
CHAPTER III
DATA MANAGEMENT ANDDELIVERABLE REQUIREMENTS
Section A. Automation of Data Collection
1. Introduction2. Development Phases3. Training
Section B. Hardware Requirements for Automated Entry and Storage
1. Minimum requirements
Section C. Contract Reports and Deliverable Distribution
1. Deliverables2. Archive of Results3. Data Dictionary
Chapter IIIData Management
August 1996
III-2
SECTION A
AUTOMATION OF DATA COLLECTION
1. Introduction
The contractor will be provided with an automated data entry program to input for each water quality datasubmission and output deliverables in an acceptable format to the Chesapeake Bay Program Office (CBPO). This submission will consist of cruise data, field parameter data, and laboratory analysis data including thequality control data points. This program is currently under development by the EPA and will be available priorto contract award. The purpose of this automated data tool is to:
o Increase the quality of the CBP monitoring data;o Decrease data processing;o Standardize data management procedures.
2. Development Phases
The automated system is being developed in three phases. Phase 1 will be available upon contract award, phase2 and 3 may be implemented at any time during the contract period. The features of each phase are notedbelow.
Phase 1 will provide:
o Manual data entry of cruise, field and lab results;
o Manual data entry of quality control results as required by the Chesapeake Bay Program DataManagement Plan (DMP);
o Create graphical, visual, and hardcopy output of data for both field and laboratory data.
o Perform automatic checking of field and lab results for valid entry, such that only numbers that arepossible for that parameter are accepted;
o Automatic statistical range check on vertical profile parameters compared to historical CBPmonitoring data for that station/depth;
o An error report to flag missing or out of range data points;
o File output for submission to the CBP monitoring program in an acceptable format.
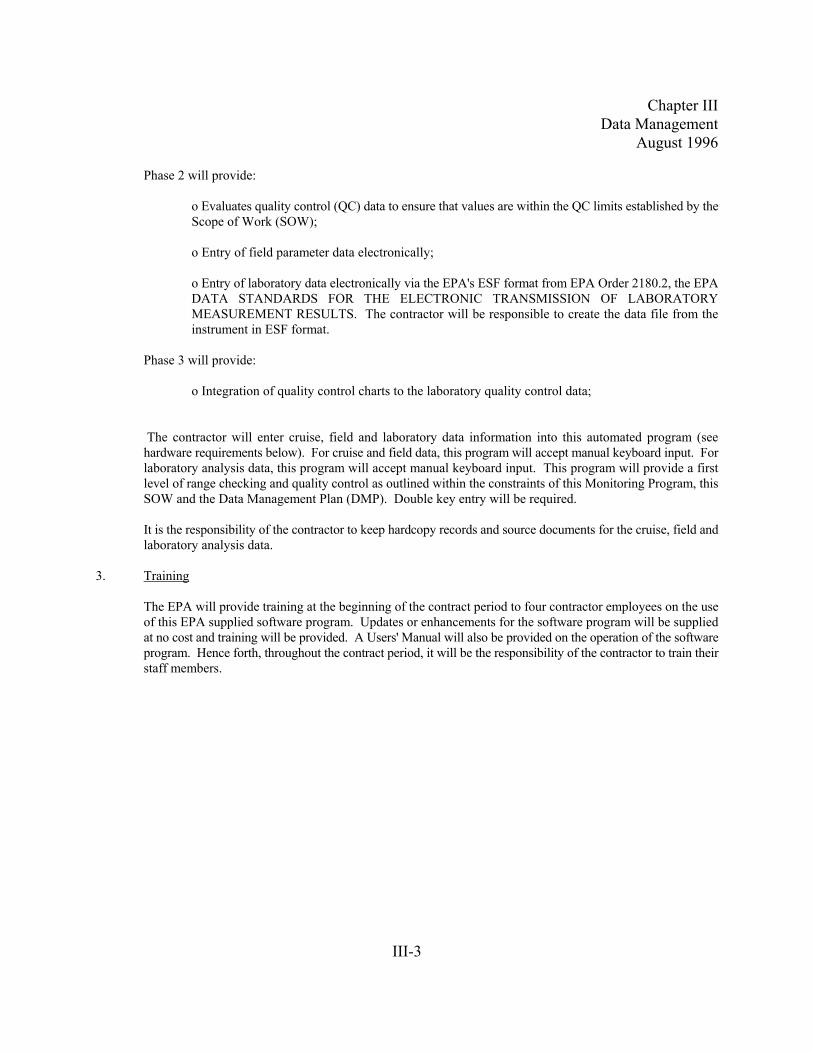
Chapter IIIData Management
August 1996
III-3
Phase 2 will provide:
o Evaluates quality control (QC) data to ensure that values are within the QC limits established by theScope of Work (SOW);
o Entry of field parameter data electronically;
o Entry of laboratory data electronically via the EPA's ESF format from EPA Order 2180.2, the EPADATA STANDARDS FOR THE ELECTRONIC TRANSMISSION OF LABORATORYMEASUREMENT RESULTS. The contractor will be responsible to create the data file from theinstrument in ESF format.
Phase 3 will provide:
o Integration of quality control charts to the laboratory quality control data;
The contractor will enter cruise, field and laboratory data information into this automated program (seehardware requirements below). For cruise and field data, this program will accept manual keyboard input. Forlaboratory analysis data, this program will accept manual keyboard input. This program will provide a firstlevel of range checking and quality control as outlined within the constraints of this Monitoring Program, thisSOW and the Data Management Plan (DMP). Double key entry will be required.
It is the responsibility of the contractor to keep hardcopy records and source documents for the cruise, field andlaboratory analysis data.
3. Training
The EPA will provide training at the beginning of the contract period to four contractor employees on the useof this EPA supplied software program. Updates or enhancements for the software program will be suppliedat no cost and training will be provided. A Users' Manual will also be provided on the operation of the softwareprogram. Hence forth, throughout the contract period, it will be the responsibility of the contractor to train theirstaff members.

Chapter IIIData Management
August 1996
III-4
SECTION B
HARDWARE REQUIREMENTS FOR AUTOMATED ENTRYAND STORAGE
1. Minimum requirements
The minimum hardware requirements for the EPA's automated entry and storage program are an IBMcompatible personal computer running DOS 3.3 or greater with 640K RAM, a 60 megabyte hard disk, an Intel80286 processor , a 1.4 megabyte 32 inch diskette drive, an EPSON FX100 or compatible printer, and a 2400baud modem with PROCOMM.
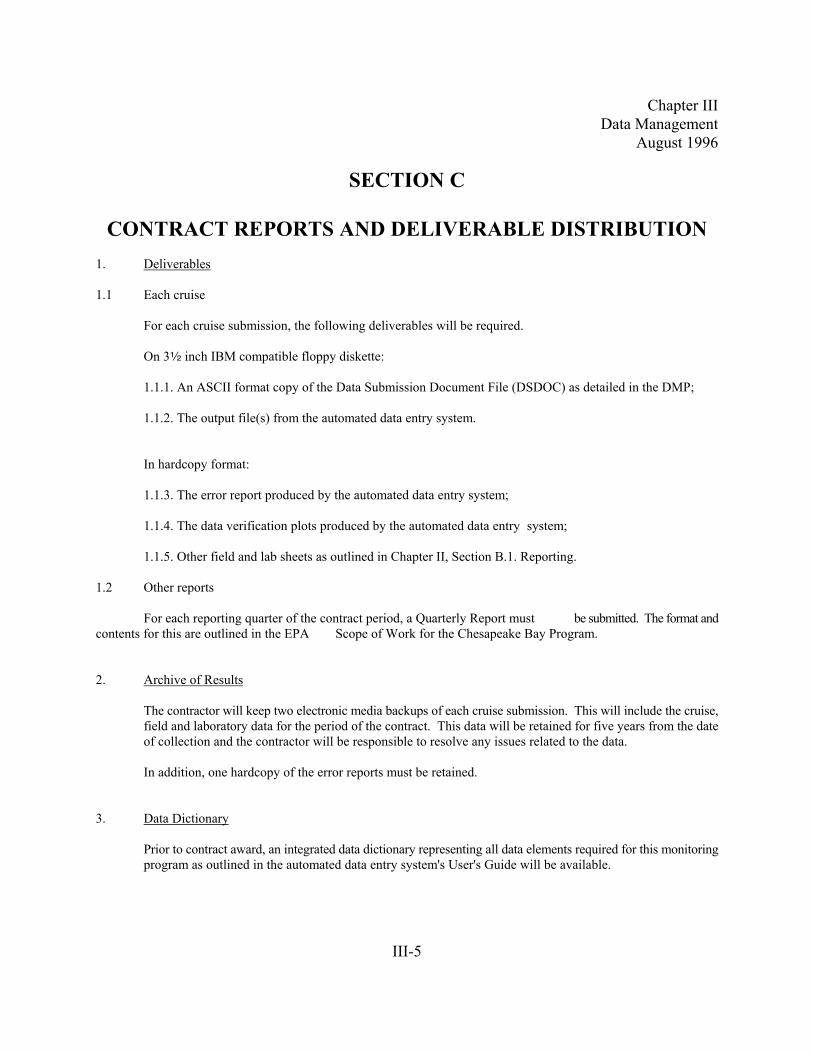
Chapter IIIData Management
August 1996
III-5
SECTION C
CONTRACT REPORTS AND DELIVERABLE DISTRIBUTION1. Deliverables
1.1 Each cruise
For each cruise submission, the following deliverables will be required.
On 32 inch IBM compatible floppy diskette:
1.1.1. An ASCII format copy of the Data Submission Document File (DSDOC) as detailed in the DMP;
1.1.2. The output file(s) from the automated data entry system.
In hardcopy format:
1.1.3. The error report produced by the automated data entry system;
1.1.4. The data verification plots produced by the automated data entry system;
1.1.5. Other field and lab sheets as outlined in Chapter II, Section B.1. Reporting.
1.2 Other reports
For each reporting quarter of the contract period, a Quarterly Report must be submitted. The format andcontents for this are outlined in the EPA Scope of Work for the Chesapeake Bay Program.
2. Archive of Results
The contractor will keep two electronic media backups of each cruise submission. This will include the cruise,field and laboratory data for the period of the contract. This data will be retained for five years from the dateof collection and the contractor will be responsible to resolve any issues related to the data.
In addition, one hardcopy of the error reports must be retained.
3. Data Dictionary
Prior to contract award, an integrated data dictionary representing all data elements required for this monitoringprogram as outlined in the automated data entry system's User's Guide will be available.
Chapter IVWater Quality Monitoring
August 1996
IV-1
CHAPTER IV
WATER QUALITY MONITORINGSection A. Introduction
1. Objectives and Scope2. Rationale
Section B. WQ Parameter List and Detection Limits
Section C. Field Measurements and Sampling
1. Introduction2. Field Measurements3. Sampling
Chapter IVWater Quality Monitoring
August 1996
IV-2
SECTION A
INTRODUCTION
1. Objectives and Scope
1.1 Objectives: Data generated using the procedures in this chapter will be used to meet the water qualitymonitoring objectives of the Chesapeake Bay Water Quality Program. These objectives are:
C To characterize the present state of the Bay and its tributaries (baseline), including spatial andseasonal variation, using key water quality indicators.
C To determine long-term trends or changes in key water quality indicators in relation to pollutioncontrol programs.
C To integrate the information collected in all components of the Monitoring Program to gain a morecomprehensive understanding of water quality processes and the relationship between waterquality and living resources.
1.2 Scope: The scope of work for the Water Quality Monitoring Program includes the measurement of thechemical and physical parameters for the water column. Parameters such as nutrients, chlorophyll,dissolved oxygen, and water transparency, were selected to provide information to identify nutrient trends,calibrate the water quality models for the Chesapeake Bay, and to correlate living resource data to the waterquality data. Other parameters such as salinity and temperature are necessary to provide a more rigorousinterpretation of these key water quality indicators. The information from these parameters with theirassociated detection limits will demonstrate if the water quality goals established for the living resourcehabitat have been met and will assist managers in instituting programs to regulate controls for point andnon-point sources. A complete listing of the water quality parameters and the detection limit requirementsis provided in Table IV.1.
2. Rationale
In the 1983 document entitled "Chesapeake Bay: A Framework for Action" the U.S. EPA recommended that a long-term water quality monitoring program was necessary. The purpose of this program is to provide data so that thecurrent state of the Bay can be described and long-term changes can be detected.
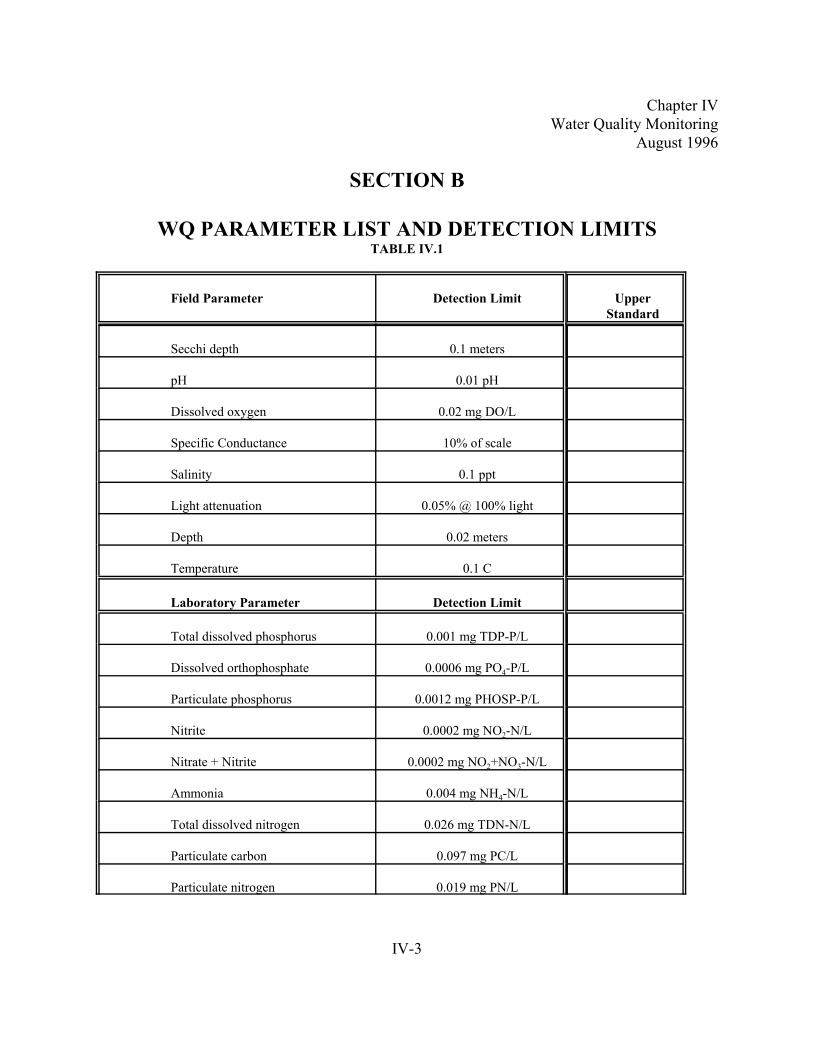
Chapter IVWater Quality Monitoring
August 1996
IV-3
SECTION B
WQ PARAMETER LIST AND DETECTION LIMITSTABLE IV.1
Field Parameter Detection Limit UpperStandard
Secchi depth 0.1 meters
pH 0.01 pH
Dissolved oxygen 0.02 mg DO/L
Specific Conductance 10% of scale
Salinity 0.1 ppt
Light attenuation 0.05% @ 100% light
Depth 0.02 meters
Temperature 0.1 C
Laboratory Parameter Detection Limit
Total dissolved phosphorus 0.001 mg TDP-P/L
Dissolved orthophosphate 0.0006 mg PO4-P/L
Particulate phosphorus 0.0012 mg PHOSP-P/L
Nitrite 0.0002 mg NO2-N/L
Nitrate + Nitrite 0.0002 mg NO2+NO3-N/L
Ammonia 0.004 mg NH4-N/L
Total dissolved nitrogen 0.026 mg TDN-N/L
Particulate carbon 0.097 mg PC/L
Particulate nitrogen 0.019 mg PN/L

Chapter IVWater Quality Monitoring
August 1996
IV-4
Dissolved organic carbon 0.5 mg DOC/L
Chlorophyll A 1.0 :g Chla/L
Phaeophytin 1.0 Pheo :g/L
Total Suspended Solids 2 mg TSS/L
Silicates 0.013 mg Si/L
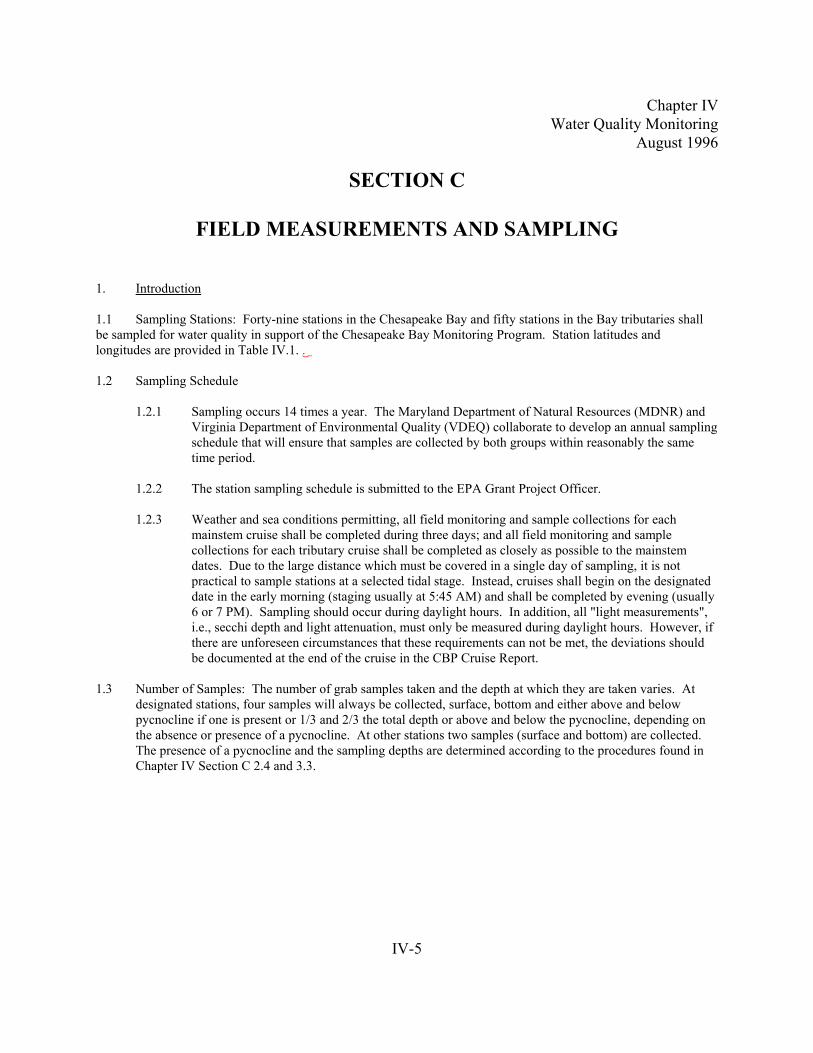
Chapter IVWater Quality Monitoring
August 1996
IV-5
SECTION C
FIELD MEASUREMENTS AND SAMPLING
1. Introduction
1.1 Sampling Stations: Forty-nine stations in the Chesapeake Bay and fifty stations in the Bay tributaries shallbe sampled for water quality in support of the Chesapeake Bay Monitoring Program. Station latitudes andlongitudes are provided in Table IV.1. .
1.2 Sampling Schedule
1.2.1 Sampling occurs 14 times a year. The Maryland Department of Natural Resources (MDNR) andVirginia Department of Environmental Quality (VDEQ) collaborate to develop an annual samplingschedule that will ensure that samples are collected by both groups within reasonably the sametime period.
1.2.2 The station sampling schedule is submitted to the EPA Grant Project Officer.
1.2.3 Weather and sea conditions permitting, all field monitoring and sample collections for eachmainstem cruise shall be completed during three days; and all field monitoring and samplecollections for each tributary cruise shall be completed as closely as possible to the mainstemdates. Due to the large distance which must be covered in a single day of sampling, it is notpractical to sample stations at a selected tidal stage. Instead, cruises shall begin on the designateddate in the early morning (staging usually at 5:45 AM) and shall be completed by evening (usually6 or 7 PM). Sampling should occur during daylight hours. In addition, all "light measurements",i.e., secchi depth and light attenuation, must only be measured during daylight hours. However, ifthere are unforeseen circumstances that these requirements can not be met, the deviations shouldbe documented at the end of the cruise in the CBP Cruise Report.
1.3 Number of Samples: The number of grab samples taken and the depth at which they are taken varies. Atdesignated stations, four samples will always be collected, surface, bottom and either above and belowpycnocline if one is present or 1/3 and 2/3 the total depth or above and below the pycnocline, depending onthe absence or presence of a pycnocline. At other stations two samples (surface and bottom) are collected. The presence of a pycnocline and the sampling depths are determined according to the procedures found inChapter IV Section C 2.4 and 3.3.
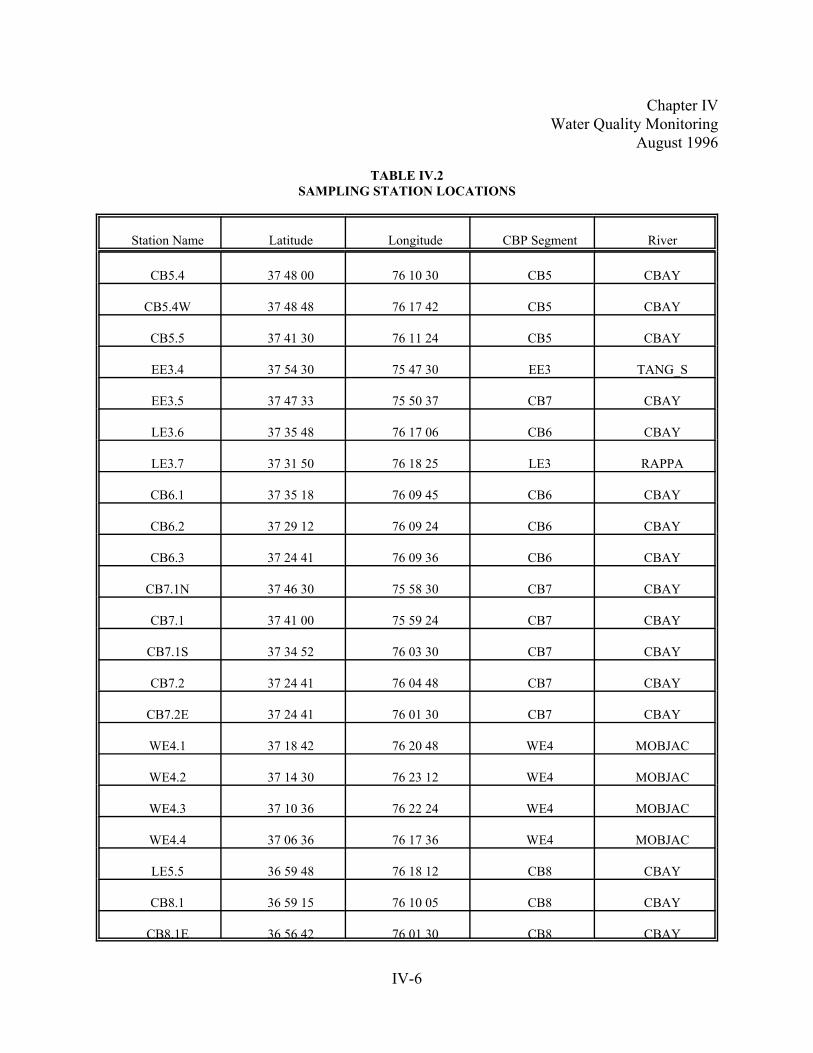
Chapter IVWater Quality Monitoring
August 1996
IV-6
TABLE IV.2SAMPLING STATION LOCATIONS
Station Name Latitude Longitude CBP Segment River
CB5.4 37 48 00 76 10 30 CB5 CBAY
CB5.4W 37 48 48 76 17 42 CB5 CBAY
CB5.5 37 41 30 76 11 24 CB5 CBAY
EE3.4 37 54 30 75 47 30 EE3 TANG_S
EE3.5 37 47 33 75 50 37 CB7 CBAY
LE3.6 37 35 48 76 17 06 CB6 CBAY
LE3.7 37 31 50 76 18 25 LE3 RAPPA
CB6.1 37 35 18 76 09 45 CB6 CBAY
CB6.2 37 29 12 76 09 24 CB6 CBAY
CB6.3 37 24 41 76 09 36 CB6 CBAY
CB7.1N 37 46 30 75 58 30 CB7 CBAY
CB7.1 37 41 00 75 59 24 CB7 CBAY
CB7.1S 37 34 52 76 03 30 CB7 CBAY
CB7.2 37 24 41 76 04 48 CB7 CBAY
CB7.2E 37 24 41 76 01 30 CB7 CBAY
WE4.1 37 18 42 76 20 48 WE4 MOBJAC
WE4.2 37 14 30 76 23 12 WE4 MOBJAC
WE4.3 37 10 36 76 22 24 WE4 MOBJAC
WE4.4 37 06 36 76 17 36 WE4 MOBJAC
LE5.5 36 59 48 76 18 12 CB8 CBAY
CB8.1 36 59 15 76 10 05 CB8 CBAY
CB8.1E 36 56 42 76 01 30 CB8 CBAY
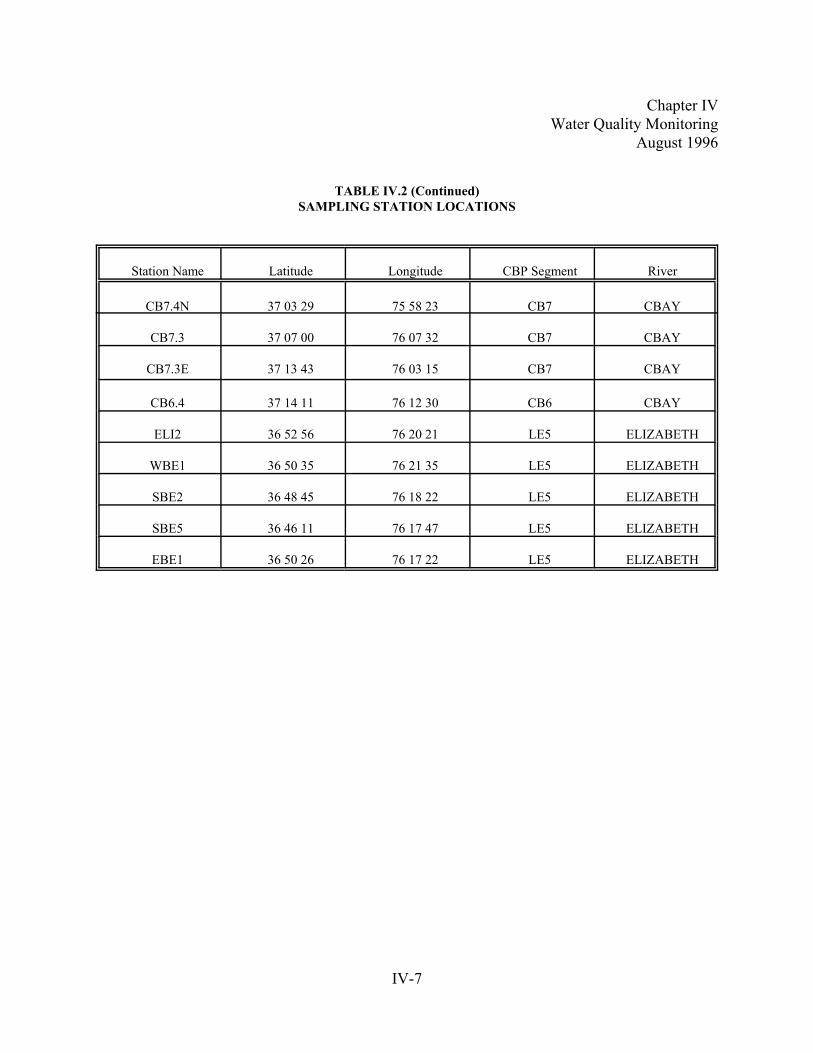
Chapter IVWater Quality Monitoring
August 1996
IV-7
TABLE IV.2 (Continued)SAMPLING STATION LOCATIONS
Station Name Latitude Longitude CBP Segment River
CB7.4N 37 03 29 75 58 23 CB7 CBAY
CB7.3 37 07 00 76 07 32 CB7 CBAY
CB7.3E 37 13 43 76 03 15 CB7 CBAY
CB6.4 37 14 11 76 12 30 CB6 CBAY
ELI2 36 52 56 76 20 21 LE5 ELIZABETH
WBE1 36 50 35 76 21 35 LE5 ELIZABETH
SBE2 36 48 45 76 18 22 LE5 ELIZABETH
SBE5 36 46 11 76 17 47 LE5 ELIZABETH
EBE1 36 50 26 76 17 22 LE5 ELIZABETH
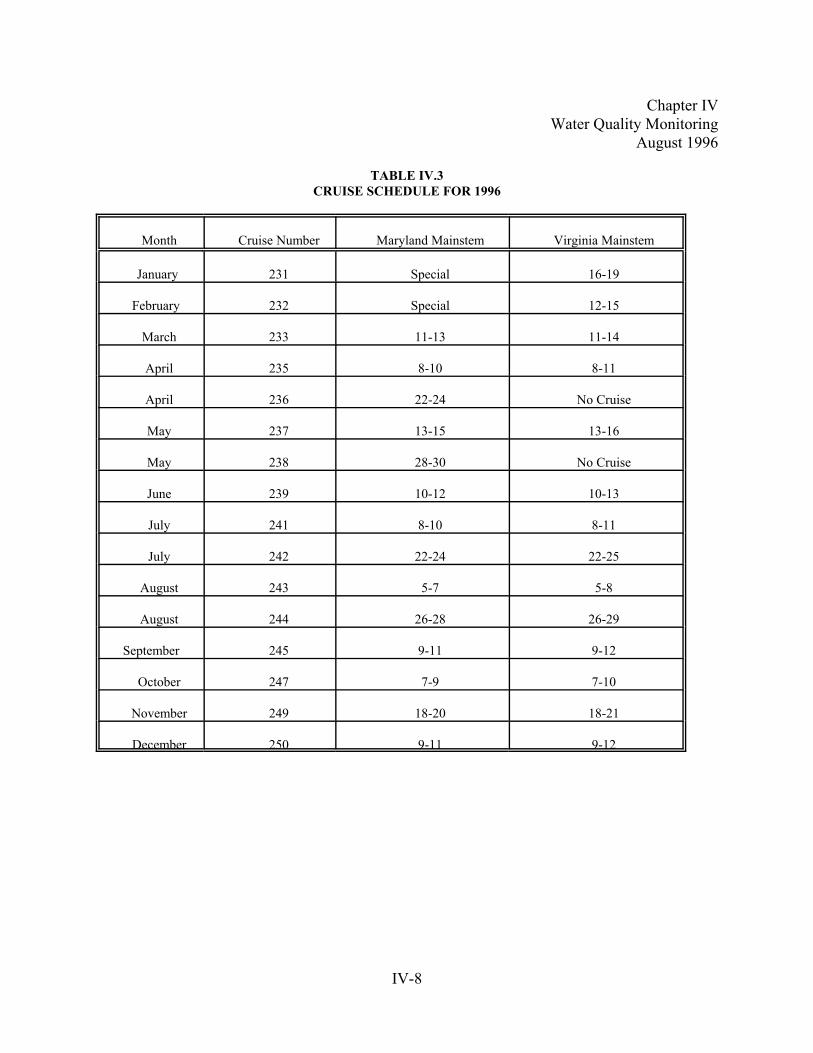
Chapter IVWater Quality Monitoring
August 1996
IV-8
TABLE IV.3CRUISE SCHEDULE FOR 1996
Month Cruise Number Maryland Mainstem Virginia Mainstem
January 231 Special 16-19
February 232 Special 12-15
March 233 11-13 11-14
April 235 8-10 8-11
April 236 22-24 No Cruise
May 237 13-15 13-16
May 238 28-30 No Cruise
June 239 10-12 10-13
July 241 8-10 8-11
July 242 22-24 22-25
August 243 5-7 5-8
August 244 26-28 26-29
September 245 9-11 9-12
October 247 7-9 7-10
November 249 18-20 18-21
December 250 9-11 9-12

Chapter IVWater Quality Monitoring
August 1996
IV-9
2. Field Measurements
2.1 At each station, the latitude and longitude (accurate within + 15 seconds) in degrees, minutes and secondsshould be recorded at the beginning of sampling. To obtain accurate location data, Global PositioningSystems (GPS) is recommended for use. The CBP segment location and total depth should also be recorded.
2.2 The weather and sea conditions at the time of sampling should also be recorded. General weather conditionsinclude cloud cover, air temperature, precipitation type, wind speed, and wind direction. Sea conditions thatshould be recorded include wave height and tidal current stage.
2.3 Secchi depth
2.3.1 Equipment: A 20 cm Secchi disk, a circular plate-like disk painted in alternating black and whitequadrants is held by a line that is marked in tenths of meters.
2.3.2 Frequency: The Secchi depth is determined at each station.
2.3.3 Procedure: The Secchi disk is used to give a measurement of transparency of the water column,also called the Secchi depth.
2.3.3.1 Slowly lower the Secchi disk until it is no longer visible and note the depth using themarkings on the line.
2.3.3.2 Slowly raise the Secchi disk until it just becomes visible and note the depth using themarkings on the line.
2.3.3.3 Perform steps 2.3.3.1 and 2.3.3.2 three times, noting both readings. Record average.
2.3.4 Quality control
2.3.4.1 If the range of measurements for the three sets of readings in section 2.3.3 is greater than0.5 m, the entire process should be performed again. Raise and lower several timesaround "disappearing" point.
2.3.4.2 No sunglasses or any other devices should be used to shade the eyes while this procedureis being performed.
2.3.4.3 The Secchi depth should be determined from the shady side of the boat during daylighthours.
Chapter IVWater Quality Monitoring
August 1996
IV-10
2.4 Physiochemical Profile
2.4.1 Equipment
2.4.1.1 A multi-parameter water quality instrument, such as a Sea-bird Sealogger CTD, or anycombination of equipment that can provide the same measurements, shall be used.
2.4.1.2 The instrument shall be equipped with the following sensors:C pressure sensor - used to determine sampling depth,C a bottom sensor - sounds an alarm on deck when the unit is approaching
the bottom, C Ph meter,C dissolved oxygen probe, andC light attenuation sensor - LI-COR LI-192SA underwater sensor, or
equivalentC temperature sensorC conductivity cell
2.4.1.3 The instrument should be outfitted with a system so that field measurements can belogged from the instrument by computer, with a manual recording backup capability incase of computer failure for as many parameters as possible.
2.4.2 Frequency: The physiochemical profile is determined at every sampling station. The surfacereading is taken at 0.5m (MD) and 0.1m (VA) below the surface. Readings are then recorded for1m, 2m, and 3m below the surface. Finally, readings every 2m to 1m above the bottom. Forstations less than 10m readings should be made every meter.
2.4.3 Procedure: The following parameters should be measured at the frequency described in 2.4.2:water temperature, Ph, dissolved oxygen, salinity, light attenuation, depth of measurements,surface radiation, and total depth. The sampling boat should be oriented so that the light sensor isnot in the shadow of the boat during data collection. All apparatus should be operated accordingto manufacturer's instructions.
2.4.4 Quality control
2.4.4.1 Calibration: All probes must be calibrated by manufacturers recommended methods..
2.4.4.1.1 Conductivity sensor: The conductivity sensor must be calibratedagainst a reference solution, according to manufacturer's specifications. As a minimum conductivity should be verified before and after eachcruise.
2.4.4.1.2 Ph meter: As a minimum the pH sensor must be calibrated at thebeginning and end of every cruise against two buffer solutions, pH 7and 10. The pH probe must be rinsed with deionized water and mayneed to be soaked in pH 7 buffer when not in use. If the probe drifts ±0.2 pH units, the sensor must be recalibrated using the pH 7 and 10buffers.
2.4.4.1.3 Dissolved oxygen meter: The dissolved oxygen meter should beverified using air-saturated water at the beginning of each day.
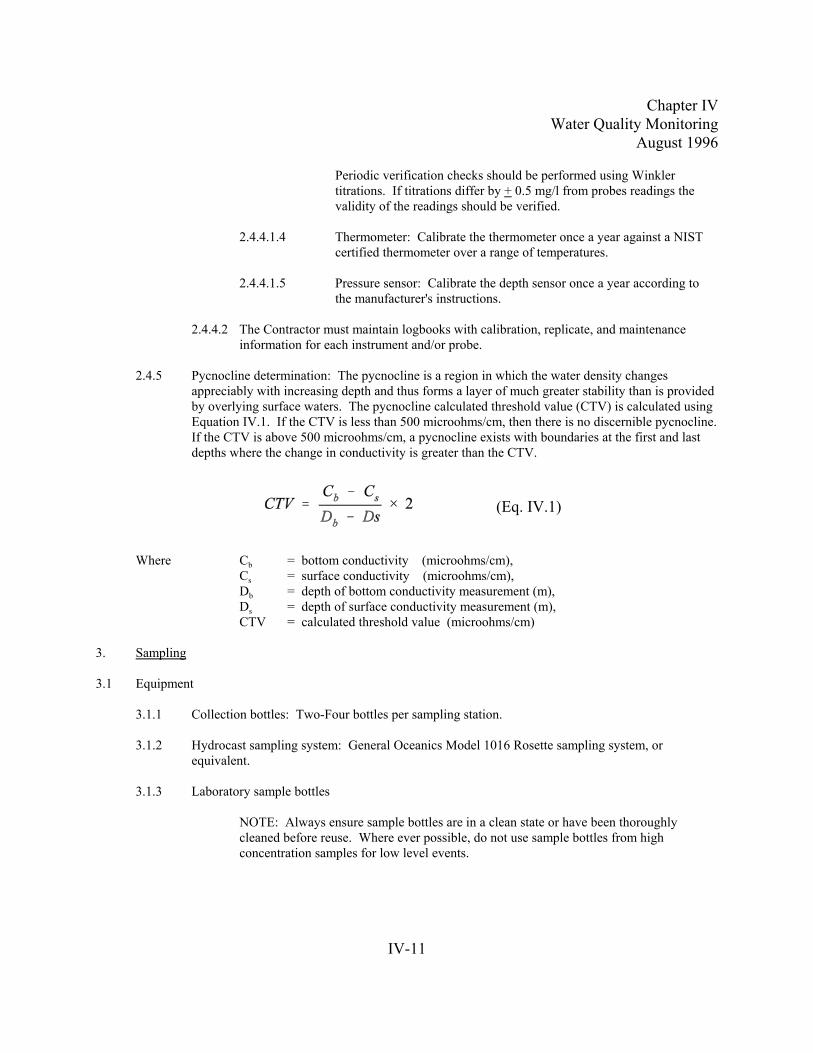
Chapter IVWater Quality Monitoring
August 1996
IV-11
(Eq. IV.1)
Periodic verification checks should be performed using Winklertitrations. If titrations differ by + 0.5 mg/l from probes readings thevalidity of the readings should be verified.
2.4.4.1.4 Thermometer: Calibrate the thermometer once a year against a NISTcertified thermometer over a range of temperatures.
2.4.4.1.5 Pressure sensor: Calibrate the depth sensor once a year according tothe manufacturer's instructions.
2.4.4.2 The Contractor must maintain logbooks with calibration, replicate, and maintenanceinformation for each instrument and/or probe.
2.4.5 Pycnocline determination: The pycnocline is a region in which the water density changesappreciably with increasing depth and thus forms a layer of much greater stability than is providedby overlying surface waters. The pycnocline calculated threshold value (CTV) is calculated usingEquation IV.1. If the CTV is less than 500 microohms/cm, then there is no discernible pycnocline. If the CTV is above 500 microohms/cm, a pycnocline exists with boundaries at the first and lastdepths where the change in conductivity is greater than the CTV.
Where Cb = bottom conductivity (microohms/cm),Cs = surface conductivity (microohms/cm),Db = depth of bottom conductivity measurement (m),Ds = depth of surface conductivity measurement (m),CTV = calculated threshold value (microohms/cm)
3. Sampling
3.1 Equipment
3.1.1 Collection bottles: Two-Four bottles per sampling station.
3.1.2 Hydrocast sampling system: General Oceanics Model 1016 Rosette sampling system, orequivalent.
3.1.3 Laboratory sample bottles
NOTE: Always ensure sample bottles are in a clean state or have been thoroughlycleaned before reuse. Where ever possible, do not use sample bottles from highconcentration samples for low level events.
Chapter IVWater Quality Monitoring
August 1996
IV-12
3.1.4 Filtration apparatus.
3.1.5 Filters:Note: Specific filter types and diameters are cited, however, alternate diameters can be used. Seespecific comments throughout the analytical methodology about concerns related to alternate sizes.
3.1.5.1 Whatman GF/F 25 mm diameter, 0.70 :m pores.
3.1.5.2 Whatman GF/F 47 mm diameter, 0.70 :m pores. Pre-wash, dry at 103-105°C, and weighuntil a constant weight ±.05 mg is reached. Store in a desiccator while cooling and untilweighed.
3.1.5.3 Whatman GF/F 47 mm diameter, 0.70 um pores. Untreated for chlorophyll analysis.
3.1.6 Cooler and freezer.
3.2 Reagents
3.2.1 Magnesium carbonate suspension: Add 1 g of finely powdered MgCO3 to 100 mL water.
3.2.2 Sulfuric acid, H2SO4 (6N) // Hydrochloric acid, HCl (6N).
3.2.3 Reagent water, all water referred to in this document, unless otherwise specified, is ASTM Type IIwater, or equivalent.
3.3 Sample Collection
3.3.1 The cruise vessel should ensure location by LORAN and anchor while taking samples. At thosestations where anchoring is not practical, the LORAN shall be used to hold station. The LORANcoordinates must be recorded at the beginning of the sampling time. It must be recorded whetherthe boat anchored or the station was held using the LORAN.
3.3.2 At stations where pycnocline sampling is designated, if a pycnocline is detected, samples arecollected 0.5m (MD) and 1.0 (VA) m below the surface, 1.0 m above the upper boundary of thepycnocline, 1.0 m below the lower boundary of the pycnocline, and 1.0 m above the bottom tonearest 0.5 m. See Chapter IV Section C 2.4.5 for pycnocline calculations and definitions.
3.3.3 If there is no discernable pycnocline at designated stations collections will be made at 0.5 m (MD)and 1.0 (VA) m below the surface, at the closest profile depth above one third of the distancebetween the surface depth, 1.0 m, and the bottom sample depth, at closest profile depth below twothirds the distance between 1.0 m and the bottom sample depth, and 1.0 m above the bottom to thenearest 0.5 m.
3.3.4 At all other stations, samples are only collected at the 1m below the surface and 1m above the
bottom.
3.3.5 Lower the collection system to each sampling depth and fill one bottle per depth. Process thesample according to 3.4.
3.4 Sample Processing
Chapter IVWater Quality Monitoring
August 1996
IV-13
3.4.1 Sample processing and division for all samples should follow Figure IV.2.
3.4.2 Chlorophyll and phaeophytin: Process sufficient sample (i.e. 100-1500 mL) to produce a greencolor on the filter pad. For smaller diameter filters (i.e., 13 mm), do not exceed the capacity of thefilters with large volumes of sample (i.e., greater than 50ml).
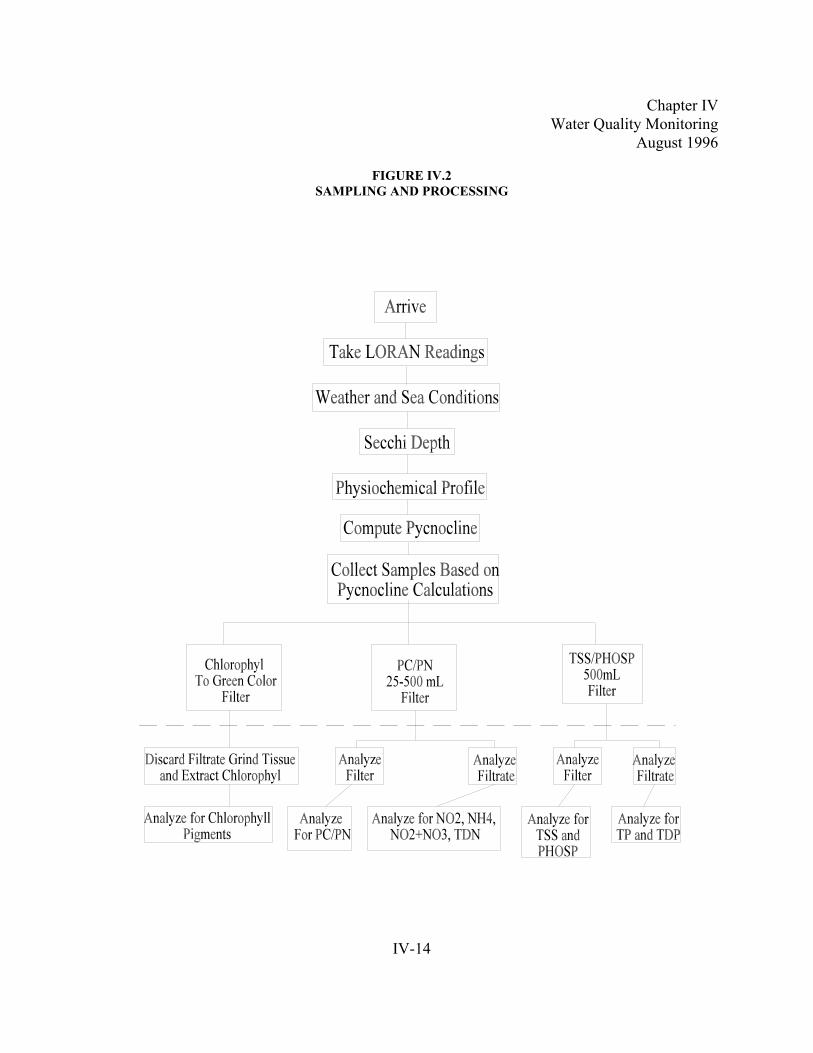
Chapter IVWater Quality Monitoring
August 1996
IV-14
FIGURE IV.2SAMPLING AND PROCESSING
Chapter IVWater Quality Monitoring
August 1996
IV-15
3.4.2.1 Immediately concentrate the algae by filtering a known volume of sample water (measured with agraduated cylinder) onto a glass fiber filter (Whatman GF/F or equivalent). To avoid cell damage andloss of contents during filtration, do not exceed a vacuum of ½ atm (50 kPa or 15 psi), or a filtrationduration greater than 5 minutes. Add 1ml of saturated MgCO3 solution 10mg/l during last fewseconds of filtering
3.4.2.2 Samples that cannot be concentrated immediately after collection may be held at 0 to 4°C in the darkfor 4 hours before the plankton are concentrated, however any delay is strongly discouraged due to thepossible lysis of phytoplankton cells. The residue on the filter may be stored in the dark at -20 ± 2°Cfor 28 days before extracting the pigments.
3.4.3 Particulate carbon and particulate nitrogen: 25-500 mL of sample is filtered under vacuum through each of two13 mm GF/F filters. The filters are stored in Petri dishes or foil pouches at -20 ± 2°C. Do not rinse the filters. Do not exceed 15 psi while filtering.
3.4.4 Ammonia, nitrite, nitrite+nitrate, orthophosphate, total dissolved nitrogen, total dissolved nitrogen, dissolvedorganic carbon, and silicates: The filtrate is stored at -20°±2°C for laboratory analysis, except for silicates,which is stored at 4°±2°C. The DOC samples should have acid preservation (HCl or H2SO4) or be frozen.
3.4.5 Total suspended solids and particulate phosphorus: 50-1000 mL of sample is filtered under vacuum throughtwo prepared 47 mm GF/F filters. The filters are stored in Petri dishes or foil pouches at -20 ± 2°C. If separatefilters are obtained for each analyses, then the total suspended solids filter can be stored at 4°±2°C. Thesefilters should be rinsed three times with at least 10 ml DI water. If filtrate is saved must save before rinse.
3.4.6 Dissolved orthophosphate and total dissolved phosphorus: The filtrate used to prepare filters for particulatephosphorus and total suspended solids is stored at -20 ± 2°C for laboratory analysis.
3.5 Quality control
3.5.1 Field blanks: A field blank is an equivalent aliquot of reagent water that is processed as a sample. The fieldblank should be processed at the beginning of every sampling day. If the concentration of any analytes exceedsthe MDL, equipment contamination should be suspected.
3.5.2 Field duplicates: A field duplicate is a sample taken at the same sample location and depth as a CBP sample. The duplicate and sample should be taken in quick succession of each other. A field duplicate should becollected once for every 10 CBP samples. The data from field duplicates indicates sampling precision.
Chapter IV Water Quality Monitoring
August 1996
IV-15
CHAPTER IV
WATER QUALITY MONITORING
Section D. Laboratory Analysis
1. General Laboratory QA/QC2. Total Dissolved Phosphorus3. Dissolved Orthophosphate4. Particulate Phosphorus5. Nitrite6. Nitrate + Nitrite7. Ammonia8. Total Dissolved Nitrogen/Particulate Nitrogen9. Particulate Carbon10. Dissolved Organic Carbon11. Biological Oxygen Demand, 5-day12. Chlorophyll and Phaeophytin13. Total Suspended Solids14. Fixed Suspended Solids15. Silicates16. Alkalinity
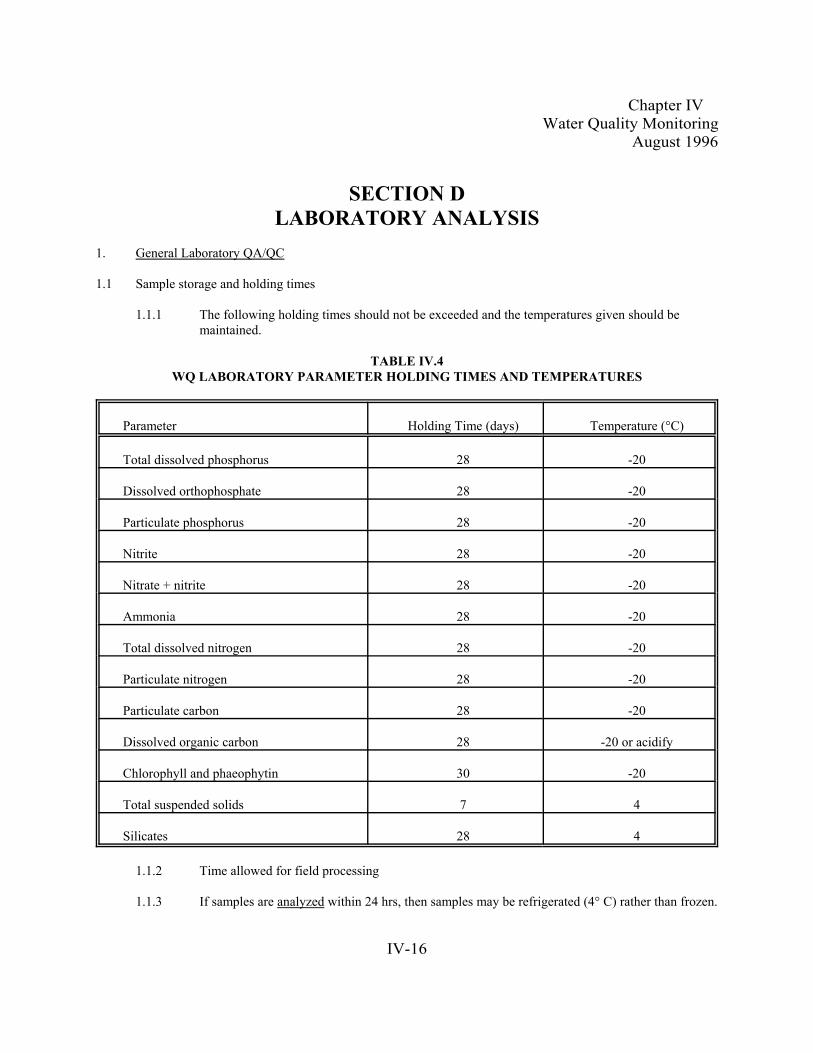
Chapter IV Water Quality Monitoring
August 1996
IV-16
SECTION DLABORATORY ANALYSIS
1. General Laboratory QA/QC
1.1 Sample storage and holding times
1.1.1 The following holding times should not be exceeded and the temperatures given should bemaintained.
TABLE IV.4WQ LABORATORY PARAMETER HOLDING TIMES AND TEMPERATURES
Parameter Holding Time (days) Temperature (°C)
Total dissolved phosphorus 28 -20
Dissolved orthophosphate 28 -20
Particulate phosphorus 28 -20
Nitrite 28 -20
Nitrate + nitrite 28 -20
Ammonia 28 -20
Total dissolved nitrogen 28 -20
Particulate nitrogen 28 -20
Particulate carbon 28 -20
Dissolved organic carbon 28 -20 or acidify
Chlorophyll and phaeophytin 30 -20
Total suspended solids 7 4
Silicates 28 4
1.1.2 Time allowed for field processing
1.1.3 If samples are analyzed within 24 hrs, then samples may be refrigerated (4° C) rather than frozen.

Chapter IV Water Quality Monitoring
August 1996
IV-17
(Eq. IV.2)
1.1.4 The samples should be stored in an atmosphere free of all potential contaminants.
1.1.5 Samples and standards should be stored separately.
1.2 Method Blank
1.2.1 A method blank is a volume of ASTM Type II reagent grade water that is carried through theentire analytical procedure. The purpose of a method blank is to determine the levels ofcontamination associated with the processing and analysis of samples.
1.2.2 A method blank should be analyzed once for every 10-20 CBP samples, including duplicates.
1.2.3 If the concentration of analyte exceeds the MDL, laboratory or reagent contamination should besuspected. If the analyte concentration is 5 times the MDL or greater, then corrective action isrequired and reanalysis if possible.
1.3 Matrix Spike (not required for chlorophyll, PN, PHOSP, TSS, PC)
1.3.1 In order to evaluate the effects of the sample matrix on the analytical methods, a known quantityof analyte is spiked in an aliquot of sample. The analyte concentration should be high enough tobe seen over the original concentration of the sample and should not be less than four times thecalculated MDL.
1.3.2 A matrix spike should be analyzed once for every 10-20 CBP samples.
1.3.3 Matrix spikes should not be performed on laboratory or field blanks.
1.3.4 The percent recovery of analyte from the matrix spike sample is calculated using the followingequation:
where,
SSR = Spike sample resultSR = Sample resultSA = Spike added
1.3.5 If the recovery of the analyte falls outside the range designated in Table II.1, repeat the spikeafter checking for obvious sources of error. If the recovery of the replicated spike of the samesample again falls outside the designated range, the recovery problem encountered with thespiked sample is judged to be matrix related, not system related and no further corrective actionis required.
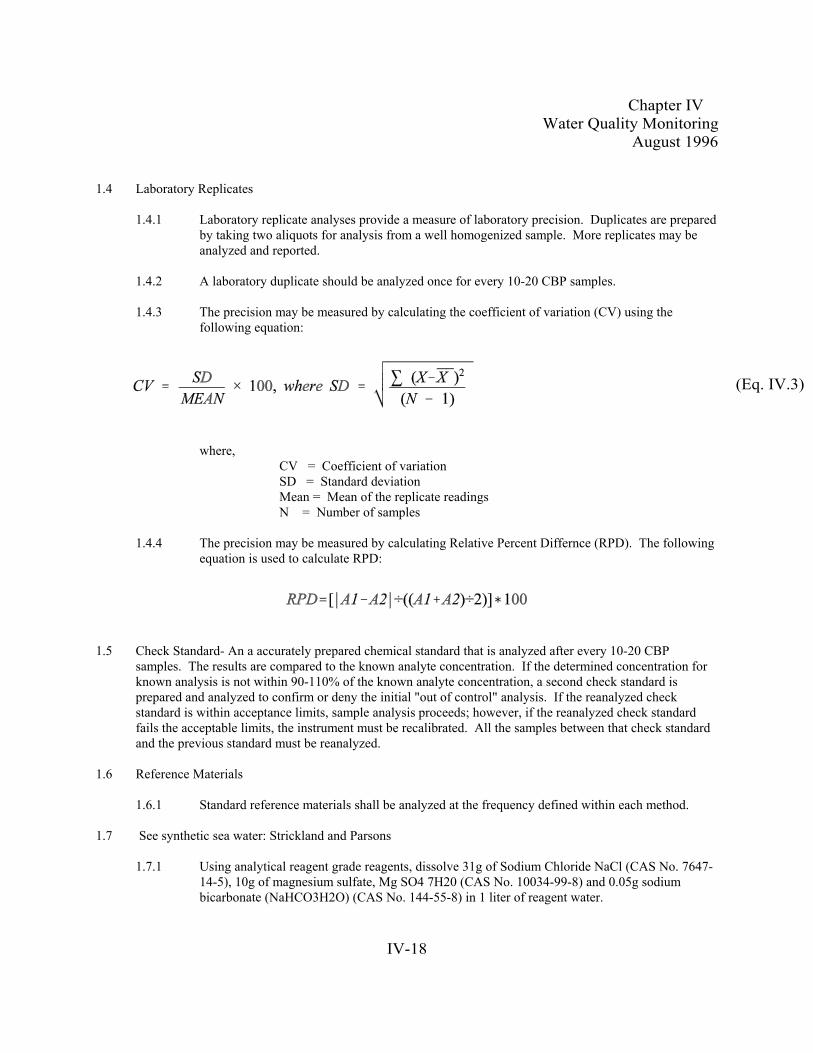
Chapter IV Water Quality Monitoring
August 1996
IV-18
(Eq. IV.3)
1.4 Laboratory Replicates
1.4.1 Laboratory replicate analyses provide a measure of laboratory precision. Duplicates are preparedby taking two aliquots for analysis from a well homogenized sample. More replicates may beanalyzed and reported.
1.4.2 A laboratory duplicate should be analyzed once for every 10-20 CBP samples.
1.4.3 The precision may be measured by calculating the coefficient of variation (CV) using thefollowing equation:
where,
CV = Coefficient of variationSD = Standard deviationMean = Mean of the replicate readingsN = Number of samples
1.4.4 The precision may be measured by calculating Relative Percent Differnce (RPD). The followingequation is used to calculate RPD:
1.5 Check Standard- An a accurately prepared chemical standard that is analyzed after every 10-20 CBPsamples. The results are compared to the known analyte concentration. If the determined concentration forknown analysis is not within 90-110% of the known analyte concentration, a second check standard isprepared and analyzed to confirm or deny the initial "out of control" analysis. If the reanalyzed checkstandard is within acceptance limits, sample analysis proceeds; however, if the reanalyzed check standardfails the acceptable limits, the instrument must be recalibrated. All the samples between that check standardand the previous standard must be reanalyzed.
1.6 Reference Materials
1.6.1 Standard reference materials shall be analyzed at the frequency defined within each method.
1.7 See synthetic sea water: Strickland and Parsons
1.7.1 Using analytical reagent grade reagents, dissolve 31g of Sodium Chloride NaCl (CAS No. 7647-14-5), 10g of magnesium sulfate, Mg SO4 7H20 (CAS No. 10034-99-8) and 0.05g sodiumbicarbonate (NaHCO3H2O) (CAS No. 144-55-8) in 1 liter of reagent water.
Chapter IV Water Quality Monitoring
August 1996
IV-19
1.8 Glassware Cleaning
1.8.1 Standard and Reagent Glassware should be rinsed with 10% HCl once and then rinsed 3 timeswith reagent grade water.
1.8.2 Sample Containers should be rinsed with tap water, 10% HCl and then rinsed 4 times withreagent water. Then, before use they should be rinsed 3 times with sample.
1.8.3 AutoAnalyzer Cups should be rinsed two-three times with the sample, and then filled.
1.9 Reagent grade water: ASTM Type II reagent grade water, or equivalent, should be used in the preparation ofreagents and standards. Reverse osmosis systems or distilling units which produce 18 megohm water are twoexamples of acceptable water sources.
Chapter IV Water Quality Monitoring
August 1996
IV-20
2. Total Dissolved Phosphorus
2.1 Scope and Application
2.1.1 This method provides the procedure for the determination of low level total dissolved phosphorusconcentrations normally found in estuarine and /or coastal waters by the automated persulfateoxidation technique in the range of 0.001 to 2.0 mg/L of P.
2.2 Summary of Method
2.2.1 This method involves the digestion of the sample with an oxidizing agent (alkaline persulfate) inan autoclave, which converts all the phosphorus compounds to orthophosphate. This is followedby analysis for orthophosphate by an automated colorimetric method.
2.2.2 The color in the samples is measured in the following manner. Ammonium molybdate andantimony potassium tartrate react in an acid medium with dilute solutions of phosphorus to forman antimony-phospho-molybdate complex. This complex is reduced to an intensely blue-coloredcomplex by ascorbic acid. The color is proportional to the phosphorus concentration.
2.3 Interferences
2.3.1 Silicon at a level of 100 :g/L causes an interference equivalent to approximately 0.04 :g/L ofP/L. This can be avoided by maintaining an acid concentration of 2.45N H2SO4 in the reagentsand analysis at 37 ± 2°C.
2.4 Apparatus and Materials
2.4.1 Continuous flow automated analytical system equipped with an autosampler, manifold,proportioning pump, colorimeter, phototube, recorder or computer based data system, andheating bath.
2.4.2 Appropriate glassware.
NOTE: Clean all culture tubes by adding 10ml persulfate digestion reagent and heating at 100°C 1 hr, and rinse 3 times with reagent water.
2.4.3 Autoanalyzer cups. see section 1.8.3 Do not reuse cups.
2.4.4 An autoclave that can maintain a temperature of 100 - 110°C.
2.4.5 Culture tubes, 30 mL capacity.
2.5 Reagents
Stock Reagent Solutions
2.5.1 Reagent Grade Water: see section 1.9
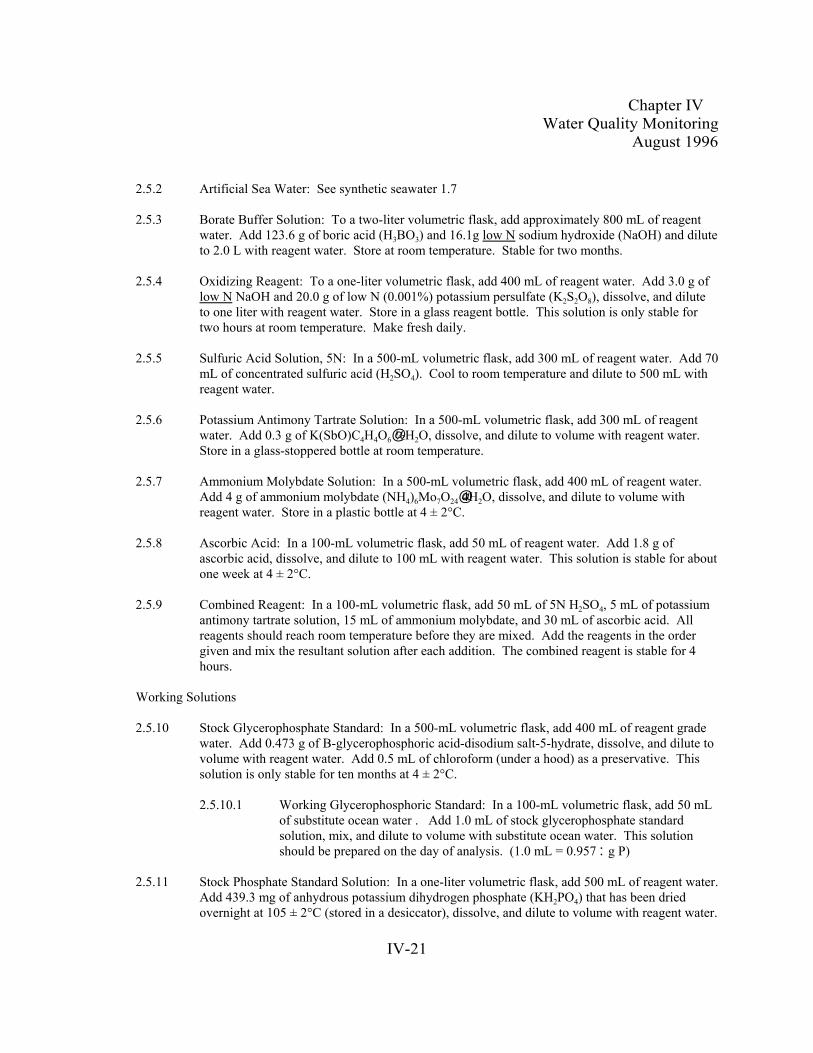
Chapter IV Water Quality Monitoring
August 1996
IV-21
2.5.2 Artificial Sea Water: See synthetic seawater 1.7
2.5.3 Borate Buffer Solution: To a two-liter volumetric flask, add approximately 800 mL of reagentwater. Add 123.6 g of boric acid (H3BO3) and 16.1g low N sodium hydroxide (NaOH) and diluteto 2.0 L with reagent water. Store at room temperature. Stable for two months.
2.5.4 Oxidizing Reagent: To a one-liter volumetric flask, add 400 mL of reagent water. Add 3.0 g oflow N NaOH and 20.0 g of low N (0.001%) potassium persulfate (K2S2O8), dissolve, and diluteto one liter with reagent water. Store in a glass reagent bottle. This solution is only stable fortwo hours at room temperature. Make fresh daily.
2.5.5 Sulfuric Acid Solution, 5N: In a 500-mL volumetric flask, add 300 mL of reagent water. Add 70mL of concentrated sulfuric acid (H2SO4). Cool to room temperature and dilute to 500 mL withreagent water.
2.5.6 Potassium Antimony Tartrate Solution: In a 500-mL volumetric flask, add 300 mL of reagentwater. Add 0.3 g of K(SbO)C4H4O6@½H2O, dissolve, and dilute to volume with reagent water. Store in a glass-stoppered bottle at room temperature.
2.5.7 Ammonium Molybdate Solution: In a 500-mL volumetric flask, add 400 mL of reagent water. Add 4 g of ammonium molybdate (NH4)6Mo7O24@4H2O, dissolve, and dilute to volume withreagent water. Store in a plastic bottle at 4 ± 2°C.
2.5.8 Ascorbic Acid: In a 100-mL volumetric flask, add 50 mL of reagent water. Add 1.8 g ofascorbic acid, dissolve, and dilute to 100 mL with reagent water. This solution is stable for aboutone week at 4 ± 2°C.
2.5.9 Combined Reagent: In a 100-mL volumetric flask, add 50 mL of 5N H2SO4, 5 mL of potassiumantimony tartrate solution, 15 mL of ammonium molybdate, and 30 mL of ascorbic acid. Allreagents should reach room temperature before they are mixed. Add the reagents in the ordergiven and mix the resultant solution after each addition. The combined reagent is stable for 4hours.
Working Solutions
2.5.10 Stock Glycerophosphate Standard: In a 500-mL volumetric flask, add 400 mL of reagent gradewater. Add 0.473 g of B-glycerophosphoric acid-disodium salt-5-hydrate, dissolve, and dilute tovolume with reagent water. Add 0.5 mL of chloroform (under a hood) as a preservative. Thissolution is only stable for ten months at 4 ± 2°C.
2.5.10.1 Working Glycerophosphoric Standard: In a 100-mL volumetric flask, add 50 mLof substitute ocean water . Add 1.0 mL of stock glycerophosphate standardsolution, mix, and dilute to volume with substitute ocean water. This solutionshould be prepared on the day of analysis. (1.0 mL = 0.957 :g P)
2.5.11 Stock Phosphate Standard Solution: In a one-liter volumetric flask, add 500 mL of reagent water. Add 439.3 mg of anhydrous potassium dihydrogen phosphate (KH2PO4) that has been driedovernight at 105 ± 2°C (stored in a desiccator), dissolve, and dilute to volume with reagent water.
Chapter IV Water Quality Monitoring
August 1996
IV-22
This solution is stable for six months at 4 ± 2°C. (1.0 mL = 100.0 :g P)
2.5.11.1 Working Standards
2.6 Sample Handling
2.6.1 Samples are filtered through a Whatman GF/F glass fiber filter or equivaleant filter and can bestored at -20 ± 2°C unacidified for a maximum of 28 days. They should not be preserved withsulfuric acid. Do not freeze after digestion; a precipitate will form.
2.7 Procedure
2.7.1 Sample preparation:
2.7.1.1 Pipet 10 mL of filtered sample into a 30 mL screw cap test tubes. Include 5-10%duplicates and 5-10% spikes (spike with 0.30ml working standard).
2.7.1.2 Pipet 10.0 ml of working standards into 30 ml screw cap test tubes. Include twooxidizing reagent blanks which contain only the oxidizing reagent.
2.7.1.3 Pipet 5.0 mL of the oxidizing reagent in each tube. Cap test tubes tightly and veryquickly due to volatilization.
NOTE: A precipitate (Mg(OH)2) will form with seawatersamples which will not form with saline standards prepared withNaCl. If standards are made with Substitute Ocean Water theprecipitate will form.
2.7.1.4 Autoclave tubes at a temperature between 100 - 110°C (follow Autoclaveinstructions).
2.7.1.5 Remove tubes from the heating apparatus and cool to room temperature. Checkvolumes for possible fluid loss and indicate any losses on bench sheet. Samplescan be refrigerated for several days at this point if necessary to delay analysis.
2.7.2 Add 1.0 mL of borate buffer solution to each tube and cap. Shake very well. The pH of thesample should be around 2. Samples can now be analyzed for orthophosphate.
2.7.3 Allow both the colorimeter and recorder to warm up for 30 minutes. Obtain a stable baselinewith all reagents, feeding reagent water through the sample line.
2.7.4 Prepare a series of standard solutions covering the concentration range of the samples by dilutingeither the stock or standard solutions and digesting them along with the samples. Digest matrixspike and blanks along with the samples.
2.7.5 Analytical sequence: The samples and associated QC samples and standards should beanalayzed according to the following sequence.
2.7.5.1 Five calibration standards with concentration within the linear range of the test.

Chapter IV Water Quality Monitoring
August 1996
IV-23
2.7.5.2 Two method blanks.
2.7.5.3 Ten-twenty CBP samples.
2.7.5.4 One matrix spike sample.
2.7.5.5 One medium concentration calibration standard.
2.7.5.6 One method blank.
2.7.5.7 Steps 2.7.5.1 - 2.7.5.6 are repeated until all samples are analyzed or QC samplesindicate that the system is out of control and recalibration is necessary.
2.7.5.8 One high concentration calibration standard.
2.7.5.9 One medium concentration calibration standard.
2.7.5.10 One low concentration calibration standard.
2.7.6 Switch sample line from distilled water to sampler and begin analysis.
2.7.7 Prepare appropriate standard curve by plotting peak heights of processed standards againstknown concentrations. Compute concentration of the samples by comparing sample peak heightswith standard curve.
NOTE: Subtract the blank background response from the standards before preparing thestandard curve.
2.7.8 Record the stabilized potential of each unknown sample and convert the potential to the TDPconcentration using the standard curve.
2.8 Quality Control
2.8.1 Method detection limits (MDL): Method detection limits should be established using theguidelines in Chapter II, Section D.
2.8.2 Calibration
2.8.2.1 Linear calibration range: Calibration standards should bracket the range of CBPsamples.
2.8.2.2 Correlation coefficient: The correlation coefficient must be 0.995 or better for thecalibration curve to be used.
2.8.3 Method blank: see Chapter II, Section C.
2.8.4 Matrix spike sample: see Chapter II, Section C.
2.8.5 Laboratory duplicate: see Chapter II, Section C.

Chapter IV Water Quality Monitoring
August 1996
IV-24
2.8.6 Reference materials: The laboratory must analyze a standard reference material once a year, asavailable.
2.9 References
Standard Methods for the Examination of Water and Wastewater, 17th Edition, p 1193.
Annual Book of ASTM Standards, Part 31, "Water", Standard D 515-72, p 389 (1976).
Chapter IV Water Quality Monitoring
August 1996
IV-25
3. Dissolved Orthophosphate
3.1 Scope and Application
3.1.1 This method provides a procedure for the determination of low level orthophosphateconcentrations normally found in estuarine and/or coastal waters. It is an automation of themethod of Murphy and Riley (1962).
3.1.2 A method detection limit (MDL) of 0.0006 mg P/L has been statistically determined by onelaboratory. This MDL is defined as three times the standard deviation of at least seven replicatesof a low level estuarine (~15 parts per thousand salinity) sample. The method is linear to 0.050mg P/L at a standard calibration setting of 9.0 on an AutoAnalyzer II system. Where higherconcentrations are encountered, the method is also linear at lower standard calibration settings.
3.1.3 This method should be used by analysts experienced in the use of automated colorimetricanalyses and matrix interferences and procedures for their correction. A minimum of six monthsexperience under supervision is recommended.
3.2 Summary of Method
3.2.1 This is an automated colorimetric method for the analysis of low level orthophosphate estuarinesamples. Ammonium molybdate and antimony potassium tartrate react in an acid medium withdilute solutions of phosphorus to form an antimony-phospho-molybdate complex. This complexis reduced to an intensely blue-colored complex by ascorbic acid. The color produced isproportional to the phosphate concentration present in the sample. A calibration curve isestablished with standards of known concentrations and the unknown samples are measuredagainst the calibration curve.
3.3 Interferences
3.3.1 It is reported that the interference caused by copper, arsenate and/or silicate is minimal to theorthophosphate determination because of their extremely low concentrations normally found inestuarine or coastal waters. High iron concentrations can cause precipitation of and subsequentloss of phosphorus from the dissolved phase. Hydrogen sulfide effects (samples collected fromdeep anoxic basins) can be treated by simple dilution of the sample, since high sulfideconcentrations are most often associated with high phosphate values (Grasshoff, et al., 1983).
3.3.2 Mercuric chloride, if used as a preservative, interferes (EPA,1977).
3.3.3 Sample turbidity should be removed by filtration prior to analysis.
3.3.4 Refractive Index interferences should be corrected for estuarine/coastal samples.
3.4 Apparatus and Materials
3.4.1 Continuous flow automated analytical system equipped with an autosampler, manifold,proportioning pump, colorimeter, phototube, recorder or computer based data system, andheating bath.
Chapter IV Water Quality Monitoring
August 1996
IV-26
3.4.2 Phosphate-free glassware: all glassware used in the determination must be low in residualphosphate to avoid sample/reagent contamination. Washing with 10% HCl and thoroughlyrinsing with distilled/deionized water have been found to be effective.
3.5 Reagents
3.5.1 Reagent Grade Water: see section 1.9.
3.5.2 Substitute Ocean Water: see section 1.7
3.5.3 Stock Reagent Solutions
3.5.3.1 Ammonium Molybdate Solution (40 g/L): Dissolve 20.0 g of ammoniummolybdate tetrahydrate [(NH4)6Mo7O24•4H2O, CAS RN 12027-67-7] inapproximately 400 mL of reagent water and dilute to 500 mL. Store in a plasticbottle out of direct sunlight. This reagent is stable for approximately threemonths.
3.5.3.2 Antimony Potassium Tartrate Solution (3.0 g/L): Dissolve 0.3 g of antimonypotassium tartrate [(K(SbO)C4H4O6•½H2O, CAS RN 11071-15-1] inapproximately 90 mL of reagent water and dilute to 100 mL. This reagent isstable for approximately three months.
3.5.3.3 Ascorbic Acid Solution (18.0 g/L): Dissolve 18.0 g of ascorbic acid (C6H6O6,CAS RN 50-81-7) in approximately 800 mL of reagent water and dilute to oneliter. Dispense approximately 75 mL into clean poly bottles and freeze. Thestability of the frozen ascorbic acid is approximately three months. Thawovernight in the refrigerator before use. The stability of the thawed, refrigeratedreagent is 10 days.
3.5.3.4 Wetting Agent - use Skalar FFD6.
3.5.3.5 Sulfuric Acid Solution (5.0 N): Add 140 mL concentrated sulfuric acid (H2SO4,CAS RN 7664-93-9) to approximately 800 mL reagent water while cooling. Afterthe solution is cooled, dilute to 1000 mL with reagent water.
3.5.3.6 Stock Phosphorus Solution: Dissolve 0.439 g of pre-dried (105± 2°C for 1 hour)potassium phosphate, monobasic (KH2PO4, CAS RN 7778-77-0) in reagent waterand dilute to 1000 mL (1.0 mL = 0.100 mg P). The stability of this stock standardis approximately three months, if kept refrigerated.
3.5.4 Working Reagents
3.5.4.1 Reagent A: Mix the following reagents in these proportions for 277 mL ofReagent A: 125mL of sulfuric acid, 37.5 mL of PAT, 37.5 mL of Molybdate,75ml of Ascorbic, and 2mL of FFD6. Prepare daily.
3.5.4.2 Reagent B: Add approximately 2.0 mL of the FFD6 solution to the 1000 mL ofDDI. Volumetric accuracy not required. Stability is approximately 10 days if
Chapter IV Water Quality Monitoring
August 1996
IV-27
kept refrigerated.
3.5.4.3 Refractive Reagent A: Add 50 mL of 4.9 N H2SO4 to 20 mL of reagent water. Add 1 mL of SLS. Prepare every few days.
3.5.4.4 Secondary Phosphorus Solution: Take 1.0 mL of stock phosphorus standard anddilute to 100 mL with reagent water (1.0 mL = 0.0010 mg P). Refrigerate andkeep no longer than 10 days.
3.5.4.5 Prepare a series of standards by diluting suitable volumes of standard solutions to100 mL with reagent water. Prepare these standards daily. When working withsamples of known salinity it is recommended that the standard curveconcentrations be prepared in substitute ocean water . When analyzing samples ofvarying salinites, it is recommended that the standard curve be prepared indeionized water and refractive index corrections be made to the sampleconcentrations.
3.6 Sample Handling
3.6.1 Samples are stored at -20 ± 2°C for a maximum 28 days.
3.7 Procedure
3.7.1 If samples have not been freshly collected and are frozen, thaw the samples to room temperature.
3.7.2 Set up the manifold as instructed by the instrument manufacturer.
3.7.3 Allow both colorimeter and recorder to warm up for 30 minutes. Obtain a steady baseline withdeionized water pumping through the system, add reagents to the sample stream and after thereagent baseline is steady, reset the "zero" if necessary.
3.7.4 A good sampling rate is approximately 30 samples/hr. with a 60:60:0 sample:wash ratio.
3.7.5 Analytical sequence: The samples and associated QC samples and standards should be runaccording to the following sequence.
3.7.5.1 Five calibration standards with concentration within the linear range of the test.
3.7.5.2 Two method blanks.
3.7.5.3 Ten - twenty CBP samples.
3.7.5.4 One matrix spike sample.
3.7.5.5 One medium concentration calibration standard.
3.7.5.6 One method blank.
3.7.5.7 Steps 3.7.5.3 - 3.7.5.6 are repeated until all samples are analyzed or QC samples
Chapter IV Water Quality Monitoring
August 1996
IV-28
indicate that the system is out of control and recalibration is necessary.
3.7.5.8 One high concentration calibration standard.
3.7.5.9 One medium concentration calibration standard.
3.7.5.10 One low concentration calibration standard.
3.7.6 Calculations
3.7.6.1 Orthophosphate concentrations are calculated from the linear regression obtainedfrom the standard curve in which the concentrations of the standards are employedas the independent variables and their corresponding peak heights are thedependent variables. Need a correction for PO4 in reagent water. This is done bymatching the matrix with the refractive reagent.
3.7.6.2 Refractive Index Correction For Estuarine/Coastal Systems
3.7.6.2.1 Obtain a second set of peak heights for all samples andstandards with Refractive Reagent A being pumped through thesystem in place of Reagent A. Reagent B remains the same andis also pumped through the system. Peak heights for therefractive index correction must be obtained at the sameStandard Calibration Setting and on the same colorimeter as thecorresponding samples and standards (Froelich and Pilson,1978). Subtract these peak heights from the corresponding peakheights obtained reagent A.
3.8 Quality Control
3.8.1 Method detection limits (MDL): Method detection limits should be established using theguidelines in Chapter II, Section D.
3.8.2 Calibration
3.8.2.1 Linear calibration range: Calibration standards should bracket the range of CBPsamples.
3.8.2.2 Correlation coefficient: The correlation coefficient must be 0.995 or better for thecalibration curve to be used.
3.8.3 Method blank: see Chapter II, Section C.
3.8.4 Matrix spike sample: see Chapter II, Section C.
3.8.5 Laboratory duplicate: see Chapter II, Section C.
3.8.6 Reference materials: The laboratory must analyze a standard reference material once a year, asavailable.
Chapter IV Water Quality Monitoring
August 1996
IV-29
3.9 References
Froelich, P.N. and M.E.Q. Pilson. 1978. Systematic absorbance errors with Technicon AutoAnalyzer IIcolorimeters. Water Research 12: 599-603.
Grasshoff, K., M. Ehrhardt and K. Kremling. 1983. Methods of Seawater Analysis. Verlag Chemie, FederalRepublic of Germany. 419 pp.
Thayer, G.W. 1970. Comparison of two storage methods for the analysis of Nitrogen and Phosphorusfractions in estuarine water. Ches. Sci. 11:3, 155-158.
Macdonald, R.W. and F.A. McLaughlin. 1982. The effect of storage by freezing on dissolved inorganicphosphate, nitrate and reactive silicate for samples from coastal and estuarine waters. WaterResearch. 16: 95-104.
Murphy, J. and J.P. Riley. 1962. A modified single solution method for the determination of phosphate innatural waters. Analytica chim. Acta 27: 31-36.
Klingamann, E.D. and D.W. Nelson. 1976. Evaluation of methods for preserving the levels of solubleinorganic phosphorus and nitrogen in unfiltered water samples. J. Environ. Qual. 5:1 42-46.
Salley, B.A., J.G. Bradshaw and B.J. Neilson. 1986. Results of comparative studies of preservationtechniques for nutrient analysis on water samples. VIMS, Gloucester Point, VA., 23062. 32pp
U.S. EPA. 1974. Methods for chemical analysis of water and wastes. Methods development and qualityassurance research laboratory. National environmental research center. Cincinnati, Ohio 45268.
40 CFR, [part] 136 Appendix B. Definition and Procedure for the Determination of the Method DetectionLimit. Revision 1.11.
Chapter IV Water Quality Monitoring
August 1996
IV-30
4. Particulate Phosphorus
4.1 Scope and Application
4.1.1 This method is applicable for the determination of particulate phosphorus in water, wastewater,saline, surface, and ground waters by a semi-automated high temperature combustion, HCLextraction technique in the range of 0.01 to 2.0 mg/L of P (Aspila, et al , 1976).
Note: Final matrix of analysis = 0.2 NHCl
4.2 Summary of Method
4.2.1 Ammonium molybdate and antimony potassium tartrate react in an acid medium with dilutesolutions of phosphorus to form an antimony-phospho-molybdate complex. This complex isreduced to an intensely blue-colored complex by ascorbic acid. The color is proportional to thephosphorus concentration.
4.3 Interferences
4.3.1 Silicon at a level of 100 :g/L causes an interference equivalent to approximately 0.04 :g/L ofP/L. This can be avoided by maintaining an acid concentration of 2.45N H2SO4 in the reagentsand analysis at 37 ± 2°C.
4.4 Apparatus and Materials
4.4.1 Continuous flow automated analytical system equipped with an autosampler, manifold,proportioning pump, colorimeter, phototube, recorder or computer based data system, andheating bath. Add a dilution coil to automatically dilute the sample to 10% with reagent waterfor orthophosphate analysis as per subsection 3.
4.4.2 Appropriate glassware. see section 1.8
NOTE: Clean all glassware two times with 4N HCl and rinse 9 times with reagent water.
4.4.3 Autoanalyzer cups. see section 1.8.3
4.4.4 Muffle furnace capable of maintaining temperatures 550 ± 50°C.
4.4.5 Whatman 47 mm glass fiber filter (0.7 :m pore size).
4.4.6 Centrifuge tubes, 50 mL capacity.
4.4.7 Filter apparatus with a minimum of 100 mL capacity.
4.5 Reagents
4.5.1 Reagent Grade Water: see section 1.9.

Chapter IV Water Quality Monitoring
August 1996
IV-31
4.5.2 Hydrochloric Acid, 1N: In a one-liter volumetric flask, add approximately 800 mL of reagentwater. Add 86 mL of concentrated HCl and dilute to one liter with reagent water.
4.5.3 Sulfuric Acid, 5.0N: To a one-liter volumetric flask, add 400 mL of reagent water. Add 140 mLof concentrated H2SO4, mix, cool, and dilute to one liter with reagent water.
4.5.4 Potassium Antimony Tartrate Solution: In a one-liter volumetric flask, add 800 mL of reagentwater. Add 3.0 g of K(SbO)C4H4O6@½H2O, dissolve, and dilute to volume with reagent water. Store in a glass-stoppered bottle at room temperature.
4.5.5 Ammonium Molybdate Solution: In a one-liter volumetric flask, add 800 mL of reagent water. Add 40.0 g of ammonium molybdate (NH4)6Mo7O24@4H2O, dissolve, and dilute to volume withreagent water. Store in a plastic bottle at 4 ± 2°C away from direct sunlight.
4.5.6 Ascorbic Acid: In a one-liter volumetric flask, add 800 mL of reagent water. Add 18.0 g ofascorbic acid, dissolve, and dilute to one liter with reagent water. Dispense 40 mL into cleanpolybottle and freeze. Thaw overnight in the refrigerator before use.
4.5.7 Sodium Lauryl Sulfate Solution: In a 100-mL volumetric flask, add 80 mL of reagent water. Add 3.0 g of sodium lauryl sulfate, dissolve, and dilute to 100-mL with reagent water.
4.5.8 Working reagent:
4.5.8.1 Reagent A: In a 100-mL volumetric flask, add 50 mL of 4.9N H2SO4, 5 mL ofpotassium antimony tartrate solution, 15 mL of ammonium molybdate, and 1.0mL of sodium lauryl sulfate solution. All reagents must reach room temperaturebefore they are mixed. Add the reagents in the order given and mix the resultantsolution after each addition. The combined reagent is stable for 4 hours.
4.5.8.2 Reagent B: In a 100-mL volumetric flask, add 30 mL of ascorbic acid, and 0.3mL of sodium lauryl sulfate solution. All reagents must reach room temperaturebefore they are mixed. Add the reagents in the order given and mix the resultantsolution after each addition. The combined reagent is stable for 4 hours.
4.5.9 Stock Phosphate Standard Solution: In a one-liter volumetric flask, add 500 mL of reagent water. Add 1.632 g of anhydrous potassium dihydrogen phosphate (KH2PO4) that has been driedovernight at 105 ± 2°C (stored in a desiccator), dissolve, and dilute to volume with reagent water. Add 1.0 mL of chloroform as a preservative. This solution is only stable for six months at 4 ±2°C. (1.0 mL = 12.0 :g P)
4.6 Sample Handling
4.6.1 Samples are stored at -20 ± 2°C for a maximum 28 days.
4.7 Procedure
4.7.1 Sample preparation:

Chapter IV Water Quality Monitoring
August 1996
IV-32
4.7.1.1 Record the weight of the GF/F filter used for total suspended solids after the totalsuspended solids have been determined and muffle for PP or refreeze them.
4.7.1.2 Remove the filters from the freezer and store in a clean container and dryovernight in an oven at 50 ± 2°C.
4.7.1.3 Place the dried filters in a clean numbered crucible in a muffle furnace and heatfor 2 hours at 550 ± 2°C. Cool overnight.
4.7.2 Place the filters in labelled 50-mL plastic screw cap centrifuge tubes, add 10 mL of 1N HCl, capand shake gently, several times during a 24-hour period. Dilute to 50 ml with reagent water andmeasure phosphate concentration.
4.7.3 Transfer the supernatant extract to autoanalyzer cups with a Pasteur pipette, and prepare tomeasure the phosphate concentration
4.7.4 Allow both the colorimeter and recorder to warm up for 30 minutes. Obtain a stable baselinewith all reagents, feeding reagent water through the sample line.
4.7.5 Prepare a series of standard solutions covering the concentration range of the samples by dilutingeither the stock or standard solutions with substitute ocean water.
4.7.6 Analytical sequence: The samples and associated QC samples and standards should be runaccording to the following sequence.
4.7.6.1 Five calibration standards with concentration within the linear range of the test.
4.7.6.2 Two method blanks.
4.7.6.3 Ten-twenty CBP samples.
4.7.6.4 One matrix spike sample.
4.7.6.5 One medium concentration calibration standard.
4.7.6.6 One method blank.
4.7.6.7 Steps 4.7.6.3 - 4.7.6.6 are repeated until are samples are analyzed or QC samplesindicate that the system is out of control and recalibration is necessary.
4.7.6.8 One high concentration calibration standard.
4.7.6.9 One medium concentration calibration standard.
4.7.6.10 One low concentration calibration standard.
4.7.7 Switch sample line from distilled water to sampler and begin analysis.

Chapter IV Water Quality Monitoring
August 1996
IV-33
4.7.8 Prepare appropriate standard curve by plotting peak heights of processed standards made up withKH2PO4, in a 0.2N Hcl matrix, against known concentrations. Compute concentration of thesamples by comparing sample peak heights with standard curve.
NOTE: Subtract the blank background response from the standards before preparing thestandard curve.
4.7.9 Record the stabilized potential of each unknown sample and convert the potential reading to thephosphorus concentration using the standard curve.
4.8 Quality Control
4.8.1 Method detection limits (MDL): Method detection limits should be established using theguidelines in Chapter II, Section D.
4.8.2 Calibration
4.8.3 Linear calibration range: Calibration standards should bracket the range of CBPsamples.
4.8.3.1 Correlation coefficient: The correlation coefficient must be 0.99 or better for thecalibration curve to be used.
4.8.4 Method blank: see Chapter II, Section C.
4.8.5 Matrix spike sample: see Chapter II, Section C.
4.8.6 Laboratory duplicate: see Chapter II, Section C.
4.8.7 Reference materials: The laboratory must analyze a standard reference material once a year, asavailable.
4.9 References
Aspila, K.I., H Agemian and A.S.Y. Chau. 1976. A semi-automated method for thedetermination of inorganic, organic, and total phosphate in sediments analysis. 101:187-197.
Standard Methods for the Examination of Water and Wastewater, 14th Edition, p 1193.
Annual Book of ASTM Standards, Part 31, "Water", Standard D 515-72, p 389 (1976).
Standard Operating Procedures for Nutrient Analytical Services Laboratory, Chesapeake BiologicalLaboratory, May 1988.
Chapter IV Water Quality Monitoring
August 1996
IV-34
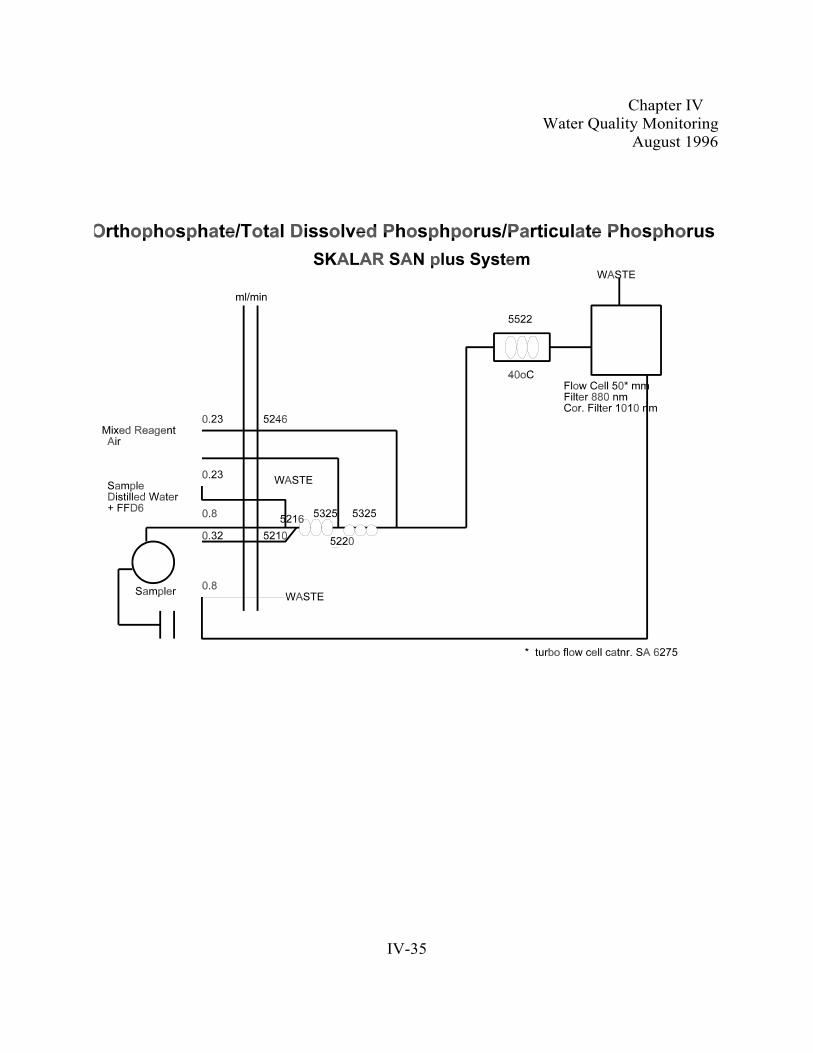
Chapter IV Water Quality Monitoring
August 1996
IV-35
Chapter IV Water Quality Monitoring
August 1996
IV-36
5. Nitrite
5.1 Scope and Application
5.1.1 This method provides a procedure for the determination of low level nitrite concentrationsnormally found in estuarine and/or coastal waters.
5.1.2 A method detection limit (MDL) of 0.0002 mg N/L has been statistically determined by onelaboratory. This MDL is defined as three times the standard deviation of at least seven replicatesof a low level estuarine (~15 parts per thousand salinity) sample. The method is linear to 0.070mg N/L at a standard calibration setting of 9.0 on an AutoAnalyzer II system. Where higherconcentrations are encountered, the method is also linear at less sensitive standard calibrationsettings.
5.1.3 This method should be used by analysts experienced in the use of automated colorimetricanalyses, matrix interferences and procedures for their correction. A minimum of six monthsexperience under supervision is recommended.
5.2 Summary of Method
5.2.1 This method is an automated colorimetric method for the analysis of low level nitriteconcentrations. Filtered samples are analyzed by deoxidizing with sulfanilamide and couplingwith N-1-naphthylethylenediamine dihydrochloride to form a colored azo dye. The colorproduced is proportional to the nitrite concentration present in the sample.
5.3 Interferences
5.3.1 Metal ions may produce a positive error if present in sufficient concentrations.
5.3.2 Sample turbidity should be removed by filtration prior to analysis.
5.3.3 Refractive Index interferences should be corrected for when analyzing estuarine/coastal samples. 5.4 Apparatus and Materials
5.4.1 Continuous flow automated analytical system equipped with an autosampler, manifold,proportioning pump, colorimeter, phototube or recorder or computer based data system.
5.4.2 Nitrogen-free glassware: All glassware used in the determination must be low in residual nitrite
to avoid sample/reagent contamination. Washing with 10% HCl and thoroughly rinsing withreagent water has been found to be effective.
5.5 Reagents
5.5.1 Stock reagent solutions
5.5.1.1 Ammonium Chloride Reagent: Dissolve 10.0 g of ammonium chloride (NH4Cl)inone liter of reagent water. Adjust to pH 8.5 by adding three to four NaOH pellets
Chapter IV Water Quality Monitoring
August 1996
IV-37
as necessary. Add 5 drops of 2% copper sulfate solution. No addition of EDTAis necessary. This reagent is stable for one week if kept refrigerated.
5.5.1.2 Color Reagent: Combine 1500 mL reagent water, 200.0 mL concentratedphosphoric acid (H3PO4), 20.0 g sulfanilamide, and 1.0 g N-1napthylethylenediamine dihydrochloride. Dilute to 2000 mL with reagent water. Add 2.0 mL BRIJ-35 (Bran & Luebbe, Elmsford, N.Y.).Store at 4 ± 2°C in thedark. This should be prepared every six weeks.
5.5.1.3 Refractive Reagent: Combine 100 mL of concentrated phosphoric acid (H3PO4)
with 800 mL reagent water. Dilute to 1000 mL with reagent water. Add 1.0 mLBRIJ-35.
5.5.1.4 Stock Nitrite Solution: Dissolve 0.493 g pre-dried (60 ± 2°C for 1 hour) sodium
nitrite (NaNO2) in reagent water and dilute to 1000 mL. 1.0 mL = 0.100 mg N. The stability of this stock standard is approximately 3 months, if kept refrigerated.
5.5.2 Reagent water: see section 1.9
5.5.3 Artificial Sea Water: see section 1.7
5.5.4 Secondary Nitrite Solution: Dilute 1.0 mL of stock nitrite solution to 100 mL with reagent water. 1.0 mL of this solution = 0.001 mg N. Refrigerate and store no longer than 3 days.
5.5.5 Prepare a series of standards by diluting suitable volumes of secondary nitrite solution to 100 mLwith reagent water. Prepare these standards daily. When working with samples of knownsalinity it is recommended that the standard curve concentrations be prepared in substitute oceanwater diluted to that salinity and that the sampler wash solution also be substitute ocean waterdiluted to that salinity. When analyzing samples of varying salinities, it is recommended that thestandard curve be prepared in reagent water and Refractive Index corrections be made to thesample concentrations. The following dilutions, brought up to 100 mL with reagent water, aresuggested.
mL of standard nitrite solution0.51.02.04.06.0
Concentration (mg N/L)0.0050.0100.0200.0400.060
5.5.6 Saline nitrite standards: When analyzing samples of varying salinities, it is also recommended thatstandards be prepared in a series of salinities in order to quantify the "salt error," the shift in thecolorimetric response of nitrite due to the change in the ionic strength of the solution.
5.6 Sample Handling
5.6.1 Samples must be analyzed as quickly as possible. If the samples are to be analyzed within 24 hours ofcollection, then refrigeration at 4 ± 2°C is acceptable.
Chapter IV Water Quality Monitoring
August 1996
IV-38
5.6.2 If samples will not be analyzed within 24 hours of collection, the sample must be stored at -20 ± 2°Cfor a maximum of 28 days.
5.7 Procedure
5.7.1 Calibration: Standard curves of varying concentrations should be analyzed through several standardcalibration settings (calibrated sensitivity settings). In so doing, where higher concentrations areencountered, the method will also have been checked for linearity using sets of standards of higherconcentrations.
5.7.2 Sample analysis
5.7.2.1 If samples have not been freshly collected and are frozen, thaw the samples to roomtemperature.
5.7.2.2 Allow both colorimeter and recorder to warm up for 30 minutes. Obtain a steady
baseline with reagent water pumping through the system, add reagents to the samplestream and after the reagent base line is steady, reset the "zero" if necessary.
5.7.2.3 A good sampling rate is approximately 40 samples/hr. with a 9:1 sample:wash ratio.
5.7.2.4 Analytical sequence: The samples and associated QC samples and standards should berun according to the following sequence.
5.7.2.4.1 Five calibration standards with concentration within the linear rangeof the test.
5.7.2.4.2 Two method blanks.
5.7.2.4.3 Ten CBP samples.
5.7.2.4.4 One matrix spike sample.
5.7.2.4.5 One medium concentration calibration standard.
5.7.2.4.6 One method blank.
5.7.2.4.7 Steps 5.7.2.4.3 - 5.7.2.4.6 are repeated until samples are analyzed orQC samples indicate that the system is out of control andrecalibration is necessary.
5.7.2.4.8 One high concentration calibration standard.
5.7.2.4.9 One medium concentration calibration standard.
5.7.2.4.10 One low concentration calibration standard.
5.7.2.5 If a low concentration sample peak follows a high concentration sample peak, a certain
Chapter IV Water Quality Monitoring
August 1996
IV-39
amount of carry over can be expected. It is recommended that if there is not a clearlydefined low concentration peak, that the sample be reanalyzed at the end of the samplerun.
5.7.3 Calculations
5.7.3.1 Nitrite concentrations are calculated from the linear regression obtained from thestandard curve in which the concentrations of the standards are entered as theindependent variable and their corresponding peak heights are the dependent variable.
5.7.3.2 Refractive Index Correction For Estuarine/Coastal Systems shall be performed inaccordance with procedures described in Section 6.7.3.2
5.7.3.3 Correction for Salt Error in Estuarine/Coastal Samples shall be performed inaccordance with procedures described in Section 6.7.3.3
5.7.3.4 Results should be reported in mg N/L.
5.8 Quality Control
5.8.1 Method detection limits (MDL): Method detection limits should be established using the guidelines inChapter II, Section D.
5.8.2 Calibration
5.8.2.1 Linear calibration range: Calibration standards should bracket the range of CBPsamples.
5.8.2.2 Correlation coefficient: The correlation coefficient must be 0.995 or better for thecalibration curve to be used.
5.8.3 Method blank: see Chapter II, Section C.
5.8.4 Matrix spike sample: see Chapter II, Section C.
5.8.5 Laboratory duplicate: see Chapter II, Section C.
5.8.6 Reference materials: The laboratory must analyze a standard reference material once a year, asavailable.
5.9 References
Froelich, P.N. and M.E.Q. Pilson. 1978. Systematic absorbance errors with Technicon AutoAnalyzer II calorimeters.Water Research 12: 599- 603.
Grasshoff, K., M. Ehrhardt and K. Kremling. 1983. Methods of Seawater Analysis. Verlag Chemie, FederalRepublic of Germany. 419 pp.

Chapter IV Water Quality Monitoring
August 1996
IV-40
Klingamann, E.D. and D.W. Nelson. 1976. Evaluation of methods for preserving the levels of soluble inorganicphosphorus and nitrogen in unfiltered water samples. J. Environ. Qual. 5:1 42-46.
Loder, T.C. and P.M. Glibert. 1977. Blank and salinity corrections for automated nutrient analysis of estuarine andseawaters. 7th Technicon International Congress: 48-56, Tarrytown, N.Y.
Macdonald, R.W. and F.A. McLaughlin. 1982. The effect of storage by freezing on dissolved inorganic phosphate,nitrate and reactive silicate for samples from coastal and estuarine waters. Water Research. 16: 95-104.
Salley, B.A., J.G. Bradshaw and B.J. Neilson. 1986. Results of comparative studies of preservation techniques fornutrient analysis on water samples. VIMS, Gloucester Point, VA., 23062. 32pp
Thayer, G.W. 1970. Comparison of two storage methods for the analysis of Nitrogen and Phosphorus fractions inestuarine water. Ches. Sci. 11:3, 155-158.
U.S. EPA. 1974. Methods for chemical analysis of water and wastes. Methods development and quality assuranceresearch laboratory. National environmental research center. Cincinnati, Ohio 45268.
Wood, E.D., F.A.G. Armstrong and F.A. Richards. 1967. Determination of nitrate in seawater by cadmium-copperreduction to nitrite. J. Mar. Biol. Assoc. U.K. 47: 23.
40 CFR, [part] 136 Appendix B. Definition and Procedure for the Determination of the Method Detection Limit.Revision 1.11.
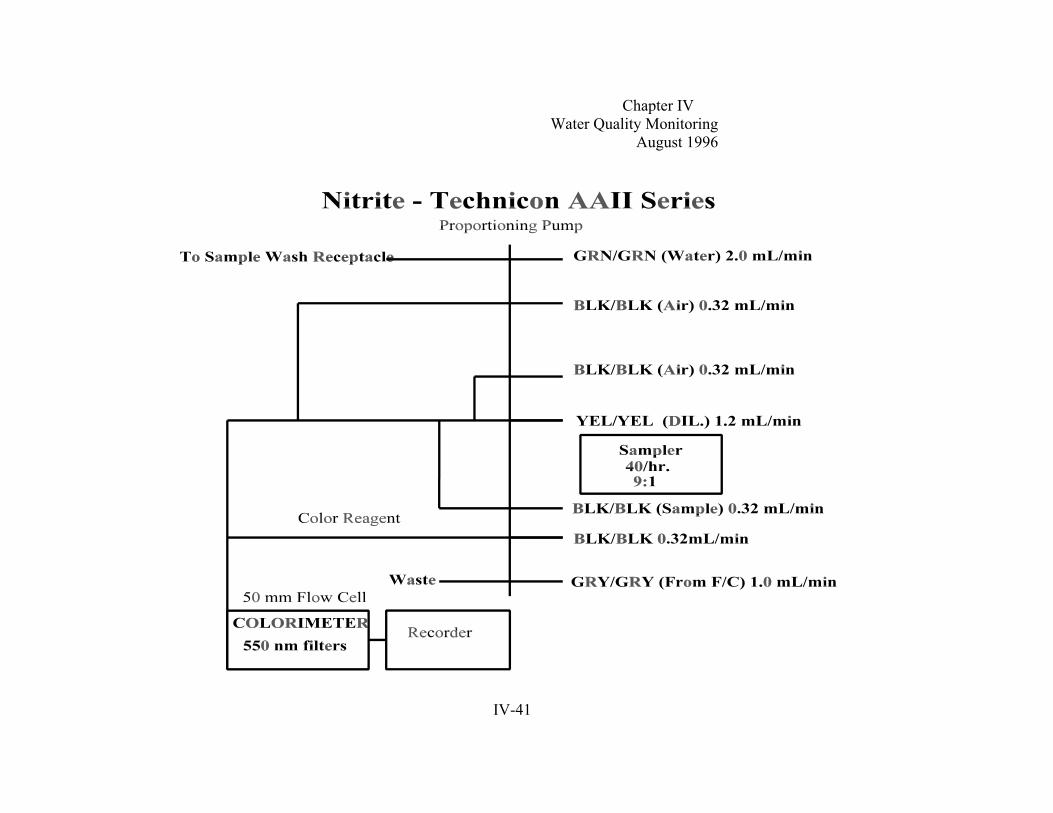
Chapter IV Water Quality Monitoring
August 1996
IV-41
Chapter IV Water Quality Monitoring
August 1996
IV-42
6. Nitrate + Nitrite
6.1 Scope and Application
6.1.1 This method provides a procedure for the determination of low level nitrite+nitrate concentrationsnormally found in estuarine and/or coastal waters using the cadmium reduction technique of Wood, etal., 1967.
6.1.2 A determined method detection limit (MDL) of 0.0002 mg N/L has been statistically determined byone laboratory. This MDL is defined as three times the standard deviation of at least seven replicatesof a low level estuarine (~15 parts per thousand salinity) sample. The method is linear to 0.070 mgN/L at a standard calibration setting of 9.0 on an AutoAnalyzer II system. Where higherconcentrations are encountered, the method is also linear at less sensitive standard calibration settings.
6.1.3 This method should be used by analysts experienced in the use of automated colorimetric analyses andmatrix interferences and procedures for their correction. A minimum of six months experience undersupervision is recommended.
6.2 Summary of Method
6.2.1 This is an automated colorimetric method for the analysis of low level nitrite+nitrate concentrations. Filtered samples are passed through a granulated copper cadmium column to reduce nitrate to nitrite. The nitrite originally present and the reduced nitrate are then determined by deoxidizing withsulfanilamide and coupling with N-1-naphthylethylenediamine dihydrochloride to form a colored azodye. The color produced is proportional to the nitrite+nitrate concentration present in the sample. Nitrite values are determined using the same method without the cadmium reduction column. Nitratevalues are calculated by subtracting the nitrite concentration from the previously determinednitrate+nitrite value.
6.3 Interferences
6.3.1 Concentrations of iron, copper and other metals above several milligrams per liter alter reductionefficiency. The presence of large concentrations of sulfide and/or sulfate will cause a loss ofsensitivity to the copper-cadmium column (EPA, 1977; Grasshoff, et al., 1983).
6.3.2 Sample turbidity should be removed by filtration prior to analysis.
6.3.3 Refractive Index and "Salt Error" interferences should be corrected for when analyzingestuarine/coastal samples by using the procedures included in this method.
6.4 Apparatus and Materials
6.4.1 Continuous flow automated analytical system equipped with an autosampler, manifold, proportioningpump, colorimeter, phototube and recorder or computer based data system.
6.4.2 Nitrogen-free glassware: All glassware used in the determination must be low in residual nitrate to
avoid sample/reagent contamination. Washing with 10% HCl and thoroughly rinsing with reagentwater have been found to be effective.
Chapter IV Water Quality Monitoring
August 1996
IV-43
6.5 Reagents
6.5.1 Stock Reagent Solutions
6.5.1.1 Ammonium Chloride Reagent: Dissolve 10.0 g of nitrate-free ammonium chloride(NH4Cl) in one liter of reagent water. Adjust to pH 8.5 by adding three to four NaOHpellets as necessary. Add 5 drops of 2% copper sulfate solution. No addition of EDTAis necessary. This reagent is stable for one week if kept refrigerated.
6.5.1.2 Color Reagent: Combine 1500 mL reagent water, 200.0 mL concentrated phosphoricacid (H3PO4), 20.0 g sulfanilamide, and 1.0 g N-1 napthylethylenediaminedihydrochloride. Dilute to 2000 mL with reagent water. Add 2.0 mL BRIJ-35 (Bran &Luebbe, Elmsford, N.Y.). Store at 4 ± 2°C in the dark. This should be prepared freshevery six weeks.
6.5.1.3 Copper Sulfate: Dissolve 2.0 g of copper sulfate (CuSO4•5H2O) in 90.0 mL of reagent
water. Bring up to 100 mL with reagent water.
6.5.1.4 Refractive Reagent: Combine 100 mL of concentrated phosphoric acid (H3PO4) with800 mL reagent water. Dilute to 1000 mL with reagent water. Add 1.0 mL BRIJ-35.
6.5.1.5 Stock Nitrate Solution: Dissolve 0.721 g of pre-dried (60 ± 2°C for 1 hour) potassium
nitrate (KNO3) in reagent water and dilute to 1000 mL. 1.0 mL = 0.100 mg N. Thestability of this stock standard is approximately 3 months, if kept refrigerated.
6.5.1.6 Stock Nitrite Solution: Dissolve 0.493 g pre-dried (60 ± 2°C for 1 hour) sodium nitrite(NaNO2) in reagent water and dilute to 1000 mL. 1.0 mL = 0.100 mg N. The stabilityof this stock standard is approximately 3 months, if kept refrigerated.
6.5.2 Reagent Grade Water:see section 1.9.
6.5.3 Substitute Ocean Water: see section 1.7
6.5.4 Cadmium preparation: The following description of cadmium and the column preparation is to beused as a general guideline. Other sizes and shapes of columns which provide equivalent results areacceptable. The ultimate goal is to obtain 100% reduction of nitrate to nitrite.
6.5.4.1 Use good quality cadmium filings. Depending on the reductor column shape and size,cadmium filings should generally be less than 0.5 mm but greater than 0.3 mm for glasscolumns and in the 25 - 60 mesh size range for columns prepared by using flexibletubing.
6.5.4.2 New cadmium filings should be rinsed with diethyl ether to remove dirt and grease. Approximately 10 g of this cadmium is then treated with 50 mL of 6N HCl in a 150 mLbeaker. Swirl VERY CAREFULLY for one minute.
6.5.4.3 Carefully decant the HCl and thoroughly rinse (at least 10 times) with reagent water. Decant the reagent water and add a 50 mL portion of 2% (w/v) copper sulfate solution.

Chapter IV Water Quality Monitoring
August 1996
IV-44
While swirling, brown flakes of colloidal copper will appear and the blue color of thesolution will fade. Decant and repeat this sequence several times until the blue colordoes not fade and a brown colloidal precipitate forms. To avoid contact with air, fromthis point on the fillings must be kept submerged at all times.
6.5.4.4 Immediately wash the filings thoroughly with reagent water until all blue color is goneand the supernatant is free of particulate matter (usually a minimum of 10 rinses isnecessary). The filings are now ready to be packed into the column.
6.5.4.5 Column preparation: Fill the reductor column with ammonium chloride reagent andtransfer the prepared cadmium filings to the column using a Pasteur pipette or employsome other method which avoids contact of the Cd particles with air. One end of thereductor column should be plugged with glass wool. Column shape and size varieswith users. Some examples include a 22 cm length of 0.110" ID tubing, a 35 cm lengthof 0.090" ID tubing, or a 3.5" length of glass tubing.
6.5.4.6 When the entire column is fairly well packed with granules, insert another glass woolplug at the top of the column and with reagents pumping through the system, attach thecolumn. Remember to have no air bubbles in the valve and to attach the column to theintake side of the valve first.
6.5.4.7 Check for good flow characteristics (regular bubble pattern) after the addition of airbubbles beyond the column. If the column is packed too tightly, an inconsistent flowpattern will be evident. Prior to sample analysis, condition the column by pumpingthrough the sample line approximately 1 mg N (nitrate)/L for five minutes followed by1 mg N (nitrite)/L for 10 minutes.
6.5.5 Secondary Nitrate Solution: Dilute 1.0 mL of stock nitrate solution to 100 mL with reagent water. 1.0mL of this solution = 0.001 mg N. Refrigerate and store no longer than 3 days.
6.5.6 Prepare a series of standards by diluting suitable volumes of secondary nitrate solution to 100 mL withreagent water. Prepare these standards daily. When working with samples of known salinity it isrecommended that the standard curve concentrations be prepared in substitute ocean water diluted tothat salinity and that the sampler wash solution also be low nutrient seawater diluted to that salinity. When analyzing samples of varying salinities, it is recommended that the standard curve be preparedin reagent water and refractive index corrections be made to the sample concentrations. The followingdilutions, brought up to 100 mL with reagent water, are suggested.
mL of standard nitrate solution0.51.02.04.06.0
Concentration (mg N/L)0.0050.0100.0200.0400.060
6.5.7 Saline Nitrate Standards: When analyzing samples of varying salinities, it is also recommended thatstandards be prepared in a series of salinities in order to quantify the "salt error," the shift in thecolorimetric response of nitrate due to the change in the ionic strength of the solution.
Chapter IV Water Quality Monitoring
August 1996
IV-45
6.5.8 Secondary Nitrite Solution: Dilute 1.0 mL of stock nitrite solution to 100 mL with reagent water. 1.0mL of this solution = 0.001 mg N. Refrigerate and store no longer than 3 days.
6.5.9 Working Nitrite Solution: One working standard must be prepared and used as a check on thereduction capability of the cadmium column. Dilute 6.0 mL of secondary nitrite solution to 100 mL toyield a concentration of 0.060 mg N/L.
6.6 Sample Handling
6.6.1 Samples must be analyzed as quickly as possible. If the samples are to be analyzed within 24 hours ofcollection, then refrigeration at 4 ± 2°C is acceptable.
6.6.2 If samples will not be analyzed within 24 hours of collection, the sample must be stored at -20 ± 2°Cfor a maximum of 28 days.
6.7 Procedure
6.7.1 Calibration: Prepare calibration curves using calibration standards that bracket the CBP samples.
6.7.2 Sample analysis
6.7.2.1 If samples have not been freshly collected and are frozen, thaw the samples to roomtemperature.
6.7.2.2 Allow both colorimeter and recorder to warm up for 30 minutes. Obtain a steady
baseline with reagent water pumping through the system, add reagents to the samplestream and after the reagent base line is steady, reset the "zero" if necessary.
6.7.2.3 A good sampling rate is approximately 40 samples/hr. with a 9:1 sample:wash ratio.
6.7.2.4 Analytical sequence: The samples and associated QC samples and standards should beanalyzed according to the following sequence.
6.7.2.4.1 Calibration standards in reagent water and saline water and workingnitrite standards in order of decreasing concentration. Two standardsof each composition and concentration should be analyzed.
6.7.2.4.2 Two method blanks.
6.7.2.4.3 Ten-twenty CBP samples.
6.7.2.4.4 One matrix spike sample.
6.7.2.4.5 One medium concentration calibration standard.
6.7.2.4.6 One method blank.
6.7.2.4.7 Steps 6.7.2.4.3 - 6.7.2.4.6 are repeated until all samples are analyzed

Chapter IV Water Quality Monitoring
August 1996
IV-46
or QC samples indicate that the system is out of control andrecalibration is necessary.
6.7.2.4.8 One standard of each composition and concentration in order ofdecreasing concentration.
6.7.2.5 The peak height of the 0.060 mg N/L nitrate standard prepared in deionized water mustbe equal to or greater than 90% of the peak height of the 0.060 mg N/L nitrite standard. If this criteria is not met, a fresh cadmium reduction column must be prepared andchecked before any CBP samples may be analyzed.
6.7.2.6 If a low concentration sample peak follows a high concentration sample peak, a certainamount of carry over can be expected. It is recommended that if there is not a clearlydefined low concentration peak, that the sample be reanalyzed.
6.7.3 Calculations
6.7.3.1 Concentrations of nitrite+nitrate are calculated from the linear regression obtained fromthe standard curve in which the concentrations of the standards are entered as theindependent variable and their corresponding peak heights are the dependent variable.
6.7.3.2 Refractive Index Correction For Estuarine/Coastal Systems
6.7.3.2.1 The absorbance peak obtained by an automated system for nitrate in aseawater sample (when compared to a reagent [deionized] waterbaseline) represents the sum of absorbances from at least foursources: (1) the light changes due to the differences in the index ofrefraction of the seawater and reagent water; (2) reaction products(e.g., precipitates) of BRIJ-35 and the seawater; (3) the absorbance ofcolored substances dissolved in the sample; and (4) reaction productsof the nitrite and the nitrate (reduced to nitrite by the cadmiumcolumn) in the sample with the color reagent (Loder and Glibert,1977). The first three sources of color are corrected for by therefractive index correction described here.
6.7.3.2.2 Obtain a second set of peak heights for all samples and standardswith refractive reagent being pumped through the system in place ofcolor reagent. All other reagents remain the same. Peak heights forthe refractive index correction must be obtained at the same standardcalibration setting and on the same colorimeter as the correspondingsamples and standards (Froelich and Pilson, 1978). Subtract thesepeak heights form the corresponding peak heights obtained with thecolor reagent.
6.7.3.3 Correction for Salt Error in Estuarine/Coastal Samples
6.7.3.3.1 When calculating concentrations of samples of varying salinities fromstandards prepared in reagent water, it is necessary to first correct for
Chapter IV Water Quality Monitoring
August 1996
IV-47
Refractive Index errors, then correct for the "Salt Error" alteration incolor development due to the ionic strength of the samples.
6.7.3.3.2 Use the CBPO software to generate a line with the salinity of thesaline standards as the independent variable (X variable) and theapparent concentration of nitrate (mg N/L) from the peak heightcorrected for refractive index as the dependent variable (Y variable)for all 0.060 mg N/L standards. The concentrations of the samples ofknown salinity are corrected for the color enhancement due to SaltError using the resulting regression.
6.7.3.4 Results should be reported in mg N/L.
6.8 Quality Control
6.8.1 Method detection limits (MDL): Method detection limits should be established using the guidelines inChapter II, Section D.
6.8.2 Calibration
6.8.2.1 Linear calibration range: Calibration standards should bracket the range of CBPsamples.
6.8.2.2 Correlation coefficient: The correlation coefficient must be 0.99 or better for thecalibration curve to be used.
6.8.3 Method blank: see Chapter II, Section C.
6.8.4 Matrix spike sample: see Chapter II, Section C.
6.8.5 Laboratory duplicate: see Chapter II, Section C.
6.8.6 Reference materials: The laboratory must analyze a standard reference material once a year, asavailable.
6.9 References
Froelich, P.N. and M.E.Q. Pilson. 1978. Systematic absorbance errors with Technicon AutoAnalyzer IIcalorimeters. Water Research 12: 599- 603.
Grasshoff, K., M. Ehrhardt and K. Kremling. 1983. Methods of Seawater Analysis. Verlag Chemie, FederalRepublic of Germany. 419 pp.
Klingamann, E.D. and D.W. Nelson. 1976. Evaluation of methods for preserving the levels of soluble inorganicphosphorus and nitrogen in unfiltered water samples. J. Environ. Qual. 5:1 42-46.
Loder, T.C. and P.M. Glibert. 1977. Blank and salinity corrections for automated nutrient analysis of estuarine andseawaters. 7th Technicon International Congress: 48-56, Tarrytown, N.Y.
Chapter IV Water Quality Monitoring
August 1996
IV-48
Macdonald, R.W. and F.A. McLaughlin. 1982. The effect of storage by freezing on dissolved inorganic phosphate,nitrate and reactive silicate for samples from coastal and estuarine waters. Water Research. 16: 95-104.
Salley, B.A., J.G. Bradshaw and B.J. Neilson. 1986. Results of comparative studies of preservation techniques fornutrient analysis on water samples. VIMS, Gloucester Point, VA., 23062. 32pp
Thayer, G.W. 1970. Comparison of two storage methods for the analysis of Nitrogen and Phosphorus fractions inestuarine water. Ches. Sci. 11:3, 155-158.
U.S. EPA. 1974. Methods for chemical analysis of water and wastes. Methods development and quality assuranceresearch laboratory. National environmental research center. Cincinnati, Ohio 45268.
Wood, E.D., F.A.G. Armstrong and F.A. Richards. 1967. Determination of nitrate in seawater by cadmium-copperreduction to nitrite. J. Mar. Biol. Assoc. U.K. 47: 23.
40 CFR, [part] 136 Appendix B. Definition and Procedure for the Determination of the Method Detection Limit.Revision 1.11.
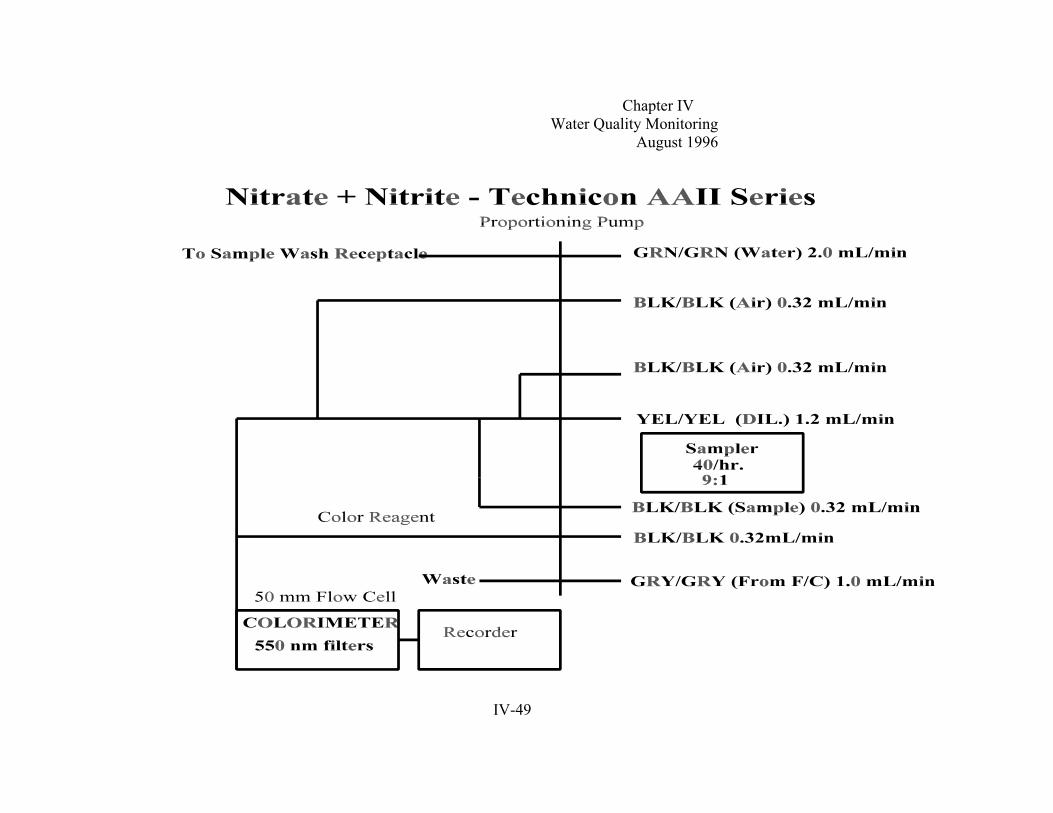
Chapter IV Water Quality Monitoring
August 1996
IV-49
Chapter IV Water Quality Monitoring
August 1996
IV-50
7. Ammonia
7.1 Scope and Application
7.1.1 This method covers the determination of ammonia in water by the automated phenate method in therange of 0.01 to 2.0 mg/L of NH4.
7.2 Summary of Method
7.2.1 Alkaline phenol and hypochlorite react with ammonia to form indophenol blue. The color intensity ofindophenol blue is proportional to the ammonia concentration. By adding sodium nitroprusside to themixture, the blue color is intensified for colorimetric measurements.
7.3 Interferences
7.3.1 Precipitation problems can occur if calcium and magnesium ions are present in sufficient amounts. Asodium potassium tartrate solution should be used to prevent this effect.
7.4 Apparatus and Materials
7.4.1 Continuous flow automated analytical system equipped with an autosampler, manifold, proportionalpump, colorimeter, phototube, recorder or computer based data system, and heating bath.
7.4.2 Appropriate glassware. see section 1.7
NOTE: Clean all glassware with soap and tap water, then rinse two times with 4N HCl and rinse 9times with reagent water.
7.4.3 Autoanalyzer cups. see section 1.7.3
7.5 Reagents
7.5.1 Reagent Water: see section 1.9
7.5.2 Complexing Reagent: To a one-liter volumetric flask, add approximately 750 Ml of reagent water. Dissolve 33 g of potassium sodium tartrate (KNaC4H4O6@4H2O) and 24 g of sodium citrate[HOC(COONa)(CH2COONa)2@2H2O]. Adjust the pH of this solution to 5.0 with concentrated sulfuricacid (H2SO4). Dilute to one liter with reagent water. Store at 4 ± 2°C.
7.5.3 Sodium Nitroprusside: Add approximately 900 mL of reagent water to a one-liter volumetric flask. Dissolve 0.5 g of sodium nitroprusside (Na2Fe(CN)5NO@2H2O) and dilute to one liter with reagentwater. Add Brij-35 only if necessary. Store in a dark bottle at 4 ± 2°C.
7.5.4 Sodium Hypochlorite Solution: To a one-liter volumetric flask, add 400 mL of reagent water. Add200 mL of a stock sodium hypochlorite solution containing 5.25% of chlorine (NaOCl) and dilute toone liter with reagent water. Add 6 drops of Brij-35. This solution is stable for one week if stored atroom temperature.
Chapter IV Water Quality Monitoring
August 1996
IV-51
7.5.5 Alkaline Phenol Solution: In a 500 mL volumetric flask, dissolve 41.5 g of phenol (C6H5OH) inapproximately 100 mL of reagent water. Make sure phenol is completely dissolved (it will be whiteand cloudy). Measure out 90 mL of 20% (w/v) of NaOH solution using a graduated cylinder and mixsolutions. The solution will turn clear. Dilute to 500 mL with reagent water and mix by inverting. Store in amber glass bottle. This solution should be prepared daily.
Caution: Phenol should be prepared every few days under a hood. It is an extremely dangerouschemical and should be handled accordingly.
7.5.6 Artificial Sea Water: see section 1.7
7.5.7 Wash Water: Dilute substitute ocean water to the average salinity of the samples being analyzed.
7.5.8 Sodium Hydroxide Solution: 20% (w/v), reagent grade.
7.5.9 Ammonia Stock Standard Solution: In a one-liter volumetric flask, add 200 mL of reagent water. Dissolve 0.3310 g of ammonium sulfate (NH4)2SO4, mix, and dilute to one liter. Add 1 mL ofconcentrated H2SO4 as a preservative. Store at 4 ± 2°C. This solution is stable for six months.
7.5.9.1 Ammonia Standard Solution A: In a 100 mL volumetric flask, add 50 mL of washwater solution. Add 2 mL of stock standard solution, mix, and dilute to volume withwash water solution. This solution should be prepared on the day of analysis. (1.0 mL= 1.4 mg NH3-N/L)
7.5.9.2 Ammonia Standard Solution B: In a 100 mL volumetric flask, add 50 mL of washwater solution. Add 10 mL of ammonia standard solution A, mix, and dilute to volumewith wash water solution. This solution should be prepared fresh on the day of theanalysis. (1.0 mL = 0.14 mg NH3-N/L).
7.6 Sample Handling
7.6.1 Samples are stored at -20 ± 2°C for a maximum 28 days.
Chapter IV Water Quality Monitoring
August 1996
IV-52
7.7 Procedure
7.7.1 Allow both the colorimeter and recorder to warm up for 30 minutes. Obtain a stable baseline withdeionized water pumping through the system, add reagents to the sample stream, and after the reagentbaseline is steady, reset the "zero" if necessary.
7.7.2 Prepare a series of standard solutions covering the concentration range of the samples by dilutingeither the stock or standard solutions of ammonium sulfate.
7.7.3 Analytical sequence: The samples and associated QC samples and standards should be analyzedaccording to the following sequence.
7.7.3.1 Five calibration standards with concentration within the linear range of the test.
7.7.3.2 Two method blanks.
7.7.3.3 Ten-twenty CBP samples.
7.7.3.4 One matrix spike sample.
7.7.3.5 One medium concentration calibration standard.
7.7.3.6 One method blank.
7.7.3.7 Steps 7.7.3.5 - 7.7.3.8 are repeated until are samples are analyzed or QC samplesindicate that the system is out of control and recalibration is necessary.
7.7.3.8 One high concentration calibration standard.
7.7.3.9 One medium concentration calibration standard.
7.7.3.10 One low concentration calibration standard.
7.7.4 Use CBP software to prepare an appropriate standard curve and to calculate the concentration of NH4. The blank background response should be subtracted from the standards before preparing the standardcurve.
7.8 Quality Control
7.8.1 Method detection limits (MDL): Method detection limits should be established using the guidelines inChapter II, Section D.
7.8.2 Calibration
7.8.2.1 Linear calibration range: Calibration standards should bracket the range of CBPsamples.
7.8.2.2 Correlation coefficient: The correlation coefficient must be 0.99 or better for the
Chapter IV Water Quality Monitoring
August 1996
IV-53
calibration curve to be used.
7.8.3 Method blank: see Chapter II, Section C.
7.8.4 Matrix spike sample: see Chapter II, Section C.
7.8.5 Laboratory duplicate: see Chapter II, Section C.
7.8.6 Reference materials: The laboratory must analyze a standard reference material once a year, asavailable.
7.9 References
Standard Methods for the Examination of Water and Wastewater, 14th Edition, p 410, Method 418A and 418B(1975).
Annual Book of ASTM Standards, Part 31, "Water", Standard D 1426-74, Method A, p 237 (1976).

Chapter IV Water Quality Monitoring
August 1996
IV-54

Chapter IV Water Quality Monitoring
August 1996
IV-55
8. Total Dissolved Nitrogen
8.1 Scope and Application
8.1.1 This method covers the determination of total dissolved nitrogen in estuarine water by the automatedpersulfate oxidation technique in the range of 0.01 to 2.0 mg/L of NO3+NO2-N.
8.2 Summary of Method
8.2.1 This method is a persulfate oxidation technique for nitrogen where, under alkaline conditions, allforms of nitrogen are oxidized to nitrite. This is followed by analysis for nitrate by an automatedcolorometric method (subsection 6). The inorganic fractions can then be subtracted from the totaldissolved sample to calculate the dissolved organic concentration, if desired.
8.3 Interferences
8.3.1 Metal ions may produce a positive nitrate error if present in sufficient concentrations. The presence oflarge concentrations of sulfate will cause a large loss of sensitivity to the copper-cadmium column.
8.3.2 Turbidity may interfere with this method if the sample has not been filtered.
8.4 Apparatus and Materials
8.4.1 Continuous flow automated analytical system equipped with an autosampler, manifold, proportionalpump, colorimeter, phototube, recorder or computer based data system, and heating bath.
8.4.2 Appropriate glassware. see section 1.7
8.4.3 Autoanalyzer cups. see section 1.7.3
8.5 Reagents
8.5.1 Reagent Grade Water: see section 1.9
8.5.2 Borate Buffer Solution: To a two liter volumetric flask, add approximately 800 mL of reagent water. Add 123.6 g of boric acid (H3BO3) and 16.16g of Low N sodium Hydroxide (NaOH) and dilute to twoLiters with reagent water. Stable for two months at room temperature.
8.5.3 Oxidizing Reagent: To a one-liter volumetric flask, add 400 mL of reagent water. Add 3.0 g of lownitrogen NaoH and 20.1 g of Baker Instra-analyzed potassium persulfate, dissolve, and dilute to oneliter with reagent water. Store in a glass reagent bottle. This solution is only stable for two hours atroom temperature.
8.5.4 Ammonium Chloride Preparation Water: Measure out two liters of reagent water with a graduatedcylinder into a clean 2-liter Erlenmeyer flask. Add a magnetic Teflon stirring bar. While stirring thewater, measure the pH. Adjust the pH to 8.5 by adding one drop of ammonium hydroxide. If thesolution becomes too acidic dilute the ammonium with water until the solution reaches a pH of 8.5.
Chapter IV Water Quality Monitoring
August 1996
IV-56
8.5.5 Ammonium Chloride Reagent: In a two-liter volumetric flask, measure out approximately 1.5 L ofammonium chloride preparation water. Add 20 g of ammonium chloride (NH4Cl) and 0.2 g ofdisodium EDTA, dissolve, and dilute to two liters with reagent water. Make sure the ammoniumchloride and EDTA are completely dissolved. Store in a glass bottle, add 1.0 mL of Brij-35, and 5drops of 2% copper sulfate (CuSO4) solution.
8.5.6 Color Reagent: In a one-liter volumetric flask, add 500 mL of reagent water. Add 100 mL ofconcentrated phosphoric acid H3PO4 and 10 g of sulfanilamide (C6H8N2O2S), dissolve the mixtureusing low heat if necessary. Add 0.5 g of N-1-naphthylethylenediamine dihydrochloride(C12H14N2@2HCl) and dissolve. Cool to room temperature then, dilute to one liter with reagent water. Pour into a plastic one-liter bottle and add 0.5 mL of Brij-35. Store in the dark at 4 ± 2°C. Thissolution is stable for one month at 4 ± 2°C.
8.5.7 Copper Sulfate Solution, 2% (w/v): In a one-liter volumetric flask, add 500 mL of reagent water. Add20.0 g of CuSO4, dissolve, and dilute to volume with reagent water. Store in a plastic bottle at roomtemperature. This solution is stable for two months.
8.5.8 Phosphoric Acid, 10%: In a 500-mL volumetric flask, add 400 mL of reagent water. Add 50 mL ofconcentrated phosphoric acid H3PO4, dissolve, and dilute to volume with reagent water. Add 0.25 mLof Brij-35. Store in a ground glass-stoppered glass bottle at room temperature.
8.5.9 Artificial Sea Water: see section 1.7
8.5.10 Wash Water: Dilute substitute ocean water to the average salinity of the samples being analyzed. Add4 mL of Brij-35 per liter. Make this solution daily.
8.5.11 Stock Glutamic Acid Standard: In a 500-mL volumetric flask, add 400 mL of reagent water. Add0.3705 g of glutamic acid (HOCOCH2CH2CH(NH2)COOH), mix, and dilute to volume with reagentwater. Add 0.5 mL of chloroform (under a hood) as a preservative. This solution is only stable for tenmonths at 4 ± 2°C.
8.5.11.1 Working Glutamic Acid Standard: In a 100-mL volumetric flask, add 50 mL of washwater solution. Add 0.5 mL of stock standard solution, mix, and dilute to volume withwash water solution. This solution should be prepared on the day of analysis. (1.0 mL= .3528 mg N/L)
8.5.12 Stock Nitrate Standard: In a one-liter volumetric flask, add 500 mL of reagent water. Add 0.7218 g ofpotassium nitrate (KNO3) that has been dried overnight at 103 ± 2°C (stored in a desiccator), mix, anddilute to volume with reagent water. Add 2 mL of chloroform (under a hood) as a preservative. Thissolution is only stable for six months at 4 ± 2°C.
8.5.13 Stock Nitrite Standard: In a 500-mL volumetric flask, add 400 mL of reagent water. Add 0.6160 g ofsodium nitrite (NaNO2) that has been dried overnight at 103 ± 2°C (stored in a desiccator), mix, anddilute to volume with reagent water. Add 2 mL of chloroform (under a hood) as a preservative. Thissolution is only stable for one month at 4 ± 2°C.
8.5.14 Column preparation:
Chapter IV Water Quality Monitoring
August 1996
IV-57
8.5.14.1 Treatment of cadmium: Approximately 7 g of cadmium are poured into a 125 mLErlenmeyer flask. Add enough 1N HCl to the flask to cover the cadmium, and swirl for10 seconds (do not exceed this allotted time). Quickly rinse the cadmium with ASTMtype II water until the solution is non-acidic (test with pH paper). Next, add 100 mLportions of 2% CuSO4 solution and swirl for 30 to 40 seconds. The cadmium will startto look very dark, the blue color will fade, and a brown colloidal precipitate forms. Pour off the 2% CuSO4. Wash the cadmium-copper with reagent water (at least tentimes) to remove all precipitated copper. The color of the cadmium so treated shouldbe black. Add ammonium chloride reagent to the flask so that it covers the cadmium. The cadmium can be capped tightly and stored this way or used immediately to make acolumn.
NOTE: When a cadmium column significantly loses its efficiency, or the ammoniumchloride the cadmium column is stored in appears cloudy, the column can be recleanedwith acid and recoated with copper sulfate according to the above directions, exceptthat it is only exposed to the copper sulfate for 15 seconds.
8.5.14.2 Packing the column: Disconnect the end of the plastic tubing which connects thecadmium column to the second set of mixing coils on the cartridges (farthest from thecolumn). Tape the end high enough so the ammonium chloride reagent will not leakout of the column. Unscrew the column from the cartridge, fill the column withammonium chloride, pack the column by adding small amounts of the treated cadmiumto it and tapping the column so the cadmium is packed without allowing the air into thecolumn.
8.6 Sample Handling
8.6.1 Samples are stored at -20 ± 2°C for a maximum 28 days.
8.7 Procedure
8.7.1 Sample preparation:
8.7.1.1 To each 30 mL screw cap test tube add 10 mL filtered sample. Add 10 mL reagentgrade water to 3 test tubes as blanks.
8.7.1.2 Pipet 5.0 mL of the oxidizing reagent in all tubes. Cap test tubes tightly and veryquickly due to volatilization. Include two oxidizing reagent blanks which contain onlythe oxidizing reagent.
NOTE: A precipitate will form with seawater samples which will not form with saline standardsprepared with NaCl. If standards are made with substitute ocean water the precipitate will form.
8.7.1.3 Autoclave samples at 100 - 110° (between 3-4 psi) for 30 minutes on the liquidautomatic cycle. No volatilization occurs after this point.
8.7.1.4 Remove tubes from autoclave and cool to room temperature (samples can berefrigerated for several days at this point if necessary to delay analysis).
Chapter IV Water Quality Monitoring
August 1996
IV-58
8.7.2 Add 1.0 mL of buffer solution to each tube. The pH of the sample should be around 2.5 after theaddition of buffer solution.
8.7.3 Allow both the colorimeter and recorder to warm up for 30 minutes. Obtain a stable baseline with allreagents, feeding reagent water through the sample line.
8.7.4 Screw the column onto the cartridge. Untape the other end, and reconnect it to the color reagent linein the 10% phosphoric acid reagent. Once an acceptable baseline has been acquired, place the colorreagent line into the color reagent.
8.7.5 Prepare a series of standard solutions covering the concentration range of the samples by dilutingeither the stock or standard solutions.
8.7.6 Analytical sequence: The samples and associated QC samples and standards should be run accordingto the following sequence.
8.7.6.1 Two high concentration calibration standards.
8.7.6.2 Two medium concentration calibration standards.
8.7.6.3 Two low concentration calibration standards.
8.7.6.4 Two method blanks.
8.7.6.5 Ten-twenty CBP samples.
8.7.6.6 One matrix spike sample.
8.7.6.7 One medium concentration calibration standard.
8.7.6.8 One method blank.
8.7.6.9 Steps 8.7.7.5 - 8.7.7.8 are repeated until are samples are analyzed or QC samplesindicate that the system is out of control and recalibration is necessary.
8.7.6.10 One high concentration calibration standard.
8.7.6.11 One medium concentration calibration standard.
8.7.6.12 One low concentration calibration standard.
8.7.7 Switch sample line from distilled water to sampler and begin analysis.
8.7.8 Prepare appropriate standard curve by plotting peak heights of processed standards against knownconcentrations. Compute concentration of the samples by comparing sample peak heights withstandard curve.
NOTE: Subtract the blank background response from the standards before preparing the standard
Chapter IV Water Quality Monitoring
August 1996
IV-59
curve.
8.7.9 Test the cadmium column efficiency by analyzing 2 cups of the 0.4 mg NO3-N/L standard followed byone cup of the 0.4 mg NO2-N/L standard. The column efficiency must be 90-110%. To ensure thatthe nitrate standards are correct, also analyze 2 cups of the EPA standard. Complete loading ofsampler tray with quality control and unknown samples.
8.7.10 Record the stabilized potential of each unknown sample and convert the potential reading to the TDNconcentration using the standard curve.
8.8 Quality Control
8.8.1 Method detection limits (MDL): Method detection limits should be established using the guidelines inChapter II, Section D.
8.8.2 Calibration
8.8.2.1 Linear calibration range: Calibration standards should bracket the range of CBPsamples.
8.8.2.2 Correlation coefficient: The correlation coefficient must be 0.99 or better for thecalibration curve to be used.
8.8.3 Method blank: see Chapter II, Section C.
8.8.4 Matrix spike sample: see Chapter II, Section C.
8.8.5 Laboratory duplicate: see Chapter II, Section C.
8.8.6 Reference materials: The laboratory must analyze a standard reference material once a year, asavailable.
8.9 References
Standard Methods for the Examination of Water and Wastewater, 14th Edition, p 427, Method 419D (1975).
Annual Book of ASTM Standards, Part 31, "Water", Standard D 3867, p 453 (1976).

Chapter IV Water Quality Monitoring
August 1996
IV-60
Chapter IV Water Quality Monitoring
August 1996
IV-61
8.10 Particulate Nitrogen
8.11 Scope and Application
8.12 This method covers the determination of particulate nitrogen in estuarine or sea water.
8.13 Summary of Method
8.13.1 The sample is filtered through a glass fiber filter and the filter is then placed in a combustion chamberfor analysis.
8.13.2 The nitrogen determination is made by burning the glass fiber filter in a closed system in the presenceof oxygen. The nitrogen in the sample is converted to molecular nitrogen (N2) and oxides of nitrogen(NOx) during the combustion. A carrier gas first transports the combustion products to a reductiontube where the NOx is converted to N2, and then to a thermal conductivity detector for measurement.
8.14 Apparatus and Materials
8.14.1 Carlo Erba NA 1500 Nitrogen/Carbon Analyzer, or other instrumentation.
8.14.2 Clean metal forceps.
8.14.3 Plastic syringe, 60 mL.
8.14.4 Filter holders with O-rings, 13 mm.
8.14.5 Dichromic acid washed DOC bottle.
8.14.6 Dichromic acid washed 50 mL graduated cylinder.
8.14.7 Glass transfer pipettes.
8.14.8 Desiccator.
8.14.9 Glass fiber filters, mm diameter, with a nominal pore size of 0.7 :m.
8.14.10 Muffle oven.
8.14.11 Analytical balance.
8.15 Reagents
8.15.1 Cleaning Solvents
8.15.1.1 Reagent Grade Water: see section 1.9.
Chapter IV Water Quality Monitoring
August 1996
IV-62
8.16 Sample Handling
8.16.1 Filter preparation
8.16.1.1 Whatman glass fiber filters, or equivalent, are placed in a metal crucible, looselyarranged.
8.16.1.2 Place filters in muffle oven for 1.5 hours at 550°C.
8.16.1.3 Remove from muffle oven, and cover crucible with aluminum foil until cool.
8.16.1.4 Place muffled filters in clean labeled petri dishes until use.
8.16.2 Sample preparation
8.16.2.1 Remove foil pouches containing sample filters from freezer and open them.
8.16.2.2 Put foil pouches in drying oven at 50 ± 1°C overnight.
8.16.2.3 Next day, remove foil pouches from oven, fold closed and desiccate until ready foranalysis.
8.16.2.4 Clean the metal forceps, and ANA metal sealing tray using reagent water and akimwipe. Never use acid on metal.
8.16.2.5 Using metal forceps, place a clean tin cup in filter loading devise.
8.16.2.6 With metal forceps remove glass fiber filter (sample) from the foil pouch, place in tincup
8.16.2.7 Place sample in nickel sleeve into auto sampler wheel an desicate until analysis.
8.17 Procedure
8.17.1 Standards and Standard Curve Equipment Preparation
8.17.1.1 Tin cups must always be handled with clean metal forceps. The forceps, metal ANAsealing plate and metal spatula must be rinsed with fresh reagent water and completelydried with Kimwipes. Always work on a clean aluminum foil-covered surfacewhenever handling standards or samples.
8.17.1.2 Calibrate the electronic microbalance at the 200 mg range each day prior to weighingany standards.
8.17.2 Standardization

Chapter IV Water Quality Monitoring
August 1996
IV-63
8.17.2.1 For PN analysis of glass fiber filters, Chloramine-T (N-chloro-p-toluenesulfonamidesodium salt) or other suitable standards are used as the standard. Standards shouldweigh approximately 0.05 to 2.0 mg.
8.17.2.2 Using metal forceps to handle tin cups, weigh a clean tin cup (see cleaning procedure,1.7.1) on calibrated microbalance, and tare the balance to eliminate the weight of thecup from the weight measurement.
8.17.2.3 Apply balance brake and remove cup. Place cup on clean ANA metal sealing plate andunfold cup somewhat.
8.17.2.4 Using a clean metal spatula, place approximately 0.05 to 2.0 mg Chloramine T into cupand, using forceps (2 pairs), seal tin cup.
8.17.2.5 Place sealed standard on microbalance, weigh, and record weight on data sheet.
8.17.2.6 For the standard curve, 3 blanks (empty clean tin cups), then 7 Chloramine T standardsof known weight are analyzed on the Carlo Erba C/N analyzer in conjunction with theCarlo Erba E.A.G.E.R. computer software.
8.17.2.7 Chloramine T standards in the standard curve are analyzed as STD sample types andCHLOR-T standard types. Blanks are analyzed as BLANK sample types.
8.17.2.8 If the correlation coefficient for the standard curve is below the minimum acceptablevalue, up to 2 standards and/or 1 blank may be omitted from the standard curve(minimum of 2 blanks and 5 standards are required for a standard curve). A standardcan be omitted by bypassing the standard in the sample table and recalculating thecurve.
8.17.3 Analysis of Glass Fiber Filter Samples
8.17.3.1 Set flow rates as outlined in the Carlo Erba NA 1500 Nitrogen/Carbon AnalyzerInstruction Manual. Set control panel parameters as follows:
Filament temperature 190°COxygen injection stop 67 secondsPeak enable 10 secondsCycle stop 410 seconds(this may need to be increased if carbon peak on Chromatogram isnot completed during cycle time).
8.17.3.2 Set autosampler tray with space #1 aligned with window on the front of theautosampler.
8.17.3.3 Place blanks and standards in spaces 1-10 of autosampler tray and, using the Carlo ErbaE.A.G.E.R. computer software, generate the standard curve.
8.17.3.4 After an acceptable standard curve has been generated, place one wrapped sample or
Chapter IV Water Quality Monitoring
August 1996
IV-64
standard in each space of the autosampler tray and, using the E.A.G.E.R. software, andanalyze the samples.
8.17.3.5 In order to demonstrate that the instrument was still in calibration at the end of theanalytical run, the last sample analyzed in any series of analyses must be a standard.
8.17.3.6 Samples will have a known volume of sample water filtered onto them. Divide thatvolume (in mL) by 10, and place this value in the sample weight column of the sampletable of the E.A.G.E.R. file.
8.17.3.7 The cycle time used in the E.A.G.E.R. program parameters should be 10 seconds longerthan the cycle stop time set on the C/N analyzer instrument panel.
8.18 Quality Control
8.18.1 The correlation coefficient of the calibration curve must $ 0.990.
8.18.2 Run a duplicate of each sample, and a Chloramine T standard after every 5 samples (sample and it'sduplicate count as one sample). If the samples are not all analyzed in duplicate, a minimum of oneduplicate must be analyzed after every 10 samples, and at least 2 duplicates must be analyzed peranalytical run.
8.18.3 The calibration check standards are analyzed as unknown sample types. Recovery must be within 90-110% of actual value. If recovery of a standard falls outside these limits, it is considered to be "out-of-control," and all samples analyzed after the last "in-control" standard must be reanalyzed.
8.18.4 Prepare and analyze at least two standards (2 "in-control" standards must occur consecutively beforeproceeding with analyses).
8.18.5 Re-prepare and reanalyze each sample which was analyzed after the last "in-control" standard.

Chapter IV Water Quality Monitoring
August 1996
IV-65
9. Particulate Carbon
9.1 Scope and Application
9.1.1 This method covers the determination of particulate carbon in estuarine or sea water.
9.2 Summary of Method
9.2.1 The sample is filtered through a glass fiber filter and the filter is then placed in a combustion chamberfor analysis.
9.2.2 The carbon determination is made by burning the glass fiber filter in a closed system in the presence ofoxygen. The carbon in the sample is converted to carbon dioxide during the combustion. A carriergas then transports the CO2 to a thermal conductivity detector for measurement.
9.3 Apparatus and Materials
9.3.1 Carlo Erba NA 1500 Nitrogen/Carbon Analyzer, or other instrumentation.
9.3.2 Clean metal forceps.
9.3.3 Plastic syringe, 60 mL.
9.3.4 Filter holders with O-rings, 13 mm.
9.3.5 Hydrochloric acid washed DOC bottle.
9.3.6 Hydrochloric acid washed 50 mL graduated cylinder.
9.3.7 Glass transfer pipettes.
9.3.8 Desiccator.
9.3.9 Muffle oven.
9.3.10 Analytical balance.
9.4 Reagents
9.4.1 Reagent Grade Water: see section 1.9.
9.5 Sample Handling
9.5.1 Filter preparation
NOTE:9.5.1.1 Whatman glass fiber filters are placed on aluminum foil in a muffle pan. Filters should
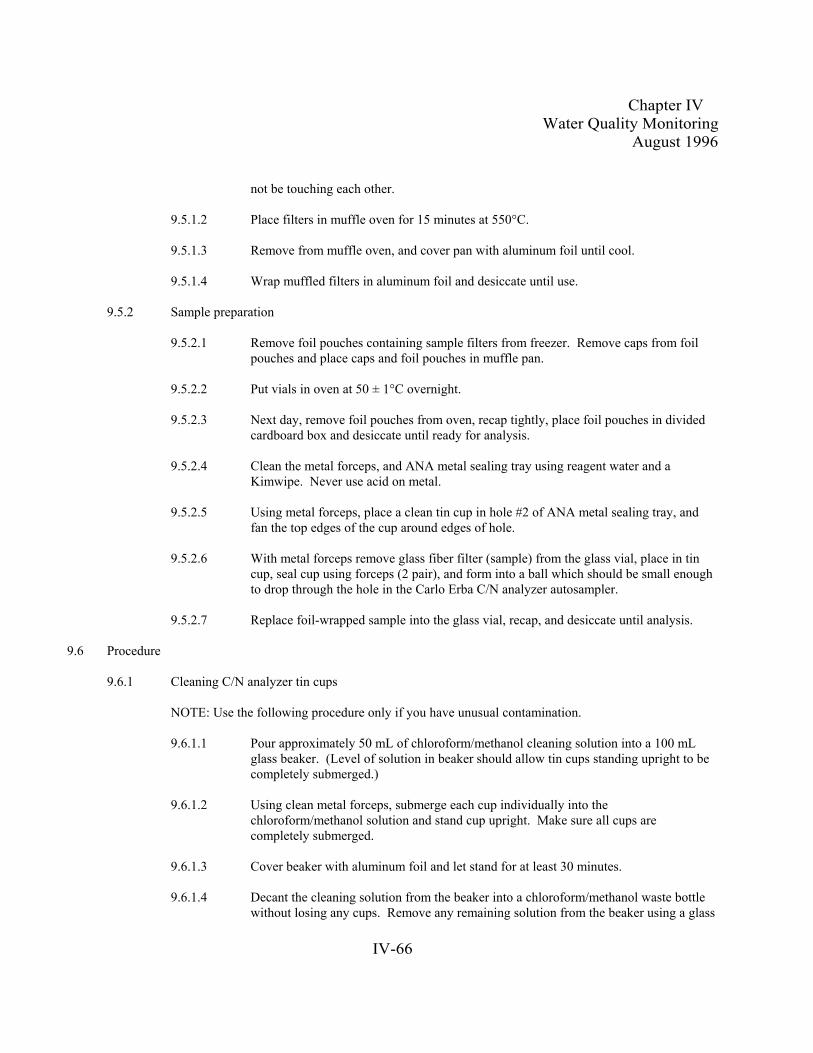
Chapter IV Water Quality Monitoring
August 1996
IV-66
not be touching each other.
9.5.1.2 Place filters in muffle oven for 15 minutes at 550°C.
9.5.1.3 Remove from muffle oven, and cover pan with aluminum foil until cool.
9.5.1.4 Wrap muffled filters in aluminum foil and desiccate until use.
9.5.2 Sample preparation
9.5.2.1 Remove foil pouches containing sample filters from freezer. Remove caps from foilpouches and place caps and foil pouches in muffle pan.
9.5.2.2 Put vials in oven at 50 ± 1°C overnight.
9.5.2.3 Next day, remove foil pouches from oven, recap tightly, place foil pouches in dividedcardboard box and desiccate until ready for analysis.
9.5.2.4 Clean the metal forceps, and ANA metal sealing tray using reagent water and aKimwipe. Never use acid on metal.
9.5.2.5 Using metal forceps, place a clean tin cup in hole #2 of ANA metal sealing tray, andfan the top edges of the cup around edges of hole.
9.5.2.6 With metal forceps remove glass fiber filter (sample) from the glass vial, place in tincup, seal cup using forceps (2 pair), and form into a ball which should be small enoughto drop through the hole in the Carlo Erba C/N analyzer autosampler.
9.5.2.7 Replace foil-wrapped sample into the glass vial, recap, and desiccate until analysis.
9.6 Procedure
9.6.1 Cleaning C/N analyzer tin cups
NOTE: Use the following procedure only if you have unusual contamination.
9.6.1.1 Pour approximately 50 mL of chloroform/methanol cleaning solution into a 100 mLglass beaker. (Level of solution in beaker should allow tin cups standing upright to becompletely submerged.)
9.6.1.2 Using clean metal forceps, submerge each cup individually into thechloroform/methanol solution and stand cup upright. Make sure all cups arecompletely submerged.
9.6.1.3 Cover beaker with aluminum foil and let stand for at least 30 minutes.
9.6.1.4 Decant the cleaning solution from the beaker into a chloroform/methanol waste bottlewithout losing any cups. Remove any remaining solution from the beaker using a glass
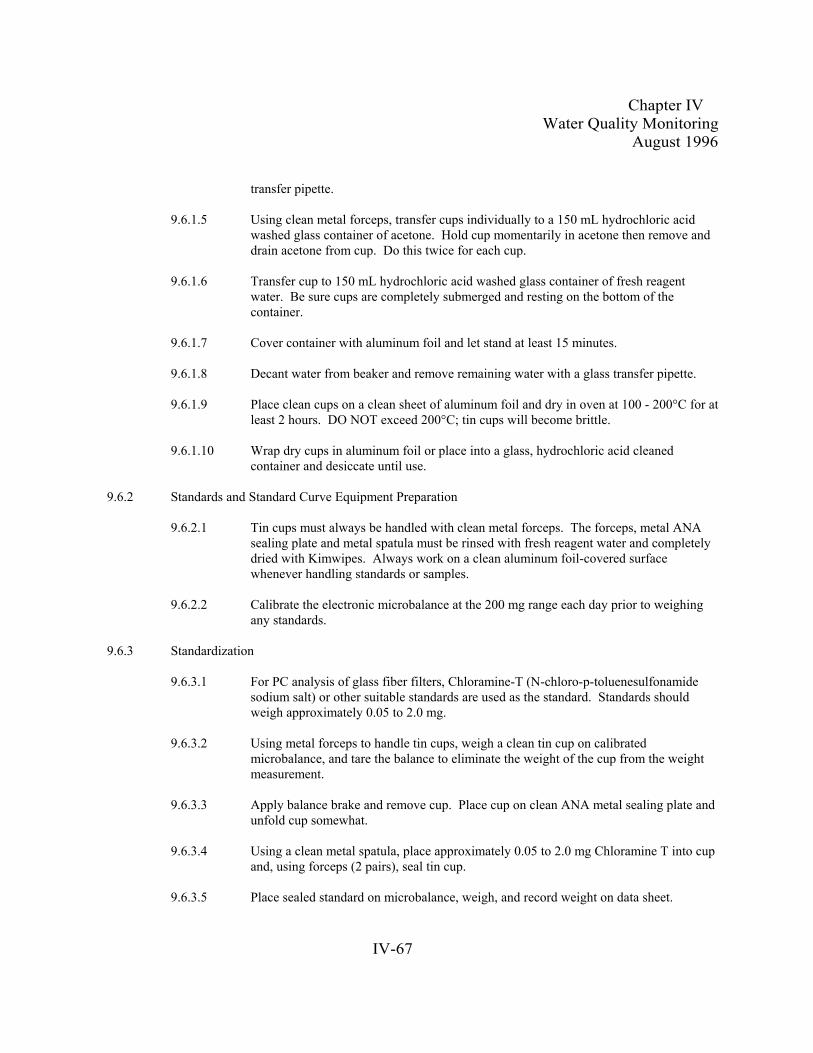
Chapter IV Water Quality Monitoring
August 1996
IV-67
transfer pipette.
9.6.1.5 Using clean metal forceps, transfer cups individually to a 150 mL hydrochloric acidwashed glass container of acetone. Hold cup momentarily in acetone then remove anddrain acetone from cup. Do this twice for each cup.
9.6.1.6 Transfer cup to 150 mL hydrochloric acid washed glass container of fresh reagentwater. Be sure cups are completely submerged and resting on the bottom of thecontainer.
9.6.1.7 Cover container with aluminum foil and let stand at least 15 minutes.
9.6.1.8 Decant water from beaker and remove remaining water with a glass transfer pipette.
9.6.1.9 Place clean cups on a clean sheet of aluminum foil and dry in oven at 100 - 200°C for atleast 2 hours. DO NOT exceed 200°C; tin cups will become brittle.
9.6.1.10 Wrap dry cups in aluminum foil or place into a glass, hydrochloric acid cleanedcontainer and desiccate until use.
9.6.2 Standards and Standard Curve Equipment Preparation
9.6.2.1 Tin cups must always be handled with clean metal forceps. The forceps, metal ANAsealing plate and metal spatula must be rinsed with fresh reagent water and completelydried with Kimwipes. Always work on a clean aluminum foil-covered surfacewhenever handling standards or samples.
9.6.2.2 Calibrate the electronic microbalance at the 200 mg range each day prior to weighingany standards.
9.6.3 Standardization
9.6.3.1 For PC analysis of glass fiber filters, Chloramine-T (N-chloro-p-toluenesulfonamidesodium salt) or other suitable standards are used as the standard. Standards shouldweigh approximately 0.05 to 2.0 mg.
9.6.3.2 Using metal forceps to handle tin cups, weigh a clean tin cup on calibratedmicrobalance, and tare the balance to eliminate the weight of the cup from the weightmeasurement.
9.6.3.3 Apply balance brake and remove cup. Place cup on clean ANA metal sealing plate andunfold cup somewhat.
9.6.3.4 Using a clean metal spatula, place approximately 0.05 to 2.0 mg Chloramine T into cupand, using forceps (2 pairs), seal tin cup.
9.6.3.5 Place sealed standard on microbalance, weigh, and record weight on data sheet.
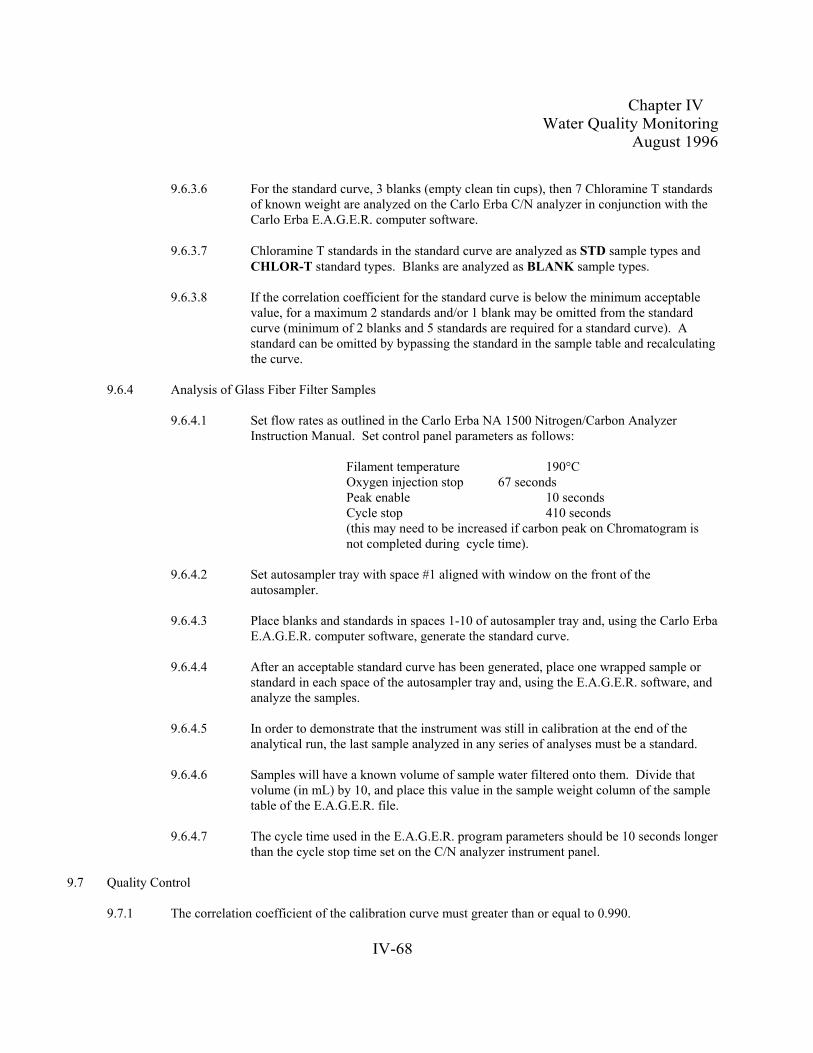
Chapter IV Water Quality Monitoring
August 1996
IV-68
9.6.3.6 For the standard curve, 3 blanks (empty clean tin cups), then 7 Chloramine T standardsof known weight are analyzed on the Carlo Erba C/N analyzer in conjunction with theCarlo Erba E.A.G.E.R. computer software.
9.6.3.7 Chloramine T standards in the standard curve are analyzed as STD sample types andCHLOR-T standard types. Blanks are analyzed as BLANK sample types.
9.6.3.8 If the correlation coefficient for the standard curve is below the minimum acceptablevalue, for a maximum 2 standards and/or 1 blank may be omitted from the standardcurve (minimum of 2 blanks and 5 standards are required for a standard curve). Astandard can be omitted by bypassing the standard in the sample table and recalculatingthe curve.
9.6.4 Analysis of Glass Fiber Filter Samples
9.6.4.1 Set flow rates as outlined in the Carlo Erba NA 1500 Nitrogen/Carbon AnalyzerInstruction Manual. Set control panel parameters as follows:
Filament temperature 190°COxygen injection stop 67 secondsPeak enable 10 secondsCycle stop 410 seconds(this may need to be increased if carbon peak on Chromatogram isnot completed during cycle time).
9.6.4.2 Set autosampler tray with space #1 aligned with window on the front of theautosampler.
9.6.4.3 Place blanks and standards in spaces 1-10 of autosampler tray and, using the Carlo ErbaE.A.G.E.R. computer software, generate the standard curve.
9.6.4.4 After an acceptable standard curve has been generated, place one wrapped sample orstandard in each space of the autosampler tray and, using the E.A.G.E.R. software, andanalyze the samples.
9.6.4.5 In order to demonstrate that the instrument was still in calibration at the end of theanalytical run, the last sample analyzed in any series of analyses must be a standard.
9.6.4.6 Samples will have a known volume of sample water filtered onto them. Divide thatvolume (in mL) by 10, and place this value in the sample weight column of the sampletable of the E.A.G.E.R. file.
9.6.4.7 The cycle time used in the E.A.G.E.R. program parameters should be 10 seconds longerthan the cycle stop time set on the C/N analyzer instrument panel.
9.7 Quality Control
9.7.1 The correlation coefficient of the calibration curve must greater than or equal to 0.990.

Chapter IV Water Quality Monitoring
August 1996
IV-69
9.7.2 Run a duplicate of each sample, and a Chloramine T standard after every 5 samples (sample and it'sduplicate count as one sample). If the samples are not all analyzed in duplicate, a minimum of oneduplicate must be analyzed after every 10 samples, and at least 2 duplicates must be analyzed peranalytical run.
9.7.3 The calibration check standards are analyzed as unknown sample types. Recovery must be within 90-110% of actual value. If recovery of a standard falls outside these limits, it is considered to be "out-of-control," and all samples analyzed after the last "in-control" standard must be reanalyzed.
9.7.4 Prepare and analyze at least two standards (2 "in-control" standards must occur consecutively beforeproceeding with analyses).
9.7.5 Re-prepare and reanalyze each sample which was analyzed after the last "in-control" standard.
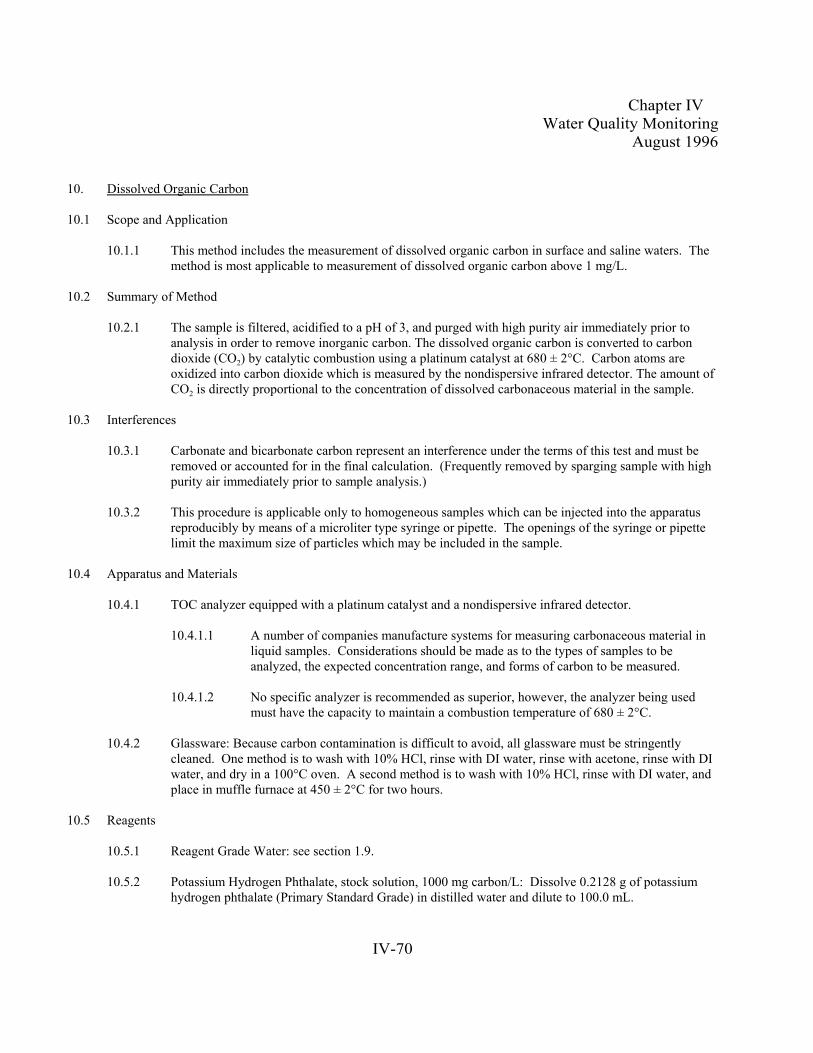
Chapter IV Water Quality Monitoring
August 1996
IV-70
10. Dissolved Organic Carbon
10.1 Scope and Application
10.1.1 This method includes the measurement of dissolved organic carbon in surface and saline waters. Themethod is most applicable to measurement of dissolved organic carbon above 1 mg/L.
10.2 Summary of Method
10.2.1 The sample is filtered, acidified to a pH of 3, and purged with high purity air immediately prior toanalysis in order to remove inorganic carbon. The dissolved organic carbon is converted to carbondioxide (CO2) by catalytic combustion using a platinum catalyst at 680 ± 2°C. Carbon atoms areoxidized into carbon dioxide which is measured by the nondispersive infrared detector. The amount ofCO2 is directly proportional to the concentration of dissolved carbonaceous material in the sample.
10.3 Interferences
10.3.1 Carbonate and bicarbonate carbon represent an interference under the terms of this test and must beremoved or accounted for in the final calculation. (Frequently removed by sparging sample with highpurity air immediately prior to sample analysis.)
10.3.2 This procedure is applicable only to homogeneous samples which can be injected into the apparatusreproducibly by means of a microliter type syringe or pipette. The openings of the syringe or pipettelimit the maximum size of particles which may be included in the sample.
10.4 Apparatus and Materials
10.4.1 TOC analyzer equipped with a platinum catalyst and a nondispersive infrared detector.
10.4.1.1 A number of companies manufacture systems for measuring carbonaceous material inliquid samples. Considerations should be made as to the types of samples to beanalyzed, the expected concentration range, and forms of carbon to be measured.
10.4.1.2 No specific analyzer is recommended as superior, however, the analyzer being usedmust have the capacity to maintain a combustion temperature of 680 ± 2°C.
10.4.2 Glassware: Because carbon contamination is difficult to avoid, all glassware must be stringentlycleaned. One method is to wash with 10% HCl, rinse with DI water, rinse with acetone, rinse with DIwater, and dry in a 100°C oven. A second method is to wash with 10% HCl, rinse with DI water, andplace in muffle furnace at 450 ± 2°C for two hours.
10.5 Reagents
10.5.1 Reagent Grade Water: see section 1.9.
10.5.2 Potassium Hydrogen Phthalate, stock solution, 1000 mg carbon/L: Dissolve 0.2128 g of potassiumhydrogen phthalate (Primary Standard Grade) in distilled water and dilute to 100.0 mL.
Chapter IV Water Quality Monitoring
August 1996
IV-71
NOTE: Sodium oxalate and acetic acid are not recommended for stock solutions.
10.5.3 Potassium Hydrogen Phthalate, standard solutions: Prepare at least four standard solutions from thestock solution by dilution with distilled water and add 4 mL of 6 N HCl/liter to each.
10.5.4 Carbonate-bicarbonate, standard solution: Prepare a series of standards similar to step 10.5.3. Aminimum of three standards and a blank must be used for calibration.
NOTE: This standard is not required by some instruments.
10.5.5 Blank Solution: Use the same distilled water (or similar quality water) used for the preparation of thestandard solutions.
10.5.6 Hydrochloric Acid (HCl), 6N.
10.6 Sample Handling
10.6.1 Samples must be acidified to a pH of less then or equal to 3 with H2SO4 or HCland stored at 4 ± 2°C ifthe sample will be analyzed within 28 days. If the sample will not be analyzed within 28 days, freezethe sample prior to acidification and store it at -20 ± 2°C.
10.6.2 Sampling and storage of samples in glass bottles is preferable. Sampling and storage in plastic bottlessuch as conventional polyethylene and cubitainers is permissible if it is established that the containersdo not contribute contaminating organics to the samples or alter the carbon concentration. Someplastics actually absorb carbon out of samples.
NOTE: A brief study performed in an EPA Laboratory indicated that distilled water stored innew, one quart cubitainers did not show any increase in organic carbon after two weeksexposure.
10.6.3 Because of the possibility of oxidation or bacterial decomposition of some components of aqueoussamples, the lapse of time between collection of samples and start of analysis should be kept to aminimum. Also, samples should be kept cool (4 ± 2°C) and protected from sunlight and atmosphericoxygen.
10.7 Procedure
10.7.1 The pH of the filtered samples is adjusted to less than 3 using 6N HCl.
NOTE: Under normal conditions, the sample should arrive at the laboratory as a filtrate. TheContractor
shall ensure that all DOC samples have been filtered as required for the analysis.
10.7.2 The compressed air is turned on and the TOC Analyzer is allowed to come to steady state at 680 ± 2°Cand in accordance with manufacturer's specifications.
10.7.3 Set conditions for automated analysis per manufacturer's specifications.

Chapter IV Water Quality Monitoring
August 1996
IV-72
10.7.4 Check syringe position with injection port, make sure compressed air is on, and make sure SPARGEswitch is on if sparging is required.
10.7.5 For calibration of the instrument, it is recommended that a series of at least four to five standardsencompassing the expected concentration range of the samples be used.
10.7.6 Follow manufacturer's instructions for calibration.
10.7.7 Analytical sequence: The following sequence is reccommended for sample analysis.
10.7.7.1 Four to five calibration standards with concentrations within the linear range of the test.
10.7.7.2 Two method blanks.
10.7.7.3 Ten CBP samples.
10.7.7.4 One matrix spike sample and one sample duplicate.
10.7.7.5 One medium concentration calibration standard.
10.7.7.6 One method blank.
10.7.7.7 Steps 10.7.7.3 - 10.7.7.6 are repeated until are samples are analyzed or QC samplesindicate that the system is out of control and recalibration is necessary.
10.7.7.8 One high concentration calibration standard.
10.7.7.9 One medium concentration calibration standard.
10.7.7.10 One low concentration calibration standard.
10.8 Quality Control
10.8.1 Method detection limits (MDL): Method detection limits should be established using the guidelines inChapter II, Section E.
10.8.2 Calibration
10.8.2.1 Linear calibration range: Calibration standards should bracket the range of CBPsamples.
10.8.2.2 Correlation coefficient: The correlation coefficient must be 0.99 or better for thecalibration curve to be used.
10.8.3 Method blank: see Chapter II, section D.
10.8.4 Matrix spike sample: see Chapter II, section D.
Chapter IV Water Quality Monitoring
August 1996
IV-73
10.8.5 Reference materials: The laboratory must analyze a standard reference material once a year, asavailable.
10.8.6 All CBP samples must be analyzed a minimum of two times.
10.9 References
Annual Book of ASTM Standards, Part 31, "Water", Standard D 2574-79, p 469 (1976).
Standard Methods for the Examination of Water and Wastewater, 14th Edition, p 532, Method 505, (1975).
Chapter IV Water Quality Monitoring
August 1996
IV-74
11. Biochemical Oxygen Demand, 5 Day
11.1 Scope and Application
11.1.1 The 5-day Biochemical Oxygen Demand (BOD5) determination is an empirical test in whichstandardized laboratory procedures are used to determine the relative oxygen requirements of surfacewaters, wastewaters, effluents, and polluted waters. This test measures the amount of oxygen usedover a 5-day incubation period for the biochemical degradation of organic material (carbonaceousdemand) and the oxygen used to oxidize inorganic material such as sulfides and ferrous iron. It alsomay measure the oxygen used to oxidize reduced forms of nitrogen (nitrogenous demand) unless theiroxidation is prevented by an inhibitor.
11.2 Summary of Method
11.2.1 Upon arrival in the laboratory, each BOD5 sample is brought to approximately 20°C. Sample dilutionsare made so as to approximate a final DO of at least 1 mg/L and a DO uptake of at least 2 mg/L. Diluted samples are neutralized and treated with a nitrification inhibitor, if required, and an initialdissolved oxygen (DO) reading is taken and recorded for each sample. The BOD bottles are sealedwith DI water, capped, and incubated at 20 ± 1°C for a period of 5 days. After the 5-day incubationperiod, a final DO reading is made and the BOD5 is calculated from the difference between the initialand final DO.
11.3 Interferences
11.3.1 Nitrogenous oxygen demand as a result of the oxidation of reduced forms of nitrogen bymicroorganisms is the most common interference in determining BOD5 values.
11.3.1.1 The extent of nitrogenous demand during the 5-day incubation period depends on thepresence of microorganisms capable of carrying out the oxidation.
11.3.1.2 Nitrogenous oxygen demand can be prevented by the use of an inhibitory chemical. Ifan inhibitory chemical is not used, the oxygen demand measured is the sum ofcarbonaceous (CBOD5) and nitrogenous (NBOD5) demands.
11.3.2 Because the BOD5 test is a bioassay, its results can be influenced greatly by the presence of toxicantssuch as residual chlorine and heavy metals. Care should be taken in the cleaning of glassware andsample containers, and in the preparation of reagents.
11.3.3 Photosynthetic production of DO may also influence BOD5 results. Care should be taken to store andincubate BOD5 samples in the dark.

Chapter IV Water Quality Monitoring
August 1996
IV-75
11.4 Apparatus and Materials
11.4.1 Incubation bottles, 250- or 300-mL glass-stoppered BOD bottles with plastic caps. Clean bottles,stoppers, and caps with a laboratory detergent, rinse thoroughly, and drain before use.
11.4.2 Air incubator, thermostatically controlled at 20 ± 1°C.
11.4.3 DO meter and probe, calibrated.
11.5 Reagents
NOTE: Discard reagents that show any sign of biological growth.
11.5.1 Phosphate Buffer Solution: pH 7.
11.5.2 Nitrification Inhibitor: 2-chloro-6-(trichloro methyl) pyridine.
11.5.3 Glucose-Glutamic Acid Solution: Dry reagent grade glucose and reagent grade glutamic acid at 103 ±2°C for 1 hour. Add 150 mg glucose and 150 mg glutamic acid to distilled water and dilute to 1 L. Prepare fresh before each use.
11.5.4 Magnesium Sulfate Solution: Dissolve 22.5 g MgSO4•7H2O in distilled water and dilute to 1 L.
11.5.5 Calcium Chloride Solution: Dissolve 27.5 g CaCl2 in distilled water and dilute to 1 L.
11.5.6 Ferric chloride solution: Dissolve 0.25 g FeCl3•6H2O in distilled water and dilute to 1 L.
11.5.7 Acid and alkali solutions, 1N, for neutralizing caustic or acidic samples:
11.5.7.1 Acid: Slowly and while stirring, add 28 mL concentrated sulfuric acid (H2SO4) todistilled water. Dilute to 1 L.
11.5.7.2 Alkali: Dissolve 40 g sodium hydroxide (NaOH) in distilled water. Dilute to 1 L.
11.5.8 Dilution water: Place the desired amount of ASTM type II water (see section 1.9) in a suitablecontainer. For every liter of water add 1 mL each of phosphate buffer, MgSO4, CaCl2, and FeCl3solutions. Before use bring to 20 ± 2°C and saturate with DO by shaking in a partially filled bottle orby aerating with organic-free filtered air.
11.6 Sample Handling
11.6.1 Sample holding time: The recommended holding time is 6 hours or less. The maximum allowableholding time is 48 hours from sample collection.
11.6.2 Sample preservation and storage: Samples for BOD5 analysis may degrade significantly duringstorage and analysis, resulting in low BOD5 values.
11.6.2.1 If analysis is not started within 2 hours of collection, keep samples in the dark and at 4
Chapter IV Water Quality Monitoring
August 1996
IV-76
± 2°C.
11.6.2.2 If analysis is started within 2 hours of collection, cold storage is unnecessary.
11.7 Procedure
11.7.1 Sample preparation
11.7.1.1 Allow the samples to stabilize to 20 ± 2°C.
11.7.1.2 Neutralize samples to pH 6.5 to 7.5 with either the 1N H2SO4 solution or the 1N NaOHsolution.
11.7.1.3 Using the dilution water from 12.5.8, make several dilutions of each sample to obtain afinal DO of at least 1 mg/L and a DO uptake of at least 2 mg/L. Dilutions may be madedirectly in the BOD bottles by adding the desired volume of sample and filling theBOD bottle to about 2/3 with dilution water. Experience with the samples fromspecific monitoring stations may permit use of a smaller number of dilutions. Ingeneral, dilutions of 25 to 100 percent may be needed.
11.7.1.4 For each sample dilution, pour approximately 200 mL of the diluted sample into acleaned BOD bottle and add 3 mg 2-chloro-6-(trichloro methyl) pyridine.
11.7.1.5 Fill the BOD bottle to the top with either dilution water or diluted sample, dependingon whether the dilution was made in the BOD bottle or in a graduated cylinder.
11.7.2 Initial DO measurement
11.7.2.1 Using a calibrated DO meter and probe, measure and record the DO for each field andQC sample.
11.7.2.2 Reduce the DO in samples containing more than 9 mg DO/L at 20 ± 2°C by vigorousshaking or by aeration with clean, filtered compressed air. Measure and record the DOfor the sample.
11.7.2.3 Rinse the DO electrode between determinations to prevent cross-contamination ofsamples.
11.7.3 Incubation
11.7.3.1 Replace any displaced contents and gently insert the glass stopper so that it displaces allair, leaving no bubbles.
11.7.3.2 Cap and water-seal the stoppered bottle and incubate for 5 days at 20 ± 1°C.
11.7.4 Final DO measurement
11.7.4.1 Using a calibrated DO meter and probe, measure and record the DO for each field and

Chapter IV Water Quality Monitoring
August 1996
IV-77
(Eq. IV.21)
QC sample.
11.8 Quality Control
11.8.1 Glucose-glutamic acid check
11.8.1.1 Check dilution water quality and analytical technique at a frequency of no less thanonce every six months.
11.8.1.2 Determine BOD5 at 20 ± 1°C for a 2 percent dilution of the glucose-glutamic acidstandard check solution using the same techniques used to determine BOD5 for the CBPsamples.
11.8.2 Method detection limits (MDL): Method detection limits should be established using the guidelines inChapter II, Section D.
11.8.3 Calibration
11.8.3.1 Linear calibration range: Calibration standards should bracket the range of CBPsamples.
11.8.3.2 Correlation coefficient: The correlation coefficient must be 0.99 or better for thecalibration curve to be used.
11.8.4 Method blank: The laboratory must analyze method blanks of both substitute ocean water and reagentwater at a minimum of every 10 CBP samples. Method blank data are used to assess contaminationfrom the laboratory environment. If the concentration of analyte in the reagents blank exceeds theMDL, then laboratory or reagent contamination should be suspected. If the analyte concentration is 5times the MDL or greater, then corrective action is required and reanalysis if possible.
11.8.5 Matrix spike sample: The laboratory should add a known amount of analyte to a minimum of 10% ofthe routine samples or one sample per sample set, whichever is greater. The analyte concentrationshould be high enough to be seen above the original concentration of the sample and should not be lessthan four times the calculated minimum detectable concentration.
11.8.5.1 Calculate the percent recovery of analyte from the matrix spike sample using thefollowing equation:

Chapter IV Water Quality Monitoring
August 1996
IV-78
(Eq. IV.22)
where,
SSR = Spike sample resultSR = Sample resultSA = Spike added
11.8.5.2 If the recovery of the analyte falls outside the designated range, repeat the spike afterchecking for obvious sources of error. If the recovery of the replicated spike of thesame sample again falls outside the designated range, the recovery problemencountered with the spiked sample is judged to be matrix related, not system relatedand no further corrective action is required.
11.8.6 Laboratory duplicate: A laboratory duplicate must be analyzed once for every 10 CBP samples.
11.8.6.1 The precision is measured by calculating the coefficient of variation (CV) using thefollowing equation:
where,
CV = Coefficient of variationSD = Standard deviationMean = Mean of the replicate readingsN = Number of samples
11.8.6.2 If the CV does not fall within the control limits listed in Table II.1, corrective actionshould be taken.
11.8.7 Reference materials: The laboratory must analyze a standard reference material once a year, asavailable.
11.9 References
American Public Health Association. 1989. Standard Methods for the Examination of Water and Wastewater,17th Edition.
Chapter IV Water Quality Monitoring
August 1996
IV-79
12. Chlorophyll and Phaeophytin
12.1 Scope and Application
12.1.1 This spectrophotometric method is used in the determination of chlorophyll a, b, and c, phaeophytin-a,and carotenoids. This method can be used to estimate phytoplankton biomass.
12.2 Summary of Method
12.2.1 The reference for this method is ASTM Method D3731-79. In brief, algal cells are ground in aqueousacetone to extract the pigments. The extract is analyzed using a spectrophotometer to measure theabsorbances at the correct wavelengths.
12.3 Apparatus and Materials
12.3.1 Laboratory coat: worn at all times and with an apron when handling acids.
12.3.2 Protective eyewear: worn at all times.
12.3.3 PVC gloves: worn at all times.
12.3.4 Glass fiber filter: Whatman GF/F or equivalent.
12.3.5 Centrifuge.
12.3.6 Dual beam spectrophotometer: or scanning spectrophotometer with matched cuvettes.
12.3.7 Tissue Grinder.
12.3.8 Filtration Apparatus
12.4 Reagents
12.4.1 Solvents:
12.4.1.1 Hydrochloric acid (1N), Hcl.
12.4.1.2 Sodium bicarbonate solution (1N), (NaH(CO3)2), dissolve 8.4 g sodium bicarbonate in100 mL water.
12.4.1.3 Magnesium carbonate suspension, (MgCO3), add 1 g finely powdered magnesiumcarbonate to 100 Ml water.
12.4.1.4 Aqueous acetone (90%), add 1 part water to 9 parts of reagent grade acetone, add 5drops of NaH(CO3)2 solution to every volume, made within 24-48 hours of time of use.
12.4.2 Reagent Grade Water: See section 1.9.
Chapter IV Water Quality Monitoring
August 1996
IV-80
12.4.2.1 Reference standards: use EPA SRM reference standards if provided.
12.5 Sample Handling
12.5.1 After the addition of magnesium carbonate, samples can be held for 24 hours at 0-4°C. The extractcan be store at -20 ± 2°C for a maximum 30 days.
12.6 Filtration Procedure
12.6.1 Using a 47 mm GF/F, Pour a measured amount of well mixed sample (typically 500ml) through filter. Apply vacuum to complete filtration process.
12.6.2 Add approximately 1 ml of Magnesium Carbonate Suspension and apply vacuum to dryness.
12.6.3 Release vacuum and remove filter. Store as required. Record sample volume filtered.
12.7 Grinding Procedure
12.7.1 Place filter in grinding vessel and add 2-3 ml of 90% acetone.
12.7.2 Insert pestle into grinding vessel and turn on grinder.
12.7.3 Grind filter for approximately 2 minutes being sure there are no discernible pieces remaining.
12.7.4 Pull pestle from vessel and rinse with 90% acetone.
12.7.5 Transfer sample to centrifuge tube using a glass funnel and 90% acetone for rinsing.
12.7.6 Record filtration volume.
12.8 Procedure
12.8.1 Adjust the temperature of the centrifuge so that unit cools to 4 ± 2°C. Centrifuge samples for 30minutes at 4500 rpm. Keep centrifuged samples level, cool, and in a dark box.
12.8.2 Zero the dual beam spectrophotometer at 750 nm using the 90% acetone reagent. After zeroing thespectrophotometer, leave the cuvette in the reference cell.
12.8.3 Using a matched pair of cuvettes, one cuvette is used to zero the spectrophotometer at eachwavelength; and the other cuvette contains the sample, so that the chlorophyll sample is not transferredback to the chlorophyll tube after the initial turbidity absorbance is obtained at the 750 nm wavelength. To account for any differences between the two cuvettes, the cuvette which will contain the samples isfirst filled with 90% acetone and the absorbance is read on the spectrophotometer. If this absorbanceis not zero, the value obtained is used to adjust all of the chlorophyll readings. The acetone in thereference and zeroing cuvettes must be rehomogenized periodically throughout the analysis.
12.8.4 Record sample volume filtered and extract volume in screw-cap test tube onto the data sheet. Note
Chapter IV Water Quality Monitoring
August 1996
IV-81
that the volume of the filter residue in the bottom of the centrifuge tube must be subtracted from thetotal volume to obtain extract volume. Then carefully dispense the sample into the sample cuvetteusing a disposable glass pipette, and measure absorbances at the following wavelengths: 750 nm, 664nm, 647 nm, 630 nm, 480 nm, and 510 nm.
12.8.5 Re-zero spectrophotometer with 90% acetone before reading at each wavelength. After the 510 nmreading is taken, add 2 drops of 1N HCL. After 1 minute, but not longer than 2 minutes afteracidification, measure sample absorbances at 750 nm and 665 nm. Zero with the blank at eachabsorbance before reading.
12.9 Quality Control
12.9.1 The initial absorbance reading at 750 nm must be less than or equal to .007, or sample(s) must be re-centrifuged. If after re-centrifugation the absorbance reading at 750nm is greater than .007, continueto measure the absorbances at the rest of the wavelengths and write in the comment section that thesample had been recentrifuged.
12.9.2 It is especially important to maintain the spectrophotometers in peak operating condition. This shouldbe confirmed by the following guidelines:
12.9.2.1 Analyzing an EPA SRM reference standard for chlorophyll analysis if provided.
12.9.2.2 Periodic evaluation of the slopes of calibration curves from spectrophotometer analyses
for other parameters for which there are reliable standards (e.g. orthophosphate, nitrite,etc.). If significant slope deviation or consistent unidirectional slope change over timeis noted, an alternate spectrophotometer should be used until the problem is correctedby an authorized repair person.
12.9.2.3 The holmium oxide absorption spectrum should be analyzed at least annually or whenproblems are suspected. Details are not provided here since this and subsequentevaluation should be performed only by or under direct supervision of experiencedpersonnel.
12.9.3 Method detection limits (MDL): Method detection limits should be established using the guidelines inChapter II, Section D.
12.9.4 Method blank: see Chapter II, Section C.
12.9.5 Laboratory duplicate: see Chapter II, Section C.
12.9.6 Reference materials: The laboratory must analyze a standard reference material once a year, asavailable.
12.10 References
American Public Health Association. Standard Methods for the Examination of Water and Wastewater, 17th Edition.
Chapter IV Water Quality Monitoring
August 1996
IV-82
Parsons, T., Y. Maita and C . Lalli. 1984. A Manual of Chemical and Biological Methods for Seawater Analysis. Pergamon Press, pp. 101-112.
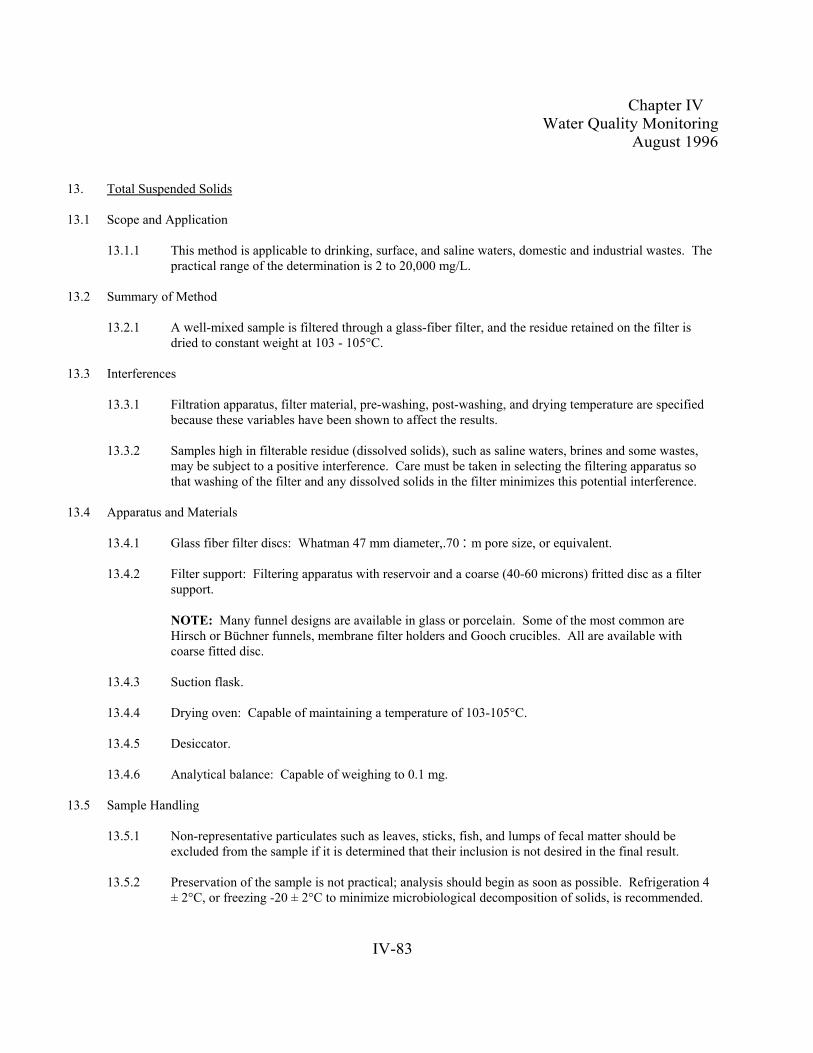
Chapter IV Water Quality Monitoring
August 1996
IV-83
13. Total Suspended Solids
13.1 Scope and Application
13.1.1 This method is applicable to drinking, surface, and saline waters, domestic and industrial wastes. Thepractical range of the determination is 2 to 20,000 mg/L.
13.2 Summary of Method
13.2.1 A well-mixed sample is filtered through a glass-fiber filter, and the residue retained on the filter isdried to constant weight at 103 - 105°C.
13.3 Interferences
13.3.1 Filtration apparatus, filter material, pre-washing, post-washing, and drying temperature are specifiedbecause these variables have been shown to affect the results.
13.3.2 Samples high in filterable residue (dissolved solids), such as saline waters, brines and some wastes,may be subject to a positive interference. Care must be taken in selecting the filtering apparatus sothat washing of the filter and any dissolved solids in the filter minimizes this potential interference.
13.4 Apparatus and Materials
13.4.1 Glass fiber filter discs: Whatman 47 mm diameter,.70 :m pore size, or equivalent.
13.4.2 Filter support: Filtering apparatus with reservoir and a coarse (40-60 microns) fritted disc as a filtersupport.
NOTE: Many funnel designs are available in glass or porcelain. Some of the most common areHirsch or Büchner funnels, membrane filter holders and Gooch crucibles. All are available withcoarse fitted disc.
13.4.3 Suction flask.
13.4.4 Drying oven: Capable of maintaining a temperature of 103-105°C.
13.4.5 Desiccator.
13.4.6 Analytical balance: Capable of weighing to 0.1 mg.
13.5 Sample Handling
13.5.1 Non-representative particulates such as leaves, sticks, fish, and lumps of fecal matter should beexcluded from the sample if it is determined that their inclusion is not desired in the final result.
13.5.2 Preservation of the sample is not practical; analysis should begin as soon as possible. Refrigeration 4± 2°C, or freezing -20 ± 2°C to minimize microbiological decomposition of solids, is recommended.

Chapter IV Water Quality Monitoring
August 1996
IV-84
13.6 Procedure
13.6.1 Preparation of filters:
13.6.1.1 Number glass fiber filters with a fine-point indelible ink pen. Allow ink to dry for 24hours.
13.6.1.2 Place the numbered glass fiber filter on the membrane filter apparatus.
13.6.1.3 While vacuum is applied, wash the filter with three successive 30 ml volumes ofdeionized, distilled water. Allow the vacuum pump to run until the filters are "dry".
13.6.1.4 Remove the filter from membrane filter apparatus and dry in an oven at 103 - 105°C forfour hours.
13.6.1.5 Cool in a desiccator, weigh each filter, record the filter number and weight in anotebook set aside for this purpose, and return the filter to the drying tray.
13.6.1.6 Return the tray to the oven, 103 - 105°C , for one hour. Repeat the drying cycle until aconstant weight is obtained (weight verification 0.5 mg or less is obtained).
13.6.1.7 Record the second filter weight in the notebook and store the filters in aluminum cupsin an oven at 60 ± 5°C, or in a desiccator until needed.
13.6.2 Sample analysis:
13.6.2.1 List filter numbers and sample indefications on Suspended Solids sheet.
13.6.2.2 Assemble the filtering apparatus, place a pre-weighed numbered filter on it, and beginsuction.
13.6.2.3 Shake the sample vigorously and with a small portion of sample. Quantitativelymeasure 500 mL of sample into the graduated cylinder. Record the volume of sampleused beside the corresponding filter and sample on the Suspended Solids sheet.
NOTE: A smaller volume may be used if sample contains a large amount of suspendedmatter.
13.6.2.4 Pour the measured sample volume onto the filter. Remove all traces of water bycontinuing to apply vacuum after sample has passed through.
13.6.2.5 With suction on, wash the filter, non-filterable residue and filter funnel wall with threeportions of deionized, distilled water allowing complete drainage between washing. Remove all traces of water by continuing to apply vacuum after water has passedthrough.
13.6.2.6 Carefully remove the filter from the filter support. Alternatively, remove crucible andfilter from crucible adapter. Dry at least one hour at 103-105°C. Cool in a desiccator
Chapter IV Water Quality Monitoring
August 1996
IV-85
and weigh. Repeat the drying cycle until a constant weight is obtained (weight loss of0.5 mg or less is obtained). Record both weights on the data sheet and determine theconcentration of the Suspended Solids in mg/L.
13.7 Quality Control
13.7.1 Method detection limits (MDL): Method detection limits should be established using the guidelines inChapter II, Section E.
13.7.2 Method blank: see Chapter II, Section D.
13.7.3 Laboratory duplicate: see Chapter II, Section D.
13.7.4 Reference materials: The laboratory must analyze a standard reference material once a year, asavailable.
13.8 References
U.S. EPA, 1979, "Methods for Chemical Analysis of Water and Wastes", Method 160.2.
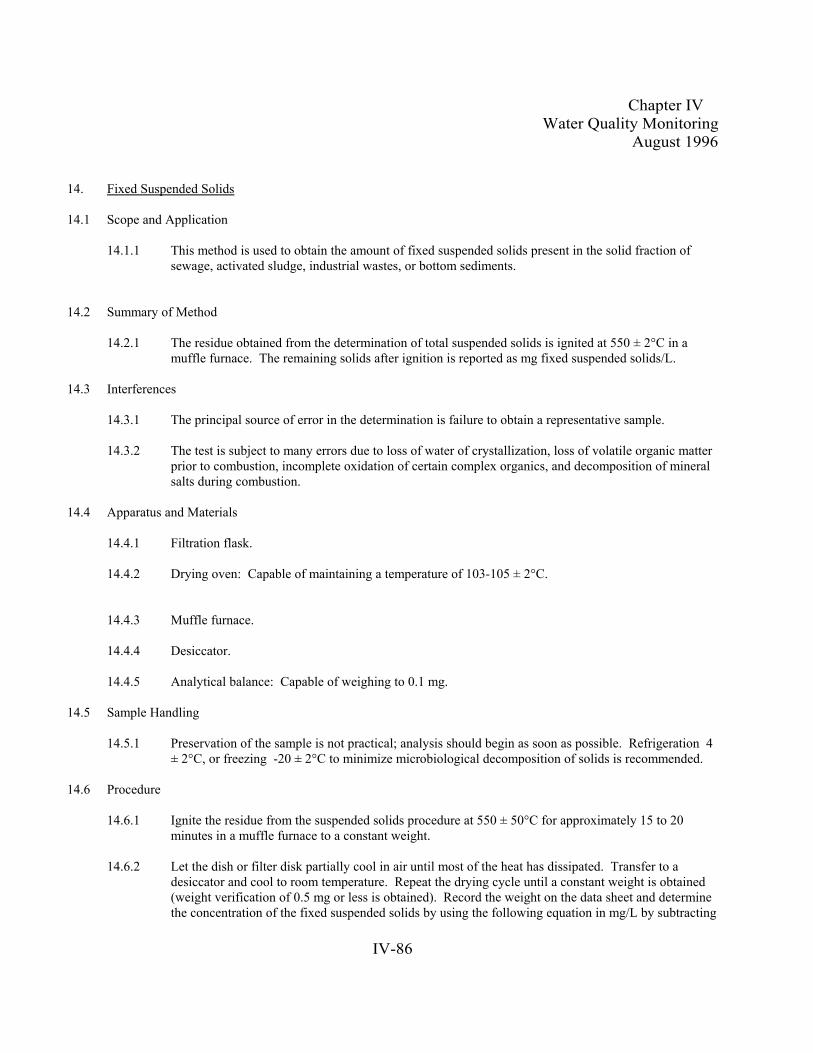
Chapter IV Water Quality Monitoring
August 1996
IV-86
14. Fixed Suspended Solids
14.1 Scope and Application
14.1.1 This method is used to obtain the amount of fixed suspended solids present in the solid fraction ofsewage, activated sludge, industrial wastes, or bottom sediments.
14.2 Summary of Method
14.2.1 The residue obtained from the determination of total suspended solids is ignited at 550 ± 2°C in amuffle furnace. The remaining solids after ignition is reported as mg fixed suspended solids/L.
14.3 Interferences
14.3.1 The principal source of error in the determination is failure to obtain a representative sample.
14.3.2 The test is subject to many errors due to loss of water of crystallization, loss of volatile organic matterprior to combustion, incomplete oxidation of certain complex organics, and decomposition of mineralsalts during combustion.
14.4 Apparatus and Materials
14.4.1 Filtration flask.
14.4.2 Drying oven: Capable of maintaining a temperature of 103-105 ± 2°C.
14.4.3 Muffle furnace.
14.4.4 Desiccator.
14.4.5 Analytical balance: Capable of weighing to 0.1 mg.
14.5 Sample Handling
14.5.1 Preservation of the sample is not practical; analysis should begin as soon as possible. Refrigeration 4± 2°C, or freezing -20 ± 2°C to minimize microbiological decomposition of solids is recommended.
14.6 Procedure
14.6.1 Ignite the residue from the suspended solids procedure at 550 ± 50°C for approximately 15 to 20minutes in a muffle furnace to a constant weight.
14.6.2 Let the dish or filter disk partially cool in air until most of the heat has dissipated. Transfer to adesiccator and cool to room temperature. Repeat the drying cycle until a constant weight is obtained(weight verification of 0.5 mg or less is obtained). Record the weight on the data sheet and determinethe concentration of the fixed suspended solids by using the following equation in mg/L by subtracting

Chapter IV Water Quality Monitoring
August 1996
IV-87
(Eq. IV.25)
the weight of the residue plus the dish after ignition from the weight of the dish times 1000 over thevolume of sample used.
where,
WRD = Weight of residue and dish WD = Weight of dish V = Volume of sample filtered
14.7 Quality Control
14.7.1 Method detection limits (MDL): Method detection limits should be established using the guidelines in Chapter II, Section E.
14.7.2 Method blank: see Chapter II, Section C.
14.7.3 Laboratory duplicate: see Chapter II, Section C.
14.7.4 Reference materials: The laboratory must analyze a standard reference material once a year, asavailable.
14.8 References
U.S. EPA, 1979, Methods for Chemical Analysis of Water and Wastes, Method 160.2.
Annual Book of ASTM Standards, "Fixed and Volatile Solids Ignited at 550°C", Standard D 2540, Method E, p 2-77 (1980).
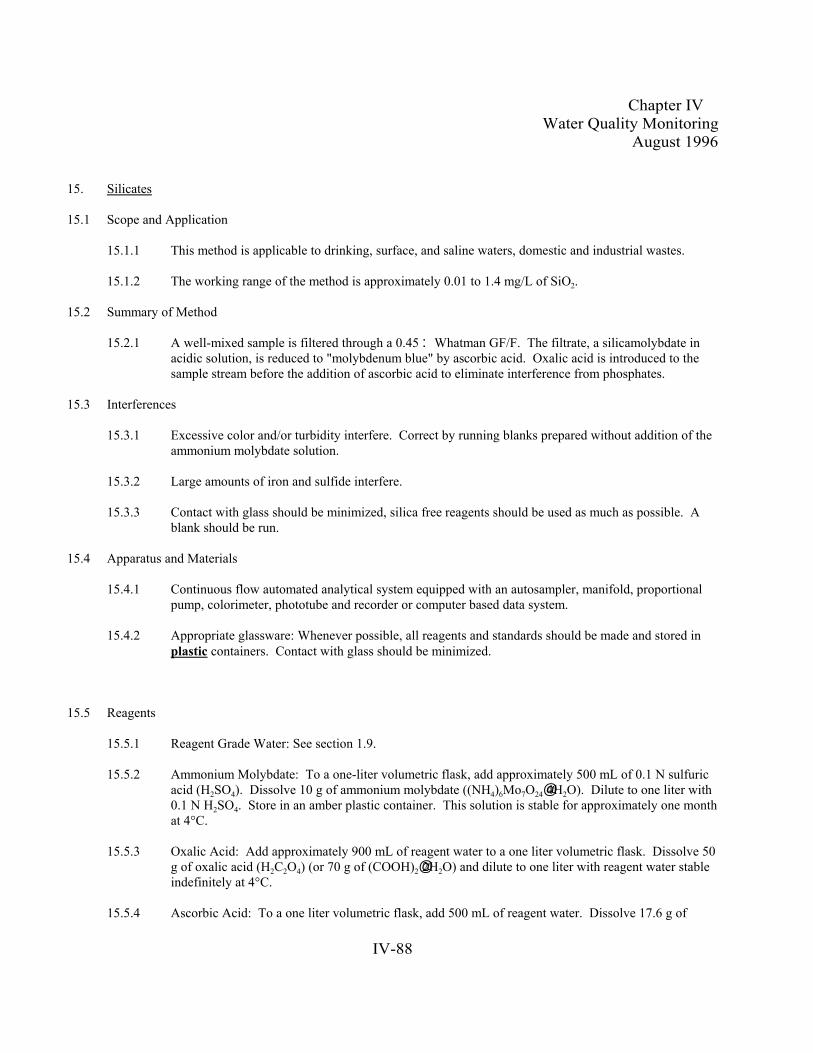
Chapter IV Water Quality Monitoring
August 1996
IV-88
15. Silicates
15.1 Scope and Application
15.1.1 This method is applicable to drinking, surface, and saline waters, domestic and industrial wastes.
15.1.2 The working range of the method is approximately 0.01 to 1.4 mg/L of SiO2.
15.2 Summary of Method
15.2.1 A well-mixed sample is filtered through a 0.45 : Whatman GF/F. The filtrate, a silicamolybdate inacidic solution, is reduced to "molybdenum blue" by ascorbic acid. Oxalic acid is introduced to thesample stream before the addition of ascorbic acid to eliminate interference from phosphates.
15.3 Interferences
15.3.1 Excessive color and/or turbidity interfere. Correct by running blanks prepared without addition of theammonium molybdate solution.
15.3.2 Large amounts of iron and sulfide interfere.
15.3.3 Contact with glass should be minimized, silica free reagents should be used as much as possible. Ablank should be run.
15.4 Apparatus and Materials
15.4.1 Continuous flow automated analytical system equipped with an autosampler, manifold, proportionalpump, colorimeter, phototube and recorder or computer based data system.
15.4.2 Appropriate glassware: Whenever possible, all reagents and standards should be made and stored inplastic containers. Contact with glass should be minimized.
15.5 Reagents
15.5.1 Reagent Grade Water: See section 1.9.
15.5.2 Ammonium Molybdate: To a one-liter volumetric flask, add approximately 500 mL of 0.1 N sulfuricacid (H2SO4). Dissolve 10 g of ammonium molybdate ((NH4)6Mo7O24@4H2O). Dilute to one liter with0.1 N H2SO4. Store in an amber plastic container. This solution is stable for approximately one monthat 4°C.
15.5.3 Oxalic Acid: Add approximately 900 mL of reagent water to a one liter volumetric flask. Dissolve 50g of oxalic acid (H2C2O4) (or 70 g of (COOH)2@2H2O) and dilute to one liter with reagent water stableindefinitely at 4°C.
15.5.4 Ascorbic Acid: To a one liter volumetric flask, add 500 mL of reagent water. Dissolve 17.6 g of
Chapter IV Water Quality Monitoring
August 1996
IV-89
ascorbic acid (C6H8O6), add 50 mL of acetone (CH3COCH3), mix, and dilute to one liter with reagentwater stable at one month at 4°C.
15.5.5 Silica Stock Solution: In a one liter volumetric flask, add 500 mL of reagent water. Dissolve 1.88 g ofsodium fluorosilicate (Na2SiF6) and dilute to volume with reagent water. Store in tightly stopperedplastic bottle at room temperature.
15.5.6 Silica Standard Solutions: Prepare at least four standard solutions from stock solution by dilution with reagent water. Prepare standard solutions on the day of analysis.
15.6 Sample Handling
15.6.1 Samples are filtered through a Whatman GF/F glass fiber filter or equivalent filter and stored atunacidified for 28 days 4°C .
15.7 Procedure
15.7.1 Allow both the colorimeter and recorder to warm up for 30 minutes. Obtain a stable baseline with allreagents, feeding reagent water through the sample line.
15.7.2 Analytical sequence: The following sequence is recommended for sample analysis..
15.7.2.1 Five calibration standards with concentrations within the linear range of the test.
15.7.2.2 Two method blanks.
15.7.2.3 Ten CBP samples.
15.7.2.4 One matrix spike sample and one sample duplicate.
15.7.2.5 One medium concentration calibration standard.
15.7.2.6 One method blank.
15.7.2.7 Steps 15.7.3.5 - 15.7.3.8 are repeated until are samples are analyzed or QC samplesindicate that the system is out of control and recalibration is necessary.
15.7.2.8 One high concentration calibration standard.
15.7.2.9 One medium concentration calibration standard.
15.7.2.10 One low concentration calibration standard.
15.7.3 Switch sample line from distilled water to sampler and begin analysis.
15.7.4 Prepare appropriate standard curve by plotting peak heights of processed standards against knownconcentrations. Compute concentration of the samples by comparing sample peak heights withstandard curve.

Chapter IV Water Quality Monitoring
August 1996
IV-90
NOTE: Subtract the blank background response from the standards before preparing the standardcurve.
15.7.5 Record the stabilized potential of each unknown sample and convert the potential reading to the silicaconcentration using the standard curve.
15.8 Quality Control
15.8.1 Method detection limits (MDL): Method detection limits should be established using the guidelines inChapter II, Section E.
15.8.2 Calibration
15.8.2.1 Linear calibration range: Calibration standards should bracket the range of CBPsamples.
15.8.2.2 Correlation coefficient: The correlation coefficient must be 0.99 or better for thecalibration curve to be used.
15.8.3 Method blank: see Chapter II, Section D.
15.8.4 Matrix spike sample: see Chapter II, Section D.
15.8.5 Laboratory duplicate: see Chapter II, Section D.
15.8.6 Reference materials: The laboratory must analyze a standard reference material once a year, asavailable.
15.9 References
Standard Methods for the Examination of Water and Wastewater, 14th Edition, p 487, Method 426 F (1975).
Annual Book of ASTM Standards, Part 31, "Water", Standard D 859-68, p 401 (1976).
Standard Methods for Chemical Analyses of Water and Wastes, EPA-600/4-79-020, Edition 1978, p 370.1-1,Method 370.1 (1978).

Chapter IV Water Quality Monitoring
August 1996
IV-91
Chapter IV Water Quality Monitoring
August 1996
IV-92
16. Alkalinity
16.1 Scope and Application
16.1.1 The alkalinity of a water is its acid-neutralizing capacity, and it comprises the sum of all titrable bases. Alkalinity is a measure of an aggregate property of water and can be interpreted in terms of specificsubstances only when the chemical composition of the sample is known. While alkalinity values mayinclude contributions from borates, phosphates, silicates, and other bases, the alkalinity of mostsurface waters is primarily a function of carbonate, bicarbonate, and hydroxide content.
16.2 Summary of Method
16.2.1 Alkalinity is dependent upon the pH of the solution and is a measure of its quantitative capacity toneutralize a strong acid to a designated pH (hydroxyl ions are neutralized). In this instance, the initialpH is taken and the solution is carefully titrated with a standardized H2SO4 solution to a pH of 8.3 (ifnecessary) and then to a pH of 4.5. Carbonate and total alkalinity values are calculated directly fromthe titration data, and any existing bicarbonate alkalinity is calculated as the difference between totaland carbonate alkalinities.
16.3 Interferences
16.3.1 Soaps, oily matter, suspended solids, or precipitates may coat the glass electrode and cause a sluggishresponse. Allow additional time between titrant additions to let electrode come to equilibrium andclean electrode more frequently. Do not filter, dilute, concentrate, or alter the sample.
16.3.2 Dissolved gases contributing to alkalinity, such as CO2, hydrogen sulfide, or ammonia, may be lost orgained during sampling, storage, or titration.
16.4 Apparatus and Materials
16.4.1 pH meter and electrode, calibrated according to manufacturer's specifications at pH 4, 7, and 10.
16.4.2 Buret, bororsilicate glass, of appropriate volume to contain enough titrant for at least one completetitration.
16.4.3 Titration vessels, the size and form will depend on the electrode and the sample size.
16.4.4 Parafilm.
16.4.5 Magnetic stirrer.
16.4.6 Pipets, volumetric.
16.4.7 Flasks, volumetric, 1-L.
16.4.8 Analytical balance, capable of weighing to 0.001 g and calibrated according to manufacturer'sspecifications using Class S weights.
Chapter IV Water Quality Monitoring
August 1996
IV-93
16.5 Reagents
16.5.1 Certified pH buffer solutions for pH 4, 7, and 10.
16.5.2 Sodium Carbonate Solution, approximately 0.05N: Dry 3 to 5 g primary standard Na2CO3 at 250 ± 2°Cfor 4 hours and cool in desiccator. Weigh 2.5 + 0.2 g (to the nearest mg), transfer to a 1-L volumetricflask, fill with approximately 500 mL of distilled water, swirl until the Na2CO3 is dissolved, and thenfill the flask to the 1-L mark with distilled water. Do not keep for longer than 1 week.
16.5.3 Standard Sulfuric Acid Solution, 0.02N: Prepare acid solution of approximate normality. Standardizedaily by potentiometric titration of Na2CO3 standard solution.
16.6 Sample Handling
16.6.1 Sample holding time: The recommended maximum holding time is 24 hours from sample collection.
16.6.2 Sample preservation and storage:
16.6.2.1 If analysis is not started within 2 hours of collection, keep samples at or below 4 ± 2°C.
16.6.2.2 If analysis is started within 2 hours of collection, cold storage is unnecessary.
16.6.3 To minimize loss or absorption of gases, avoid sample agitation and prolonged exposure to air.
16.7 Procedure
16.7.1 Calibrate the pH meter and electrode using certified buffer solutions at pH 4, 7, and 10. A freshaliquot of each buffer should be used daily.
16.7.2 Rinse electrode with distilled water.
16.7.3 Rinse and fill burette with H2SO4 solution.
16.7.4 Standardize the H2SO4 solution by titrating 10.00 mL of the 0.05N Na2CO3 standard solution. Pleasenote that the actual normality of the Na2CO3 solution must be calculated based on the exact weight ofdried standard used.
16.7.5 Adjust sample to room temperature (if necessary), pour sample aliquot (100ml) into a clean titrationvessel, introduce a Teflon coated stirring bar into the sample and place on a magnetic stirrer.
16.7.6 Position burette so that the acid goes directly into the titration vessel. The buret tip must be abovesample level at all times.
16.7.7 Cover the titration vessel with parafilm, making small apertures for the pH electrode and the tip of theburet.
16.7.8 Measure and record the initial pH.
Chapter IV Water Quality Monitoring
August 1996
IV-94
16.7.9 Record initial buret reading.
16.7.10 If the initial pH is less than 8.3, then proceed to Section 17.7.12, otherwise continue as described inSection 17.7.11.
16.7.11 Slowly add standard sulfuric acid solution until a pH of 8.3 is reached. Record pH and the titrationvolume.
16.7.12 Add standard sulfuric acid solution until a pH of approximately 6 is reached. Slowly add more acid,until a pH of 4.5 is reached, record pH and the final titration volume.
16.7.13 Calculate and report carbonate and total alkalinities. If the initial pH was 8.3 or greater, also calculateand report bicarbonate alkalinity.
16.8 Quality Control
16.8.1 Method detection limits (MDL): Method detection limits should be established using the guidelines inChapter II, Section D.
16.8.2 Laboratory duplicate: see Chapter II, Section C.
16.8.3 Reference materials: The laboratory must analyze a standard reference material once a year, asavailable.
16.9 References
American Public Health Association. 1989. Standard Methods for the Examination of Water and Wastewater,17th Edition.
McGraw-Hill, Chemistry and Environmental Engineering, pp. 364-376.
Strickland and Parsons, A Practical Handbook of Seawater Analysis, pp. 27-28.