Embed Size (px)
Citation preview
Recommended Changes to Withdrawn FDA Draft Stratified Sampling Guidance Document ISPE Blend and Content Uniformity Group December, 2014
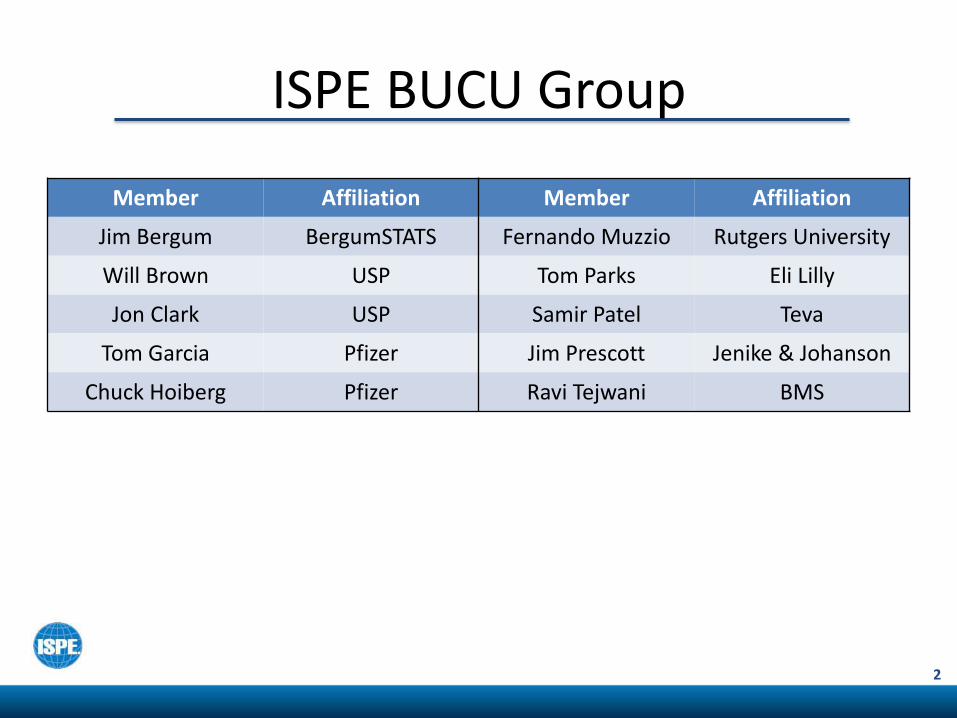
ISPE BUCU Group
Member Affiliation Member Affiliation
Jim Bergum BergumSTATS Fernando Muzzio Rutgers University
Will Brown USP Tom Parks Eli Lilly
Jon Clark USP Samir Patel Teva
Tom Garcia Pfizer Jim Prescott Jenike & Johanson
Chuck Hoiberg Pfizer Ravi Tejwani BMS
2
Publication
Garcia, Thomas et.al., Recommendations for the assessment of blend and content uniformity: modifications to withdrawn FDA draft stratified sampling guidance, J Pharm Innov, 2014, (DOI) 10.1007/s12247-014-9207-0.
3
Purpose and Scope
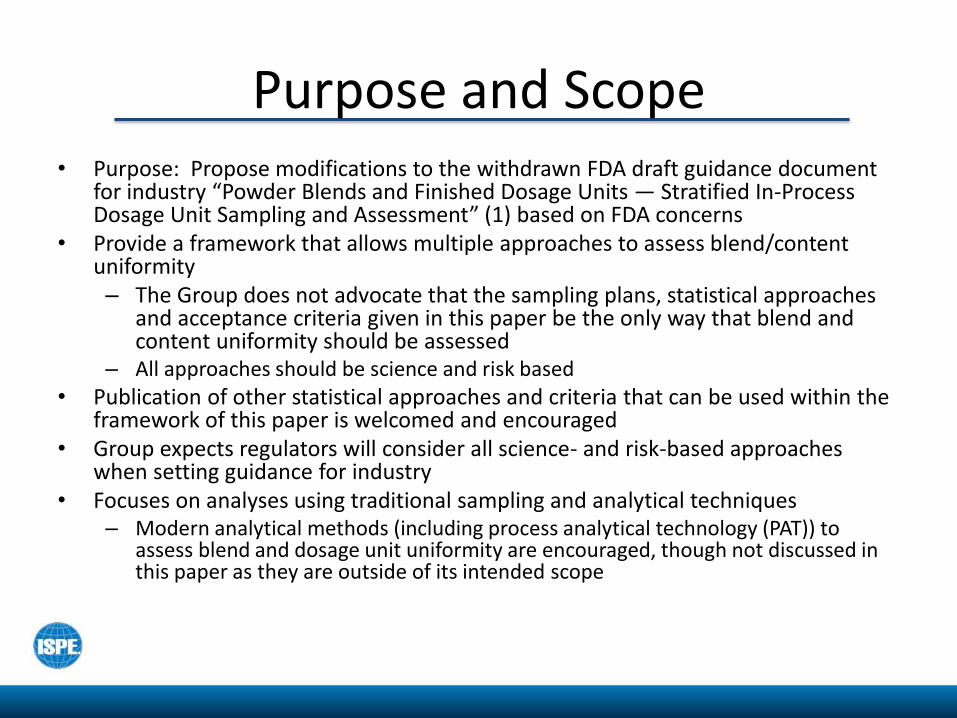
• Purpose: Propose modifications to the withdrawn FDA draft guidance document for industry “Powder Blends and Finished Dosage Units — Stratified In-Process Dosage Unit Sampling and Assessment” (1) based on FDA concerns
• Provide a framework that allows multiple approaches to assess blend/content uniformity – The Group does not advocate that the sampling plans, statistical approaches
and acceptance criteria given in this paper be the only way that blend and content uniformity should be assessed
– All approaches should be science and risk based
• Publication of other statistical approaches and criteria that can be used within the framework of this paper is welcomed and encouraged
• Group expects regulators will consider all science- and risk-based approaches when setting guidance for industry
• Focuses on analyses using traditional sampling and analytical techniques – Modern analytical methods (including process analytical technology (PAT)) to
assess blend and dosage unit uniformity are encouraged, though not discussed in this paper as they are outside of its intended scope
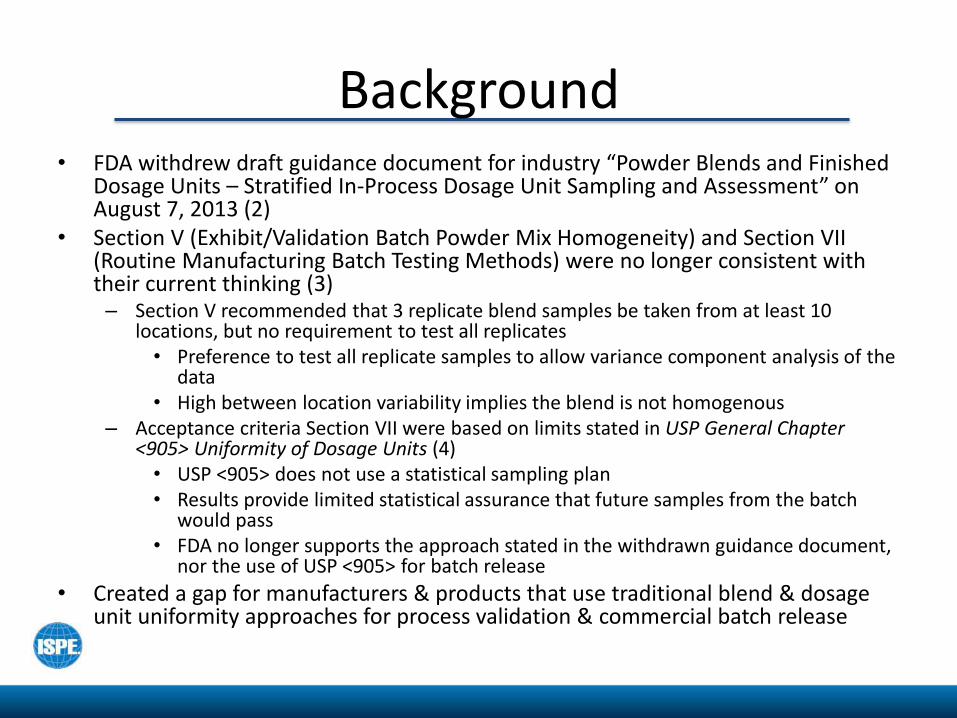
Background • FDA withdrew draft guidance document for industry “Powder Blends and Finished
Dosage Units – Stratified In-Process Dosage Unit Sampling and Assessment” on August 7, 2013 (2)
• Section V (Exhibit/Validation Batch Powder Mix Homogeneity) and Section VII (Routine Manufacturing Batch Testing Methods) were no longer consistent with their current thinking (3) – Section V recommended that 3 replicate blend samples be taken from at least 10
locations, but no requirement to test all replicates • Preference to test all replicate samples to allow variance component analysis of the
data • High between location variability implies the blend is not homogenous
– Acceptance criteria Section VII were based on limits stated in USP General Chapter <905> Uniformity of Dosage Units (4) • USP <905> does not use a statistical sampling plan • Results provide limited statistical assurance that future samples from the batch
would pass • FDA no longer supports the approach stated in the withdrawn guidance document,
nor the use of USP <905> for batch release
• Created a gap for manufacturers & products that use traditional blend & dosage unit uniformity approaches for process validation & commercial batch release
Formation of ISPE BUCU Group
• Formed in August 2013 to discuss approaches to assess blend and content uniformity
• Sponsored by the International Society for Pharmaceutical Engineering (ISPE)
• Session at ISPE Annual Meeting (November 6, 2013) covering the current issues associated with blend and content uniformity analysis (5,6) – FDA concerns with current practices – Importance of using statistically sound sampling plans and
acceptance criteria – Consider the impact that therapeutic properties of the
drug can have on content uniformity acceptance criteria
Summary of Proposed Modifications
• Modifications are proposed by the Group to assess “adequacy of mixing to assure uniformity and homogeneity” of the finished product in accordance with CGMP requirement 21 CFR 211.110 (7)
• Blend sampling and testing plans are revised to be more explicit • Statistical approaches and sampling plans provide more confidence
that future samples from the batch will comply with USP <905>. • Flexible risk based approach to define the number of dosage units
to be tested during routine manufacture – Balance consumer’s risk and producer’s risk
• Approach can be applied to all stages of process validation (8) • Can use for various dosage forms for which USP <905> applies
– Tablets, capsules (all types), sachets, powder filled bottles and in some instances semisolids, regardless of drug loading.
Framework
• Satisfies CGMP and application review requirements for in-process and release testing to demonstrate adequacy of the powder mix and uniform content of the dosage units
• Multiple approaches, sampling plans and acceptance criteria can be used to assess blend and/or dosage unit uniformity, including: – Various statistical approaches that use confidence intervals
and/or tolerance intervals that provide assurance of complying with USP <905> (9, 10, 11)
– The application of PAT sensors to determine uniformity of powder mix and blending end points
– The application of PAT and large n acceptance criteria to demonstrate uniformity of dosage units
Relevant Information From Original Draft Guidance Document
• Retains the use in-process dosage unit data as a surrogate measure for blend uniformity and release testing of the drug product during commercial production
• The identification of blending parameters and assessment of blend homogeneity throughout the blender and/or intermediate bulk containers using appropriate sampling plans
• Sampling Technique and procedure: – Assess impact of blend sample size (e.g., 1-10X dosage unit range; sizes > 3X
can be used with adequate justification) – Sampling errors should be identified, which may be negated by the use of in-
situ analytical techniques using real-time sampling and analysis • Design sampling plans and evaluate the data using appropriate statistical analysis,
such as variance component analysis to measure variability present in the results – Include significant events (start-up, end of run, bin change-over samples) – Low dose / high potency drugs may require more rigorous sampling plans
• Compare blend, in-process dosage units, and finished product data to justify the use of in-process dosage units to demonstrate blend and content uniformity for finished product release
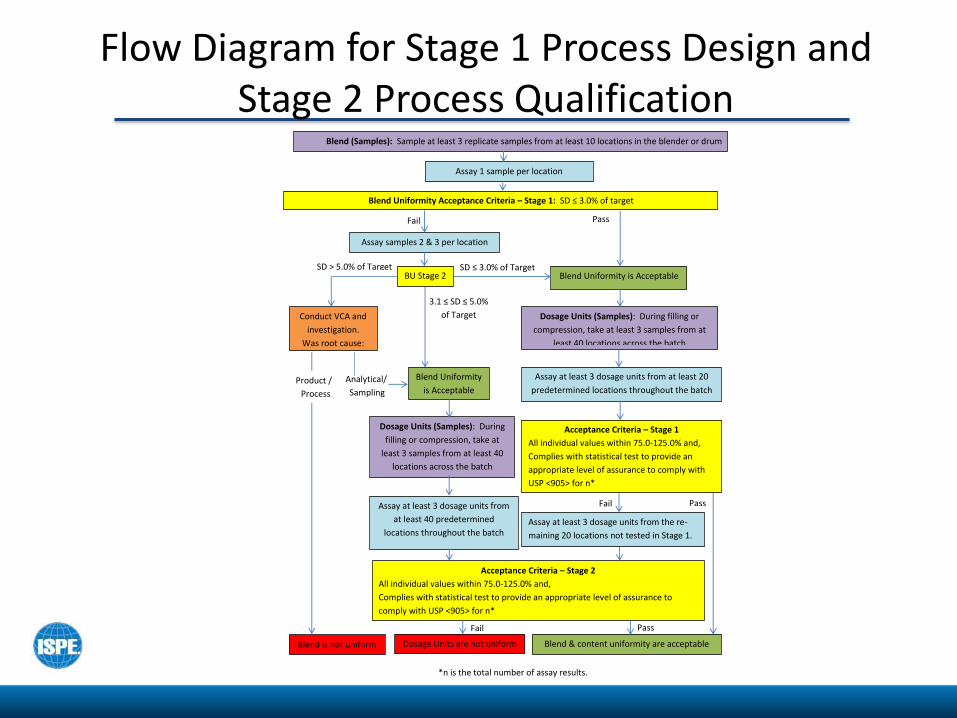
Flow Diagram for Stage 1 Process Design and Stage 2 Process Qualification
Blend (Samples): Sample at least 3 replicate samples from at least 10 locations in the blender or drum
Assay 1 sample per location
Blend Uniformity Acceptance Criteria – Stage 1: SD ≤ 3.0% of target
Conduct VCA and
investigation.
Was root cause:
Dosage Units (Samples): During filling or
compression, take at least 3 samples from at
least 40 locations across the batch
Assay at least 3 dosage units from at least 20
predetermined locations throughout the batch
Blend Uniformity is Acceptable
Pass Fail
SD ≤ 3.0% of Target
Pass Fail
Pass
Analytical/
Sampling
Dosage Units are not uniform Blend & content uniformity are acceptable
*n is the total number of assay results.
Blend is not uniform
Assay at least 3 dosage units from
at least 40 predetermined
locations throughout the batch
3.1 ≤ SD ≤ 5.0%
of Target
SD > 5.0% of Target
Blend Uniformity
is Acceptable
Dosage Units (Samples): During
filling or compression, take at
least 3 samples from at least 40
locations across the batch
Acceptance Criteria – Stage 2
All individual values within 75.0-125.0% and,
Complies with statistical test to provide an appropriate level of assurance to
comply with USP <905> for n*
Assay samples 2 & 3 per location
BU Stage 2
Acceptance Criteria – Stage 1
All individual values within 75.0-125.0% and,
Complies with statistical test to provide an
appropriate level of assurance to comply with
USP <905> for n*
Assay at least 3 dosage units from the re-
maining 20 locations not tested in Stage 1.
Fail
Product /
Process
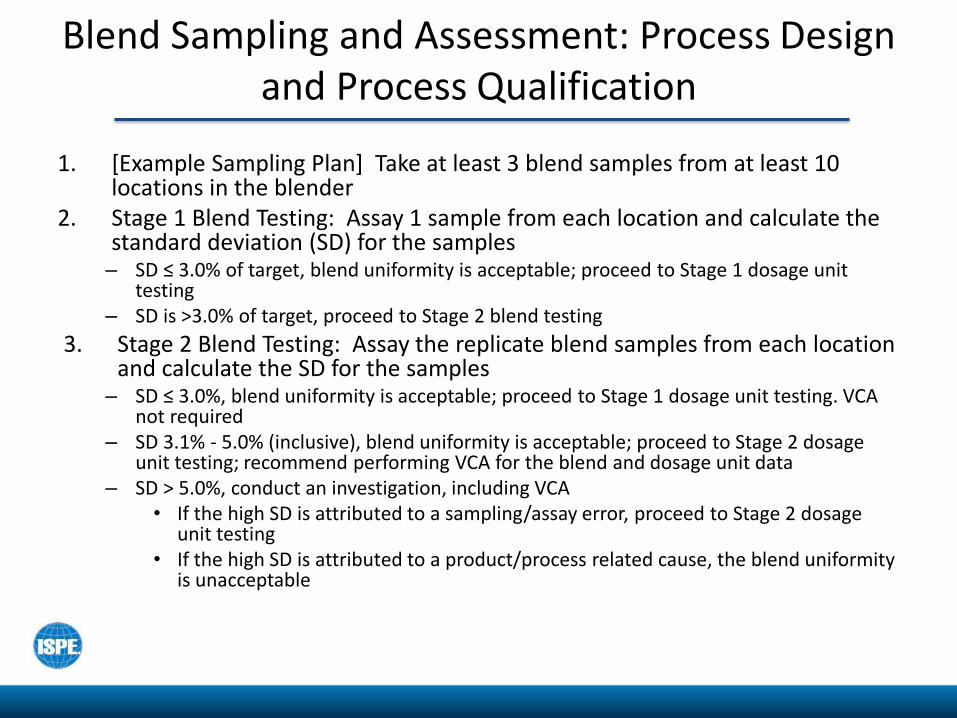
Blend Sampling and Assessment: Process Design and Process Qualification
1. [Example Sampling Plan] Take at least 3 blend samples from at least 10 locations in the blender
2. Stage 1 Blend Testing: Assay 1 sample from each location and calculate the standard deviation (SD) for the samples – SD ≤ 3.0% of target, blend uniformity is acceptable; proceed to Stage 1 dosage unit
testing – SD is >3.0% of target, proceed to Stage 2 blend testing
3. Stage 2 Blend Testing: Assay the replicate blend samples from each location and calculate the SD for the samples
– SD ≤ 3.0%, blend uniformity is acceptable; proceed to Stage 1 dosage unit testing. VCA not required
– SD 3.1% - 5.0% (inclusive), blend uniformity is acceptable; proceed to Stage 2 dosage unit testing; recommend performing VCA for the blend and dosage unit data
– SD > 5.0%, conduct an investigation, including VCA • If the high SD is attributed to a sampling/assay error, proceed to Stage 2 dosage
unit testing • If the high SD is attributed to a product/process related cause, the blend uniformity
is unacceptable
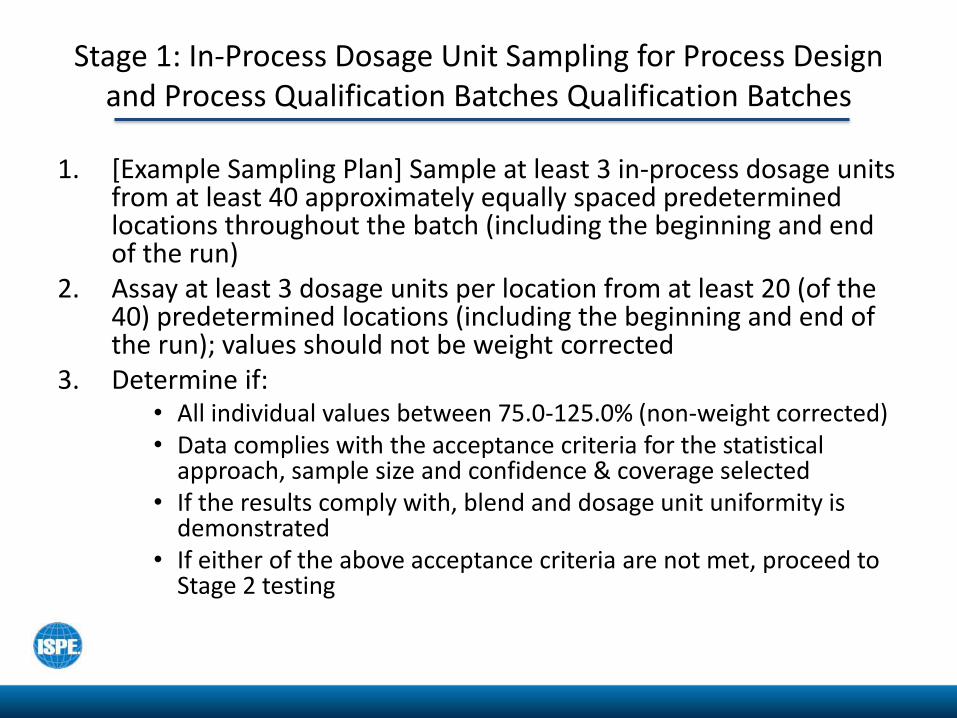
Stage 1: In-Process Dosage Unit Sampling for Process Design and Process Qualification Batches Qualification Batches
1. [Example Sampling Plan] Sample at least 3 in-process dosage units from at least 40 approximately equally spaced predetermined locations throughout the batch (including the beginning and end of the run)
2. Assay at least 3 dosage units per location from at least 20 (of the 40) predetermined locations (including the beginning and end of the run); values should not be weight corrected
3. Determine if: • All individual values between 75.0-125.0% (non-weight corrected) • Data complies with the acceptance criteria for the statistical
approach, sample size and confidence & coverage selected • If the results comply with, blend and dosage unit uniformity is
demonstrated • If either of the above acceptance criteria are not met, proceed to
Stage 2 testing
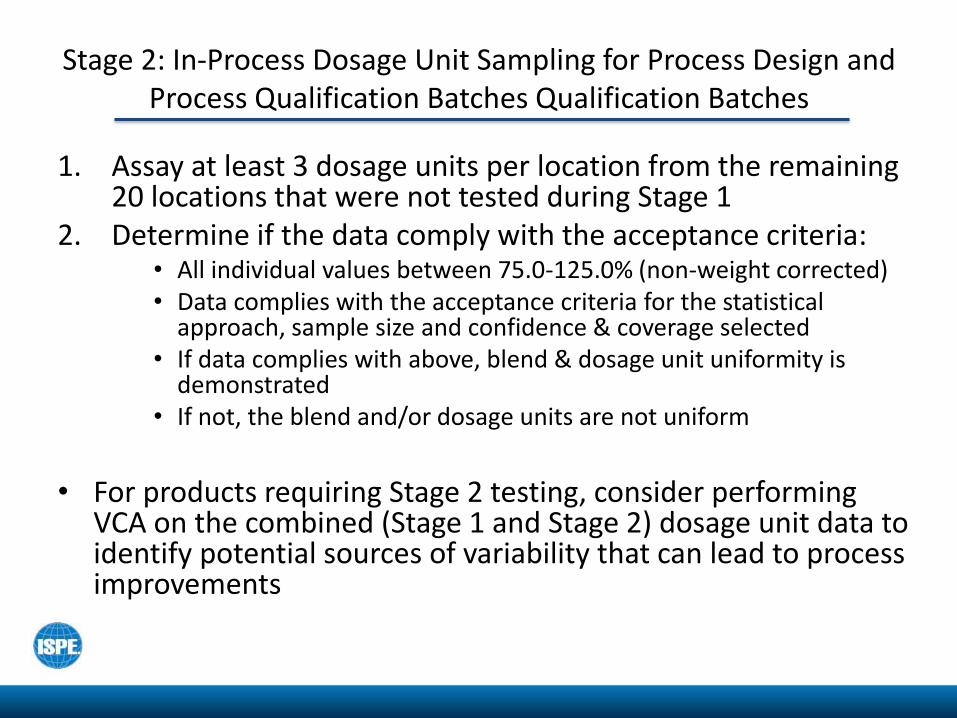
Stage 2: In-Process Dosage Unit Sampling for Process Design and Process Qualification Batches Qualification Batches
1. Assay at least 3 dosage units per location from the remaining 20 locations that were not tested during Stage 1
2. Determine if the data comply with the acceptance criteria: • All individual values between 75.0-125.0% (non-weight corrected) • Data complies with the acceptance criteria for the statistical
approach, sample size and confidence & coverage selected • If data complies with above, blend & dosage unit uniformity is
demonstrated • If not, the blend and/or dosage units are not uniform
• For products requiring Stage 2 testing, consider performing
VCA on the combined (Stage 1 and Stage 2) dosage unit data to identify potential sources of variability that can lead to process improvements
Assessment of Blend and Content Uniformity for Continued Process Verification
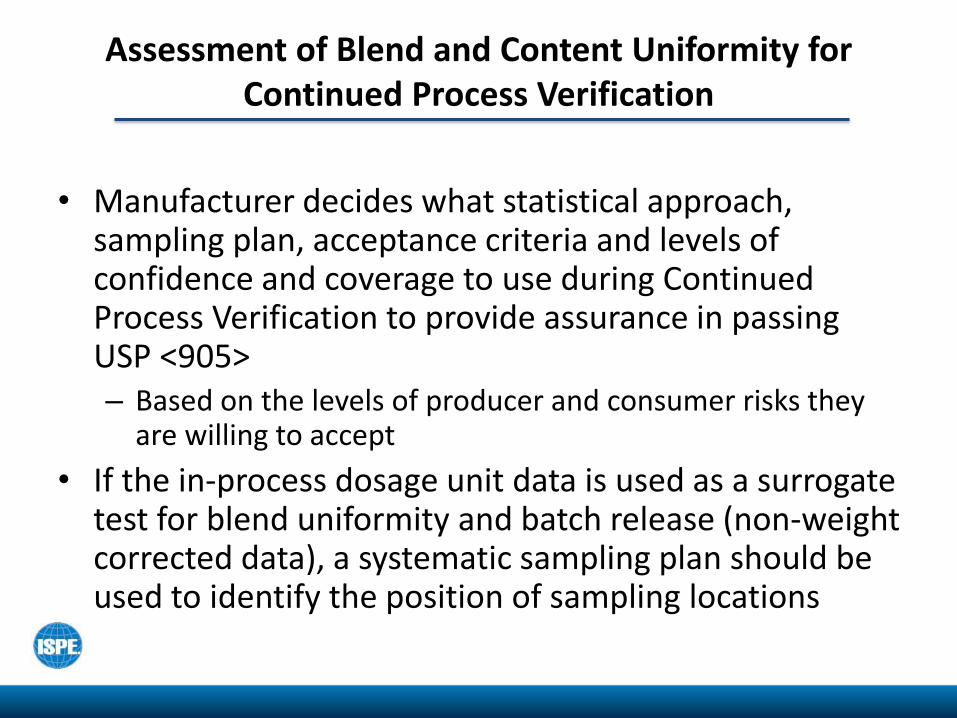
• Manufacturer decides what statistical approach, sampling plan, acceptance criteria and levels of confidence and coverage to use during Continued Process Verification to provide assurance in passing USP <905> – Based on the levels of producer and consumer risks they
are willing to accept
• If the in-process dosage unit data is used as a surrogate test for blend uniformity and batch release (non-weight corrected data), a systematic sampling plan should be used to identify the position of sampling locations
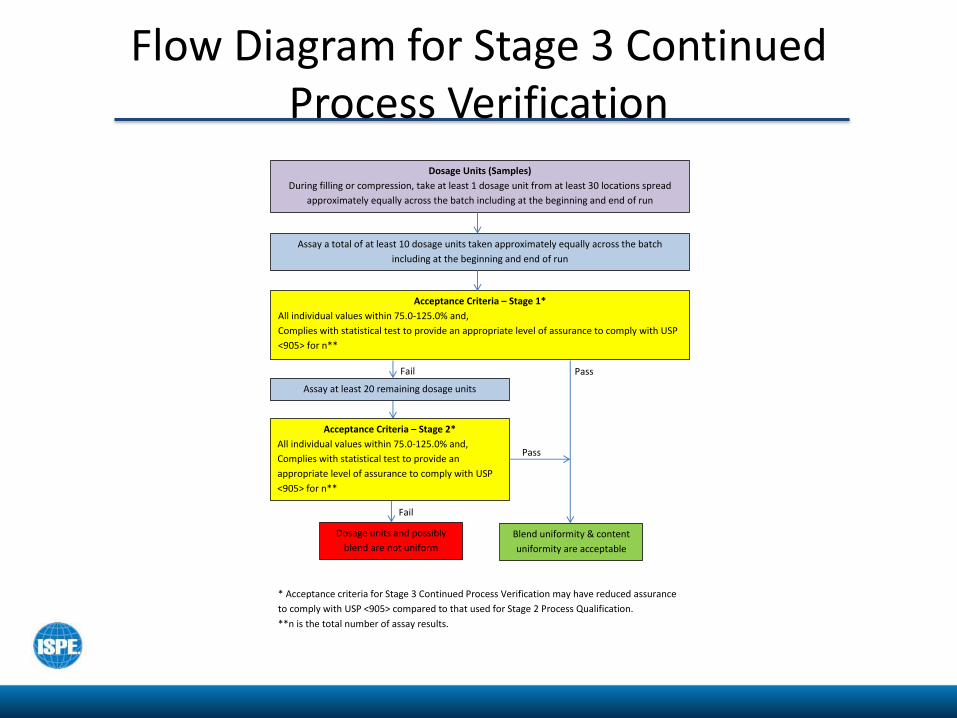
Flow Diagram for Stage 3 Continued Process Verification
Dosage Units (Samples)
During filling or compression, take at least 1 dosage unit from at least 30 locations spread
approximately equally across the batch including at the beginning and end of run
Acceptance Criteria – Stage 1*
All individual values within 75.0-125.0% and,
Complies with statistical test to provide an appropriate level of assurance to comply with USP
<905> for n**
Assay at least 20 remaining dosage units
Dosage units and possibly
blend are not uniform
Assay a total of at least 10 dosage units taken approximately equally across the batch
including at the beginning and end of run
Blend uniformity & content
uniformity are acceptable
* Acceptance criteria for Stage 3 Continued Process Verification may have reduced assurance
to comply with USP <905> compared to that used for Stage 2 Process Qualification.
**n is the total number of assay results.
Pass
Fail
Acceptance Criteria – Stage 2*
All individual values within 75.0-125.0% and,
Complies with statistical test to provide an
appropriate level of assurance to comply with USP
<905> for n**
Fail
Pass
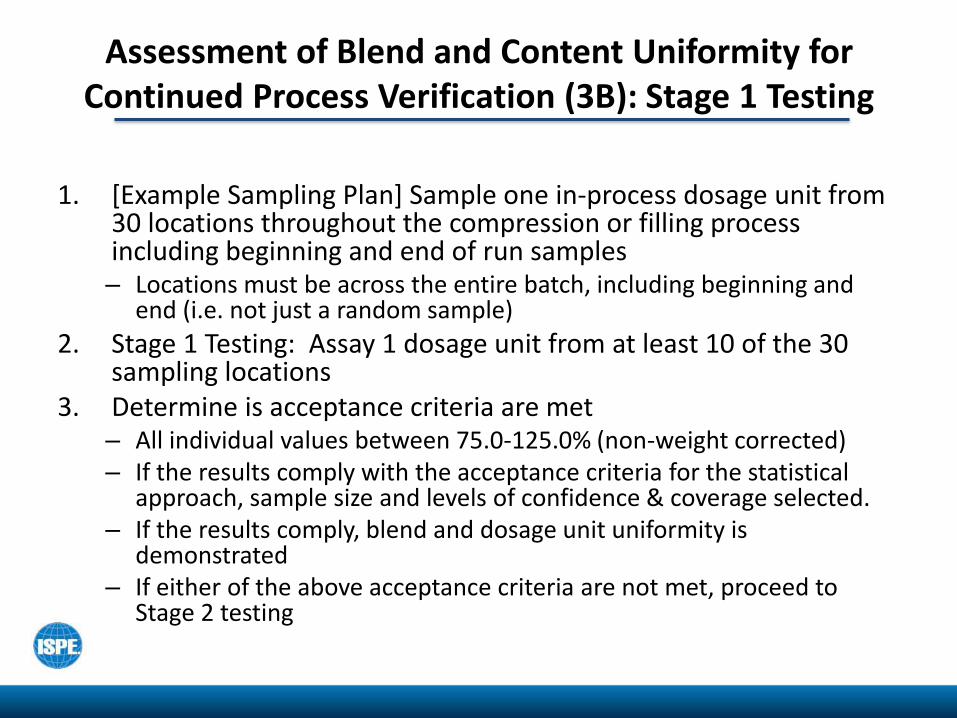
Assessment of Blend and Content Uniformity for Continued Process Verification (3B): Stage 1 Testing
1. [Example Sampling Plan] Sample one in-process dosage unit from 30 locations throughout the compression or filling process including beginning and end of run samples – Locations must be across the entire batch, including beginning and
end (i.e. not just a random sample)
2. Stage 1 Testing: Assay 1 dosage unit from at least 10 of the 30 sampling locations
3. Determine is acceptance criteria are met – All individual values between 75.0-125.0% (non-weight corrected) – If the results comply with the acceptance criteria for the statistical
approach, sample size and levels of confidence & coverage selected. – If the results comply, blend and dosage unit uniformity is
demonstrated – If either of the above acceptance criteria are not met, proceed to
Stage 2 testing
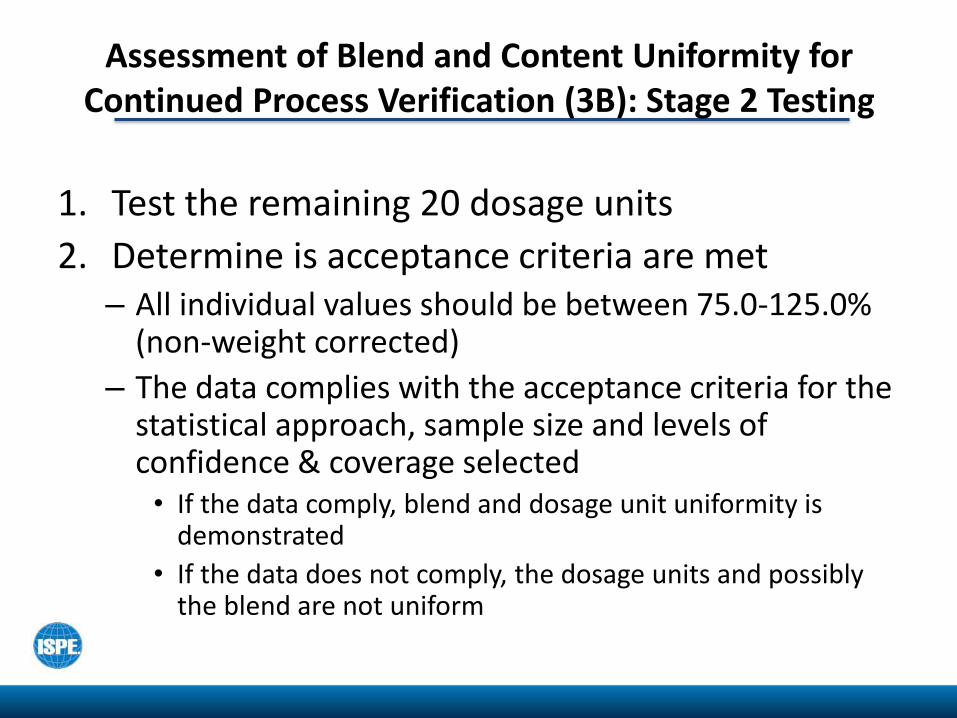
Assessment of Blend and Content Uniformity for Continued Process Verification (3B): Stage 2 Testing
1. Test the remaining 20 dosage units
2. Determine is acceptance criteria are met – All individual values should be between 75.0-125.0%
(non-weight corrected)
– The data complies with the acceptance criteria for the statistical approach, sample size and levels of confidence & coverage selected • If the data comply, blend and dosage unit uniformity is
demonstrated
• If the data does not comply, the dosage units and possibly the blend are not uniform
Assessment of Blend and Content Uniformity for Continued Process Verification (3A): Stage 2 Testing
• For products with blend SDs 3.1-5.0% and/or required Stage 2 dosage unit testing during Process Qualification: – Additional samples may be needed during Continued
Process Verification (Stage 3A) – Number of dosage units assayed should be risk based
• Higher SDs (4.0-5.0%) comparable to Process Qualification Stage 2 quantities
• Moderate SDs (3.1-4.0%) comparable to Process Qualification Stage 2 quantities.
• Quantities tested can be reduced if: – Process changes improve blend and/or dosage unit uniformity – A due diligence effort fails to improve the process resulting in high
but consistent (and acceptable) SDs, indicating its the best the process can do
Comments Regarding Blend Uniformity
• Blend uniformity analysis should be performed during Process Design and Process Qualification batches – Do not skip blend uniformity testing and default directly to dosage units – BUA can be performed for any mixing operation, although the final blend
(lubricated) is the best indicator prior to compression or filling
• Fewer sampling locations may be justified for smaller scale batches (e.g., early Process Design batches; small Process Qualification and commercial batch sizes) – Sample at least 3 blend samples and at least 3 dosage units from each location – Revised sampling plans must be appropriate for assuring acceptable blend and
dosage unit uniformity – Acceptance criteria may be adjusted to be phase appropriate (especially
during Process Design)
• Situations may exist where it is not possible to sample blends – e.g., Potent drugs manufactured in high containment equipment (significant
operator safety risks)
Comments Regarding Blend Uniformity (Continued)
• Recommend a 2-stage approach for the assessment of blend uniformity
– Unnecessary to assay blend replicates if SD ≤ 3.0% for the first set of samples
• Total SD, between location and within location variance components would be very small
– If SD > 3.0%, VCA information could identify sources of variability, and opportunities to improve blend uniformity
• Weight correction is justified when using dosage unit content uniformity as a surrogate test to demonstrate blend uniformity
– In-process dosage units must be sampled over the entire batch to assure the entire blender is uniform, including beginning and end of run
• Weight correction is not allowed when using dosage unit content uniformity data for batch release
• If the in-process dosage unit is not the final dosage form (e.g., tablet core versus film coated tablet) demonstrate content uniformity is not significantly impacted during subsequent unit operations (e.g., film coating)
Investigations
• Blend SD of 3.1 - 5.0% – Blend uniformity is acceptable, but proceed to Stage 2 in-process
dosage unit testing – Group recommends performing VCA on the blend and dosage unit
data to assess between location and within location variance components to identify opportunities to improve blend uniformity
• Blend SD >5.0% – Conduct an investigation (including VCA) to determine if the variability
was due to a non-blending issue (e.g., sampling bias, analytical error or other non-formulation/process causes) • Compare blend and dosage unit variance components • If an error can be demonstrated and justified, implement corrective
measures and proceed to Stage 2 dosage unit testing • If the high SD is product/process related, then blend uniformity is
unacceptable and further formulation and/or process development is required for the product
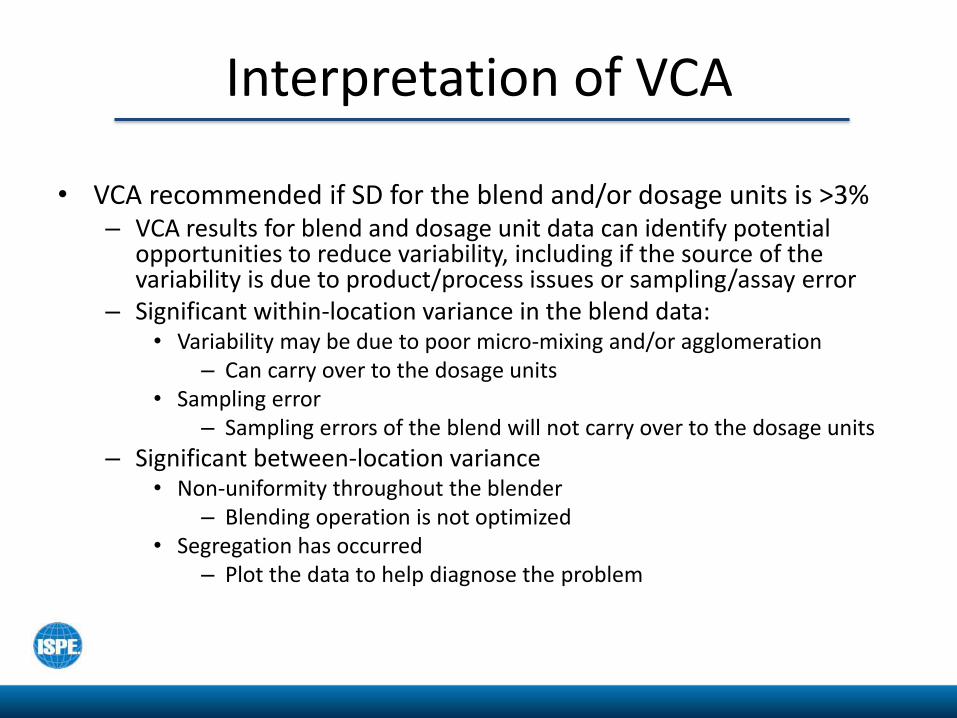
Interpretation of VCA
• VCA recommended if SD for the blend and/or dosage units is >3% – VCA results for blend and dosage unit data can identify potential
opportunities to reduce variability, including if the source of the variability is due to product/process issues or sampling/assay error
– Significant within-location variance in the blend data: • Variability may be due to poor micro-mixing and/or agglomeration
– Can carry over to the dosage units • Sampling error
– Sampling errors of the blend will not carry over to the dosage units
– Significant between-location variance • Non-uniformity throughout the blender
– Blending operation is not optimized • Segregation has occurred
– Plot the data to help diagnose the problem
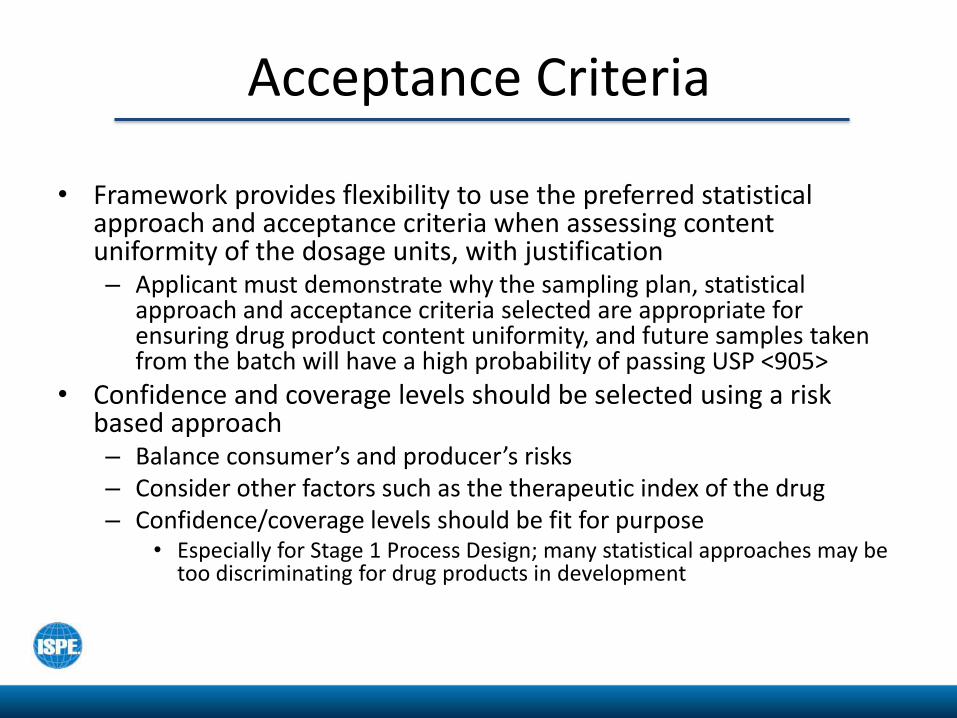
Acceptance Criteria
• Framework provides flexibility to use the preferred statistical approach and acceptance criteria when assessing content uniformity of the dosage units, with justification – Applicant must demonstrate why the sampling plan, statistical
approach and acceptance criteria selected are appropriate for ensuring drug product content uniformity, and future samples taken from the batch will have a high probability of passing USP <905>
• Confidence and coverage levels should be selected using a risk based approach – Balance consumer’s and producer’s risks – Consider other factors such as the therapeutic index of the drug – Confidence/coverage levels should be fit for purpose
• Especially for Stage 1 Process Design; many statistical approaches may be too discriminating for drug products in development
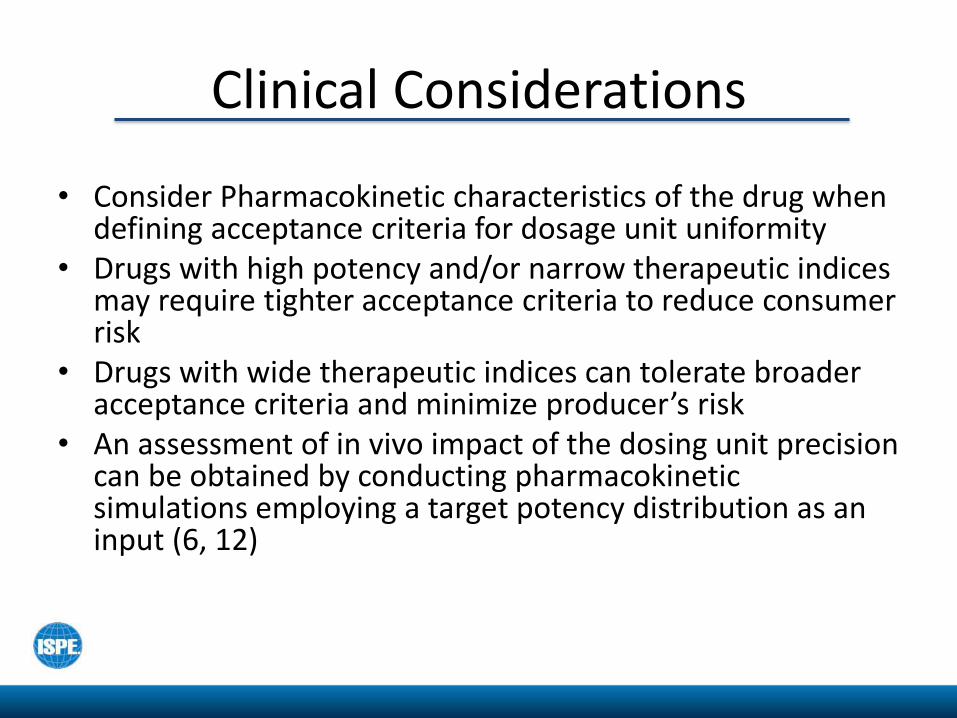
Clinical Considerations
• Consider Pharmacokinetic characteristics of the drug when defining acceptance criteria for dosage unit uniformity
• Drugs with high potency and/or narrow therapeutic indices may require tighter acceptance criteria to reduce consumer risk
• Drugs with wide therapeutic indices can tolerate broader acceptance criteria and minimize producer’s risk
• An assessment of in vivo impact of the dosing unit precision can be obtained by conducting pharmacokinetic simulations employing a target potency distribution as an input (6, 12)
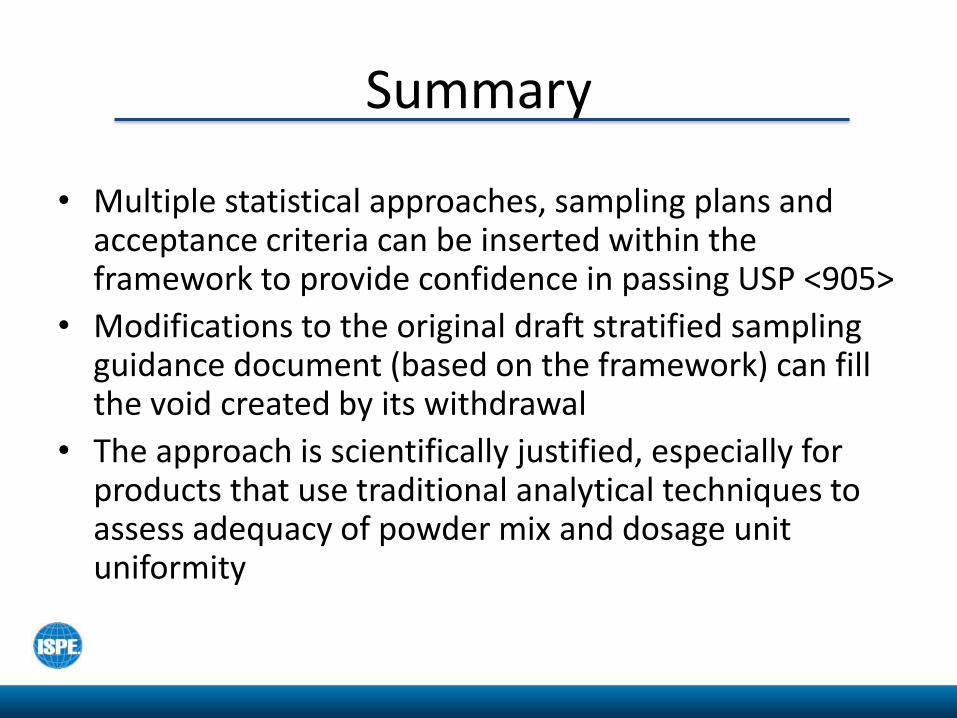
Summary
• Multiple statistical approaches, sampling plans and acceptance criteria can be inserted within the framework to provide confidence in passing USP <905>
• Modifications to the original draft stratified sampling guidance document (based on the framework) can fill the void created by its withdrawal
• The approach is scientifically justified, especially for products that use traditional analytical techniques to assess adequacy of powder mix and dosage unit uniformity
References
1. Guidance for Industry, “Powder Blends and Finished Dosage Units – Stratified In-Process Dosage Unit Sampling and Assessment,” U.S. Department of Health and Human Services, Food and Drug Administration, Center for Drug Evaluation and Research (CDER), October 2003, Pharmaceutical CGMPs.
2. Federal Register / Vol. 78, No. 152, p. 48175-48176, August 7, 2013/Notices.
3. Questions and Answers on Current Good Manufacturing Practices, Good Guidance Practices, Level 2 Guidance – Production and Process Controls, CDER/OC Office of Manufacturing and Product Quality: CGMP Subject Matter Contacts, 6 August 2013. http://www.fda.gov/Drugs/GuidanceComplianceRegulatoryInformation/Guidances/ucm124782.htm.
4. United States Pharmacopeia Convention, USP 37 NF 32, USP General Chapter <905> Uniformity of Dosage Units, General Notices and Requirements, Section 3.10, Applicability of Standards.
5. “Stratified Sampling” presented at 2013 ISPE Annual Meeting, Washington Marriott Wardman Park, Washington, DC, 3-6 November 2013.
6. Bergum J., et. al., Current Events in Blend and Content Uniformity, Pharmaceutical Engineering, March/April 2014, Vol. 34, No. 2, p. 1-10.
7. 21 CFR 211.110, Code of Federal Regulations, Title 21, Volume 4, Revised as of April 1, 2014.
8. Guidance for Industry, “Process Validation: General Principles and Practices,” U.S. Department of Health and Human Services, Food and Drug Administration, Center for Drug Evaluation and Research (CDER), Center for Biologics Evaluation and Research (CBER), Center for Veterinary Medicine (CVM), January 2011, Current Good Manufacturing Practices, Revision 1.
9. Bergum J, Parks T, et.al. Assessment of Blend and Content Uniformity: Technical Discussion of Sampling Plans and Application of ASTM E2709/E2810, submitted to J. Pharm. Innov., November, 2014.
10. Bergum J., Tolerance Interval Alternative to ASTM E2709/E2810 Methodology To Provide Assurance of Passing the USP Uniformity of Dosage Unit (UDU) Test <905>, submitted to Pharmaceutical Engineering, October, 2014.
11. De los Santos, P.; Liu, J.; Pfahler, L.; Harrington, B.; Vukovinsky, K.; “Performance Characteristics and Alternative Approaches for the ASTM E2709/2810 (CUDAL) Method for Ensuring that a Product Meets USP <905> Uniformity of Dosage Units”, Submitted to Pharmaceutical Engineering, October 2014.
12. Tejwani R. “Relating Blend Uniformity Specification to the Finished Product” presented at 2013 ISPE Annual Meeting, Washington Marriott Wardman Park, Washington, DC, November 6, 2013.