Embed Size (px)
Citation preview

1 FERCo-P121
Recent Experiences Tuning SCR Systems L. Muzio, R. Smith, D. Shore, G. Quartucy, Q. Qader Fossil Energy Research Corp., 23342C South Pointe, Laguna Hills, CA 92653
ABSTRACT An important step in starting up an SCR system is tuning the AIG to obtain uniform NH3/NOx ratios across the catalyst. In addition, it is also of interest to assess the velocity distribution across the catalyst surface. FERCo utilizes a technique involving NOx measurements alone at the catalyst exit to characterize the NH3/NOx distribution across the catalyst surface. This involves making outlet NOx measurements with the ammonia turned off, then again with the ammonia injection set to give a modest level of NOx reduction (i.e., 50 – 60%).
A novel approach has also been developed using catalyst outlet NOx measurements to determine the velocity distribution across the catalyst.
These measurements are streamlined using FERCo’s MCDA (Multipoint-Multigas-Combustion Diagnostic Analyzer) analyzer with AIG tuning usually completed in nominally three days. Examples are presented for both boiler and gas turbine SCR systems.
INTRODUCTION SCR (Selective Catalytic Reduction) is a key post-combustion NOx control technology that has become the method of choice by utilities to comply with increasingly stringent NOx regulations. Over 100 GW of SCR are expected to be installed in the U.S. Many of these SCR systems are being designed for high NOx reduction efficiencies of over 90% while minimizing NH3 slip to below 2 ppm. In coal-fired boilers, high NH3 slip has an adverse impact on cold-end equipment located downstream of the SCR reactor. The concerns include deposition, plugging and potential corrosion. On natural gas-fired units, NH3 slip is primarily a regulatory issue.
The parameters that are important in achieving the concomitant requirements of high NOx reduction and low NH3 slip are a uniform velocity distribution at the ammonia injection grid (AIG) and catalyst inlet, a uniform NOx distribution at the AIG, and a uniform temperature and NH3/NOx ratio distribution at the catalyst inlet. Uniform velocity, NOx and temperature distribution are achieved by optimizing the ductwork design by the use of turning vanes, baffles, and perforated plates. Uniform NOx distribution at the AIG facilitates achieving a more uniform NH3/NOx ratio at the catalyst. Uniform temperature distribution maintains uniform activity at high load and minimizes the deposition of ammonium bisulfate at low loads.
Of these parameters, the one that has the largest impact on achieving high levels of NOx reduction with low NH3 slip is the NH3/NOx ratio distribution at the catalyst surface. Large local variations in NH3/NOx distribution result in NH3 slip as NH3/NOx ratios greater than unity mean that there are local areas of excess ammonia that pass through the catalyst unreacted.
2 FERCo-P121
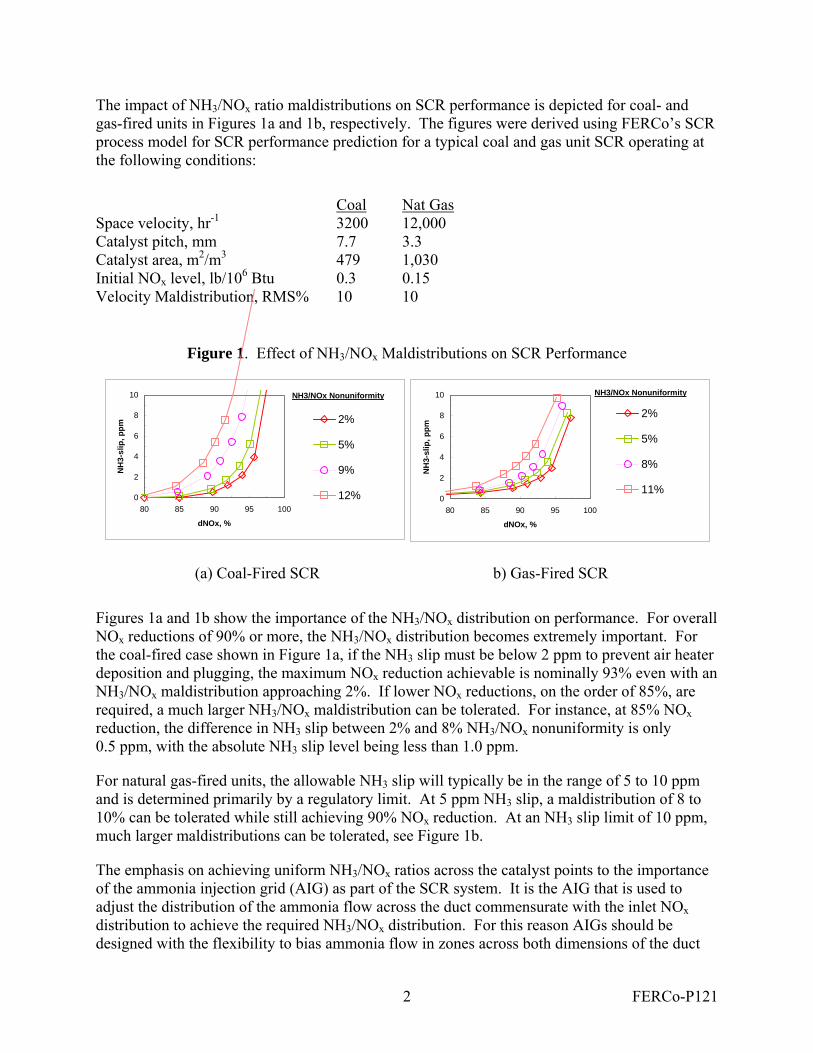
The impact of NH3/NOx ratio maldistributions on SCR performance is depicted for coal- and gas-fired units in Figures 1a and 1b, respectively. The figures were derived using FERCo’s SCR process model for SCR performance prediction for a typical coal and gas unit SCR operating at the following conditions:
Coal Nat Gas Space velocity, hr-1 3200 12,000 Catalyst pitch, mm 7.7 3.3 Catalyst area, m2/m3 479 1,030 Initial NOx level, lb/106 Btu 0.3 0.15 Velocity Maldistribution, RMS% 10 10
Figure 1. Effect of NH3/NOx Maldistributions on SCR Performance
(a) Coal-Fired SCR b) Gas-Fired SCR
Figures 1a and 1b show the importance of the NH3/NOx distribution on performance. For overall NOx reductions of 90% or more, the NH3/NOx distribution becomes extremely important. For the coal-fired case shown in Figure 1a, if the NH3 slip must be below 2 ppm to prevent air heater deposition and plugging, the maximum NOx reduction achievable is nominally 93% even with an NH3/NOx maldistribution approaching 2%. If lower NOx reductions, on the order of 85%, are required, a much larger NH3/NOx maldistribution can be tolerated. For instance, at 85% NOx reduction, the difference in NH3 slip between 2% and 8% NH3/NOx nonuniformity is only 0.5 ppm, with the absolute NH3 slip level being less than 1.0 ppm.
For natural gas-fired units, the allowable NH3 slip will typically be in the range of 5 to 10 ppm and is determined primarily by a regulatory limit. At 5 ppm NH3 slip, a maldistribution of 8 to 10% can be tolerated while still achieving 90% NOx reduction. At an NH3 slip limit of 10 ppm, much larger maldistributions can be tolerated, see Figure 1b.
The emphasis on achieving uniform NH3/NOx ratios across the catalyst points to the importance of the ammonia injection grid (AIG) as part of the SCR system. It is the AIG that is used to adjust the distribution of the ammonia flow across the duct commensurate with the inlet NOx distribution to achieve the required NH3/NOx distribution. For this reason AIGs should be designed with the flexibility to bias ammonia flow in zones across both dimensions of the duct
0
2
4
6
8
10
80 85 90 95 100
dNOx, %
NH
3-sl
ip, p
pm2%
5%
8%
11%
NH3/NOx Nonuniformity
0
2
4
6
8
10
80 85 90 95 100
dNOx, %
NH
3-sl
ip, p
pm
2%
5%
9%
12%
NH3/NOx Nonuniformity
3 FERCo-P121
even when static mixers are utilized. Although ductwork design is optimized to achieve a uniform velocity distribution at the AIG inlet, the actual NOx distribution may not be uniform due to the unit’s boiler and combustion design and operating characteristics. Thus, AIG tuning is one of the key startup activities of an SCR installation.
FERCo has been actively involved in tuning SCR systems and has developed an approach using instrumentation and techniques that allow the NH3/NOx distribution to be measured by making only NOx measurements at the catalyst exit. FERCo has recently investigated the use of a similar technique to determine the velocity profile at the catalyst.
SCR TUNING APPROACH
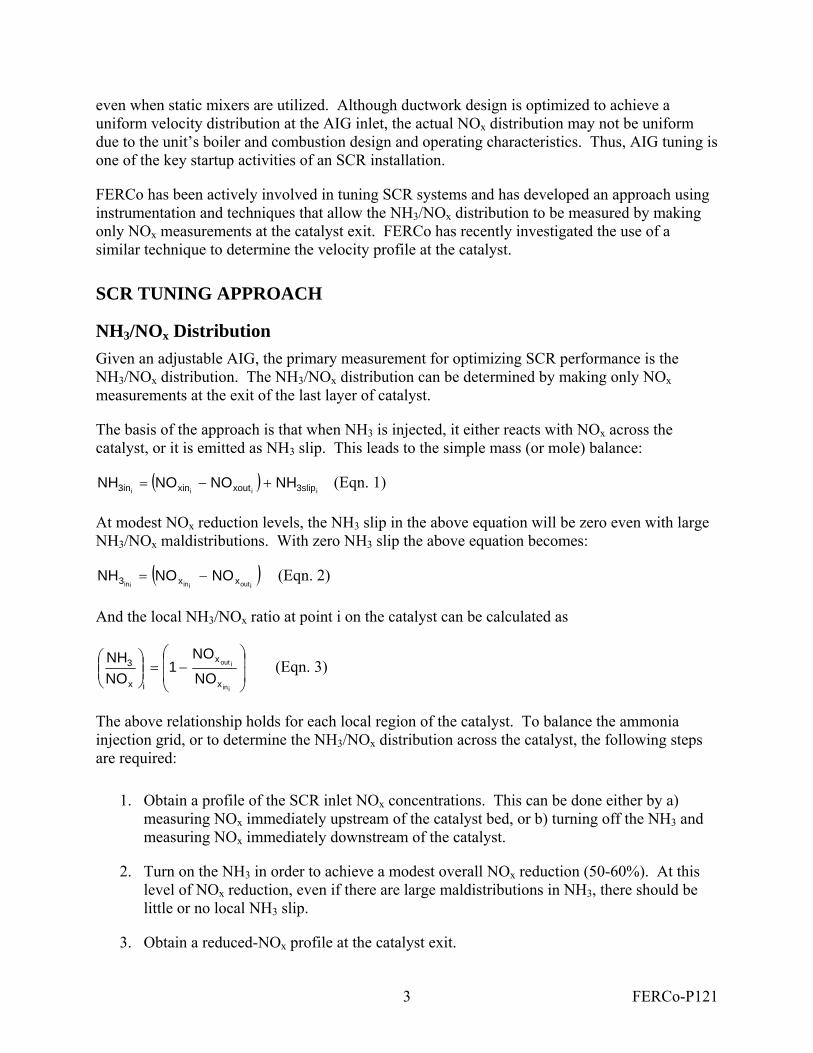
NH3/NOx Distribution Given an adjustable AIG, the primary measurement for optimizing SCR performance is the NH3/NOx distribution. The NH3/NOx distribution can be determined by making only NOx measurements at the exit of the last layer of catalyst.
The basis of the approach is that when NH3 is injected, it either reacts with NOx across the catalyst, or it is emitted as NH3 slip. This leads to the simple mass (or mole) balance:
( )iiii 3slipxoutxin3in NHNONONH +−= (Eqn. 1)
At modest NOx reduction levels, the NH3 slip in the above equation will be zero even with large NH3/NOx maldistributions. With zero NH3 slip the above equation becomes:
( )ioutiiniin xx3 NONONH −= (Eqn. 2)
And the local NH3/NOx ratio at point i on the catalyst can be calculated as
⎟⎟
⎠
⎞
⎜⎜
⎝
⎛−=⎟⎟
⎠
⎞⎜⎜⎝
⎛
iin
iout
x
x
ix
3
NO
NO1
NONH (Eqn. 3)
The above relationship holds for each local region of the catalyst. To balance the ammonia injection grid, or to determine the NH3/NOx distribution across the catalyst, the following steps are required:
1. Obtain a profile of the SCR inlet NOx concentrations. This can be done either by a) measuring NOx immediately upstream of the catalyst bed, or b) turning off the NH3 and measuring NOx immediately downstream of the catalyst.
2. Turn on the NH3 in order to achieve a modest overall NOx reduction (50-60%). At this level of NOx reduction, even if there are large maldistributions in NH3, there should be little or no local NH3 slip.
3. Obtain a reduced-NOx profile at the catalyst exit.
4 FERCo-P121
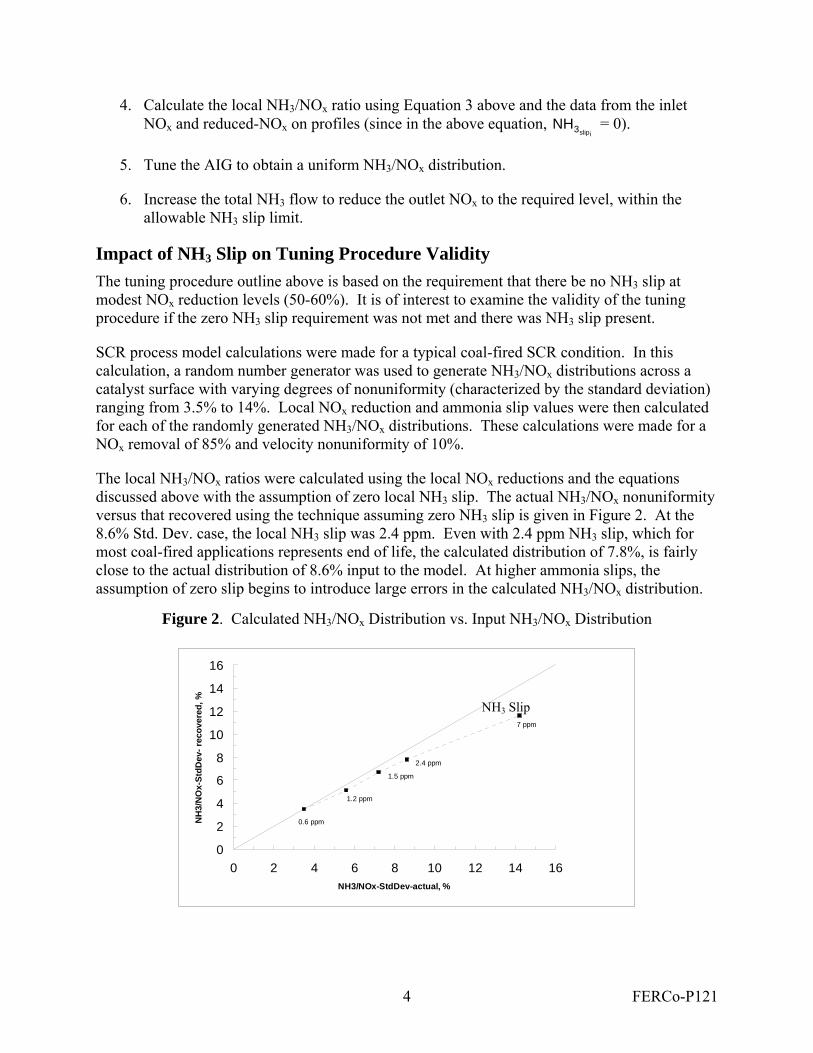
4. Calculate the local NH3/NOx ratio using Equation 3 above and the data from the inlet NOx and reduced-NOx on profiles (since in the above equation,
islip3NH = 0).
5. Tune the AIG to obtain a uniform NH3/NOx distribution.
6. Increase the total NH3 flow to reduce the outlet NOx to the required level, within the allowable NH3 slip limit.
Impact of NH3 Slip on Tuning Procedure Validity The tuning procedure outline above is based on the requirement that there be no NH3 slip at modest NOx reduction levels (50-60%). It is of interest to examine the validity of the tuning procedure if the zero NH3 slip requirement was not met and there was NH3 slip present.
SCR process model calculations were made for a typical coal-fired SCR condition. In this calculation, a random number generator was used to generate NH3/NOx distributions across a catalyst surface with varying degrees of nonuniformity (characterized by the standard deviation) ranging from 3.5% to 14%. Local NOx reduction and ammonia slip values were then calculated for each of the randomly generated NH3/NOx distributions. These calculations were made for a NOx removal of 85% and velocity nonuniformity of 10%.
The local NH3/NOx ratios were calculated using the local NOx reductions and the equations discussed above with the assumption of zero local NH3 slip. The actual NH3/NOx nonuniformity versus that recovered using the technique assuming zero NH3 slip is given in Figure 2. At the 8.6% Std. Dev. case, the local NH3 slip was 2.4 ppm. Even with 2.4 ppm NH3 slip, which for most coal-fired applications represents end of life, the calculated distribution of 7.8%, is fairly close to the actual distribution of 8.6% input to the model. At higher ammonia slips, the assumption of zero slip begins to introduce large errors in the calculated NH3/NOx distribution.
Figure 2. Calculated NH3/NOx Distribution vs. Input NH3/NOx Distribution
0
2
4
6
8
10
12
14
16
0 2 4 6 8 10 12 14 16NH3/NOx-StdDev-actual, %
NH
3/N
Ox-
StdD
ev- r
ecov
ered
, %
0.6 ppm
1.2 ppm
1.5 ppm
2.4 ppm
7 ppm
NH3 Slip
5 FERCo-P121
The slip sensitivity analysis illustrates that the tuning procedure assuming zero slip is valid at modest NOx reduction levels even if there is some NH3 slip present. It also illustrates that for installations for which ammonia slip at the design NOx reduction is very low (1 or 2 ppm), the outlet NOx measurement with NH3 on (Step 2 in the tuning procedure) can be performed at the design NOx reduction condition instead of the 50-60% reduction condition. A similar analysis could be conducted for a natural gas-fired SCR to ascertain how much NH3 slip can be tolerated and still yield valid NH3/NOx distribution.
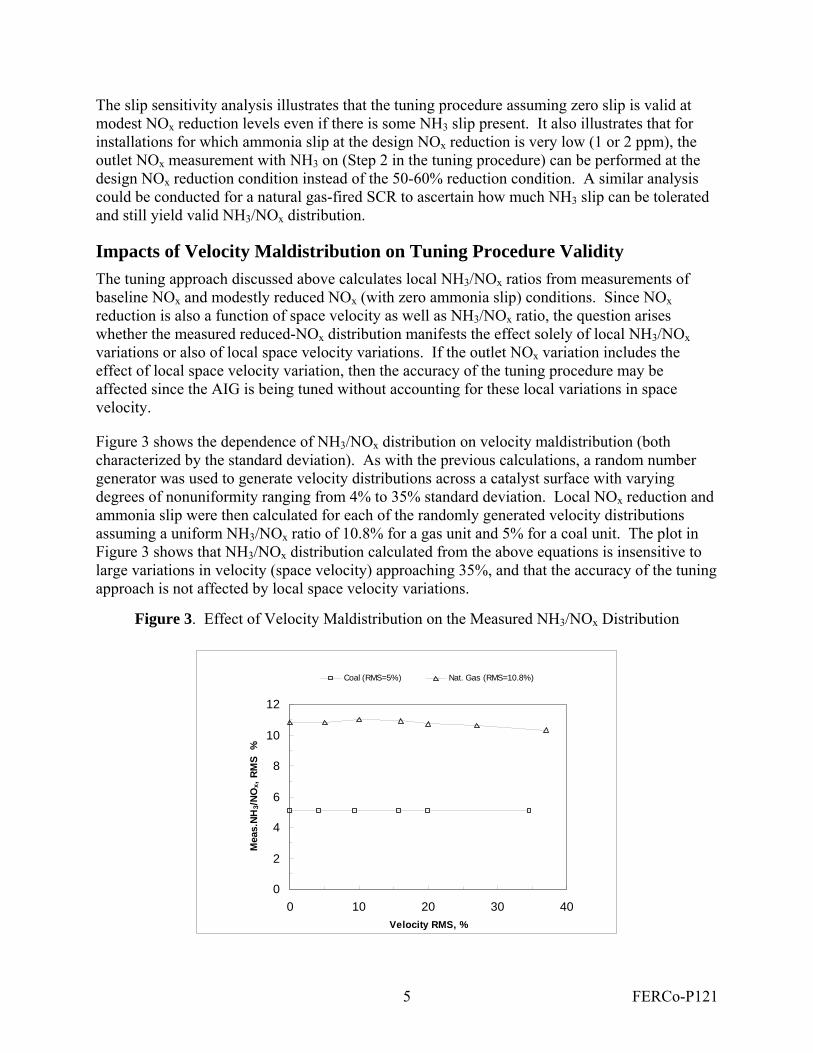
Impacts of Velocity Maldistribution on Tuning Procedure Validity The tuning approach discussed above calculates local NH3/NOx ratios from measurements of baseline NOx and modestly reduced NOx (with zero ammonia slip) conditions. Since NOx reduction is also a function of space velocity as well as NH3/NOx ratio, the question arises whether the measured reduced-NOx distribution manifests the effect solely of local NH3/NOx variations or also of local space velocity variations. If the outlet NOx variation includes the effect of local space velocity variation, then the accuracy of the tuning procedure may be affected since the AIG is being tuned without accounting for these local variations in space velocity.
Figure 3 shows the dependence of NH3/NOx distribution on velocity maldistribution (both characterized by the standard deviation). As with the previous calculations, a random number generator was used to generate velocity distributions across a catalyst surface with varying degrees of nonuniformity ranging from 4% to 35% standard deviation. Local NOx reduction and ammonia slip were then calculated for each of the randomly generated velocity distributions assuming a uniform NH3/NOx ratio of 10.8% for a gas unit and 5% for a coal unit. The plot in Figure 3 shows that NH3/NOx distribution calculated from the above equations is insensitive to large variations in velocity (space velocity) approaching 35%, and that the accuracy of the tuning approach is not affected by local space velocity variations.
Figure 3. Effect of Velocity Maldistribution on the Measured NH3/NOx Distribution
0
2
4
6
8
10
12
0 10 20 30 40Velocity RMS, %
Mea
s.N
H3/
NO
x, R
MS
%
Coal (RMS=5%) Nat. Gas (RMS=10.8%)
6 FERCo-P121
Test Equipment and Instrumentation To determine NH3/NOx or velocity distribution at the catalyst inlet, point-to-point NOx measurements at the catalyst exit are needed. Depending on the size of the SCR reactor, it is not uncommon for a reactor to have a 36- to 48-probe grid at the catalyst exit, or 96 probes for the entire SCR system if it is a two-reactor design. At a measurement rate of 2 to 3 minutes per point, it will require between 1.5 to 2.5 hours per reactor, or 3 – 5 hours to obtain a complete NOx profile.
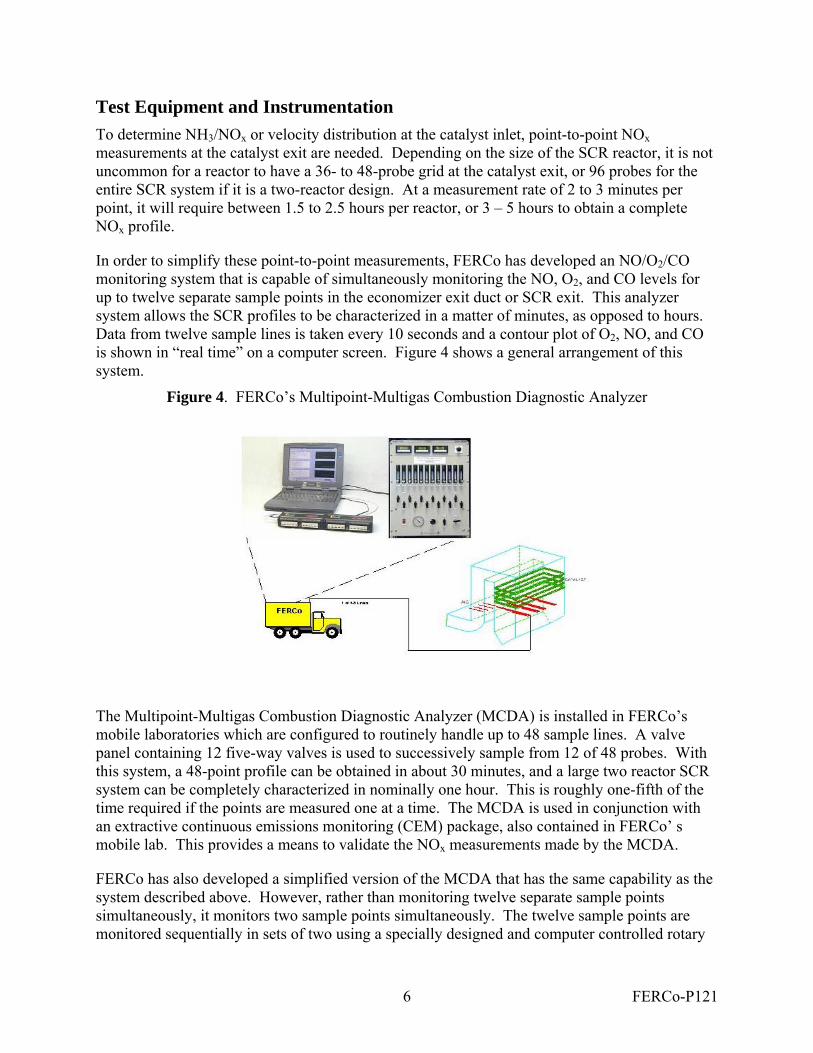
In order to simplify these point-to-point measurements, FERCo has developed an NO/O2/CO monitoring system that is capable of simultaneously monitoring the NO, O2, and CO levels for up to twelve separate sample points in the economizer exit duct or SCR exit. This analyzer system allows the SCR profiles to be characterized in a matter of minutes, as opposed to hours. Data from twelve sample lines is taken every 10 seconds and a contour plot of O2, NO, and CO is shown in “real time” on a computer screen. Figure 4 shows a general arrangement of this system.
Figure 4. FERCo’s Multipoint-Multigas Combustion Diagnostic Analyzer
The Multipoint-Multigas Combustion Diagnostic Analyzer (MCDA) is installed in FERCo’s mobile laboratories which are configured to routinely handle up to 48 sample lines. A valve panel containing 12 five-way valves is used to successively sample from 12 of 48 probes. With this system, a 48-point profile can be obtained in about 30 minutes, and a large two reactor SCR system can be completely characterized in nominally one hour. This is roughly one-fifth of the time required if the points are measured one at a time. The MCDA is used in conjunction with an extractive continuous emissions monitoring (CEM) package, also contained in FERCo’ s mobile lab. This provides a means to validate the NOx measurements made by the MCDA.
FERCo has also developed a simplified version of the MCDA that has the same capability as the system described above. However, rather than monitoring twelve separate sample points simultaneously, it monitors two sample points simultaneously. The twelve sample points are monitored sequentially in sets of two using a specially designed and computer controlled rotary

7 FERCo-P121
valve. While the data collection rate is a little slower than the 12-point MCDA this system has greater portability and lower testing costs.
AIG OPTIMIZATION EXAMPLE CASES FERCo has been successful in applying the approach described in this paper to tune the ammonia injection grids on both boiler and gas turbine SCR systems. Results from some of these tuning efforts using this technique are described below.
A 230 MW Natural Gas-Fired Boiler A 230 MW tangentially fired gas-fired boiler was retrofitted with an SCR system. Results of the AIG tuning are shown below in Figure 5. Figure 5a shows the baseline test of the as-found condition with no ammonia injection. With the addition of enough ammonia flow to reduce NOx emissions about 70% (with all valves set for equal ammonia flow), the NOx and NH3/NOx profiles of Figures 5b and 5c were achieved. The variation in NH3/NOx distribution had a standard deviation of 9.7%.
Figure 5. 230 MW Natural Gas-Fired Boiler
Figure 5d shows the optimized NH3/NOx profile after nominally four AIG valve adjustments. The standard deviation was 4.1%, reduced from 9.7%. The NH3 slips were measured and found to be well within the allowable limit of 10 ppm, in fact the NH3 slip was less than 2 ppm.
14 MW Gas Turbine with Waste Heat Recovery Boiler
0 10 20 30
a. Baseline NOx: Ammonia Off
0
10
20
Wes
t
Eas
t
0 10 20 30
b. Outlet NOx @ Nominally 70% dNOx
0
10
20
Wes
t
Eas
t
0 10 20 30
c. Calculated Normalized NH3/NOx: AIG Valves all equal (9.7% Std, Dev.)
0
10
20
Wes
t
East
0 10 20 30
d. Optimized AIG: Normalized NH3/NOx Ratio (4.1% Std. Dev.)
0
10
20
Wes
t
East
8 FERCo-P121
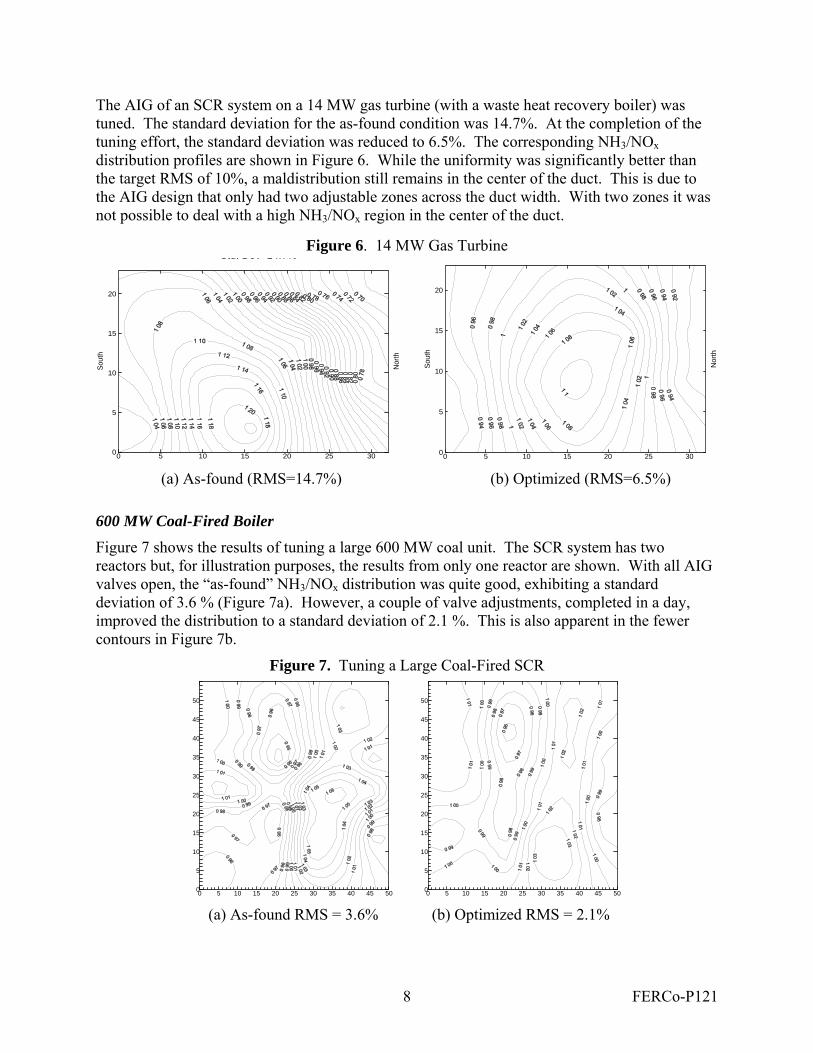
The AIG of an SCR system on a 14 MW gas turbine (with a waste heat recovery boiler) was tuned. The standard deviation for the as-found condition was 14.7%. At the completion of the tuning effort, the standard deviation was reduced to 6.5%. The corresponding NH3/NOx distribution profiles are shown in Figure 6. While the uniformity was significantly better than the target RMS of 10%, a maldistribution still remains in the center of the duct. This is due to the AIG design that only had two adjustable zones across the duct width. With two zones it was not possible to deal with a high NH3/NOx region in the center of the duct.
Figure 6. 14 MW Gas Turbine
0 5 10 15 20 25 300
5
10
15
20
Sout
h
Nor
th
0 5 10 15 20 25 300
5
10
15
20
Sout
h
Nor
th
Std. Dev 14.7%
(a) As-found (RMS=14.7%) (b) Optimized (RMS=6.5%)
600 MW Coal-Fired Boiler Figure 7 shows the results of tuning a large 600 MW coal unit. The SCR system has two reactors but, for illustration purposes, the results from only one reactor are shown. With all AIG valves open, the “as-found” NH3/NOx distribution was quite good, exhibiting a standard deviation of 3.6 % (Figure 7a). However, a couple of valve adjustments, completed in a day, improved the distribution to a standard deviation of 2.1 %. This is also apparent in the fewer contours in Figure 7b.
Figure 7. Tuning a Large Coal-Fired SCR
(a) As-found RMS = 3.6% (b) Optimized RMS = 2.1% 0 5 10 15 20 25 30 35 40 45 500
5
10
15
20
25
30
35
40
45
50
0 5 10 15 20 25 30 35 40 45 500
5
10
15
20
25
30
35
40
45
50
9 FERCo-P121
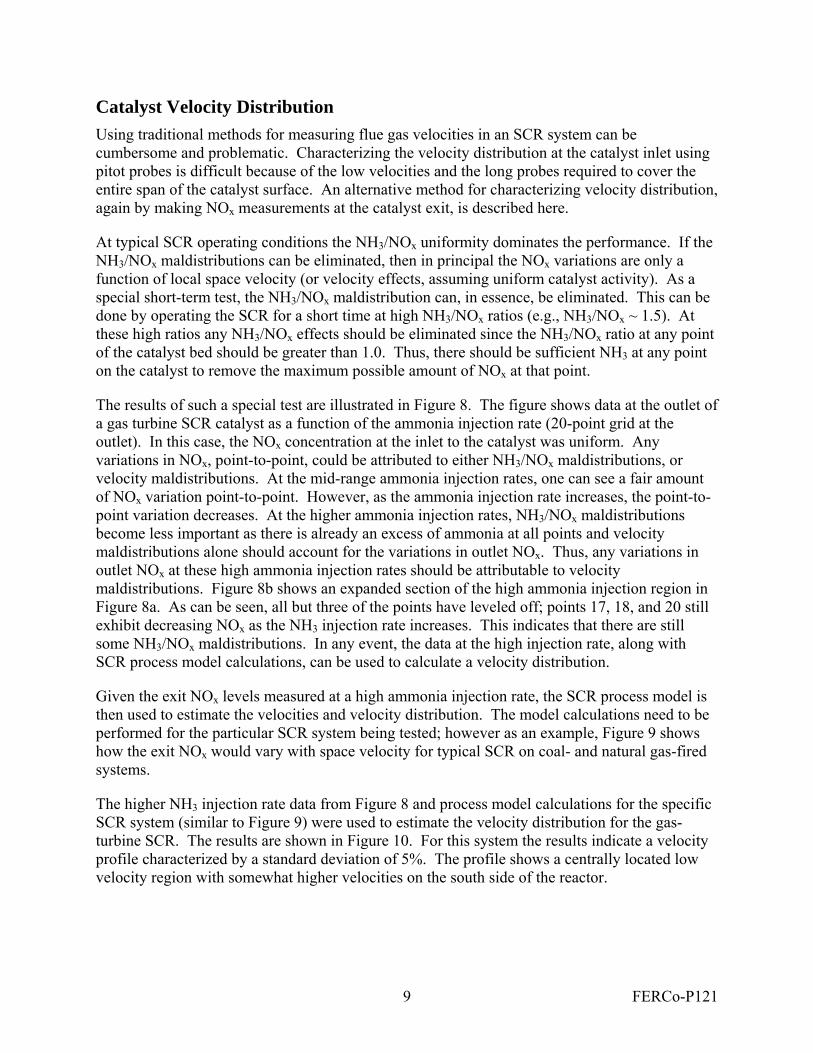
Catalyst Velocity Distribution Using traditional methods for measuring flue gas velocities in an SCR system can be cumbersome and problematic. Characterizing the velocity distribution at the catalyst inlet using pitot probes is difficult because of the low velocities and the long probes required to cover the entire span of the catalyst surface. An alternative method for characterizing velocity distribution, again by making NOx measurements at the catalyst exit, is described here.
At typical SCR operating conditions the NH3/NOx uniformity dominates the performance. If the NH3/NOx maldistributions can be eliminated, then in principal the NOx variations are only a function of local space velocity (or velocity effects, assuming uniform catalyst activity). As a special short-term test, the NH3/NOx maldistribution can, in essence, be eliminated. This can be done by operating the SCR for a short time at high NH3/NOx ratios (e.g., NH3/NOx ~ 1.5). At these high ratios any NH3/NOx effects should be eliminated since the NH3/NOx ratio at any point of the catalyst bed should be greater than 1.0. Thus, there should be sufficient NH3 at any point on the catalyst to remove the maximum possible amount of NOx at that point.
The results of such a special test are illustrated in Figure 8. The figure shows data at the outlet of a gas turbine SCR catalyst as a function of the ammonia injection rate (20-point grid at the outlet). In this case, the NOx concentration at the inlet to the catalyst was uniform. Any variations in NOx, point-to-point, could be attributed to either NH3/NOx maldistributions, or velocity maldistributions. At the mid-range ammonia injection rates, one can see a fair amount of NOx variation point-to-point. However, as the ammonia injection rate increases, the point-to-point variation decreases. At the higher ammonia injection rates, NH3/NOx maldistributions become less important as there is already an excess of ammonia at all points and velocity maldistributions alone should account for the variations in outlet NOx. Thus, any variations in outlet NOx at these high ammonia injection rates should be attributable to velocity maldistributions. Figure 8b shows an expanded section of the high ammonia injection region in Figure 8a. As can be seen, all but three of the points have leveled off; points 17, 18, and 20 still exhibit decreasing NOx as the NH3 injection rate increases. This indicates that there are still some NH3/NOx maldistributions. In any event, the data at the high injection rate, along with SCR process model calculations, can be used to calculate a velocity distribution.
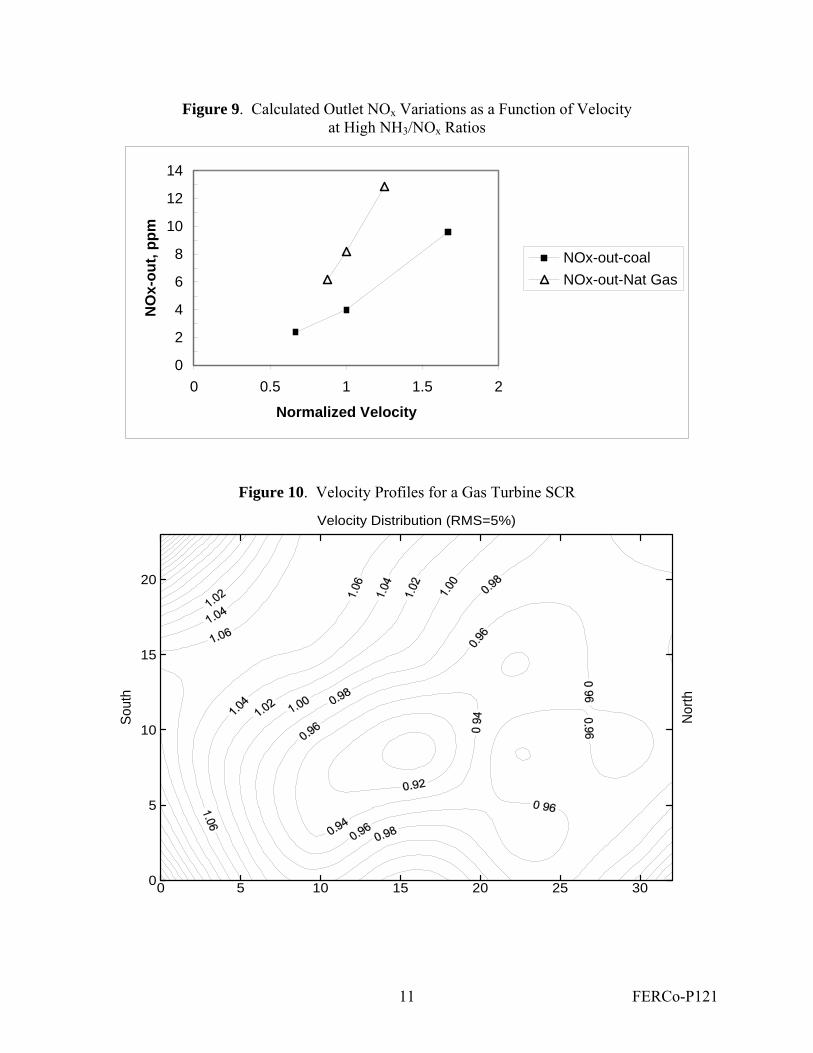
Given the exit NOx levels measured at a high ammonia injection rate, the SCR process model is then used to estimate the velocities and velocity distribution. The model calculations need to be performed for the particular SCR system being tested; however as an example, Figure 9 shows how the exit NOx would vary with space velocity for typical SCR on coal- and natural gas-fired systems.
The higher NH3 injection rate data from Figure 8 and process model calculations for the specific SCR system (similar to Figure 9) were used to estimate the velocity distribution for the gas-turbine SCR. The results are shown in Figure 10. For this system the results indicate a velocity profile characterized by a standard deviation of 5%. The profile shows a centrally located low velocity region with somewhat higher velocities on the south side of the reactor.

10 FERCo-P121
Figure 8. Outlet NOx vs. Ammonia Injection Rate for Individual Probes at Catalyst Exit (20-point Grid)
(b) expanded view
0
1
2
3
4
5
6
7
8
9
10
150 160 170 180 190 200
Am m onia Injection Rat e, lb/hr
Loca
l Out
let N
Ox,
ppm
raw
0
20
40
60
0 50 100 150 200
Ammonia Injection Rate , lb/hr
Loca
l Out
let N
Ox,
ppm
raw
pt-1pt-2pt-3pt-4pt-5pt-6pt-7pt-8pt-9pt-10pt-11pt-12pt-13pt-14pt-15pt-16pt-17pt-18pt-19pt-20
NOx variations due to velocity maldistribution NOx variations due
primarily to NH3/NOx maldistribution
(a)
11 FERCo-P121
Figure 9. Calculated Outlet NOx Variations as a Function of Velocity at High NH3/NOx Ratios
Figure 10. Velocity Profiles for a Gas Turbine SCR
0 5 10 15 20 25 30
Velocity Distribution (RMS=5%)
0
5
10
15
20
Sout
h
Nor
th
0
2
4
6
8
10
12
14
0 0.5 1 1.5 2
Normalized Velocity
NO
x-ou
t, pp
m
NOx-out-coalNOx-out-Nat Gas
12 FERCo-P121
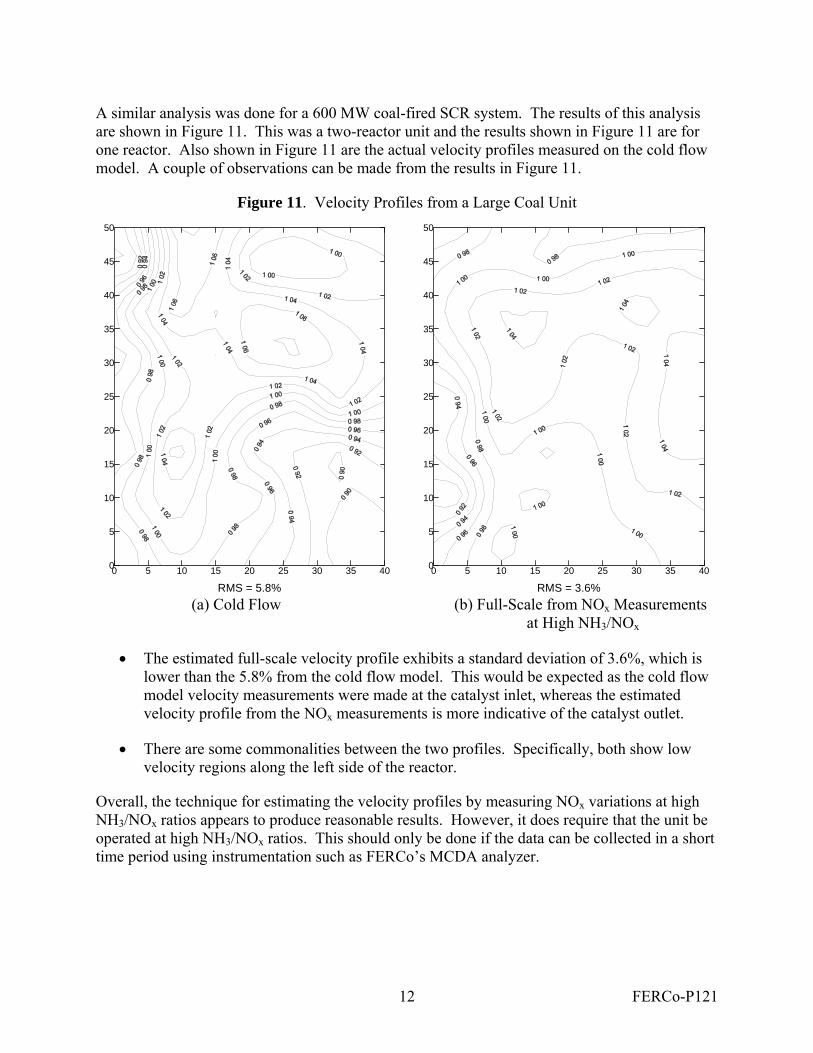
A similar analysis was done for a 600 MW coal-fired SCR system. The results of this analysis are shown in Figure 11. This was a two-reactor unit and the results shown in Figure 11 are for one reactor. Also shown in Figure 11 are the actual velocity profiles measured on the cold flow model. A couple of observations can be made from the results in Figure 11.
Figure 11. Velocity Profiles from a Large Coal Unit
(a) Cold Flow (b) Full-Scale from NOx Measurements at High NH3/NOx
• The estimated full-scale velocity profile exhibits a standard deviation of 3.6%, which is lower than the 5.8% from the cold flow model. This would be expected as the cold flow model velocity measurements were made at the catalyst inlet, whereas the estimated velocity profile from the NOx measurements is more indicative of the catalyst outlet.
• There are some commonalities between the two profiles. Specifically, both show low velocity regions along the left side of the reactor.
Overall, the technique for estimating the velocity profiles by measuring NOx variations at high NH3/NOx ratios appears to produce reasonable results. However, it does require that the unit be operated at high NH3/NOx ratios. This should only be done if the data can be collected in a short time period using instrumentation such as FERCo’s MCDA analyzer.
0 5 10 15 20 25 30 35 40
RMS = 3.6%
0
5
10
15
20
25
30
35
40
45
50
0 5 10 15 20 25 30 35 40
RMS = 5.8%
0
5
10
15
20
25
30
35
40
45
50
13 FERCo-P121
Catalyst Activity When a catalyst vendor determines catalyst activity, NOx reduction is measured across a catalyst sample with the laboratory system operating at a high NH3/NOx ratio. The activity is calculated using an equation of the form:
( )xv
∆NO11nA1K −=
K = activity
Av = area velocity
∆NOx = NOx reduction across the catalyst sample with NH3/NOx > 1
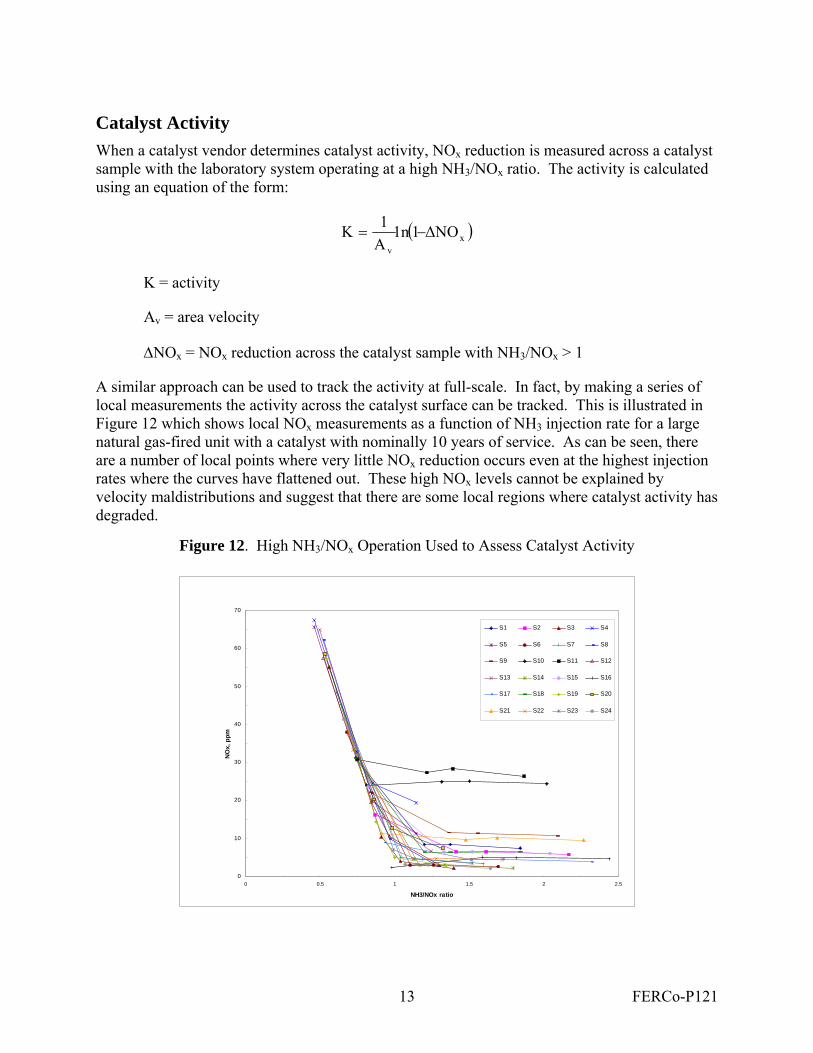
A similar approach can be used to track the activity at full-scale. In fact, by making a series of local measurements the activity across the catalyst surface can be tracked. This is illustrated in Figure 12 which shows local NOx measurements as a function of NH3 injection rate for a large natural gas-fired unit with a catalyst with nominally 10 years of service. As can be seen, there are a number of local points where very little NOx reduction occurs even at the highest injection rates where the curves have flattened out. These high NOx levels cannot be explained by velocity maldistributions and suggest that there are some local regions where catalyst activity has degraded.
Figure 12. High NH3/NOx Operation Used to Assess Catalyst Activity
0
10
20
30
40
50
60
70
0 0.5 1 1.5 2 2.5
NH3/NOx ratio
NO
x, p
pm
S1 S2 S3 S4
S5 S6 S7 S8
S9 S10 S11 S12
S13 S14 S15 S16
S17 S18 S19 S20
S21 S22 S23 S24
14 FERCo-P121
Conclusion SCR is a key post-combustion NOx control technology that is rapidly being implemented by utilities to comply with increasingly stringent NOx regulations. The effectiveness of an SCR system is contingent on satisfying the design criteria of uniformity for velocity and NH3/NOx distribution at the catalyst inlet. The NH3/NOx ratio uniformity has a first-order effect on SCR performance, and maldistribution of NH3/NOx affects not only NOx reduction but also the extent of NH3 slip. Uniform NH3/NOx distribution is achieved at system startup by tuning the AIG; thus AIG tuning is one of the key startup activities of an SCR installation.
This paper described an approach to tune or balance AIGs by making only NOx measurements at the catalyst exit. This is done in conjunction with a multipoint multigas measurement system that simplifies and streamlines this process making it possible to completely tune an SCR system in two to three days.
An approach to estimate velocity distributions across an SCR catalyst, again using only NOx measurements at the exit of the catalyst, was also described. This basic approach was also shown to be useful in assessing in situ catalyst activity.
FERCo has used this technique successfully to tune ammonia injection grids of SCR systems on gas- and coal-fired utility boilers and on gas turbines.
Key Words: SCR
AIG
Tuning