Embed Size (px)
Citation preview
Volume 11 • Issue 4 • 2019
65
Engineering Management in Production and Services
received: 15 June 2019accepted: 15 October 2019
Logistics decision-making based on the maturity assessment of imperfect knowledge
Lech Bukowski
A B S T R A C TThe main purpose of this article is to develop a method that allows for an objective quality assessment of imperfect knowledge, which is necessary for decision-making in logistics. The methodology aimed at achieving this goal is established on the system analysis of the entire process employed for obtaining, processing and using data and information as well as the knowledge generated on this basis. The result of this work is a general framework that can be used for managerial decision-making in smart systems that are part of Industry 4.0, and, in particular, Logistics 4.0. A key theoretical contribution of this framework is the concept for quantitative assessment of the maturity of imperfect knowledge acquired from Big Data. The practical implication of this concept is the possibility to use the framework for the assessment of the acceptable risk associated with a managerial decision. For this purpose, the article presents a brief example of how to use this methodology in the risk-taking decision-making process. Finally, the summary and discussion of the results are offered.
K E Y W O R D SIndustry 4.0, Logistics 4.0, Big Data, imperfect knowledge, knowledge maturity
DOI: 10.2478/emj-2019-0034
Corresponding author:
Lech Bukowski
WSB University in Dąbrowa Górnicza, Poland
e-mail: [email protected]
Introduction
The contemporary networked world, character-ised by the Internet of Things and Services, is leading to the emergence of smart grids in the field of energy supply, sustainable mobility strategies, such as smart mobility and smart logistics, and smart health in the realm of healthcare (Kagermann, Wahlster and Hel-big, 2013). In the area of manufacturing, this trend
led to the fourth stage of industrialisation — Industry 4.0, which focuses on creating smart products, proce-dures and processes. Smart factories are capable of managing complexity, are less susceptible to disrup-tions and able to manufacture goods more effectively and efficiently. In this environment, human beings, machines and resources communicate with each other in the same way as in a social network. Its
pages: 65-79
66
Volume 11 • Issue 4 • 2019Engineering Management in Production and Services
interfaces with smart mobility, smart logistics and smart grids will make the smart factory a key compo-nent of tomorrow’s smart infrastructures. This drives forward the transformation of conventional value chains and the emergence of new business models. A comprehensive literature analysis of the problems related to the challenges of the so-called the fourth industrial revolution is already discussed in the pub-lication by Ślusarczyk et al. (Ślusarczyk, Haseeb and Hussain, 2019) and will not be duplicated here.
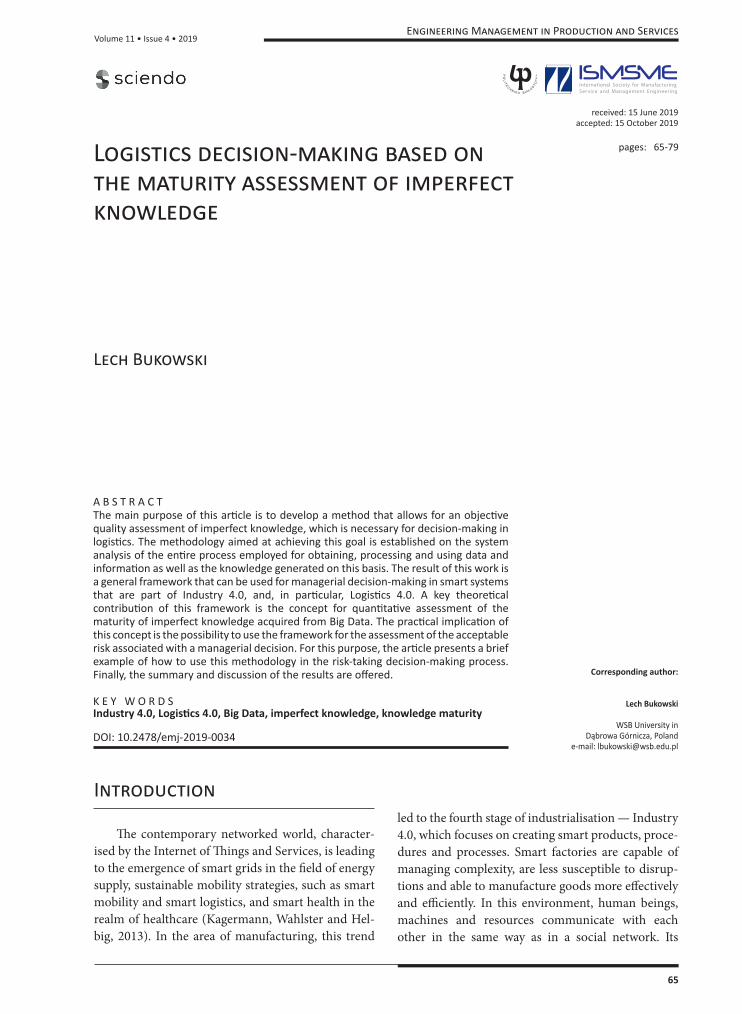
The implementation of Industrie 4.0 requires an interdisciplinary approach and close cooperation with other key areas. Consequently, logistics plays a key role in the mutual coordination of individual processes implemented under these systems. Fig. 1 presents a simplified interrelationship between indi-vidual subsystems that compose the “system of sys-tems” of Industry 4.0 (Bukowski, 2016a). Also, it illustrates the symbolic role of logistics management as Logistics 4.0. As the diagram suggests, smart equipment, which is operated using robots and sen-sors, as well as smart information and communica-tion technologies (ICT based on Big Data and Cloud Computing) are of fundamental importance for the effective implementation of processes under Industry 4.0 and Logistics 4.0. The quality of knowledge acquired from ICT has a particularly significant impact on making the right decisions within these systems. Therefore, an important issue is to develop a method that allows objective quality assessment of the entire process used to obtain and process data and information as well as the knowledge generated on this basis.
Fig. 1. ROC curve
The purpose of this article is to develop a method that allows for such an assessment based on the analy-sis of knowledge creation and decision-making using expert methods. The work is organised as follows: first, the evolution of the concept and the scope of logistics is characterised, followed by specific features of Logistics 4.0, and, on this basis, a new method for assessing knowledge maturity is proposed. Next, a brief example is presented, depicting the use of this method in the risk-taking decision-making process. Finally, the results are summarised and discussed.
1. Logistics evolution — from Logistics 1.0 to Logistics 4.0
The modern concept of “logistics” was shaped in the military field in the first half of the 19th century and included transport, accommodation and supply of military units, as well as transport, storage and supervision of goods intended for the army (Blaik, 2010; Michlowicz, 2002). In the 1950s, this concept of logistics started being transferred from the sphere of national defence to business. The term “business logistics” emerged, which included transport, ware-housing and transshipment processes of goods within one enterprise and between different enterprises (Schönsleben, 1998; Stock and Lambert, 2001).
The turning point in the development of modern logistics was the publication of the article “Note on the Formulation of the Theory of Logistics” by Mor-genstern in 1955 (Morgenstern, 1955). In the Ger-
Volume 11 • Issue 4 • 2019
67
Engineering Management in Production and Services
man-speaking area, the year 1973 is regarded as the date of the birth of civil logistics, which is the year of issue of the book “Business logistics — systems, deci-sions, methods” (Kirsch et al., 1973). The authors of this book understood logistics as “... shaping, control-ling, regulating and implementing energy, informa-tion and people flows, in particular materials and products, within a given system and between systems …”. In the next years, the interest in practical aspects of logistics has grown significantly in Europe, which resulted in the creation of a practical definition of logistics in the form of the so-called 7R rules (from the English word “right” or from the German “rich-tig”). The interpretation of this rule means that the basic task of logistics is to provide the right goods, in the right quantity, at the right time, to the right place, with the right quality, at the right costs along with the right information (Lasch, 2014).
At the end of the 1980s, the representative of the German logistics school Reinhard Jünemann gener-alised this definition, proposing to understand logis-tics as “... a scientific field of knowledge including planning, control and checking of material, energy and information flows within systems” (Jünemann, 1989). Such understanding of the logistics concept has opened new perspectives for scientists dealing with logistic issues, creating opportunities for the search of theoretical models in the broadly under-stood area of logistics knowledge. The individual phases and directions of civil logistics development since its foundation to the current state have been described and analysed in detail by many authors (e.g. Pfohl, 1998; Witkowski, 2010; Lasch, 2014; Bukowski, 2019). On this basis, the development of logistics in business can be divided into four stages, whose brief characteristics are presented in Tab. 1.
Logistics 1.0 covered the sixties and seventies of the twentieth century and was characterised by mar-keting orientation. The main task of logistics was defined as “providing raw materials, semi-finished products and finished products in accordance with the principle of 7R”. The dominant approach at this stage of logistics development was functionally tar-geted, which means that the optimisation of logistic operations was seen as a part of separate functions and not as a part of the whole delivery process. This orientation often resulted in problems at the interface of individual functional areas (e.g. bottlenecks in flows and weak links in systems) and hindered the comprehensive optimisation of entire logistics pro-cesses (Coyle et al., 2010; Krawczyk, 2011).
In the eighties of the twentieth century, a new concept — Logistics 2.0 — was introduced. It empha-sised the coordinating role of logistics in managing the flows of all goods between the place of their origin (e.g. by a producer) and the destination (e.g. a recipi-ent). It was connected with an increase in the com-plexity of logistics systems and the dynamic development of the new role of logistics, namely, the organisation of returns of used materials, goods and packaging (reverse logistics). The functional approach gradually gave way to a regulatory approach, in which management decisions were usually reactions to changes taking place over time. The function of the logistic objective was subordinated to the idea of “lean thinking”, which concerned the manufacturing (lean manufacturing), organisational and manage-ment (lean structures and lean management) areas. The next phase of Logistics 2.0, at the turn of the 1980s and 1990s, was largely a response to significant market changes, namely, limiting mass production, allowing the full use of economies of scale for flexible adaptation to the needs of the unpredictable customer (logistics systems and processes, regardless of the ownership structure of individual parts of the supply chain, and the economy of scope instead of the econ-omy of scale). Such a change in the functioning of the industry required the use of a new dynamic approach, considering the environmental variability in time. The predominant problem in this phase was the con-flict between the struggle for full flexibility while adapting to the changing market requirements (responsiveness) and rising costs (Harrison and van Hoek, 2009).
The next step — Logistics 3.0 — can be charac-terised by the concept of the supply chain as a sequence of processes related to the flow of goods across the borders of individual organisations, rang-ing from the acquisition of raw materials to the final user of goods (E2E concept). Such a change in per-spective related to logistics issues enabled a compre-hensive approach to the optimisation of transition from flexibility in supply management to its higher level, i.e. agility. The integration of logistic systems and processes became the foundation for further stages of modern logistics development (Blanchard, 2015).
The fourth stage — Logistics 4.0 — started with the beginning of the 21st century and was driven by the ever-expanding economic globalisation. Optimi-sation methods based on the concept of Porter’s value creation chain to improve the efficiency of logistics
68
Volume 11 • Issue 4 • 2019Engineering Management in Production and Services
systems and a dynamic approach in modelling and simulation of logistics processes have been used on a larger scale (Blaik and Matwiejczuk, 2008). At the same time, the virtualisation of logistics networks occurred within the so-called third IT platform, which is often described by the acronym SMAC (Social, Mobile, Analytics, Cloud). This trend, com-monly known as e-logistics or smart logistics (Adam-czewski, 2016), fully fits in the currently developed model of the so-called economics of the moment (also known as “now economy”), and implemented mostly in the real-time organisations (RTE — Real-Time Enterprise). The goals of modern logistic sys-tems are multiple, namely, effectiveness, economic efficiency, leanness and, at the same time, agility (so-called “leagility”) and resilience to disruptions (Gudehus and Kotzab, 2009).
In practice, Logistics 4.0 was created as an inte-gral part of the Industry 4.0 concept (Kagermann et al., 2013; Wieland, Handfield and Durach, 2016). The dynamic development of manufacturing according to the concept of Industry 4.0 is a result of such pro-cesses as globalisation, IT development (e.g. Internet of Things) and international cooperation. To com-plete these tasks, the production must be supported with modern logistics, i.e. Logistics 4.0. Therefore, the next section will discuss the most important fea-tures of Logistics 4.0 that distinguish it from earlier versions of logistics.
2. Main characteristics of Logistics 4.0
The origins of Logistics 4.0 is the concept of the fourth industrial revolution defined usually by machine-to-machine communication and autono-
Tab. 1. Development steps of logistics in business practice
Stage The main characteristic The dominant approach The main goal
Logistics 1.0 Delivery of goods in three steps:
“transport — transshipment —
storage”
functional, regulatory, reactive effectiveness
Logistics 2.0 Management of goods flow pro-
cesses within a single enterprise
systemic, active lean, flexibility
Logistics 3.0 Comprehensive management of
the goods flow in supply chains
integration across the borders of
the organisation
efficiency, agility
Logistics 4.0 Optimisation and virtualisation of
logistics networks within the 3rd IT
platform (SMAC)
dynamic, global perspective, real-
time operation (RTE)
effectiveness efficiency, leagility,
resilience
mous processes (Strandhagen et al., 2017). This sec-tion will try to answer the following question: what are the distinct characteristics that define the logic behind Logistics 4.0? Five most important features that characterise the modern version of Logistics 4.0 age given below.
2.1. Full integration with Industry 4.0
One of the most important facets of Logistics 4.0 is its ability to integrate seamlessly with Industry 4.0 systems, creating a symbiotic, synergistic relationship between producers and delivery services. To achieve the optimal relationship between logistics and smart manufacturing, it is necessary to share data and IT resources between logistics operations and manufac-turing companies. This will allow the entire supply chain to provide better efficiency and effectiveness, so that global supply chains will be leaner, smarter, and more agile as a whole, cohesive, interconnected sys-tem (Ślusarczyk, Haseeb and Hussain, 2019).
2.2. Implementation of Internet of Things
The adoption of Internet of Things (IoT) both enables and enhances such technology as smart sys-tems, by connecting them (usually via the cloud) to a company’s existing IT systems. For instance, some companies have deployed heat and light sensors in their storage areas to prevent the possibility that a particular product might become damaged or destroyed by poor physical conditions. If the sensors determine that this damage is likely to have occurred, they can send alerts back to inventory managers and production planners to ensure that existing produc-tion and transport plans are adapted to the changing situation (Tadejko, 2015).
Volume 11 • Issue 4 • 2019
69
Engineering Management in Production and Services
2.3. Using smart systems and solutions
Smart versions of traditional logistics systems and components are changing the way that goods move from suppliers to customers. Smart containers and smart pallets, for example, are transforming tra-ditional shipping workflows into new opportunities to collect and act on crucial information about what-ever stock is being moved. A smart pallet could alert users if it were being filled more than its maximum weight capacity, to prevent wear and tear or increas-ing load-time efficacy. In the future, this will allow increasing autonomous decision-making in the sup-ply chain compared to the level of autonomous deci-sion-making currently being seen in advanced Industry 4.0 environments. Usually, this is associated with an increase in the number of driverless cars and trucks. This trend will likely begin on a smaller scale, e.g. with robots that can make inventory restocking decisions on their own, saving time and money (Wie-land, Handfield and Durach, 2016).
2.4. Visibility across the entire supply chain
One of the most crucial aspects of modern logis-tics is the increase in visibility that comes from enhanced digitisation across the entire supply chain (E2E). Usually, increased visibility is the first step to building a smarter value stream as well as a necessary prerequisite to the kind of transparency and intra-operational collaboration. That helps make modern logistics much more efficient and comprehensive compared to its earlier manifestations, especially by creating additional planning stability. Smart ports like in Abu Dhabi are already implementing solutions that make possible real-time viewing of documents and other mission-critical information for freight forwarders and their customers (Wieland, Handfield and Durach, 2016).
2.5. Big Data Analytics
In recent years, a lot has been done in the area of collecting huge amounts of data (so-called Big Data) in new logistics frameworks, but the real value of that data is not limited to making manual planning efforts more cohesive. The advances in transparency, visibil-ity and data collection using sensors and RFID chips is a result of the utilisation of analytics processes. By feeding large quantities of data and information into predictive and prescriptive algorithms, logistics pro-viders can improve their demand and supply forecasts
while uncovering potential areas of waste or possible improvement activities in their value streams. This can help in the development of a smarter version of supply chain management, that is less susceptible to risk, disruptions, and opacity; however, it is also pav-ing the way for the rise of anticipatory logistics, which predict and act on customer needs before they arise (Bukowski, 2019).
As this short review of the most important char-acteristics of Logistics 4.0 suggests, the basic condi-tion for its introduction is access to advanced and reliable ICT systems. These systems are based, at present, on intangible assets in the form of Big Data. Therefore, the next part of the work will concern the provision and management of knowledge based on Big Data veracity as a prerequisite for the functioning of systems based on the Logistics 4.0 concept.
3. Assessing knowledge matu-rity — a general framework based on the concept of imper-fect knowledge
In the second half of the twentieth century, a model of “the pyramid of knowledge hierarchy” was created by Ackoff. This model became the foundation of a dynamically developing concept of knowledge management, and it has undergone a number of interpretative modifications. The pyramid of knowl-edge is based on data that usually occur in the form of symbols and represent individual observations of real-world states. Data represent raw facts, events, or statements without reference to other things. It does not have a meaning in itself. Usually, data is under-stood as atomistic tiny packets that have no inherent structure. Data can be measurable or not, analogue or discrete, as well as considered statically (e.g. data record) or dynamically (e.g. data stream). It can be obtained from various sources (Ackoff, 1989).
Information is data that are processed to be use-ful, and it means data that has been given meaning (e.g. relational connection), relevance and purpose. Information is partly subjective because it depends not only on the data but also on the process of their interpretation, which is based on the knowledge held by the knowledge interpreter at that time. Thus, it can be assumed that information is a collection of selected data, processed and presented in a form that can be useful to the recipient (e.g. the decision-maker). The basic condition for the usefulness of information is its
70
Volume 11 • Issue 4 • 2019Engineering Management in Production and Services
ability to be interpreted in a specific context (Skytter, 2008).
Knowledge is created by integrating new infor-mation with existing knowledge (so-called back-ground knowledge) about a particular area of interest. It requires the ability to evaluate available information and understand the reality in light of this informa-tion, in accordance with the current state of knowl-edge. Knowledge relies on the ability to use information effectively and efficiently to find answers to more complex questions, such as “how?”. Knowl-edge is emergent in relation to information — it is possible to generate new knowledge by applying pro-cesses of systematisation and structuring of informa-tion (Klir, 1991).
In 1957, Bergmann published “Philosophy of Science”, in which he made a distinction between “perfect” and “imperfect” knowledge. Perfect knowl-edge is based on complete theories, deterministic nature laws (such as Newtonian mechanics); it con-cerns closed systems, in which the initial conditions are known accurately, and the only method used in the inference is the deductive method (Bergmann, 1957).
Whereas, in applied sciences, such as engineer-ing, social sciences, economics or management, knowledge is based on incomplete theories and indeterministic laws. It concerns open systems, in which the initial conditions are known inaccurately, and the method used in the inference is usually the inductive method. It is, therefore, imperfect knowl-edge. The data, on which the entire pyramid is built, come from observations or measurements whose accuracy is limited and, therefore, burdened with errors. If it is possible to repeat the same observations or measurements, the use of statistical methods mini-mises the impact of these errors on our knowledge. But in many cases, it is not possible, and then, the knowledge has a high degree of uncertainty (Magruk, 2017; Bukowski, 2019).
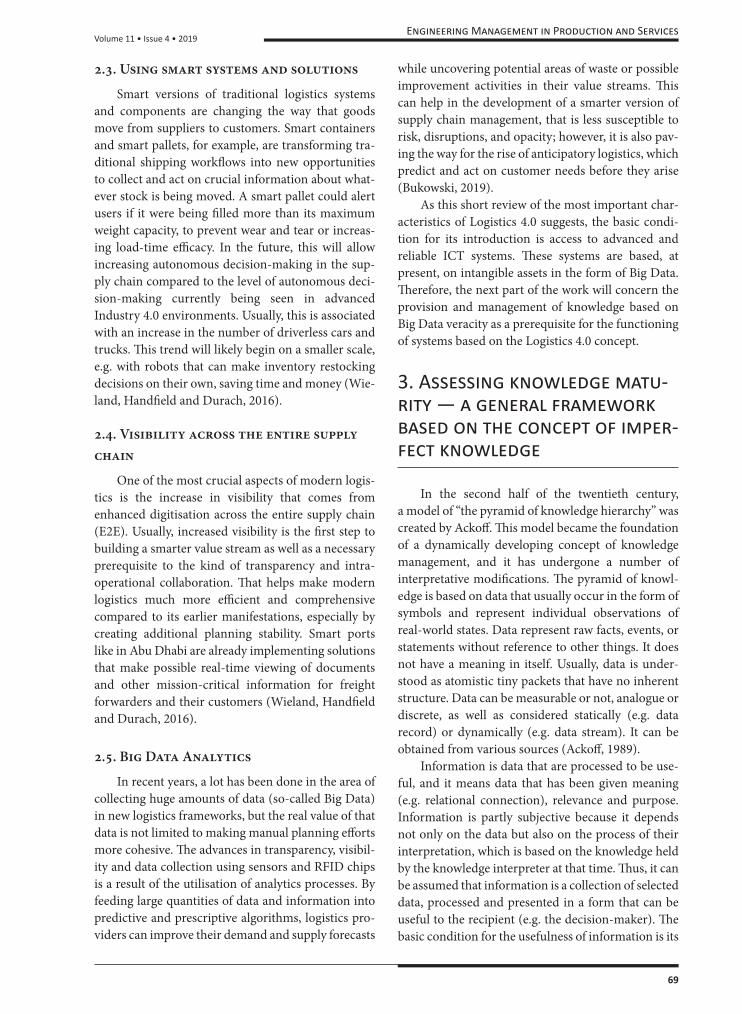
The problem of knowledge imperfection has become particularly important as a result of the increased use of vast data amounts, called “Big Data” (Corrigan, 2013). For these reasons, one of the key problems in the effective use of smart systems based on data streams, such as Logistics 4.0, is the objective assessment of the reliability of this data and the quality of knowledge based on it (Weerdmeester, Pocaterra and Hefke, 2003). For this purpose, a general frame-work was developed based on the imperfect knowledge concept, the diagram of which is presented in Fig. 2.
The entire process of knowledge preparation for managerial decision-making can be divided into eight steps, namely: raw data acquisition, data pro-cessing to Big Data format, data veracity appraise-ment, information forming, information utility estimation, creation of new knowledge, knowledge processing quality evaluation and knowledge matu-rity rating. The basis of the procedure is the idea to combine both quantitative and qualitative methodol-ogies in logistics research (Mangan et al., 2004). Next, the main stages of this process will be discussed in detail.
Big Data includes data sets with sizes beyond the ability of software tools commonly used to capture, manage, and process data within an acceptable period, and can be described by the following charac-teristics (so-called “10Vs” model):• Volume represents data size. It refers to the huge
amount of data being generated and used in IT systems. The Internet of Things (IoT) is creating exponential growth in data, and what in the past used to be measured in Gigabytes is now meas-ured in Zettabytes or even Yottabytes;
• Velocity is the speed, at which data becomes accessible by a user. It refers both to the increas-ing rate of data sets and constantly growing demand for access to databases;
• Variety refers to different types of data. It can include many different kinds of data, such as numbers, messages, photos, sensor data, voice or video. It can be structured, semi-structured, and unstructured;
• Variability refers to the changeability of data over time. If the meaning of data is changing in time, it can have a huge impact on data homogenisa-tion;
• Visualisation it the use of charts and graphs to visualise big amounts of complex data. It is far more effective in the communication of meaning than spreadsheets and reports with numbers and formulas;
• Value refers to the benefits that the data can bring to the user;
• Validity refers to how accurate and correct the data is for its intended use;
• Volatility concerns the amount of time, for which the data is useful before it becomes irrelevant;
• Vulnerability refers to how susceptible data is to unauthorised access and how safe it is to use it;
• Veracity refers to truthfulness and reliability of data. Highly complex data sets contain significant
Volume 11 • Issue 4 • 2019
71
Engineering Management in Production and Services
Fig. 2. Diagram of the knowledge preparation process for managerial decision-making
amounts of dubious data (data in doubt), which constitutes database imperfections. Data veracity has decisive influence on the degree
of quality of information. It depends on the imperfec-tion of the data due to (Klir, 1991) incorrectness, incredibility, implausibility, inconsistency, incoher-ency, vagueness, ambiguity, incompleteness, impreci-sion and inaccuracy. The proposal is to use the following definition of data veracity based on Bukowski (2016):
Data Veracity (DV) is the property of the data described by the five-dimensional vector of its attrib-utes, namely:• Accuracy (ACC) — the degree, to which the data
fulfil the relevant requirements (the data should precisely meet certain specifications and stand-ards).
• Clarity (CLA) — the degree, to which the data can be clearly understood (the data should be well defined, without several meanings, vague-ness and ambiguity).
• Consistency (CON) — the degree, to which the data is compatible with the same type of data from different sources (the data should be coher-ent without a confusing or conflicting meaning).
• Plausibility (PLA) — the degree, to which the data fits the reality (the data should be compatible with the reality, imaginable and possible).
• Traceability (TRA) — the degree, to which the data can be traced to its sources (the origin of the data should be identifiable with confidence).
(1)DV = {ACC, CLA, CON, PLA, TRA}
DVV = ∏ Ai5i=1
IU = {BEL, COM, COR, REL, TIM}
IUV = ∏ Bi5i=1
KPQ = {MTA, MPA, DMC, DCR, DRC}
KPQ = ∏ Ci5i=1
KM = {DVV, IUV, KPQ}
KML = ∏ Di3i=1
R(Si) = (C′i, P′
i, K′i)
This definition can be illustrated by the following relation
(2)
DV = {ACC, CLA, CON, PLA, TRA}
DVV = ∏ Ai5i=1
IU = {BEL, COM, COR, REL, TIM}
IUV = ∏ Bi5i=1
KPQ = {MTA, MPA, DMC, DCR, DRC}
KPQ = ∏ Ci5i=1
KM = {DVV, IUV, KPQ}
KML = ∏ Di3i=1
R(Si) = (C′i, P′
i, K′i)
The result of the assessment is to assign them to one of five classes, namely:
• Rank 0 — very low (VL), unacceptable,• Rank 1 to 2 — low (L),• Rank 4 to 8 — moderate (M),• Rank 16 — high (H),• Rank 32 — very high (VH).Data, for which Data Veracity Value is very low
(DVV = 0), should be fully eliminated and must not be used to create information.
Information uncertainty may be due to objective reasons caused by data imperfections and subjective errors caused by errors in their interpretation. In practice, the uncertainty of information is largely determined by the quality of the available data. Thus, their interpretation, and the elimination of false and contradictory data, as well as the clarification of their
To use this model for the assessment of data veracity, the expert method is proposed. Each verac-ity attribute Ai is rated on a 3-point scale as:
0 — unacceptable,1 — acceptable,2 — fully satisfactory,and on this basis, the Data Veracity Value (DVV)
is calculated as the product of all five attributes Ai.
72
Volume 11 • Issue 4 • 2019Engineering Management in Production and Services
definitions in the case of data ambiguity, are of great significance in the process of information acquisition. This crucial as the degree of information uncertainty determines its quality and usefulness for creating new knowledge.
The following characteristics of information quality are proposed (Bukowski, 2019):• Accessibility — the extent, to which information
is available, or easily and quickly retrievable;• Accuracy — the extent, to which data are correct,
reliable and free of error;• Amount of data — the extent, to which the quan-
tity or volume of available data is appropriate.• Availability — the extent, to which information is
physically accessible;• Believability — the extent, to which information
is regarded as true and credible;• Completeness — the extent, to which informa-
tion is not missing and is of sufficient breadth and depth for the task at hand;
• Concise — the extent, to which information is compactly represented without being over-whelming (i.e. brief in presentation, yet complete and to the point);
• Consistency — the extent, to which information is presented in the same format and compatible with previous data;
• Efficiency — the extent, to which data are capable to quickly meet the information needs for the task at hand;
• Navigation — the extent, to which data are easily found and linked to;
• Objectivity — the extent, to which information is unbiased, unprejudiced and impartial;
• Relevancy — the extent, to which information is applicable and helpful for the task at hand;
• Reliability — the extent, to which information is correct and reliable;
• Reputation — the extent, to which information is highly regarded in terms of source or content;
• Security — the extent, to which access to infor-mation is restricted appropriately to maintain its security;
• Timeliness — the extent, to which the informa-tion is sufficiently up-to-date for the task at hand;
• Understandability — the extent, to which data are clear without ambiguity and easily compre-hended;
• Usability — the extent, to which information is clear and easily used;
• Usefulness — the extent, to which information is applicable and helpful for the task at hand;
• Value-Added — the extent, to which information is beneficial and provides advantages from its use.In reality, the quality of information depends on
the context, in which it is used. Therefore, in the decision-making process, it is essential to evaluate the usefulness of information in the context of its specific purpose. Based on the literature (Kulikowski, 2014), it is proposed to use the term information utility as an equivalent of the usefulness of information, and the following definition of this term (based on Bukowski, 2019):
Information Utility (IU) is the property of the information described by the five-dimensional vector of its attributes:• Believability (BEL) — the degree, to which the
information can be considered reliable (the information should be believable, credible and from a reputable source);
• Completeness (COM) — the degree, to which the information does not contain omission errors (the information should include all the necessary values, be complete, cover the needs of existing tasks and have a sufficient extent and deepness);
• Correctness (COR) — the degree, to which the information is proper (the information should be free from errors);
• Relevancy (REL) — the degree, to which the information is useful in a given case (the infor-mation should be relevant and applicable to the work, as well as appropriate for existing needs);
• Timeliness (TIM) — the degree, to which the information is up to date (the information should be sufficiently timely, current for the work and fresh enough to satisfy needs).This definition can be exemplified by the model,
which represents the following relation
(3)
DV = {ACC, CLA, CON, PLA, TRA}
DVV = ∏ Ai5i=1
IU = {BEL, COM, COR, REL, TIM}
IUV = ∏ Bi5i=1
KPQ = {MTA, MPA, DMC, DCR, DRC}
KPQ = ∏ Ci5i=1
KM = {DVV, IUV, KPQ}
KML = ∏ Di3i=1
R(Si) = (C′i, P′
i, K′i)
To use this model to assess the Information Util-ity, the proposal is to use the following expert method. Each IU attribute Bi is rated by experts on a 3-point scale as:
1 — low,2 — moderate,3 — high,and on this basis, the Information Utility Value
(IUV) is calculated as the product of all five attributes Bi.
(4)
DV = {ACC, CLA, CON, PLA, TRA}
DVV = ∏ Ai5i=1
IU = {BEL, COM, COR, REL, TIM}
IUV = ∏ Bi5i=1
KPQ = {MTA, MPA, DMC, DCR, DRC}
KPQ = ∏ Ci5i=1
KM = {DVV, IUV, KPQ}
KML = ∏ Di3i=1
R(Si) = (C′i, P′
i, K′i)
Volume 11 • Issue 4 • 2019
73
Engineering Management in Production and Services
The result of the assessment is to assign them to one of five classes, namely:
• Rank 1 to 4 — very low (VL),• Rank 6 to 12 — low (L),• Rank 16 to 48 — moderate (M),• Rank 72 to 108 — high (H),• Rank 162 to 243 — very high (VH).The imperfection of knowledge is due to the
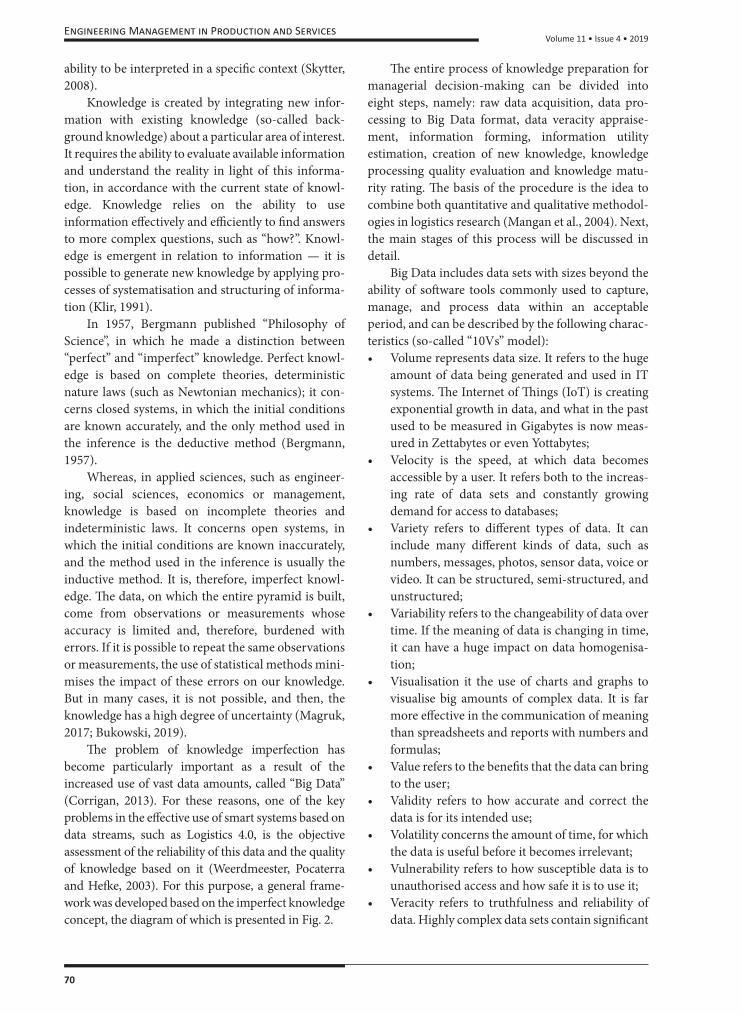
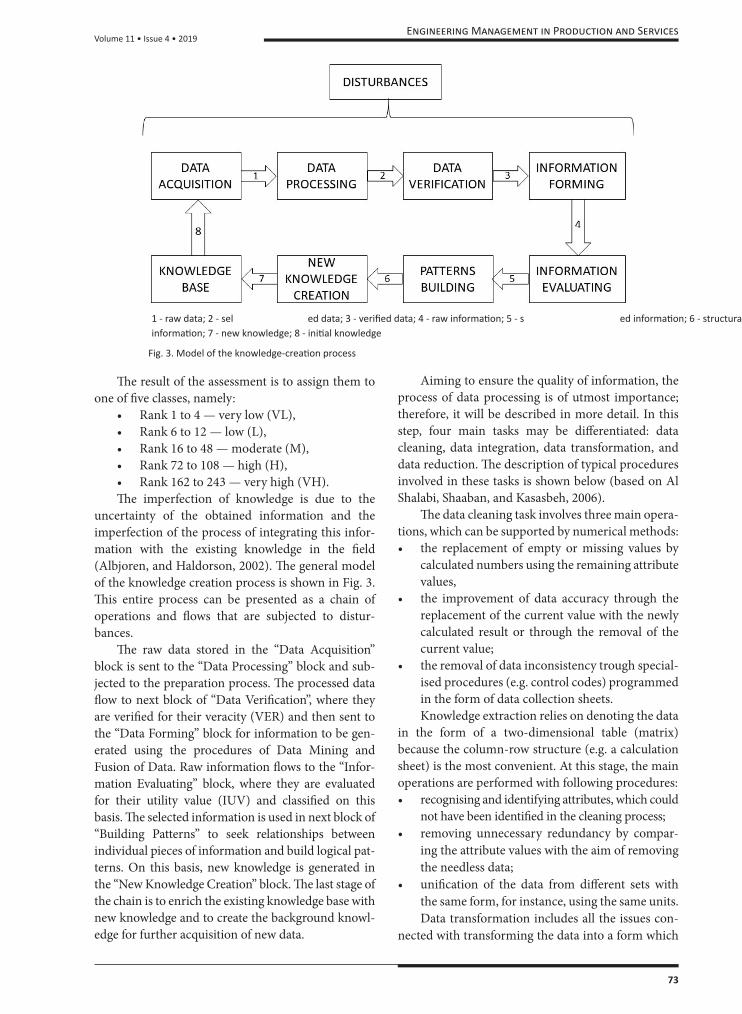
uncertainty of the obtained information and the imperfection of the process of integrating this infor-mation with the existing knowledge in the field (Albjoren, and Haldorson, 2002). The general model of the knowledge creation process is shown in Fig. 3. This entire process can be presented as a chain of operations and flows that are subjected to distur-bances.
The raw data stored in the “Data Acquisition” block is sent to the “Data Processing” block and sub-jected to the preparation process. The processed data flow to next block of “Data Verification”, where they are verified for their veracity (VER) and then sent to the “Data Forming” block for information to be gen-erated using the procedures of Data Mining and Fusion of Data. Raw information flows to the “Infor-mation Evaluating” block, where they are evaluated for their utility value (IUV) and classified on this basis. The selected information is used in next block of “Building Patterns” to seek relationships between individual pieces of information and build logical pat-terns. On this basis, new knowledge is generated in the “New Knowledge Creation” block. The last stage of the chain is to enrich the existing knowledge base with new knowledge and to create the background knowl-edge for further acquisition of new data.
Aiming to ensure the quality of information, the process of data processing is of utmost importance; therefore, it will be described in more detail. In this step, four main tasks may be differentiated: data cleaning, data integration, data transformation, and data reduction. The description of typical procedures involved in these tasks is shown below (based on Al Shalabi, Shaaban, and Kasasbeh, 2006).
The data cleaning task involves three main opera-tions, which can be supported by numerical methods: • the replacement of empty or missing values by
calculated numbers using the remaining attribute values,
• the improvement of data accuracy through the replacement of the current value with the newly calculated result or through the removal of the current value;
• the removal of data inconsistency trough special-ised procedures (e.g. control codes) programmed in the form of data collection sheets.Knowledge extraction relies on denoting the data
in the form of a two-dimensional table (matrix) because the column-row structure (e.g. a calculation sheet) is the most convenient. At this stage, the main operations are performed with following procedures: • recognising and identifying attributes, which could
not have been identified in the cleaning process;• removing unnecessary redundancy by compar-
ing the attribute values with the aim of removing the needless data;
• unification of the data from different sets with the same form, for instance, using the same units.Data transformation includes all the issues con-
nected with transforming the data into a form which
Fig. 3. Model of the knowledge-creation process
Fig. 3. Model of the knowledge-creation process Source: (Bukowski, 2019).
Fig. 4. Model of the imperfect knowledge management process Source: (Bukowski, 2019).
1 - raw data; 2 - selected data; 3 - verified data; 4 - raw information; 5 - selected information; 6 - structuralized information; 7 - new knowledge; 8 - initial knowledge
74
Volume 11 • Issue 4 • 2019Engineering Management in Production and Services
makes its exploration possible. This process involves four main operations: • data smoothing by the elimination of the local
deviations having the character of noise. This process involves the techniques, such as regres-sion, binning, or clustering;
• data generalisation by converting the collected data into higher-order quantities (e.g. by their discretisation);
• data normalisation by the adjustment (e.g. resca-ling) of the data to a specified range, usually from 0 to 1;
• data accommodation by transforming the data into a new format used by a specific algorithm.Data reduction consists of the attribute selection
with the expert opinion and experience pertaining to the data under analysis. Those attributes that do not have any influence on the modelled features should be removed from the data set. The general aim of the data reduction techniques is to significantly reduce the amount of data. Data reduction stage includes four operations: • the selection of an attribute by eliminating attrib-
utes that are redundant or have little significance for the modelled phenomenon;
• the reduction of the dimension and size by trans-forming the data and eliminating the recurrence or similar cases;
• data discretisation by transforming a continuous variable into a discontinuous (discrete) and specified number of ranges;
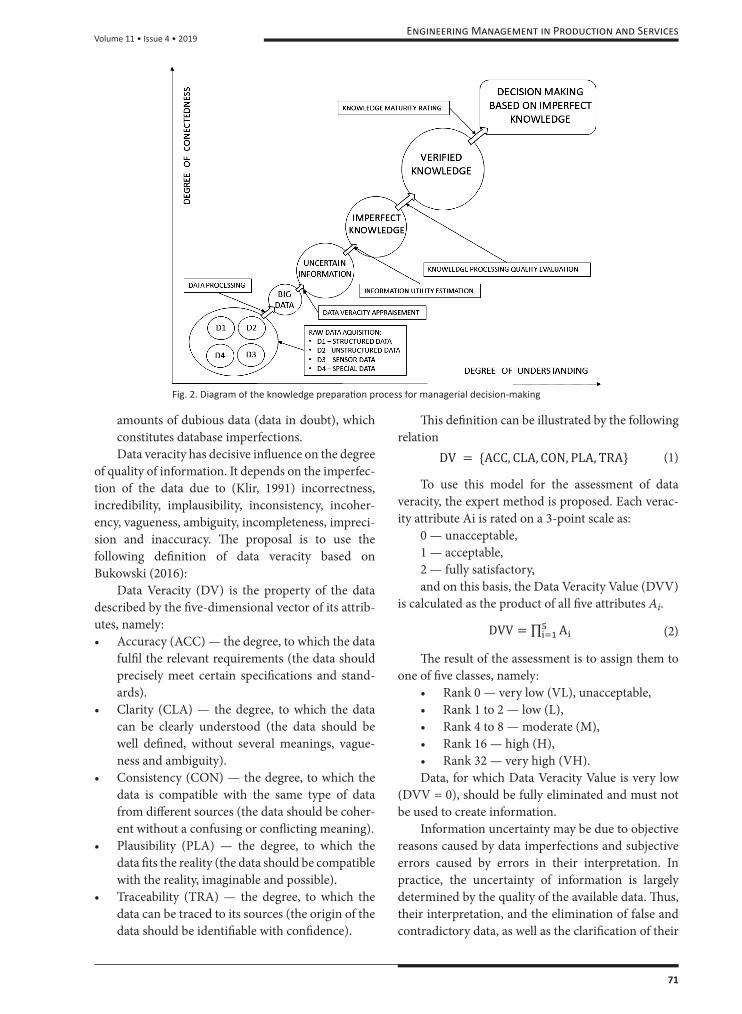
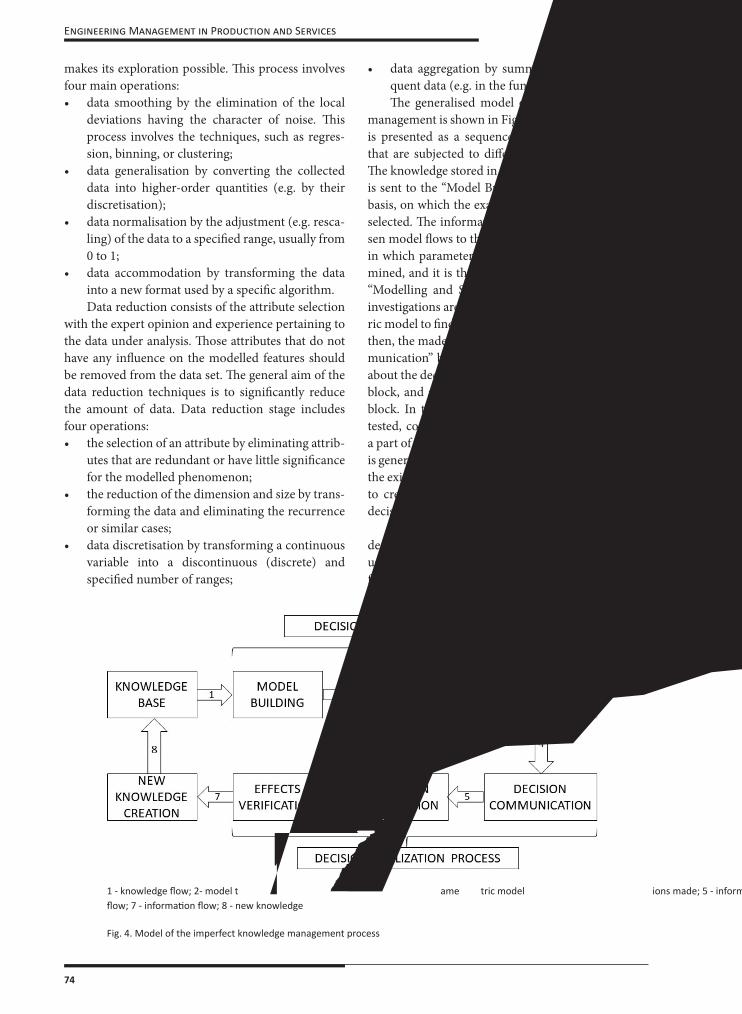
• data aggregation by summing up the most fre-quent data (e.g. in the function of time). The generalised model of imperfect knowledge
management is shown in Fig. 4. The complete process is presented as a sequence of operations and flows that are subjected to different kind of disturbances. The knowledge stored in the “Knowledge Base” block is sent to the “Model Building” block and forms the basis, on which the exact type of a decision model is selected. The information about the type of the cho-sen model flows to the “Parameter Evaluation” block, in which parameters of the chosen model are deter-mined, and it is then sent to the next block, namely, “Modelling and Simulation”. In this block, suitable investigations are carried out on the chosen paramet-ric model to find the best of all possible decisions, and then, the made decision flows to the “Decision Com-munication” block. In the next step, the information about the decision flows to the “Decision Realization” block, and after, flows into the “Effects Verification” block. In this block, the results of this decision are tested, conclusions for the future are proposed, and a part of new knowledge in New Knowledge Creation is generated. The last stage of the process is to improve the existing knowledge base with new knowledge and to create the updated initial knowledge for further decision-making.
Based on the above concept, the proposal is to describe the knowledge processing quality (KPQ) by using the five-dimensional vector of its attributes as follows:
Fig. 4. Model of the imperfect knowledge management process
Fig. 3. Model of the knowledge-creation process Source: (Bukowski, 2019).
Fig. 4. Model of the imperfect knowledge management process Source: (Bukowski, 2019).
1 - knowledge flow; 2- model type; 3 - parametric model; 4 - decisions made; 5 - information flow; 6 - information flow; 7 - information flow; 8 - new knowledge
Volume 11 • Issue 4 • 2019
75
Engineering Management in Production and Services
• Model Type Adequacy (MTA) — the degree, to which the model reflects the reality with suffi-cient plausibility and sensibility;
• Model’s Parameters Accuracy (MPA) — the degree, to which the model reflects the reality with sufficient precision;
• Decision-Making Process Correctness (DMC) — the degree, to which decisions are made with-out significant errors;
• Decision Communication Process Reliability (DCR) — the degree, to which the decisions are communicated without faults;
• Decision Realization Process Compliance (DRC) — the degree, to which the decisions are carried out in agreement with the intention of the deci-sion-maker. This concept can be illustrated by the model,
which represents the following formula:
(5)
DV = {ACC, CLA, CON, PLA, TRA}
DVV = ∏ Ai5i=1
IU = {BEL, COM, COR, REL, TIM}
IUV = ∏ Bi5i=1
KPQ = {MTA, MPA, DMC, DCR, DRC}
KPQ = ∏ Ci5i=1
KM = {DVV, IUV, KPQ}
KML = ∏ Di3i=1
R(Si) = (C′i, P′
i, K′i)
To use this formula for the assessment of knowl-edge processing quality (KPQ), the following expert method is proposed.
Each KPQ attribute Ci is rated by experts on a 3-point scale as:
1 — low, 2 — moderate, 3 — high.On this basis, the value of the Knowledge Pro-
cessing Quality (KPQ) is calculated as the product of all attributes Ci.
(6)
DV = {ACC, CLA, CON, PLA, TRA}
DVV = ∏ Ai5i=1
IU = {BEL, COM, COR, REL, TIM}
IUV = ∏ Bi5i=1
KPQ = {MTA, MPA, DMC, DCR, DRC}
KPQ = ∏ Ci5i=1
KM = {DVV, IUV, KPQ}
KML = ∏ Di3i=1
R(Si) = (C′i, P′
i, K′i)
The result of the assessment is to assign them to one of five KPQ classes, namely:
• Rank 1 to 4 — very low (VL),• Rank 6 to 12 — low (L),• Rank 16 to 48 — moderate (M),• Rank 72 to 108 — high (H),• Rank 162 to 243 — very high (VH).The last step of the knowledge management pro-
cess is the assessment of the knowledge maturity level. Maturity models describe how an entity devel-ops through the levels over time until it reaches the fully satisfactory level. Maturity models have the fol-lowing general properties (Klimko, 2001; Weerd-meester et al., 2003; Schumacher, Erol and Sihn, 2016): • the development of an entity described with
a limited number of maturity levels (usually, between four and six);
• maturity levels are characterised by certain requirements to be achieved by the entity on given level;
• maturity levels are ordered sequentially, from an initial development level up to a fully satisfactory level;
• during the development, the entity progresses step by step from one level to the next, thus no levels can be skipped.The proposal is to use the concept of maturity to
assess knowledge that is available when making deci-sions based on Big Data. The assessment of knowledge maturity (KM) should be based on three main crite-ria, namely, the data veracity value, the information utility value and the knowledge processing quality. Methods for determining these criteria are described above. This concept can be illustrated by the model, which represents the following formula:
(7)
DV = {ACC, CLA, CON, PLA, TRA}
DVV = ∏ Ai5i=1
IU = {BEL, COM, COR, REL, TIM}
IUV = ∏ Bi5i=1
KPQ = {MTA, MPA, DMC, DCR, DRC}
KPQ = ∏ Ci5i=1
KM = {DVV, IUV, KPQ}
KML = ∏ Di3i=1
R(Si) = (C′i, P′
i, K′i)
Each knowledge maturity attribute Di is evalu-ated on a 5-point scale, and on this basis, the value of the Knowledge Maturity Level (KML) is calculated as the product of all attributes Di.
(8)
DV = {ACC, CLA, CON, PLA, TRA}
DVV = ∏ Ai5i=1
IU = {BEL, COM, COR, REL, TIM}
IUV = ∏ Bi5i=1
KPQ = {MTA, MPA, DMC, DCR, DRC}
KPQ = ∏ Ci5i=1
KM = {DVV, IUV, KPQ}
KML = ∏ Di3i=1
R(Si) = (C′i, P′
i, K′i)
The maturity of knowledge can also be assessed on five levels, e.g.:• Rank 2 to 4 — a very low (insufficient) maturity
level (VL),• Rank 8 to 18 — a low maturity level (L),• Rank 27 to 48 — a moderate maturity level (M),• Rank 64 to 80 — a high maturity level (H), and• Rank 100 to 125 — a very high (fully satisfactory)
maturity level (VH).A very low (VL) maturity level can be identified
by a lack of knowledge, while the level L — by weak, imperfect knowledge, the level M — by medium imperfect knowledge, the level H — by strong imper-fect knowledge, and the level VH — by complete, perfect knowledge.
4. Assessing the disruption risk based on the knowledge matu-rity concept — an example
The example demonstrates how to apply the method, which is proposed in Section 3, in the logis-tics decision-making process. The problem concerned the assessment of disruption risk in a new distribu-
76
Volume 11 • Issue 4 • 2019Engineering Management in Production and Services
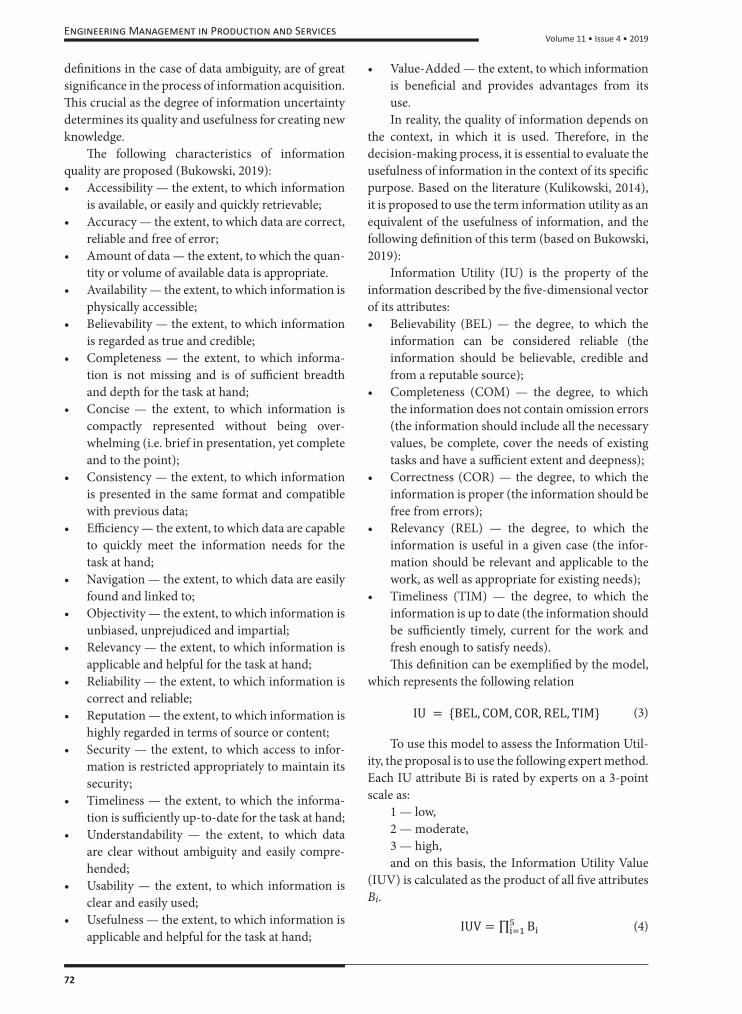
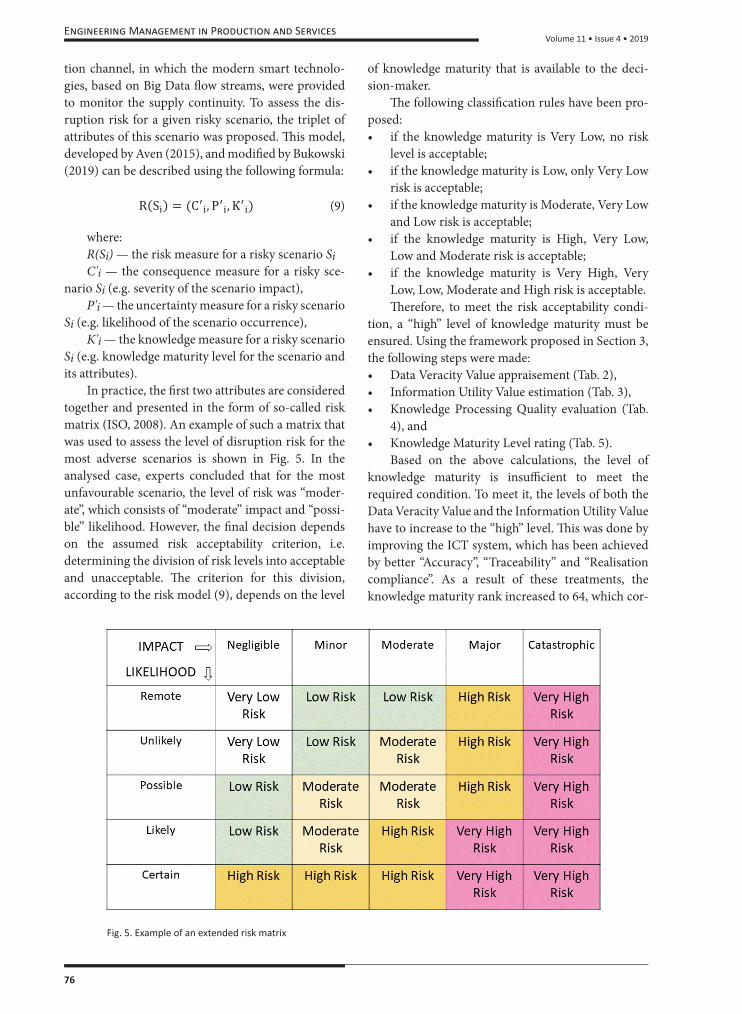
Fig. 5. Example of an extended risk matrix
tion channel, in which the modern smart technolo-gies, based on Big Data fl ow streams, were provided to monitor the supply continuity. To assess the dis-ruption risk for a given risky scenario, the triplet of attributes of this scenario was proposed. Th is model, developed by Aven (2015), and modifi ed by Bukowski (2019) can be described using the following formula:
(9)
DV = {ACC, CLA, CON, PLA, TRA}
DVV = ∏ Ai5i=1
IU = {BEL, COM, COR, REL, TIM}
IUV = ∏ Bi5i=1
KPQ = {MTA, MPA, DMC, DCR, DRC}
KPQ = ∏ Ci5i=1
KM = {DVV, IUV, KPQ}
KML = ∏ Di3i=1
R(Si) = (C′i, P′
i, K′i)
where: R(Si) — the risk measure for a risky scenario SiC'i — the consequence measure for a risky sce-
nario Si (e.g. severity of the scenario impact),P'i — the uncertainty measure for a risky scenario
Si (e.g. likelihood of the scenario occurrence),K'i — the knowledge measure for a risky scenario
Si (e.g. knowledge maturity level for the scenario and its attributes).
In practice, the fi rst two attributes are considered together and presented in the form of so-called risk matrix (ISO, 2008). An example of such a matrix that was used to assess the level of disruption risk for the most adverse scenarios is shown in Fig. 5. In the analysed case, experts concluded that for the most unfavourable scenario, the level of risk was “moder-ate”, which consists of “moderate” impact and “possi-ble” likelihood. However, the fi nal decision depends on the assumed risk acceptability criterion, i.e. determining the division of risk levels into acceptable and unacceptable. Th e criterion for this division, according to the risk model (9), depends on the level
of knowledge maturity that is available to the deci-sion-maker.
Th e following classifi cation rules have been pro-posed:• if the knowledge maturity is Very Low, no risk
level is acceptable;• if the knowledge maturity is Low, only Very Low
risk is acceptable;• if the knowledge maturity is Moderate, Very Low
and Low risk is acceptable;• if the knowledge maturity is High, Very Low,
Low and Moderate risk is acceptable;• if the knowledge maturity is Very High, Very
Low, Low, Moderate and High risk is acceptable.Th erefore, to meet the risk acceptability condi-
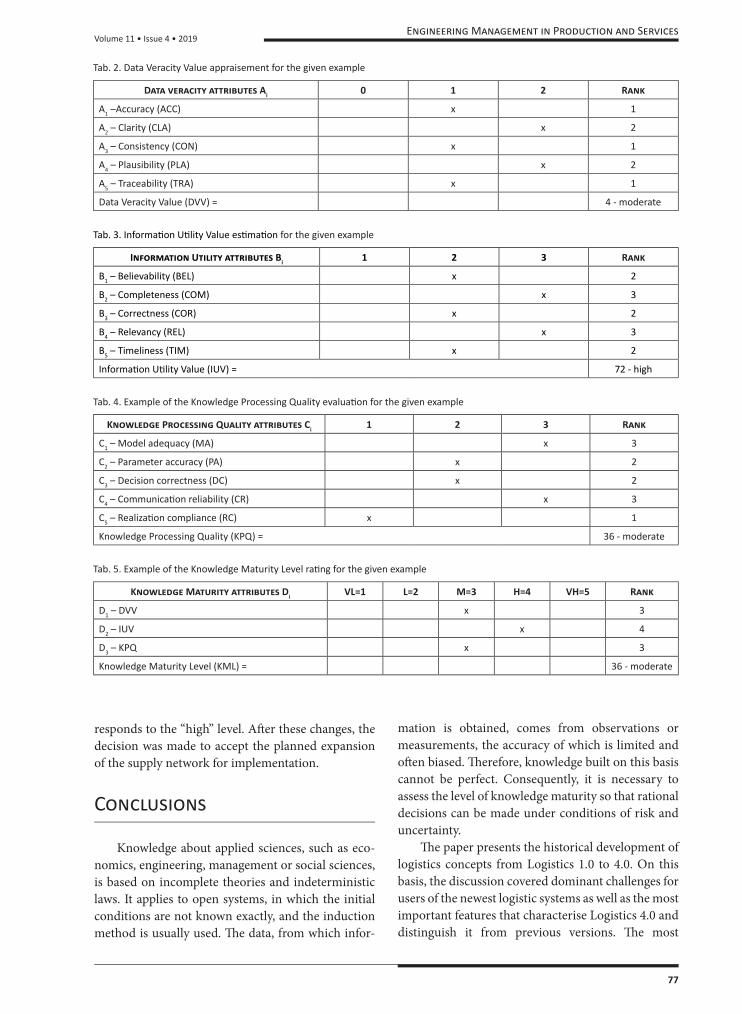
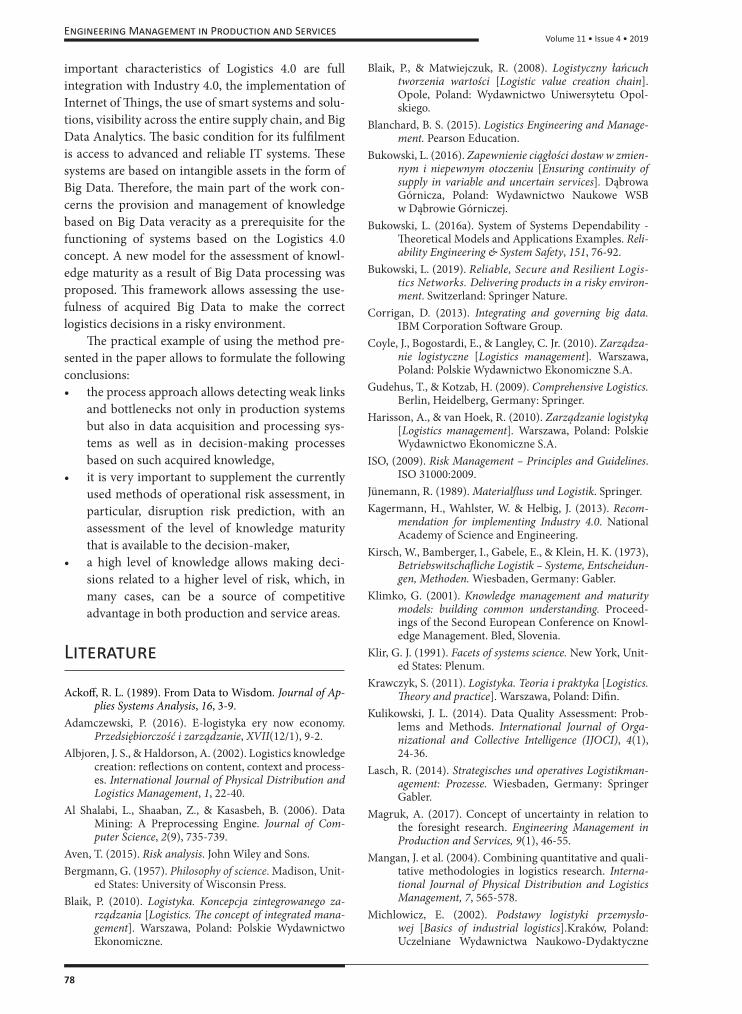
tion, a “high” level of knowledge maturity must be ensured. Using the framework proposed in Section 3, the following steps were made:• Data Veracity Value appraisement (Tab. 2),• Information Utility Value estimation (Tab. 3),• Knowledge Processing Quality evaluation (Tab.
4), and• Knowledge Maturity Level rating (Tab. 5).
Based on the above calculations, the level of knowledge maturity is insuffi cient to meet the required condition. To meet it, the levels of both the Data Veracity Value and the Information Utility Value have to increase to the “high” level. Th is was done by improving the ICT system, which has been achieved by better “Accuracy”, “Traceability” and “Realisation compliance”. As a result of these treatments, the knowledge maturity rank increased to 64, which cor-
Fig. 5. Example of an extended risk matrix
Volume 11 • Issue 4 • 2019
77
Engineering Management in Production and Services
Tab. 2. Data Veracity Value appraisement for the given example
Data veracity attributes Ai 0 1 2 Rank
A1 –Accuracy (ACC) x 1
A2 – Clarity (CLA) x 2
A3 – Consistency (CON) x 1
A4 – Plausibility (PLA) x 2
A5 – Traceability (TRA) x 1
Data Veracity Value (DVV) = 4 - moderate
Tab. 3. Informati on Uti lity Value esti mati on for the given example
Information Utility attributes Bi 1 2 3 Rank
B1 – Believability (BEL) x 2
B2 – Completeness (COM) x 3
B3 – Correctness (COR) x 2
B4 – Relevancy (REL) x 3
B5 – Timeliness (TIM) x 2
Informati on Uti lity Value (IUV) = 72 - high
Tab. 4. Example of the Knowledge Processing Quality evaluati on for the given example
Knowledge Processing Quality attributes Ci 1 2 3 Rank
C1 – Model adequacy (MA) x 3
C2 – Parameter accuracy (PA) x 2
C3 – Decision correctness (DC) x 2
C4 – Communicati on reliability (CR) x 3
C5 – Realizati on compliance (RC) x 1
Knowledge Processing Quality (KPQ) = 36 - moderate
Tab. 5. Example of the Knowledge Maturity Level rati ng for the given example
Knowledge Maturity attributes Di VL=1 L=2 M=3 H=4 VH=5 Rank
D1 – DVV x 3
D2 – IUV x 4
D3 – KPQ x 3
Knowledge Maturity Level (KML) = 36 - moderate
responds to the “high” level. Aft er these changes, the decision was made to accept the planned expansion of the supply network for implementation.
Conclusions
Knowledge about applied sciences, such as eco-nomics, engineering, management or social sciences, is based on incomplete theories and indeterministic laws. It applies to open systems, in which the initial conditions are not known exactly, and the induction method is usually used. Th e data, from which infor-
mation is obtained, comes from observations or measurements, the accuracy of which is limited and oft en biased. Th erefore, knowledge built on this basis cannot be perfect. Consequently, it is necessary to assess the level of knowledge maturity so that rational decisions can be made under conditions of risk and uncertainty.
Th e paper presents the historical development of logistics concepts from Logistics 1.0 to 4.0. On this basis, the discussion covered dominant challenges for users of the newest logistic systems as well as the most important features that characterise Logistics 4.0 and distinguish it from previous versions. Th e most
78
Volume 11 • Issue 4 • 2019Engineering Management in Production and Services
important characteristics of Logistics 4.0 are full integration with Industry 4.0, the implementation of Internet of Things, the use of smart systems and solu-tions, visibility across the entire supply chain, and Big Data Analytics. The basic condition for its fulfilment is access to advanced and reliable IT systems. These systems are based on intangible assets in the form of Big Data. Therefore, the main part of the work con-cerns the provision and management of knowledge based on Big Data veracity as a prerequisite for the functioning of systems based on the Logistics 4.0 concept. A new model for the assessment of knowl-edge maturity as a result of Big Data processing was proposed. This framework allows assessing the use-fulness of acquired Big Data to make the correct logistics decisions in a risky environment.
The practical example of using the method pre-sented in the paper allows to formulate the following conclusions:• the process approach allows detecting weak links
and bottlenecks not only in production systems but also in data acquisition and processing sys-tems as well as in decision-making processes based on such acquired knowledge,
• it is very important to supplement the currently used methods of operational risk assessment, in particular, disruption risk prediction, with an assessment of the level of knowledge maturity that is available to the decision-maker,
• a high level of knowledge allows making deci-sions related to a higher level of risk, which, in many cases, can be a source of competitive advantage in both production and service areas.
Literature
Ackoff, R. L. (1989). From Data to Wisdom. Journal of Ap-plies Systems Analysis, 16, 3-9.
Adamczewski, P. (2016). E-logistyka ery now economy. Przedsiębiorczość i zarządzanie, XVII(12/1), 9-2.
Albjoren, J. S., & Haldorson, A. (2002). Logistics knowledge creation: reflections on content, context and process-es. International Journal of Physical Distribution and Logistics Management, 1, 22-40.
Al Shalabi, L., Shaaban, Z., & Kasasbeh, B. (2006). Data Mining: A Preprocessing Engine. Journal of Com-puter Science, 2(9), 735-739.
Aven, T. (2015). Risk analysis. John Wiley and Sons. Bergmann, G. (1957). Philosophy of science. Madison, Unit-
ed States: University of Wisconsin Press.Blaik, P. (2010). Logistyka. Koncepcja zintegrowanego za-
rządzania [Logistics. The concept of integrated mana-gement]. Warszawa, Poland: Polskie Wydawnictwo Ekonomiczne.
Blaik, P., & Matwiejczuk, R. (2008). Logistyczny łańcuch tworzenia wartości [Logistic value creation chain]. Opole, Poland: Wydawnictwo Uniwersytetu Opol-skiego.
Blanchard, B. S. (2015). Logistics Engineering and Manage-ment. Pearson Education.
Bukowski, L. (2016). Zapewnienie ciągłości dostaw w zmien-nym i niepewnym otoczeniu [Ensuring continuity of supply in variable and uncertain services]. Dąbrowa Górnicza, Poland: Wydawnictwo Naukowe WSB w Dąbrowie Górniczej.
Bukowski, L. (2016a). System of Systems Dependability - Theoretical Models and Applications Examples. Reli-ability Engineering & System Safety, 151, 76-92.
Bukowski, L. (2019). Reliable, Secure and Resilient Logis-tics Networks. Delivering products in a risky environ-ment. Switzerland: Springer Nature.
Corrigan, D. (2013). Integrating and governing big data. IBM Corporation Software Group.
Coyle, J., Bogostardi, E., & Langley, C. Jr. (2010). Zarządza-nie logistyczne [Logistics management]. Warszawa, Poland: Polskie Wydawnictwo Ekonomiczne S.A.
Gudehus, T., & Kotzab, H. (2009). Comprehensive Logistics. Berlin, Heidelberg, Germany: Springer.
Harisson, A., & van Hoek, R. (2010). Zarządzanie logistyką [Logistics management]. Warszawa, Poland: Polskie Wydawnictwo Ekonomiczne S.A.
ISO, (2009). Risk Management – Principles and Guidelines. ISO 31000:2009.
Jünemann, R. (1989). Materialfluss und Logistik. Springer.Kagermann, H., Wahlster, W. & Helbig, J. (2013). Recom-
mendation for implementing Industry 4.0. National Academy of Science and Engineering.
Kirsch, W., Bamberger, I., Gabele, E., & Klein, H. K. (1973), Betriebswitschafliche Logistik – Systeme, Entscheidun-gen, Methoden. Wiesbaden, Germany: Gabler.
Klimko, G. (2001). Knowledge management and maturity models: building common understanding. Proceed-ings of the Second European Conference on Knowl-edge Management. Bled, Slovenia.
Klir, G. J. (1991). Facets of systems science. New York, Unit-ed States: Plenum.
Krawczyk, S. (2011). Logistyka. Teoria i praktyka [Logistics. Theory and practice]. Warszawa, Poland: Difin.
Kulikowski, J. L. (2014). Data Quality Assessment: Prob-lems and Methods. International Journal of Orga-nizational and Collective Intelligence (IJOCI), 4(1), 24-36.
Lasch, R. (2014). Strategisches und operatives Logistikman-agement: Prozesse. Wiesbaden, Germany: Springer Gabler.
Magruk, A. (2017). Concept of uncertainty in relation to the foresight research. Engineering Management in Production and Services, 9(1), 46-55.
Mangan, J. et al. (2004). Combining quantitative and quali-tative methodologies in logistics research. Interna-tional Journal of Physical Distribution and Logistics Management, 7, 565-578.
Michlowicz, E. (2002). Podstawy logistyki przemysło-wej [Basics of industrial logistics].Kraków, Poland: Uczelniane Wydawnictwa Naukowo-Dydaktyczne
Volume 11 • Issue 4 • 2019
79
Engineering Management in Production and Services
Akademii Górniczo-Hutniczej im. Stanisława Staszi-ca.
Morgenstern, O. (1955). Note on the Formulation of the Theory of Logistics. Neval Research Logistics Quar-tely, 5, 129-136.
Pfohl, H. Ch. (1998). Systemy logistyczne. Podstawy organi-zacji i zarządzania [Logistics systems. Basics of orga-nisation and management]. Poznań, Poland: Instytut Logistyki i Magazynowania.
Schönsleben, P. (1998). Integrales Logistikmanagement. Pla-nung und Steuerung von umfassenden Geschäftsproz-essen, Berlin Heidelberg, Germany: Springer-Verlag.
Schumacher, A., Erol, S., & Sihn, W. (2016). A Maturity Model for Assessing Industry 4.0 Readiness and Ma-turity of Manufacturing Enterprises, Procedia CIRP, 52, 161-166.
Skyttner, L. (2008). General systems theory. Problems, per-spectives, practice. Word Scientific.
Ślusarczyk, B., Haseeb, M., & Hussain, H. I. (2019). Fourth industrial revolution: a way forward to attain bet-ter performance in the textile industry. Engineering Management in Production and Services, 7(4), 54-64.
Stock, J. R., & Lambert, D. M. (2001). Strategic Logistics Management. Mc Grow-Hill Higher Education.
Strandhagen, J. O. et al. (2017). Logistics 4.0 and emerging sustainable business models. Advances in Manufac-turing, 5, 359-369.
Tadejko, P. (2015). Application of Internet of Things in Logistics – current challenges. Engineering Manage-ment in Production and Services, 7(4), 54-64.
Weerdmeester, R., Pocaterra, C., & Hefke, M. (2003). VI-SION: Next generation knowledge management: Knowledge management maturity model. Informa-tion Societies Technology Programme.
Wieland, A., Handfield, R. B., & Durach, C. F. (2016). Map-ping the landscape of future research themes in sup-ply chain management. Journal of Business Logistics, 37(3), 205-212.
Witkowski, J. (2010). Zarządzanie łańcuchem dostaw: kon-cepcje, procedury, doświadczenia [Supply chain mana-gement: concepts, procedures, experiences]. Warszawa, Poland: PWE.