Embed Size (px)
Citation preview
Ion Microprobe δ18O-contraints on Fluid Mobility and Thermal Structure During Early
Slip on a Low-angle Normal Fault, Chemehuevi Mountains, SE California
A thesis presented to
the faculty of
the College of Arts and Sciences of Ohio University
In partial fulfillment
of the requirements for the degree
Master of Science
James E. Brown
December 2015
© 2015 James E. Brown. All Rights Reserved.
2
This thesis titled
Ion Microprobe δ18O-contraints on Fluid Mobility and Thermal Structure During Early
Slip on a Low-angle Normal Fault, Chemehuevi Mountains, SE California
by
JAMES E. BROWN
has been approved for
the Department of Geological Sciences
and the College of Arts and Sciences by
Craig B. Grimes
Assistant Professor of Geological Sciences
Robert Frank
Dean, College of Arts and Sciences
3
Abstract
BROWN, JAMES E., M.S., December 2015, Geological Sciences
Ion Microprobe δ18O-contraints on Fluid Mobility and Thermal Structure During Early
Slip on a Low-angle Normal Fault, Chemehuevi Mountains, SE California
Director of Thesis: Craig B. Grimes
The Mohave Wash fault (MWF), a low angle normal fault (~2 km of slip)
initiated near the brittle-ductile transition in crystalline rocks, is associated with the
regionally developed Chemehuevi detachment system. To address the role of water on
initiation and early slip, δ18O of quartz/epidote pairs from thin shear zones and vein-fill
were analyzed in situ using a 10 μm ion microprobe spot (precision ±0.3‰, 2 SD). 480
analyses were made on 317 grains in 23 samples collected from three vertical transects
from the footwall and through the damage zone, distributed over 17 km down-dip. Quartz
from undeformed hosts defines pre-faulting δ18O = 9.0–10.4‰ VSMOW. δ18O values
decrease within damage zone microstructures down to -1.0‰ for quartz and -5.3‰ for
epidote. Such low-δ18O values at the structurally deepest exposures are interpreted to
reflect influx of surface-derived fluids to depths of > 10 km.
Syn- and post-deformation mineralization in ~25% of the shear zones record
heterogeneous δ18O(mineral) on the scale of < 100 mm2. Inter- and intra-crystalline
variability in δ18O is greatest in the damage zone. Host clasts are often preserved, but
textural relations also signify heterogeneity in new mineral growth within discrete shear
zones. Of 123 grains analyzed with multiple spots, 36% are zoned in δ18O; single-grain
gradients reach 8.7‰ (over 500 μm) for quartz and 2.1‰ (over 300 μm) for epidote.
4
Differences in Δ18O(Qtz-Ep) from adjacent rims over < 100 mm2 range from 0.2–8.0‰ (in
damage zone) and 0.6–2.2‰ (below damage zone). Large variability in measured
Δ18O(Qtz-Ep) is consistent with variable oxygen isotope exchange, and sub mm-scale
heterogeneities in permeability. Despite the intrasample-variability, overall trends in
Δ18O(Qtz-Ep) from rims on adjacent grains (and thus temperature, assuming rims
equilibrated) vs. vertical position are resolved. Δ18O(Qtz-Ep) generally increases (=
decreasing temperature) over ~30–100 m vertical transects from the footwall into the
damage zone at structurally deep exposures, consistent with footwall refrigeration.
Temperature defined at shallow exposures is relatively high, and implies significant heat
transfer up the fault. These results are interpreted to reflect surface-derived fluid
infiltration at the onset of slip followed by fluid recirculation likely driven by syntectonic
dike emplacement.
5
Acknowledgements
I would like to thank my advisor Craig Grimes for his support and enthusiasm
since we met during my career as an undergraduate at Mississippi State University. His
excitement about my project has been extremely encouraging, especially during the
challenging times. I would like to acknowledge Dr. Barbara John and Justin LaForge for
their assistance on this project. Research and technical staff of the WiscSIMS lab at the
University of Wisconsin as well as the electron microprobe lab at the University of
Tennessee, Dr. John Valley, Dr. Kouki Kitajima, Jim Kern, and Alan Patchen assisted me
in analyses or discussions. Thanks are due to my committee at Ohio University, Drs.
Gregory Nadon and Damian Nance. I would like to thank the faculty, staff, and students
of Clippinger Laboratories for their friendship and encouragement during my time here.
Especially of note are my fellow advisees of the past two years Cody MacDonald and
Cody Strack for providing support and helping to alleviate stress. Funding came from
NSF (EAR-1145183), the Ohio University Department of Geological Sciences, and the
Geological Society of America (GSA). I would like to thank my family who has shown
me enormous support not only during my graduate work, but also throughout my life. I
want to end by thanking my partner Jen for being completely understanding and
supportive of all my ideas and eccentricities. She has given me an abundance of support
scientifically and emotionally.
6
Table of Contents
Page Abstract ................................................................................................................................3
Acknowledgements ..............................................................................................................5
List of Tables .......................................................................................................................8
List of Figures ......................................................................................................................9
1. Introduction ....................................................................................................................12
2. Background ....................................................................................................................16
2.1 Low-angle detachment normal faults .......................................................................16
2.2 Detachment fault related mineralization ..................................................................17
2.3 Stable Isotopes and thermal structure of detachment shear zones ...........................18
2.3.2 Oxygen isotope studies on detachment faults .................................................. 20
2.4 Geologic setting .......................................................................................................23
2.4.1 Mohave Wash fault .......................................................................................... 26
2.4.2 Previous thermal structure studies ................................................................... 27
3. Methods..........................................................................................................................32
3.1 Sampling strategy.....................................................................................................32
3.2 Analytical techniques ...............................................................................................33
3.2.1 Microscopy ...................................................................................................... 33
3.2.2 Electron probe microanalysis ........................................................................... 34
3.2.3 Ion microprobe analysis ................................................................................... 35
3.2.3.1 Sample preparation ................................................................................... 35 3.2.3.2 SIMS oxygen isotope analysis .................................................................. 36 3.2.3.3 Post-SIMS imaging ................................................................................... 37
3.3 Oxygen-isotope thermometry ..................................................................................37
4. Results ............................................................................................................................45
4.1. The Saddle Section: Generalized outcrop and sample description .........................45
4.1.1 The Saddle Section: Petrographic and Microstructural description ................ 46
4.2 The Bat Cave Wash Section: Generalized outcrop and sample description ............48
4.2.1 The Bat Cave Wash Section: Petrographic and Microstructural description .. 49
4.3 Vertical transect summary .......................................................................................51
4.4 Additional samples...................................................................................................52
4.5 Electron probe microanalysis results .......................................................................54
7
4.6 Oxygen isotope results .............................................................................................55
4.6.1 Oxygen isotope composition of The Saddle .................................................... 56
4.6.2 Oxygen isotope composition of Bat Cave Wash ............................................. 58
4.6.3 Oxygen isotope composition of additional MWF samples .............................. 62
4.6.4 Intercrystalline variability in oxygen isotope composition .............................. 64
4.6.4.1 Heterogeneity: shear zones versus veins ................................................... 65 4.6.4.2 Oxygen isotope zonation within mineral grains ....................................... 67 4.3.2.3 Mineral pair variability within microstructural domains .......................... 68
5. Discussion ......................................................................................................................96
5.1 Evidence for early fluid-infiltration along the Mohave Wash fault .........................96
5.2 Miocene fluid-rock interaction ................................................................................97
5.3 Grain-scale oxygen isotope variability ..................................................................100
5.3.1 Ion microprobe data verses conventional analyses of isotope composition .. 101
5.4 Calculated temperatures of in situ mineral pairs ....................................................102
5.4.1 Vertical isotopic and thermal characteristics through the Mohave Wash fault................................................................................................................................. 106
5.4.1.1 The Saddle .............................................................................................. 106 5.4.1.2 Mohave Wash ......................................................................................... 107 5.4.1.2 Bat Cave Wash ........................................................................................ 107
5.4.2 Summary of vertical transect trends .............................................................. 108
5.5 Surface-derived fluids and the Mohave Wash fault ...............................................110
5.6 Stable isotopic constraints on lateral variations along the Mohave Wash fault ....114
6. Conclusions ..................................................................................................................131
References ........................................................................................................................134
Appendix – Additional elemental and stable isotope data ...............................................143
8
List of Tables
Page
Table 3.1: Samples from the Mohave Wash fault analyzed for hydrothermal minerals….….….….….….….….….….….….….….….….….….….….….….….….…..40 Table 4.1: Results of petrographic analysis of Mohave Wash fault samples associated ..69 Table 4.2: Data from electron microprobe analysis Mohave Wash fault samples……....71 Table 4.3: Summary of oxygen isotope compositions…………………………………...72 Table 4.4: Summary of intercrystalline homogeneity of analyzed minerals in δ18O.……76 Table 4.5: Summary of intracrystalline zonation patterns in δ18O……...…………….…79 Table 5.1: Summary of calculated temperatures from the Mohave Wash fault…..…....117 Table 5.2: Summary of calculated temperatures of the Mohave Wash fault from samples with heterogeneous microstructural domains……..……….………………………...…120 Table A1: Weight percent oxide data for epidote from electron microprobe analysis....143 Table A2: Epidote number of ions data from electron microprobe analysis…………...152 Table A3: Feldspar weight percent oxide data from electron microprobe analysis……161 Table A4: Feldspar number of ions data from electron microprobe analysis………….164 Table A5: Ion microprobe data for analysis of quartz, epidote, and K-feldspar……….165
9
List of Figures
Page
Figure 2.1: Idealized low-angle normal fault with the effects of extensional shearing and footwall heating on geothermal gradient ……………………………………………..…29 Figure 2.2: Simplified geologic map showing sample locations and cross-section of the Chemehuevi Mountains, California…………………………………….………….…….30 Figure 3.1: Field characteristics of the Mohave Wash fault damage zone at The Saddle vertical transect……………………………..………………………………………...….42 Figure 3.2: Field characteristics of the Mohave Wash fault damage zone at the vertical transect located at Bat Cave Wash………………………………..……………..………43 Figure 3.3: Example analysis pits by ion microprobe…………….……………..………44 Figure 4.1: Hand sample example of a cataclasite from the Mohave Wash fault at The Saddle vertical transect…………………………………………………..……………....80 Figure 4.2: Annotated photographs, X-ray maps and backscattered electron images of samples characteristic of the Mohave Wash fault at The Saddle vertical transect……....81 Figure 4.3: Annotated photograph, X-ray maps, and backscattered electron images of sample CG-14CH-126 from the top of the Mohave Wash fault damage zone at the mouth of Bat Cave Wash……………………...........………………………………...…………82 Figure 4.4: Annotated photograph, X-ray maps, and backscattered electron images of sample CG-14CH-128 taken from the bottom of the Mohave Wash fault damage at the mouth of Bat Cave Wash ……………............................………………………………..83 Figure 4.5: Annotated photograph and X-ray maps of sample CG-14CH-124 from 1 m below the main Mohave Wash fault damage zone at the mouth of Bat Cave Wash ……84 Figure 4.6:Annotated backscattered electron images of sample CG-14CH-135 from 10 m below the main Mohave Wash fault damage zone at the mouth of Bat Cave Wash.........85 Figure 4.7: Annotated photograph and backscattered electron images of sample CG-13CH-4 from the Studio Spring sampling area……………………………….....……….85 Figure 4.8: Annotated photograph and backscattered electron image of sample CG-13CH-24 from the Trampas Wash sampling area……………………………..…………86
10
Figure 4.9: The XFe of 17 samples taken from within and outlying the main damage zone of the Mohave Wash fault………………………………….………………………....….87 Figure 4.10: Summary showing petrographic relations of analyzed textures for all 503 measurements of δ18O (‰, VSMOW) of quartz, epidote, and K-feldspar in 23 analyzed samples…………………………………………………………………..………….……88 Figure 4.11: Secondary electron images of sample CG-14CH-127 from Bat Cave Wash showing significant intracrystalline and grain-to-grain variation in δ18O values.....…….89 Figure 4.12: All oxygen isotope analyses of quartz and epidote sampled by field site plotted versus distance along the Mohave Wash fault……….…………………………..89 Figure 4.13: All ion microprobe measurements arbitrarily arranged in order of increasing δ18O (‰) of quartz and epidote in samples taken from three vertical transects of the Mohave Wash fault damage zone……………………………………..…..……………..90 Figure 4.14: All ion microprobe measurements arbitrarily arranged in order of increasing δ18O (‰) of quartz and epidote in additional samples taken along the Mohave Wash fault damage zone.…………………………………...…………………………….…………..91 Figure 4.15: Summary showing petrographic relations of all 116 measurements of δ18O (‰) of quartz, epidote, and K-feldspar in six analyzed samples from the Mohave Wash fault vertical transect at The Saddle…………………………………….……………..…92 Figure 4.16: Summary showing petrographic relations of all 235 measurements of δ18O (‰) of quartz and epidote in nine analyzed samples from Mohave Wash fault vertical transects at Bat Cave Wash…………………….……………………………...…………93 Figure 4.17: Annotated photograph and backscattered electron images of sample CG-13CH-RF from the Range Front sampling area………………….……………...……….94 Figure 4.18: Backscattered electron image of sample CG-14CH-133 from Bat Cave Wash…………………………………………………...……..………………...………..95 Figure 5.1: Comparison of stable isotope compositions of δ18O and elemental iron composition of epidote for a given sample ………………………………………..…...122 Figure 5.2: Comparison of stable isotope compositions of δ18O (‰) of quartz and epidote for a given sample ………………………………….………………………….…..…...123 Figure 5.3: Summary of measured δ18O (‰, VSMOW) of quartz-epidote mineral pairs in fault rocks analyzed by ion microprobe……………………………………………..….124
11
Figure 5.4: (a) Quartz and epidote δ18O values (‰, VSMOW) from a given vertical transect plotted versus Mohave Wash fault (MWF) position. (b) Apparent temperatures calculated using the oxygen isotope fractionation plotted versus the MWF position.…125 Figure 5.5: Measured δ18O(Qtz) values plotted versus respective calculated δ18O of fluids. Measured δ18O(Ep) values plotted versus respective calculated δ18O of fluids……….…126 Figure 5.6: (a) Calculated apparent temperatures of quartz-epidote mineral pairs from a given field site plotted versus distance along the Mohave Wash fault (MWF). (b) The effect of rapid advection of heat transport along the MWF relative to the overall geothermal gradient…………………………………………………………………….127 Figure 5.7: (a) Summary cartoon of the Mohave Wash fault with results from this study. (b) Modeling by Gottardi et al. (2013) showing colder temperatures within a detachment recharge zone and hotter temperatures within a detachment discharge zone…………..129
12
1. Introduction
Despite recognition of regionally developed, large-slip, low-angle normal faults
(LANFs) globally and in various geotectonic settings, controversy remains regarding
their initiation and protracted slip at shallow dips through the seismogenic crust (review
by John and Cheadle, 2010; Whitney et al., 2013). Hydrothermal fluid circulation, heat
flow, and the behavior of actively slipping geologic faults are most likely intimately
linked, and fluids may contribute to early fracture development and later strain
localization of low-angle faults through weakening processes involving reaction
softening, elevated pore pressure and/or reduced frictional coefficients, which are often
invoked to explain fault movement (e.g., Lachenbruch, 1980; Famin et al., 2004;
Collettini, 2011). Low-angle normal fault systems are widely recognized as major
conduits for fluid migration (e.g., Kerrich and Rehrig, 1987; Fricke et al., 1992;
Wickham et al., 1993; Nesbitt and Muehlenbachs, 1995; Losh et al., 1997; Morrison and
Anderson, 1998; Holk and Taylor, 2007). Speculations on the source of fluids moving
through these faults vary widely and are based largely on stable isotope data. The
spectrum of inferred fluids include shallow level meteoric water (Kerrich and Hyndman,
1986; Glazner and Bartley, 1991), basinal brines (Spencer and Welty, 1986; Roddy et al.,
1988), deep magmatic or metamorphic sources (Smith et al., 1991; Axen, 1992; Smith et
al., 2008), or mixing of multiple sources (Spencer and Welty, 1986). Some authors have
suggested that surface-derived fluids penetrate to 10-15 km depths (Wickham et al.,
1993; Fricke et al., 1992; Kerrich and Rehrig, 1987). Other workers favor the concept
that downward fluid penetration is restricted to the upper, brittle sections of detachment
faults, whereas the release of metamorphic or deeply seated magmatic fluids account for
13
the alteration of ductile portions of the system (e.g., Axen et al., 2001). Once initiated,
cataclasis associated with faulting increases permeability, channeling fluids into a fault
zone, allowing fluid-assisted deformation processes to enhance break-down reactions of
feldspar to form weaker phyllosilicates.
Past research of LANFs has focused in large part on fault breccias and gouges
related to late slip that occurred after fault initiation since these are often readily
preserved (reviewed by Collettini, 2011). Such studies have consistently suggested that
increased fluid pore pressure and development of aligned phyllosilicate-rich networks
contribute to fault slip based on laboratory evidence of fault zone fabrics (reviewed by
Collettini et al., 2009). However, field evidence is elusive, and it is not clear when these
weakening mechanisms develop or how the fault initially breaks.
Oxygen isotope geochemistry can be an effective monitor of fluid rock
interactions, and the fractionation of 18O between minerals is temperature sensitive. If
equilibrated, two co-existing minerals formed from the same fluid can be used to monitor
the temperature of formation based on comparisons between their δ18O values and
established experimental oxygen isotope fractionation factors (e.g., Valley, 2001). Most
stable isotope studies on LANFs have been conducted using bulk measurements on whole
rocks or mineral separates. Such measurements effectively constrain integrated fluid
histories, but likely obscure fluid-rock interaction associated with early slip along faults.
For example, Morrison (1994) demonstrated that mylonitic footwall rocks to the Whipple
detachment (California) had low-δ18O caused by a secondary overprint (on feldspar)
related to late circulation of meteoric water at ~350°C, rather than infiltration of fluids
while the rocks experienced ductile deformation. Overprinting of isotopic signatures of
14
microstructures by later fluid flow may be quite common. Morrison and Anderson (1998)
found spatially varying Δ18O(Qtz-Ep) (δ18O(Qtz) - δ18O(Ep)) fractionations in minerals
separated from chlorite breccias in the Whipple detachment fault footwall within
gneisses. They showed Δ18O(Qtz-Ep) increased from 4.54 ± 0.46 ‰ (yielding an oxygen
isotope temperature of 458°C) 50 m below the fault to 5.81 ± 0.52 ‰ (~350°C) 12 m
below the fault. They attributed this extreme geothermal gradient (82°C over 38 m or
2160°C/km) to convection of cool surface-derived fluid down high-angle faults in the
upper plate. More recent studies have reported similar transient vertical geotherms in
detachment faults of ~2000°C/km in mylonitic micaschists and marbles of the Tinos
detachment in the Aegean (Famin et al., 2004), and 140°C over 100 m in quartzite fault
rocks of the Raft River detachment in Utah (Gottardi et al., 2011). Similarly, McCaig and
Harris (2012) suggest upward fluid and heat migration along oceanic detachment faults
where a high temperature heat source (melt lens) occurs at depth. If common, this process
would lead to cooling and strain localization along brittle structures due to the rapid
advection of heat by infiltrating surface-derived fluids.
Past research considered, the goal of this study is to evaluate the role of footwall
refrigeration (or heating) during initiation of the extinct limited-slip, low-angle Mohave
Wash fault (MWF) seated in the footwall to the regional Chemehuevi fault system
located in SE California using oxygen isotope geochemistry. The MWF is thought to
have limited slip history (~2 km of displacement and lacking the development of a gouge
zone common in mature faults) partly in isotropic granites (no preexisting fabrics to help
localize deformation), preserving conditions shortly after fault initiation near the brittle-
ductile transition zone (John and Foster, 1993). Thus, limited fluid-rock interactions
15
during the pre- and post-faulting history allow isotopic signatures reflecting fluid flow
within MWF microstructures to be constrained directly to the early slip history. Sampling
of vertical transects through the MWF damage zone, and laterally over ~17 km in the
down-dip direction allow characterization of the stable isotopic composition on various
scales. The Δ18O(Qtz-Ep) of mineral pairs have been determined in situ by ion microprobe
using a 10 μm spot. The principal advantage of this technique is the ability to relate
specific textures or zones/domains within single grains identified by optical microscope
and Scanning Electron Microscope (SEM) to stable isotope compositions. The
assumption of stable isotope equilibrium can be evaluated more effectively when
adjacent rims on two grains are analyzed, allowing mineral zoning and mineralization
related to MWF deformation and fluid flow to be recognized and resulting in more
geologically meaningful temperature calculations. The isotopic data are used to address:
1) the extent to which heat and mass transfer along a LANF creates a locally steep
vertical gradient that may help facilitate strain localization; 2) the likely source of fluids
at fault initiation and with progressive slip; and 3) lateral variations in fluid-rock
interactions over 17 km in the down-dip direction, reflecting paleodepths ranging from
~5-11 km.
16
2. Background
2.1 Low-angle detachment normal faults
Detachment faults, or low-angle normal faults (LANFs), are gently dipping (30°
or less) regional features showing domed topography with offsets of 10–50 km (Figure
2.1a; Axen, 2004). These features have been recognized in a wide variety of settings such
as the Basin and Range province of the Western US, rifted continental margins, and mid-
ocean ridge spreading centers (Figure 2.2; John and Cheadle, 2010) and are considered
important structures along which extreme lithospheric extension is accommodated.
Although appreciation of large offset detachment faults in continental and oceanic crustal
settings has expanded in recent decades, discussion with regard to their initiation and
early slip mechanisms remains controversial (John and Foster, 1993; Axen, 2004; Famin
et al., 2004; Collettini, 2011; Gottardi et al., 2015) since Andersonian fault mechanical
theory does not predict the development of normal faults at such low-angles to horizontal
(Anderson, 1951; Collettini and Sibson, 2001). Contrary to theoretical predictions, field
observations from detachment faults accompanied by thermochronometric and
paleomagnetic data indicate both initiation and kilometer-scale displacement within the
brittle crust (John and Foster, 1993; Axen, 2007). Detachment faults are suggested by
some to initiate within the brittle zone and without conventional stick-slip behavior by
providing considerable extension through aseismic creep since the accommodation of
large amounts of displacement found with detachment faults is anomalous due to the lack
of observed large magnitude earthquakes (Howard and John, 1987; Abers, 1991; Axen et
al., 1999; Collettini and Holdworth, 2004; Abers, 2009). Detachment faults are
17
influenced by extension of uplifted core complexes that form domal geometries, or
upwarping, parallel to the extensional direction (Yin and Dunn, 1992). This domed
detachment geometry may be the product of various processes: isostatic response from
past tectonic events (Rehrig and Reynolds, 1980); reverse drag from a deeper underlying
detachment fault (Davis and Lister, 1988); formation of shear zones in the lower plate of
the detachment (Reynolds and Lister, 1990); movement initiated by a flat fault surface
(John, 1987). Analysis on the origin of domal detachment zones has focused on the link
between detachment faults and their observed lower-plate structures (John, 1987), dikes
(Spencer et al., 1986), and mylonitic-zones (Davis, 1988).
2.2 Detachment fault related mineralization
Significant evidence for fluid migration along detachment faults, which may
promote reaction-weakening processes and facilitate slip, comes from field observations
(Spencer and Welty, 1986; Roddy et al., 1988; Spencer and Reynolds, 1989). Greenschist
facies minerals including epidote, chlorite, and calcite are typically found throughout the
damage zone in early-slip portions of many detachment faults of the Colorado River
extensional corridor (CREC), including the Mohave Wash fault (MWF) (John, 1987;
Lister and Davis, 1989). Distinct features of detachment-fault-related mineralization in
general are:
1. Mineralization is controlled by structures formed during detachment faulting.
Structures include the low-angle detachment-fault system, high-angle faults in the
18
lower-plate just below the detachment fault, and low- to high-angle normal faults
in the upper-plate.
2. Mineralization localized in zones that have been brecciated or deformed by
movement along or above the detachment fault.
3. Chlorite-epidote-calcite alteration along and below the detachment fault.
Late mineralization consists of iron and copper oxides, principally specular to earthy
hematite. Common gangue minerals are quartz, barite, fluorite and manganese oxides.
Lower-temperature clay gouge mineralization is also common in faults active to low
temperatures.
2.3 Stable Isotopes and thermal structure of detachment shear zones
The fractionation of 18O between water and minerals provides a sensitive
indicator of fluid-rock interactions (O’Neil, 1986; Chacko et al., 2001). The fractionation
of 18O between two phases is also temperature dependent. However, oxygen isotope
thermometry has proven more difficult in large part due to uncertainties about
equilibration between mineral assemblages and an altering fluid (Valley, 2001). Mineral
pairs may be equilibrated through coprecipitation from a single fluid, reequilibration
during crystal plastic deformation, or from bulk diffusive exchange between preexisting
minerals, although the latter is typically only expected at adjacent grain boundaries
(O’Neil, 1986). To determine geologically meaningful temperatures using stable isotopes,
mineral pairs must be equilibrated and must not have experienced differential exchange
or resetting during cooling or later fluid-rock interactions (O’Neil, 1986; Valley, 2001).
19
This constraint can become problematic at the grain scale where growth zoning,
recrystallization, grain boundary diffusion, and exchange with a hydrothermal fluid occur
(Valley, 2001; Valley and Kita, 2009; Ferry et al., 2014).
As a rock cools, minerals will continue to exchange oxygen isotopes with
surrounding minerals of different δ18O values as part of a closed system exchange. High
oxygen diffusivity minerals (e.g., K-feldspar) will exchange oxygen isotopes during
cooling to low temperatures (< 300°C). Low oxygen diffusivity minerals (e.g., epidote)
will exchange oxygen isotopes only at high temperatures (> 800°C) and δ18O values
should not be affected by cooling. Minerals with medium oxygen diffusivity (e.g., quartz)
will restrict exchanging oxygen isotopes below ~550°C (Cole and Chakraborty, 2001).
Open system exchange occurs when a fluid moves through a rock allowing
minerals to exchange oxygen isotopes with the fluid, however the roles of fault
permeability and deformation mechanisms in oxygen isotope transport and exchange
during fluid flow are poorly understood (Bowman et al., 1994; Person et al., 2007;
Gottardi et al., 2013). Inter-grain fluids may be preferentially incorporated into one
mineral relative to another. Oxygen isotope disequilibrium is frequently interpreted to be
present in shear zones, where kinetic fractionation (physical separation of isotopes)
surpasses equilibrium fractionation (thermodynamic separation). Disequilibrium
exchange is unlikely to have affected δ18O values from the samples containing quartz and
epidote from the MWF due to relatively high oxygen diffusivity properties (e.g.,
Morrison and Anderson, 1998).
20
2.3.2 Oxygen isotope studies on detachment faults
In an attempt to constrain fluid-rock interactions during faulting of the
detachment zone, many previous stable isotope studies used laser fluorination
measurements from whole rock and mineral separates consisting of 2–3 milligrams of
material (Losh, 1989; Fricke et al., 1992; Wickham et al., 1993; Morrison, 1994;
Morrison and Anderson, 1998; Holk and Taylor, 2007; Gottardi et al., 2011; MacDonald,
2014). A common finding was lowered δ18O along fault rocks, consistent with the influx
of low-δ18O surface-derived fluids. Morrison (1994), found the Whipple detachment fault
had low absolute δ18O values of quartz and K-feldspar associated with late circulating
surface-derived fluids overprinting feldspar found in the mylonitic footwall; the low
absolute δ18O values were interpreted to post-date the mylonite-forming event. Studies
using quartz-feldspar mineral pairs often find oxygen isotope exchange trajectories
showing δ18O(Qtz) – δ18O(Kfs) plots with a vertical slope (e.g., Morrison, 1994; Holk and
Taylor, 2007). Feldspars are particularly sensitive to low temperature oxygen exchange
with fluids as well as hydrolysis reactions that produce secondary phyllosilicates (i.e.,
clays; Valley, 2001). Through careful sampling of adjacent quartz and epidote grains in
the footwall to the Whipple detachment, Morrison and Anderson (1998) reported
systematic variations in mean Δ18O(Qtz-Ep) (δ18O(Qtz) - δ18O(Ep)) within the footwall, and
based on oxygen isotope thermometry interpreted them to reflect an extreme geothermal
gradient (82°C over 38 m) from 50–12 m below the damage zone (Figure 2.1c). Based on
a systematic change in Δ18O (Qtz-Ms), Gottardi et al. (2011) subsequently suggested that a
thermal gradient of 140°C, found over a 100 m thick shear zone of the Raft River
detachment, forms near the brittle-ductile transition zone to account for the formation of
21
shearing and convection of fluids (i.e., Figure 2.1b). Similarly, Famin et al. (2004)
reported a thermal gradient of ~2000°C/km in the Tinos detachment using Δ18O (Qtz-Cc)
fractionations from quartz-calcite mineral pairs. MacDonald (2014) provided evidence
for a downward shift in whole rock and mineral δ18O values from quartz and epidote
within shear zones along the MWF relative to undeformed granitic host rocks, indicating
that infiltration of low-δ18O fluid (surface-derived) permeated the MWF zone early in the
development of shear zones.
In an attempt assess the hydrologic and thermal controls on fluid-rock isotopic
exchange and transport along idealized detachment faults, modeling by Person et al.
(2007) and Gottardi et al. (2013) has been used to show that “domino” or “book shelf”
thinning effects of the upper brittle crust (e.g., Lister and Davis, 1989) allows infiltrating
fluid to channelize as its base and transfer heat (e.g., Lopez and Smith, 1995). Modeling
by Person et al. (2007) and Gottardi et al. (2013) show that considerable oxygen isotope
and heat distributions resulting from low-δ18O fluid flow at mid-crustal depths is highly
dependent upon permeability (i.e., detachment fault damage zone). The transfer of heat
along permeable fault systems at depth would promote a steep geothermal gradient in the
footwall, which is supported by existing oxygen isotope thermometry constraints (e.g.,
Morrison and Anderson, 1998; Famin et al., 2004; Gottardi et al., 2011).
Field and thin section observations from studied detachment faults indicate that
individual shear zones experienced several episodes of deformation which in some cases
included early semi-brittle deformation followed by cataclasis and subsequent
hydrothermal alteration of feldspars and along fractures (Morrison, 1994). Conventional
analytical techniques (laser fluorination) using millimeter-scale sample size may
22
homogenize multiple events and obscure heterogeneities such as mineral zoning due to
extended growth events, inclusions of other minerals, or hydrothermal alteration
overprinting formation compositions (i.e., Morrison, 1994; Morrison and Anderson,
1998; Gottardi et al., 2011; MacDonald, 2014). These factors make it difficult to relate
bulk geochemical compositions to specific microstructures. In contrast to conventional
techniques, analysis by ion microprobe provides improved spatial resolution and the
ability to correlate geochemistry directly to specific microstructures. Valley and Graham
(1996) found regular variations of 3–13‰ over 200–400 m extensional shear zones,
respectively, in δ18O using single quartz grains with ion microprobe analysis. The only
application of secondary ion mass spectrometry (SIMS) techniques to LANFs known to
the author was conducted by Famin et al. (2004) produced results providing support of
footwall refrigeration from surface-derived fluids (absolute δ18O values < 5‰) circulating
along a LANF with a geotherm of > 100ºC/50 m using quartz-calcite oxygen isotope
fractionations. The cumulative results of these studies establish that circulating fluids
along faults is a complex system and requires in situ oxygen isotope geochemistry by
spatially resolved ion microprobe analysis to better understanding these fluid interactions.
Late low-temperature overprinting of isotopic signatures from infiltrating fluids is
common in evolving fault systems (Fricke et al., 1992; Morrison 1994; Morrison and
Anderson, 1998; Famin et al., 2004, 2005; Holk and Taylor; 2007; Gottardi et al., 2011).
However, Sharp et al. (1991) demonstrated that quartz will be significantly less altered
than whole rock or feldspars due to extremely slow bulk diffusion at temperatures <
500ºC. Coexisting quartz and epidote have been shown to be effectively closed to
subsolidus oxygen isotope diffusion at temperatures below ~550ºC (Sharp et al., 1991;
23
Ferreira et al., 2003). Thus, these minerals are expected to preserve δ18O values inherited
during original formation or later recrystallization that are unaffected by the subsequent
uplift, extension, and hydrothermal fluid flow. Mathews (1994) found that the
equilibrium fractionation for quartz and epidote (Δ18OQtz-Ep) to varied by 4‰ over 250–
450ºC and established that the quartz-epidote thermometer is reasonably sensitive in this
temperature range given typical analytical uncertainties (±0.1‰ for laser fluorination;
±0.3‰ for ion microprobe; Valley and Kita, 2009).
2.4 Geologic setting
The Chemehuevi Mountains and Whipple Mountains are centrally located
features of the Colorado River extensional corridor (CREC), which underwent crustal
extension from 23–12 Ma, accommodated an estimated 40–75 km of motion thought to
be caused by crustal relaxation and Basin and Range extension (Figure 2.2; Davis et al.,
1980; Howard and John, 1987). The CREC stretches from southeastern California and
western Arizona to southern Nevada and lies within the curved boundary of Cordilleran
core complexes containing the Whipple, Buckskin, Dead, and Chemehuevi Mountains
(Coney, 1980). These mountains represent metamorphic core complexes comprising
upper to mid-crustal rocks denuded by regional detachment faults. The corridor is
initiated along a rooted asymmetric zone of crustal extension. Seismic refraction and
structural data has suggested Chemehuevi detachment system is connected in the
subsurface to the Whipple Mountains detachment fault, lies < 3 km beneath the Mohave
24
Mountains, and can be rooted as far east as the Hualapai Mountains, ~80 km (Howard
and John, 1987; John, 1987).
The rock types exposed in the Chemehuevi Mountains core complex include
Cretaceous granitic lithologies, Proterozoic layered gneisses, and Tertiary basaltic to
rhyolitic dike swarms (Figure 2.2). The Chemehuevi Plutonic Suite makes up the central
and southwestern portions of the area and is exposed primarily as granodiorite (Kpg)
showing a zonation of increasing silica content toward the center of the pluton.
Proterozoic gneiss makes up the northeast portion of the area composed of layered
orthogneiss and paragneiss with common leucosome pods. The gneisses contain
subvertical veins with greenschist mineralization (i.e., epidote) and typically show
alteration of biotite to chlorite. Basaltic to rhyolitic Tertiary dike swarms intrude the
Chemehuevi plutonic suite in southwest and central parts of Chemehuevi Mountains.
Dikes are of several generations, but a K-Ar age of 20.7 ± 1.3 Ma implies some of the
intrusions occurred during regional extension (John and Foster, 1993). Dikes in the
northeastern portion of the area show strong internal lineations oriented parallel to the
established extension direction. Mineralized shear zones are observed at the margin of
several dikes.
Field studies of the Chemehuevi Mountains reveal that the Cretaceous granitoids
and Proterozoic gneiss country rocks were exposed by a series of at least two stacked
faults that formed at the time of detachment with > 23 km of displacement in the original
dip direction (Howard and John, 1987; John and Foster, 1993). Of the two major low-
angle normal faults recognized previously (John, 1987), the Chemehuevi detachment
fault (CDF) is the shallowest structurally and accommodated the majority of the
25
extension at the Chemehuevi Mountains. The CDF is associated with the neighboring
Whipple detachment fault ~30 km SE and the Sacramento detachment fault ~20 km NW
(Figure 2.2; John, 1987).
Field observations from the Chemehuevi and Whipple detachment faults have
shown displacements of more than ~8 km along the Chemehuevi fault (Miller and John,
1988) and ~40 km along the Whipple fault system (Davis and Lister, 1988). Slip-
direction indicators such as slickenlines, lineations, offset markers, preserved striae, drag
folds, minor faults within related cataclasites, and the southwest dip of syntectonic strata
above each detachment fault show motion of the upper plates was to the northeast at 050
(John, 1987; Yin and Dunn, 1992). Age of the CREC initiation has been determined by
crystallization ages of syntectonic plutons, 40Ar/39Ar footwall cooling ages, and K-Ar
ages from synextensional volcanic rocks to be ~23 Ma (Spencer and Reynolds, 1991;
Anderson et al., 1988; Howard and John, 1987).
The hanging-wall of the CDF contains many high-angle normal faults that have
rotated over time to shallower dips but which do not cut the detachment providing
evidence for detachment fault emplacement without passive rotation (Howard and John,
1987). The faults cut across large portions of isotropic plutonic rocks in the southwestern
portion and gneisses similar to those found in the Whipple Mountains in the northeastern
portion of the mountains (Howard and John, 1987). The gneisses are the structurally
deepest fault rocks and contain thin (1–10 cm) shear zones. The faults are thought to have
served as fluid pathways based on previous oxygen isotope studies. Even though fluid
source and infiltration mechanisms for low permeability crystalline rock within
continental crust to depths of the brittle-ductile transition remain problematic (Fricke et
26
al., 1992; Morrison, 1994; Morrison and Anderson, 1998; Famin et al., 2004; Holk and
Taylor, 2007), numerical modeling of oxygen isotope transport and exchange has proven
useful in constraining parameters allowing meteoric fluid to circulate to these depths
(Bowman et al., 1994; Person et al., 2007; Gottardi et al., 2013).
2.4.1 Mohave Wash fault
The Mohave Wash fault (MWF) is a relatively small-displacement (1–2 km) low-
angle fault outcropping as a sinuous trace over 350 km2 that was denuded to near the
surface within the CDF footwall and exposed through erosion (John and Foster, 1993).
The lack of fault gouge on the MWF indicates that the fault did not reactivate at
shallower depths and it is considered to preserve the initial faulting structures and
mineralization associated with detachment fault initiation at depth (John and Foster,
1993). Previous studies of the MWF describe a damage zone varying from 10 to ~200 m
thick, represented by cracked granite/gneiss, chlorite-rich breccia/cataclasite, and
cohesive cataclasite with indication of sequential fracturing and fluid flow (John, 1987;
LaForge et al., 2014). The metamorphic minerals epidote, chlorite, and calcite are found
hosted throughout the damage zone of the MWF, but are scarce away from the fault. John
(1987) determined that cataclasis was the primary deformation microstructure during
early slip history producing the thick chlorite-rich cataclasite/breccia zones with little
evidence of mylonitization. In the southwest region the MWF cuts isotropic granodiorite
and is dominated by brittle deformation. The MWF in the structurally deepest northeast
region cuts gneissic fabric with plastically deformed mafic and felsic dikes intruding the
27
damage zone with foliations parallel to slip direction (John and Foster, 1993; LaForge et
al., 2014).
2.4.2 Previous thermal structure studies
Both structural and thermochronologic data from the Chemehuevi Mountains
show that low-angle normal faulting began 22–24 Ma (John and Foster, 1993). Using
multiple thermochronometric systems (40Ar/39Ar on hornblende [closure temperature of
490ºC (Harrison, (1982)] and biotite [closure temperature of 373ºC (Berger and York,
(1981)], and fission-track on apatite), John and Foster (1993) defined a southwest to the
northeast trend of decreasing cooling ages in samples from the lower plate footwall rocks.
The trend of younger biotite 40Ar/39Ar ages toward the northeast is consistent with deeper
structural levels at the time of detachment-fault activity and is interpreted as
demonstrating rapid cooling associated with detachment initiation (John and Foster,
1993). Based on the closure temperatures and ages of minerals from samples collected
over 16 km in the spreading direction, they determined a continuous increase in
temperature of < 200ºC in the southwest to > 450ºC in the northeast at the time of fault
initiation (~23 Ma). MacDonald et al. (2014) found apparent temperatures using oxygen
isotope thermometry on coexisting quartz and epidote from the MWF footwall to be
typically 50–150ºC higher than ambient footwall temperatures found by John and Foster
(1993) at fault initiation. John and Foster (1993) and MacDonald et al. (2014) both found
that temperatures increased along fault with paleodip. Using these data along with
estimated thermal gradients of 30–50ºC/km, the fault system was modeled to root at a
minimum depth of ~10–12 km with a paleodip ≤30º, and an estimated slip rate of ~8
28
mm/yr (John and Foster, 1993). However, circulation of surface-derived fluids along the
fault (i.e., footwall refrigeration) could locally perturb geothermal gradients by creating
lower temperatures deeper than expected that resulted in closure of thermochronometers
prior to substantial uplift (Figure 2.1b,c). Carter et al. (2004) found anomalous young
ages from the Chemehuevi Mountains among the consistent age decrease along the slip
direction using the apatite (U-Th)/He (closure temperature of ~40-80ºC)
thermochronometer indicative of localized heat flow, possibly due to syntectonic dike
emplacement.
29
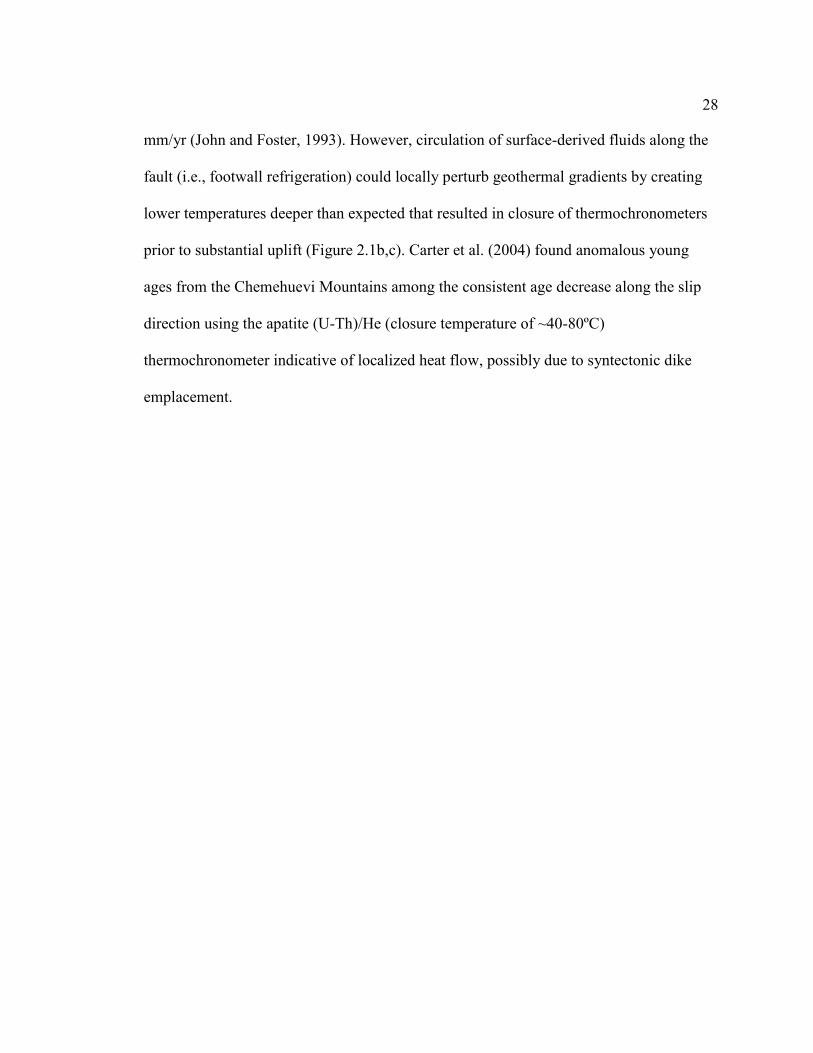
Figure 2.1: (a) Schematic cross section of an idealized low-angle normal fault shortly after initiation, with possible fluid flow paths and channelized fluid flow (blue arrows) along high-angle faults in the upper plate and along the main detachment. (b) Two models for the thermal structure along a fault showing effect extensional shearing (left) resulting in localized footwall heating of a given detachment fault (red dashed lines) on geothermal gradient, and (right) the effects of fluid flow penetrating a given detachment fault (blue dashed lines) on geothermal gradient with grey dashed box highlights the region most affected by an extreme thermal gradient (Gottardi et al., 2011; 2013). (c) Measured difference in δ18O of quartz and epidote (Δ18OQtz-Ep) in the footwall to the Whipple detachment fault, and corresponding oxygen isotope temperatures showing a geothermal gradient of 82ºC over 30 m within the uppermost 50 m of footwall of the nearby Whipple detachment fault (Morrison and Anderson, 1998).
30
31
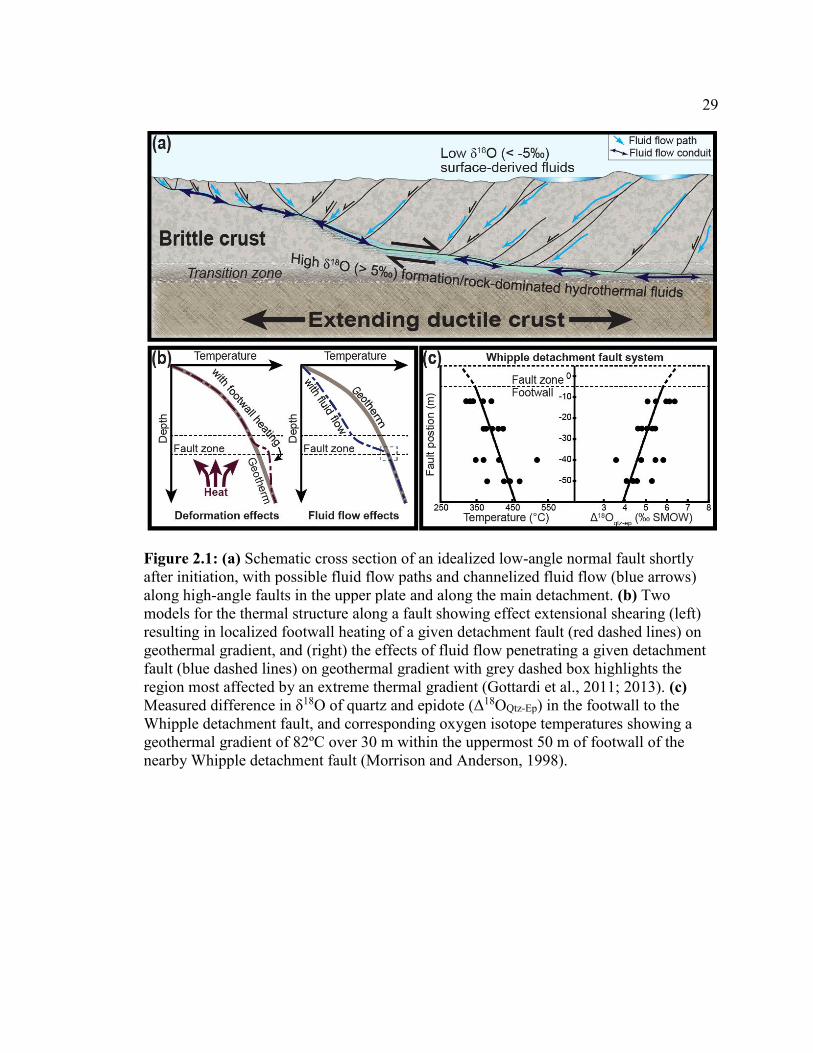
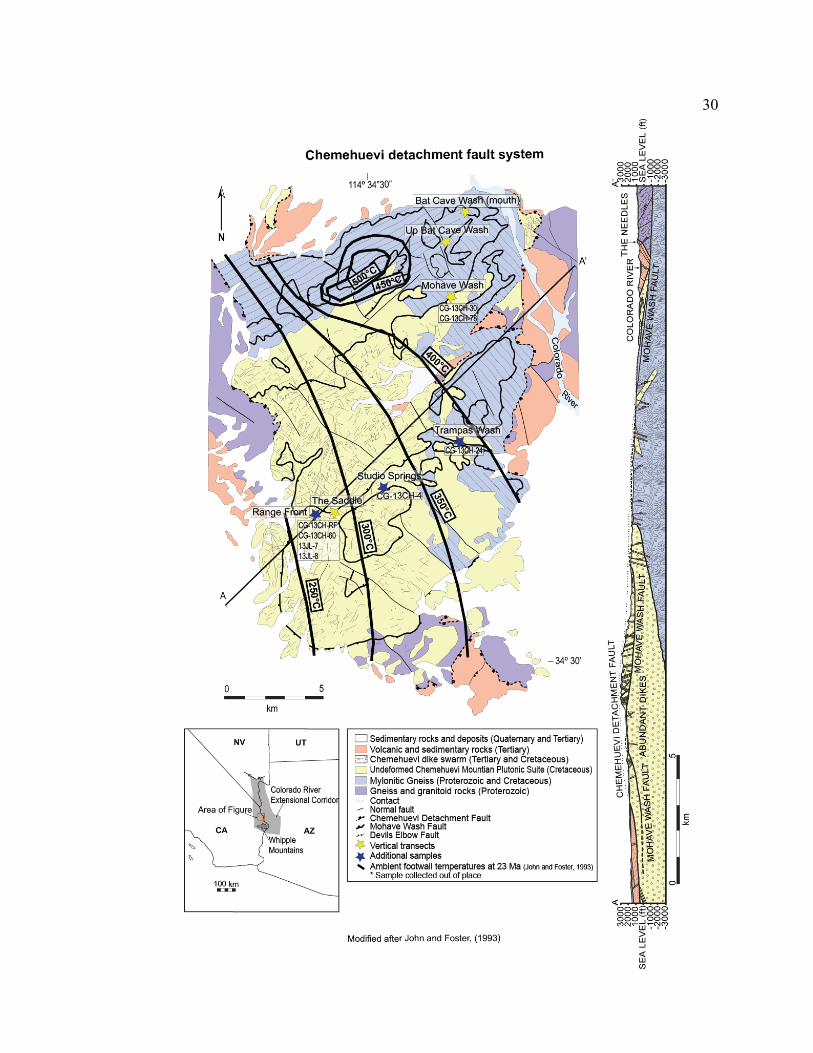
Figure 2.2: Simplified geologic map and cross section of the Chemehuevi Mountains, California (after John and Foster, 1993) showing sample locations for this study. Yellow stars identify locations where vertical transects were made. Notched lines show major faults. Bold lines represent the thermal structure of the footwall at 23 Ma, the inferred timing of initiation (John and Foster, 1993).
32
3. Methods
3.1 Sampling strategy
Fieldwork and sampling for this investigation took place during December 2013
and March 2014. To characterize vertical gradients across the fault using stable isotope
geochemistry, two locations were targeted for sampling along the Mohave Wash fault
(MWF) separated by 17 km in the slip direction. The two sites selected include The
Saddle section, located near the W-SW margin of the exposed footwall (shallower at
initiation), and the Bat Cave Wash located at the far NE (deeper at initiation) portion of
the footwall (Figures 2.2, 3.1, 3.2).
A transect of 10 samples at The Saddle covered ~120 m of continuous vertical
section (Figure 3.1). Two transects of approximately 30 m and which were perpendicular
to the fault were made at the Bat Cave Wash site due to poor MWF footwall exposure.
One site was near the mouth of the wash and another 1.75 km to the SW with 10 total
samples collected from both locations (Figure 3.2). The two sites were surveyed to
increase the vertical distance relative to the fault that was accessible for sampling.
Combined, both Bat Cave Wash transects cover ~61 meters extending from 40 meters
below the main damage zone through the intensely-fractured interval (~10 m thick) of the
MWF.
During Spring of 2013, 113 samples were collected along the MWF at four sites
known as Range Front, Studio Springs, Trampas Wash, and Mohave Wash, spanning ~15
km in the slip direction (Figure 2.2). Many of these samples were originally analyzed by
laser fluorination and reported by MacDonald (2014). Eight of 113 samples were selected
33
for additional secondary ion mass spectrometry (SIMS) analysis and are incorporated in
this study for comparison with vertical transects and to constrain lateral variations in the
fault-slip direction. The rock types sampled include granitoids of the Chemehuevi
Plutonic Suite (Cretaceous), Precambrian gneiss, breccias featuring greenschist facies
mineralization, quartz-epidote cataclasite shear zones containing brittle deformation, and
veins mineralized with epidote and quartz. Table 3.1 summaries the location, sample
type, and structural orientations of all samples incorporated during this study.
3.2 Analytical techniques
Oxygen isotope values were determined in situ in thin section or rock chips by ion
microprobe to characterize fluid rock interactions, heat, and mass transfer during early
slip on the Mohave Wash fault system. Examination of samples using optical
petrography, scanning electron microscopy (SEM), energy dispersive X-ray spectroscopy
(EDS), and electron probe microanalysis (EPMA) was carried out to characterize
microstructures, mineralogy, and geochemistry along the fault zone and to guide ion
microprobe analysis.
3.2.1 Microscopy
In order to characterize microstructures and map minerals for oxygen isotope
measurements, 19 standard thin sections were prepared. Additionally, five rock chips
from representative microstructures were cut, mounted in epoxy, and polished.
Mineralogy was determined, and generations of deformation zone/vein formation were
34
established by cross-cutting relationships. Deformed rock type name was determined
using the following classification modified from Davis et al. (1996):
Breccia: 200–500 μm angular clasts in a finer grained matrix.
Cataclasite: < 200 μm angular clasts in a finer grained matrix.
Ultracataclasite: < 200 μm angular clasts in a glassy matrix.
Mylonite: ductile deformation of feldspar clasts in quartz ribbons.
Thin sections were examined by secondary electron and backscattered electron
(BSE) imaging with the Hitachi S-2460N natural scanning electron microscope in the
Department of Physics and Astronomy at Ohio University to assess texturally complex
areas and characterize mineralogy. EDS confirmed identified minerals. BSE techniques
were used to prepare maps of thin sections and polished rock chips and to identify
adjacent rims on appropriate minerals interpreted to be in textural equilibrium. Sharp
grain boundaries between minerals in distinct textural domains were used as evidence for
textural equilibrium.
3.2.2 Electron probe microanalysis
Once sample mineralogy and deformation textures were documented, samples
were mounted and prepared for in situ geochemical analysis by electron probe
microanalysis (EPMA). Four samples were cut into ~1 cm3 rock chips and mounted in
~2.5 cm diameter epoxy rounds along with an oxygen-isotope standard UWQ-1 (Kelly et
al., 2007) at the center of each round. Thin sections of 17 samples were cut down to ~2.5
cm diameter circular thin sections with UWQ-1 quartz standard mounted in epoxy at the
center of each thin section.
35
Analyses were made using a Cameca SX-100 electron microprobe equipped with
four wavelength-dispersive spectrometers, natural and synthetic silicate standards, and
ZAF (ZAF refers to atomic number, absorption, and fluorescence) correction in the
Department of Earth & Planetary Sciences, University of Tennessee at Knoxville. All
epidote analyses were conducted with a spot size of ~1 μm, 20 kV accelerating voltage,
and 20 nA probe current over a two day analytical session. All K-feldspar analyses were
conducted with a spot size of 5 μm, a 10 kV accelerating voltage, and a 20 nA probe
current over the same two day analytical session. Backscattered electron imaging and
quantitative wavelength dispersive spectrometry (WDS) were conducted for in situ
chemical analysis of epidote (17 samples; 259 points), K-feldspar (2 samples; 4 points),
and plagioclase (6 samples; 74 points). Cation-oxide proportions in epidote were
calculated on the basis of 25 oxygens, and the pistacite composition of epidote, defined
by XFe (molecular iron / iron + aluminum), was found on the basis of 25 oxygen atoms.
Cation-oxide proportions in feldspars were found on the basis of 8 oxygen atoms.
Orthoclase (Or) composition of K-feldspar was determined as K / (K + Na + Ca), and the
anorthite content (An#) of plagioclase was calculated as Ca / Ca + Na.
3.2.3 Ion microprobe analysis
3.2.3.1 Sample preparation
Thin sections of four samples were cut into ~1 cm3 chips and mounted in one ~2.5
cm diameter epoxy round along with an oxygen-isotope standard UWQ-1 (Kelly et al.,
2007) mounted at the center of the round. All epoxy rounds and thin sections were
36
polished using 3 μm diamond suspension to minimize topographic effects that can cause
isotopic fractionation across the analysis area (i.e., Kita et al., 2009). All samples were
cleaned by sonicating in deionized water and ethanol multiple times, and then dried in a
vacuum oven. After drying, a ~30 nm Au coat was applied to each sample mount.
Detailed mineral maps were made prior to analyses based on SEM, EPMA, and optical
microscope imaging to guide spot positioning.
3.2.3.2 SIMS oxygen isotope analysis
Oxygen isotope analyses were made on selected minerals using a CAMECA ims-
1280 ion microprobe at the University of Wisconsin-Madison WiscSIMS Laboratory.
Oxygen isotope analyses of quartz, epidote, and k-feldspar in all prepared samples were
acquired in six consecutive 12-hour analytical sessions with a primary ion beam diameter
of 10–12 μm and depth of ~1 μm. Operating and analytical conditions followed those
described by Kita et al. (2009). Primary ion beam current ranged from 1.7–2.6 nA. The
working standard for all samples was UWQ-1 (12.33‰, Vienna Standard Mean Ocean
Water; VSMOW). The working standard in each sample was measured four times before
and after each 10–12 unknown analyses. The difference between the measured δ18O
values (δ18Oraw) of the quartz standard and the true δ18O defines the instrumental mass
fractionation (IMF) for each bracket, which was then used to correct δ18Oraw of the
unknowns to their true δ18O (VSMOW). The IMF is known to vary systematically with
composition in minerals that show solid solution, known as the ‘matrix effect’, and so an
additional correction was applied to δ18Oraw of epidote and K-feldspar using an in-house
37
calibration curve defined by analyzing compositionally-variable standards. Standards
used for matrix effects corrections were Tz-1 (epidote), Tz-3 (epidote), Corse1 (epidote),
CD23 (epidote), B28 (epidote), C30 (epidote), MES-4 (K-feldspar; Pollington, 2013),
FCS (K-feldspar; Pollington, 2013), and Gem28 (K-feldspar; Pollington, 2013).
Coexisting quartz, epidote, and K-feldspar were targeted for oxygen isotope thermometry
at spots within 6 mm of the center of the sample to avoid spatial variations in the IMF
(i.e., Kita et al., 2009).
3.2.3.3 Post-SIMS imaging
Following ion microprobe analysis, an additional thin coating of Au was applied
to each sample to minimize electron-charging effects in analysis pits. Every analysis pit
was then examined by secondary electron and BSE imaging with the Hitachi S3400N
SEM in the Department of Geoscience at the University of Wisconsin to assess pit
location, verify the mineral analyzed, and inspect for any cracks or other irregular pit
features (Figure 3.3). Energy-dispersive spectrometry was used to analyze pits placed in
extremely fine-grained and texturally-complex areas to verify mineral composition. A
total of 85 pits were observed to overlap grain boundaries or cracks, in which case they
were excluded from the following results and discussion.
3.3 Oxygen-isotope thermometry
Temperatures can be calculated provided that (1) experimentally-determined
values for the temperature-dependent oxygen isotope fractionation have been measured
38
and, (2) minerals have reached oxygen isotope equilibrium without retrograde change to
that composition. The latter constraint is often difficult to exclude in natural systems, and
variations in mineral δ18O have been shown to be common over small areas (~1 cm2) in
thin sections from low-grade metamorphic rocks (up to 7.4‰ in silicates; Ferry et al.,
2014). Various stable isotope studies of detachment zones have concentrated on the
oxygen isotope values from quartz-feldspar (e.g., Fricke et al., 1992; Morrison, 1994;
Holk and Taylor, 2000), quartz-muscovite (e.g., Mulch et al., 2007; Gottardi et al., 2011),
and quartz-epidote (e.g., Morrison and Anderson, 1998; MacDonald, 2014). These
studies find systematic variations in Δ18O(m-n) = δ18O(m) - δ18O(n) (i.e., the thermal
gradient) between two minerals phases m and n across the damage zone of a given
detachment fault using laser fluorination measurements from whole rock and mineral
separates. Determining that two mineral phases are in isotopic equilibrium at the scale
required from laser fluorination is improbable and thus analysis by SIMS is appropriate
for useful oxygen-isotope thermometry.
Temperature calculations come from measuring the difference in δ18O of two or
more isotopically equilibrated mineral phases (Δ18O(m-n)) and a temperature-dependent
experimentally determined fractionation factor (α) between two isotopically equilibrated
minerals. The temperature-dependent oxygen isotope fractionation between two minerals
phases m and n is expressed as:
1000𝑙𝑛α𝑛𝑚 =
𝐴×106
𝑇2 + 𝐵 + C
where A, B, and C are experimental determined constants and T is temperature in Kelvin
(O’Neil et al., 1969). Temperature calculations between quartz and epidote in the study
39
used constants calibrated experimentally by Matthews (1994) of A = 2.180, B = 0.000,
and C = 0.000 for epidote having a composition of XFe = 24 for the temperature range of
0 – 1200°C. Temperature calculations between quartz and K-feldspar in the study used
constants calibrated experimentally by Zheng (1993) of A = 0.16 and B = 1.50, and C = -
0.62 for the temperature range of 0 – 1200°C.
40
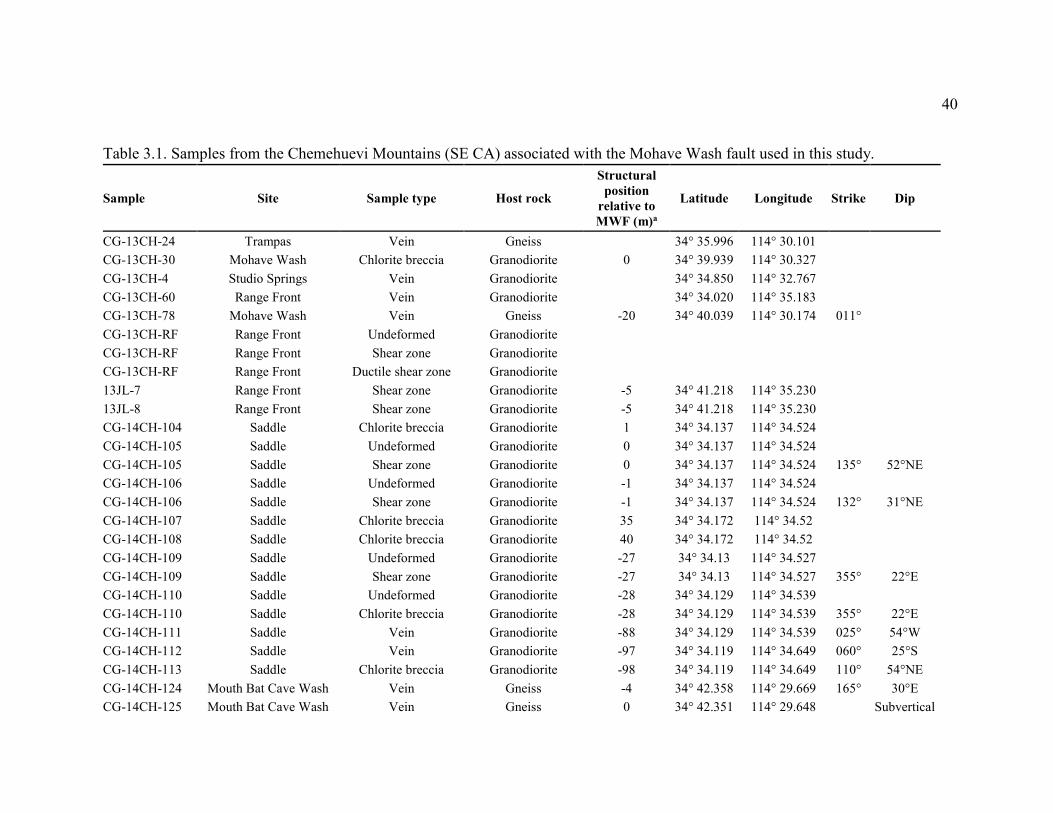
Table 3.1. Samples from the Chemehuevi Mountains (SE CA) associated with the Mohave Wash fault used in this study.
Sample Site Sample type Host rock
Structural position
relative to MWF (m)a
Latitude Longitude Strike Dip
CG-13CH-24 Trampas Vein Gneiss
34° 35.996 114° 30.101
CG-13CH-30 Mohave Wash Chlorite breccia Granodiorite 0 34° 39.939 114° 30.327
CG-13CH-4 Studio Springs Vein Granodiorite
34° 34.850 114° 32.767
CG-13CH-60 Range Front Vein Granodiorite
34° 34.020 114° 35.183
CG-13CH-78 Mohave Wash Vein Gneiss -20 34° 40.039 114° 30.174 011°
CG-13CH-RF Range Front Undeformed Granodiorite
CG-13CH-RF Range Front Shear zone Granodiorite
CG-13CH-RF Range Front Ductile shear zone Granodiorite
13JL-7 Range Front Shear zone Granodiorite -5 34° 41.218 114° 35.230
13JL-8 Range Front Shear zone Granodiorite -5 34° 41.218 114° 35.230
CG-14CH-104 Saddle Chlorite breccia Granodiorite 1 34° 34.137 114° 34.524
CG-14CH-105 Saddle Undeformed Granodiorite 0 34° 34.137 114° 34.524
CG-14CH-105 Saddle Shear zone Granodiorite 0 34° 34.137 114° 34.524 135° 52°NE CG-14CH-106 Saddle Undeformed Granodiorite -1 34° 34.137 114° 34.524
CG-14CH-106 Saddle Shear zone Granodiorite -1 34° 34.137 114° 34.524 132° 31°NE CG-14CH-107 Saddle Chlorite breccia Granodiorite 35 34° 34.172 114° 34.52
CG-14CH-108 Saddle Chlorite breccia Granodiorite 40 34° 34.172 114° 34.52
CG-14CH-109 Saddle Undeformed Granodiorite -27 34° 34.13 114° 34.527
CG-14CH-109 Saddle Shear zone Granodiorite -27 34° 34.13 114° 34.527 355° 22°E CG-14CH-110 Saddle Undeformed Granodiorite -28 34° 34.129 114° 34.539
CG-14CH-110 Saddle Chlorite breccia Granodiorite -28 34° 34.129 114° 34.539 355° 22°E CG-14CH-111 Saddle Vein Granodiorite -88 34° 34.129 114° 34.539 025° 54°W CG-14CH-112 Saddle Vein Granodiorite -97 34° 34.119 114° 34.649 060° 25°S CG-14CH-113 Saddle Chlorite breccia Granodiorite -98 34° 34.119 114° 34.649 110° 54°NE CG-14CH-124 Mouth Bat Cave Wash Vein Gneiss -4 34° 42.358 114° 29.669 165° 30°E CG-14CH-125 Mouth Bat Cave Wash Vein Gneiss 0 34° 42.351 114° 29.648
Subvertical
41
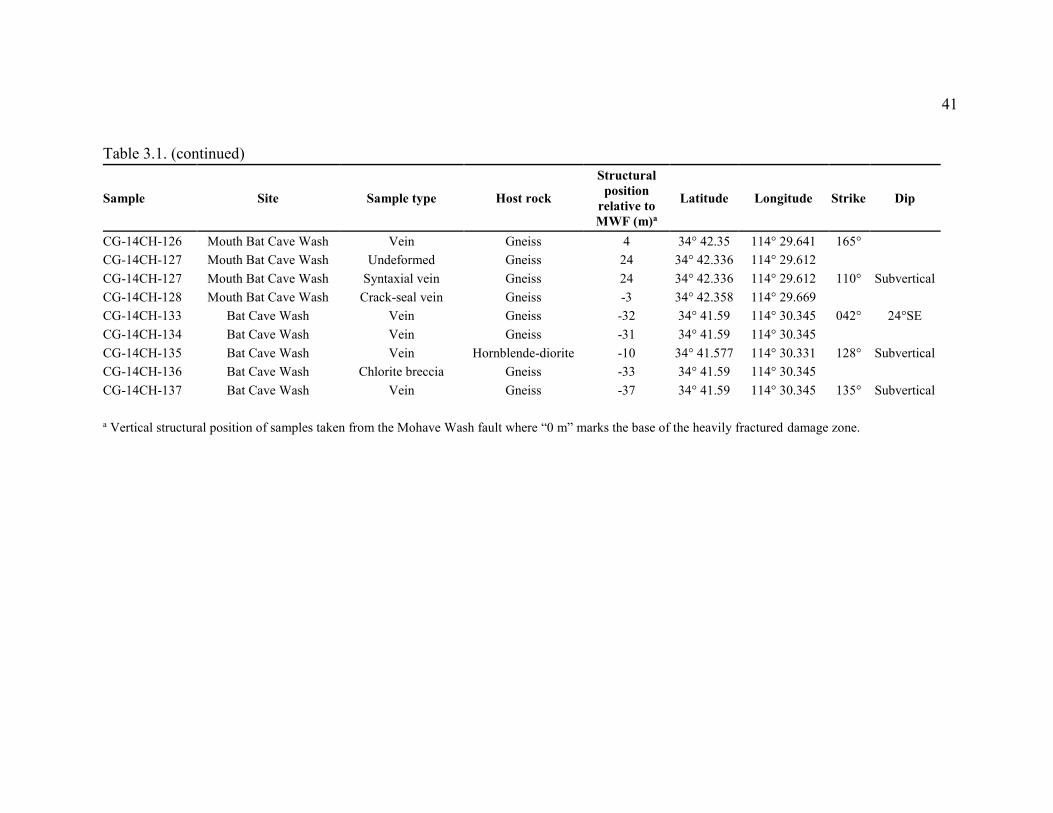
Table 3.1. (continued)
Sample Site Sample type Host rock
Structural position
relative to MWF (m)a
Latitude Longitude Strike Dip
CG-14CH-126 Mouth Bat Cave Wash Vein Gneiss 4 34° 42.35 114° 29.641 165°
CG-14CH-127 Mouth Bat Cave Wash Undeformed Gneiss 24 34° 42.336 114° 29.612
CG-14CH-127 Mouth Bat Cave Wash Syntaxial vein Gneiss 24 34° 42.336 114° 29.612 110° Subvertical CG-14CH-128 Mouth Bat Cave Wash Crack-seal vein Gneiss -3 34° 42.358 114° 29.669
CG-14CH-133 Bat Cave Wash Vein Gneiss -32 34° 41.59 114° 30.345 042° 24°SE CG-14CH-134 Bat Cave Wash Vein Gneiss -31 34° 41.59 114° 30.345
CG-14CH-135 Bat Cave Wash Vein Hornblende-diorite -10 34° 41.577 114° 30.331 128° Subvertical CG-14CH-136 Bat Cave Wash Chlorite breccia Gneiss -33 34° 41.59 114° 30.345
CG-14CH-137 Bat Cave Wash Vein Gneiss -37 34° 41.59 114° 30.345 135° Subvertical
a Vertical structural position of samples taken from the Mohave Wash fault where “0 m” marks the base of the heavily fractured damage zone.
42
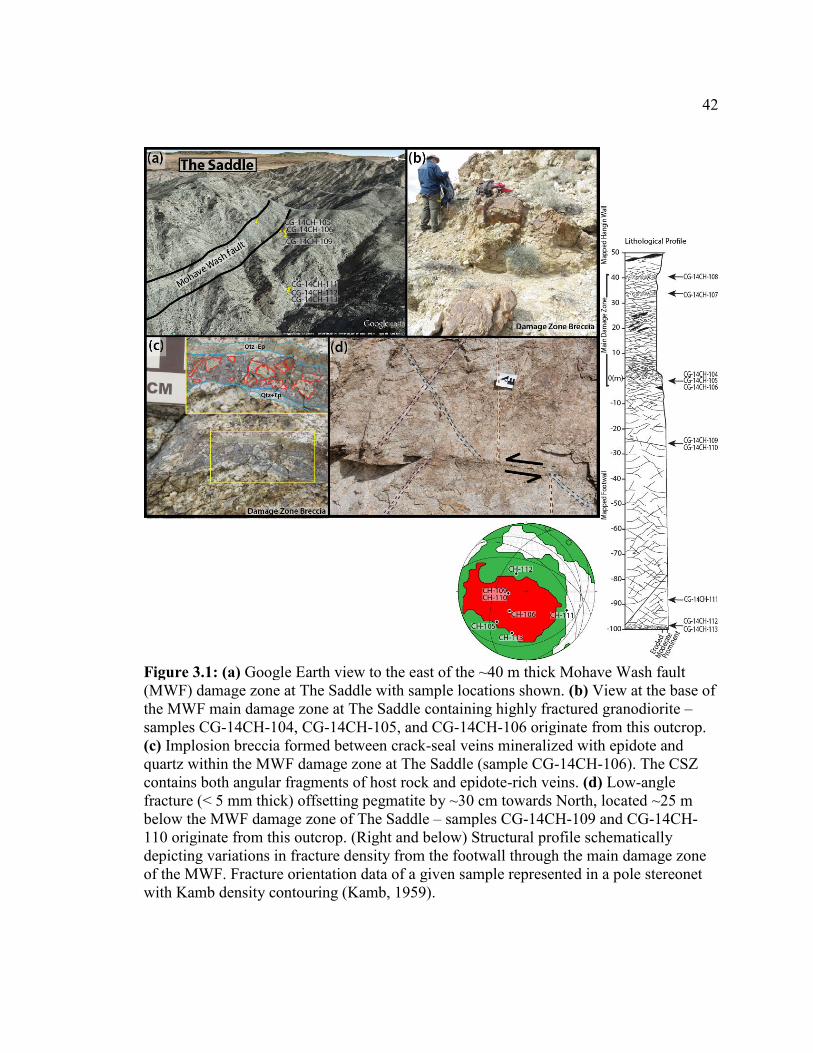
Figure 3.1: (a) Google Earth view to the east of the ~40 m thick Mohave Wash fault (MWF) damage zone at The Saddle with sample locations shown. (b) View at the base of the MWF main damage zone at The Saddle containing highly fractured granodiorite – samples CG-14CH-104, CG-14CH-105, and CG-14CH-106 originate from this outcrop. (c) Implosion breccia formed between crack-seal veins mineralized with epidote and quartz within the MWF damage zone at The Saddle (sample CG-14CH-106). The CSZ contains both angular fragments of host rock and epidote-rich veins. (d) Low-angle fracture (< 5 mm thick) offsetting pegmatite by ~30 cm towards North, located ~25 m below the MWF damage zone of The Saddle – samples CG-14CH-109 and CG-14CH-110 originate from this outcrop. (Right and below) Structural profile schematically depicting variations in fracture density from the footwall through the main damage zone of the MWF. Fracture orientation data of a given sample represented in a pole stereonet with Kamb density contouring (Kamb, 1959).
43
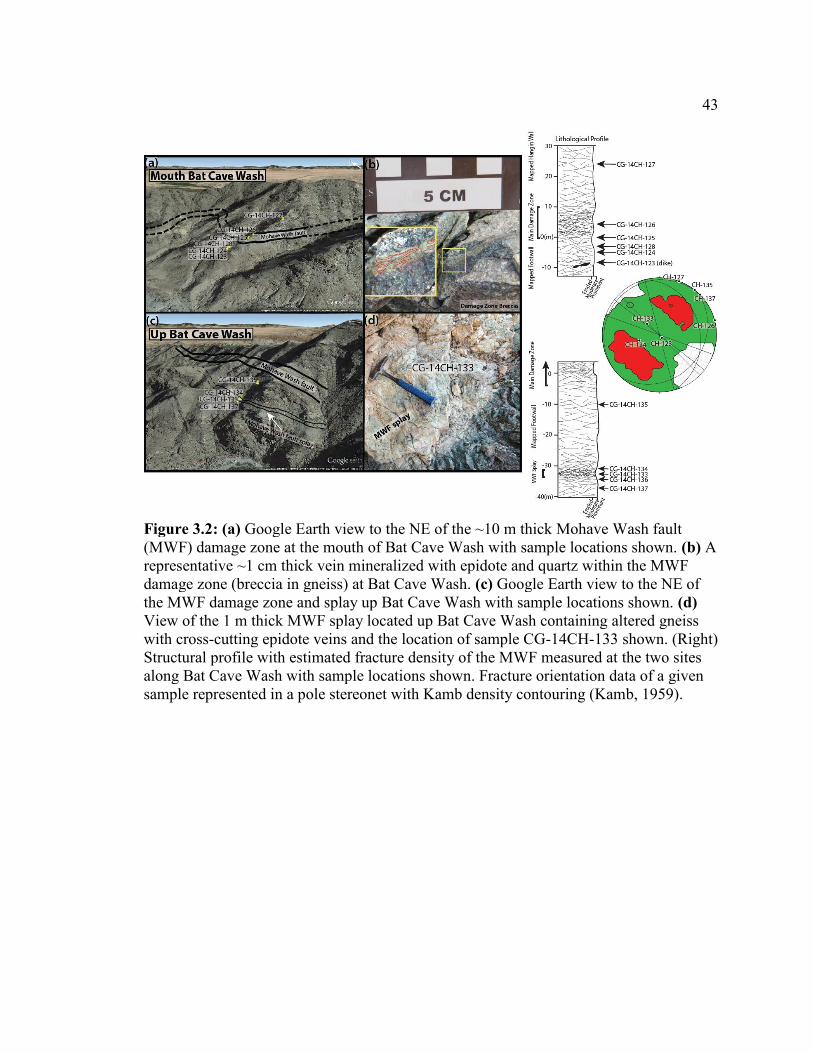
Figure 3.2: (a) Google Earth view to the NE of the ~10 m thick Mohave Wash fault (MWF) damage zone at the mouth of Bat Cave Wash with sample locations shown. (b) A representative ~1 cm thick vein mineralized with epidote and quartz within the MWF damage zone (breccia in gneiss) at Bat Cave Wash. (c) Google Earth view to the NE of the MWF damage zone and splay up Bat Cave Wash with sample locations shown. (d) View of the 1 m thick MWF splay located up Bat Cave Wash containing altered gneiss with cross-cutting epidote veins and the location of sample CG-14CH-133 shown. (Right) Structural profile with estimated fracture density of the MWF measured at the two sites along Bat Cave Wash with sample locations shown. Fracture orientation data of a given sample represented in a pole stereonet with Kamb density contouring (Kamb, 1959).
44
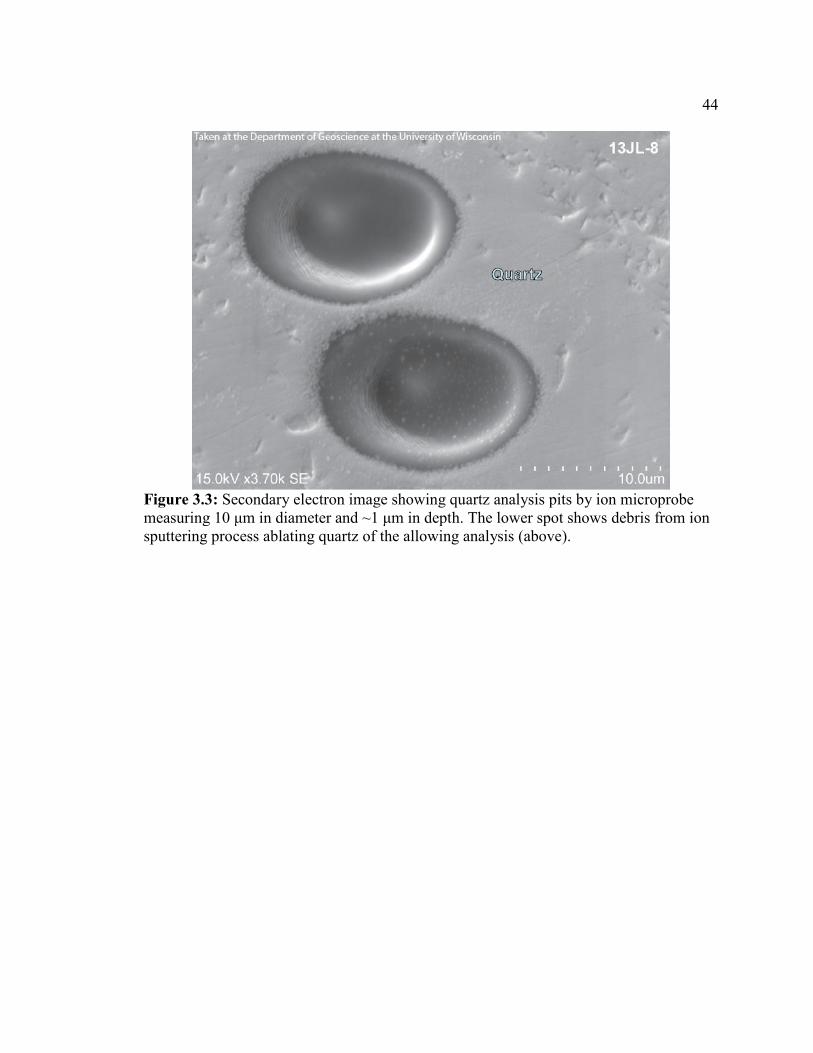
Figure 3.3: Secondary electron image showing quartz analysis pits by ion microprobe measuring 10 μm in diameter and ~1 μm in depth. The lower spot shows debris from ion sputtering process ablating quartz of the allowing analysis (above).
45
4. Results
4.1. The Saddle Section: Generalized outcrop and sample description
The country rock in this section was primarily granodiorite intruded by minor
mafic dikes. The Mohave Wash fault (MWF) was recognized by a variable damage zone
up to 40 m in thickness consisting of cracked granodiorite, chlorite breccia, and cohesive
cataclasite. Figure 3.1 shows the 138 m vertical transect sampled from the base of the
most intensely fractured zone.
Chlorite breccia (CG-14CH-108, CG-14CH-107) makes up the top 10 meters of
The Saddle vertical transect with only very minor cataclasis found in localized 0.5–2 mm
thick shear zones (CG-14CH-109, CG-14CH-110, CG-14CH-113) in the lower 70
meters. Samples CG-14CH-104, CG-14CH-105, and CG-14CH-106 were taken from the
main deformation zone (0 m on fault column). Sample CG-14CH-104 was taken from a
representative chlorite breccia of the MWF damage zone containing thin (< 1 mm)
cataclasite shear zones. Sample CG-14CH-105 features a 1 cm thick shear zone
containing crack-seal veins striking 135° and dipping 52°NE. Sample CG-14CH-106
features a 2.5 cm thick cataclasite shear zone containing crack-seal veins striking 132°
and dipping 31°NE. Samples CG-14CH-109 and CG-14CH-110 were taken from slightly
altered-deformed host granodiorite at -27 m on the fault column featuring 1 cm thick
cataclasite shear zones striking 355° and dipping 22°E. Sample CG-14CH-111 was taken
at -88 m on the fault column and features a ~2 cm thick quartz + epidote vein in
undeformed granodiorite striking 025° and dipping 54°W. Sample CG-14CH-112 was
taken at -97 m on the fault column and features a ~1 cm thick cracked zone in
46
undeformed granodiorite containing quartz + epidote veins striking 060° and dipping
25°S. Sample CG-14CH-113 was taken at -98 m on the fault column from a 1–2 meter
thick isolated chlorite breccia containing thin (~1 mm) cataclasite zones striking 110° and
dipping 54°NE.
4.1.1 The Saddle Section: Petrographic and Microstructural description
The mineralogy and microstructural character of the footwall and MWF damage
zone at The Saddle section is based on 10 thin sections sampled within and below the 40
m thick MWF damage zone. Throughout the interval, primary igneous minerals in the
host granodiorite include quartz, k-feldspar, plagioclase, muscovite, and biotite. The
grains are typically 0.25–2 mm in diameter. The quartz shows weak undulatory
extinction, whereas the feldspars are undeformed. Plagioclase shows signs of incipient
alteration to fine-grained phyllosilicate. Biotite is altered to chlorite at grain boundaries.
In addition to clasts of the primary minerals, shear zones contain greenschist facies
mineral assemblages of chlorite + minor epidote +/- calcite. Quartz microstructures
within shear zones include microfractures and undulose extinction, but no evidence for
subgrain formation. Average grain size within shear zones is visually estimated to be <
0.5 mm, and bands up to 1 cm thick of fine-grained (< 10 μm) K-feldspar + quartz +
epidote are observed in some samples (CG-14CH-105, CG-14CH-106, CG-14CH-109;
Figure 4.2).
Samples CG-14CH-108, CG-14CH-107, and CG-14CH-104 feature thin
cataclasite zones within chlorite breccia ranging 100–500 μm in thickness of fine-grained
(< 10 μm) quartz, K-feldspar, albite, and epidote. Samples CG-14CH-107 and CG-14CH-
47
104 also contain thin calcite-rich veins (0.25–0.5 mm thick) cross-cutting the brecciated
granodiorite. Samples CG-14CH-108, CG-14CH-107, and CG-14CH-104 were not
targeted for δ18O analysis due to the fine grain size (< 10 μm). The crack-seal veins found
at the margins of samples CG-14CH-105, CG-14CH-106, and CG-14CH-109 are also
found within the feldspar-rich shear zone as broken angular fragments and are evidence
of formation during slip along the MWF (Figures 4.1, 4.2). Sample CG-14CH-105 shows
a 1 cm thick crack-seal vein containing broken fragments (0.5–1 cm long segments) of
fine-grained (< 10 μm) quartz, K-feldspar, and albite cemented within a matrix of the
same composition having an average grain size of ~100 μm (Figure 4.2). Epidote found
within the shear zone sample CG-14CH-105 has an average grain size of ~5 μm. Sample
CG-14CH-106 features a 2.5 cm thick cataclasite shear zone of angular host granodiorite
fragments 1 mm to 1 cm in size cemented within a matrix of albite, K-feldspar, and
quartz grains 100–500 μm in size surrounded by 2 mm thick localized crack-seal veins of
fine-grained (10 μm) quartz and epidote (Figures 4.1, 4.2). SamplesCG-14CH-109 and
CG-14CH-110 feature a similar mineralogy between the host rock and shear zone of each
respective sample, consisting of fine-grained (< 10 μm) K-feldspar-albite and quartz
matrix with minor calcite and epidote (Figure 4.2). Samples CG-14CH-111 and CG-
14CH-112 contain a 0.1–2 mm thick vein infill by undeformed quartz and epidote.
Sample CG-14CH-113 contains multiple cataclasite zones within chlorite breccia ranging
0.25–1 mm in thickness of fine-grained (< 10 μm) quartz, K-feldspar, and epidote.
48
4.2 The Bat Cave Wash Section: Generalized outcrop and sample description
The country rock in this section was quartz-biotite gneiss with a prominent
foliation containing upper greenschist- to lower amphibolite-facies mineralogy and quartz
leucosomes. Greenschist facies shear zones related to Miocene deformation typically cut
the gneissic fabric, although slip along folia is also likely based on field observations.
Syntectonic dikes of felsic to mafic composition are commonly found within gneiss, and
mineral lineations at 050° were measured on several examples. The MWF was
recognized by a damage zone ~10 m in thickness and is represented by cracked gneiss,
chlorite breccia, and cohesive cataclasite. Mineralized fractures cutting gneiss below and
within the zone mapped as the MWF (John and Foster, 1993) were sampled. Due to poor
MWF footwall exposure, the section for Bat Cave Wash is a composite of two localities
separated by 1.75 km. The second transect was sampled deeper in the footwall and
crossed a sharp fault with evidence for substantial greenschist facies mineralization and
fluid flow (Figure 3.3). The sharp fault is interpreted as a deeper splay off the main
MWF, although no crosscutting relations were observed and the exact structural relations
are not clear. Figures 3.2 and 3.3 each show ~30 m vertical transects from the base of the
most intensely fractured zone.
Sample CG-14CH-127 is a 1 cm epidote-rich vein taken 24 m above the base of
the MWF. Sample CG-14CH-126 taken from the MWF damage zone (4 m on fault
column) contains cross-cutting veins striking 110° and with a subvertical dip. Sample
CG-14CH-125 was taken from a chlorite breccia zone containing cross-cutting veins at
the bottom of the MWF damage zone (0 m on fault column) with a subvertical dip.
Sample CG-14CH-128 features a ~1 cm thick zone of quartz + epidote veins taken 3 m

49
beneath the base of the MWF damage zone. Sample CG-14CH-124 features interspersed
quartz + epidote veins taken 1 m below CG-14CH-128 striking 165° and dipping 30°E (-
4 on fault column). Sample CG-14CH-135 was taken 22 m above the splay (~10 m below
the MWF) and features 5 mm thick quartz + epidote vein striking 128° and with a
subvertical dip. The host rock for sample CG-14CH-135 is a hornblende-biotite diorite
dike and is the only undeformed host rock found in the Bat Cave Wash section. Sample
CG-14CH-134 was taken < 0.5 m above the splay and features a quartz + epidote shear
zone. Sample CG-14CH-133 is from the middle of the 1 m thick MWF splay (~32 m
below the MWF) containing a quartz + epidote shear zone striking 042° and dipping
24°SE and many subvertical cross-cutting veins. Sample CG-14CH-136 was taken 1 m
below the splay. Sample CG-14CH-137, featuring epidote-rich veins striking 135° and
with a subvertical dip, was taken 5 m below the splay (~37 m below the MWF).
4.2.1 The Bat Cave Wash Section: Petrographic and Microstructural description
The mineralogy and microstructural character of the footwall and MWF damage
zone at Bat Cave Wash section is based on nine thin sections. Throughout the interval,
primary igneous minerals in the host quartz-biotite gneiss were dominated by quartz,
plagioclase, and biotite. Primary igneous minerals in the undeformed hornblende-biotite
diorite dike include plagioclase, hornblende, and biotite. The grains are typically 0.1–1
mm in diameter. The quartz grains have undulatory extinction. Biotite has been altered to
chlorite within and surrounding the MWF damage zone. Cross-cutting veins sampled
throughout the transect exhibit greenschist facies mineral assemblages of chlorite +
epidote + calcite + titanite. Surrounding cross-veins, gneissic foliation containing primary
50
biotite and plagioclase is typically heavily altered to fine-grained (< 10–100 μm) epidote
(Ep) and chlorite intergrowth among quartz (Qtz) ribbons (CG-14CH-126, CG-14CH-
134, CG-14CH-133). Thin calcite veins occasionally are observed cutting veins (CG-
14CH-135; Figure 4.6).
Sample CG-14CH-127 contains a syntaxial vein of coarse undeformed
(subhedral) quartz and epidote grains (~300 μm) cemented by calcite and bounded by 0.5
mm thick zones of fine-grained quartz and epidote (< 50 μm) cutting gneissic fabric.
Sample CG-14CH-126 features fine-grained (< 10–100 μm) epidote and chlorite
intergrowth among quartz ribbons containing subgrains parallel to the gneissic fabric as
well as a cross-cutting epidote vein containing quartz showing undulatory extinction
(Figure 4.3). Sample CG-14CH-125 features fine-grained (50 μm) quartz + epidote veins
cross-cutting gneissic fabric. Sample CG-14CH-128 features a 1 cm thick zone of quartz
+ epidote crack-seal veins showing sharp contacts (up to 1 mm in thickness) of reduction
in grain size with quartz-epidote grain sizes decreasing from 100 μm to 10 μm (Figure
4.4). Sample CG-14CH-124 features interspersed veins of epidote + quartz 0.5–3 mm
thick cutting gneissic fabric (Figure 4.5). Sample CG-14CH-135 features a 5 mm thick
zone of quartz, epidote, and calcite veins cutting undeformed host (Figure 4.6). Samples
CG-14CH-134 and CG-14CH-133 show abundant epidote intergrowth (10–200 μm in
size) among quartz ribbons (50–1000 μm in size) containing subgrains parallel to the
gneissic fabric with minor K-feldspar, Ca-plagioclase, and titanite. Sample CG-14CH-
133 contains undeformed cross-cutting veins of quartz and epidote with a grain size of
10–100 μm (Figure 3.1). Sample CG-14CH-136 features zones of chlorite and epidote
marked by a brecciated contact without identifiable gneissic fabric. Sample CG-14CH-
51
137 features a gneissic fabric containing chlorite as well as undeformed cross-cutting
quartz + epidote veins with a grain size of 20–100 μm cutting gneissic fabric (Figure 3.1).
All samples from the MWF damage zone located in Bat Cave Wash show well-defined
cross-cutting veins.
4.3 Vertical transect summary
Throughout both vertical transects sampled, the MWF was observed to consist of
zones < 1 m thick in which principle slip surfaces are concentrated as friable chlorite
breccia and cataclasite. The MWF damage zone was observed to be ~40 m thick at the
structurally-shallow levels of The Saddle cutting granodiorite (Figure 3.1). The fault
damage zone becomes thinner (~10 m) at Bat Cave Wash to the northeast, where it cuts
across gneissic banding within Proterozoic gneiss, and is defined again by fractured rock
with vein-fill and a zone of chlorite breccia and thin cataclasite shear bands (Figures 3.2,
3.3). Hydrothermal mineralization (especially epidote, chlorite) is observed within the
MWF damage zone at both The Saddle and Bat Cave Wash. Table 4.1 summarizes the
mineralogy and deformation of all analyzed samples.
Quartz in each of The Saddle samples commonly contains micro-fractures and
exhibits undulose extinction. Epidote was observed in seven of the ten Saddle samples
with a grain size of ~5–25 μm. Quartz, K-feldspar and albite, rather than quartz and
epidote, were the principle minerals precipitated within the most intensely fractured
section of the damage zone (0 m). Quartz-epidote mineralization was limited to veins and
shear zone margins at The Saddle. Quartz in Bat Cave Wash samples commonly feature
52
micro-fractures and subgrains in addition to exhibiting undulose extinction. Epidote was
observed in all of the Bat Cave Wash samples with a grain size of ~5–300 μm. Quartz
and epidote were found to be the principle secondary minerals precipitated, commonly
present in veins and along grain boundaries especially within the most intensely fractured
section of the MWF damage zone and splay in Bat Cave Wash.
Samples analyzed from The Saddle show structural evidence of multiple
generations of brittle deformation through cm-thick cataclasite shear zones and more
discrete, single events in the case of crack-seal veins. Samples analyzed from Bat Cave
Wash are more structurally complex relative to samples from The Saddle due to
interspersed veins and a strong preexisting fabric. Another major difference at Bat Cave
Wash is the presence of numerous plastically-deformed, 2–3 meter-wide dikes intruding
at the level of the mapped fault, and with lineations aligned with the documented regional
slip direction along the MWF of 050°, intruding in the footwall as well as into the fault
zone (Figure 3.2).
4.4 Additional samples
To further characterize the shallow portion of the WMF, samples CG-13CH-60,
CG-13CH-RF, 13JL-7, and 13JL-8 were incorporated in this study. These samples
originate from exposures of the MWF 1.25 km west of The Saddle (Figure 2.2). Sample
CG-13CH-60 is granodiorite containing a 5 mm vein of undeformed quartz and epidote
with a grain size of 50–100 μm as well as a second cross-cutting epidote vein ~1 mm
thick with undeformed quartz and epidote grains < 50 μm in size. Sample CG-13CH-RF
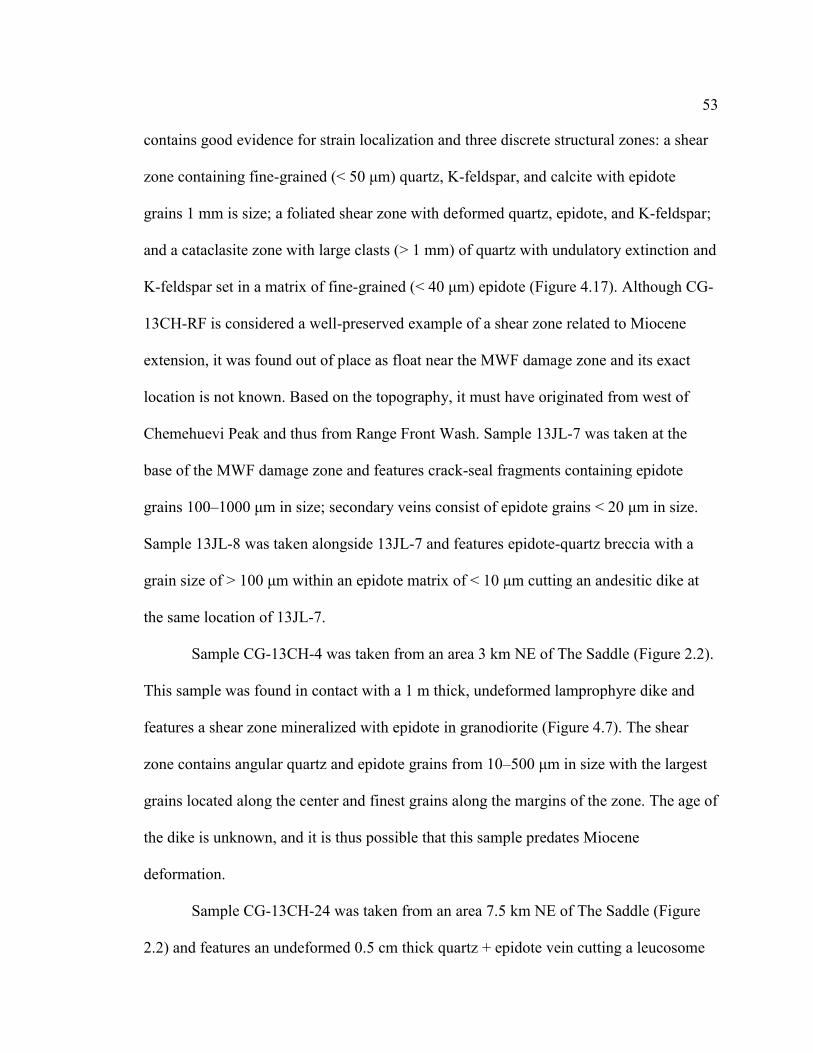
53
contains good evidence for strain localization and three discrete structural zones: a shear
zone containing fine-grained (< 50 μm) quartz, K-feldspar, and calcite with epidote
grains 1 mm is size; a foliated shear zone with deformed quartz, epidote, and K-feldspar;
and a cataclasite zone with large clasts (> 1 mm) of quartz with undulatory extinction and
K-feldspar set in a matrix of fine-grained (< 40 μm) epidote (Figure 4.17). Although CG-
13CH-RF is considered a well-preserved example of a shear zone related to Miocene
extension, it was found out of place as float near the MWF damage zone and its exact
location is not known. Based on the topography, it must have originated from west of
Chemehuevi Peak and thus from Range Front Wash. Sample 13JL-7 was taken at the
base of the MWF damage zone and features crack-seal fragments containing epidote
grains 100–1000 μm in size; secondary veins consist of epidote grains < 20 μm in size.
Sample 13JL-8 was taken alongside 13JL-7 and features epidote-quartz breccia with a
grain size of > 100 μm within an epidote matrix of < 10 μm cutting an andesitic dike at
the same location of 13JL-7.
Sample CG-13CH-4 was taken from an area 3 km NE of The Saddle (Figure 2.2).
This sample was found in contact with a 1 m thick, undeformed lamprophyre dike and
features a shear zone mineralized with epidote in granodiorite (Figure 4.7). The shear
zone contains angular quartz and epidote grains from 10–500 μm in size with the largest
grains located along the center and finest grains along the margins of the zone. The age of
the dike is unknown, and it is thus possible that this sample predates Miocene
deformation.
Sample CG-13CH-24 was taken from an area 7.5 km NE of The Saddle (Figure
2.2) and features an undeformed 0.5 cm thick quartz + epidote vein cutting a leucosome
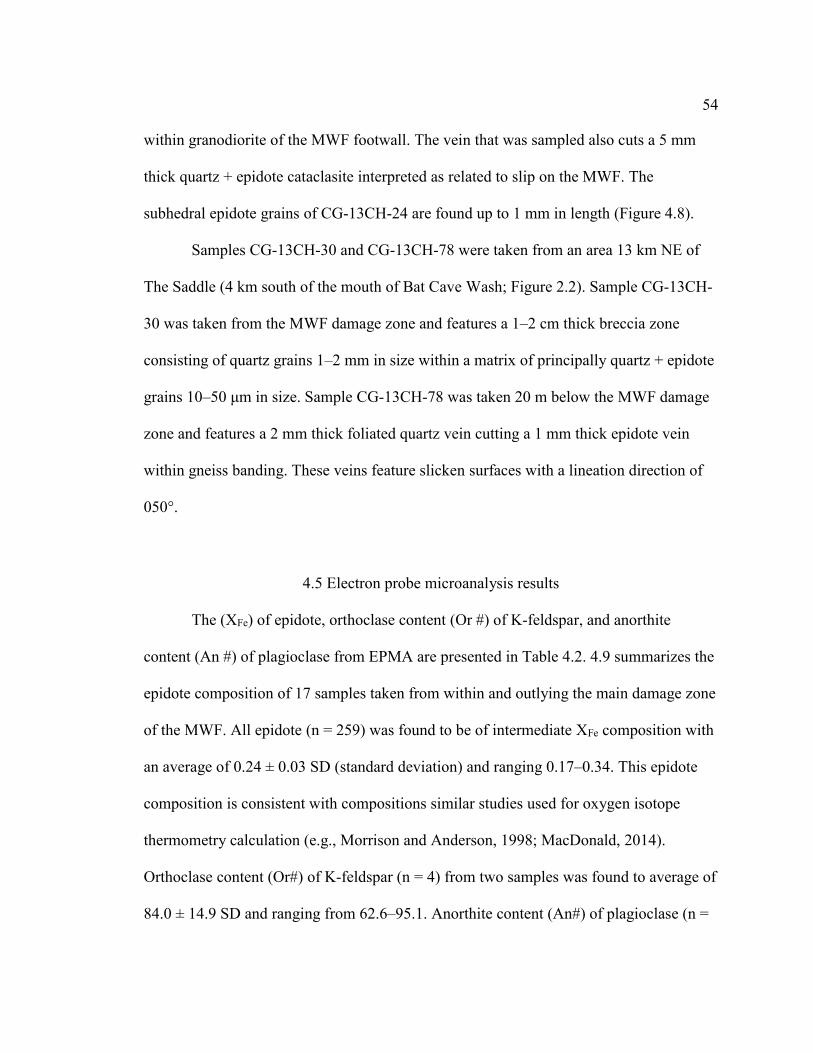
54
within granodiorite of the MWF footwall. The vein that was sampled also cuts a 5 mm
thick quartz + epidote cataclasite interpreted as related to slip on the MWF. The
subhedral epidote grains of CG-13CH-24 are found up to 1 mm in length (Figure 4.8).
Samples CG-13CH-30 and CG-13CH-78 were taken from an area 13 km NE of
The Saddle (4 km south of the mouth of Bat Cave Wash; Figure 2.2). Sample CG-13CH-
30 was taken from the MWF damage zone and features a 1–2 cm thick breccia zone
consisting of quartz grains 1–2 mm in size within a matrix of principally quartz + epidote
grains 10–50 μm in size. Sample CG-13CH-78 was taken 20 m below the MWF damage
zone and features a 2 mm thick foliated quartz vein cutting a 1 mm thick epidote vein
within gneiss banding. These veins feature slicken surfaces with a lineation direction of
050°.
4.5 Electron probe microanalysis results
The (XFe) of epidote, orthoclase content (Or #) of K-feldspar, and anorthite
content (An #) of plagioclase from EPMA are presented in Table 4.2. 4.9 summarizes the
epidote composition of 17 samples taken from within and outlying the main damage zone
of the MWF. All epidote (n = 259) was found to be of intermediate XFe composition with
an average of 0.24 ± 0.03 SD (standard deviation) and ranging 0.17–0.34. This epidote
composition is consistent with compositions similar studies used for oxygen isotope
thermometry calculation (e.g., Morrison and Anderson, 1998; MacDonald, 2014).
Orthoclase content (Or#) of K-feldspar (n = 4) from two samples was found to average of
84.0 ± 14.9 SD and ranging from 62.6–95.1. Anorthite content (An#) of plagioclase (n =
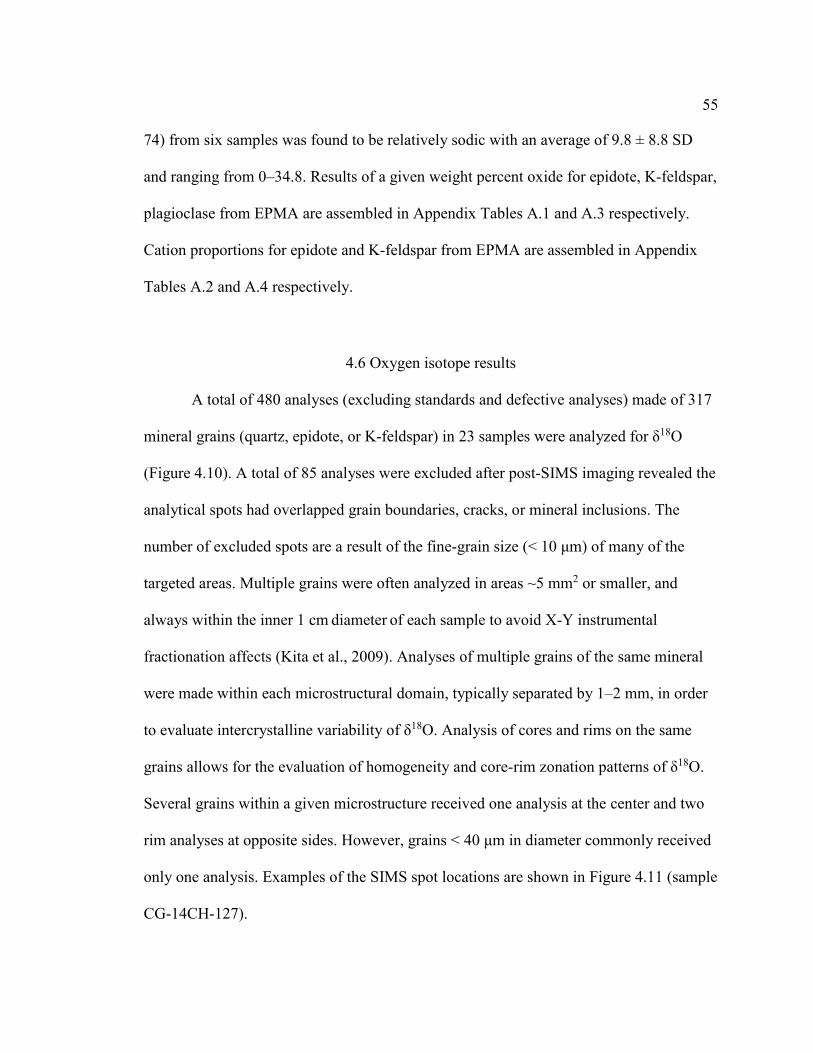
55
74) from six samples was found to be relatively sodic with an average of 9.8 ± 8.8 SD
and ranging from 0–34.8. Results of a given weight percent oxide for epidote, K-feldspar,
plagioclase from EPMA are assembled in Appendix Tables A.1 and A.3 respectively.
Cation proportions for epidote and K-feldspar from EPMA are assembled in Appendix
Tables A.2 and A.4 respectively.
4.6 Oxygen isotope results
A total of 480 analyses (excluding standards and defective analyses) made of 317
mineral grains (quartz, epidote, or K-feldspar) in 23 samples were analyzed for δ18O
(Figure 4.10). A total of 85 analyses were excluded after post-SIMS imaging revealed the
analytical spots had overlapped grain boundaries, cracks, or mineral inclusions. The
number of excluded spots are a result of the fine-grain size (< 10 μm) of many of the
targeted areas. Multiple grains were often analyzed in areas ~5 mm2 or smaller, and
always within the inner 1 cm diameter of each sample to avoid X-Y instrumental
fractionation affects (Kita et al., 2009). Analyses of multiple grains of the same mineral
were made within each microstructural domain, typically separated by 1–2 mm, in order
to evaluate intercrystalline variability of δ18O. Analysis of cores and rims on the same
grains allows for the evaluation of homogeneity and core-rim zonation patterns of δ18O.
Several grains within a given microstructure received one analysis at the center and two
rim analyses at opposite sides. However, grains < 40 μm in diameter commonly received
only one analysis. Examples of the SIMS spot locations are shown in Figure 4.11 (sample
CG-14CH-127).
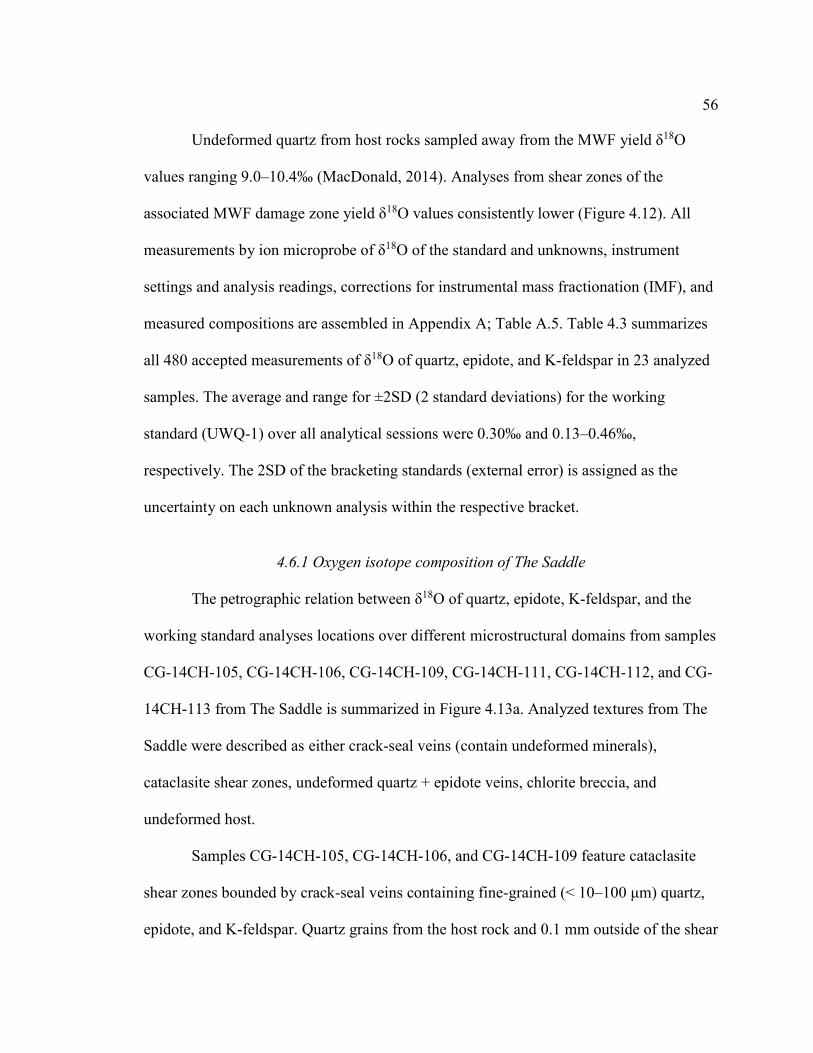
56
Undeformed quartz from host rocks sampled away from the MWF yield δ18O
values ranging 9.0–10.4‰ (MacDonald, 2014). Analyses from shear zones of the
associated MWF damage zone yield δ18O values consistently lower (Figure 4.12). All
measurements by ion microprobe of δ18O of the standard and unknowns, instrument
settings and analysis readings, corrections for instrumental mass fractionation (IMF), and
measured compositions are assembled in Appendix A; Table A.5. Table 4.3 summarizes
all 480 accepted measurements of δ18O of quartz, epidote, and K-feldspar in 23 analyzed
samples. The average and range for ±2SD (2 standard deviations) for the working
standard (UWQ-1) over all analytical sessions were 0.30‰ and 0.13–0.46‰,
respectively. The 2SD of the bracketing standards (external error) is assigned as the
uncertainty on each unknown analysis within the respective bracket.
4.6.1 Oxygen isotope composition of The Saddle
The petrographic relation between δ18O of quartz, epidote, K-feldspar, and the
working standard analyses locations over different microstructural domains from samples
CG-14CH-105, CG-14CH-106, CG-14CH-109, CG-14CH-111, CG-14CH-112, and CG-
14CH-113 from The Saddle is summarized in Figure 4.13a. Analyzed textures from The
Saddle were described as either crack-seal veins (contain undeformed minerals),
cataclasite shear zones, undeformed quartz + epidote veins, chlorite breccia, and
undeformed host.
Samples CG-14CH-105, CG-14CH-106, and CG-14CH-109 feature cataclasite
shear zones bounded by crack-seal veins containing fine-grained (< 10–100 μm) quartz,
epidote, and K-feldspar. Quartz grains from the host rock and 0.1 mm outside of the shear
57
zone of sample CG-14CH-105 give δ18O values of 9.0‰ at the rim and 10.0 to 10.2‰ at
the core. Quartz measured within crack-seal veins of sample CG-14CH-105 give
considerably lower δ18O values between -1.0 to 0.7‰ (Figure 4.15). K-feldspar measured
inside the crack-seal vein of sample CG-14CH-105 give δ18O values from -2.1 to 1.8‰.
No K-feldspar from the host rock were analyzed, but values of 8–9‰ are expected for K-
feldspar in magmatic equilibrium with δ18OQtz = 10‰ (fractionation factor of Blattner et
al., 1974).
Quartz grains from the host rock and up to 4 mm outside of the shear zone of
sample CG-14CH-106 give δ18O values of 1.3 and 1.5‰ at the rims of grains and 9.3 to
10.8 10.8‰ at the cores (Figure 4.15). Quartz measured within the crack-seal veins give
δ18O values of 5.5 ‰ at the rims of clasts. Epidote measured 4 mm outside of the shear
zone give δ18O values from -5.1 to -4.4‰ compared to δ18O values from -4.6 to -3.5‰
measured 50 μm inside of the crack-seal veins. Epidote measured 500 μm inside the
crack-seal veins give δ18O values of -4.1 to -3.5‰. K-feldspar measured 0.1 mm outside
of the shear zone give a δ18O value of 0.0‰ and δ18O values of -2.0 to -1.1‰ inside the
crack-seal vein. Only two quartz-epidote mineral pairs were measured from these
samples, yielding Δ18O(Qtz-Ep) values of 6.3 and 6.1‰ from 4 mm outside of the shear
zone of sample CG-14CH-106.
Quartz clasts measured within the crack-seal veins of sample CG-14CH-109 give
δ18O values of 10.1 to 10.6‰. K-feldspar measured within the crack-seal veins give δ18O
values of -2.6 to -0.9‰ at the rims of grains and -2.7 to -0.3‰ at the cores.
Samples CG-14CH-111 and CG-14CH-112 feature cracked zones in undeformed
granodiorite containing a 0.1–2 mm thick quartz + epidote veins of possible multiple
58
generations. Quartz measured within the vein of sample CG-14CH-111 give δ18O values
from 10.2 to 10.9‰. Epidote measured within the vein of sample CG-14CH-111 give
δ18O values of 2.6 to 5.3‰ (Figure 4.15). Epidote measured within the vein of sample
CG-14CH-112 give δ18O values from 1.8 to 6.6‰ with the larger of the two veins
analyzed having values from 1.8 to 5.7‰ and the smaller of the two veins analyzed
having values from 4.6 to 6.6‰ (Figure 4.15). Only two quartz-epidote mineral pairs
were measured from these samples, yielding Δ18O(Qtz-Ep) values of 5.9 and 5.3‰ from a 1
mm thick quartz + epidote vein of sample CG-14CH-111.
Sample CG-14CH-113 was taken from a 1–2 meter thick isolated chlorite breccia
containing cataclasite zones. Quartz measured from the brittle shear zone give δ18O
values of 5.6 to 8.5‰ at the rims of grains and 8.4 to 10.0‰ at the cores. K-feldspar
measured from the same shear zone give δ18O values from -1.1 to 1.4‰.
4.6.2 Oxygen isotope composition of Bat Cave Wash
The petrographic relation between δ18O of quartz, epidote, and the working
standard analyses locations over different microstructural domains from the Bat Cave
Wash is summarized in Figure 4.13b-c. Analyzed textures from Bat Cave Wash include
crack-seal veins, cataclasite shear zones, undeformed quartz + epidote veins, and host
gneiss.
Sample CG-14CH-127 contains a syntaxial vein of large undeformed, euhedral
quartz and epidote grains (~300 μm) bounded by fine-grained 0.5 mm thick undeformed
zones epidote-rich veins with minor quartz (< 50 μm) cutting a gneissic fabric (Figure
4.11). Quartz measured within the central coarse-grained zone give δ18O values from 2.2
59
to 3.7‰ with the exception of two core δ18O values of 8.6 and 9.1‰. Quartz measured
within the vein wall gives δ18O values from 4.2 to 6.2‰. Epidote measured within the
central coarse-grained zone give δ18O values of -3.1 to -2.0‰ at the rims of grains and -
3.1 to -1.6‰ at the cores. Epidote measured within the vein wall give δ18O values from -
1.9 to 1.0‰ (Figures 4.4.1, 4.4.2, 4.4.7). Seven quartz-epidote mineral pairs were
measured from two structurally distinct zones separated by ~5 mm. Quartz-epidote
mineral pairs from the central coarse-grained zone yield Δ18O(Qtz-Ep) values of 5.8 and
5.1‰. Quartz-epidote mineral pairs from the vein wall yield comparable Δ18O(Qtz-Ep)
values from 5.4 to 4.9‰ (n = 3).
Sample CG-14CH-126 features fine-grained (< 10–100 μm) epidote and chlorite
intergrowth among quartz ribbons containing subgrains parallel to a gneissic fabric as
well as a cross-cutting epidote vein. Quartz measured within gneissic intergrowth give
δ18O values of 4.4 to 6.5‰ and δ18O values from 5.4 to 6.4‰ within the crosscutting
epidote-rich vein. Epidote measured within gneissic intergrowth yielded δ18O values from
-2.7 to 3.3‰ and δ18O values from -2.9 to 3.4‰ from within the crosscutting vein (Figure
4.16). Eight quartz-epidote mineral pairs were measured from two structurally distinct
zones separated by ~2–3 mm. Quartz-epidote mineral pairs from gneissic intergrowth
yielded large Δ18O(Qtz-Ep) values from 8.1 to 6.2‰ (n = 6). A quartz-epidote mineral pair
from the epidote vein yields a Δ18O(Qtz-Ep) value of 9.3‰.
Sample CG-14CH-125 features well-defined fine-grained (50 μm) epidote-rich
veins. Quartz measured within the host gneiss give δ18O values from 5.8 to 7.1‰. Quartz
measured within the epidote-rich veins give similar δ18O values from 6.6 to 7.6‰.
60
Epidote measured within the veins give δ18O values from -0.6 to 3.4‰. Quartz-epidote
mineral pairs from the epidote vein yield Δ18O(Qtz-Ep) values from 7.2 to 4.2‰ (n = 5).
Sample CG-14CH-128 features crack-seal veins with grain sizes decreasing from
100 μm to < 10 μm. A single coarse quartz grain analysis gives a δ18O value of 6.0‰.
Quartz measured within the finest-grained (< 50 μm) zone gives similar δ18O values from
4.3 to 6.3‰. Epidote measured within the coarse-grained zone gives δ18O values of 0.5
and 1.5‰. Epidote measured within the finest-grained zone give δ18O values of -3.8 to
1.7‰. A single quartz-epidote mineral pair of the coarse-grained epidote yields a
Δ18O(Qtz-Ep) value of 4.5‰. Quartz-epidote mineral pairs from the finest-grained textures
yield Δ18O(Qtz-Ep) values from 8.0 to 3.9‰ (n = 8).
Sample CG-14CH-124 contains interspersed quartz + epidote veins cutting a
gneissic fabric. Quartz measured within veins give δ18O values from 4.3 to 4.8‰. Epidote
measured within veins give δ18O values from -2.2 to -0.4‰. Two quartz-epidote mineral
pairs measured from veins yield Δ18O(Qtz-Ep) values of 6.4 and 5.2‰.
Sample CG-14CH-135 features veins of fine-grained (10–50 μm) quartz and
epidote; the veins contain undeformed 100–500 μm thick calcite veins containing
undeformed quartz and epidote grains 10–100 μm in size. δ18O values of quartz measured
within the epidote-rich veins ranged from 7.9 to 9.1‰ and from 8.1 to 9.1‰ within the
calcite veins. Epidote measured within the epidote-rich veins give δ18O values from 0.6 to
2.0‰. Epidote measured within the calcite veins give δ18O values from 1.4 to 2.0‰.
Quartz-epidote mineral pairs from the quartz + epidote vein yield Δ18O(Qtz-Ep) values of
8.2 to 6.5‰ (n = 4). Quartz-epidote mineral pairs from the calcite vein yield Δ18O(Qtz-Ep)
values from 7.3 to 6.5‰ (n = 3).
61
Samples CG-14CH-133 and CG-14CH-134 feature fine-grained (< 10–100 μm)
epidote, quartz, and chlorite intergrowth among quartz ribbons surrounding cross-cutting
fine-grained (< 20 μm) epidote veins. These samples are the most structurally complex
and therefore different deformation events are difficult to distinguish. Quartz measured
within gneissic intergrowth from CG-14CH-133 gives δ18O values from 1.1 to 7.6‰
(Figure 4.16). Epidote measured within gneissic intergrowth from CG-14CH-133 gives
δ18O values from -5.3 to -1.7‰. Epidote measured within a single distinguishable vein
from CG-14CH-133 gives δ18O values from -3.9 to -3.4‰ (Figure 4.18). Quartz-epidote
mineral pairs from the zone within gneissic intergrowth from CG-14CH-133 yield
Δ18O(Qtz-Ep) values of 12.9 to 4.9‰ (n = 4). Quartz-epidote mineral pairs from the quartz
+ epidote vein within CG-14CH-133 yield Δ18O(Qtz-Ep) values of 8.6 and 6.8‰. Quartz
measured within gneissic intergrowth from CG-14CH-134 give δ18O values from 3.3 to
6.0‰. Epidote measured within gneissic intergrowth from CG-14CH-134 give δ18O
values from -2.9 to -0.5‰. Quartz-epidote mineral pairs measured from sample CG-
14CH-134 yield Δ18O(Qtz-Ep) values of 6.9 to 5.7‰ (n = 4).
Sample CG-14CH-137 features zones of plastic deformation fabric parallel to the
gneissic fabric containing quartz, epidote, and chlorite as well as undeformed cross-
cutting epidote-rich veins with a grain size of 20–100 μm. Primary quartz within gneissic
fabric cut by veins give δ18O values from 4.0 to 5.9‰. Quartz measured within the
largest epidote-rich vein (1.5 mm wide) gives δ18O values from 3.2 to 3.8‰. Quartz
measured within a thin epidote-rich vein (0.1 mm wide) gives δ18O values from 2.4 to
3.3‰. Epidote measured within the largest epidote-rich vein of CG-14CH-137 gives δ18O
values from -3.4 to -2.4‰. Epidote measured within the thin epidote-rich vein gives δ18O
62
values of -2.3 and -2.0‰ (Figure 4.16). Quartz-epidote mineral pairs from the largest
epidote-rich vein yield Δ18O(Qtz-Ep) values of 7.0 and 5.7‰. Quartz-epidote mineral pairs
from the thin epidote-rich vein yield Δ18O(Qtz-Ep) values of 4.9 and 4.8‰.
4.6.3 Oxygen isotope composition of additional MWF samples
The petrographic relation between δ18O of quartz, epidote, K-feldspar, and the
working standard analyses locations over different microstructural domains from
additional samples are summarized in Figure 4.14. Analyzed textures from additional
MWF samples include crack-seal veins, brittle deformed cataclasite shear zones,
undeformed quartz + epidote veins, foliated quartz + epidote veins, chlorite breccia, and
undeformed host.
Sample CG-13CH-60 is granodiorite containing a 0.5 cm vein of quartz and
epidote with a grain size of 50–100 μm as well as an inner epidote vein 1 mm thick with
quartz and epidote grains < 50 μm in size. Epidote measured within the inner epidote vein
gives δ18O values from 4.3 to 6.4‰.
Sample CG-13CH-RF contains three structural zones described in section 4.4
(Figure 4.17). Quartz measured within all three zones is quite similar, giving δ18O values
of 7.9 to 9.0‰. Epidote measured within all three zones is also similar, giving values
from 4.2 to 6.1‰. Quartz-epidote mineral pairs of the epidote cataclasite zone yield
Δ18O(Qtz-Ep) values of 3.9 and 3.7‰. A single quartz-epidote mineral pair from the ductile
zone yields a Δ18O(Qtz-Ep) value of 3.1‰. Quartz-epidote mineral pairs from a coarse zone
containing subhedral epidote yield Δ18O(Qtz-Ep) values of 2.6 and 2.3‰. K-feldspar
measured from the cataclasite zone give δ18O values from 2.3 to 3.0‰.
63
Sample 13JL-7 features crack-seal veins containing epidote grains 100–1000 μm
in size; secondary veins consist of epidote grains < 20 μm in size were not analyzed.
Quartz measured within coarse crack-seal vein gives δ18O values of 6.7 to 9.4‰ at the
rims of grains and 9.7‰ at a core. Quartz measured within the fine-grained veins gives
δ18O values from 3.5 to 8.8‰. Epidote within a coarse crack-seal vein gives δ18O values
of 2.4 to 3.6‰ at the rims of grains and 2.5 to 4.2‰ at the cores. Epidote measured
within the fine-grained vein gives δ18O values of 3.9 to 4.0‰. A single quartz-epidote
mineral pair from coarse crack-seal fragments yields a Δ18O(Qtz-Ep) value of 3.1‰. K-
feldspar measured from the coarse crack-seal vein gives δ18O values of 7.8 and 8.2‰.
Sample 13JL-8 features a cataclasite comprising quartz with a clast size of > 100
μm within an epidote matrix of < 10 μm. Quartz measured within host clasts gives δ18O
values of 9.3‰ at the rim of a grain and 5.8 and 7.7 ‰ at the core. Quartz measured
within the brecciated vein gives δ18O values of 4.0 to 9.3‰ at the rims of grains and 3.7
and 7.9‰ at the cores. Epidote measured within the brecciated vein gives δ18O values
from 0.6 to 2.3‰.
Sample CG-13CH-4 features an epidote shear zone in granodiorite featuring
angular quartz and epidote grains from 10–500 μm in size with the largest grains located
along the center and finest grains along the margins of the zone. Quartz measured within
the brecciated zone gives δ18O values from 5.4 to 9.0‰. Epidote measured within the
brecciated zone gives δ18O values from 4.6 to 5.3‰. A single quartz-epidote mineral pair
yields a Δ18O(Qtz-Ep) value of 1.4‰.
Sample CG-13CH-24 features an undeformed 0.5 cm thick quartz + epidote zone
(grains up to 1 mm in length) cutting a leucosome within granodiorite. Quartz measured
64
within the quartz + epidote zone gives δ18O values from 7.2 to 10.3‰. Epidote measured
within the quartz + epidote zone gives δ18O values from 5.6 to 6.4‰. Quartz-epidote
mineral pairs yield Δ18O(Qtz-Ep) values from 4.0 to 3.4‰ (n = 4).
Sample CG-13CH-30 features a 1–2 cm thick breccia zone consisting of quartz
grains 1–2 mm in size within a matrix of principally quartz-epidote grains 10–50 μm in
size. Quartz measured within the quartz + epidote matrix gives δ18O values from 6.4 to
7.5‰. Epidote measured within the quartz + epidote matrix gives δ18O values from -2.0
and -1.3‰. Epidote measured at the brecciated margin of the quartz + epidote matrix
gives δ18O values from -0.1 and 0.1‰. A single quartz-epidote mineral pair yields a
Δ18O(Qtz-Ep) value of 8.1‰.
Sample CG-13CH-78 features 2 mm thick foliated quartz vein cutting a 1 mm
thick epidote vein within gneiss banding. Quartz measured within the vein gives δ18O
values from 9.0 to 9.7‰. Epidote measured within the epidote vein gives δ18O values
from 4.7 to 5.8‰. Quartz-epidote mineral pairs yield Δ18O(Qtz-Ep) values of 4.5 and 4.2‰.
4.6.4 Intercrystalline variability in oxygen isotope composition
Large differences in δ18O(mineral) within a given sample in areas < 100 mm2 are
common in low grade metamorphic rocks (e.g., Ferry et al. 2014), and may result from
both partial isotopic exchange between protolith minerals and fluids, and multiple
generations of new mineral growth under changing conditions. In order for mineral pairs
to be used for oxygen isotope thermometry, it must be reasonable to assume that both
minerals equilibrated during a particular event. This study follows the criteria outlined in
Ferry et al. (2010), all analyses of a mineral, both inter- and intracrystalline, must obtain
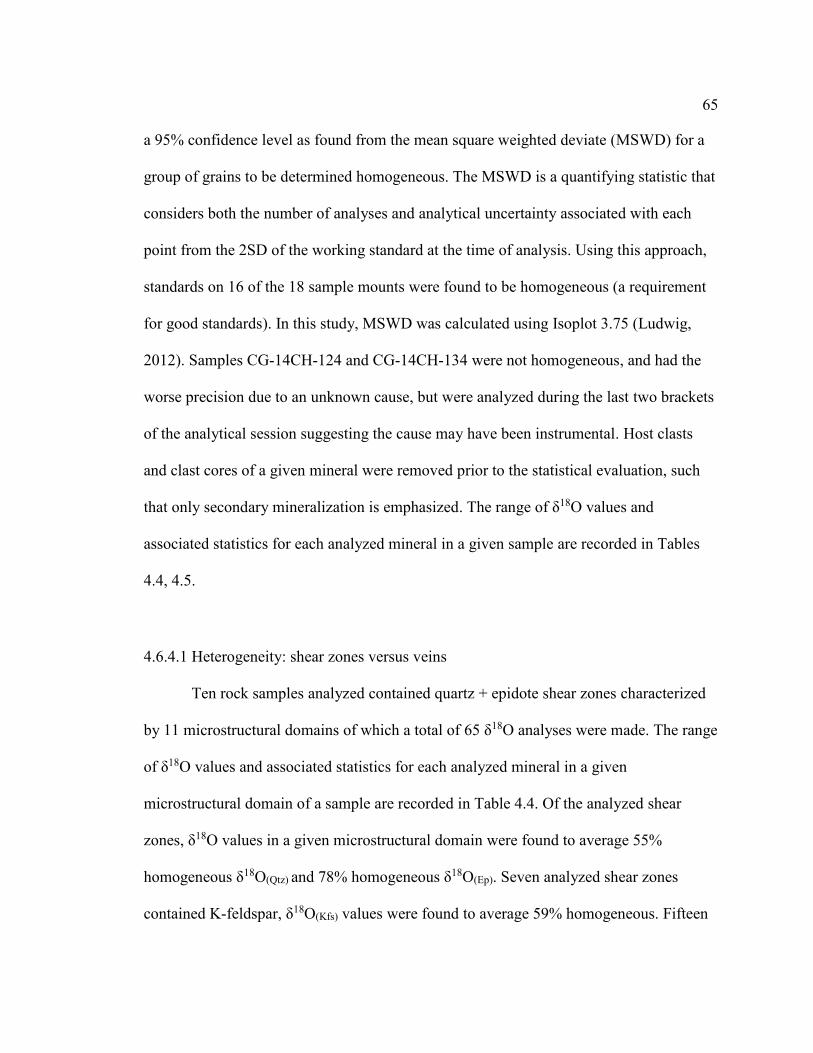
65
a 95% confidence level as found from the mean square weighted deviate (MSWD) for a
group of grains to be determined homogeneous. The MSWD is a quantifying statistic that
considers both the number of analyses and analytical uncertainty associated with each
point from the 2SD of the working standard at the time of analysis. Using this approach,
standards on 16 of the 18 sample mounts were found to be homogeneous (a requirement
for good standards). In this study, MSWD was calculated using Isoplot 3.75 (Ludwig,
2012). Samples CG-14CH-124 and CG-14CH-134 were not homogeneous, and had the
worse precision due to an unknown cause, but were analyzed during the last two brackets
of the analytical session suggesting the cause may have been instrumental. Host clasts
and clast cores of a given mineral were removed prior to the statistical evaluation, such
that only secondary mineralization is emphasized. The range of δ18O values and
associated statistics for each analyzed mineral in a given sample are recorded in Tables
4.4, 4.5.
4.6.4.1 Heterogeneity: shear zones versus veins
Ten rock samples analyzed contained quartz + epidote shear zones characterized
by 11 microstructural domains of which a total of 65 δ18O analyses were made. The range
of δ18O values and associated statistics for each analyzed mineral in a given
microstructural domain of a sample are recorded in Table 4.4. Of the analyzed shear
zones, δ18O values in a given microstructural domain were found to average 55%
homogeneous δ18O(Qtz) and 78% homogeneous δ18O(Ep). Seven analyzed shear zones
contained K-feldspar, δ18O(Kfs) values were found to average 59% homogeneous. Fifteen
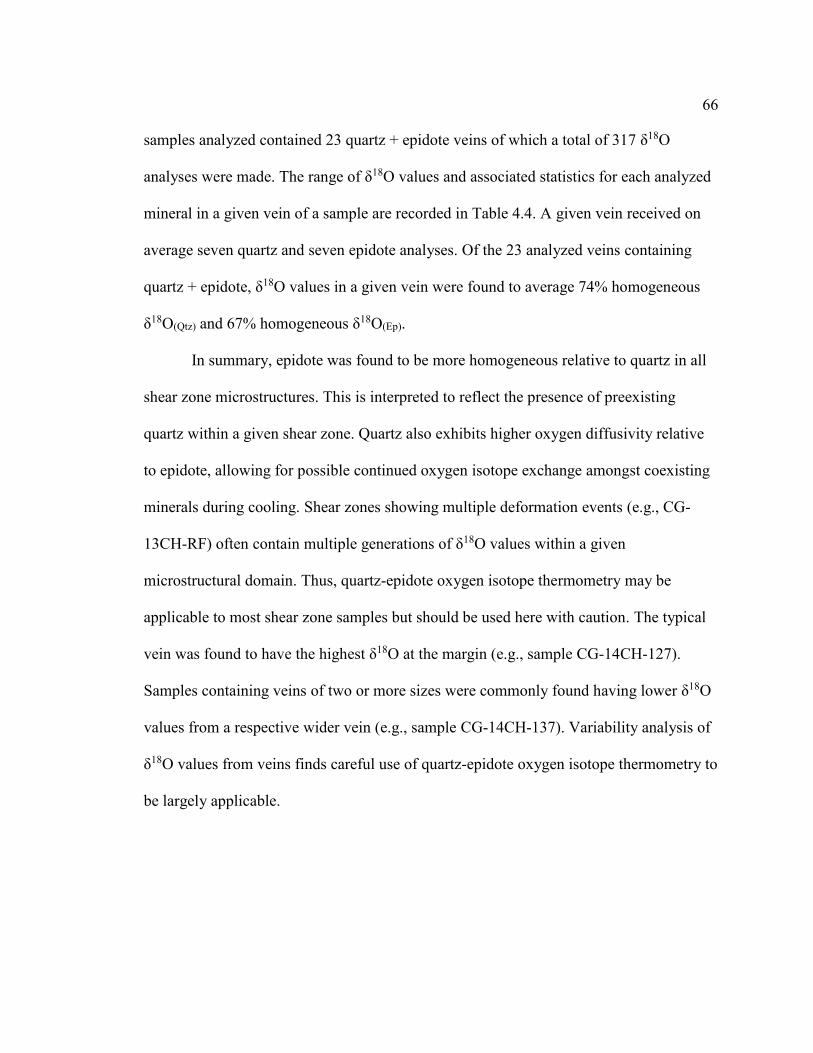
66
samples analyzed contained 23 quartz + epidote veins of which a total of 317 δ18O
analyses were made. The range of δ18O values and associated statistics for each analyzed
mineral in a given vein of a sample are recorded in Table 4.4. A given vein received on
average seven quartz and seven epidote analyses. Of the 23 analyzed veins containing
quartz + epidote, δ18O values in a given vein were found to average 74% homogeneous
δ18O(Qtz) and 67% homogeneous δ18O(Ep).
In summary, epidote was found to be more homogeneous relative to quartz in all
shear zone microstructures. This is interpreted to reflect the presence of preexisting
quartz within a given shear zone. Quartz also exhibits higher oxygen diffusivity relative
to epidote, allowing for possible continued oxygen isotope exchange amongst coexisting
minerals during cooling. Shear zones showing multiple deformation events (e.g., CG-
13CH-RF) often contain multiple generations of δ18O values within a given
microstructural domain. Thus, quartz-epidote oxygen isotope thermometry may be
applicable to most shear zone samples but should be used here with caution. The typical
vein was found to have the highest δ18O at the margin (e.g., sample CG-14CH-127).
Samples containing veins of two or more sizes were commonly found having lower δ18O
values from a respective wider vein (e.g., sample CG-14CH-137). Variability analysis of
δ18O values from veins finds careful use of quartz-epidote oxygen isotope thermometry to
be largely applicable.
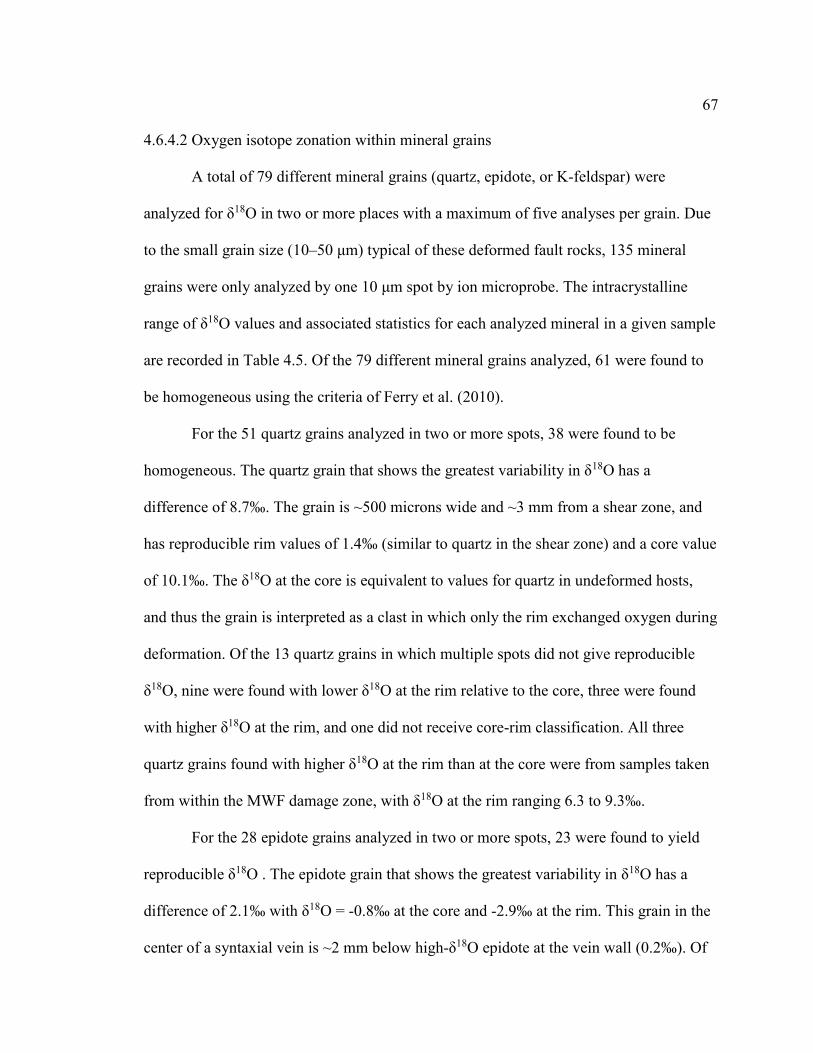
67
4.6.4.2 Oxygen isotope zonation within mineral grains
A total of 79 different mineral grains (quartz, epidote, or K-feldspar) were
analyzed for δ18O in two or more places with a maximum of five analyses per grain. Due
to the small grain size (10–50 μm) typical of these deformed fault rocks, 135 mineral
grains were only analyzed by one 10 μm spot by ion microprobe. The intracrystalline
range of δ18O values and associated statistics for each analyzed mineral in a given sample
are recorded in Table 4.5. Of the 79 different mineral grains analyzed, 61 were found to
be homogeneous using the criteria of Ferry et al. (2010).
For the 51 quartz grains analyzed in two or more spots, 38 were found to be
homogeneous. The quartz grain that shows the greatest variability in δ18O has a
difference of 8.7‰. The grain is ~500 microns wide and ~3 mm from a shear zone, and
has reproducible rim values of 1.4‰ (similar to quartz in the shear zone) and a core value
of 10.1‰. The δ18O at the core is equivalent to values for quartz in undeformed hosts,
and thus the grain is interpreted as a clast in which only the rim exchanged oxygen during
deformation. Of the 13 quartz grains in which multiple spots did not give reproducible
δ18O, nine were found with lower δ18O at the rim relative to the core, three were found
with higher δ18O at the rim, and one did not receive core-rim classification. All three
quartz grains found with higher δ18O at the rim than at the core were from samples taken
from within the MWF damage zone, with δ18O at the rim ranging 6.3 to 9.3‰.
For the 28 epidote grains analyzed in two or more spots, 23 were found to yield
reproducible δ18O . The epidote grain that shows the greatest variability in δ18O has a
difference of 2.1‰ with δ18O = -0.8‰ at the core and -2.9‰ at the rim. This grain in the
center of a syntaxial vein is ~2 mm below high-δ18O epidote at the vein wall (0.2‰). Of
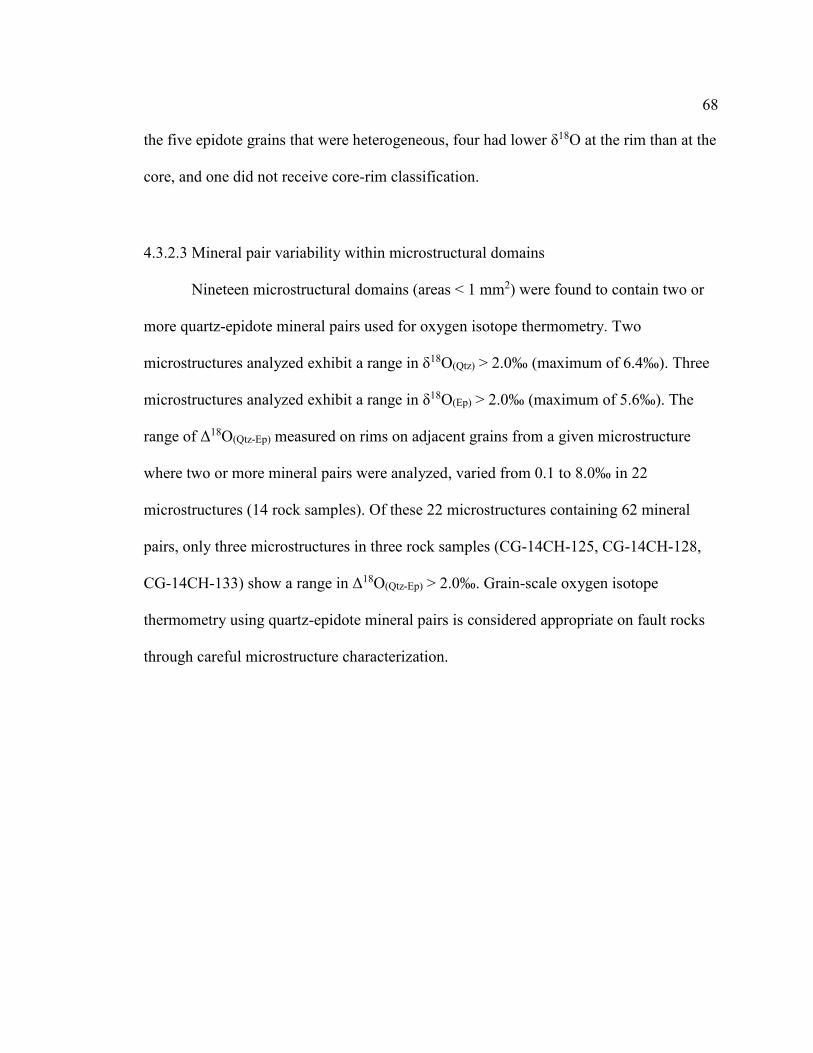
68
the five epidote grains that were heterogeneous, four had lower δ18O at the rim than at the
core, and one did not receive core-rim classification.
4.3.2.3 Mineral pair variability within microstructural domains
Nineteen microstructural domains (areas < 1 mm2) were found to contain two or
more quartz-epidote mineral pairs used for oxygen isotope thermometry. Two
microstructures analyzed exhibit a range in δ18O(Qtz) > 2.0‰ (maximum of 6.4‰). Three
microstructures analyzed exhibit a range in δ18O(Ep) > 2.0‰ (maximum of 5.6‰). The
range of Δ18O(Qtz-Ep) measured on rims on adjacent grains from a given microstructure
where two or more mineral pairs were analyzed, varied from 0.1 to 8.0‰ in 22
microstructures (14 rock samples). Of these 22 microstructures containing 62 mineral
pairs, only three microstructures in three rock samples (CG-14CH-125, CG-14CH-128,
CG-14CH-133) show a range in Δ18O(Qtz-Ep) > 2.0‰. Grain-scale oxygen isotope
thermometry using quartz-epidote mineral pairs is considered appropriate on fault rocks
through careful microstructure characterization.
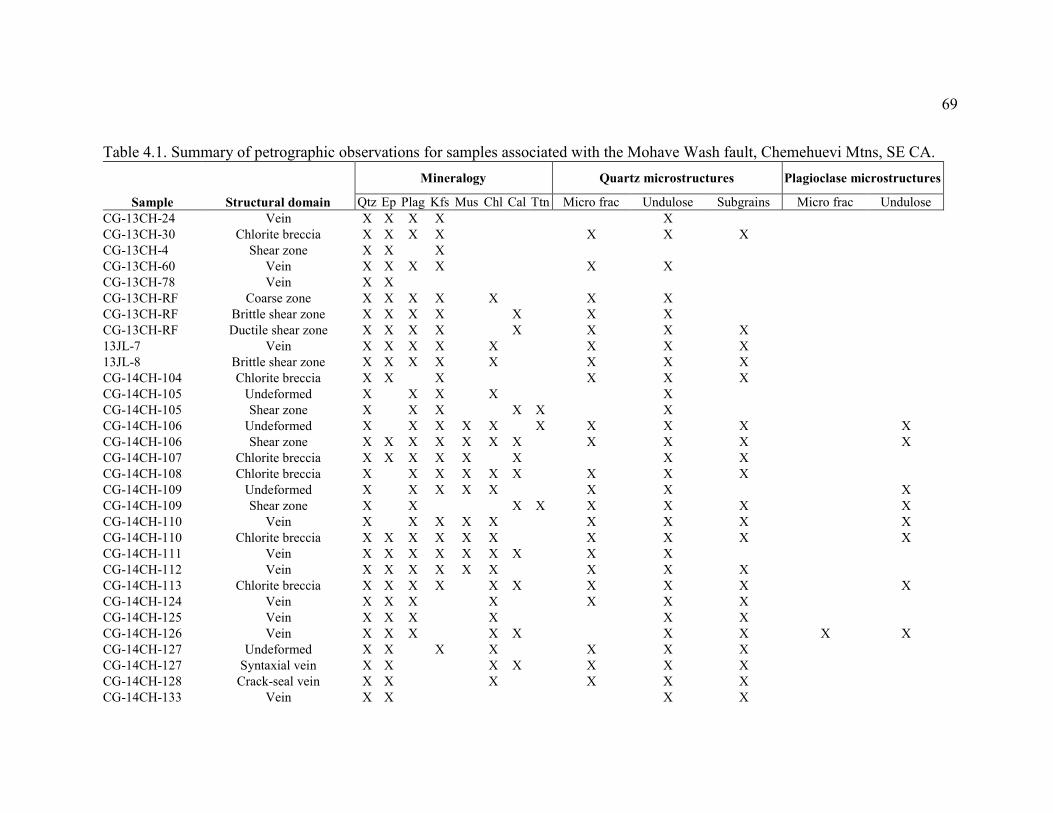
69
Table 4.1. Summary of petrographic observations for samples associated with the Mohave Wash fault, Chemehuevi Mtns, SE CA.
Sample Structural domain
Mineralogy Quartz microstructures Plagioclase microstructures
Qtz Ep Plag Kfs Mus Chl Cal Ttn Micro frac Undulose Subgrains Micro frac Undulose CG-13CH-24 Vein X X X X X CG-13CH-30 Chlorite breccia X X X X X X X CG-13CH-4 Shear zone X X X CG-13CH-60 Vein X X X X X X CG-13CH-78 Vein X X CG-13CH-RF Coarse zone X X X X X X X CG-13CH-RF Brittle shear zone X X X X X X X CG-13CH-RF Ductile shear zone X X X X X X X X 13JL-7 Vein X X X X X X X X 13JL-8 Brittle shear zone X X X X X X X X CG-14CH-104 Chlorite breccia X X X X X X CG-14CH-105 Undeformed X X X X X CG-14CH-105 Shear zone X X X X X X CG-14CH-106 Undeformed X X X X X X X X X X CG-14CH-106 Shear zone X X X X X X X X X X X CG-14CH-107 Chlorite breccia X X X X X X X X CG-14CH-108 Chlorite breccia X X X X X X X X X CG-14CH-109 Undeformed X X X X X X X X CG-14CH-109 Shear zone X X X X X X X X CG-14CH-110 Vein X X X X X X X X X CG-14CH-110 Chlorite breccia X X X X X X X X X X CG-14CH-111 Vein X X X X X X X X X CG-14CH-112 Vein X X X X X X X X X CG-14CH-113 Chlorite breccia X X X X X X X X X X CG-14CH-124 Vein X X X X X X X CG-14CH-125 Vein X X X X X X CG-14CH-126 Vein X X X X X X X X X CG-14CH-127 Undeformed X X X X X X X CG-14CH-127 Syntaxial vein X X X X X X X CG-14CH-128 Crack-seal vein X X X X X X CG-14CH-133 Vein X X X X
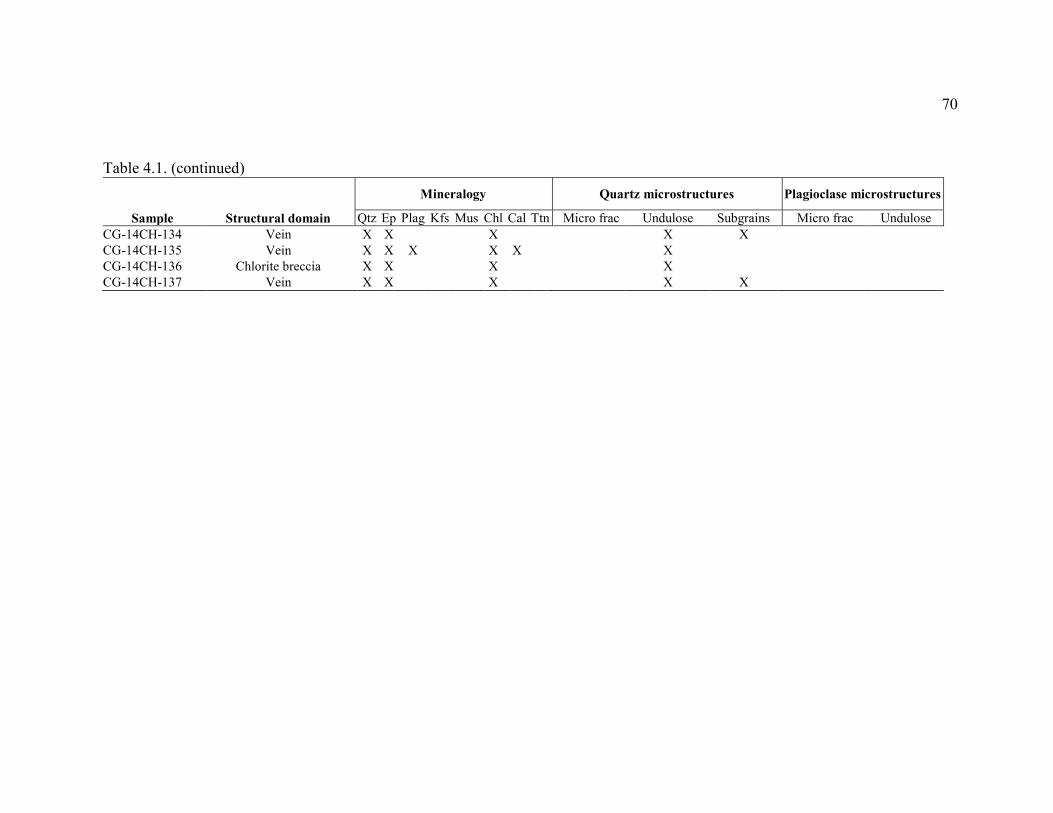
70
Table 4.1. (continued)
Sample Structural domain
Mineralogy Quartz microstructures Plagioclase microstructures
Qtz Ep Plag Kfs Mus Chl Cal Ttn Micro frac Undulose Subgrains Micro frac Undulose CG-14CH-134 Vein X X X X X CG-14CH-135 Vein X X X X X X CG-14CH-136 Chlorite breccia X X X X CG-14CH-137 Vein X X X X X
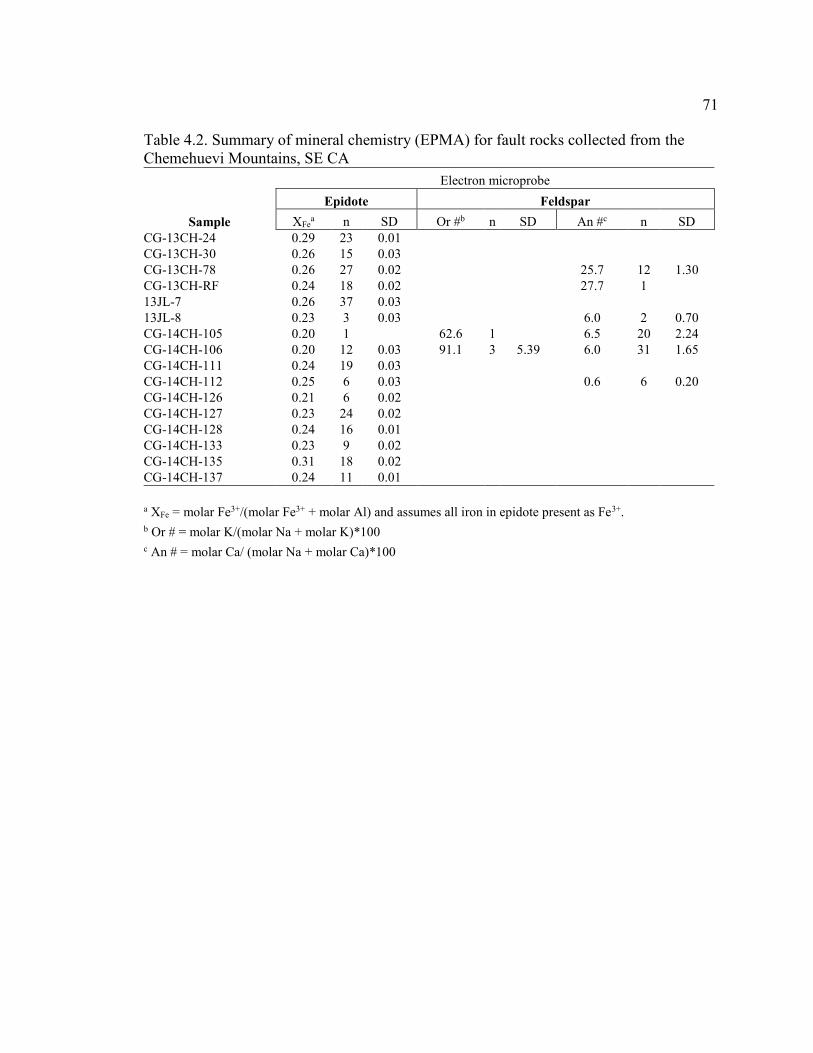
71
Table 4.2. Summary of mineral chemistry (EPMA) for fault rocks collected from the Chemehuevi Mountains, SE CA
Sample
Electron microprobe Epidote Feldspar
XFea n SD Or #b n SD An #c n SD
CG-13CH-24 0.29 23 0.01 CG-13CH-30 0.26 15 0.03 CG-13CH-78 0.26 27 0.02 25.7 12 1.30 CG-13CH-RF 0.24 18 0.02 27.7 1 13JL-7 0.26 37 0.03 13JL-8 0.23 3 0.03 6.0 2 0.70 CG-14CH-105 0.20 1 62.6 1 6.5 20 2.24 CG-14CH-106 0.20 12 0.03 91.1 3 5.39 6.0 31 1.65 CG-14CH-111 0.24 19 0.03 CG-14CH-112 0.25 6 0.03 0.6 6 0.20 CG-14CH-126 0.21 6 0.02 CG-14CH-127 0.23 24 0.02 CG-14CH-128 0.24 16 0.01 CG-14CH-133 0.23 9 0.02 CG-14CH-135 0.31 18 0.02 CG-14CH-137 0.24 11 0.01
a XFe = molar Fe3+/(molar Fe3+ + molar Al) and assumes all iron in epidote present as Fe3+. b Or # = molar K/(molar Na + molar K)*100 c An # = molar Ca/ (molar Na + molar Ca)*100
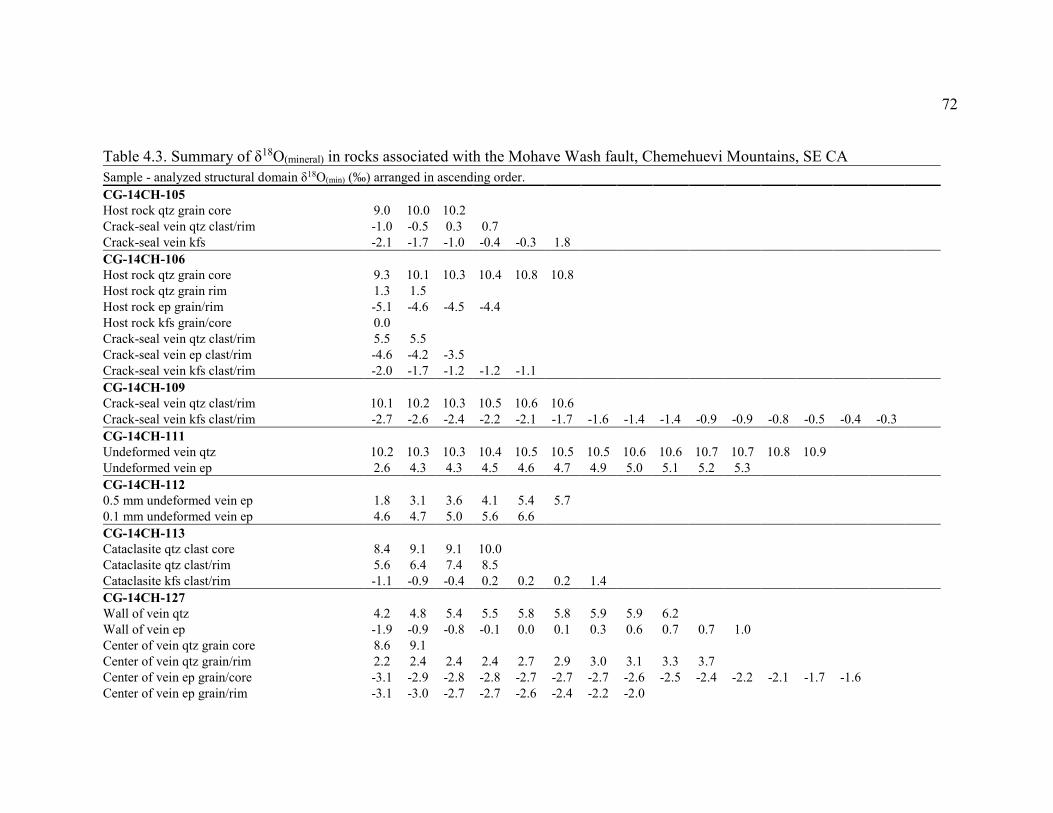
72
Table 4.3. Summary of δ18O(mineral) in rocks associated with the Mohave Wash fault, Chemehuevi Mountains, SE CA Sample - analyzed structural domain δ18O(min) (‰) arranged in ascending order. CG-14CH-105 Host rock qtz grain core 9.0 10.0 10.2
Crack-seal vein qtz clast/rim -1.0 -0.5 0.3 0.7 Crack-seal vein kfs -2.1 -1.7 -1.0 -0.4 -0.3 1.8
CG-14CH-106 Host rock qtz grain core 9.3 10.1 10.3 10.4 10.8 10.8
Host rock qtz grain rim 1.3 1.5 Host rock ep grain/rim -5.1 -4.6 -4.5 -4.4
Host rock kfs grain/core 0.0 Crack-seal vein qtz clast/rim 5.5 5.5
Crack-seal vein ep clast/rim -4.6 -4.2 -3.5 Crack-seal vein kfs clast/rim -2.0 -1.7 -1.2 -1.2 -1.1
CG-14CH-109 Crack-seal vein qtz clast/rim 10.1 10.2 10.3 10.5 10.6 10.6
Crack-seal vein kfs clast/rim -2.7 -2.6 -2.4 -2.2 -2.1 -1.7 -1.6 -1.4 -1.4 -0.9 -0.9 -0.8 -0.5 -0.4 -0.3 CG-14CH-111
Undeformed vein qtz 10.2 10.3 10.3 10.4 10.5 10.5 10.5 10.6 10.6 10.7 10.7 10.8 10.9 Undeformed vein ep 2.6 4.3 4.3 4.5 4.6 4.7 4.9 5.0 5.1 5.2 5.3
CG-14CH-112 0.5 mm undeformed vein ep 1.8 3.1 3.6 4.1 5.4 5.7
0.1 mm undeformed vein ep 4.6 4.7 5.0 5.6 6.6 CG-14CH-113
Cataclasite qtz clast core 8.4 9.1 9.1 10.0 Cataclasite qtz clast/rim 5.6 6.4 7.4 8.5 Cataclasite kfs clast/rim -1.1 -0.9 -0.4 0.2 0.2 0.2 1.4
CG-14CH-127 Wall of vein qtz 4.2 4.8 5.4 5.5 5.8 5.8 5.9 5.9 6.2
Wall of vein ep -1.9 -0.9 -0.8 -0.1 0.0 0.1 0.3 0.6 0.7 0.7 1.0 Center of vein qtz grain core 8.6 9.1
Center of vein qtz grain/rim 2.2 2.4 2.4 2.4 2.7 2.9 3.0 3.1 3.3 3.7 Center of vein ep grain/core -3.1 -2.9 -2.8 -2.8 -2.7 -2.7 -2.7 -2.6 -2.5 -2.4 -2.2 -2.1 -1.7 -1.6
Center of vein ep grain/rim -3.1 -3.0 -2.7 -2.7 -2.6 -2.4 -2.2 -2.0
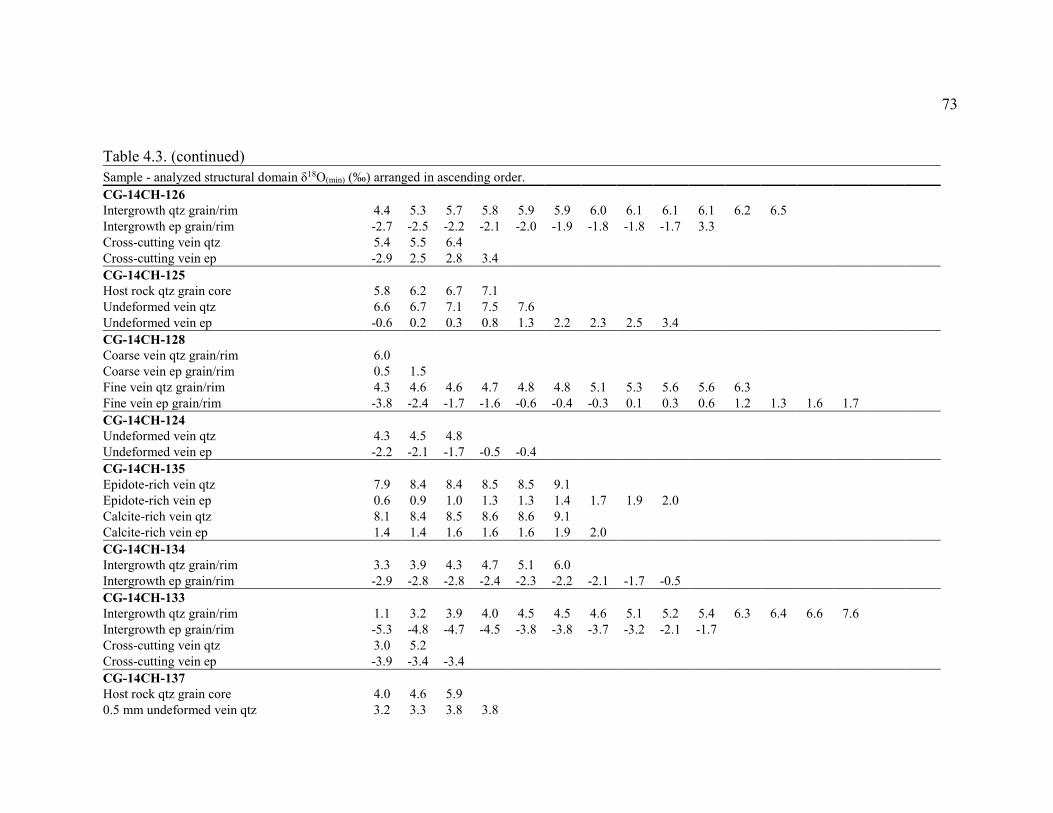
73
Table 4.3. (continued) Sample - analyzed structural domain δ18O(min) (‰) arranged in ascending order. CG-14CH-126 Intergrowth qtz grain/rim 4.4 5.3 5.7 5.8 5.9 5.9 6.0 6.1 6.1 6.1 6.2 6.5
Intergrowth ep grain/rim -2.7 -2.5 -2.2 -2.1 -2.0 -1.9 -1.8 -1.8 -1.7 3.3 Cross-cutting vein qtz 5.4 5.5 6.4
Cross-cutting vein ep -2.9 2.5 2.8 3.4 CG-14CH-125
Host rock qtz grain core 5.8 6.2 6.7 7.1 Undeformed vein qtz 6.6 6.7 7.1 7.5 7.6
Undeformed vein ep -0.6 0.2 0.3 0.8 1.3 2.2 2.3 2.5 3.4 CG-14CH-128
Coarse vein qtz grain/rim 6.0 Coarse vein ep grain/rim 0.5 1.5
Fine vein qtz grain/rim 4.3 4.6 4.6 4.7 4.8 4.8 5.1 5.3 5.6 5.6 6.3 Fine vein ep grain/rim -3.8 -2.4 -1.7 -1.6 -0.6 -0.4 -0.3 0.1 0.3 0.6 1.2 1.3 1.6 1.7
CG-14CH-124 Undeformed vein qtz 4.3 4.5 4.8
Undeformed vein ep -2.2 -2.1 -1.7 -0.5 -0.4 CG-14CH-135
Epidote-rich vein qtz 7.9 8.4 8.4 8.5 8.5 9.1 Epidote-rich vein ep 0.6 0.9 1.0 1.3 1.3 1.4 1.7 1.9 2.0
Calcite-rich vein qtz 8.1 8.4 8.5 8.6 8.6 9.1 Calcite-rich vein ep 1.4 1.4 1.6 1.6 1.6 1.9 2.0
CG-14CH-134 Intergrowth qtz grain/rim 3.3 3.9 4.3 4.7 5.1 6.0
Intergrowth ep grain/rim -2.9 -2.8 -2.8 -2.4 -2.3 -2.2 -2.1 -1.7 -0.5 CG-14CH-133
Intergrowth qtz grain/rim 1.1 3.2 3.9 4.0 4.5 4.5 4.6 5.1 5.2 5.4 6.3 6.4 6.6 7.6 Intergrowth ep grain/rim -5.3 -4.8 -4.7 -4.5 -3.8 -3.8 -3.7 -3.2 -2.1 -1.7
Cross-cutting vein qtz 3.0 5.2 Cross-cutting vein ep -3.9 -3.4 -3.4
CG-14CH-137 Host rock qtz grain core 4.0 4.6 5.9
0.5 mm undeformed vein qtz 3.2 3.3 3.8 3.8
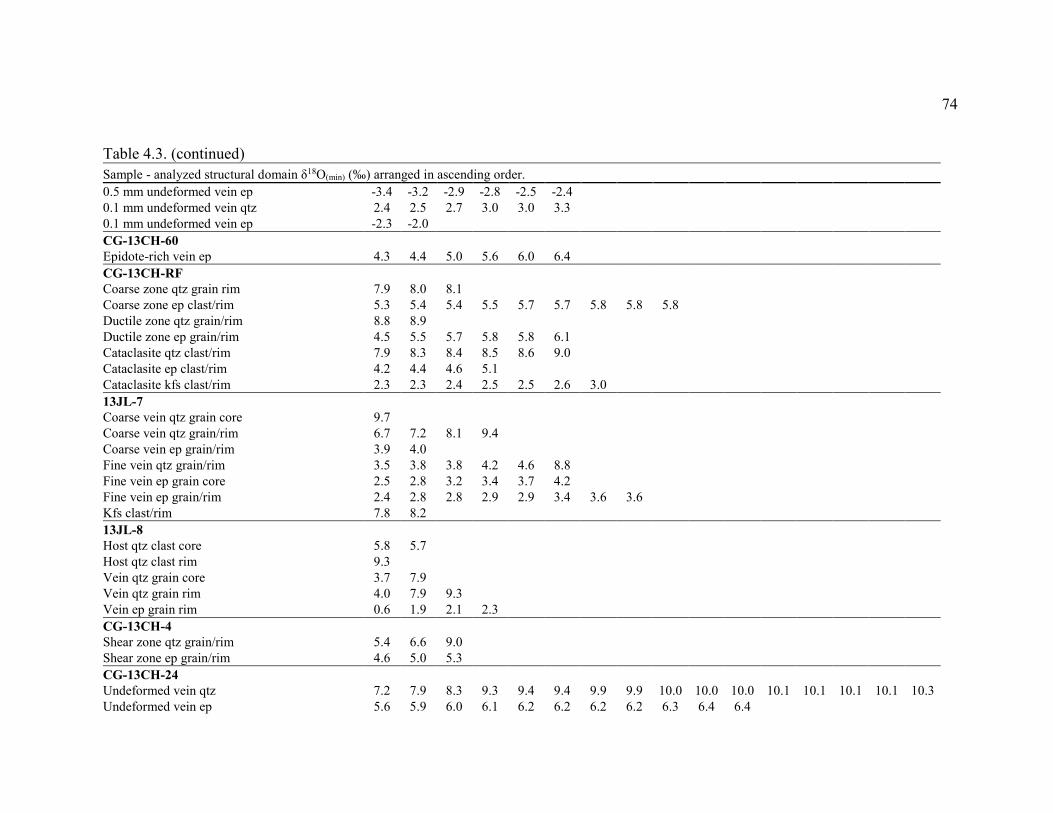
74
Table 4.3. (continued) Sample - analyzed structural domain δ18O(min) (‰) arranged in ascending order. 0.5 mm undeformed vein ep -3.4 -3.2 -2.9 -2.8 -2.5 -2.4
0.1 mm undeformed vein qtz 2.4 2.5 2.7 3.0 3.0 3.3 0.1 mm undeformed vein ep -2.3 -2.0
CG-13CH-60 Epidote-rich vein ep 4.3 4.4 5.0 5.6 6.0 6.4
CG-13CH-RF Coarse zone qtz grain rim 7.9 8.0 8.1
Coarse zone ep clast/rim 5.3 5.4 5.4 5.5 5.7 5.7 5.8 5.8 5.8 Ductile zone qtz grain/rim 8.8 8.9
Ductile zone ep grain/rim 4.5 5.5 5.7 5.8 5.8 6.1 Cataclasite qtz clast/rim 7.9 8.3 8.4 8.5 8.6 9.0 Cataclasite ep clast/rim 4.2 4.4 4.6 5.1
Cataclasite kfs clast/rim 2.3 2.3 2.4 2.5 2.5 2.6 3.0 13JL-7
Coarse vein qtz grain core 9.7 Coarse vein qtz grain/rim 6.7 7.2 8.1 9.4
Coarse vein ep grain/rim 3.9 4.0 Fine vein qtz grain/rim 3.5 3.8 3.8 4.2 4.6 8.8
Fine vein ep grain core 2.5 2.8 3.2 3.4 3.7 4.2 Fine vein ep grain/rim 2.4 2.8 2.8 2.9 2.9 3.4 3.6 3.6
Kfs clast/rim 7.8 8.2 13JL-8
Host qtz clast core 5.8 5.7 Host qtz clast rim 9.3
Vein qtz grain core 3.7 7.9 Vein qtz grain rim 4.0 7.9 9.3
Vein ep grain rim 0.6 1.9 2.1 2.3 CG-13CH-4
Shear zone qtz grain/rim 5.4 6.6 9.0 Shear zone ep grain/rim 4.6 5.0 5.3 CG-13CH-24
Undeformed vein qtz 7.2 7.9 8.3 9.3 9.4 9.4 9.9 9.9 10.0 10.0 10.0 10.1 10.1 10.1 10.1 10.3 Undeformed vein ep 5.6 5.9 6.0 6.1 6.2 6.2 6.2 6.2 6.3 6.4 6.4
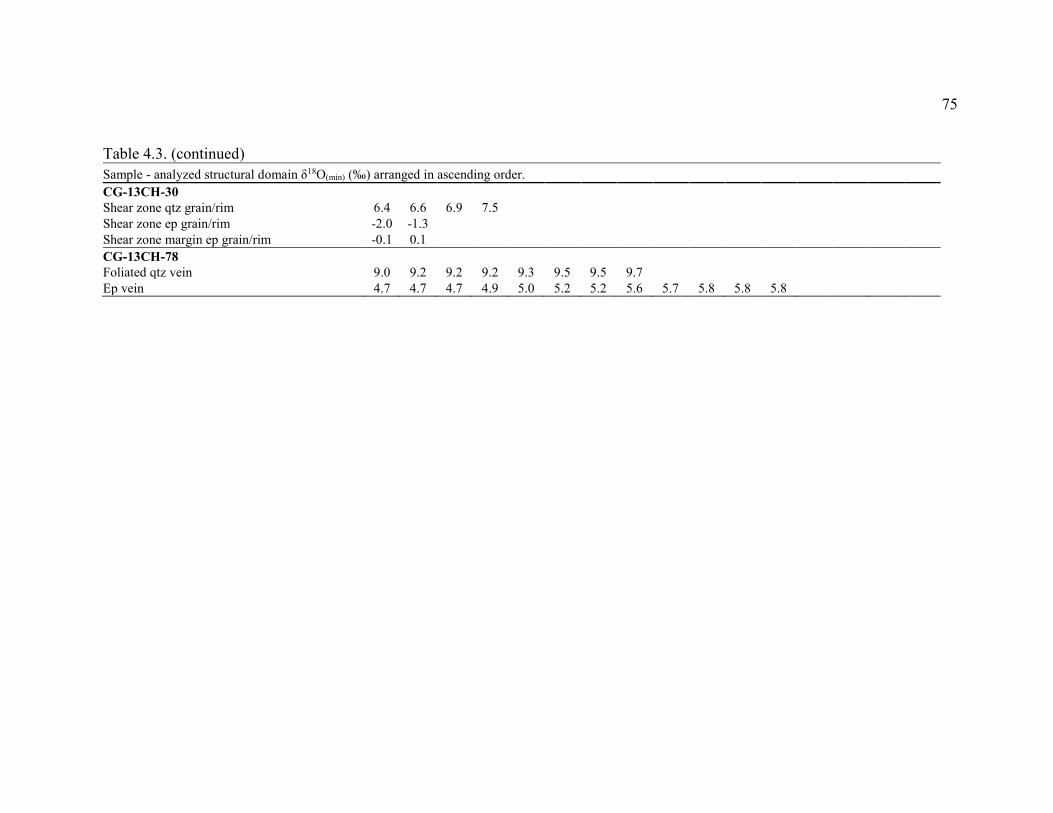
75
Table 4.3. (continued) Sample - analyzed structural domain δ18O(min) (‰) arranged in ascending order. CG-13CH-30 Shear zone qtz grain/rim 6.4 6.6 6.9 7.5
Shear zone ep grain/rim -2.0 -1.3 Shear zone margin ep grain/rim -0.1 0.1 CG-13CH-78
Foliated qtz vein 9.0 9.2 9.2 9.2 9.3 9.5 9.5 9.7 Ep vein 4.7 4.7 4.7 4.9 5.0 5.2 5.2 5.6 5.7 5.8 5.8 5.8
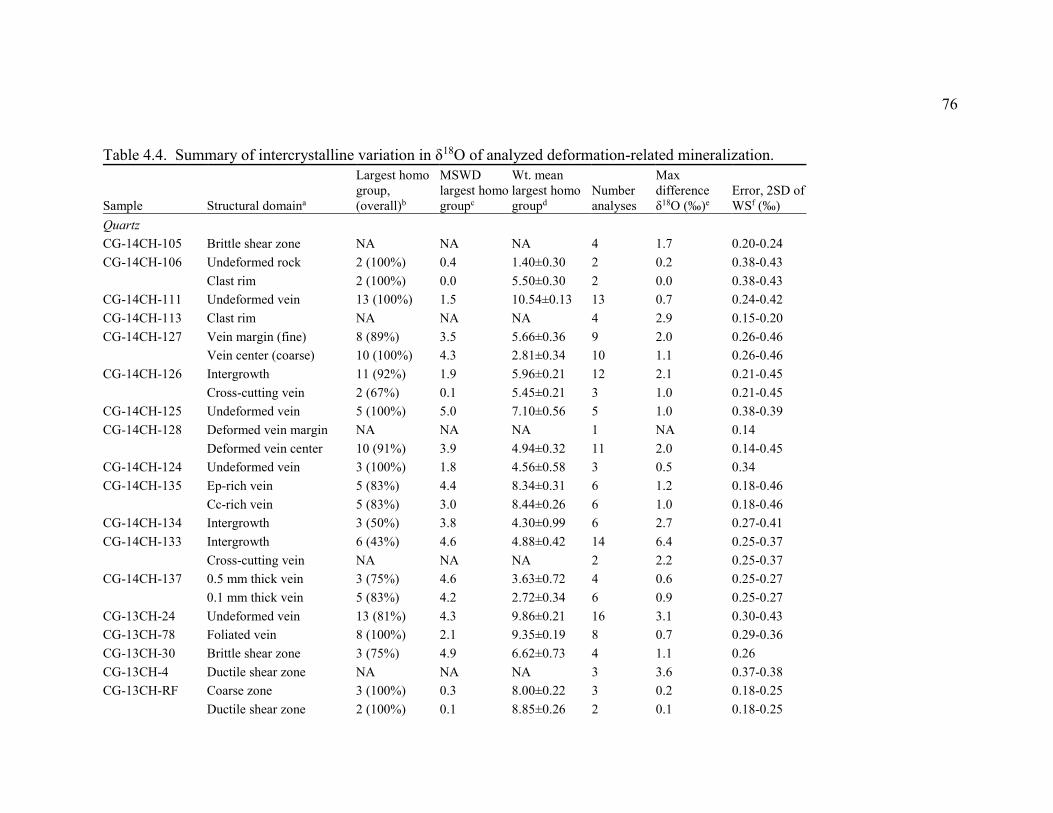
76
Table 4.4. Summary of intercrystalline variation in δ18O of analyzed deformation-related mineralization.
Sample Structural domaina
Largest homo group, (overall)b
MSWD largest homo groupc
Wt. mean largest homo groupd
Number analyses
Max difference δ18O (‰)e
Error, 2SD of WSf (‰)
Quartz CG-14CH-105 Brittle shear zone NA NA NA 4 1.7 0.20-0.24 CG-14CH-106 Undeformed rock 2 (100%) 0.4 1.40±0.30 2 0.2 0.38-0.43
Clast rim 2 (100%) 0.0 5.50±0.30 2 0.0 0.38-0.43
CG-14CH-111 Undeformed vein 13 (100%) 1.5 10.54±0.13 13 0.7 0.24-0.42 CG-14CH-113 Clast rim NA NA NA 4 2.9 0.15-0.20 CG-14CH-127 Vein margin (fine) 8 (89%) 3.5 5.66±0.36 9 2.0 0.26-0.46
Vein center (coarse) 10 (100%) 4.3 2.81±0.34 10 1.1 0.26-0.46
CG-14CH-126 Intergrowth 11 (92%) 1.9 5.96±0.21 12 2.1 0.21-0.45
Cross-cutting vein 2 (67%) 0.1 5.45±0.21 3 1.0 0.21-0.45
CG-14CH-125 Undeformed vein 5 (100%) 5.0 7.10±0.56 5 1.0 0.38-0.39 CG-14CH-128 Deformed vein margin NA NA NA 1 NA 0.14
Deformed vein center 10 (91%) 3.9 4.94±0.32 11 2.0 0.14-0.45
CG-14CH-124 Undeformed vein 3 (100%) 1.8 4.56±0.58 3 0.5 0.34 CG-14CH-135 Ep-rich vein 5 (83%) 4.4 8.34±0.31 6 1.2 0.18-0.46
Cc-rich vein 5 (83%) 3.0 8.44±0.26 6 1.0 0.18-0.46
CG-14CH-134 Intergrowth 3 (50%) 3.8 4.30±0.99 6 2.7 0.27-0.41 CG-14CH-133 Intergrowth 6 (43%) 4.6 4.88±0.42 14 6.4 0.25-0.37
Cross-cutting vein NA NA NA 2 2.2 0.25-0.37
CG-14CH-137 0.5 mm thick vein 3 (75%) 4.6 3.63±0.72 4 0.6 0.25-0.27
0.1 mm thick vein 5 (83%) 4.2 2.72±0.34 6 0.9 0.25-0.27
CG-13CH-24 Undeformed vein 13 (81%) 4.3 9.86±0.21 16 3.1 0.30-0.43 CG-13CH-78 Foliated vein 8 (100%) 2.1 9.35±0.19 8 0.7 0.29-0.36 CG-13CH-30 Brittle shear zone 3 (75%) 4.9 6.62±0.73 4 1.1 0.26 CG-13CH-4 Ductile shear zone NA NA NA 3 3.6 0.37-0.38 CG-13CH-RF Coarse zone 3 (100%) 0.3 8.00±0.22 3 0.2 0.18-0.25
Ductile shear zone 2 (100%) 0.1 8.85±0.26 2 0.1 0.18-0.25
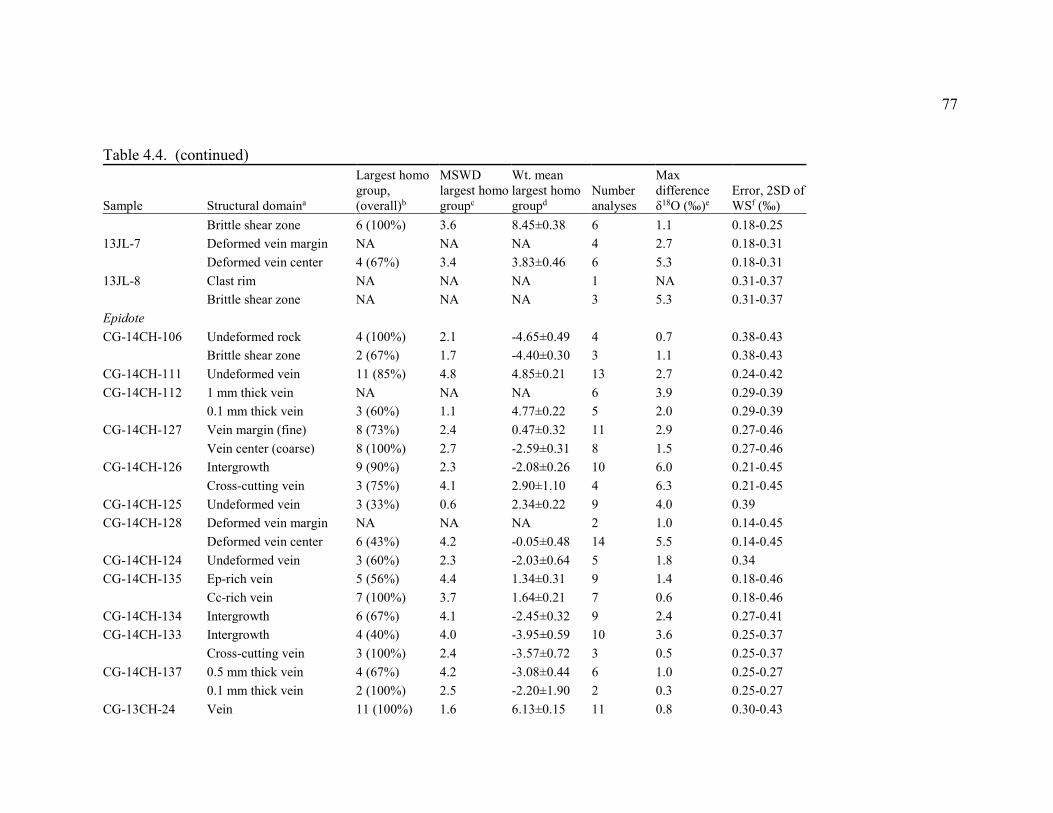
77
Table 4.4. (continued)
Sample Structural domaina
Largest homo group, (overall)b
MSWD largest homo groupc
Wt. mean largest homo groupd
Number analyses
Max difference δ18O (‰)e
Error, 2SD of WSf (‰)
Brittle shear zone 6 (100%) 3.6 8.45±0.38 6 1.1 0.18-0.25
13JL-7 Deformed vein margin NA NA NA 4 2.7 0.18-0.31
Deformed vein center 4 (67%) 3.4 3.83±0.46 6 5.3 0.18-0.31
13JL-8 Clast rim NA NA NA 1 NA 0.31-0.37
Brittle shear zone NA NA NA 3 5.3 0.31-0.37
Epidote CG-14CH-106 Undeformed rock 4 (100%) 2.1 -4.65±0.49 4 0.7 0.38-0.43
Brittle shear zone 2 (67%) 1.7 -4.40±0.30 3 1.1 0.38-0.43
CG-14CH-111 Undeformed vein 11 (85%) 4.8 4.85±0.21 13 2.7 0.24-0.42 CG-14CH-112 1 mm thick vein NA NA NA 6 3.9 0.29-0.39
0.1 mm thick vein 3 (60%) 1.1 4.77±0.22 5 2.0 0.29-0.39
CG-14CH-127 Vein margin (fine) 8 (73%) 2.4 0.47±0.32 11 2.9 0.27-0.46
Vein center (coarse) 8 (100%) 2.7 -2.59±0.31 8 1.5 0.27-0.46
CG-14CH-126 Intergrowth 9 (90%) 2.3 -2.08±0.26 10 6.0 0.21-0.45
Cross-cutting vein 3 (75%) 4.1 2.90±1.10 4 6.3 0.21-0.45
CG-14CH-125 Undeformed vein 3 (33%) 0.6 2.34±0.22 9 4.0 0.39 CG-14CH-128 Deformed vein margin NA NA NA 2 1.0 0.14-0.45
Deformed vein center 6 (43%) 4.2 -0.05±0.48 14 5.5 0.14-0.45
CG-14CH-124 Undeformed vein 3 (60%) 2.3 -2.03±0.64 5 1.8 0.34 CG-14CH-135 Ep-rich vein 5 (56%) 4.4 1.34±0.31 9 1.4 0.18-0.46
Cc-rich vein 7 (100%) 3.7 1.64±0.21 7 0.6 0.18-0.46
CG-14CH-134 Intergrowth 6 (67%) 4.1 -2.45±0.32 9 2.4 0.27-0.41 CG-14CH-133 Intergrowth 4 (40%) 4.0 -3.95±0.59 10 3.6 0.25-0.37
Cross-cutting vein 3 (100%) 2.4 -3.57±0.72 3 0.5 0.25-0.37
CG-14CH-137 0.5 mm thick vein 4 (67%) 4.2 -3.08±0.44 6 1.0 0.25-0.27
0.1 mm thick vein 2 (100%) 2.5 -2.20±1.90 2 0.3 0.25-0.27
CG-13CH-24 Vein 11 (100%) 1.6 6.13±0.15 11 0.8 0.30-0.43
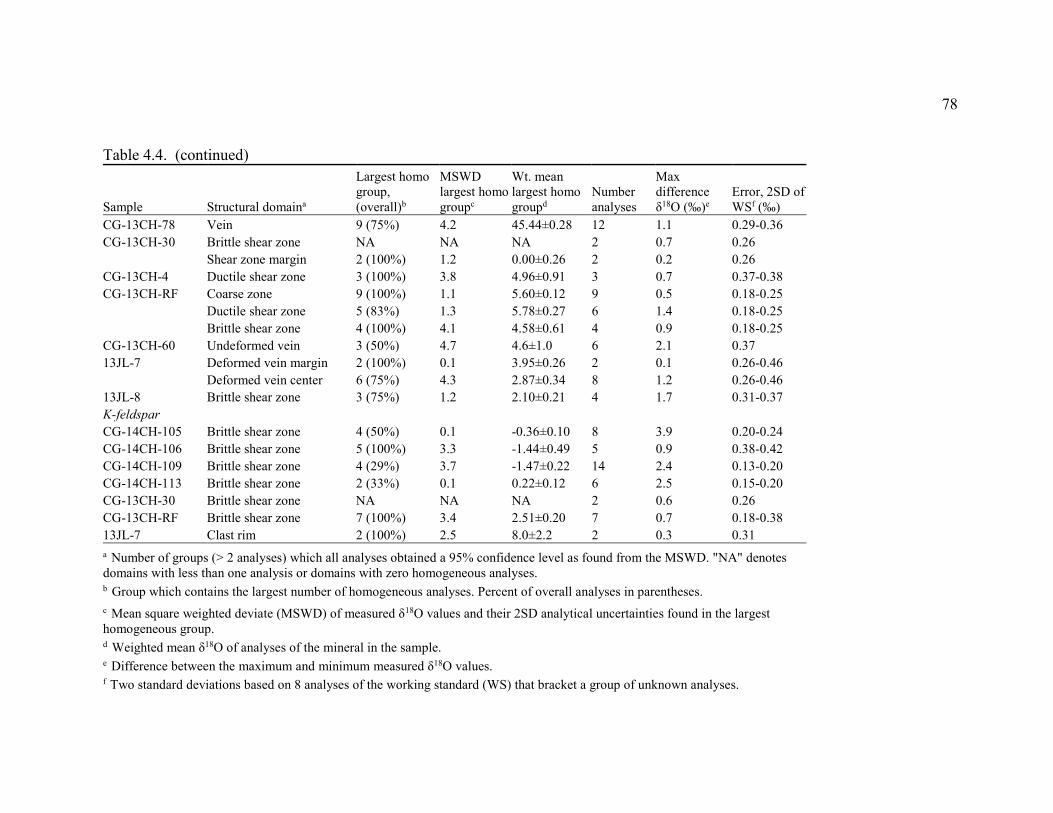
78
Table 4.4. (continued)
Sample Structural domaina
Largest homo group, (overall)b
MSWD largest homo groupc
Wt. mean largest homo groupd
Number analyses
Max difference δ18O (‰)e
Error, 2SD of WSf (‰)
CG-13CH-78 Vein 9 (75%) 4.2 45.44±0.28 12 1.1 0.29-0.36 CG-13CH-30 Brittle shear zone NA NA NA 2 0.7 0.26
Shear zone margin 2 (100%) 1.2 0.00±0.26 2 0.2 0.26
CG-13CH-4 Ductile shear zone 3 (100%) 3.8 4.96±0.91 3 0.7 0.37-0.38 CG-13CH-RF Coarse zone 9 (100%) 1.1 5.60±0.12 9 0.5 0.18-0.25
Ductile shear zone 5 (83%) 1.3 5.78±0.27 6 1.4 0.18-0.25
Brittle shear zone 4 (100%) 4.1 4.58±0.61 4 0.9 0.18-0.25
CG-13CH-60 Undeformed vein 3 (50%) 4.7 4.6±1.0 6 2.1 0.37 13JL-7 Deformed vein margin 2 (100%) 0.1 3.95±0.26 2 0.1 0.26-0.46
Deformed vein center 6 (75%) 4.3 2.87±0.34 8 1.2 0.26-0.46
13JL-8 Brittle shear zone 3 (75%) 1.2 2.10±0.21 4 1.7 0.31-0.37 K-feldspar
CG-14CH-105 Brittle shear zone 4 (50%) 0.1 -0.36±0.10 8 3.9 0.20-0.24 CG-14CH-106 Brittle shear zone 5 (100%) 3.3 -1.44±0.49 5 0.9 0.38-0.42 CG-14CH-109 Brittle shear zone 4 (29%) 3.7 -1.47±0.22 14 2.4 0.13-0.20 CG-14CH-113 Brittle shear zone 2 (33%) 0.1 0.22±0.12 6 2.5 0.15-0.20 CG-13CH-30 Brittle shear zone NA NA NA 2 0.6 0.26 CG-13CH-RF Brittle shear zone 7 (100%) 3.4 2.51±0.20 7 0.7 0.18-0.38 13JL-7 Clast rim 2 (100%) 2.5 8.0±2.2 2 0.3 0.31 a Number of groups (> 2 analyses) which all analyses obtained a 95% confidence level as found from the MSWD. "NA" denotes domains with less than one analysis or domains with zero homogeneous analyses. b Group which contains the largest number of homogeneous analyses. Percent of overall analyses in parentheses.
c Mean square weighted deviate (MSWD) of measured δ18O values and their 2SD analytical uncertainties found in the largest homogeneous group. d Weighted mean δ18O of analyses of the mineral in the sample.
e Difference between the maximum and minimum measured δ18O values. f Two standard deviations based on 8 analyses of the working standard (WS) that bracket a group of unknown analyses.
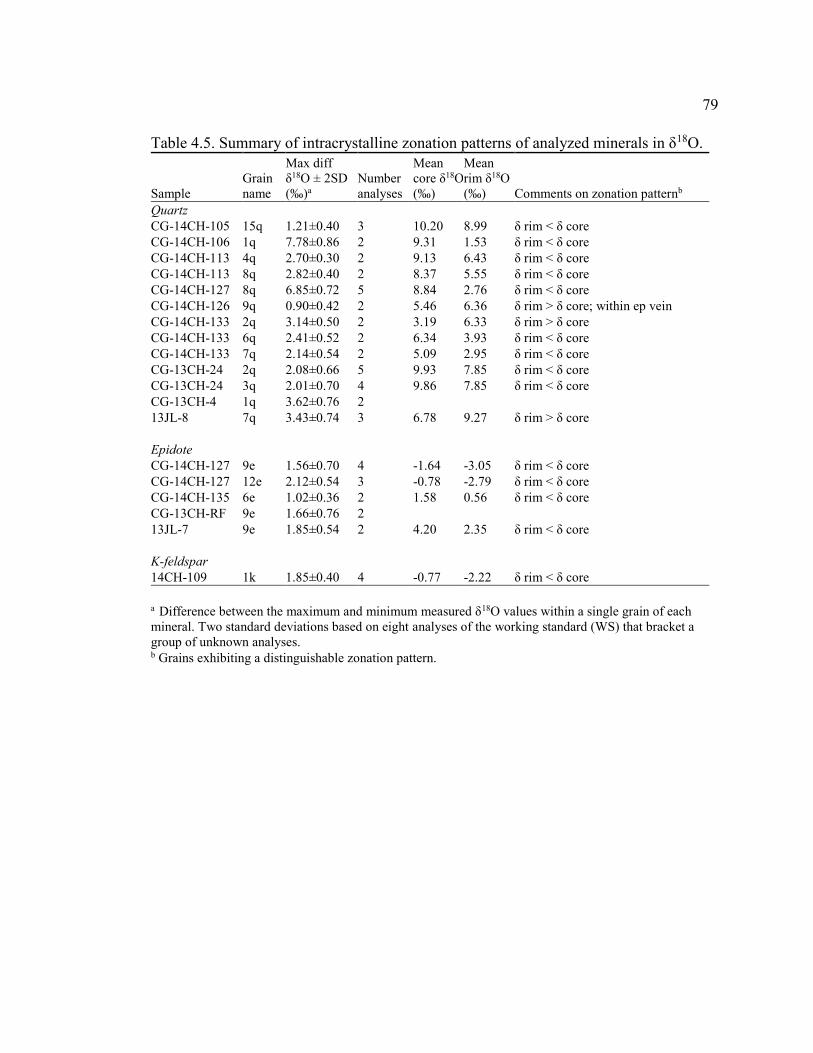
79
Table 4.5. Summary of intracrystalline zonation patterns of analyzed minerals in δ18O.
Sample Grain name
Max diff δ18O ± 2SD (‰)a
Number analyses
Mean core δ18O (‰)
Mean rim δ18O (‰) Comments on zonation patternb
Quartz CG-14CH-105 15q 1.21±0.40 3 10.20 8.99 δ rim < δ core
CG-14CH-106 1q 7.78±0.86 2 9.31 1.53 δ rim < δ core CG-14CH-113 4q 2.70±0.30 2 9.13 6.43 δ rim < δ core CG-14CH-113 8q 2.82±0.40 2 8.37 5.55 δ rim < δ core CG-14CH-127 8q 6.85±0.72 5 8.84 2.76 δ rim < δ core CG-14CH-126 9q 0.90±0.42 2 5.46 6.36 δ rim > δ core; within ep vein CG-14CH-133 2q 3.14±0.50 2 3.19 6.33 δ rim > δ core CG-14CH-133 6q 2.41±0.52 2 6.34 3.93 δ rim < δ core CG-14CH-133 7q 2.14±0.54 2 5.09 2.95 δ rim < δ core CG-13CH-24 2q 2.08±0.66 5 9.93 7.85 δ rim < δ core CG-13CH-24 3q 2.01±0.70 4 9.86 7.85 δ rim < δ core CG-13CH-4 1q 3.62±0.76 2
13JL-8 7q 3.43±0.74 3 6.78 9.27 δ rim > δ core
Epidote CG-14CH-127 9e 1.56±0.70 4 -1.64 -3.05 δ rim < δ core
CG-14CH-127 12e 2.12±0.54 3 -0.78 -2.79 δ rim < δ core CG-14CH-135 6e 1.02±0.36 2 1.58 0.56 δ rim < δ core CG-13CH-RF 9e 1.66±0.76 2
13JL-7 9e 1.85±0.54 2 4.20 2.35 δ rim < δ core
K-feldspar 14CH-109 1k 1.85±0.40 4 -0.77 -2.22 δ rim < δ core
a Difference between the maximum and minimum measured δ18O values within a single grain of each mineral. Two standard deviations based on eight analyses of the working standard (WS) that bracket a group of unknown analyses. b Grains exhibiting a distinguishable zonation pattern.
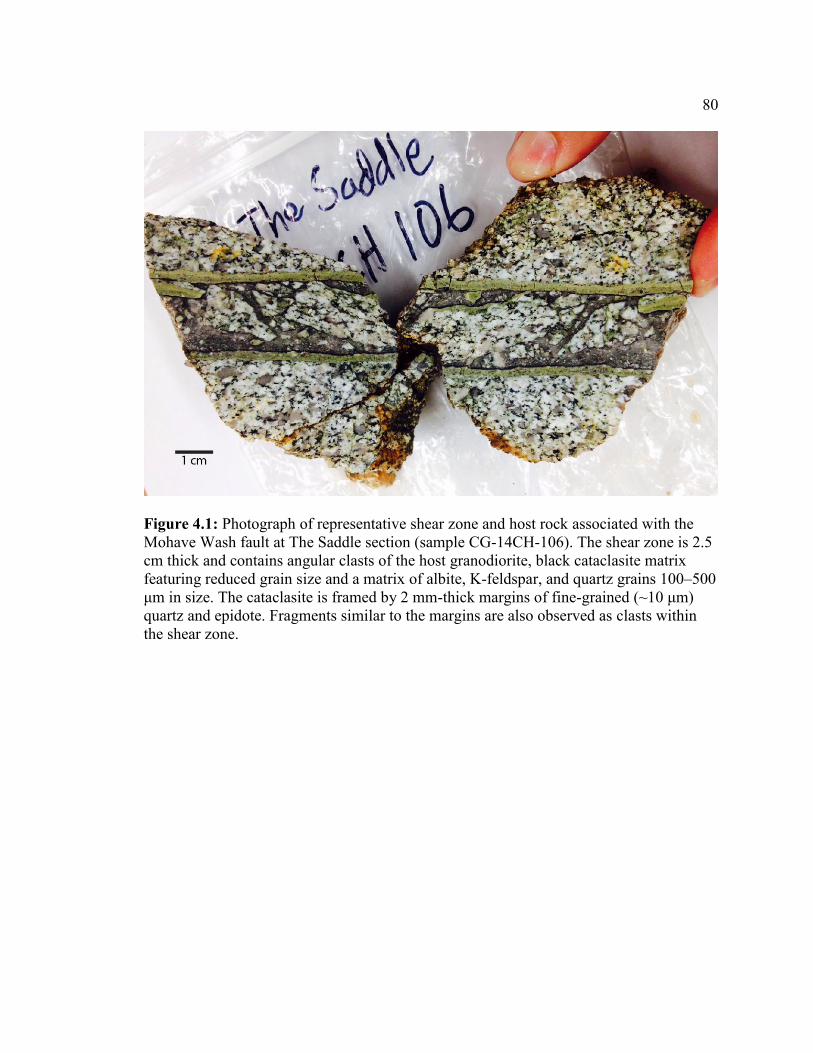
80
Figure 4.1: Photograph of representative shear zone and host rock associated with the Mohave Wash fault at The Saddle section (sample CG-14CH-106). The shear zone is 2.5 cm thick and contains angular clasts of the host granodiorite, black cataclasite matrix featuring reduced grain size and a matrix of albite, K-feldspar, and quartz grains 100–500 μm in size. The cataclasite is framed by 2 mm-thick margins of fine-grained (~10 μm) quartz and epidote. Fragments similar to the margins are also observed as clasts within the shear zone.
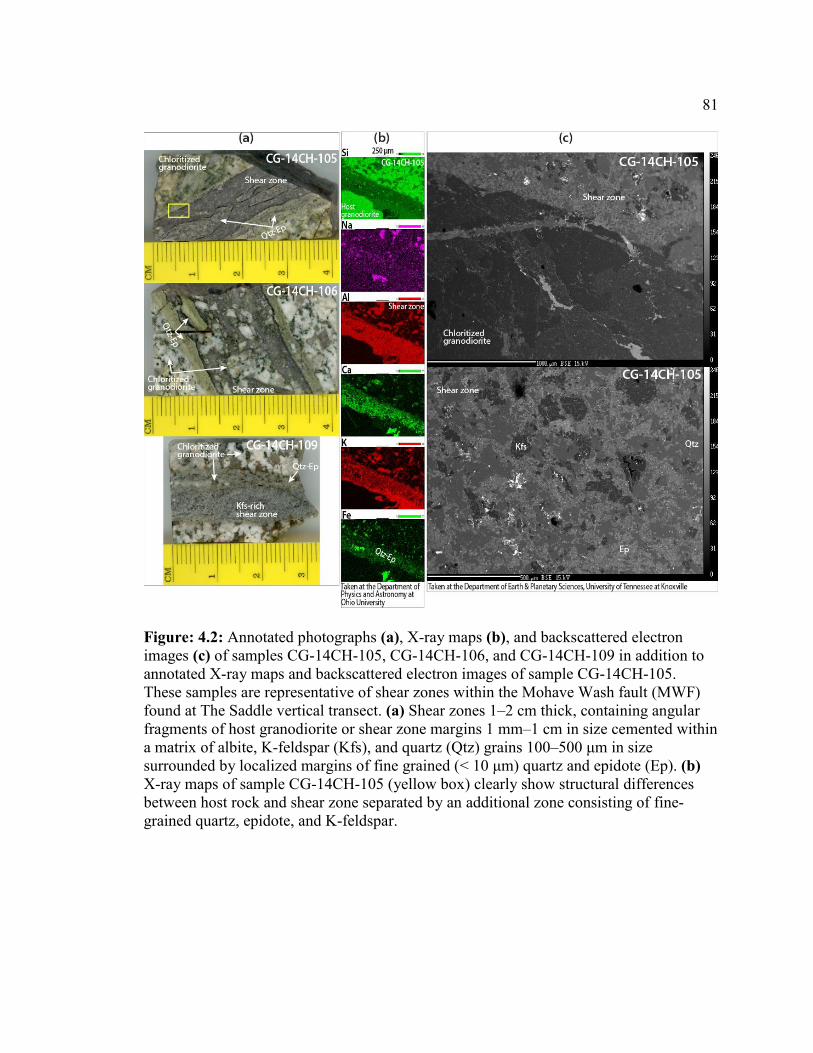
81
Figure: 4.2: Annotated photographs (a), X-ray maps (b), and backscattered electron images (c) of samples CG-14CH-105, CG-14CH-106, and CG-14CH-109 in addition to annotated X-ray maps and backscattered electron images of sample CG-14CH-105. These samples are representative of shear zones within the Mohave Wash fault (MWF) found at The Saddle vertical transect. (a) Shear zones 1–2 cm thick, containing angular fragments of host granodiorite or shear zone margins 1 mm–1 cm in size cemented within a matrix of albite, K-feldspar (Kfs), and quartz (Qtz) grains 100–500 μm in size surrounded by localized margins of fine grained (< 10 μm) quartz and epidote (Ep). (b) X-ray maps of sample CG-14CH-105 (yellow box) clearly show structural differences between host rock and shear zone separated by an additional zone consisting of fine-grained quartz, epidote, and K-feldspar.
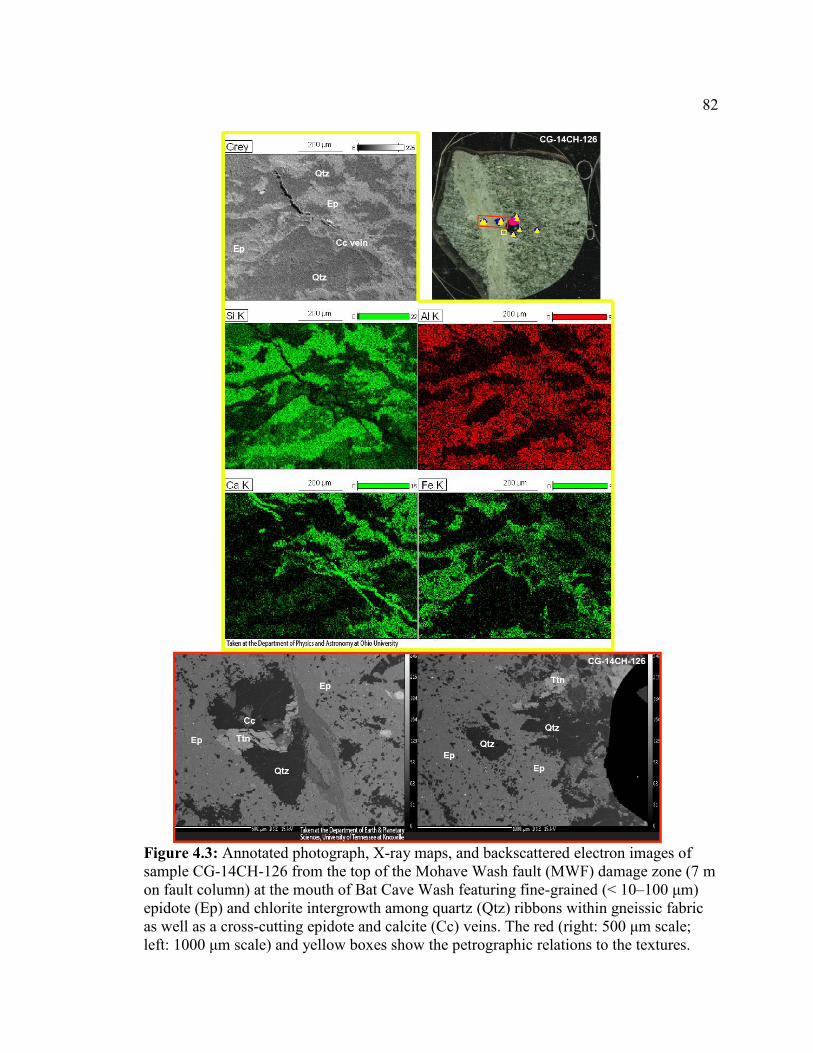
82
Figure 4.3: Annotated photograph, X-ray maps, and backscattered electron images of sample CG-14CH-126 from the top of the Mohave Wash fault (MWF) damage zone (7 m on fault column) at the mouth of Bat Cave Wash featuring fine-grained (< 10–100 μm) epidote (Ep) and chlorite intergrowth among quartz (Qtz) ribbons within gneissic fabric as well as a cross-cutting epidote and calcite (Cc) veins. The red (right: 500 μm scale; left: 1000 μm scale) and yellow boxes show the petrographic relations to the textures.
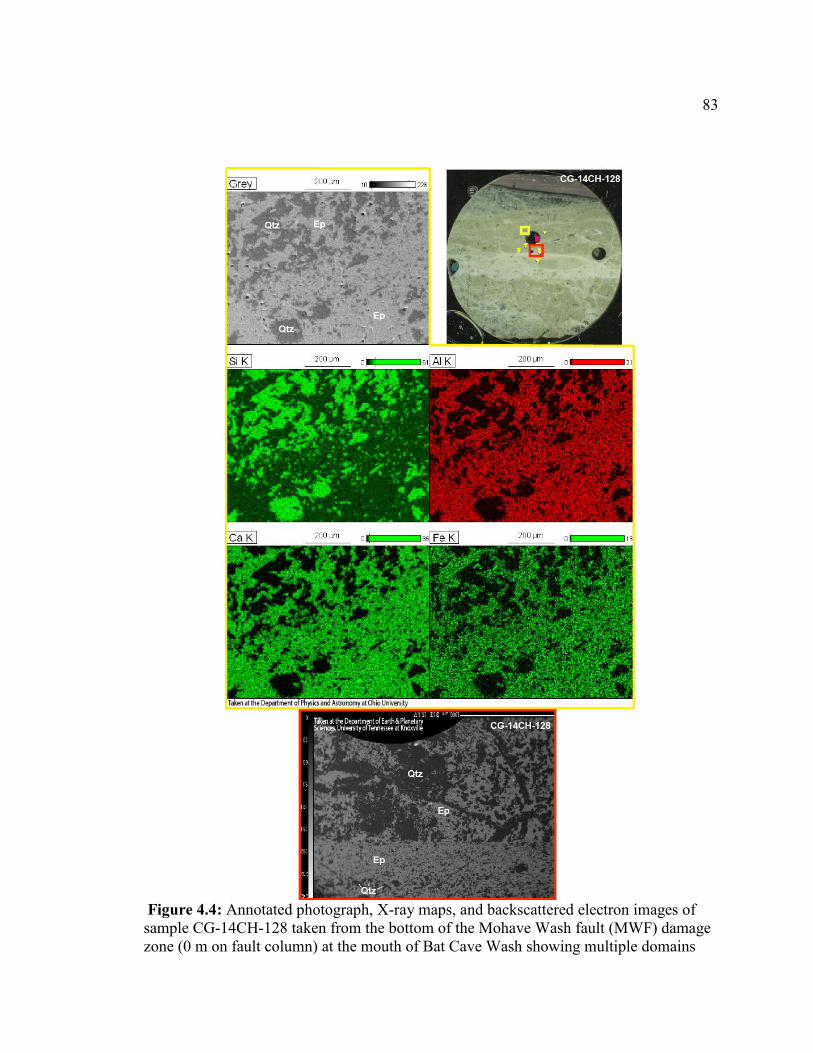
83
Figure 4.4: Annotated photograph, X-ray maps, and backscattered electron images of sample CG-14CH-128 taken from the bottom of the Mohave Wash fault (MWF) damage zone (0 m on fault column) at the mouth of Bat Cave Wash showing multiple domains
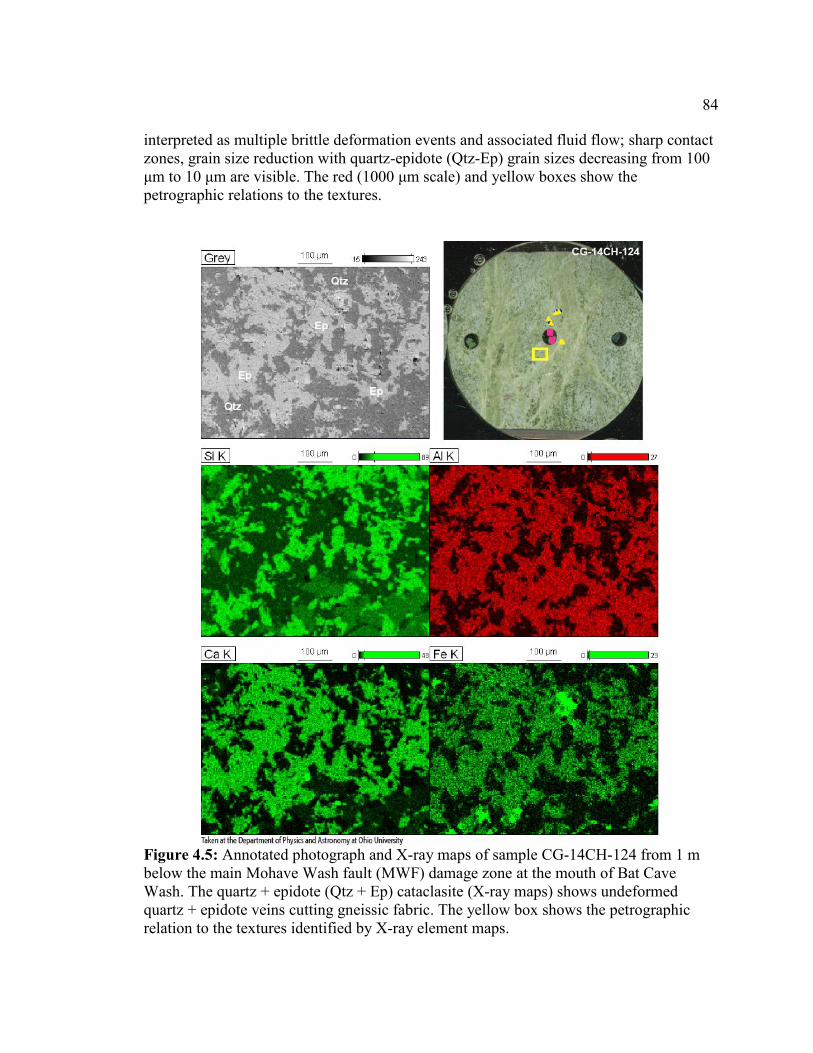
84
interpreted as multiple brittle deformation events and associated fluid flow; sharp contact zones, grain size reduction with quartz-epidote (Qtz-Ep) grain sizes decreasing from 100 μm to 10 μm are visible. The red (1000 μm scale) and yellow boxes show the petrographic relations to the textures.
Figure 4.5: Annotated photograph and X-ray maps of sample CG-14CH-124 from 1 m below the main Mohave Wash fault (MWF) damage zone at the mouth of Bat Cave Wash. The quartz + epidote (Qtz + Ep) cataclasite (X-ray maps) shows undeformed quartz + epidote veins cutting gneissic fabric. The yellow box shows the petrographic relation to the textures identified by X-ray element maps.
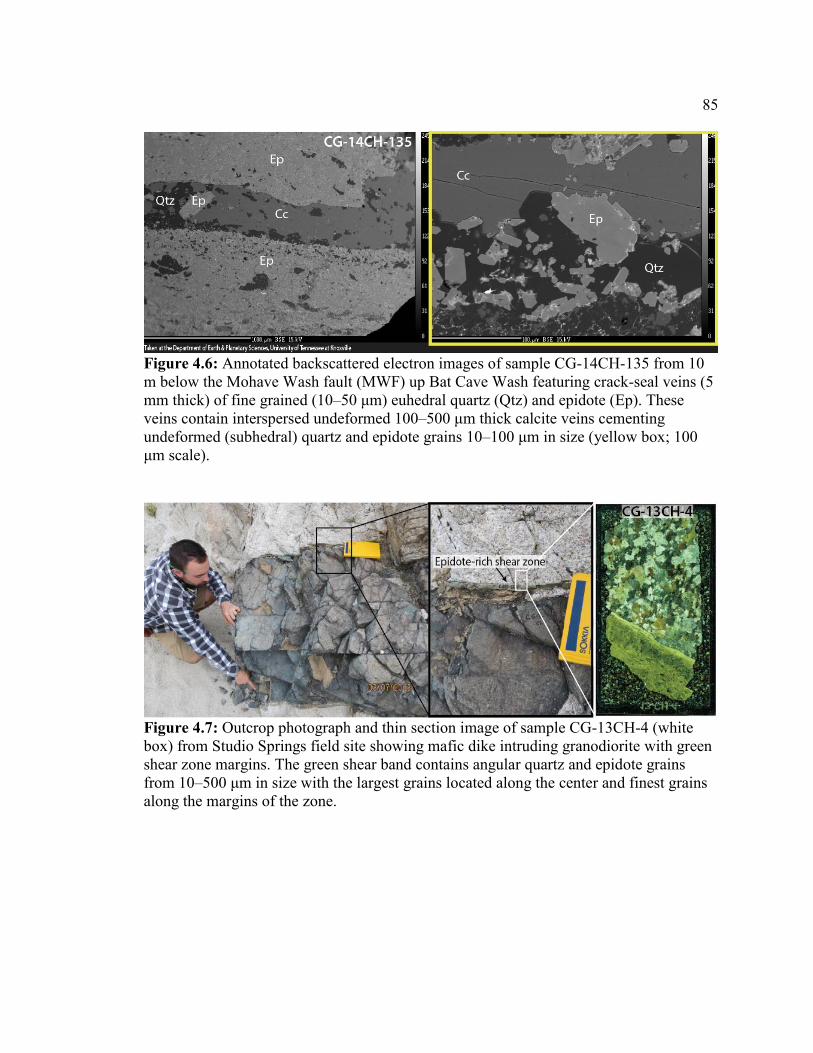
85
Figure 4.6: Annotated backscattered electron images of sample CG-14CH-135 from 10 m below the Mohave Wash fault (MWF) up Bat Cave Wash featuring crack-seal veins (5 mm thick) of fine grained (10–50 μm) euhedral quartz (Qtz) and epidote (Ep). These veins contain interspersed undeformed 100–500 μm thick calcite veins cementing undeformed (subhedral) quartz and epidote grains 10–100 μm in size (yellow box; 100 μm scale).
Figure 4.7: Outcrop photograph and thin section image of sample CG-13CH-4 (white box) from Studio Springs field site showing mafic dike intruding granodiorite with green shear zone margins. The green shear band contains angular quartz and epidote grains from 10–500 μm in size with the largest grains located along the center and finest grains along the margins of the zone.
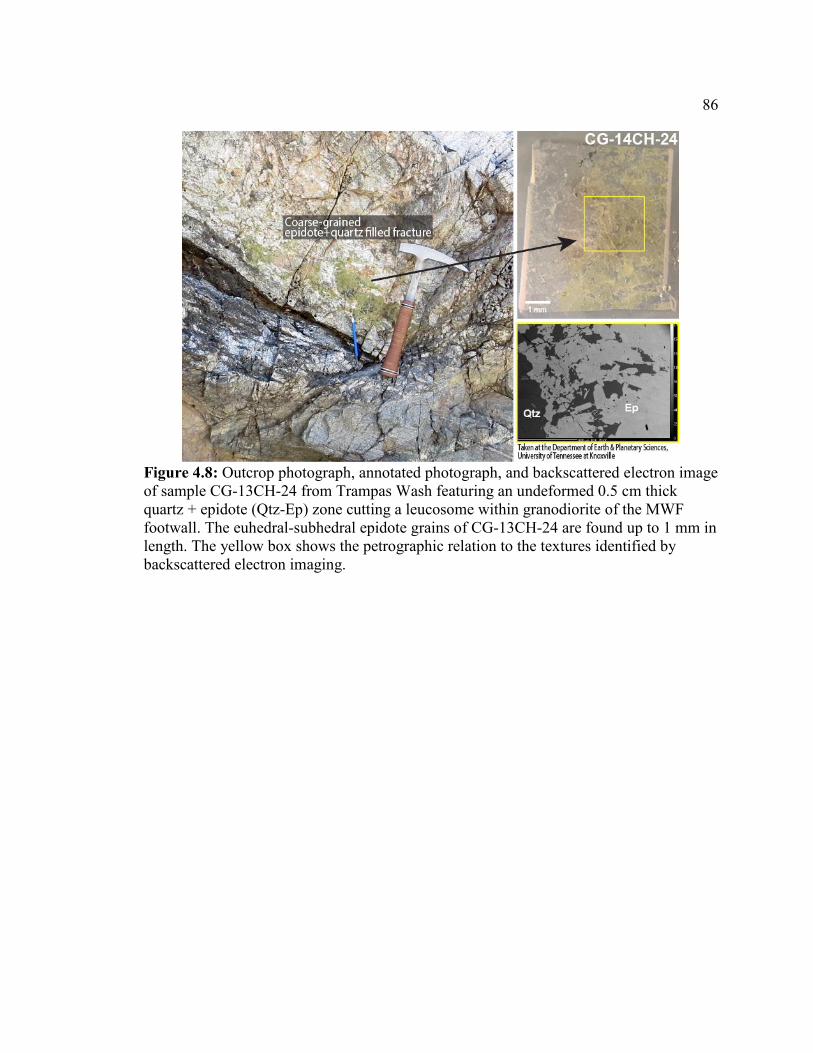
86
Figure 4.8: Outcrop photograph, annotated photograph, and backscattered electron image of sample CG-13CH-24 from Trampas Wash featuring an undeformed 0.5 cm thick quartz + epidote (Qtz-Ep) zone cutting a leucosome within granodiorite of the MWF footwall. The euhedral-subhedral epidote grains of CG-13CH-24 are found up to 1 mm in length. The yellow box shows the petrographic relation to the textures identified by backscattered electron imaging.
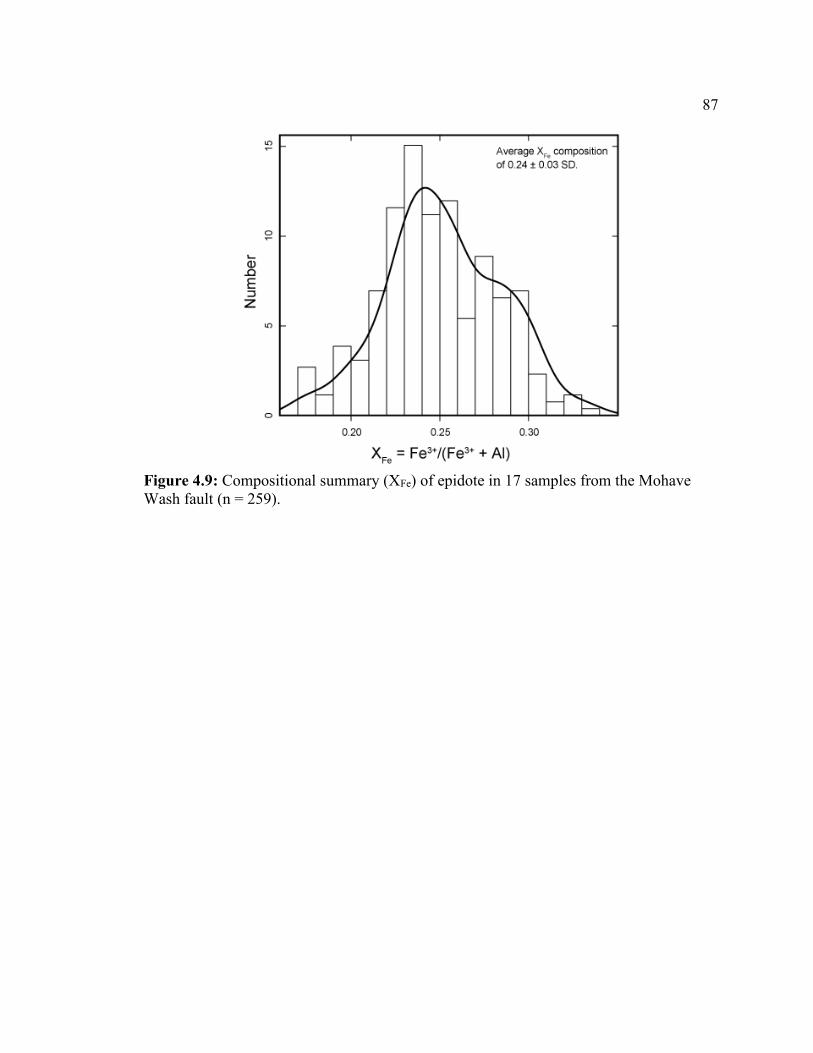
87
Figure 4.9: Compositional summary (XFe) of epidote in 17 samples from the Mohave Wash fault (n = 259).
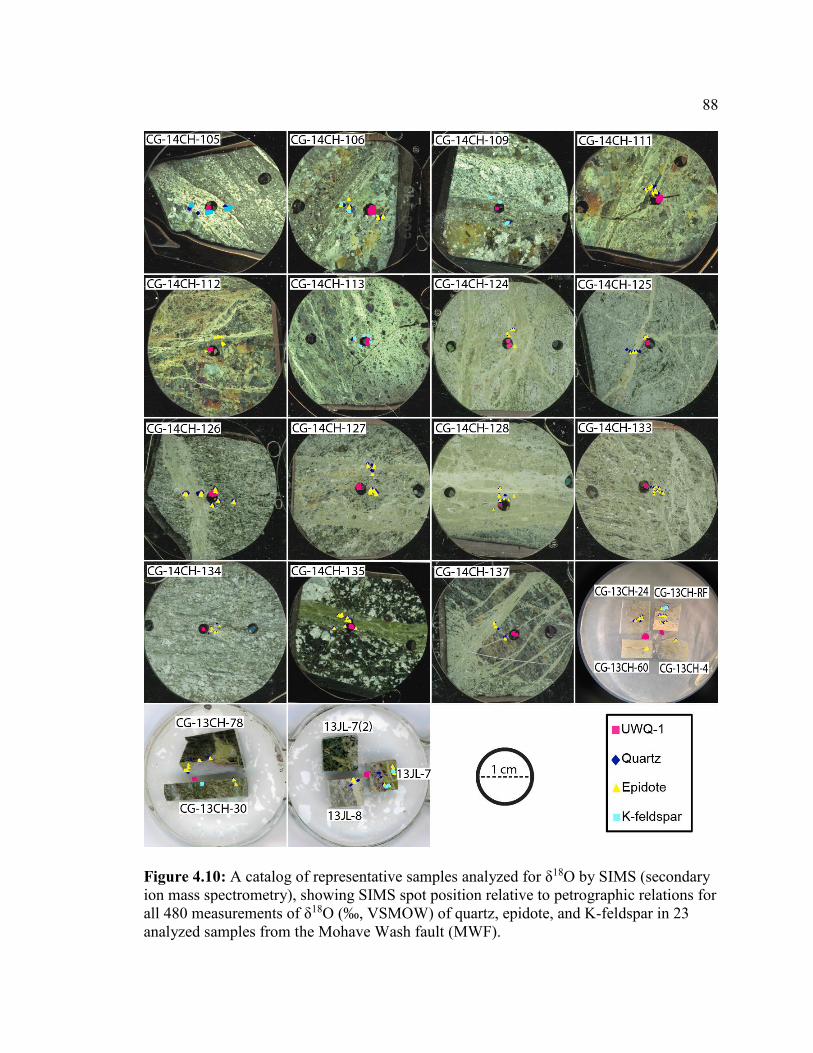
88
Figure 4.10: A catalog of representative samples analyzed for δ18O by SIMS (secondary ion mass spectrometry), showing SIMS spot position relative to petrographic relations for all 480 measurements of δ18O (‰, VSMOW) of quartz, epidote, and K-feldspar in 23 analyzed samples from the Mohave Wash fault (MWF).
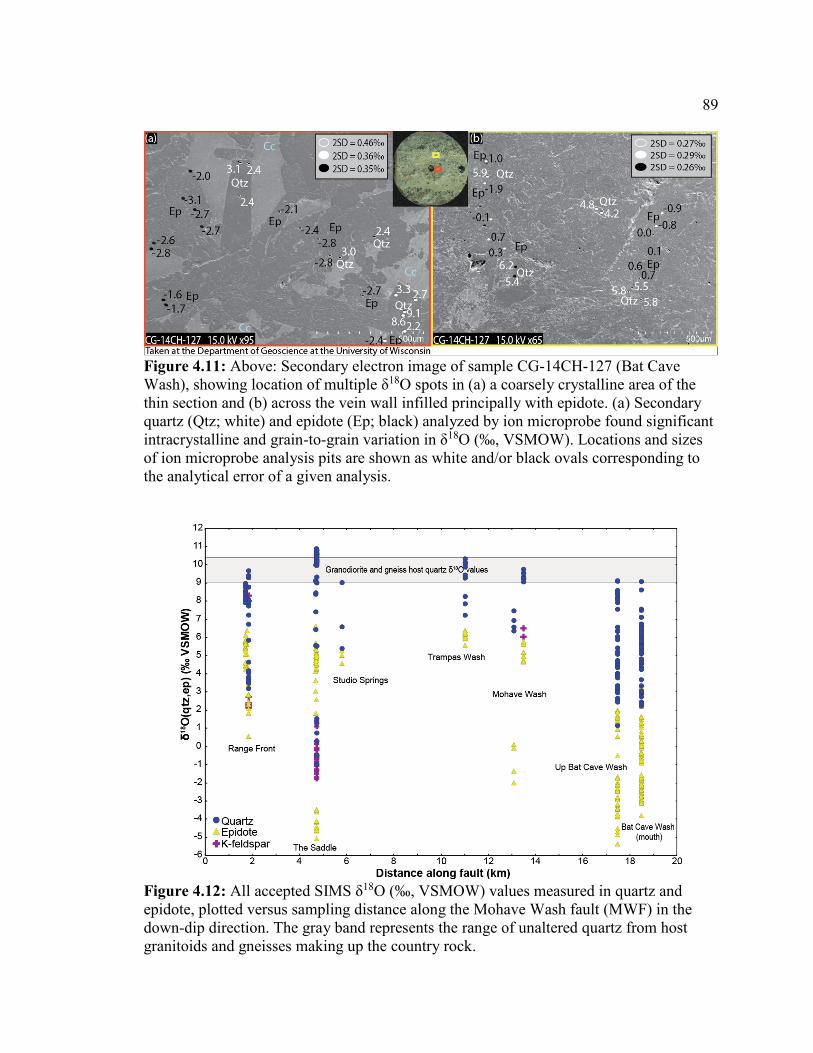
89
Figure 4.11: Above: Secondary electron image of sample CG-14CH-127 (Bat Cave Wash), showing location of multiple δ18O spots in (a) a coarsely crystalline area of the thin section and (b) across the vein wall infilled principally with epidote. (a) Secondary quartz (Qtz; white) and epidote (Ep; black) analyzed by ion microprobe found significant intracrystalline and grain-to-grain variation in δ18O (‰, VSMOW). Locations and sizes of ion microprobe analysis pits are shown as white and/or black ovals corresponding to the analytical error of a given analysis.
Figure 4.12: All accepted SIMS δ18O (‰, VSMOW) values measured in quartz and epidote, plotted versus sampling distance along the Mohave Wash fault (MWF) in the down-dip direction. The gray band represents the range of unaltered quartz from host granitoids and gneisses making up the country rock.
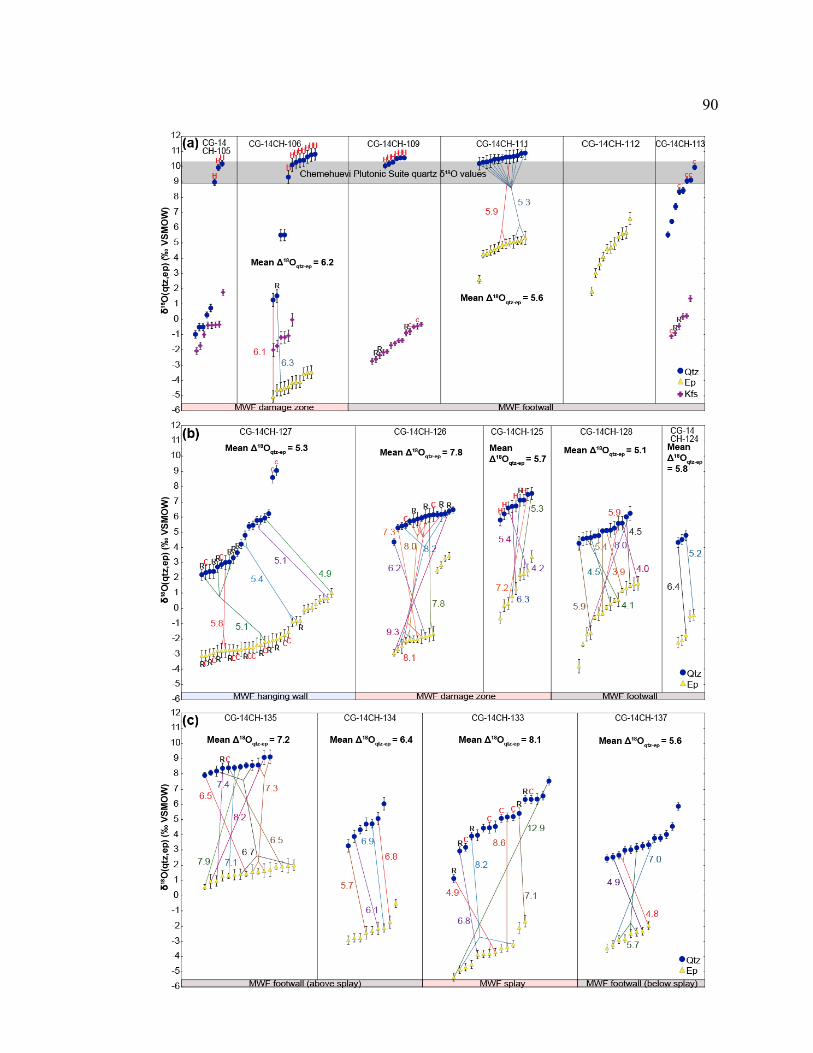
90
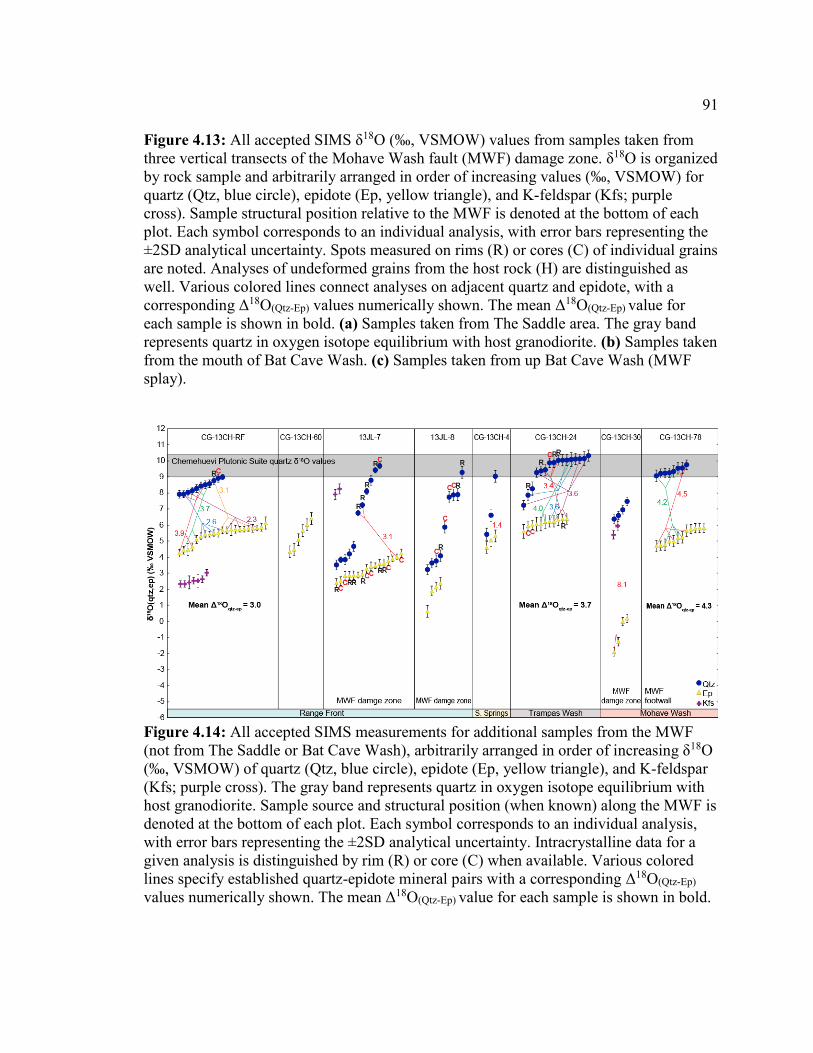
91
Figure 4.13: All accepted SIMS δ18O (‰, VSMOW) values from samples taken from three vertical transects of the Mohave Wash fault (MWF) damage zone. δ18O is organized by rock sample and arbitrarily arranged in order of increasing values (‰, VSMOW) for quartz (Qtz, blue circle), epidote (Ep, yellow triangle), and K-feldspar (Kfs; purple cross). Sample structural position relative to the MWF is denoted at the bottom of each plot. Each symbol corresponds to an individual analysis, with error bars representing the ±2SD analytical uncertainty. Spots measured on rims (R) or cores (C) of individual grains are noted. Analyses of undeformed grains from the host rock (H) are distinguished as well. Various colored lines connect analyses on adjacent quartz and epidote, with a corresponding Δ18O(Qtz-Ep) values numerically shown. The mean Δ18O(Qtz-Ep) value for each sample is shown in bold. (a) Samples taken from The Saddle area. The gray band represents quartz in oxygen isotope equilibrium with host granodiorite. (b) Samples taken from the mouth of Bat Cave Wash. (c) Samples taken from up Bat Cave Wash (MWF splay).
Figure 4.14: All accepted SIMS measurements for additional samples from the MWF (not from The Saddle or Bat Cave Wash), arbitrarily arranged in order of increasing δ18O (‰, VSMOW) of quartz (Qtz, blue circle), epidote (Ep, yellow triangle), and K-feldspar (Kfs; purple cross). The gray band represents quartz in oxygen isotope equilibrium with host granodiorite. Sample source and structural position (when known) along the MWF is denoted at the bottom of each plot. Each symbol corresponds to an individual analysis, with error bars representing the ±2SD analytical uncertainty. Intracrystalline data for a given analysis is distinguished by rim (R) or core (C) when available. Various colored lines specify established quartz-epidote mineral pairs with a corresponding Δ18O(Qtz-Ep) values numerically shown. The mean Δ18O(Qtz-Ep) value for each sample is shown in bold.
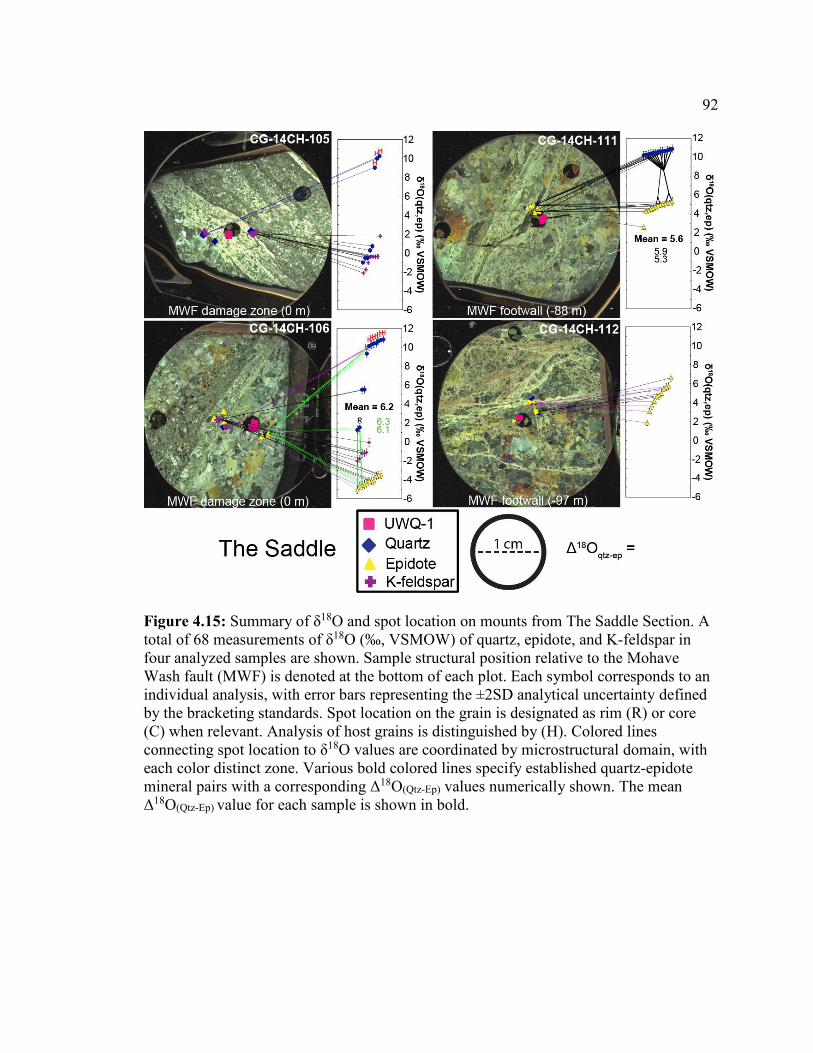
92
Figure 4.15: Summary of δ18O and spot location on mounts from The Saddle Section. A total of 68 measurements of δ18O (‰, VSMOW) of quartz, epidote, and K-feldspar in four analyzed samples are shown. Sample structural position relative to the Mohave Wash fault (MWF) is denoted at the bottom of each plot. Each symbol corresponds to an individual analysis, with error bars representing the ±2SD analytical uncertainty defined by the bracketing standards. Spot location on the grain is designated as rim (R) or core (C) when relevant. Analysis of host grains is distinguished by (H). Colored lines connecting spot location to δ18O values are coordinated by microstructural domain, with each color distinct zone. Various bold colored lines specify established quartz-epidote mineral pairs with a corresponding Δ18O(Qtz-Ep) values numerically shown. The mean Δ18O(Qtz-Ep) value for each sample is shown in bold.
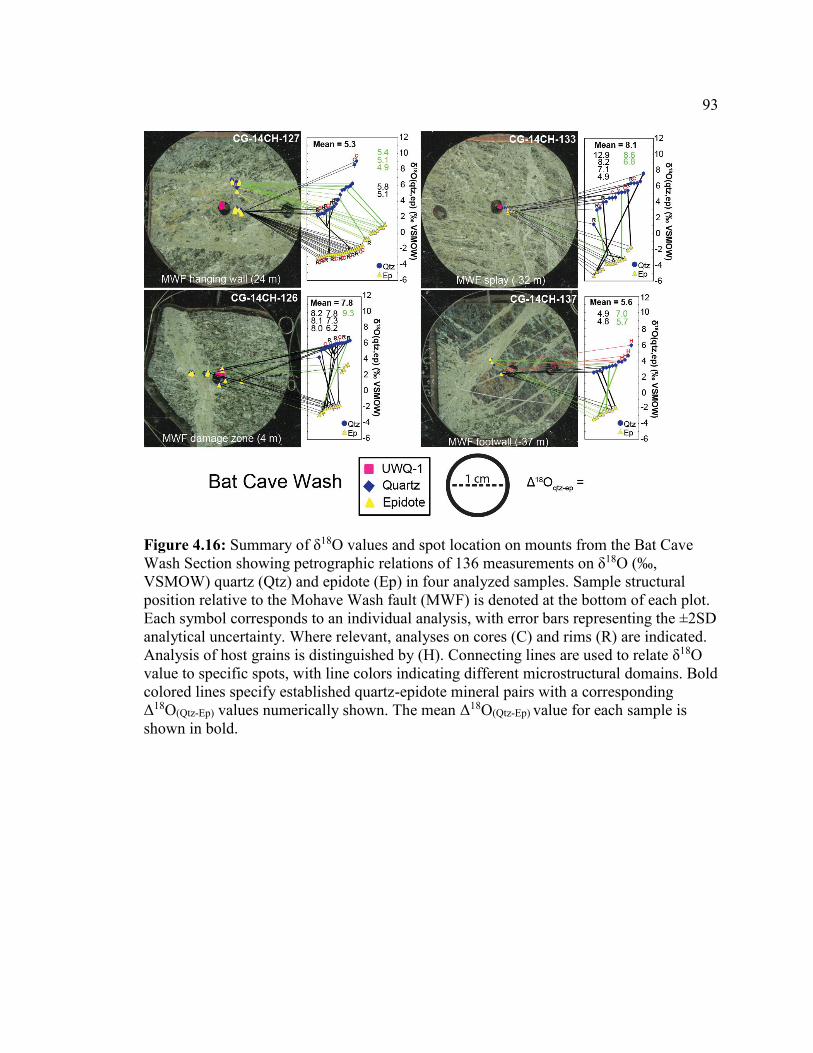
93
Figure 4.16: Summary of δ18O values and spot location on mounts from the Bat Cave Wash Section showing petrographic relations of 136 measurements on δ18O (‰, VSMOW) quartz (Qtz) and epidote (Ep) in four analyzed samples. Sample structural position relative to the Mohave Wash fault (MWF) is denoted at the bottom of each plot. Each symbol corresponds to an individual analysis, with error bars representing the ±2SD analytical uncertainty. Where relevant, analyses on cores (C) and rims (R) are indicated. Analysis of host grains is distinguished by (H). Connecting lines are used to relate δ18O value to specific spots, with line colors indicating different microstructural domains. Bold colored lines specify established quartz-epidote mineral pairs with a corresponding Δ18O(Qtz-Ep) values numerically shown. The mean Δ18O(Qtz-Ep) value for each sample is shown in bold.
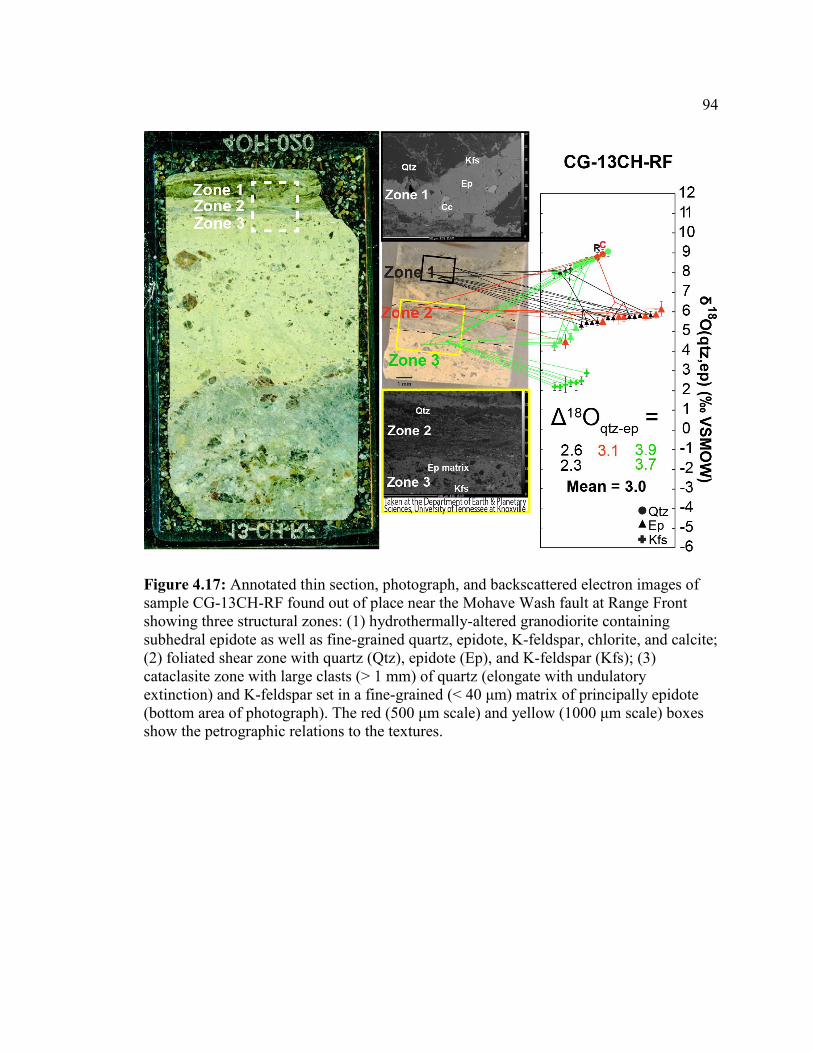
94
Figure 4.17: Annotated thin section, photograph, and backscattered electron images of sample CG-13CH-RF found out of place near the Mohave Wash fault at Range Front showing three structural zones: (1) hydrothermally-altered granodiorite containing subhedral epidote as well as fine-grained quartz, epidote, K-feldspar, chlorite, and calcite; (2) foliated shear zone with quartz (Qtz), epidote (Ep), and K-feldspar (Kfs); (3) cataclasite zone with large clasts (> 1 mm) of quartz (elongate with undulatory extinction) and K-feldspar set in a fine-grained (< 40 μm) matrix of principally epidote (bottom area of photograph). The red (500 μm scale) and yellow (1000 μm scale) boxes show the petrographic relations to the textures.
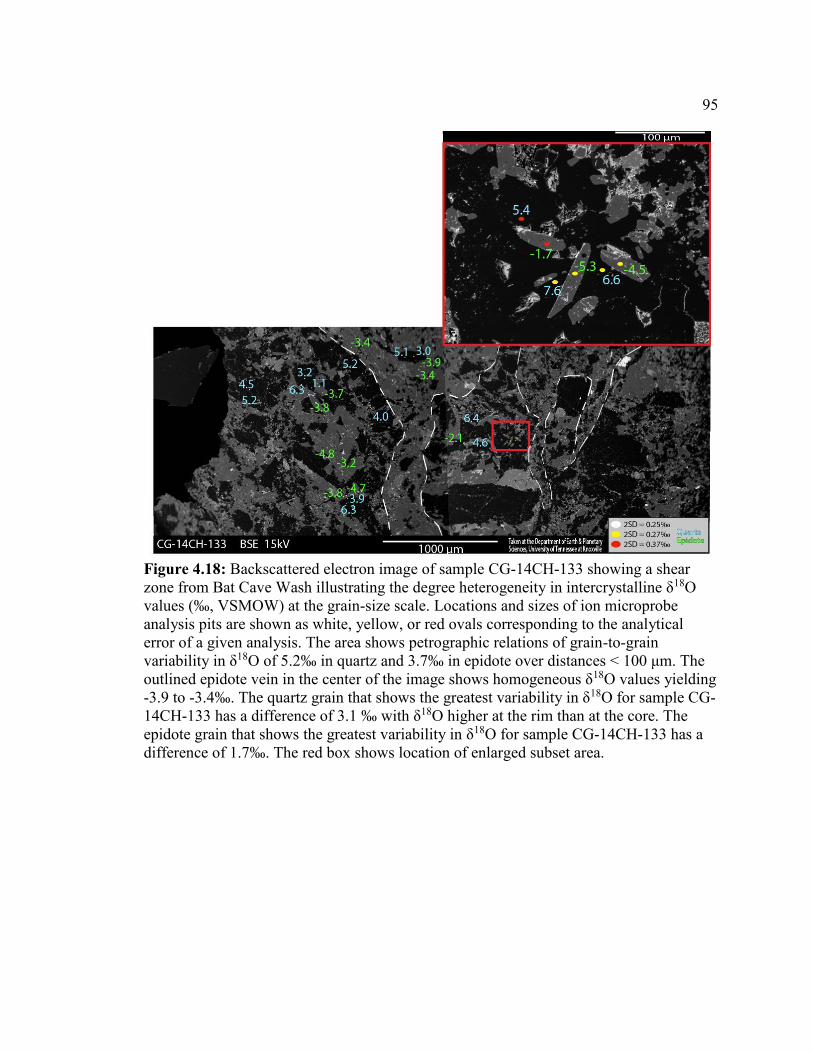
95
Figure 4.18: Backscattered electron image of sample CG-14CH-133 showing a shear zone from Bat Cave Wash illustrating the degree heterogeneity in intercrystalline δ18O values (‰, VSMOW) at the grain-size scale. Locations and sizes of ion microprobe analysis pits are shown as white, yellow, or red ovals corresponding to the analytical error of a given analysis. The area shows petrographic relations of grain-to-grain variability in δ18O of 5.2‰ in quartz and 3.7‰ in epidote over distances < 100 μm. The outlined epidote vein in the center of the image shows homogeneous δ18O values yielding -3.9 to -3.4‰. The quartz grain that shows the greatest variability in δ18O for sample CG-14CH-133 has a difference of 3.1 ‰ with δ18O higher at the rim than at the core. The epidote grain that shows the greatest variability in δ18O for sample CG-14CH-133 has a difference of 1.7‰. The red box shows location of enlarged subset area.
96
5. Discussion
5.1 Evidence for early fluid-infiltration along the Mohave Wash fault
The Mohave Wash fault (MWF) is characterized as an intensely fractured horizon
dipping at a low-angle across the field area. It is recognizable in the field as poorly
outcropping, and greenish in color such that it contrasts with the surrounding granitic and
gneissic hosts. Field and thin section observations indicate that the coloration is primarily
due to the abundance of greenschist facies mineral assemblages including chlorite and
epidote. Mineralization is concentrated along shear zones, veins, and along grain
boundaries of the host rocks in some instances. These observations indicate that fluids
were mobile along the MWF zone, if not at initiation then immediately following fault
initiation. A lack of hydrothermal alteration and abundance of LANF-related
pseudotachylyte has been previously reported by Prante et al. (2013) in the West Salton
Detachment, CA. This observation supports the suggestions of Sibson et al. (1975) that
pseudotachylyte is preferentially generated in “dry” conditions (i.e., lack of hydrothermal
fluids). The presence of only one pseudotachylyte found and a lack of fault-related gouge
over two extensive sampling seasons of the MWF further suggest that fluids were present
in an early “wet” slip history.
The modification of granodiorite or gneiss found in the Chemehuevi Mountains
into rocks dominated by chlorite-epidote mineralization requires infiltration of a fluid.
Mineralization can occur within gneiss through the infiltration of H2O and replacement of
biotite and calcic plagioclase by chlorite, epidote, calcite, and titanite. Mineralization can
occur within granodiorite through the infiltration of H2O and replacement of calcic
97
plagioclase and orthoclase by epidote, muscovite, quartz, and sodic plagioclase. Epidote
within the Chemehuevi Plutonic Suite is found to exhibit secondary textures such as
mineral replacement and vein-fill. Tulloch (1979) determined that epidote formed under
typical magmatic conditions yield iron (XFe) contents of XFe = 0.25–0.29, whereas
epidote from the alteration of plagioclase typically yields lower XFe = 0.0–0.24, and
epidote formed by alteration of biotite yields XFe = 0.36–0.48, although overlap between
these ranges is probable. Epidote XFe values from all samples of the MWF are most
consistent with the ranges described for epidote formed from plagioclase alteration, and
crystallization under magmatic conditions. There is a hint of a correlation between XFe
and δ18O, but grain-to-grain correlations were not made during analysis owing to the
typically-uniform XFe composition observed in each individual rock (Figure 5.1). While
epidote compositions were found to be quite uniform, and likely formed dominantly
through alteration of plagioclase, δ18O values are varied and monitor changes in fluid
composition and the temperature at which alteration occurred.
5.2 Miocene fluid-rock interaction
Quartz of undeformed host granodiorite to the MWF analyzed by ion microprobe
yield δ18O values from 9.0 to 10.4‰, similar to Chemehuevi Plutonic Suite host rocks
analyzed by laser fluorination and reported by MacDonald (2014) of 8.9 to 10.3‰
(Figures 4.13, 4.14). Analyses of quartz within the gneissic fabric of the Precambrian
gneisses separated by < 100 μm from epidote vein-fill (samples: CG-14CH-125, CG-
14CH-137) gives lower δ18O values from ~4 to 7‰ (Figure 4.16). These results support
98
data from MacDonald (2014) from whole-rock analysis of host quartz in the gneissic
fabric of the Precambrian gneiss with a δ18O value of 5.0‰ hosting a 1 cm thick
cataclasite. MacDonald (2014) reports quartz collected from a leucosome within gneiss
yielding a δ18O value of 9.1‰. The nominal protolith quartz δ18O value from the
Precambrian gneiss section is taken to be > 9‰, with lower values interpreted as protolith
quartz contacting shear zone and vein margins which exchanged oxygen during
deformation and fluid flow.
Mineral analyses from shear zones and vein-fill within the MWF damage zone in
granodiorite at The Saddle yield δ18O values ranging from -1.0 to 5.5‰ for quartz and -
5.1 to -3.5‰ for epidote (Figures 4.13, 4.14). Mineral analyses from vein-fill within the
MWF damage zone (and splay) in gneisses at Bat Cave Wash yield δ18O values ranging
from 1.1 to 7.6‰ for quartz and -5.3 to 3.4‰ for epidote (Figures 4.13, 4.14). Data from
similar microstructures analyzed by MacDonald (2014) gave δ18O values as low as -0.1‰
and -1.5‰, respectively, for quartz and epidote mineral separates from the MWF damage
zone. Mineral analyses from all shear zones and vein-fill associated with MWF
deformation within granodiorite yield δ18O values ranging from -1.0 to 10.9‰ for quartz
and -5.1 to 6.6‰ for epidote (Figures 4.13, 4.14). Mineral analyses from all vein-fill
associated with MWF deformation within gneisses yield δ18O values ranging from 1.1 to
10.3‰ for quartz and -5.3 to 6.4‰ for epidote (Figures 4.13, 4.14). The δ18O values
identified within deformation zones along the MWF are interpreted to be the result of
oxygen isotope exchange with fluids of different compositions. The extensive low-δ18O
values identified, typically from samples within the MWF damage zone, are likely
precipitated from surface-derived fluids. Low-δ18O values either originate as meteoric
99
fluids (δ18O < -5‰) that were shifted by water-rock interactions, or evaporative brines
forming in half-grabens developing at the surface during extension of the upper crust
(Roddy et al., 1988). Higher δ18O values identified are interpreted as fluid compositions
available during the early stages of fracturing.
The δ18O of magmatic epidote in equilibrium with quartz from host granodiorite
(δ18O(Qtz) = 9.0 to 10.4‰) or gneiss (δ18O(Qtz) = 9.0‰) would be 6.1-7.7‰ (Δ18O(Qtz-Ep) =
δ18OQtz - δ18OEp = 2.9‰) using the oxygen isotope fractionation factor of Matthews
(1994) for a temperature of 600°C. This range serves as a comparison for interpreting
shifts in δ18O values for secondary epidote. Samples CG-13CH-60, CG-13CH-RF, and
CG-14CH-112 give a single analysis of δ18O for epidote within the range in equilibrium
with host granodiorite (Figures 4.13, 4.14), but intercrystalline variability and textural
evidence (i.e., located in hydrothermally-altered cataclasite) is taken to indicate that these
samples experienced externally sourced fluids as well. Only epidote from sample CG-
13CH-24 falls within the range of magmatic equilibrium with gneiss defined by the
calibration of Matthews (1994), having homogeneous δ18O(Ep) values of 6.1 ± 0.2‰. The
composition of epidote from this sample (XFe = 0.29) is also compatible with magmatic
epidote from Tulloch (1979). However, outcrop relations for this microstructure clearly
indicate formation as a fracture hosting coarse epidote and quartz, which was in turn cut
by a thin, subhorizontal cataclasite (Figure 4.8). The sample therefore reflects an end-
member for fluid compositions available during the early stages of fracturing and is
consistent with dewatering of the country rocks with no contribution from surface-
derived fluids. The temperature calculated from coexisting quartz and epidote in CH-24
is 500°C, which is ~100°C higher than the temperature estimated for the footwall at the
100
same location obtained from thermochronology (Trampas Wash; John and Foster 1993).
Assuming the quartz and epidote in this sample are isotopically equilibrated, these
observations constrain the incipient fluids moving at depth prior to uplift and cooling of
the footwall recorded by thermochronometry. It could not be determined whether the
location of this sample at the base of the Mohave Wash fault is reflective of a weak zone
where faulting later was initiated or whether its occurrence here is fortuitous (i.e.,
cracking occurred throughout the eventual footwall during the early stage of extension).
5.3 Grain-scale oxygen isotope variability
Oxygen isotope exchange disequilibrium is preserved at grain-scale in fault rocks
of the MWF, both within and outlying the main damage zone. Disequilibrium is indicated
by significant variations in δ18O(mineral) and can be found within a given sample in areas <
1 mm2 (e.g., Figure 4.17). This observation, along with the fine-grain size of minerals in
this study brings into question the accuracy of larger volume multigrain analyses by laser
fluorination that were carried out historically for the application of thermometry. In this
study, an average of 73% of the spots analyzed within each individual microstructure
(area < 1 mm2) define a homogeneous population (δ18O(mineral); Section 4.3.2). Of 31
analyzed microstructural domains containing quartz, only four contained populations in
which <50 % of the spots defined a homogeneous group of δ18O(Qtz). Nineteen
microstructural domains exhibited populations in which > 75% of the spots analyzed
defined a homogeneous group. Of 32 analyzed microstructural domains containing
epidote, only four were found to contain populations < 50 % homogeneous δ18O(Ep)
101
values, and 18 were found to be > 75% homogeneous. In other words, a small portion of
a typical microstructure contains outliers relative to the dominant group, thus defining
heterogeneous δ18O(mineral) at grain-scale. Homogeneous microstructural domains at grain-
scale provide more confidence that mineral pairs define meaningful temperatures using
oxygen isotope thermometry. Bowman et al. (1994) stated that the variability in oxygen
isotope composition for a given rock is dependent on the rate of fluid infiltration, rate of
diffusion, rate of isotopic exchange and transportation, and the oxygen isotope ratio.
Thus, the variation of initial and final oxygen isotope composition for a given rock and a
given fluid is strongly influenced by permeability (i.e., fluid flow pathways). Adjacent
grains that appear to be in texturally equilibrium with one another can therefore have
significant variations in δ18O(mineral) due to differences in oxygen isotope exchange events
at the μm–mm scale (capable of being analyzed by ion microprobe), and this can be
difficult to identify independent of reproducible temperatures recorded in multiple pairs
from a given microstructure. Variable temperatures in a rock could record a down-
temperature evolution of fluid-rock interactions, but they might also reflect
disequilibrium if not clearly associated with structural evolution based on textural
analysis.
5.3.1 Ion microprobe data verses conventional analyses of isotope composition
Correlating δ18O values acquired by MacDonald (2014), using laser fluorination
methods assessed the accuracy of the ion microprobe measurements of quartz and
epidote. Laser fluorination analyses were made on multi-grain quartz-epidote mineral
pairs separated from thin rock chips. Samples CG-13CH-30, CG-13CH-4, CG-13CH-60,
102
CG-13CH-RF, CG-13CH-24, CG-13CH-78, and 13JL-7 were used for the comparison
between the two techniques. Efforts were made to sample the same structural domain by
ion microprobe as Macdonald (2014) sampled for laser fluorination analysis (Figure 5.2).
In comparing ion microprobe data with the laser fluorination data, it is clear that the ion
microprobe spots record variable δ18O relative to laser fluorination in excess of the
slightly worse precision. However, mean δ18O of ion microprobe values for each sample
are typically quite similar to the δ18O values measured by laser fluorination. Four samples
yield significant differences in mean δ18O values (> 1‰) between the two techniques,
including samples CG-13CH-4, CG-13CH-60, CG-13CH-RF, and 13JL-7. The exact
cause of this discrepancy is unknown, but is most likely that the aliquots selected for laser
fluorination were mineralogically impure.
5.4 Calculated temperatures of in situ mineral pairs
In order for oxygen isotope equilibrium temperatures to provide meaningful
constraints, mineral pairs must have equilibrated during the same event. SIMS analyses
were used to minimize disequilibrium caused by spatial variations in fluid flow and
oxygen isotope exchange, which based on the observed inter- and intra crystalline
heterogeneity can be significant. Apparent temperatures were calculated on rims of
adjacent grains of quartz, epidote, and K-feldspar using the temperature-dependent
oxygen isotope fractionation defined by Matthews (1994) and Zheng (1993), and
measured Δ18O(Qtz-min) (= δ18OQtz - δ18OEp or Kfs) from in situ mineral pairs both within and
outlying the main damage zone of the MWF. None of the 11 adjacent quartz and feldspar
103
grains from samples analyzed considered likely to be in equilibrium. A total of 68
apparent temperatures were calculated from adjacent quartz and epidote grains, and found
to range from 138 to 963°C (Figure 5.3; Tables 5.1, 5.2). Uncertainties in the calculated
temperatures are estimated by the combined analytical error of quartz and epidote and are
on average ±30°C at 350°C.
The highest temperature of 963°C was observed in the Studio Springs area from
sample CG-13CH-4, collected 1 cm from a mafic dike. The high-δ18O values measured in
quartz (5.4 to 9.0‰) and epidote (4.6 to 5.3‰) indicates that the fluids with which they
were equilibrated were also high (6.4‰). Therefore, the anomalously high temperatures
calculated for this shear zone are likely related to fluids that circulated as a result of dike
injection. Excluding the temperature calculated from sample CG-13CH-4, the observed
temperature range associated with faulting and fluid flow along the MWF is 138–702°C.
The lowest temperatures were observed from the structurally deepest fault rocks
at the Bat Cave Wash sampling area, which would have been at the highest temperatures
when faulting and uplift initiated. These rock samples were found to have abundant
cross-cutting epidote-rich veins within greenschist intergrowth among gneissic fabric
(Figure 3.2). The lowest recorded temperature was from rock sample CG-14CH-133
collected from the middle of a 1-m thick cataclasite zone interpreted as a splay to the
MWF, and exposed within the MWF footwall (Figures 3.2, 4.16, 4.18). This sample
yielded a temperature range of 138–395°C, with an average recorded temperature of
264°C. The highest recorded temperatures are ~50-100°C lower than temperatures
estimated for the footwall at initiation (23 Ma) based on thermochronometry (John and
Foster, 1993). The low temperatures raise the possibility that this splay could have been
104
active (or reactivated) after the initial period of uplift at fault initiation. The low-δ18O
values measured in quartz (1.1 to 7.6‰) and epidote (-5.3 to -1.7‰) indicate that the
fluids with which they were equilibrated were also low (-5.8 to -2.7‰), and surface-
derived.
Considering the relatively high variability in recorded temperatures of 6–220°C
within a single microstructural domain of a rock sample (characteristic from samples of
the damage zone; Table 5.2), it is clear that these sections do not record a simple thermal
structure involving equilibrium with a single fluid flow event at the time of MWF
initiation. Instead, the large variability observed throughout the MWF damage zone is
interpreted to reflect multiple fluid-rock interactions spanning the active time period of a
specific section of the fault. The variations in both absolute δ18O(mineral) and in some cases,
temperatures calculated from mineral pairs, instead points to variability in water-rock
exchange, fluid δ18O and temperature, and local permeability. Protracted flux of water
evolving from magmatic-δ18O signatures to near-meteoric δ18O is recorded across the
entire sample area, and records dual hydrothermal systems likely evolving with the fault
system. The importance of temperature and textural relations are illustrated by trends in
mineral element compositions, δ18O(mineral), and five apparent temperatures from three
domains (area < 20 mm2) each containing homogeneous δ18O(mineral) from sample CG-
13CH-RF ranging from 479 to 702°C (Table 5.1; Figure 4.17). This sample thus records
a continuous record of deformation and fluid flow spanning 223°C, a magnitude similar
to the variation in average δ18O of well-constrained Miocene deformation structures
observed across the study area (Figure 5.6a). Evidence for protracted fluid flux events
within individual rocks can also be observed in intracrystalline δ18O-zonation showing
105
values higher at the grain rim relative to the grain core (Section 4.3.2.2). Reverse
zonation is recorded in samples 13JL-8, CG-14CH-126, and CG-14CH-133, in which
higher δ18O values are observed on the rims of lower δ18O interior domains of single
grains (Table 4.5). The rims of grains showing reverse zonation from the Range Front
area give a δ18O value of 9.3‰ and from Bat Cave Wash give similar δ18O values of 6.3
and 6.4‰. This observation indicates a pulse of relatively higher δ18O fluids soon
followed initial mineral growth of these grains. For mineral growth during cooling from a
uniform δ18O fluid, one would expect higher δ18O values to be observed on the rims of
lower δ18O interior domains of single grains. Alternatively, precipitation during cooling
from progressively lower δ18O fluids (as the result of an evolving reaction front) would
lead to lower δ18O values observed on the rims of higher δ18O interior domains of single
grains. The temperature range in the samples showing reverse zonation is 211–320°C
(CG-14CH-126) and 138–395°C (sample CG-14CH-133). Sample 13JL-8 did not yield
mineral pairs, however, sample 13JL-7 from the same cataclasite zone gives a calculated
temperature of 572°C. Due to the existence of oxygen isotope heterogeneity in some
rocks, only microstructures considered > 50% homogeneous in δ18O(mineral) (Section
4.3.2.1; Table 4.4) were used in attempting to constrain thermal gradients of vertical
transects. When applied, samples 13JL-7, CG-14CH-125, CG-14CH-128, and CG-14CH-
133 yield single/multiple microstructures < 50% homogeneous δ18O(mineral). Twelve rock
samples that contain an average microstructure 88% homogeneous in δ18O(Qtz) and 84%
homogeneous in δ18O(Ep) yielded a temperature range associated with faulting and fluid
flow along the MWF of 211 to 702°C. MacDonald (2014) reported similar apparent
temperature calculations from 13 quartz-epidote mineral pairs along the MWF damage
106
zone, which range from 248–542°C. The lowest temperatures from that study were also
found in the structurally-deepest fault rocks in the Mohave Wash sampling area located
~4 km south of Bat Cave Wash.
5.4.1 Vertical isotopic and thermal characteristics through the Mohave Wash fault
Morrison and Anderson (1998) proposed a model for the nearby Whipple
detachment fault in which an extreme thermal gradient resulted from extraction of heat
from the footwall as cold, surface-derived fluids flow along the detachment fault. They
termed this process footwall refrigeration, and proposed it as a mechanism for strain
localizing during evolution from diffuse, ductile deformation to a localized zone of
semibrittle/brittle deformation during low-angle normal faulting. In this model, heat was
advectively removed by fluid flow through the upper-most extent of the footwall causing
cooling (rapid) beneath the fault zone. To evaluate this model further during the early
stages of slip recorded by the MWF, oxygen isotope temperatures determined from
measured Δ18O(Qtz-Ep) were evaluated across three vertical transects through the MWF.
5.4.1.1 The Saddle
The fine grain size and limited extent of hydrothermal mineralization restricted
the useful samples to only two rocks (four mineral pairs) from the 120 m-long traverse at
The Saddle site with epidote and quartz pairs considered appropriate for oxygen isotope
thermometry (Figures 3.1, 4.13a, 5.3). The mean calculated temperatures of the MWF
vertical transect at The Saddle decrease from 319°C at the base of the MWF damage zone
107
to 351°C at 88 m beneath the MWF damage zone yielding a thermal gradient of 31°C
over 88 m toward the MWF based on the mean apparent temperatures.
5.4.1.2 Mohave Wash
At Mohave Wash, two rock samples over a 20 m vertical transect from the base of
the MWF damage zone into the footwall at Mohave Wash yielded three mineral pairs
(Figures 4.14, 5.3). The mineral pairs recorded mean temperatures decreasing of 437°C at
20 m beneath the MWF damage zone and 245°C at the base of the MWF damage zone.
Using the mean apparent temperatures in each sample at Mohave Wash, a decrease in
temperature of 191°C over 20 m was observed toward the MWF.
5.4.1.2 Bat Cave Wash
Five rock samples spanning 61 m in two vertical transects from the hanging-wall
of the MWF damage zone into the footwall at Bat Cave Wash yielded a distribution of
δ18O(Qtz) and δ18O(Ep) values used for oxygen isotope thermometry (Figures 3.2, 4.13b-c,
5.3). The transect sampled up the Bat Cave Wash, a total of 16 mineral pairs were used
for apparent temperature calculation at the vertical transect 1.5 km into Bat Cave Wash.
The calculated mean apparent temperatures decreased systematically from 357°C at 37 m
beneath the MWF damage zone to 314°C at 31 m beneath the MWF damage zone and to
279°C at 10 m beneath the MWF damage zone. Mean apparent temperatures at Bat Cave
Wash were found to have thermal gradient of 169°C over 27 m decreasing toward the
MWF.
108
Temperatures were calculated from 14 mineral adjacent mineral pairs at the
mouth of Bat Cave Wash. The mean recorded temperatures of the MWF vertical transect
at the mouth of Bat Cave Wash decreased from 341°C at 4 m beneath the MWF damage
zone to 286°C at 4 m above the base of the MWF damage zone. The mean apparent
temperatures at the mouth of Bat Cave Wash were found to have thermal gradient of
114°C over 8 m decreasing toward the MWF. A thermal gradient of 120°C over 41 m
decreasing toward the MWF was found using calculated temperatures from both Bat
Cave Wash locations.
5.4.2 Summary of vertical transect trends
Since the MWF is thought to have formed during the early evolution of the
Chemehuevi detachment fault system, accommodating ~2 km of slip before ceasing, the
infiltration of early fluids are likely to have exchanged with the country rock and been
buffered to higher δ18O as they migrated into the detachment zone. Later fluids migrating
into the fault would have exchanged with rocks that had already had their δ18O lowered
by prior exchange with infiltrating fluids, and thus encountered a less shifted fluid
(resulting in lower δ18O(mineral) values). In a rock-buffered system, where fluid flux is low,
the ability for fluids to transport heat may also be diminished, resulting in the shift in
δ18O despite significant overlap in the apparent oxygen isotope equilibrium temperatures.
A syntaxial vein analyzed ~4 m above the damage zone of the MWF at Bat Cave Wash
(sample CG-14CH-127) shows δ18O(Qtz; Ep) values consistently > 2‰ higher at the vein
wall relative to center (Figure 4.16). However, quartz-epidote mineral pairs yield
overlapping temperatures, ranging from 364 to 393°C at the vein wall and 341 to 378°C
109
at the vein center. These observations may generally be consistent with low water/rock
ratios at the early stages of slip. The vertical transect at the mouth of Bat Cave
consistently yielded temperatures ~50°C higher (and more variable) to the MWF footwall
transect 1.5 km further into Bat Cave Wash. This difference could reflect an increase in
temperature of fluids, possible from syntectonic felsic dikes observed within the damage
zone at the mouth of Bat Cave Wash ~8 m beneath the MWF damage zone in the transect
sampled. This dike was mylonitic with well-defined plagioclase lineations at 050°.
Alternatively, lower temperatures observed along the transect 1.5 km further into Bat
Cave Wash and significantly lower absolute δ18O(mineral) values (Figure 5.4) could reflect
a temporally-distinct fluid infiltration event (later) involving fluids infiltrating along
established permeability pathways, preserving the low-δ18O values characteristic of their
source. The presence of epidotized-zones up to 10’s cm thick and the sharp, well-defined
nature of the fault splay itself support the interpretation that a greater volume of fluid
infiltrated this portion of the fault (Figure 3.2d). In either case, the temperatures recorded
at the two transects would not reflect a static, uniform thermal structure along the MWF.
Instead, the stable isotope record indicates fault injection, limited fluid rock interactions,
and multiple fracturing and fluid flow events during the early slip.
All vertical transects show a consistent decrease in δ18O values toward the MWF
damage zone with respect to the footwall in both quartz and epidote. A systematic
increase in both minimum and mean apparent temperature occurs with increasing
structural depth beneath the MWF damage zone (Figure 5.4). Gottardi et al. (2011)
suggested that a high (vertical) thermal gradient forms near the brittle-ductile transition
zone as a result of shearing and convection of fluids (i.e., Figure 2.1b). Modeling by
110
Person et al. (2007) and Gottardi et al. (2013) of oxygen isotope exchange and transport
along idealized detachment faults suggests that a thinning effect of the upper brittle crust
allows for infiltrating fluid to channelize at its base and transfer heat (e.g., Lopez and
Smith, 1995). Modeling by Person et al. (2007) and Gottardi et al. (2013) show that
considerable oxygen isotope and heat distributions resulting from low-δ18O fluid flow at
mid-crustal depths is dependent upon permeability pathways, such as a detachment fault
damage zone. Past studies using oxygen isotope thermometry of detachment faults (e.g.,
Morrison and Anderson, 1998; Famin et al., 2004; Gottardi et al., 2011) have shown
evidence of an extreme thermal gradient in support of this modeling, ranging from
70°C/50 m in the Raft River Mountains to 106°C/50 m in the Whipple Mountains and
Tinos Detachment. Results from this study provide evidence of vertical thermal gradients
(i.e., footwall refrigeration) of 18°C/50 m (The Saddle), 478°C/50 m (Mohave Wash),
and 147°C/50 m (Bat Cave Wash) all with temperatures consistently decreasing toward
the MWF (Figure 5.4).
5.5 Surface-derived fluids and the Mohave Wash fault
While stable isotope temperatures recorded by rims on adjacent, coexisting
mineral pairs can vary, there is a uniform shift to lower values in the δ18O of minerals in
the MWF damage zone. Modeling by Gottardi et al. (2013) showed that oxygen isotope
depletion of 13‰ (starting composition) to 6‰ along a detachment fault. This decrease is
observed in the MWF with the protolith quartz δ18O value of > 9‰ and mineralization
associated to the MWF damage zone yielding δ18O quartz values as low as -1.0‰.
111
Similar studies found depleted δ18O quartz compositions decreasing from 13‰ to 5‰ in
the Kettle dome of NE Washington (Mulch et al., 2007) and values as low as 2.8‰ in the
Ruby Mountains NE Nevada (Fricke et al., 1992). The extensive low-δ18O values
identified within deformation zones of the MWF are interpreted to signify oxygen isotope
exchange with a fluid of surficial origin, either meteoric or from basinal brines
developing in basins formed by the extending upper plate (e.g., Reynolds and Rehrig,
1980). Extensive fracture networks within the brittle upper plate could have served as
conduits for large volumes of surface-derived fluids to interact with the MWF. Water in
equilibrium with the atmosphere (meteoric) at the latitude of the Chemehuevi Mountains
has a δ18O(H2O) value of -5‰ (Bowen and Wilkinson, 2002). Brines would evolve to
slightly higher δ18O through evaporation, developing values of perhaps -5 to +3‰
(Reynolds and Rehrig, 1980). Fluid in magmatic equilibrium with undeformed
granodiorite was calculated using quartz-H2O oxygen isotope fractionation following
Clayton et al. (1972) for a temperature of 600°C, and gives δ18O(H2O) values ranging from
7.2 to 8.6‰, values consistent with common magmatic fluid compositions in similar
settings (Sheppard, 1986). Fluid in oxygen isotope equilibrium with gneiss using the
same fractionation factor (Clayton et al., 1972) would have δ18O(H2O) values ranging from
7.2 to 7.9‰.
With temperatures from in situ mineral pairs of the MWF constrained, the δ18O of
a fluid in equilibrium with a given mineral pair can be calculated using a temperature-
dependent mineral-H2O oxygen isotope fractionation (Δ18O(mineral-H2O); Figure 5.5).
Applying the quartz-H2O oxygen isotope fractionation of Clayton et al. (1972) to the 46
analyses of quartz inferred to be in isotopic equilibrium with epidote yields δ18O of fluids
112
ranging from -5.6 to 7.3‰. Applying epidote-H2O oxygen isotope fractionation, found
using quartz-epidote oxygen isotope fractionation of Mathews (1994) and quartz-H2O
oxygen isotope fractionation of Clayton et al. (1972) [(quartz-epidote) - (quartz-H2O) =
epidote-H2O], to the 46 analyses of epidote inferred to be in isotopic equilibrium with
quartz yields δ18O of fluids ranging from -5.6 to 7.3‰. Calculated δ18O(H2O) values in
equilibrium with quartz-epidote pairs (assuming they are in fact equilibrated) are
presented in Figure 5.5. Of the 46 mineral pairs, 13 yield calculated δ18O(H2O) values
ranging from 4.3 to 7.3‰, 12 yield calculated δ18O(H2O) values ranging from -0.9 to
1.3‰, 18 yield calculated δ18O(H2O) values ranging from -1.7 to -4.2‰, and three yield
calculated δ18O(H2O) values > 5.0‰. Sample CG-13CH-24 yields calculated δ18O(H2O)
values for quartz found to be in isotopic equilibrium with host gneiss (6.8 to 7.3‰). The
fluid with which it exchanged (i.e., precipitated from) is interpreted to be an end-member
for fluid compositions available and moving during the early stages of fracturing without
contribution from surface-derived fluids. Samples CG-14CH-106 and CG-14CH-126
yield values of a fluid in isotopic equilibrium with meteoric water (-5‰). Samples with
calculated δ18O(H2O) values of -5.0 to 5.0‰ are interpreted to have precipitated from
external fluids of varying water-rock ratios (i.e., meteoric water, hydrothermal fluid, or
brines). The observed large variability throughout the MWF damage zone is interpreted
to reflect multiple fluid-rock interactions spanning the active time period of a specific
transect of the fault. From a respective transect, the lowest calculated δ18O(H2O) values
were quartz-epidote mineral pairs from the most heavily fractured area, and the highest
calculated δ18O(H2O) values were quartz-epidote mineral pairs furthest from the most
heavily fractured area. The quartz-epidote mineral pairs yielding the lowest calculated
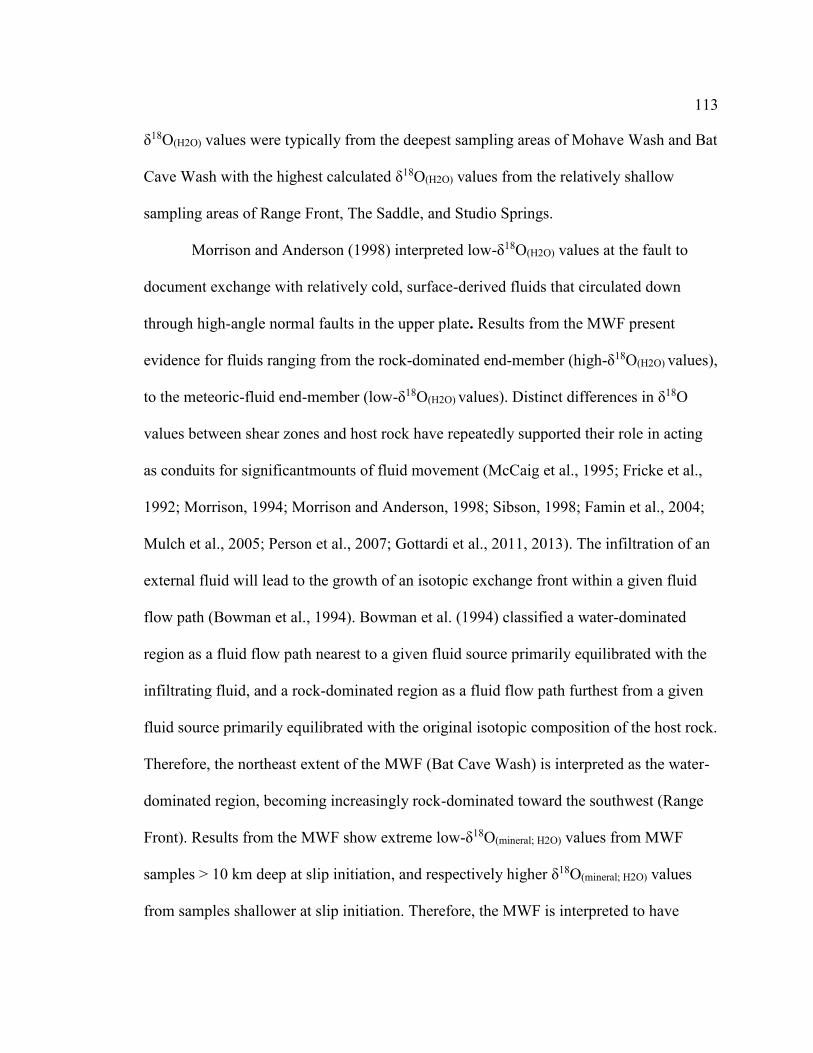
113
δ18O(H2O) values were typically from the deepest sampling areas of Mohave Wash and Bat
Cave Wash with the highest calculated δ18O(H2O) values from the relatively shallow
sampling areas of Range Front, The Saddle, and Studio Springs.
Morrison and Anderson (1998) interpreted low-δ18O(H2O) values at the fault to
document exchange with relatively cold, surface-derived fluids that circulated down
through high-angle normal faults in the upper plate. Results from the MWF present
evidence for fluids ranging from the rock-dominated end-member (high-δ18O(H2O) values),
to the meteoric-fluid end-member (low-δ18O(H2O) values). Distinct differences in δ18O
values between shear zones and host rock have repeatedly supported their role in acting
as conduits for significantmounts of fluid movement (McCaig et al., 1995; Fricke et al.,
1992; Morrison, 1994; Morrison and Anderson, 1998; Sibson, 1998; Famin et al., 2004;
Mulch et al., 2005; Person et al., 2007; Gottardi et al., 2011, 2013). The infiltration of an
external fluid will lead to the growth of an isotopic exchange front within a given fluid
flow path (Bowman et al., 1994). Bowman et al. (1994) classified a water-dominated
region as a fluid flow path nearest to a given fluid source primarily equilibrated with the
infiltrating fluid, and a rock-dominated region as a fluid flow path furthest from a given
fluid source primarily equilibrated with the original isotopic composition of the host rock.
Therefore, the northeast extent of the MWF (Bat Cave Wash) is interpreted as the water-
dominated region, becoming increasingly rock-dominated toward the southwest (Range
Front). Results from the MWF show extreme low-δ18O(mineral; H2O) values from MWF
samples > 10 km deep at slip initiation, and respectively higher δ18O(mineral; H2O) values
from samples shallower at slip initiation. Therefore, the MWF is interpreted to have
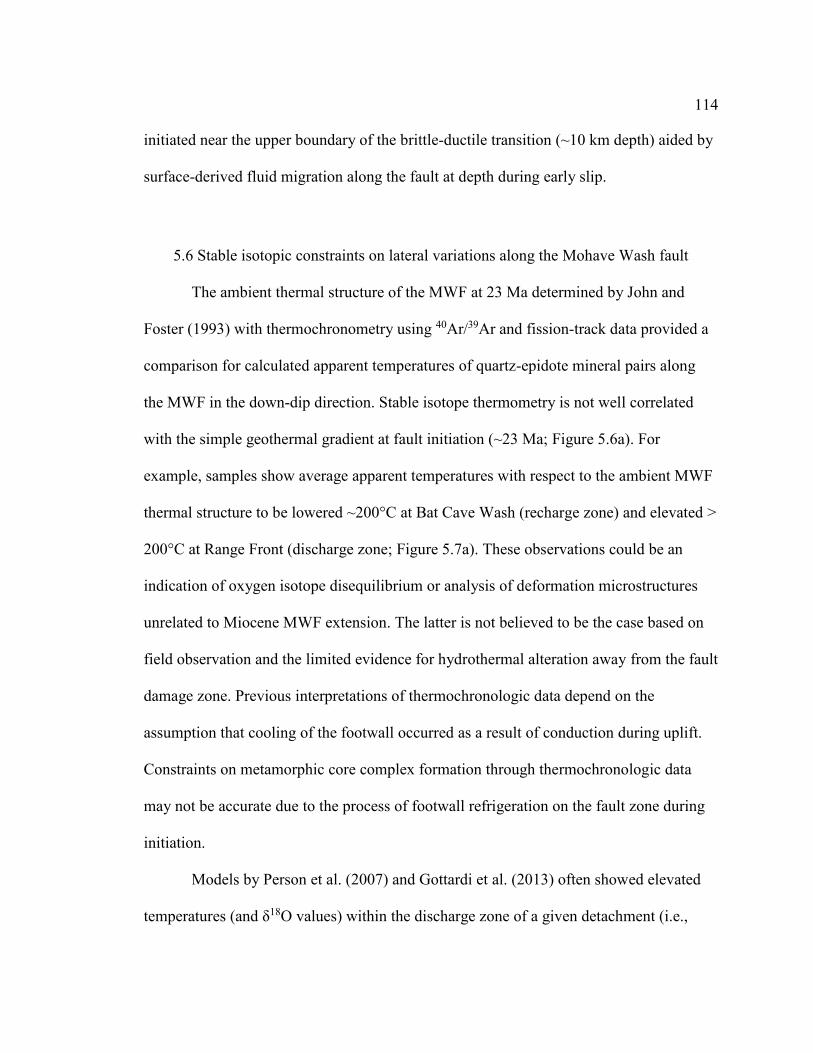
114
initiated near the upper boundary of the brittle-ductile transition (~10 km depth) aided by
surface-derived fluid migration along the fault at depth during early slip.
5.6 Stable isotopic constraints on lateral variations along the Mohave Wash fault
The ambient thermal structure of the MWF at 23 Ma determined by John and
Foster (1993) with thermochronometry using 40Ar/39Ar and fission-track data provided a
comparison for calculated apparent temperatures of quartz-epidote mineral pairs along
the MWF in the down-dip direction. Stable isotope thermometry is not well correlated
with the simple geothermal gradient at fault initiation (~23 Ma; Figure 5.6a). For
example, samples show average apparent temperatures with respect to the ambient MWF
thermal structure to be lowered ~200°C at Bat Cave Wash (recharge zone) and elevated >
200°C at Range Front (discharge zone; Figure 5.7a). These observations could be an
indication of oxygen isotope disequilibrium or analysis of deformation microstructures
unrelated to Miocene MWF extension. The latter is not believed to be the case based on
field observation and the limited evidence for hydrothermal alteration away from the fault
damage zone. Previous interpretations of thermochronologic data depend on the
assumption that cooling of the footwall occurred as a result of conduction during uplift.
Constraints on metamorphic core complex formation through thermochronologic data
may not be accurate due to the process of footwall refrigeration on the fault zone during
initiation.
Models by Person et al. (2007) and Gottardi et al. (2013) often showed elevated
temperatures (and δ18O values) within the discharge zone of a given detachment (i.e.,
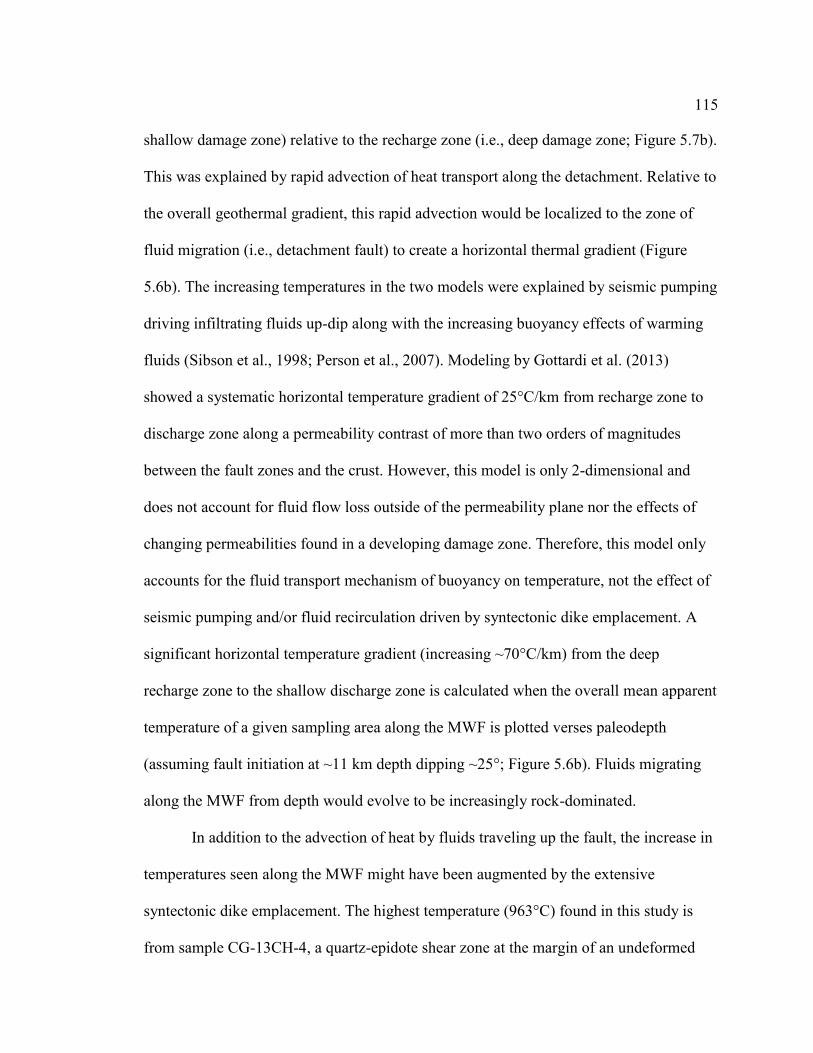
115
shallow damage zone) relative to the recharge zone (i.e., deep damage zone; Figure 5.7b).
This was explained by rapid advection of heat transport along the detachment. Relative to
the overall geothermal gradient, this rapid advection would be localized to the zone of
fluid migration (i.e., detachment fault) to create a horizontal thermal gradient (Figure
5.6b). The increasing temperatures in the two models were explained by seismic pumping
driving infiltrating fluids up-dip along with the increasing buoyancy effects of warming
fluids (Sibson et al., 1998; Person et al., 2007). Modeling by Gottardi et al. (2013)
showed a systematic horizontal temperature gradient of 25°C/km from recharge zone to
discharge zone along a permeability contrast of more than two orders of magnitudes
between the fault zones and the crust. However, this model is only 2-dimensional and
does not account for fluid flow loss outside of the permeability plane nor the effects of
changing permeabilities found in a developing damage zone. Therefore, this model only
accounts for the fluid transport mechanism of buoyancy on temperature, not the effect of
seismic pumping and/or fluid recirculation driven by syntectonic dike emplacement. A
significant horizontal temperature gradient (increasing ~70°C/km) from the deep
recharge zone to the shallow discharge zone is calculated when the overall mean apparent
temperature of a given sampling area along the MWF is plotted verses paleodepth
(assuming fault initiation at ~11 km depth dipping ~25°; Figure 5.6b). Fluids migrating
along the MWF from depth would evolve to be increasingly rock-dominated.
In addition to the advection of heat by fluids traveling up the fault, the increase in
temperatures seen along the MWF might have been augmented by the extensive
syntectonic dike emplacement. The highest temperature (963°C) found in this study is
from sample CG-13CH-4, a quartz-epidote shear zone at the margin of an undeformed
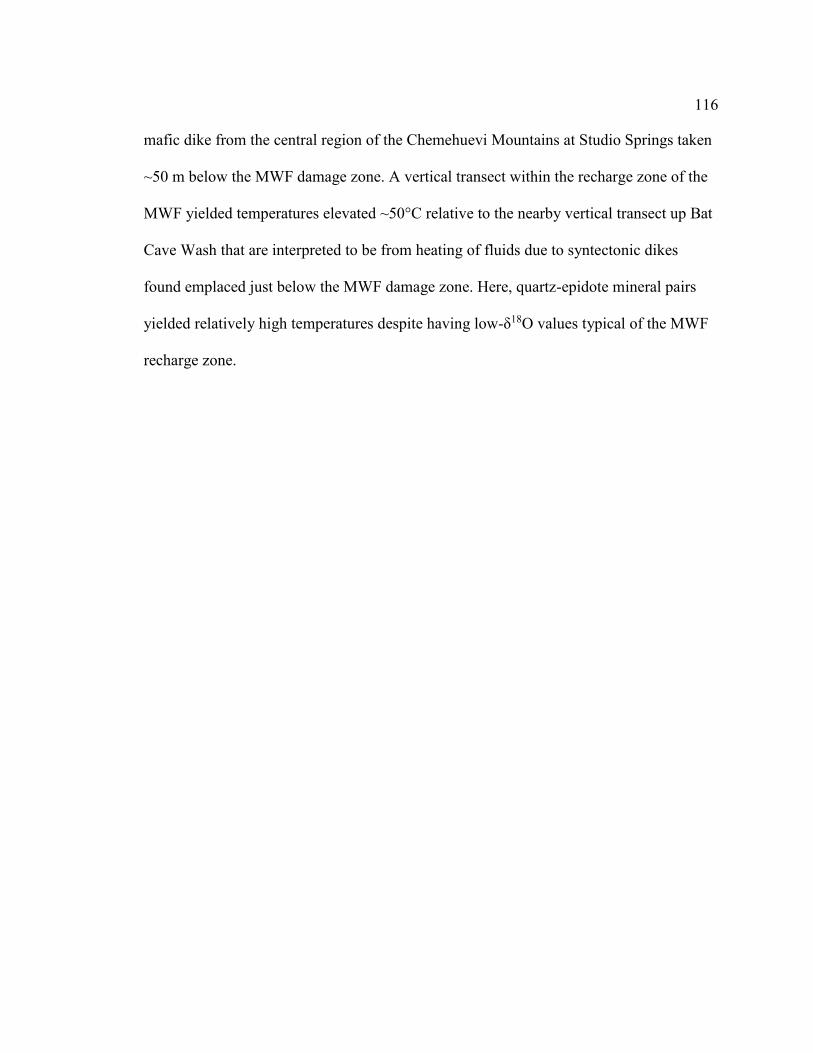
116
mafic dike from the central region of the Chemehuevi Mountains at Studio Springs taken
~50 m below the MWF damage zone. A vertical transect within the recharge zone of the
MWF yielded temperatures elevated ~50°C relative to the nearby vertical transect up Bat
Cave Wash that are interpreted to be from heating of fluids due to syntectonic dikes
found emplaced just below the MWF damage zone. Here, quartz-epidote mineral pairs
yielded relatively high temperatures despite having low-δ18O values typical of the MWF
recharge zone.
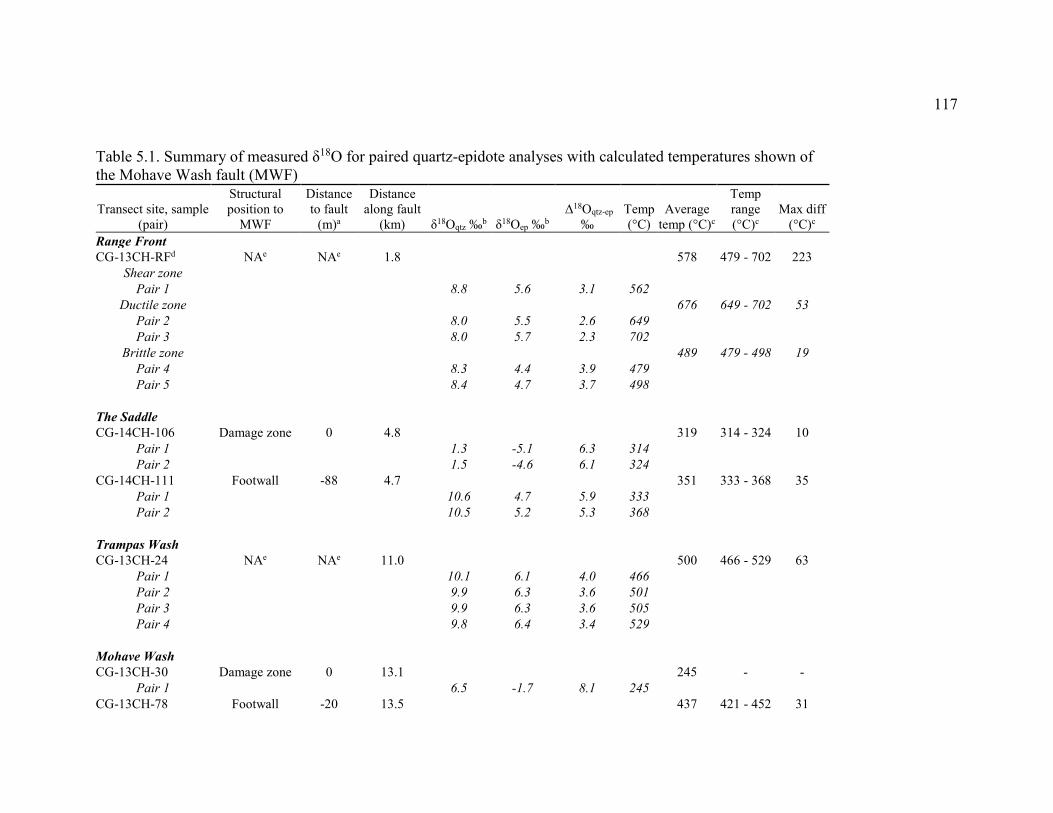
117
Table 5.1. Summary of measured δ18O for paired quartz-epidote analyses with calculated temperatures shown of the Mohave Wash fault (MWF)
Transect site, sample (pair)
Structural position to
MWF
Distance to fault
(m)a
Distance along fault
(km) δ18Oqtz ‰b δ18Oep ‰b Δ18Oqtz-ep
‰ Temp (°C)
Average temp (°C)c
Temp range (°C)c
Max diff (°C)c
Range Front CG-13CH-RFd NAe NAe 1.8
578 479 - 702 223
Shear zone Pair 1
8.8 5.6 3.1 562 Ductile zone
676 649 - 702 53
Pair 2
8.0 5.5 2.6 649 Pair 3
8.0 5.7 2.3 702
Brittle zone
489 479 - 498 19 Pair 4
8.3 4.4 3.9 479
Pair 5
8.4 4.7 3.7 498
The Saddle CG-14CH-106 Damage zone 0 4.8
319 314 - 324 10
Pair 1
1.3 -5.1 6.3 314 Pair 2
1.5 -4.6 6.1 324
CG-14CH-111 Footwall -88 4.7
351 333 - 368 35 Pair 1
10.6 4.7 5.9 333
Pair 2
10.5 5.2 5.3 368
Trampas Wash CG-13CH-24 NAe NAe 11.0
500 466 - 529 63
Pair 1
10.1 6.1 4.0 466 Pair 2
9.9 6.3 3.6 501
Pair 3
9.9 6.3 3.6 505 Pair 4
9.8 6.4 3.4 529
Mohave Wash
CG-13CH-30 Damage zone 0 13.1
245 - - Pair 1
6.5 -1.7 8.1 245
CG-13CH-78 Footwall -20 13.5
437 421 - 452 31
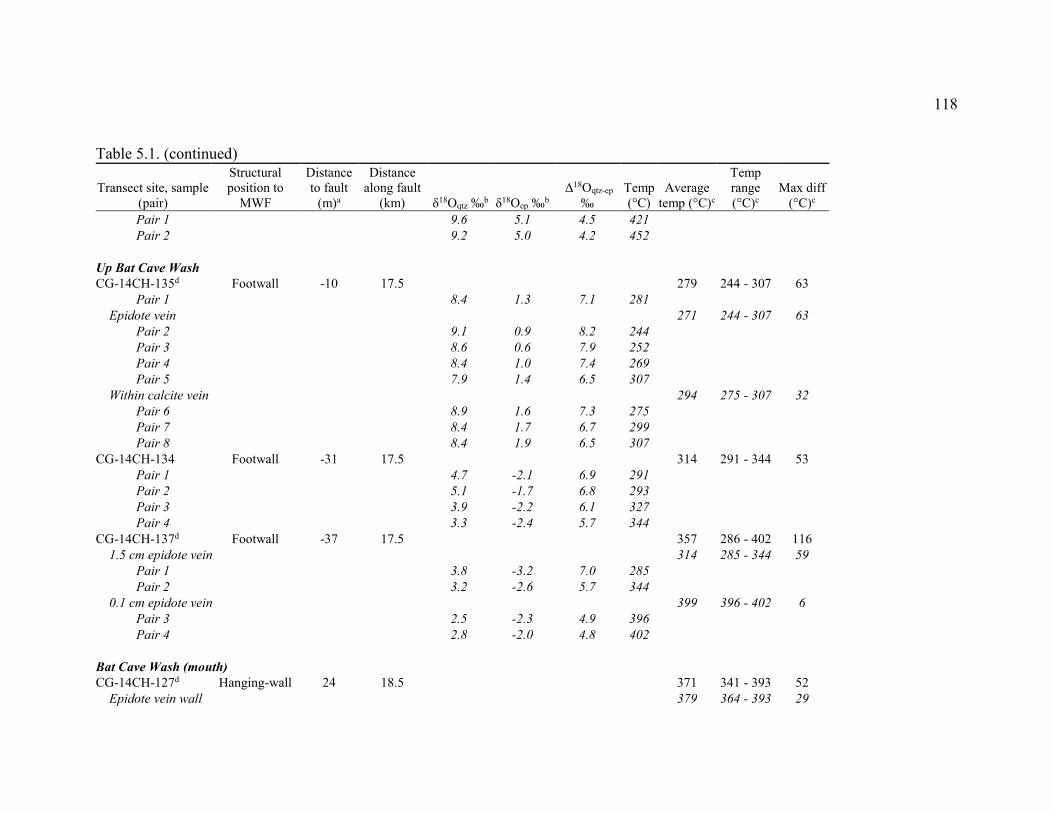
118
Table 5.1. (continued)
Transect site, sample (pair)
Structural position to
MWF
Distance to fault
(m)a
Distance along fault
(km) δ18Oqtz ‰b δ18Oep ‰b Δ18Oqtz-ep
‰ Temp (°C)
Average temp (°C)c
Temp range (°C)c
Max diff (°C)c
Pair 1
9.6 5.1 4.5 421 Pair 2
9.2 5.0 4.2 452
Up Bat Cave Wash
CG-14CH-135d Footwall -10 17.5
279 244 - 307 63 Pair 1
8.4 1.3 7.1 281
Epidote vein
271 244 - 307 63 Pair 2
9.1 0.9 8.2 244
Pair 3
8.6 0.6 7.9 252 Pair 4
8.4 1.0 7.4 269
Pair 5
7.9 1.4 6.5 307 Within calcite vein
294 275 - 307 32
Pair 6
8.9 1.6 7.3 275 Pair 7
8.4 1.7 6.7 299
Pair 8
8.4 1.9 6.5 307 CG-14CH-134 Footwall -31 17.5
314 291 - 344 53
Pair 1
4.7 -2.1 6.9 291 Pair 2
5.1 -1.7 6.8 293
Pair 3
3.9 -2.2 6.1 327 Pair 4
3.3 -2.4 5.7 344
CG-14CH-137d Footwall -37 17.5
357 286 - 402 116 1.5 cm epidote vein
314 285 - 344 59
Pair 1
3.8 -3.2 7.0 285 Pair 2
3.2 -2.6 5.7 344
0.1 cm epidote vein
399 396 - 402 6 Pair 3
2.5 -2.3 4.9 396
Pair 4
2.8 -2.0 4.8 402
Bat Cave Wash (mouth) CG-14CH-127d Hanging-wall 24 18.5
371 341 - 393 52
Epidote vein wall
379 364 - 393 29
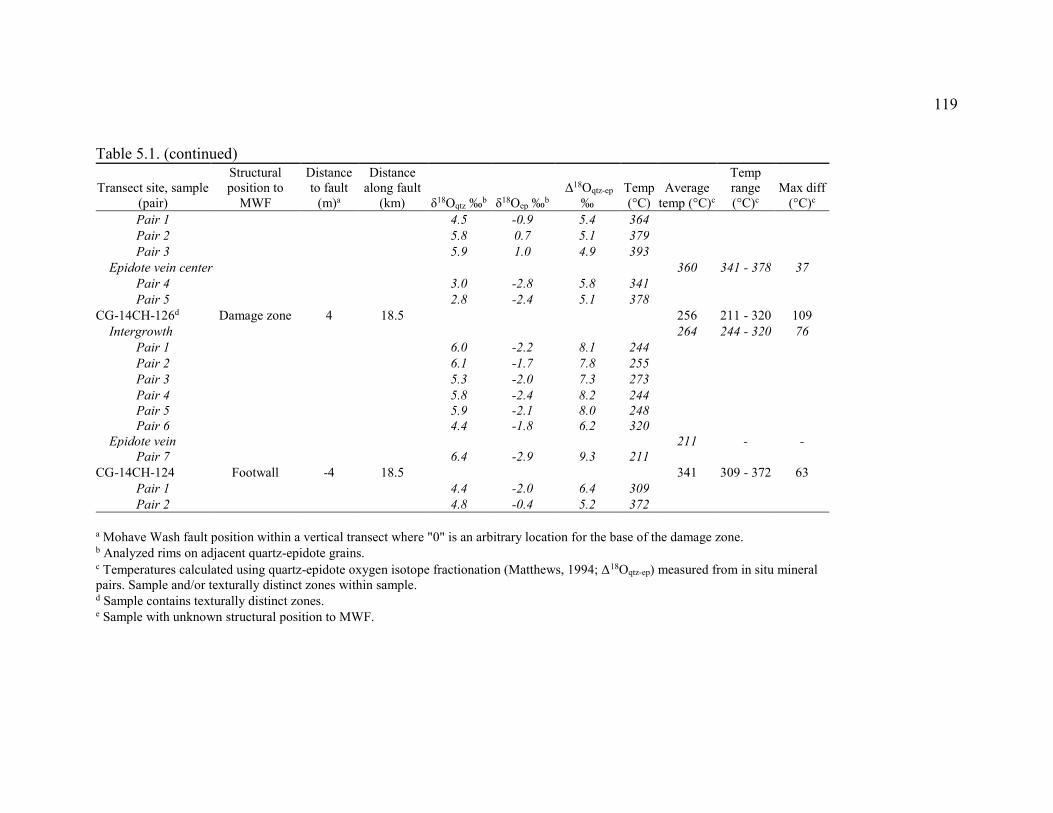
119
Table 5.1. (continued)
Transect site, sample (pair)
Structural position to
MWF
Distance to fault
(m)a
Distance along fault
(km) δ18Oqtz ‰b δ18Oep ‰b Δ18Oqtz-ep
‰ Temp (°C)
Average temp (°C)c
Temp range (°C)c
Max diff (°C)c
Pair 1
4.5 -0.9 5.4 364 Pair 2
5.8 0.7 5.1 379
Pair 3
5.9 1.0 4.9 393 Epidote vein center
360 341 - 378 37
Pair 4
3.0 -2.8 5.8 341 Pair 5
2.8 -2.4 5.1 378
CG-14CH-126d Damage zone 4 18.5
256 211 - 320 109 Intergrowth
264 244 - 320 76
Pair 1
6.0 -2.2 8.1 244 Pair 2
6.1 -1.7 7.8 255
Pair 3
5.3 -2.0 7.3 273 Pair 4
5.8 -2.4 8.2 244
Pair 5
5.9 -2.1 8.0 248 Pair 6
4.4 -1.8 6.2 320
Epidote vein
211 - - Pair 7
6.4 -2.9 9.3 211
CG-14CH-124 Footwall -4 18.5
341 309 - 372 63 Pair 1
4.4 -2.0 6.4 309
Pair 2 4.8 -0.4 5.2 372
a Mohave Wash fault position within a vertical transect where "0" is an arbitrary location for the base of the damage zone. b Analyzed rims on adjacent quartz-epidote grains.
c Temperatures calculated using quartz-epidote oxygen isotope fractionation (Matthews, 1994; Δ18Oqtz-ep) measured from in situ mineral pairs. Sample and/or texturally distinct zones within sample. d Sample contains texturally distinct zones.
e Sample with unknown structural position to MWF.
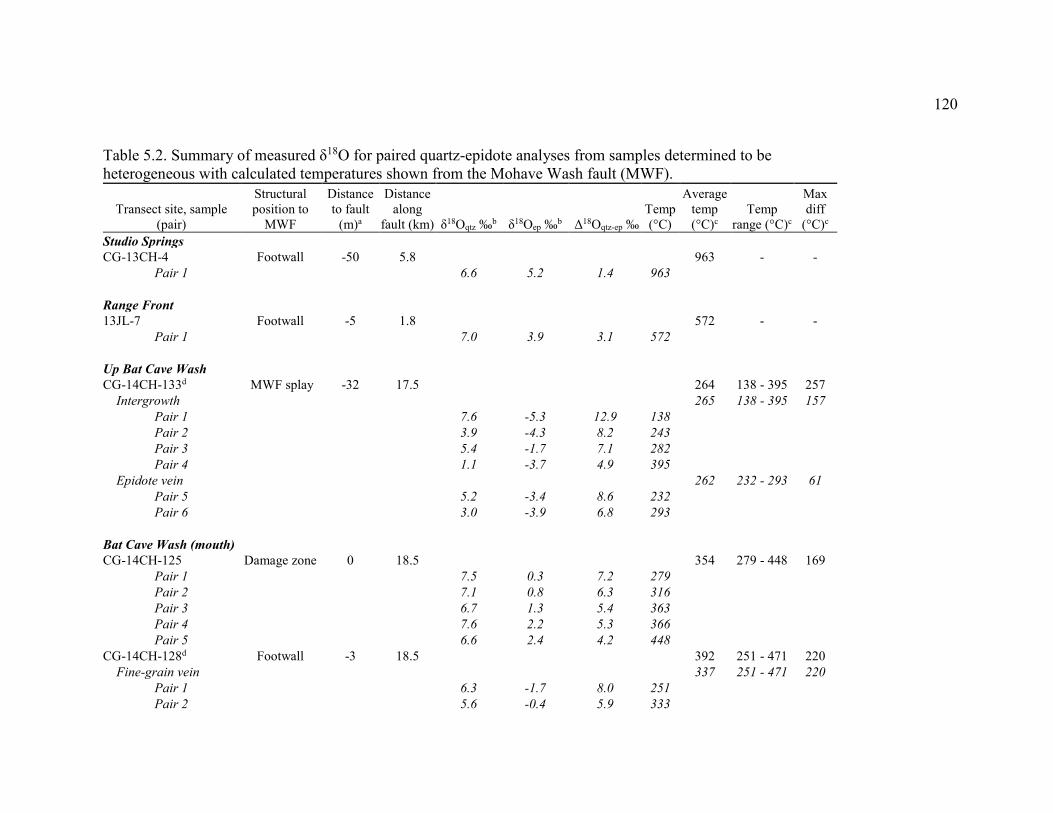
120
Table 5.2. Summary of measured δ18O for paired quartz-epidote analyses from samples determined to be heterogeneous with calculated temperatures shown from the Mohave Wash fault (MWF).
Transect site, sample (pair)
Structural position to
MWF
Distance to fault
(m)a
Distance along
fault (km) δ18Oqtz ‰b δ18Oep ‰b Δ18Oqtz-ep ‰ Temp (°C)
Average temp (°C)c
Temp range (°C)c
Max diff
(°C)c Studio Springs
CG-13CH-4 Footwall -50 5.8
963 - - Pair 1
6.6 5.2 1.4 963
Range Front
13JL-7 Footwall -5 1.8
572 - - Pair 1
7.0 3.9 3.1 572
Up Bat Cave Wash
CG-14CH-133d MWF splay -32 17.5
264 138 - 395 257 Intergrowth
265 138 - 395 157
Pair 1
7.6 -5.3 12.9 138 Pair 2
3.9 -4.3 8.2 243
Pair 3
5.4 -1.7 7.1 282 Pair 4
1.1 -3.7 4.9 395
Epidote vein
262 232 - 293 61 Pair 5
5.2 -3.4 8.6 232
Pair 6
3.0 -3.9 6.8 293
Bat Cave Wash (mouth) CG-14CH-125 Damage zone 0 18.5
354 279 - 448 169
Pair 1
7.5 0.3 7.2 279 Pair 2
7.1 0.8 6.3 316
Pair 3
6.7 1.3 5.4 363 Pair 4
7.6 2.2 5.3 366
Pair 5
6.6 2.4 4.2 448 CG-14CH-128d Footwall -3 18.5
392 251 - 471 220
Fine-grain vein
337 251 - 471 220 Pair 1
6.3 -1.7 8.0 251
Pair 2
5.6 -0.4 5.9 333
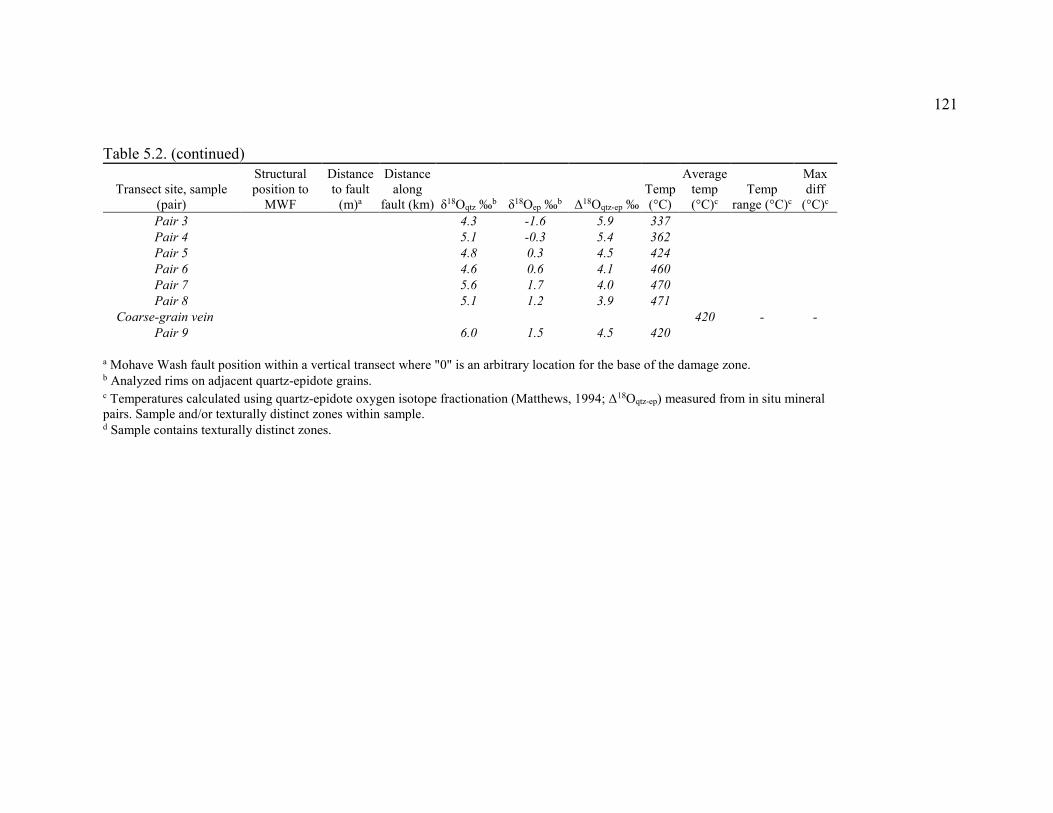
121
Table 5.2. (continued)
Transect site, sample (pair)
Structural position to
MWF
Distance to fault
(m)a
Distance along
fault (km) δ18Oqtz ‰b δ18Oep ‰b Δ18Oqtz-ep ‰ Temp (°C)
Average temp (°C)c
Temp range (°C)c
Max diff
(°C)c Pair 3
4.3 -1.6 5.9 337
Pair 4
5.1 -0.3 5.4 362 Pair 5
4.8 0.3 4.5 424
Pair 6
4.6 0.6 4.1 460 Pair 7
5.6 1.7 4.0 470
Pair 8
5.1 1.2 3.9 471 Coarse-grain vein
420 - -
Pair 9
6.0 1.5 4.5 420
a Mohave Wash fault position within a vertical transect where "0" is an arbitrary location for the base of the damage zone. b Analyzed rims on adjacent quartz-epidote grains.
c Temperatures calculated using quartz-epidote oxygen isotope fractionation (Matthews, 1994; Δ18Oqtz-ep) measured from in situ mineral pairs. Sample and/or texturally distinct zones within sample. d Sample contains texturally distinct zones.
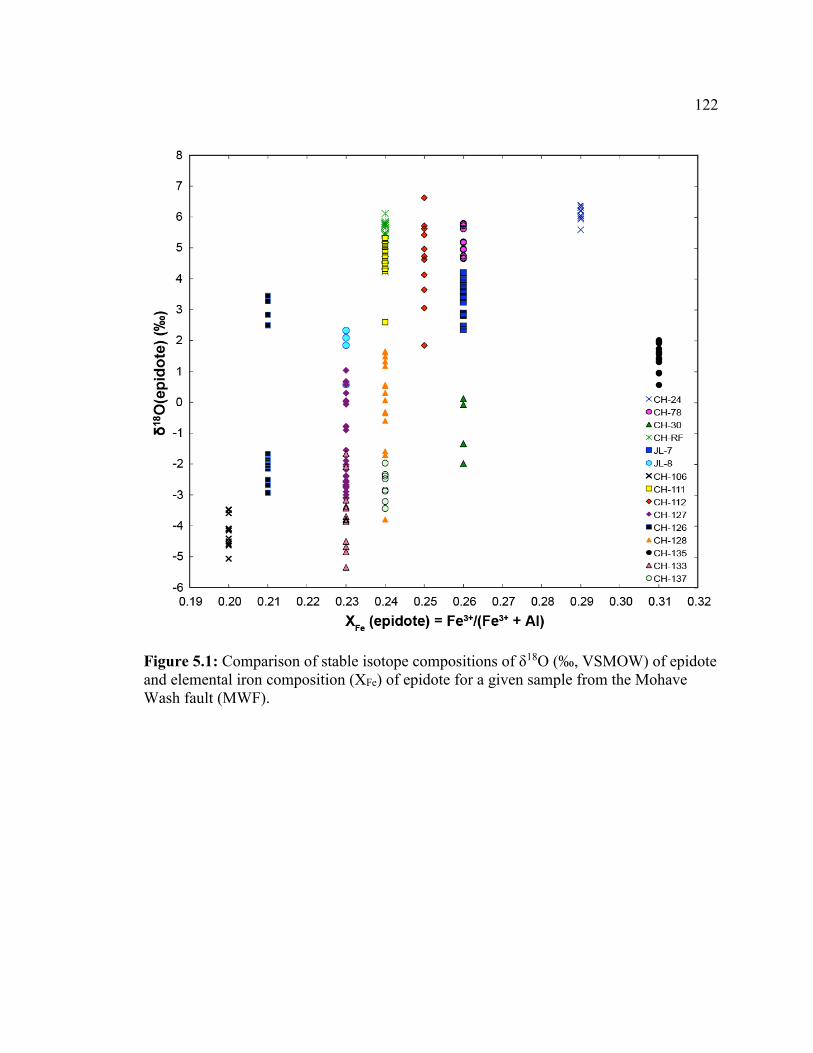
122
Figure 5.1: Comparison of stable isotope compositions of δ18O (‰, VSMOW) of epidote and elemental iron composition (XFe) of epidote for a given sample from the Mohave Wash fault (MWF).
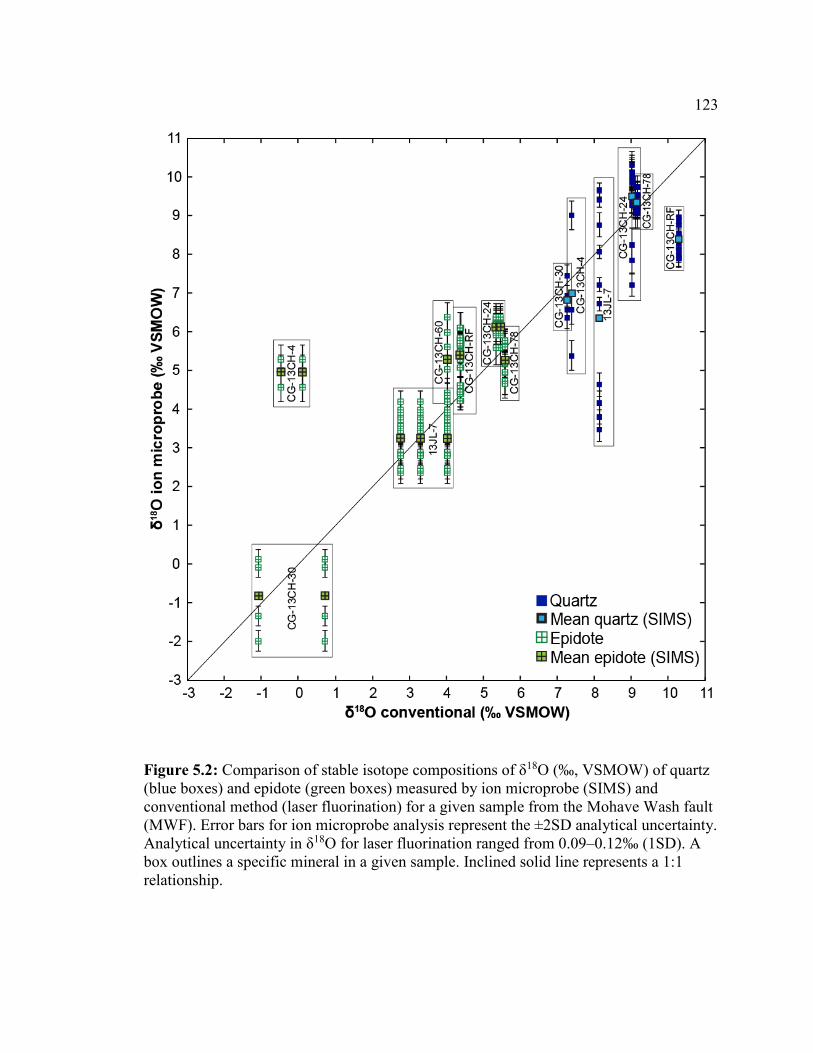
123
Figure 5.2: Comparison of stable isotope compositions of δ18O (‰, VSMOW) of quartz (blue boxes) and epidote (green boxes) measured by ion microprobe (SIMS) and conventional method (laser fluorination) for a given sample from the Mohave Wash fault (MWF). Error bars for ion microprobe analysis represent the ±2SD analytical uncertainty. Analytical uncertainty in δ18O for laser fluorination ranged from 0.09–0.12‰ (1SD). A box outlines a specific mineral in a given sample. Inclined solid line represents a 1:1 relationship.
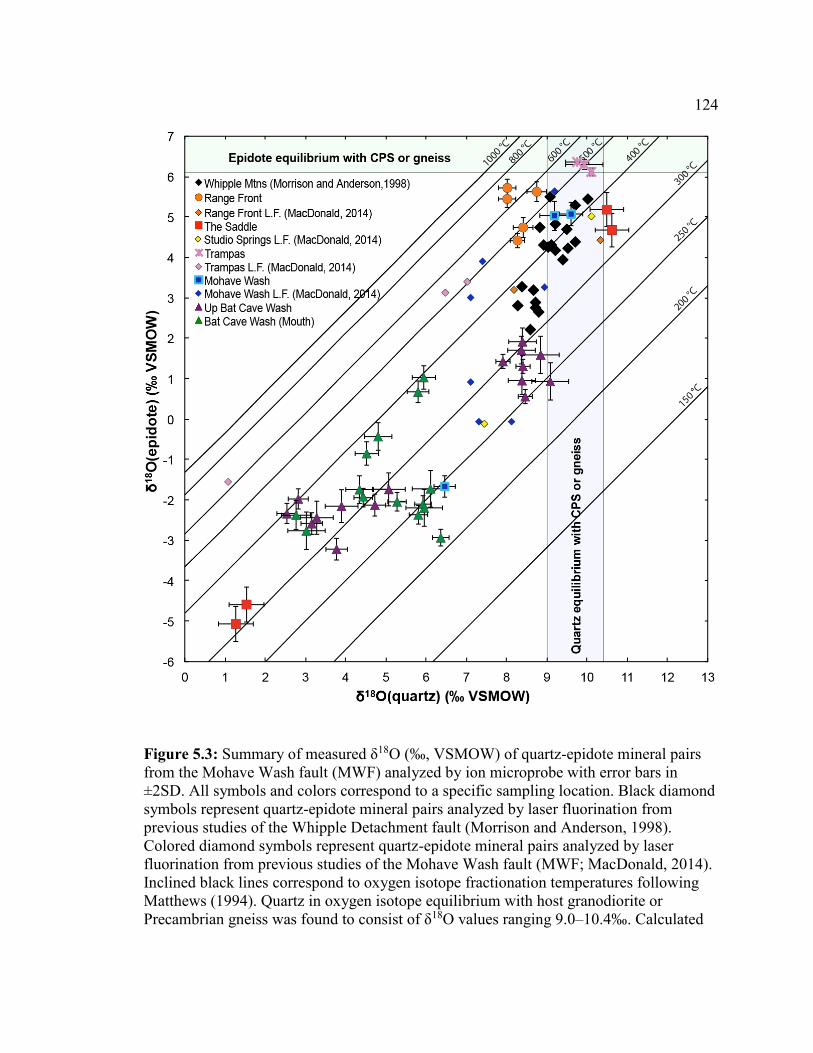
124
Figure 5.3: Summary of measured δ18O (‰, VSMOW) of quartz-epidote mineral pairs from the Mohave Wash fault (MWF) analyzed by ion microprobe with error bars in ±2SD. All symbols and colors correspond to a specific sampling location. Black diamond symbols represent quartz-epidote mineral pairs analyzed by laser fluorination from previous studies of the Whipple Detachment fault (Morrison and Anderson, 1998). Colored diamond symbols represent quartz-epidote mineral pairs analyzed by laser fluorination from previous studies of the Mohave Wash fault (MWF; MacDonald, 2014). Inclined black lines correspond to oxygen isotope fractionation temperatures following Matthews (1994). Quartz in oxygen isotope equilibrium with host granodiorite or Precambrian gneiss was found to consist of δ18O values ranging 9.0–10.4‰. Calculated
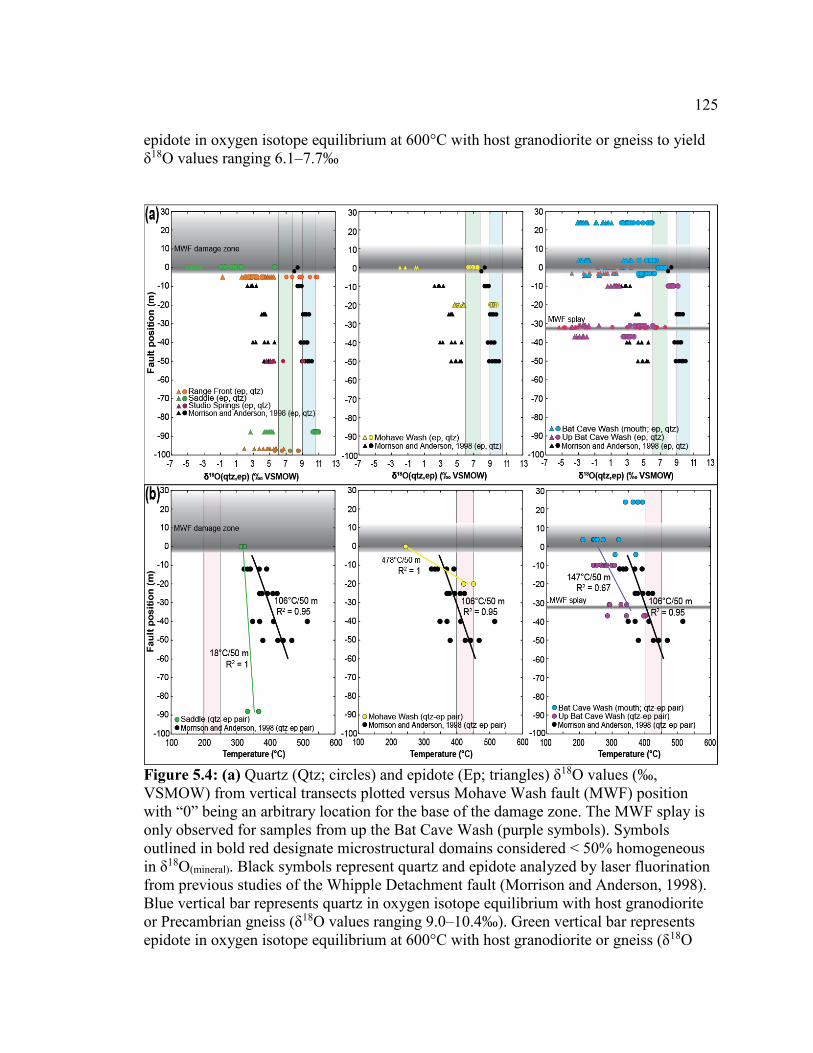
125
epidote in oxygen isotope equilibrium at 600°C with host granodiorite or gneiss to yield δ18O values ranging 6.1–7.7‰
Figure 5.4: (a) Quartz (Qtz; circles) and epidote (Ep; triangles) δ18O values (‰, VSMOW) from vertical transects plotted versus Mohave Wash fault (MWF) position with “0” being an arbitrary location for the base of the damage zone. The MWF splay is only observed for samples from up the Bat Cave Wash (purple symbols). Symbols outlined in bold red designate microstructural domains considered < 50% homogeneous in δ18O(mineral). Black symbols represent quartz and epidote analyzed by laser fluorination from previous studies of the Whipple Detachment fault (Morrison and Anderson, 1998). Blue vertical bar represents quartz in oxygen isotope equilibrium with host granodiorite or Precambrian gneiss (δ18O values ranging 9.0–10.4‰). Green vertical bar represents epidote in oxygen isotope equilibrium at 600°C with host granodiorite or gneiss (δ18O
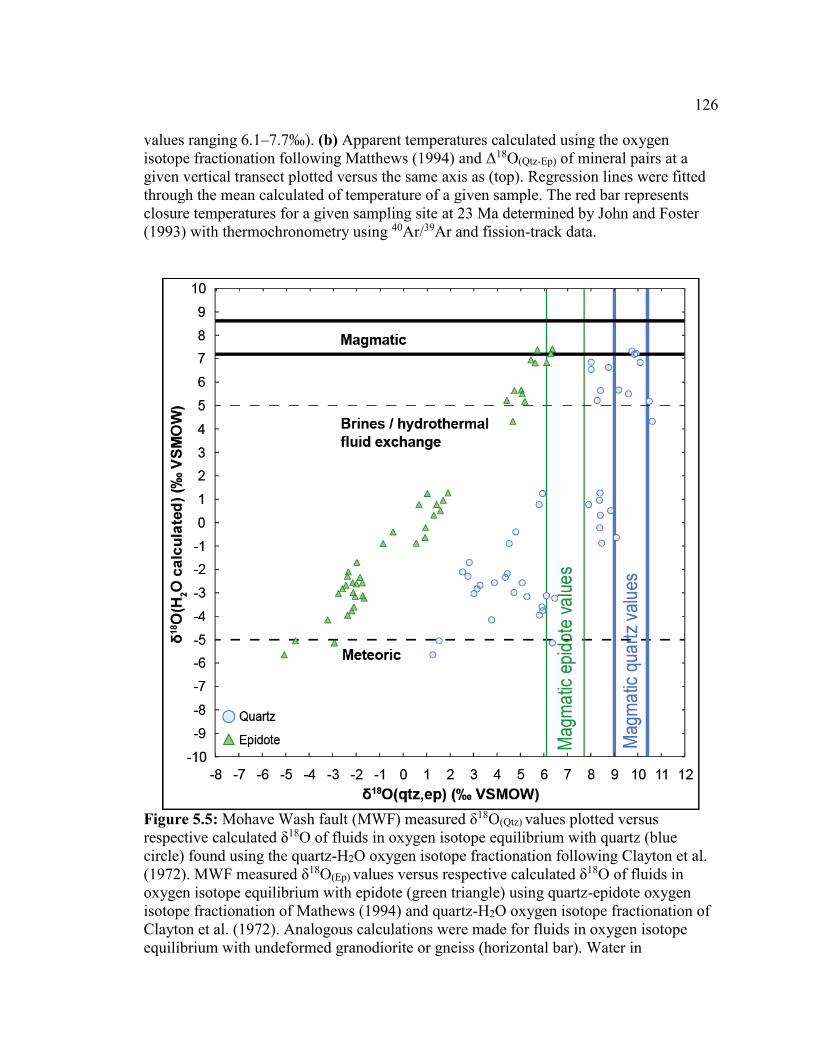
126
values ranging 6.1–7.7‰). (b) Apparent temperatures calculated using the oxygen isotope fractionation following Matthews (1994) and Δ18O(Qtz-Ep) of mineral pairs at a given vertical transect plotted versus the same axis as (top). Regression lines were fitted through the mean calculated of temperature of a given sample. The red bar represents closure temperatures for a given sampling site at 23 Ma determined by John and Foster (1993) with thermochronometry using 40Ar/39Ar and fission-track data.
Figure 5.5: Mohave Wash fault (MWF) measured δ18O(Qtz) values plotted versus respective calculated δ18O of fluids in oxygen isotope equilibrium with quartz (blue circle) found using the quartz-H2O oxygen isotope fractionation following Clayton et al. (1972). MWF measured δ18O(Ep) values versus respective calculated δ18O of fluids in oxygen isotope equilibrium with epidote (green triangle) using quartz-epidote oxygen isotope fractionation of Mathews (1994) and quartz-H2O oxygen isotope fractionation of Clayton et al. (1972). Analogous calculations were made for fluids in oxygen isotope equilibrium with undeformed granodiorite or gneiss (horizontal bar). Water in
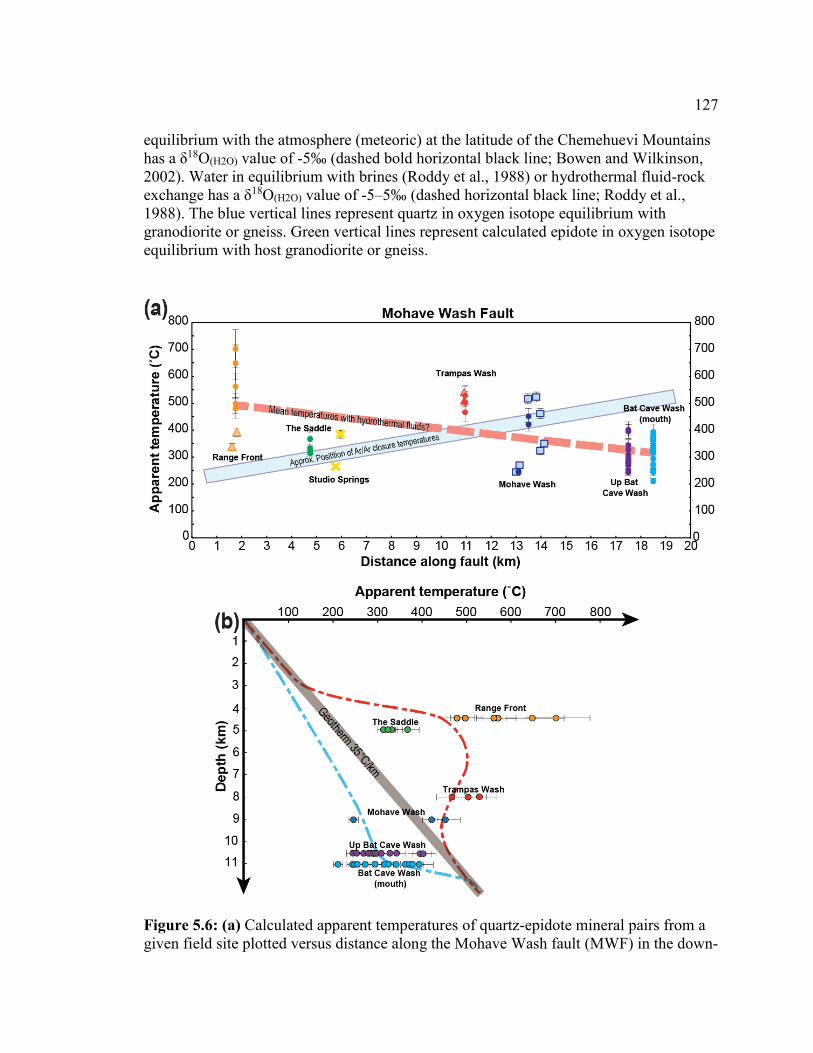
127
equilibrium with the atmosphere (meteoric) at the latitude of the Chemehuevi Mountains has a δ18O(H2O) value of -5‰ (dashed bold horizontal black line; Bowen and Wilkinson, 2002). Water in equilibrium with brines (Roddy et al., 1988) or hydrothermal fluid-rock exchange has a δ18O(H2O) value of -5–5‰ (dashed horizontal black line; Roddy et al., 1988). The blue vertical lines represent quartz in oxygen isotope equilibrium with granodiorite or gneiss. Green vertical lines represent calculated epidote in oxygen isotope equilibrium with host granodiorite or gneiss.
Figure 5.6: (a) Calculated apparent temperatures of quartz-epidote mineral pairs from a given field site plotted versus distance along the Mohave Wash fault (MWF) in the down-
128
dip direction. Colored symbols not circles represent quartz-epidote mineral pairs analyzed by laser fluorination from MacDonald, 2014 (error bars indicate possible range of temperatures). The blue bar represents closure temperatures at 23 Ma determined by John and Foster (1993) with thermochronometry using 40Ar/39Ar and fission-track data (width of the bar represents the ~1–4 km error associated with paleoisotherm placement). Red bar represents the mean temperature (at a given sampling site) of the MWF with the effect of up-dip localized fluid flow. Apparent temperatures were calculated using the oxygen isotope fractionation following Matthews (1994) and quartz-epidote mineral pairs. (b) The effect of rapid advection of heat transport along the MWF relative to the overall geothermal gradient (~35°C/km; brown bar) caused by localized fluid flow at seven sample areas (separated by ~17 km of slip direction) plotted at respective paleodepths (assuming fault initiation at ~11 km depth dipping ~25°). A significant horizontal temperature gradient along the MWF from the deep recharge zone to the shallow discharge zone when the overall mean calculated temperature of a given sampling area along the MWF is plotted verses paleodepth. At a given depth, channelized fluid flow of low-δ18O surface-derived fluids up the MWF creates sharp vertical thermal gradients (blue and red dashed lines).
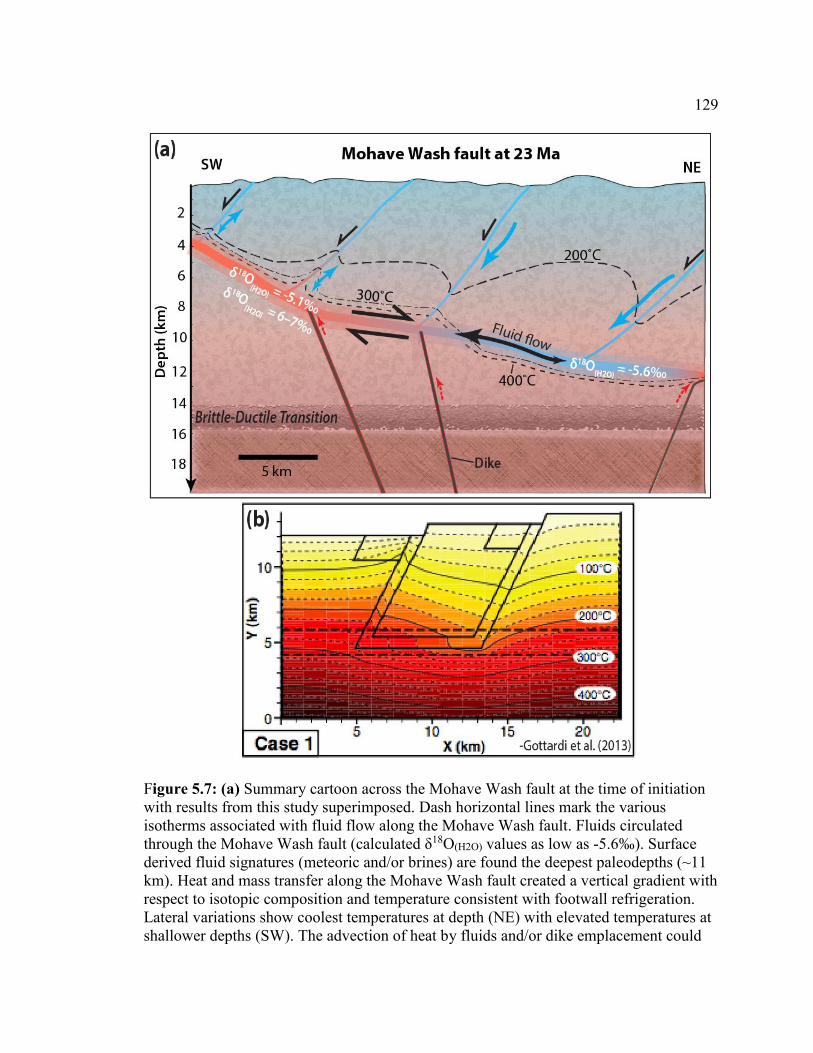
129
Figure 5.7: (a) Summary cartoon across the Mohave Wash fault at the time of initiation with results from this study superimposed. Dash horizontal lines mark the various isotherms associated with fluid flow along the Mohave Wash fault. Fluids circulated through the Mohave Wash fault (calculated δ18O(H2O) values as low as -5.6‰). Surface derived fluid signatures (meteoric and/or brines) are found the deepest paleodepths (~11 km). Heat and mass transfer along the Mohave Wash fault created a vertical gradient with respect to isotopic composition and temperature consistent with footwall refrigeration. Lateral variations show coolest temperatures at depth (NE) with elevated temperatures at shallower depths (SW). The advection of heat by fluids and/or dike emplacement could

130
influence heat and fluid migration locally. (b) Gottardi et al. (2013) provided a model showing elevated temperatures (and δ18O values) within the discharge zone of a given detachment (i.e., shallow damage zone) relative to the recharge zone (i.e., deep damage zone).
131
6. Conclusions
The Mohave Wash fault (MWF) sampled show evidence of a complex oxygen
isotope system. Based on the relations observed between δ18O and specific
textures/domains of 23 analyzed rock samples by ion microprobe, the following
conclusions were drawn:
(1) Oxygen isotope thermometry applied to the early slip, greenschist facies fault rocks is
complicated by grain scale disequilibrium.
Nineteen microstructural domains were found in 14 rock samples to contain two
or more mineral pairs used for thermometry. Two domains containing quartz give
a range in δ18O(Qtz) > 2.0‰ (maximum of 6.4‰) and four domains containing
epidote give a range in δ18O(Ep) > 2.0‰ (maximum of 5.6‰).
The range of Δ18OQtz-Ep (δ18OQtz - δ18OEp) measured on rims on adjacent grains
within the same microstructural domain, which are considered most likely to be
equilibrated, varied from 0.1 to 8.0‰ in 14 rock samples containing 22
microstructures where two or more pairs were analyzed. However, only three
microstructures from three rock samples exhibit a range in Δ18O(Qtz-Ep) > 2.0‰.
The difference in calculated temperatures for these coexisting pairs within these
microstructures is therefore ~170 to 260°C, implying that some structural
domains record a protracted history of mineralization.
Overall, variability in the analyses of 388 δ18O values from 63 separate
microstructural domains found them to average 73% homogeneous.
132
(2) Heat and mass transfer along a low-angle normal fault create locally steep vertical
gradients with respect to isotopic composition and temperature. The decrease in
temperature and presence of fluids to promote high fluid pore pressure may help facilitate
strain localization over time.
Extensive low-δ18O(mineral) values found throughout the recharge zone of the MWF
are consistent with surface-derived fluids penetrating the fault during early slip.
Quartz and epidote δ18O values showing varying degrees of 18O depletion are
interpreted to indicate different degrees of fluid-rock interaction at the mm-scale.
Vertical trends of δ18O(mineral) values decreasing toward the fault are observed in
all transects of the MWF.
Calculated apparent oxygen isotope equilibrium temperatures show extreme
vertical and horizontal thermal gradients that are consistent with models of
channelized fluid flow at mid-crustal depths.
o Vertical thermal gradients of 18°C/50 m (The Saddle), 478°C/50 m
(Mohave Wash), and 147°C/50 m (Bat Cave Wash) all decrease toward
the MWF.
o Horizontal thermal gradient along fault of 70°C/km decrease with depth.
(3) Decreasing water-rock ratios and/or interactions with higher δ18O fluid occur at
shallower paleodepths along the fault.
Extensive high-δ18O(mineral) (i.e., rock-dominated) values are found throughout
shallower paleodepths of the MWF, consistent with horizontal fluid migration
originating at depth and migrating up the fault.
133
Vertical gradients of δ18O(mineral) values and temperature become steeper at
shallower depths.
4) Dike emplacement may serve as an important source of heat locally. Future work
should incorporate a more in-depth examination of the local dikes to provide a more
thorough explanation in their role in fluid migration within the study area.
134
References
Abers, G., 1991, Possible seismogenic shallow-dipping normal faults in the Woodlark-
D’Entrecasteaux extensional environment, Papua New Guinea: Geology, 19, p.1205- 1208.
Abers, G.A., 2009, Research Focus: Slip on shallow dipping normal faults: Geology, v.
37, p. 767–768. Anderson, E.M., 1951, The dynamics of faulting (2nd edition): Edinburgh, Scotland,
Oliver and Boyd, p. 191. Axen, G.J., Fletcher, J.M., Cowgill, E., Murphy, M., Kapp, P., MacMillan, I., Ramos-
Vel.z quez, E., and Aranda-Gomez, J., 1999, Range-front fault scarps of the Sierra El Mayor, Baja California: Formed above an active low-angle normal fault?. Geology 27, 247–250.
Axen, G., Selverstone, J., and Wawrzyniec, T., 2001, High-temperature embrittlement of
extensional Alpine mylonite zones in the midcrustal ductilebrittle transition. J. Geophys. Res., 106, 4337 – 4347
Axen, G.J., 2004, Mechanics of low-angle normal faults, in Karner and others eds.,
Rheology and deformation in the lithosphere at continental margins: New York, Columbia University Press, 46-91.
Axen, G., 2007, Research focus: Significance of large-displacement, low-angle normal
faults, Geology, 35(3), 287–288. Berger, G.W., and York, D., 1981, Geothermometry from 40Ar/39Ar dating experiments.
Geochimica et Cosmochimica Acta, 45, 795-811. Bowen, G.J., and Wilkinson, B., 2002, Spatial distribution of δ18O in meteoric
precipitation: Geology, v. 30(4), p. 315-318. Bowman, J.R., Willett, S.D., and Cook, S.J., 1994. Oxygen isotopic transport and
exchange during fluid flow: one dimensional models and applications. American Journal of Science. 294, 1e55.
Chacko, T., Cole, D.R., and Horite, J., 2001, Equilibrium oxygen, hydrogen, and carbon
isotope fractionation factors applicable to geologic systems, in stable isotopes, Valley J.W., Cole D.R. eds., RiMG. 43, p. 1-191.
Clayton, R.N., O'Neil, J.R., and Mayeda, T.K., 1972, Oxygen isotope exchange between
quartz and water. Journal of Geophysical research, 77(17), 3057-3067.
135
Cole, D.R., 1985, A preliminary evaluation of oxygen isotopic exchange between chlorite
and water; Geological Society of America Abstract with Programs, 17, p. 550. Cole, D.R., and Chakraborty, S., 2001, Rates and mechanisms of isotopic exchange:
Reviews in Mineralogy and Geochemistry, 43, p. 83–223. Collettini, C., and Sibson, R., 2001, Normal faults, normal friction?: Geology, v. 29, p.
927- 930. Collettini, C., and Holdsworth, R., 2004, Fault zone weakening and character of slip
along low-angle normal faults: insights from the Zuccale fault, Elba, Italy: J. Geological Society London, 161, 1039-1051.
Collettini, C., Niemeijer, A., Viti, C., and Marone, C.J., 2009, Fault zone fabric and fault
weakness. Nature 462, 907–910. Collettini, C., 2011, The mechanical paradox of low-angle normal faults: Current
understanding and open questions: Tectonophysics, 510(3), 253-268. Coney, P.J., 1980, Cordilleran metamorphic core complexes: An overview. Geological
Society of America Memoirs, 153, 7-31. Davis, G.A., Anderson, J.L., Frost, E.G., and Shackelford, T.J., 1980, Mylonitization and
detachment faulting in the Whipple-Buckskin-Rawhide Mountains terrane, southeastern California and western Arizona, in Crittenden, M. L., Jr., Coney, P. J., and Davis, G. H., eds., Cordilleran core complexes: Geological Society of America Memoir 153, 79-129.
Davis, G.A., 1988, Rapid upward transport of mid-crustal mylonitic gneisses in the
footwall of a Miocene detachment fault, Whipple Mountains, southeastern California, Geol. Rundsch., 77(1), 191–209.
Davis, G.A., and G.S. Lister, 1988, Detachment faulting in continental extension:
Perspectives from the southwestern U.S. Cordillera, Spec. Pap. Geol. Soc. Am., 218, 133–159.
Davis, G.H., Reynolds, S.J., and Kluth, C., 1996, Structural geology of rocks and regions
(776). New York: Wiley. Famin, V., Philippot, P., Jolivet, L., and Agard, P., 2004, Evolution of hydrothermal
regime along a crustal shear zone, Tinos Island, Greece: Tectonics, 23, (TC5004).
136
Ferreira, V.P., Valley, J.W., Sial, A.N., and Spicuzza, M.J., 2003, Oxygen isotope compositions and magmatic epidote from two contrasting metaluminous granitoids, NE Brazil. Contrib Mineral Petrol 145:205–216.
Ferry J.M., Ushikubo T., Kita N.T., and Valley J.W., 2010, Assessment of grain-scale
homogeneity of carbon and oxygen isotope compositions of minerals in carbonate-bearing metamorphic rocks by ion microprobe. Geochimica et Cosmochimica Acta, 74, 6517–6540.
Ferry, J. M., Kitajima, K., Strickland, A., and Valley, J.W., 2014, Ion microprobe survey
of the grain-scale oxygen isotope geochemistry of minerals in metamorphic rocks. Geochimica et Cosmochimica Acta, 144, 403-433.
Fricke, H.C., Wickham, S., and O’Neil J.R., 1992, Oxygen and hydrogen isotope
evidence for meteoric water infiltration during mylonitization and uplift in the Ruby Mountains-East Humboldt Range core complex, Nevada, Contrib. Mineral. Petrol., 111, 203–221.
Glazner A., and Bartley J., 1991, Volume loss, fluid flow and the state off strain in
extensional mylonites from the central Mojave Desert, Califnoria. Journal of Structural Geology, v 13, p 587-594.
Gottardi, R., Teyssier, C., Mulch, A., Vennemann, T.W., and Wells, M.L., 2011,
Preservation of an extreme transient geotherm in the Raft River detachment shear zone. Geology 39 (No. 8), 759e762.
Gottardi, R., Kao, P-H., Saar, M.O., and Teyssier, C., 2013, Effects of permeability fields
on fluid, heat, and oxygen isotope transport in extensional detachment systems. Geochem. Geophys. Geosyst. 1e30.
Gottardi, R., Teyssier, C., Mulch, A., Valley, J.W., Spicuzza, M.J., Vennemann, T.W.,
and Heizler, M., 2015, Strain and permeability gradients traced by stable isotope exchange in the Raft River detachment shear zone, Utah. Journal of Structural Geology, 71, 41-57.
Harrison, T.M., 1982, Diffusion of 40Ar in hornblende. Contributions to Mineralogy and
Petrology, 78(3), 324-331. Holk, G.J., and Taylor Jr., H.P., 2000, Water as a petrologic catalyst driving 18O/16O
homogenization and anatexis of the middle crust in the metamorphic core complexes of British Columbia. Int. Geol. Rev. 42 (No. 2), 97e130.
Holk, G.J., and Taylor Jr., H.P., 2007, 18O/16O evidence for contrasting
137
hydrothermal regimes involving magmatic and meteoric-hydrothermal waters at the Valhalla metamorphic core complex, British Columbia, Economic Geology, 102(6), 1063–1078.
Howard, K.A., and John, B.E., 1987, Crustal extension along a rooted system of low-
angle normal faults: Colorado River extensional corridor, California and Arizona, in Coward, M. P., Dewey, J. F., and Hancock, P. L., eds., Continental extensional tectonics: Geological Society of London Special Paper 28, 299-312.
John, B. E., 1987, Geometry and evolution of a mid-crustal extensional fault system:
Chemehuevi Mountains, southeastern California, in Coward, M. P., Dewey, J. F., and Hancock, P. L., eds., Continental extensional tectonics: Geological Society of London Special Paper 28, 313-335.
John, B.E., and Foster, D.A., 1993, Structural and thermal constraints on the initiation
angle of detachment faulting in the southern Basin and Range: the Chemehuevi Mountains case study. Geological Society of America Bulletin 105, 1091–1108.
John, B.E., and Cheadle, M.J., 2010, Deformation and alteration associated with oceanic
and continental detachment fault systems: are they similar? In: Rona, Devey, Dyment, Murton (Eds.), Diversity of Hydrothermal Systems on Slow-spreading Ocean Ridges, AGU Monograph, 175–205.
Kamb, W.B., 1959, Ice petrofabric observations from Blue Glacier, Washington, in
relation to theory and experiment: Journal of Geophysical Research, 64, 1891-1909.
Kelly, J.L., Fu, B., Kita, N.T., and Valley, J.W., 2007, Optically continuous silcrete
quartz cements of the St. Peter Sandstone: high precision oxygen isotope analysis by ion microprobe. Geochimica et Cosmochimica Acta, 71, 3812–3832.
Kerrich, R., and Hyndman, D., 1986, Thermal and fluid regimes in the Bitterroot lobe–
Sapphire block detachment zone, Montana: Evidence from 18O/16O and geologic relations. Geological Society of America Bulletin, 97, p. 147–155.
Kerrich, R., and Rehrig, W.A., 1987, Fluid motion associated with Tertiary
mylonitization and detachment faulting: 18O/16O evidence from the Picacho metamorphic core complex, Arizona. Geology, 15(1), p. 58-62.
Kita, N.T., Ushikubo, T., Fu, B., and Valley, J.W., 2009, High precision SIMS oxygen
isotope analyses and the effect of sample topography. Chemical Geology, 264:43-57.
138
Kohn, M.J., Spear, F.S., and Valley, J.W., 1997, Dehydration melting and fluid recycling during metamorphism: Rangeley Formation, New Hampshire, USA. Journal of Petrology 38, 1255-1277.
Lachenbruch, A.H., 1980, Frictional heating, fluid pressure, and the resistance to fault
motion. Journal of Geophysical Research, 85: 6097-6112. LaForge, J.S., John, B., Grimes, C.B., and MacDonald, C.J., 2014, Microstructural
Character and Strain Localization at Initiation of a Low-Angle Normal Fault in Crystalline Basement (Chemehuevi Mountains, SE California): American Geophysical Union proceedings, fall meeting, abs. T11B-4554.
Lister, G. S., and Davis, G. A., 1989, The origin of metamorphic core complexes and
detachment faults formed during Tertiary continental extension in the northern Colorado River region, U.S.A.: Journal of Structural Geology, 11, 65-94.
Lopez, D.L., and Smith, L., 1995, Fluid flow in fault zones: Analysis of the interplay of
convective circulation and topographically driven groundwater flow, Water Resources Research, 31(6), 1489–1503.
Losh, S., 1989, Fluid-rock interaction in an evolving ductile shear zone and across the
brittle-ductile transition, central Pyrenees, France. American Journal of Science, 289, 600–648.
Losh, S., 1997, Stable isotope and modeling studies of fluid-rock interaction associated
with the Snake Range and Mormon Peak detachment faults, Nevada, Geological Society of America Bulletin, 109, 300–323.
Ludwig K.R., 2012, ISOPLOT 3.75, A geochronological toolkit for Microsoft Excel.
Berkeley Geochronology Center, Berkeley. MacDonald, C.J., Grimes, C.B., John, B., LaForge, J.S., Kilian, R., Heilbronner, R.,
Stunitz, H., Valley, J.W., and Spicuzza, M.J., 2014, Oxygen isotope constraints on the early slip history of the Mohave Wash fault, Chemehuevi Mountains, SE CA: Geological Society of America Abstracts with Programs, v. 46, no. 5, p. 31.
MacDonald, C.J., 2014, The role of crustal-scale fluid flow during early slip on a low-
angle normal fault: An oxygen isotope investigation in the Chemehuevi Mountains, SE CA., Graduate Thesis, Ohio University.
Matthews, A., 1994, Oxygen isotope geothermometers for metamorphic rocks. Journal
Metamorphic Geology, 12, 211–219. McCaig, A.M., Wayne, D.M., Marshall, J.D., Banks, D., and Henderson, I., 1995,
Isotopic and fluid inclusion studies of fluid movement along the Gavarnie Thrust,
139
central Pyrenees; reaction fronts in carbonate mylonites. American Journal of Science, 295(3), 309-343.
McCaig, A.M., and Harris, M., 2012, Hydrothermal circulation and the dike-gabbro
transition in the detachment mode of slow seafloor spreading. Geology, 40(4), 367-370.
Morad, S., El-Ghali, M.A.K., Caja, M.A., Sirat, M., Al-Ramadan, K., and Mansurbeg, H.,
2010, Hydrothermal alteration of plagioclase in granitic rocks from Proterozoic basement of SE Sweden: Geological Journal, 45, 105–116.
Morrison, J., 1994, Meteoric water-rock interaction in the lower plate of the Whipple
Mountain metamorphic core complex, California: J. Metamorphic Geology, 12, 827 – 840.
Morrison, J., and Anderson, J.L., 1998, Footwall refrigeration along a detachment fault:
Implications for the thermal evolution of core complexes: Science, 279, 63 – 66. Mulch, A., Cosca, M.A., Fiebig, J., and Andresen, A., 2005. Time scales of mylonitic
deformation and meteoric fluid infiltration during extensional detachment faulting: an integrated in situ 40Ar/39Ar geochronology and stable isotope study of the Porsgrunn-Kristiansand Shear Zone (Southern Norway). Earth Planet. Science Letters. 233, 375e390.
Mulch, A., Teyssier, C., Cosca, M. A., and Chamberlain, C. P., 2007, Stable isotope
paleoaltimetry of Eocene core complexes in the North American Cordillera. Tectonics, 26(4).
Nesbitt, B.E., and Muehlenbachs, K.,1989, Origins and movement of fluids during
deformaion and metamorphism in the Canadian Cordillera: Science, v. 245, p. 733-736.
O'Neil, J.R., and Taylor Jr., H.P., 1967, The oxygen isotope and cation exchange
chemistry of feldspars; American Mineral. 52, 1414-1437. O'neil, J.R., 1986, Terminology and Standards. In “Stable Isotope in High Temperature
Geological Processes”, J.W. Valley, J.R. O'Neil, and H.P. Taylor, eds. Mineralogical Society of America. Reviews in Mineralogy 16, 561-570.
Prante, M.R., Evans, J.P., Janecke, S.U., and Steely, A., 2014, Evidence for paleoseismic
slip on a continental low-angle normal fault: Tectonic pseudotachylyte from the West Salton detachment fault, CA, USA. Earth and Planetary Science Letters, 387, 170-183.
140
Person, M., Mulch, A., Teyssier, C., and Gao, Y., 2007. Isotope transport and exchange within metamorphic core complexes. American Journal of Science. 307 (No. 3), 555e589.
Pollington A.D., 2013, Stable isotope signatures of diagenesis: natural and experimental
studies. Ph.D. thesis, Univ. of Wisconsin, Madison. Prante, M.R., Evans, J.P., Janecke, S.U., and Steely, A., 2013, Evidence for paleoseismic
slip on a continental low-angle normal fault: Tectonic pseudotachylyte from the West Salton detachment fault, CA, USA: Earth and Planetary Science Letters, 387, 170-183.
Rehrig, W.A., and Reynolds, S.J., 1980, Geologic and geochronologic reconnaissance of
a northwest-trending zone of metamorphic core complexes in southern and western Arizona. Geological Society of America Memoirs, 153, 131-158.
Reynolds, S.J., and Lister, G.S., 1990, Folding of mylonitic zones in Cordilleran
metamorphic core complexes: Evidence from near the mylonitic front. Geology, 18(3), 216-219.
Roddy, M.S., Reynolds, S.J., Smith, B.M. and Ruiz, J., 1988, K- metasomatism and
detachment-related mineralization, Harcuvar Mountains, Arizona. Geological Society of America Bulletin. 100, 1627-1639.
Selverstone, J., Axen, G.J., and Luther, A., 2012, Fault localization controlled by fluid
infiltration into mylonites: Formation and strength of low‐ angle normal faults in the midcrustal brittle‐ plastic transition. Journal of Geophysical Research: Solid Earth (1978–2012), 117(B6).
Sharp, Z.D., Giletti, B.J., and Yoder Jr., H.S., 1991, Oxygen diffusion rates in quartz
exchanged with CO2: Earth and Planetary Science Letters, 107, 339-348. Sheppard, S.M., 1986, Characterization and isotopic variations in natural waters. Reviews
in Mineralogy and Geochemistry, 16(1), 165-183. Shmulovich, K., Graham, C., and Yardley, B., 2001, Quartz, albite and diopside
solubilities in H2O-NaCl and H2O-CO2 fluids at 0.5–0.9 GPa, Contrib. Mineral. Petrol., 141(1), 95-108.
Sibson, R.H., Moore, J.McM., and Rankin, A.H., 1975, Seismic pumping-a hydrothermal
fluid transport mechanisms: J. Geol. Soc. London. 131, 653-659. Sibson, R.H., 1998. Brittle failure mode plots for compressional and extensional tectonic
regimes. Journal of Structural Geology. 20, 655e660.
141
Sibson, R.H., 2000, Fluid involvement in normal faulting. Journal of Geodynamics 29, 469–499.
Smith, B., Reynolds, S., Day, H., and Bodnar R., 1991, Deep-seated fluid involvement in
ductile-brittle deformation and mineralization, South Mountains metamorphic core complex, Arizona: GSA Bulletin, v 103, p 559-569.
Smith, S.A., Holdsworth, R.E., Collettini, C., MacPherson, C.G., Pearce, M.A., and
Faulkner, D., 2008, The nature and evolution of fluid related weakening mechanisms along a continental low-angle normal fault: the Zuccale fault, Elbe Island, Italy. Eos Transactions, AGU, 89(53) Fall Meet. Suppl. Abstract T21D-02.
Spencer, J.E., and Welty, J.W., 1986, Possible controls of base and precious metal
mineralization associated with Tertiary detachment faults in the lower Colorado River trough, Arizona and California: Geology, 14, 195-198.
Spencer, J.E., and Reynolds, S.J., eds., 1989, Geology and mineral resources of the
Buckskin and Rawhide Mountains, west-central Arizona: Arizona Geological Survey Bulletin 198, p 280.
Spencer, J.E., and Reynolds, S.J., 1991, Tectonics of mid-Tertiary extension along a
transect through west central Arizona. Tectonics, 10(6), 1204-1221. Taylor Jr, H.P., 1997, Oxygen and hydrogen isotope relationships in hydrothermal
mineral deposits, in Barnes, H.L., ed., Geochemistry of hydrothermal ore de- posits, 3rd ed.: New York, Wiley, 229–302.
Tulloch, A.J., 1979, Secondary Ca–Al silicates as low-grade alteration products of
granitoid biotite. Contributions to Mineralogy and Petrology 69, 105–117. Valley, J.W., and Graham, C.M., 1996, Ion microprobe analysis of oxygen isotope ratios
in quartz from Skye granite; healed micro-cracks, fluid flow, and hydrothermal exchange: Contributions to Mineralogy and Petrology, 124, 225–234.
Valley, J.W., 2001, Stable isotope thermometry at high temperatures. In Stable Isotope
Geochemistry, Reviews in Mineralogy and Geochemistry. (J.W. Valley and D.R. Cole, eds.) 43, 365-414.
Valley, J.W., and Kita, N., 2009, In situ oxygen isotope geochemistry by ion microprobe.
Mineralogical Association of Canada Short Course 41, Toronto, May 2009: 19-63.
Whitney, D.L., Teyssier, C., Rey, P.F., and Buck, W.R., 2013, Continental and oceanic
core complexes. Geological Society of America Bulletin, 26 p., doi:10.1130/B30754.1.
142
Wickham, S.M., Peters, M.T., Fricke, H.C., and O’Neil, J.R., 1993, Identification of
magmatic and meteoric fluid sources and upward- and downward-moving infiltration fronts in a metamorphic core complex, Geology, 21, 81–84.
Yin, A., and Dunn, J.F., 1992, Structural and stratigraphic development of the Whipple-
Chemehuevi detachment system, southeastern California: Implications for the geometrical evolution of domal and basinal low-angle normal faults. Geological Society of America Bulletin. 104:659–674.
Zheng, Y.F., 1993, Calculation of oxygen isotope fractionation in hydroxyl-bearing
silicates. Earth and Planetary Science Letters, 120(3), 247-263.
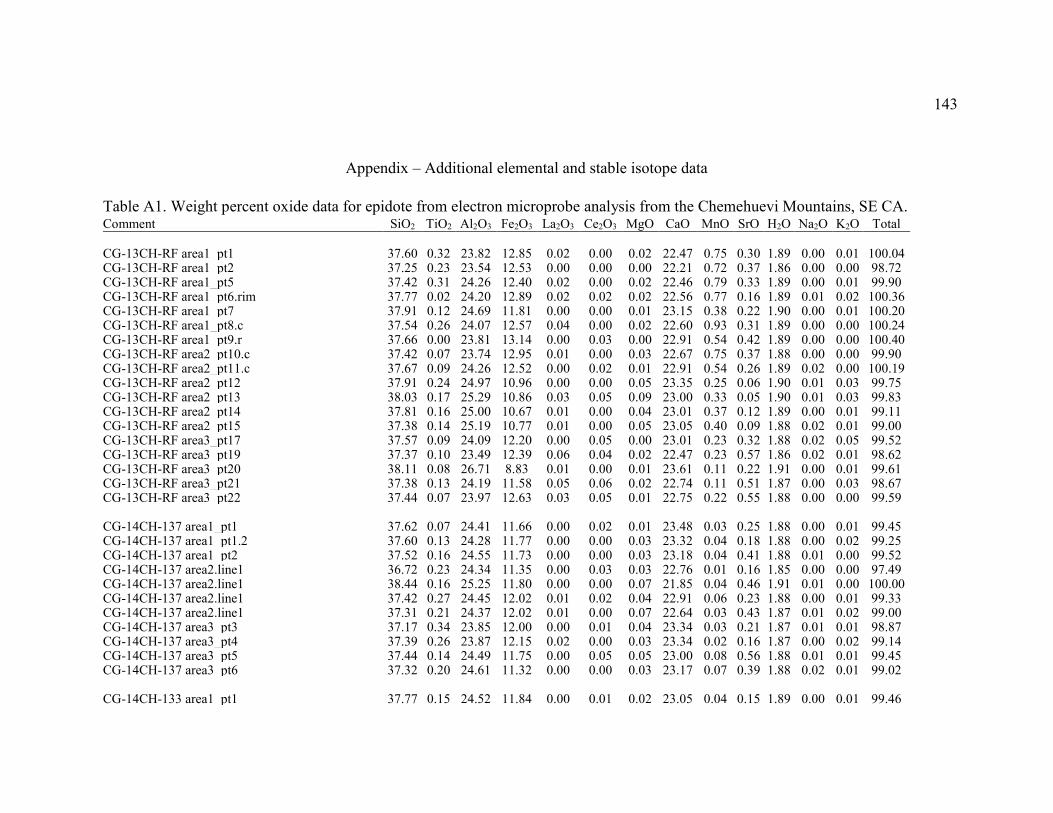
143
Appendix – Additional elemental and stable isotope data
Table A1. Weight percent oxide data for epidote from electron microprobe analysis from the Chemehuevi Mountains, SE CA. Comment SiO2 TiO2 Al2O3 Fe2O3 La2O3 Ce2O3 MgO CaO MnO SrO H2O Na2O K2O Total CG-13CH-RF area1_pt1 37.60 0.32 23.82 12.85 0.02 0.00 0.02 22.47 0.75 0.30 1.89 0.00 0.01 100.04 CG-13CH-RF area1_pt2 37.25 0.23 23.54 12.53 0.00 0.00 0.00 22.21 0.72 0.37 1.86 0.00 0.00 98.72 CG-13CH-RF area1_pt5 37.42 0.31 24.26 12.40 0.02 0.00 0.02 22.46 0.79 0.33 1.89 0.00 0.01 99.90 CG-13CH-RF area1_pt6.rim 37.77 0.02 24.20 12.89 0.02 0.02 0.02 22.56 0.77 0.16 1.89 0.01 0.02 100.36 CG-13CH-RF area1_pt7 37.91 0.12 24.69 11.81 0.00 0.00 0.01 23.15 0.38 0.22 1.90 0.00 0.01 100.20 CG-13CH-RF area1_pt8.c 37.54 0.26 24.07 12.57 0.04 0.00 0.02 22.60 0.93 0.31 1.89 0.00 0.00 100.24 CG-13CH-RF area1_pt9.r 37.66 0.00 23.81 13.14 0.00 0.03 0.00 22.91 0.54 0.42 1.89 0.00 0.00 100.40 CG-13CH-RF area2_pt10.c 37.42 0.07 23.74 12.95 0.01 0.00 0.03 22.67 0.75 0.37 1.88 0.00 0.00 99.90 CG-13CH-RF area2_pt11.c 37.67 0.09 24.26 12.52 0.00 0.02 0.01 22.91 0.54 0.26 1.89 0.02 0.00 100.19 CG-13CH-RF area2_pt12 37.91 0.24 24.97 10.96 0.00 0.00 0.05 23.35 0.25 0.06 1.90 0.01 0.03 99.75 CG-13CH-RF area2_pt13 38.03 0.17 25.29 10.86 0.03 0.05 0.09 23.00 0.33 0.05 1.90 0.01 0.03 99.83 CG-13CH-RF area2_pt14 37.81 0.16 25.00 10.67 0.01 0.00 0.04 23.01 0.37 0.12 1.89 0.00 0.01 99.11 CG-13CH-RF area2_pt15 37.38 0.14 25.19 10.77 0.01 0.00 0.05 23.05 0.40 0.09 1.88 0.02 0.01 99.00 CG-13CH-RF area3_pt17 37.57 0.09 24.09 12.20 0.00 0.05 0.00 23.01 0.23 0.32 1.88 0.02 0.05 99.52 CG-13CH-RF area3_pt19 37.37 0.10 23.49 12.39 0.06 0.04 0.02 22.47 0.23 0.57 1.86 0.02 0.01 98.62 CG-13CH-RF area3_pt20 38.11 0.08 26.71 8.83 0.01 0.00 0.01 23.61 0.11 0.22 1.91 0.00 0.01 99.61 CG-13CH-RF area3_pt21 37.38 0.13 24.19 11.58 0.05 0.06 0.02 22.74 0.11 0.51 1.87 0.00 0.03 98.67 CG-13CH-RF area3_pt22 37.44 0.07 23.97 12.63 0.03 0.05 0.01 22.75 0.22 0.55 1.88 0.00 0.00 99.59
CG-14CH-137 area1_pt1 37.62 0.07 24.41 11.66 0.00 0.02 0.01 23.48 0.03 0.25 1.88 0.00 0.01 99.45 CG-14CH-137 area1_pt1.2 37.60 0.13 24.28 11.77 0.00 0.00 0.03 23.32 0.04 0.18 1.88 0.00 0.02 99.25 CG-14CH-137 area1_pt2 37.52 0.16 24.55 11.73 0.00 0.00 0.03 23.18 0.04 0.41 1.88 0.01 0.00 99.52 CG-14CH-137 area2.line1 36.72 0.23 24.34 11.35 0.00 0.03 0.03 22.76 0.01 0.16 1.85 0.00 0.00 97.49 CG-14CH-137 area2.line1 38.44 0.16 25.25 11.80 0.00 0.00 0.07 21.85 0.04 0.46 1.91 0.01 0.00 100.00 CG-14CH-137 area2.line1 37.42 0.27 24.45 12.02 0.01 0.02 0.04 22.91 0.06 0.23 1.88 0.00 0.01 99.33 CG-14CH-137 area2.line1 37.31 0.21 24.37 12.02 0.01 0.00 0.07 22.64 0.03 0.43 1.87 0.01 0.02 99.00 CG-14CH-137 area3_pt3 37.17 0.34 23.85 12.00 0.00 0.01 0.04 23.34 0.03 0.21 1.87 0.01 0.01 98.87 CG-14CH-137 area3_pt4 37.39 0.26 23.87 12.15 0.02 0.00 0.03 23.34 0.02 0.16 1.87 0.00 0.02 99.14 CG-14CH-137 area3_pt5 37.44 0.14 24.49 11.75 0.00 0.05 0.05 23.00 0.08 0.56 1.88 0.01 0.01 99.45 CG-14CH-137 area3_pt6 37.32 0.20 24.61 11.32 0.00 0.00 0.03 23.17 0.07 0.39 1.88 0.02 0.01 99.02
CG-14CH-133 area1_pt1 37.77 0.15 24.52 11.84 0.00 0.01 0.02 23.05 0.04 0.15 1.89 0.00 0.01 99.46
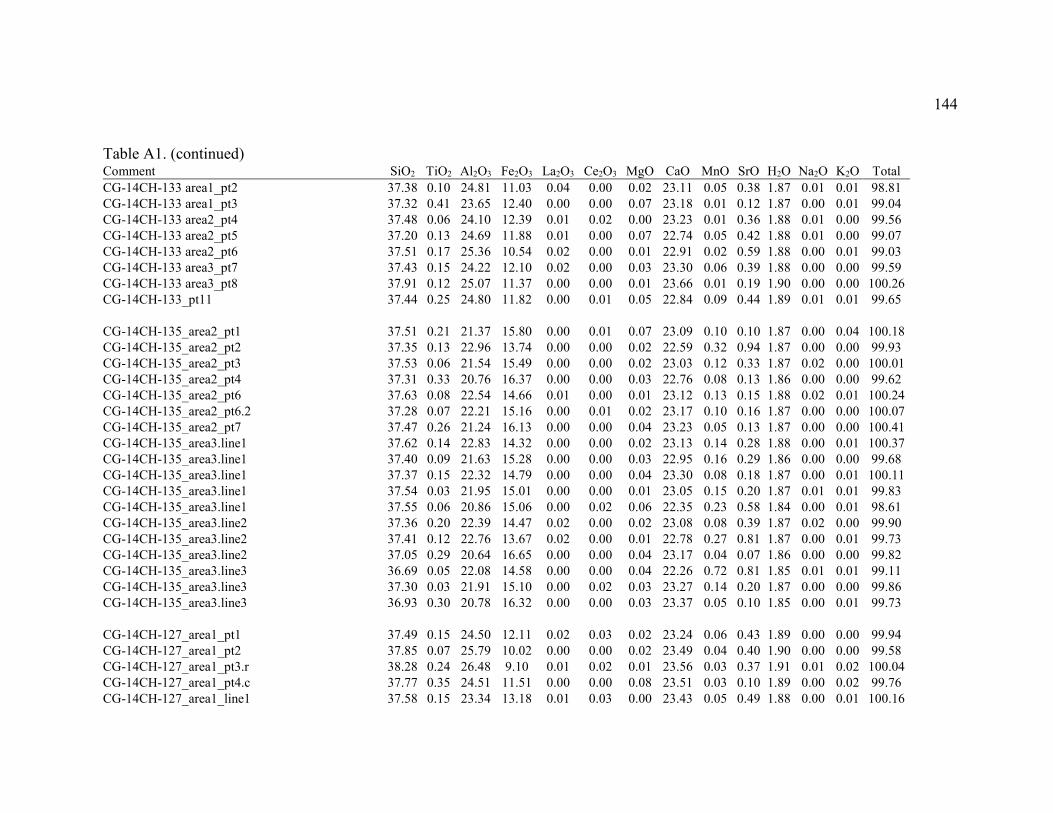
144
Table A1. (continued) Comment SiO2 TiO2 Al2O3 Fe2O3 La2O3 Ce2O3 MgO CaO MnO SrO H2O Na2O K2O Total
CG-14CH-133 area1_pt2 37.38 0.10 24.81 11.03 0.04 0.00 0.02 23.11 0.05 0.38 1.87 0.01 0.01 98.81 CG-14CH-133 area1_pt3 37.32 0.41 23.65 12.40 0.00 0.00 0.07 23.18 0.01 0.12 1.87 0.00 0.01 99.04 CG-14CH-133 area2_pt4 37.48 0.06 24.10 12.39 0.01 0.02 0.00 23.23 0.01 0.36 1.88 0.01 0.00 99.56 CG-14CH-133 area2_pt5 37.20 0.13 24.69 11.88 0.01 0.00 0.07 22.74 0.05 0.42 1.88 0.01 0.00 99.07 CG-14CH-133 area2_pt6 37.51 0.17 25.36 10.54 0.02 0.00 0.01 22.91 0.02 0.59 1.88 0.00 0.01 99.03 CG-14CH-133 area3_pt7 37.43 0.15 24.22 12.10 0.02 0.00 0.03 23.30 0.06 0.39 1.88 0.00 0.00 99.59 CG-14CH-133 area3_pt8 37.91 0.12 25.07 11.37 0.00 0.00 0.01 23.66 0.01 0.19 1.90 0.00 0.00 100.26 CG-14CH-133_pt11 37.44 0.25 24.80 11.82 0.00 0.01 0.05 22.84 0.09 0.44 1.89 0.01 0.01 99.65
CG-14CH-135_area2_pt1 37.51 0.21 21.37 15.80 0.00 0.01 0.07 23.09 0.10 0.10 1.87 0.00 0.04 100.18 CG-14CH-135_area2_pt2 37.35 0.13 22.96 13.74 0.00 0.00 0.02 22.59 0.32 0.94 1.87 0.00 0.00 99.93 CG-14CH-135_area2_pt3 37.53 0.06 21.54 15.49 0.00 0.00 0.02 23.03 0.12 0.33 1.87 0.02 0.00 100.01 CG-14CH-135_area2_pt4 37.31 0.33 20.76 16.37 0.00 0.00 0.03 22.76 0.08 0.13 1.86 0.00 0.00 99.62 CG-14CH-135_area2_pt6 37.63 0.08 22.54 14.66 0.01 0.00 0.01 23.12 0.13 0.15 1.88 0.02 0.01 100.24 CG-14CH-135_area2_pt6.2 37.28 0.07 22.21 15.16 0.00 0.01 0.02 23.17 0.10 0.16 1.87 0.00 0.00 100.07 CG-14CH-135_area2_pt7 37.47 0.26 21.24 16.13 0.00 0.00 0.04 23.23 0.05 0.13 1.87 0.00 0.00 100.41 CG-14CH-135_area3.line1 37.62 0.14 22.83 14.32 0.00 0.00 0.02 23.13 0.14 0.28 1.88 0.00 0.01 100.37 CG-14CH-135_area3.line1 37.40 0.09 21.63 15.28 0.00 0.00 0.03 22.95 0.16 0.29 1.86 0.00 0.00 99.68 CG-14CH-135_area3.line1 37.37 0.15 22.32 14.79 0.00 0.00 0.04 23.30 0.08 0.18 1.87 0.00 0.01 100.11 CG-14CH-135_area3.line1 37.54 0.03 21.95 15.01 0.00 0.00 0.01 23.05 0.15 0.20 1.87 0.01 0.01 99.83 CG-14CH-135_area3.line1 37.55 0.06 20.86 15.06 0.00 0.02 0.06 22.35 0.23 0.58 1.84 0.00 0.01 98.61 CG-14CH-135_area3.line2 37.36 0.20 22.39 14.47 0.02 0.00 0.02 23.08 0.08 0.39 1.87 0.02 0.00 99.90 CG-14CH-135_area3.line2 37.41 0.12 22.76 13.67 0.02 0.00 0.01 22.78 0.27 0.81 1.87 0.00 0.01 99.73 CG-14CH-135_area3.line2 37.05 0.29 20.64 16.65 0.00 0.00 0.04 23.17 0.04 0.07 1.86 0.00 0.00 99.82 CG-14CH-135_area3.line3 36.69 0.05 22.08 14.58 0.00 0.00 0.04 22.26 0.72 0.81 1.85 0.01 0.01 99.11 CG-14CH-135_area3.line3 37.30 0.03 21.91 15.10 0.00 0.02 0.03 23.27 0.14 0.20 1.87 0.00 0.00 99.86 CG-14CH-135_area3.line3 36.93 0.30 20.78 16.32 0.00 0.00 0.03 23.37 0.05 0.10 1.85 0.00 0.01 99.73
CG-14CH-127_area1_pt1 37.49 0.15 24.50 12.11 0.02 0.03 0.02 23.24 0.06 0.43 1.89 0.00 0.00 99.94 CG-14CH-127_area1_pt2 37.85 0.07 25.79 10.02 0.00 0.00 0.02 23.49 0.04 0.40 1.90 0.00 0.00 99.58 CG-14CH-127_area1_pt3.r 38.28 0.24 26.48 9.10 0.01 0.02 0.01 23.56 0.03 0.37 1.91 0.01 0.02 100.04 CG-14CH-127_area1_pt4.c 37.77 0.35 24.51 11.51 0.00 0.00 0.08 23.51 0.03 0.10 1.89 0.00 0.02 99.76 CG-14CH-127_area1_line1 37.58 0.15 23.34 13.18 0.01 0.03 0.00 23.43 0.05 0.49 1.88 0.00 0.01 100.16
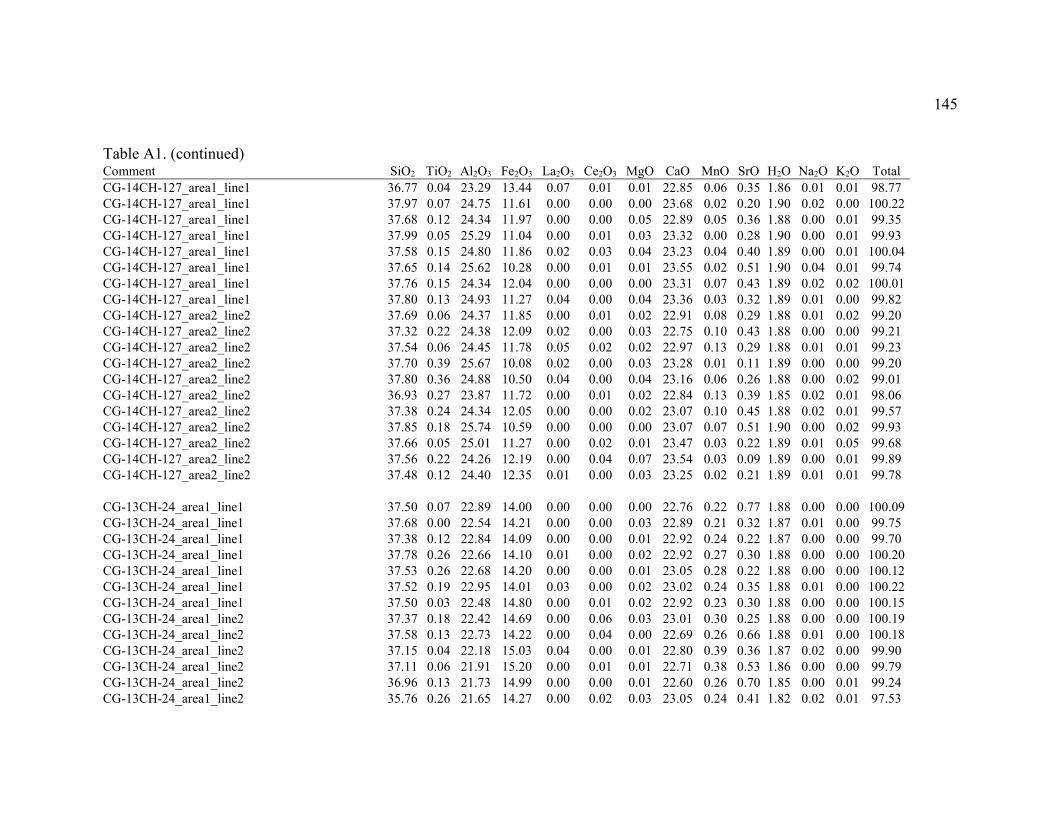
145
Table A1. (continued) Comment SiO2 TiO2 Al2O3 Fe2O3 La2O3 Ce2O3 MgO CaO MnO SrO H2O Na2O K2O Total
CG-14CH-127_area1_line1 36.77 0.04 23.29 13.44 0.07 0.01 0.01 22.85 0.06 0.35 1.86 0.01 0.01 98.77 CG-14CH-127_area1_line1 37.97 0.07 24.75 11.61 0.00 0.00 0.00 23.68 0.02 0.20 1.90 0.02 0.00 100.22 CG-14CH-127_area1_line1 37.68 0.12 24.34 11.97 0.00 0.00 0.05 22.89 0.05 0.36 1.88 0.00 0.01 99.35 CG-14CH-127_area1_line1 37.99 0.05 25.29 11.04 0.00 0.01 0.03 23.32 0.00 0.28 1.90 0.00 0.01 99.93 CG-14CH-127_area1_line1 37.58 0.15 24.80 11.86 0.02 0.03 0.04 23.23 0.04 0.40 1.89 0.00 0.01 100.04 CG-14CH-127_area1_line1 37.65 0.14 25.62 10.28 0.00 0.01 0.01 23.55 0.02 0.51 1.90 0.04 0.01 99.74 CG-14CH-127_area1_line1 37.76 0.15 24.34 12.04 0.00 0.00 0.00 23.31 0.07 0.43 1.89 0.02 0.02 100.01 CG-14CH-127_area1_line1 37.80 0.13 24.93 11.27 0.04 0.00 0.04 23.36 0.03 0.32 1.89 0.01 0.00 99.82 CG-14CH-127_area2_line2 37.69 0.06 24.37 11.85 0.00 0.01 0.02 22.91 0.08 0.29 1.88 0.01 0.02 99.20 CG-14CH-127_area2_line2 37.32 0.22 24.38 12.09 0.02 0.00 0.03 22.75 0.10 0.43 1.88 0.00 0.00 99.21 CG-14CH-127_area2_line2 37.54 0.06 24.45 11.78 0.05 0.02 0.02 22.97 0.13 0.29 1.88 0.01 0.01 99.23 CG-14CH-127_area2_line2 37.70 0.39 25.67 10.08 0.02 0.00 0.03 23.28 0.01 0.11 1.89 0.00 0.00 99.20 CG-14CH-127_area2_line2 37.80 0.36 24.88 10.50 0.04 0.00 0.04 23.16 0.06 0.26 1.88 0.00 0.02 99.01 CG-14CH-127_area2_line2 36.93 0.27 23.87 11.72 0.00 0.01 0.02 22.84 0.13 0.39 1.85 0.02 0.01 98.06 CG-14CH-127_area2_line2 37.38 0.24 24.34 12.05 0.00 0.00 0.02 23.07 0.10 0.45 1.88 0.02 0.01 99.57 CG-14CH-127_area2_line2 37.85 0.18 25.74 10.59 0.00 0.00 0.00 23.07 0.07 0.51 1.90 0.00 0.02 99.93 CG-14CH-127_area2_line2 37.66 0.05 25.01 11.27 0.00 0.02 0.01 23.47 0.03 0.22 1.89 0.01 0.05 99.68 CG-14CH-127_area2_line2 37.56 0.22 24.26 12.19 0.00 0.04 0.07 23.54 0.03 0.09 1.89 0.00 0.01 99.89 CG-14CH-127_area2_line2 37.48 0.12 24.40 12.35 0.01 0.00 0.03 23.25 0.02 0.21 1.89 0.01 0.01 99.78
CG-13CH-24_area1_line1 37.50 0.07 22.89 14.00 0.00 0.00 0.00 22.76 0.22 0.77 1.88 0.00 0.00 100.09 CG-13CH-24_area1_line1 37.68 0.00 22.54 14.21 0.00 0.00 0.03 22.89 0.21 0.32 1.87 0.01 0.00 99.75 CG-13CH-24_area1_line1 37.38 0.12 22.84 14.09 0.00 0.00 0.01 22.92 0.24 0.22 1.87 0.00 0.00 99.70 CG-13CH-24_area1_line1 37.78 0.26 22.66 14.10 0.01 0.00 0.02 22.92 0.27 0.30 1.88 0.00 0.00 100.20 CG-13CH-24_area1_line1 37.53 0.26 22.68 14.20 0.00 0.00 0.01 23.05 0.28 0.22 1.88 0.00 0.00 100.12 CG-13CH-24_area1_line1 37.52 0.19 22.95 14.01 0.03 0.00 0.02 23.02 0.24 0.35 1.88 0.01 0.00 100.22 CG-13CH-24_area1_line1 37.50 0.03 22.48 14.80 0.00 0.01 0.02 22.92 0.23 0.30 1.88 0.00 0.00 100.15 CG-13CH-24_area1_line2 37.37 0.18 22.42 14.69 0.00 0.06 0.03 23.01 0.30 0.25 1.88 0.00 0.00 100.19 CG-13CH-24_area1_line2 37.58 0.13 22.73 14.22 0.00 0.04 0.00 22.69 0.26 0.66 1.88 0.01 0.00 100.18 CG-13CH-24_area1_line2 37.15 0.04 22.18 15.03 0.04 0.00 0.01 22.80 0.39 0.36 1.87 0.02 0.00 99.90 CG-13CH-24_area1_line2 37.11 0.06 21.91 15.20 0.00 0.01 0.01 22.71 0.38 0.53 1.86 0.00 0.00 99.79 CG-13CH-24_area1_line2 36.96 0.13 21.73 14.99 0.00 0.00 0.01 22.60 0.26 0.70 1.85 0.00 0.01 99.24 CG-13CH-24_area1_line2 35.76 0.26 21.65 14.27 0.00 0.02 0.03 23.05 0.24 0.41 1.82 0.02 0.01 97.53
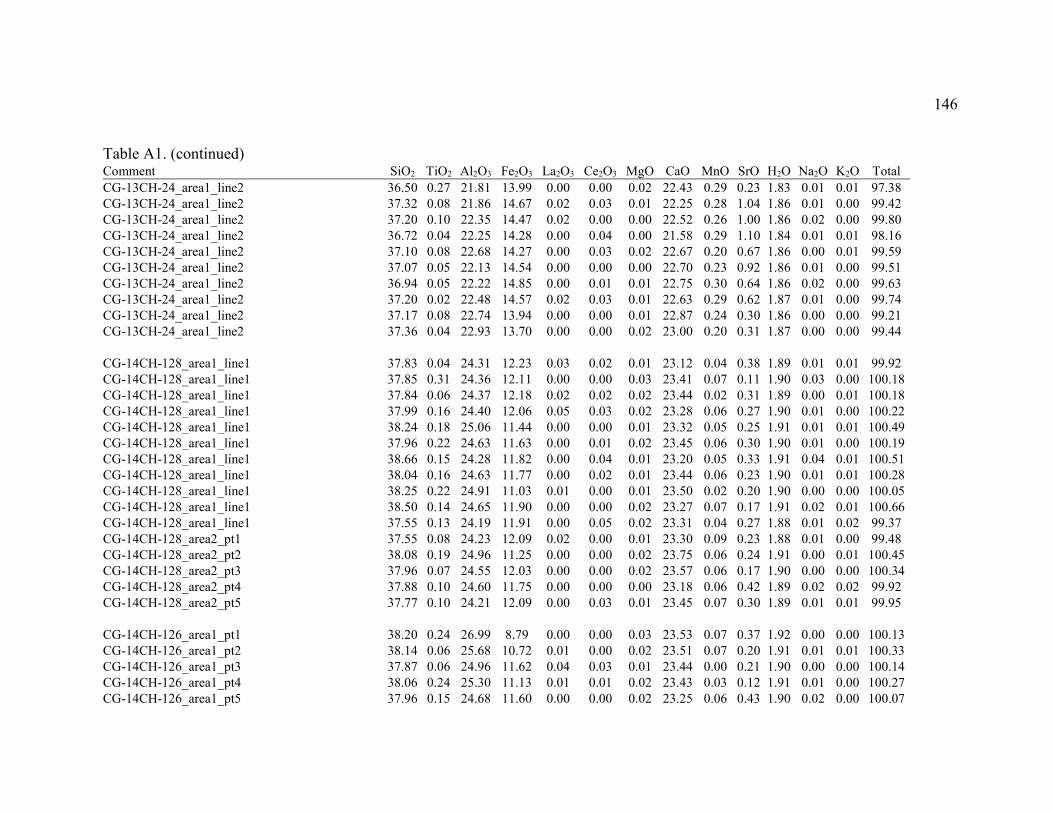
146
Table A1. (continued) Comment SiO2 TiO2 Al2O3 Fe2O3 La2O3 Ce2O3 MgO CaO MnO SrO H2O Na2O K2O Total
CG-13CH-24_area1_line2 36.50 0.27 21.81 13.99 0.00 0.00 0.02 22.43 0.29 0.23 1.83 0.01 0.01 97.38 CG-13CH-24_area1_line2 37.32 0.08 21.86 14.67 0.02 0.03 0.01 22.25 0.28 1.04 1.86 0.01 0.00 99.42 CG-13CH-24_area1_line2 37.20 0.10 22.35 14.47 0.02 0.00 0.00 22.52 0.26 1.00 1.86 0.02 0.00 99.80 CG-13CH-24_area1_line2 36.72 0.04 22.25 14.28 0.00 0.04 0.00 21.58 0.29 1.10 1.84 0.01 0.01 98.16 CG-13CH-24_area1_line2 37.10 0.08 22.68 14.27 0.00 0.03 0.02 22.67 0.20 0.67 1.86 0.00 0.01 99.59 CG-13CH-24_area1_line2 37.07 0.05 22.13 14.54 0.00 0.00 0.00 22.70 0.23 0.92 1.86 0.01 0.00 99.51 CG-13CH-24_area1_line2 36.94 0.05 22.22 14.85 0.00 0.01 0.01 22.75 0.30 0.64 1.86 0.02 0.00 99.63 CG-13CH-24_area1_line2 37.20 0.02 22.48 14.57 0.02 0.03 0.01 22.63 0.29 0.62 1.87 0.01 0.00 99.74 CG-13CH-24_area1_line2 37.17 0.08 22.74 13.94 0.00 0.00 0.01 22.87 0.24 0.30 1.86 0.00 0.00 99.21 CG-13CH-24_area1_line2 37.36 0.04 22.93 13.70 0.00 0.00 0.02 23.00 0.20 0.31 1.87 0.00 0.00 99.44
CG-14CH-128_area1_line1 37.83 0.04 24.31 12.23 0.03 0.02 0.01 23.12 0.04 0.38 1.89 0.01 0.01 99.92 CG-14CH-128_area1_line1 37.85 0.31 24.36 12.11 0.00 0.00 0.03 23.41 0.07 0.11 1.90 0.03 0.00 100.18 CG-14CH-128_area1_line1 37.84 0.06 24.37 12.18 0.02 0.02 0.02 23.44 0.02 0.31 1.89 0.00 0.01 100.18 CG-14CH-128_area1_line1 37.99 0.16 24.40 12.06 0.05 0.03 0.02 23.28 0.06 0.27 1.90 0.01 0.00 100.22 CG-14CH-128_area1_line1 38.24 0.18 25.06 11.44 0.00 0.00 0.01 23.32 0.05 0.25 1.91 0.01 0.01 100.49 CG-14CH-128_area1_line1 37.96 0.22 24.63 11.63 0.00 0.01 0.02 23.45 0.06 0.30 1.90 0.01 0.00 100.19 CG-14CH-128_area1_line1 38.66 0.15 24.28 11.82 0.00 0.04 0.01 23.20 0.05 0.33 1.91 0.04 0.01 100.51 CG-14CH-128_area1_line1 38.04 0.16 24.63 11.77 0.00 0.02 0.01 23.44 0.06 0.23 1.90 0.01 0.01 100.28 CG-14CH-128_area1_line1 38.25 0.22 24.91 11.03 0.01 0.00 0.01 23.50 0.02 0.20 1.90 0.00 0.00 100.05 CG-14CH-128_area1_line1 38.50 0.14 24.65 11.90 0.00 0.00 0.02 23.27 0.07 0.17 1.91 0.02 0.01 100.66 CG-14CH-128_area1_line1 37.55 0.13 24.19 11.91 0.00 0.05 0.02 23.31 0.04 0.27 1.88 0.01 0.02 99.37 CG-14CH-128_area2_pt1 37.55 0.08 24.23 12.09 0.02 0.00 0.01 23.30 0.09 0.23 1.88 0.01 0.00 99.48 CG-14CH-128_area2_pt2 38.08 0.19 24.96 11.25 0.00 0.00 0.02 23.75 0.06 0.24 1.91 0.00 0.01 100.45 CG-14CH-128_area2_pt3 37.96 0.07 24.55 12.03 0.00 0.00 0.02 23.57 0.06 0.17 1.90 0.00 0.00 100.34 CG-14CH-128_area2_pt4 37.88 0.10 24.60 11.75 0.00 0.00 0.00 23.18 0.06 0.42 1.89 0.02 0.02 99.92 CG-14CH-128_area2_pt5 37.77 0.10 24.21 12.09 0.00 0.03 0.01 23.45 0.07 0.30 1.89 0.01 0.01 99.95
CG-14CH-126_area1_pt1 38.20 0.24 26.99 8.79 0.00 0.00 0.03 23.53 0.07 0.37 1.92 0.00 0.00 100.13 CG-14CH-126_area1_pt2 38.14 0.06 25.68 10.72 0.01 0.00 0.02 23.51 0.07 0.20 1.91 0.01 0.01 100.33 CG-14CH-126_area1_pt3 37.87 0.06 24.96 11.62 0.04 0.03 0.01 23.44 0.00 0.21 1.90 0.00 0.00 100.14 CG-14CH-126_area1_pt4 38.06 0.24 25.30 11.13 0.01 0.01 0.02 23.43 0.03 0.12 1.91 0.01 0.00 100.27 CG-14CH-126_area1_pt5 37.96 0.15 24.68 11.60 0.00 0.00 0.02 23.25 0.06 0.43 1.90 0.02 0.00 100.07
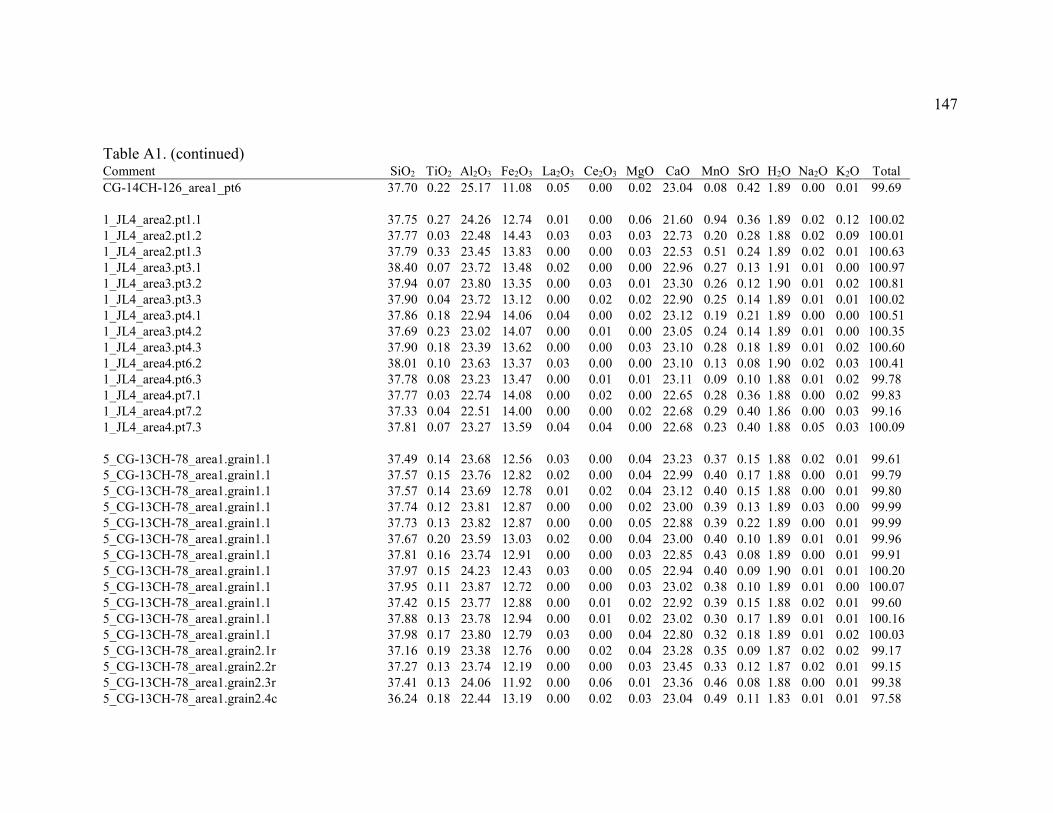
147
Table A1. (continued) Comment SiO2 TiO2 Al2O3 Fe2O3 La2O3 Ce2O3 MgO CaO MnO SrO H2O Na2O K2O Total
CG-14CH-126_area1_pt6 37.70 0.22 25.17 11.08 0.05 0.00 0.02 23.04 0.08 0.42 1.89 0.00 0.01 99.69
1_JL4_area2.pt1.1 37.75 0.27 24.26 12.74 0.01 0.00 0.06 21.60 0.94 0.36 1.89 0.02 0.12 100.02 1_JL4_area2.pt1.2 37.77 0.03 22.48 14.43 0.03 0.03 0.03 22.73 0.20 0.28 1.88 0.02 0.09 100.01 1_JL4_area2.pt1.3 37.79 0.33 23.45 13.83 0.00 0.00 0.03 22.53 0.51 0.24 1.89 0.02 0.01 100.63 1_JL4_area3.pt3.1 38.40 0.07 23.72 13.48 0.02 0.00 0.00 22.96 0.27 0.13 1.91 0.01 0.00 100.97 1_JL4_area3.pt3.2 37.94 0.07 23.80 13.35 0.00 0.03 0.01 23.30 0.26 0.12 1.90 0.01 0.02 100.81 1_JL4_area3.pt3.3 37.90 0.04 23.72 13.12 0.00 0.02 0.02 22.90 0.25 0.14 1.89 0.01 0.01 100.02 1_JL4_area3.pt4.1 37.86 0.18 22.94 14.06 0.04 0.00 0.02 23.12 0.19 0.21 1.89 0.00 0.00 100.51 1_JL4_area3.pt4.2 37.69 0.23 23.02 14.07 0.00 0.01 0.00 23.05 0.24 0.14 1.89 0.01 0.00 100.35 1_JL4_area3.pt4.3 37.90 0.18 23.39 13.62 0.00 0.00 0.03 23.10 0.28 0.18 1.89 0.01 0.02 100.60 1_JL4_area4.pt6.2 38.01 0.10 23.63 13.37 0.03 0.00 0.00 23.10 0.13 0.08 1.90 0.02 0.03 100.41 1_JL4_area4.pt6.3 37.78 0.08 23.23 13.47 0.00 0.01 0.01 23.11 0.09 0.10 1.88 0.01 0.02 99.78 1_JL4_area4.pt7.1 37.77 0.03 22.74 14.08 0.00 0.02 0.00 22.65 0.28 0.36 1.88 0.00 0.02 99.83 1_JL4_area4.pt7.2 37.33 0.04 22.51 14.00 0.00 0.00 0.02 22.68 0.29 0.40 1.86 0.00 0.03 99.16 1_JL4_area4.pt7.3 37.81 0.07 23.27 13.59 0.04 0.04 0.00 22.68 0.23 0.40 1.88 0.05 0.03 100.09
5_CG-13CH-78_area1.grain1.1 37.49 0.14 23.68 12.56 0.03 0.00 0.04 23.23 0.37 0.15 1.88 0.02 0.01 99.61 5_CG-13CH-78_area1.grain1.1 37.57 0.15 23.76 12.82 0.02 0.00 0.04 22.99 0.40 0.17 1.88 0.00 0.01 99.79 5_CG-13CH-78_area1.grain1.1 37.57 0.14 23.69 12.78 0.01 0.02 0.04 23.12 0.40 0.15 1.88 0.00 0.01 99.80 5_CG-13CH-78_area1.grain1.1 37.74 0.12 23.81 12.87 0.00 0.00 0.02 23.00 0.39 0.13 1.89 0.03 0.00 99.99 5_CG-13CH-78_area1.grain1.1 37.73 0.13 23.82 12.87 0.00 0.00 0.05 22.88 0.39 0.22 1.89 0.00 0.01 99.99 5_CG-13CH-78_area1.grain1.1 37.67 0.20 23.59 13.03 0.02 0.00 0.04 23.00 0.40 0.10 1.89 0.01 0.01 99.96 5_CG-13CH-78_area1.grain1.1 37.81 0.16 23.74 12.91 0.00 0.00 0.03 22.85 0.43 0.08 1.89 0.00 0.01 99.91 5_CG-13CH-78_area1.grain1.1 37.97 0.15 24.23 12.43 0.03 0.00 0.05 22.94 0.40 0.09 1.90 0.01 0.01 100.20 5_CG-13CH-78_area1.grain1.1 37.95 0.11 23.87 12.72 0.00 0.00 0.03 23.02 0.38 0.10 1.89 0.01 0.00 100.07 5_CG-13CH-78_area1.grain1.1 37.42 0.15 23.77 12.88 0.00 0.01 0.02 22.92 0.39 0.15 1.88 0.02 0.01 99.60 5_CG-13CH-78_area1.grain1.1 37.88 0.13 23.78 12.94 0.00 0.01 0.02 23.02 0.30 0.17 1.89 0.01 0.01 100.16 5_CG-13CH-78_area1.grain1.1 37.98 0.17 23.80 12.79 0.03 0.00 0.04 22.80 0.32 0.18 1.89 0.01 0.02 100.03 5_CG-13CH-78_area1.grain2.1r 37.16 0.19 23.38 12.76 0.00 0.02 0.04 23.28 0.35 0.09 1.87 0.02 0.02 99.17 5_CG-13CH-78_area1.grain2.2r 37.27 0.13 23.74 12.19 0.00 0.00 0.03 23.45 0.33 0.12 1.87 0.02 0.01 99.15 5_CG-13CH-78_area1.grain2.3r 37.41 0.13 24.06 11.92 0.00 0.06 0.01 23.36 0.46 0.08 1.88 0.00 0.01 99.38 5_CG-13CH-78_area1.grain2.4c 36.24 0.18 22.44 13.19 0.00 0.02 0.03 23.04 0.49 0.11 1.83 0.01 0.01 97.58
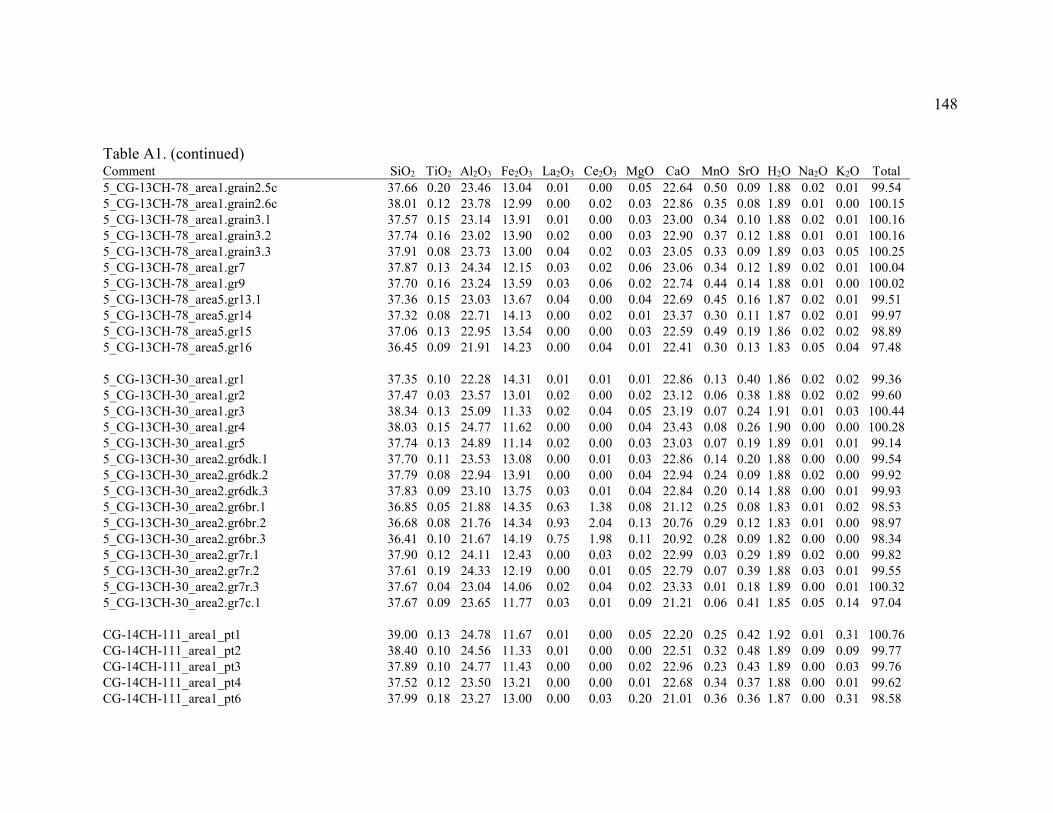
148
Table A1. (continued) Comment SiO2 TiO2 Al2O3 Fe2O3 La2O3 Ce2O3 MgO CaO MnO SrO H2O Na2O K2O Total
5_CG-13CH-78_area1.grain2.5c 37.66 0.20 23.46 13.04 0.01 0.00 0.05 22.64 0.50 0.09 1.88 0.02 0.01 99.54 5_CG-13CH-78_area1.grain2.6c 38.01 0.12 23.78 12.99 0.00 0.02 0.03 22.86 0.35 0.08 1.89 0.01 0.00 100.15 5_CG-13CH-78_area1.grain3.1 37.57 0.15 23.14 13.91 0.01 0.00 0.03 23.00 0.34 0.10 1.88 0.02 0.01 100.16 5_CG-13CH-78_area1.grain3.2 37.74 0.16 23.02 13.90 0.02 0.00 0.03 22.90 0.37 0.12 1.88 0.01 0.01 100.16 5_CG-13CH-78_area1.grain3.3 37.91 0.08 23.73 13.00 0.04 0.02 0.03 23.05 0.33 0.09 1.89 0.03 0.05 100.25 5_CG-13CH-78_area1.gr7 37.87 0.13 24.34 12.15 0.03 0.02 0.06 23.06 0.34 0.12 1.89 0.02 0.01 100.04 5_CG-13CH-78_area1.gr9 37.70 0.16 23.24 13.59 0.03 0.06 0.02 22.74 0.44 0.14 1.88 0.01 0.00 100.02 5_CG-13CH-78_area5.gr13.1 37.36 0.15 23.03 13.67 0.04 0.00 0.04 22.69 0.45 0.16 1.87 0.02 0.01 99.51 5_CG-13CH-78_area5.gr14 37.32 0.08 22.71 14.13 0.00 0.02 0.01 23.37 0.30 0.11 1.87 0.02 0.01 99.97 5_CG-13CH-78_area5.gr15 37.06 0.13 22.95 13.54 0.00 0.00 0.03 22.59 0.49 0.19 1.86 0.02 0.02 98.89 5_CG-13CH-78_area5.gr16 36.45 0.09 21.91 14.23 0.00 0.04 0.01 22.41 0.30 0.13 1.83 0.05 0.04 97.48
5_CG-13CH-30_area1.gr1 37.35 0.10 22.28 14.31 0.01 0.01 0.01 22.86 0.13 0.40 1.86 0.02 0.02 99.36 5_CG-13CH-30_area1.gr2 37.47 0.03 23.57 13.01 0.02 0.00 0.02 23.12 0.06 0.38 1.88 0.02 0.02 99.60 5_CG-13CH-30_area1.gr3 38.34 0.13 25.09 11.33 0.02 0.04 0.05 23.19 0.07 0.24 1.91 0.01 0.03 100.44 5_CG-13CH-30_area1.gr4 38.03 0.15 24.77 11.62 0.00 0.00 0.04 23.43 0.08 0.26 1.90 0.00 0.00 100.28 5_CG-13CH-30_area1.gr5 37.74 0.13 24.89 11.14 0.02 0.00 0.03 23.03 0.07 0.19 1.89 0.01 0.01 99.14 5_CG-13CH-30_area2.gr6dk.1 37.70 0.11 23.53 13.08 0.00 0.01 0.03 22.86 0.14 0.20 1.88 0.00 0.00 99.54 5_CG-13CH-30_area2.gr6dk.2 37.79 0.08 22.94 13.91 0.00 0.00 0.04 22.94 0.24 0.09 1.88 0.02 0.00 99.92 5_CG-13CH-30_area2.gr6dk.3 37.83 0.09 23.10 13.75 0.03 0.01 0.04 22.84 0.20 0.14 1.88 0.00 0.01 99.93 5_CG-13CH-30_area2.gr6br.1 36.85 0.05 21.88 14.35 0.63 1.38 0.08 21.12 0.25 0.08 1.83 0.01 0.02 98.53 5_CG-13CH-30_area2.gr6br.2 36.68 0.08 21.76 14.34 0.93 2.04 0.13 20.76 0.29 0.12 1.83 0.01 0.00 98.97 5_CG-13CH-30_area2.gr6br.3 36.41 0.10 21.67 14.19 0.75 1.98 0.11 20.92 0.28 0.09 1.82 0.00 0.00 98.34 5_CG-13CH-30_area2.gr7r.1 37.90 0.12 24.11 12.43 0.00 0.03 0.02 22.99 0.03 0.29 1.89 0.02 0.00 99.82 5_CG-13CH-30_area2.gr7r.2 37.61 0.19 24.33 12.19 0.00 0.01 0.05 22.79 0.07 0.39 1.88 0.03 0.01 99.55 5_CG-13CH-30_area2.gr7r.3 37.67 0.04 23.04 14.06 0.02 0.04 0.02 23.33 0.01 0.18 1.89 0.00 0.01 100.32 5_CG-13CH-30_area2.gr7c.1 37.67 0.09 23.65 11.77 0.03 0.01 0.09 21.21 0.06 0.41 1.85 0.05 0.14 97.04
CG-14CH-111_area1_pt1 39.00 0.13 24.78 11.67 0.01 0.00 0.05 22.20 0.25 0.42 1.92 0.01 0.31 100.76 CG-14CH-111_area1_pt2 38.40 0.10 24.56 11.33 0.01 0.00 0.00 22.51 0.32 0.48 1.89 0.09 0.09 99.77 CG-14CH-111_area1_pt3 37.89 0.10 24.77 11.43 0.00 0.00 0.02 22.96 0.23 0.43 1.89 0.00 0.03 99.76 CG-14CH-111_area1_pt4 37.52 0.12 23.50 13.21 0.00 0.00 0.01 22.68 0.34 0.37 1.88 0.00 0.01 99.62 CG-14CH-111_area1_pt6 37.99 0.18 23.27 13.00 0.00 0.03 0.20 21.01 0.36 0.36 1.87 0.00 0.31 98.58
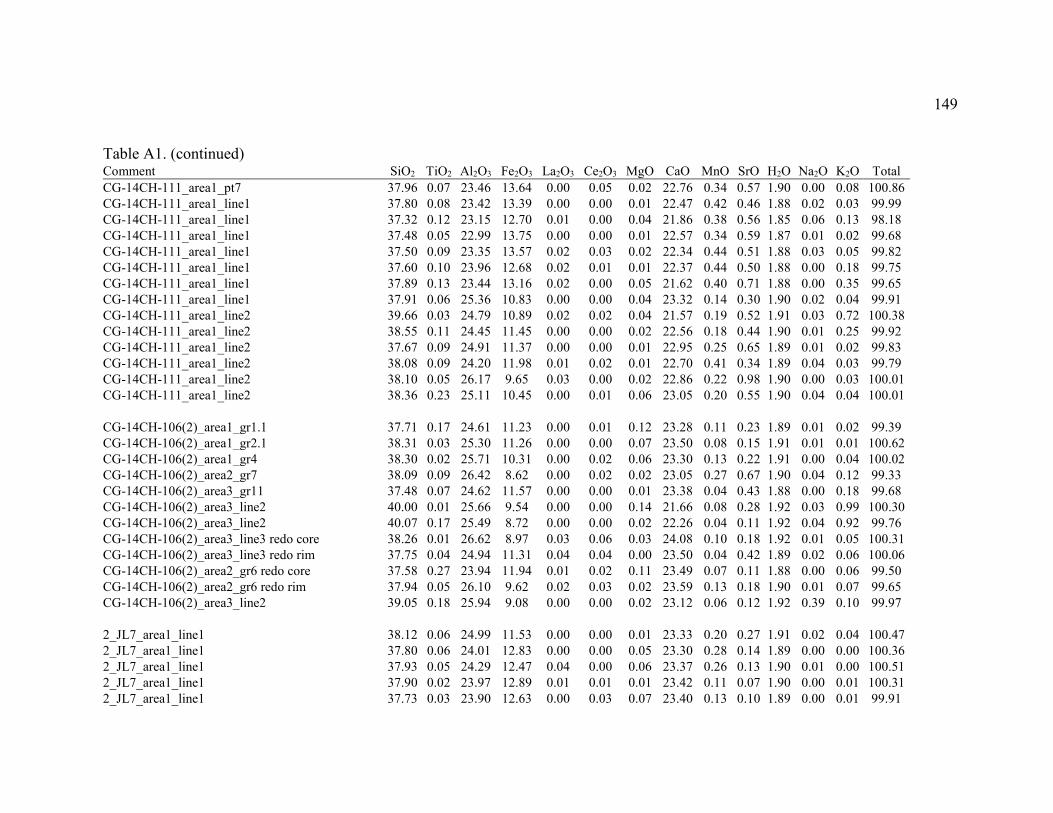
149
Table A1. (continued) Comment SiO2 TiO2 Al2O3 Fe2O3 La2O3 Ce2O3 MgO CaO MnO SrO H2O Na2O K2O Total
CG-14CH-111_area1_pt7 37.96 0.07 23.46 13.64 0.00 0.05 0.02 22.76 0.34 0.57 1.90 0.00 0.08 100.86 CG-14CH-111_area1_line1 37.80 0.08 23.42 13.39 0.00 0.00 0.01 22.47 0.42 0.46 1.88 0.02 0.03 99.99 CG-14CH-111_area1_line1 37.32 0.12 23.15 12.70 0.01 0.00 0.04 21.86 0.38 0.56 1.85 0.06 0.13 98.18 CG-14CH-111_area1_line1 37.48 0.05 22.99 13.75 0.00 0.00 0.01 22.57 0.34 0.59 1.87 0.01 0.02 99.68 CG-14CH-111_area1_line1 37.50 0.09 23.35 13.57 0.02 0.03 0.02 22.34 0.44 0.51 1.88 0.03 0.05 99.82 CG-14CH-111_area1_line1 37.60 0.10 23.96 12.68 0.02 0.01 0.01 22.37 0.44 0.50 1.88 0.00 0.18 99.75 CG-14CH-111_area1_line1 37.89 0.13 23.44 13.16 0.02 0.00 0.05 21.62 0.40 0.71 1.88 0.00 0.35 99.65 CG-14CH-111_area1_line1 37.91 0.06 25.36 10.83 0.00 0.00 0.04 23.32 0.14 0.30 1.90 0.02 0.04 99.91 CG-14CH-111_area1_line2 39.66 0.03 24.79 10.89 0.02 0.02 0.04 21.57 0.19 0.52 1.91 0.03 0.72 100.38 CG-14CH-111_area1_line2 38.55 0.11 24.45 11.45 0.00 0.00 0.02 22.56 0.18 0.44 1.90 0.01 0.25 99.92 CG-14CH-111_area1_line2 37.67 0.09 24.91 11.37 0.00 0.00 0.01 22.95 0.25 0.65 1.89 0.01 0.02 99.83 CG-14CH-111_area1_line2 38.08 0.09 24.20 11.98 0.01 0.02 0.01 22.70 0.41 0.34 1.89 0.04 0.03 99.79 CG-14CH-111_area1_line2 38.10 0.05 26.17 9.65 0.03 0.00 0.02 22.86 0.22 0.98 1.90 0.00 0.03 100.01 CG-14CH-111_area1_line2 38.36 0.23 25.11 10.45 0.00 0.01 0.06 23.05 0.20 0.55 1.90 0.04 0.04 100.01
CG-14CH-106(2)_area1_gr1.1 37.71 0.17 24.61 11.23 0.00 0.01 0.12 23.28 0.11 0.23 1.89 0.01 0.02 99.39 CG-14CH-106(2)_area1_gr2.1 38.31 0.03 25.30 11.26 0.00 0.00 0.07 23.50 0.08 0.15 1.91 0.01 0.01 100.62 CG-14CH-106(2)_area1_gr4 38.30 0.02 25.71 10.31 0.00 0.02 0.06 23.30 0.13 0.22 1.91 0.00 0.04 100.02 CG-14CH-106(2)_area2_gr7 38.09 0.09 26.42 8.62 0.00 0.02 0.02 23.05 0.27 0.67 1.90 0.04 0.12 99.33 CG-14CH-106(2)_area3_gr11 37.48 0.07 24.62 11.57 0.00 0.00 0.01 23.38 0.04 0.43 1.88 0.00 0.18 99.68 CG-14CH-106(2)_area3_line2 40.00 0.01 25.66 9.54 0.00 0.00 0.14 21.66 0.08 0.28 1.92 0.03 0.99 100.30 CG-14CH-106(2)_area3_line2 40.07 0.17 25.49 8.72 0.00 0.00 0.02 22.26 0.04 0.11 1.92 0.04 0.92 99.76 CG-14CH-106(2)_area3_line3 redo core 38.26 0.01 26.62 8.97 0.03 0.06 0.03 24.08 0.10 0.18 1.92 0.01 0.05 100.31 CG-14CH-106(2)_area3_line3 redo rim 37.75 0.04 24.94 11.31 0.04 0.04 0.00 23.50 0.04 0.42 1.89 0.02 0.06 100.06 CG-14CH-106(2)_area2_gr6 redo core 37.58 0.27 23.94 11.94 0.01 0.02 0.11 23.49 0.07 0.11 1.88 0.00 0.06 99.50 CG-14CH-106(2)_area2_gr6 redo rim 37.94 0.05 26.10 9.62 0.02 0.03 0.02 23.59 0.13 0.18 1.90 0.01 0.07 99.65 CG-14CH-106(2)_area3_line2 39.05 0.18 25.94 9.08 0.00 0.00 0.02 23.12 0.06 0.12 1.92 0.39 0.10 99.97
2_JL7_area1_line1 38.12 0.06 24.99 11.53 0.00 0.00 0.01 23.33 0.20 0.27 1.91 0.02 0.04 100.47 2_JL7_area1_line1 37.80 0.06 24.01 12.83 0.00 0.00 0.05 23.30 0.28 0.14 1.89 0.00 0.00 100.36 2_JL7_area1_line1 37.93 0.05 24.29 12.47 0.04 0.00 0.06 23.37 0.26 0.13 1.90 0.01 0.00 100.51 2_JL7_area1_line1 37.90 0.02 23.97 12.89 0.01 0.01 0.01 23.42 0.11 0.07 1.90 0.00 0.01 100.31 2_JL7_area1_line1 37.73 0.03 23.90 12.63 0.00 0.03 0.07 23.40 0.13 0.10 1.89 0.00 0.01 99.91
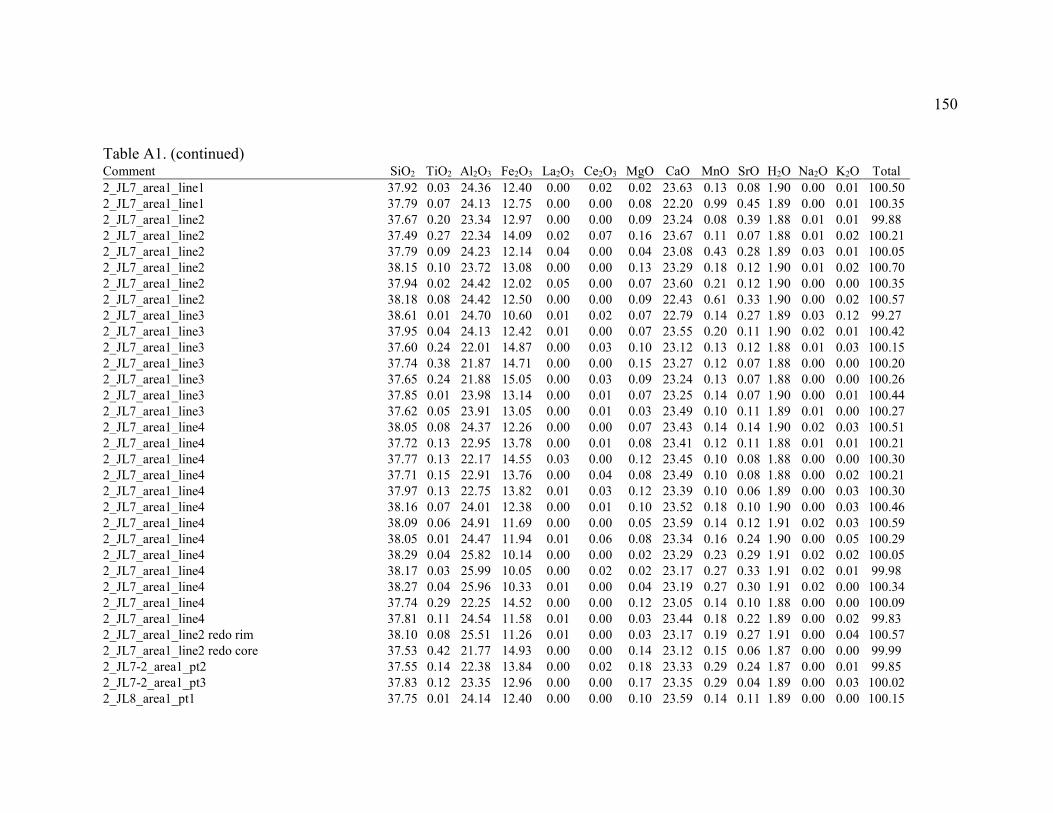
150
Table A1. (continued) Comment SiO2 TiO2 Al2O3 Fe2O3 La2O3 Ce2O3 MgO CaO MnO SrO H2O Na2O K2O Total
2_JL7_area1_line1 37.92 0.03 24.36 12.40 0.00 0.02 0.02 23.63 0.13 0.08 1.90 0.00 0.01 100.50 2_JL7_area1_line1 37.79 0.07 24.13 12.75 0.00 0.00 0.08 22.20 0.99 0.45 1.89 0.00 0.01 100.35 2_JL7_area1_line2 37.67 0.20 23.34 12.97 0.00 0.00 0.09 23.24 0.08 0.39 1.88 0.01 0.01 99.88 2_JL7_area1_line2 37.49 0.27 22.34 14.09 0.02 0.07 0.16 23.67 0.11 0.07 1.88 0.01 0.02 100.21 2_JL7_area1_line2 37.79 0.09 24.23 12.14 0.04 0.00 0.04 23.08 0.43 0.28 1.89 0.03 0.01 100.05 2_JL7_area1_line2 38.15 0.10 23.72 13.08 0.00 0.00 0.13 23.29 0.18 0.12 1.90 0.01 0.02 100.70 2_JL7_area1_line2 37.94 0.02 24.42 12.02 0.05 0.00 0.07 23.60 0.21 0.12 1.90 0.00 0.00 100.35 2_JL7_area1_line2 38.18 0.08 24.42 12.50 0.00 0.00 0.09 22.43 0.61 0.33 1.90 0.00 0.02 100.57 2_JL7_area1_line3 38.61 0.01 24.70 10.60 0.01 0.02 0.07 22.79 0.14 0.27 1.89 0.03 0.12 99.27 2_JL7_area1_line3 37.95 0.04 24.13 12.42 0.01 0.00 0.07 23.55 0.20 0.11 1.90 0.02 0.01 100.42 2_JL7_area1_line3 37.60 0.24 22.01 14.87 0.00 0.03 0.10 23.12 0.13 0.12 1.88 0.01 0.03 100.15 2_JL7_area1_line3 37.74 0.38 21.87 14.71 0.00 0.00 0.15 23.27 0.12 0.07 1.88 0.00 0.00 100.20 2_JL7_area1_line3 37.65 0.24 21.88 15.05 0.00 0.03 0.09 23.24 0.13 0.07 1.88 0.00 0.00 100.26 2_JL7_area1_line3 37.85 0.01 23.98 13.14 0.00 0.01 0.07 23.25 0.14 0.07 1.90 0.00 0.01 100.44 2_JL7_area1_line3 37.62 0.05 23.91 13.05 0.00 0.01 0.03 23.49 0.10 0.11 1.89 0.01 0.00 100.27 2_JL7_area1_line4 38.05 0.08 24.37 12.26 0.00 0.00 0.07 23.43 0.14 0.14 1.90 0.02 0.03 100.51 2_JL7_area1_line4 37.72 0.13 22.95 13.78 0.00 0.01 0.08 23.41 0.12 0.11 1.88 0.01 0.01 100.21 2_JL7_area1_line4 37.77 0.13 22.17 14.55 0.03 0.00 0.12 23.45 0.10 0.08 1.88 0.00 0.00 100.30 2_JL7_area1_line4 37.71 0.15 22.91 13.76 0.00 0.04 0.08 23.49 0.10 0.08 1.88 0.00 0.02 100.21 2_JL7_area1_line4 37.97 0.13 22.75 13.82 0.01 0.03 0.12 23.39 0.10 0.06 1.89 0.00 0.03 100.30 2_JL7_area1_line4 38.16 0.07 24.01 12.38 0.00 0.01 0.10 23.52 0.18 0.10 1.90 0.00 0.03 100.46 2_JL7_area1_line4 38.09 0.06 24.91 11.69 0.00 0.00 0.05 23.59 0.14 0.12 1.91 0.02 0.03 100.59 2_JL7_area1_line4 38.05 0.01 24.47 11.94 0.01 0.06 0.08 23.34 0.16 0.24 1.90 0.00 0.05 100.29 2_JL7_area1_line4 38.29 0.04 25.82 10.14 0.00 0.00 0.02 23.29 0.23 0.29 1.91 0.02 0.02 100.05 2_JL7_area1_line4 38.17 0.03 25.99 10.05 0.00 0.02 0.02 23.17 0.27 0.33 1.91 0.02 0.01 99.98 2_JL7_area1_line4 38.27 0.04 25.96 10.33 0.01 0.00 0.04 23.19 0.27 0.30 1.91 0.02 0.00 100.34 2_JL7_area1_line4 37.74 0.29 22.25 14.52 0.00 0.00 0.12 23.05 0.14 0.10 1.88 0.00 0.00 100.09 2_JL7_area1_line4 37.81 0.11 24.54 11.58 0.01 0.00 0.03 23.44 0.18 0.22 1.89 0.00 0.02 99.83 2_JL7_area1_line2 redo rim 38.10 0.08 25.51 11.26 0.01 0.00 0.03 23.17 0.19 0.27 1.91 0.00 0.04 100.57 2_JL7_area1_line2 redo core 37.53 0.42 21.77 14.93 0.00 0.00 0.14 23.12 0.15 0.06 1.87 0.00 0.00 99.99 2_JL7-2_area1_pt2 37.55 0.14 22.38 13.84 0.00 0.02 0.18 23.33 0.29 0.24 1.87 0.00 0.01 99.85 2_JL7-2_area1_pt3 37.83 0.12 23.35 12.96 0.00 0.00 0.17 23.35 0.29 0.04 1.89 0.00 0.03 100.02 2_JL8_area1_pt1 37.75 0.01 24.14 12.40 0.00 0.00 0.10 23.59 0.14 0.11 1.89 0.00 0.00 100.15
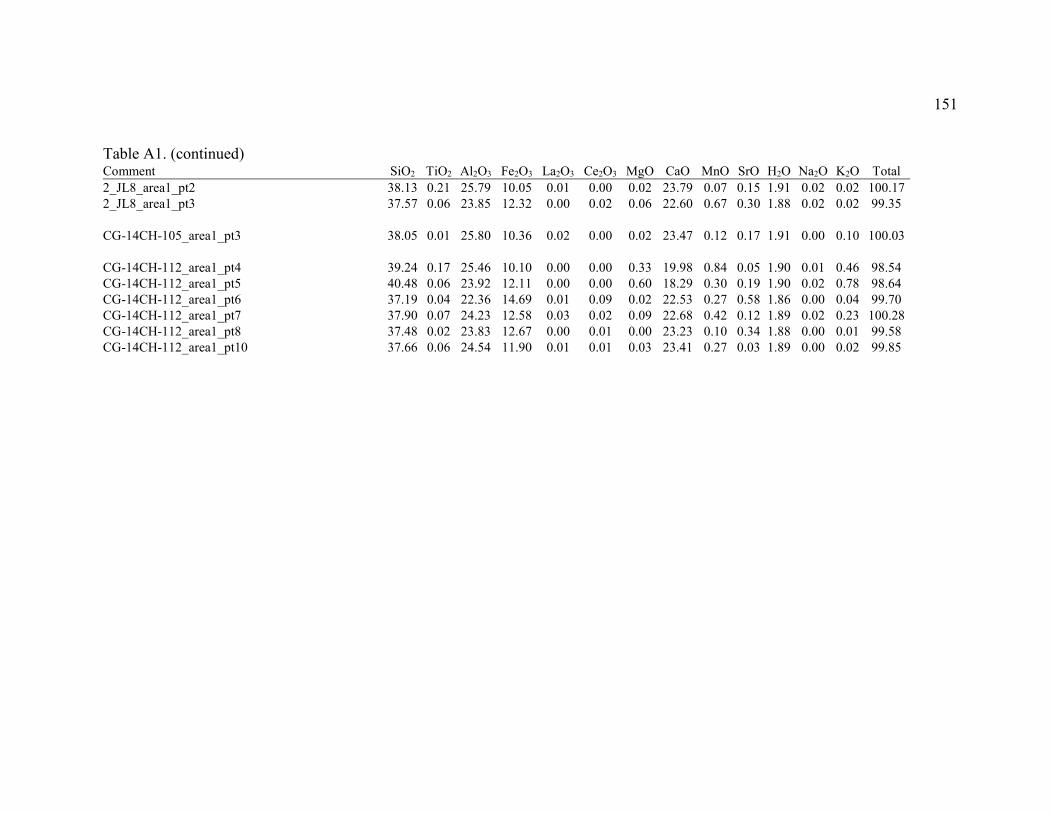
151
Table A1. (continued) Comment SiO2 TiO2 Al2O3 Fe2O3 La2O3 Ce2O3 MgO CaO MnO SrO H2O Na2O K2O Total
2_JL8_area1_pt2 38.13 0.21 25.79 10.05 0.01 0.00 0.02 23.79 0.07 0.15 1.91 0.02 0.02 100.17 2_JL8_area1_pt3 37.57 0.06 23.85 12.32 0.00 0.02 0.06 22.60 0.67 0.30 1.88 0.02 0.02 99.35
CG-14CH-105_area1_pt3 38.05 0.01 25.80 10.36 0.02 0.00 0.02 23.47 0.12 0.17 1.91 0.00 0.10 100.03
CG-14CH-112_area1_pt4 39.24 0.17 25.46 10.10 0.00 0.00 0.33 19.98 0.84 0.05 1.90 0.01 0.46 98.54 CG-14CH-112_area1_pt5 40.48 0.06 23.92 12.11 0.00 0.00 0.60 18.29 0.30 0.19 1.90 0.02 0.78 98.64 CG-14CH-112_area1_pt6 37.19 0.04 22.36 14.69 0.01 0.09 0.02 22.53 0.27 0.58 1.86 0.00 0.04 99.70 CG-14CH-112_area1_pt7 37.90 0.07 24.23 12.58 0.03 0.02 0.09 22.68 0.42 0.12 1.89 0.02 0.23 100.28 CG-14CH-112_area1_pt8 37.48 0.02 23.83 12.67 0.00 0.01 0.00 23.23 0.10 0.34 1.88 0.00 0.01 99.58 CG-14CH-112_area1_pt10 37.66 0.06 24.54 11.90 0.01 0.01 0.03 23.41 0.27 0.03 1.89 0.00 0.02 99.85
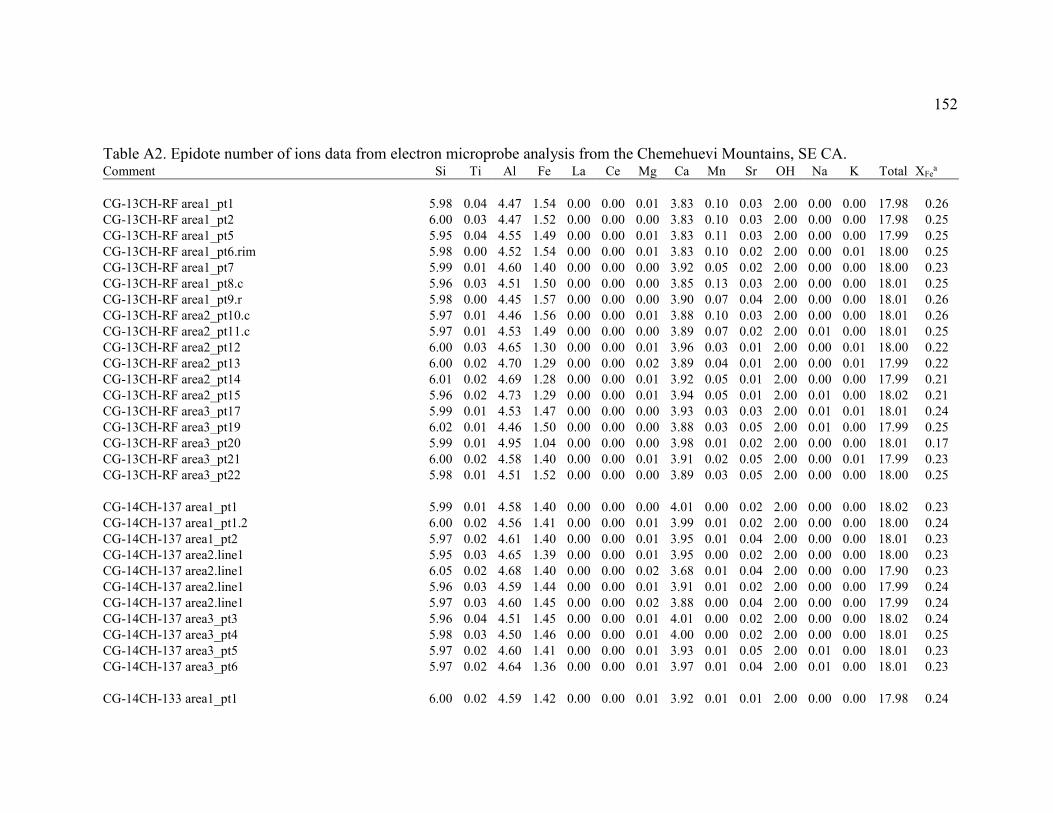
152
Table A2. Epidote number of ions data from electron microprobe analysis from the Chemehuevi Mountains, SE CA. Comment Si Ti Al Fe La Ce Mg Ca Mn Sr OH Na K Total XFe
a
CG-13CH-RF area1_pt1 5.98 0.04 4.47 1.54 0.00 0.00 0.01 3.83 0.10 0.03 2.00 0.00 0.00 17.98 0.26 CG-13CH-RF area1_pt2 6.00 0.03 4.47 1.52 0.00 0.00 0.00 3.83 0.10 0.03 2.00 0.00 0.00 17.98 0.25 CG-13CH-RF area1_pt5 5.95 0.04 4.55 1.49 0.00 0.00 0.01 3.83 0.11 0.03 2.00 0.00 0.00 17.99 0.25 CG-13CH-RF area1_pt6.rim 5.98 0.00 4.52 1.54 0.00 0.00 0.01 3.83 0.10 0.02 2.00 0.00 0.01 18.00 0.25 CG-13CH-RF area1_pt7 5.99 0.01 4.60 1.40 0.00 0.00 0.00 3.92 0.05 0.02 2.00 0.00 0.00 18.00 0.23 CG-13CH-RF area1_pt8.c 5.96 0.03 4.51 1.50 0.00 0.00 0.00 3.85 0.13 0.03 2.00 0.00 0.00 18.01 0.25 CG-13CH-RF area1_pt9.r 5.98 0.00 4.45 1.57 0.00 0.00 0.00 3.90 0.07 0.04 2.00 0.00 0.00 18.01 0.26 CG-13CH-RF area2_pt10.c 5.97 0.01 4.46 1.56 0.00 0.00 0.01 3.88 0.10 0.03 2.00 0.00 0.00 18.01 0.26 CG-13CH-RF area2_pt11.c 5.97 0.01 4.53 1.49 0.00 0.00 0.00 3.89 0.07 0.02 2.00 0.01 0.00 18.01 0.25 CG-13CH-RF area2_pt12 6.00 0.03 4.65 1.30 0.00 0.00 0.01 3.96 0.03 0.01 2.00 0.00 0.01 18.00 0.22 CG-13CH-RF area2_pt13 6.00 0.02 4.70 1.29 0.00 0.00 0.02 3.89 0.04 0.01 2.00 0.00 0.01 17.99 0.22 CG-13CH-RF area2_pt14 6.01 0.02 4.69 1.28 0.00 0.00 0.01 3.92 0.05 0.01 2.00 0.00 0.00 17.99 0.21 CG-13CH-RF area2_pt15 5.96 0.02 4.73 1.29 0.00 0.00 0.01 3.94 0.05 0.01 2.00 0.01 0.00 18.02 0.21 CG-13CH-RF area3_pt17 5.99 0.01 4.53 1.47 0.00 0.00 0.00 3.93 0.03 0.03 2.00 0.01 0.01 18.01 0.24 CG-13CH-RF area3_pt19 6.02 0.01 4.46 1.50 0.00 0.00 0.00 3.88 0.03 0.05 2.00 0.01 0.00 17.99 0.25 CG-13CH-RF area3_pt20 5.99 0.01 4.95 1.04 0.00 0.00 0.00 3.98 0.01 0.02 2.00 0.00 0.00 18.01 0.17 CG-13CH-RF area3_pt21 6.00 0.02 4.58 1.40 0.00 0.00 0.01 3.91 0.02 0.05 2.00 0.00 0.01 17.99 0.23 CG-13CH-RF area3_pt22 5.98 0.01 4.51 1.52 0.00 0.00 0.00 3.89 0.03 0.05 2.00 0.00 0.00 18.00 0.25
CG-14CH-137 area1_pt1 5.99 0.01 4.58 1.40 0.00 0.00 0.00 4.01 0.00 0.02 2.00 0.00 0.00 18.02 0.23 CG-14CH-137 area1_pt1.2 6.00 0.02 4.56 1.41 0.00 0.00 0.01 3.99 0.01 0.02 2.00 0.00 0.00 18.00 0.24 CG-14CH-137 area1_pt2 5.97 0.02 4.61 1.40 0.00 0.00 0.01 3.95 0.01 0.04 2.00 0.00 0.00 18.01 0.23 CG-14CH-137 area2.line1 5.95 0.03 4.65 1.39 0.00 0.00 0.01 3.95 0.00 0.02 2.00 0.00 0.00 18.00 0.23 CG-14CH-137 area2.line1 6.05 0.02 4.68 1.40 0.00 0.00 0.02 3.68 0.01 0.04 2.00 0.00 0.00 17.90 0.23 CG-14CH-137 area2.line1 5.96 0.03 4.59 1.44 0.00 0.00 0.01 3.91 0.01 0.02 2.00 0.00 0.00 17.99 0.24 CG-14CH-137 area2.line1 5.97 0.03 4.60 1.45 0.00 0.00 0.02 3.88 0.00 0.04 2.00 0.00 0.00 17.99 0.24 CG-14CH-137 area3_pt3 5.96 0.04 4.51 1.45 0.00 0.00 0.01 4.01 0.00 0.02 2.00 0.00 0.00 18.02 0.24 CG-14CH-137 area3_pt4 5.98 0.03 4.50 1.46 0.00 0.00 0.01 4.00 0.00 0.02 2.00 0.00 0.00 18.01 0.25 CG-14CH-137 area3_pt5 5.97 0.02 4.60 1.41 0.00 0.00 0.01 3.93 0.01 0.05 2.00 0.01 0.00 18.01 0.23 CG-14CH-137 area3_pt6 5.97 0.02 4.64 1.36 0.00 0.00 0.01 3.97 0.01 0.04 2.00 0.01 0.00 18.01 0.23
CG-14CH-133 area1_pt1 6.00 0.02 4.59 1.42 0.00 0.00 0.01 3.92 0.01 0.01 2.00 0.00 0.00 17.98 0.24
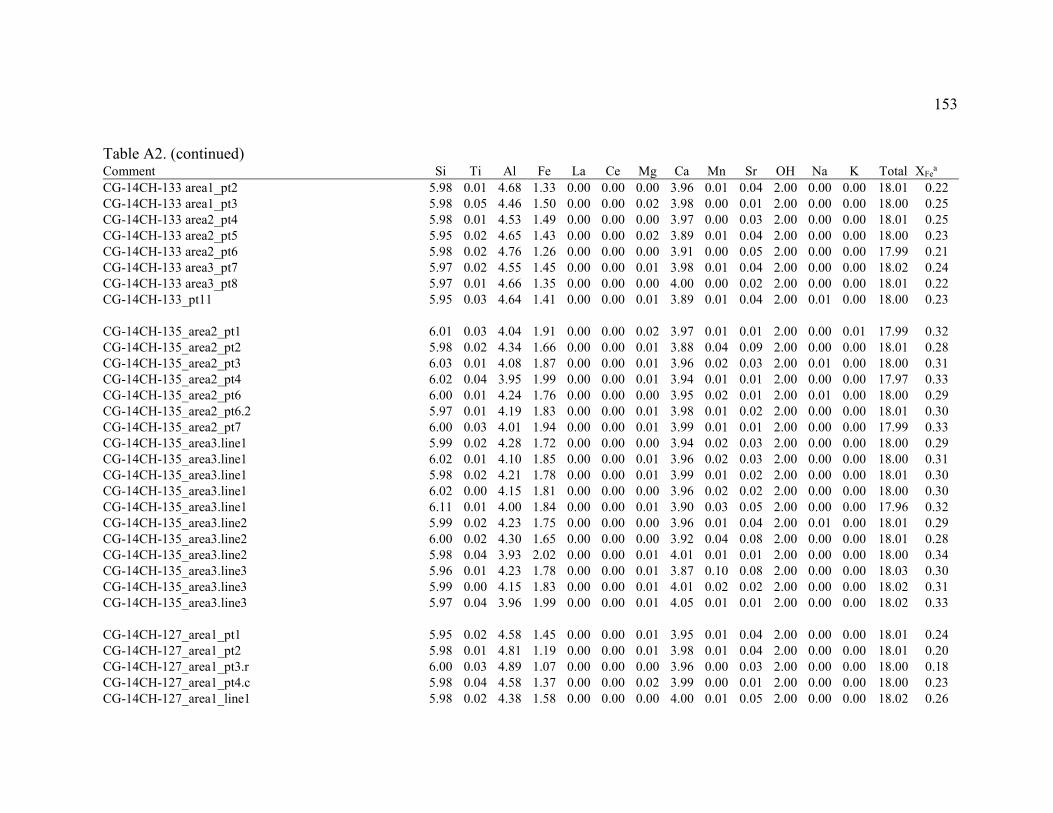
153
Table A2. (continued) Comment Si Ti Al Fe La Ce Mg Ca Mn Sr OH Na K Total XFe
a CG-14CH-133 area1_pt2 5.98 0.01 4.68 1.33 0.00 0.00 0.00 3.96 0.01 0.04 2.00 0.00 0.00 18.01 0.22 CG-14CH-133 area1_pt3 5.98 0.05 4.46 1.50 0.00 0.00 0.02 3.98 0.00 0.01 2.00 0.00 0.00 18.00 0.25 CG-14CH-133 area2_pt4 5.98 0.01 4.53 1.49 0.00 0.00 0.00 3.97 0.00 0.03 2.00 0.00 0.00 18.01 0.25 CG-14CH-133 area2_pt5 5.95 0.02 4.65 1.43 0.00 0.00 0.02 3.89 0.01 0.04 2.00 0.00 0.00 18.00 0.23 CG-14CH-133 area2_pt6 5.98 0.02 4.76 1.26 0.00 0.00 0.00 3.91 0.00 0.05 2.00 0.00 0.00 17.99 0.21 CG-14CH-133 area3_pt7 5.97 0.02 4.55 1.45 0.00 0.00 0.01 3.98 0.01 0.04 2.00 0.00 0.00 18.02 0.24 CG-14CH-133 area3_pt8 5.97 0.01 4.66 1.35 0.00 0.00 0.00 4.00 0.00 0.02 2.00 0.00 0.00 18.01 0.22 CG-14CH-133_pt11 5.95 0.03 4.64 1.41 0.00 0.00 0.01 3.89 0.01 0.04 2.00 0.01 0.00 18.00 0.23
CG-14CH-135_area2_pt1 6.01 0.03 4.04 1.91 0.00 0.00 0.02 3.97 0.01 0.01 2.00 0.00 0.01 17.99 0.32 CG-14CH-135_area2_pt2 5.98 0.02 4.34 1.66 0.00 0.00 0.01 3.88 0.04 0.09 2.00 0.00 0.00 18.01 0.28 CG-14CH-135_area2_pt3 6.03 0.01 4.08 1.87 0.00 0.00 0.01 3.96 0.02 0.03 2.00 0.01 0.00 18.00 0.31 CG-14CH-135_area2_pt4 6.02 0.04 3.95 1.99 0.00 0.00 0.01 3.94 0.01 0.01 2.00 0.00 0.00 17.97 0.33 CG-14CH-135_area2_pt6 6.00 0.01 4.24 1.76 0.00 0.00 0.00 3.95 0.02 0.01 2.00 0.01 0.00 18.00 0.29 CG-14CH-135_area2_pt6.2 5.97 0.01 4.19 1.83 0.00 0.00 0.01 3.98 0.01 0.02 2.00 0.00 0.00 18.01 0.30 CG-14CH-135_area2_pt7 6.00 0.03 4.01 1.94 0.00 0.00 0.01 3.99 0.01 0.01 2.00 0.00 0.00 17.99 0.33 CG-14CH-135_area3.line1 5.99 0.02 4.28 1.72 0.00 0.00 0.00 3.94 0.02 0.03 2.00 0.00 0.00 18.00 0.29 CG-14CH-135_area3.line1 6.02 0.01 4.10 1.85 0.00 0.00 0.01 3.96 0.02 0.03 2.00 0.00 0.00 18.00 0.31 CG-14CH-135_area3.line1 5.98 0.02 4.21 1.78 0.00 0.00 0.01 3.99 0.01 0.02 2.00 0.00 0.00 18.01 0.30 CG-14CH-135_area3.line1 6.02 0.00 4.15 1.81 0.00 0.00 0.00 3.96 0.02 0.02 2.00 0.00 0.00 18.00 0.30 CG-14CH-135_area3.line1 6.11 0.01 4.00 1.84 0.00 0.00 0.01 3.90 0.03 0.05 2.00 0.00 0.00 17.96 0.32 CG-14CH-135_area3.line2 5.99 0.02 4.23 1.75 0.00 0.00 0.00 3.96 0.01 0.04 2.00 0.01 0.00 18.01 0.29 CG-14CH-135_area3.line2 6.00 0.02 4.30 1.65 0.00 0.00 0.00 3.92 0.04 0.08 2.00 0.00 0.00 18.01 0.28 CG-14CH-135_area3.line2 5.98 0.04 3.93 2.02 0.00 0.00 0.01 4.01 0.01 0.01 2.00 0.00 0.00 18.00 0.34 CG-14CH-135_area3.line3 5.96 0.01 4.23 1.78 0.00 0.00 0.01 3.87 0.10 0.08 2.00 0.00 0.00 18.03 0.30 CG-14CH-135_area3.line3 5.99 0.00 4.15 1.83 0.00 0.00 0.01 4.01 0.02 0.02 2.00 0.00 0.00 18.02 0.31 CG-14CH-135_area3.line3 5.97 0.04 3.96 1.99 0.00 0.00 0.01 4.05 0.01 0.01 2.00 0.00 0.00 18.02 0.33
CG-14CH-127_area1_pt1 5.95 0.02 4.58 1.45 0.00 0.00 0.01 3.95 0.01 0.04 2.00 0.00 0.00 18.01 0.24 CG-14CH-127_area1_pt2 5.98 0.01 4.81 1.19 0.00 0.00 0.01 3.98 0.01 0.04 2.00 0.00 0.00 18.01 0.20 CG-14CH-127_area1_pt3.r 6.00 0.03 4.89 1.07 0.00 0.00 0.00 3.96 0.00 0.03 2.00 0.00 0.00 18.00 0.18 CG-14CH-127_area1_pt4.c 5.98 0.04 4.58 1.37 0.00 0.00 0.02 3.99 0.00 0.01 2.00 0.00 0.00 18.00 0.23 CG-14CH-127_area1_line1 5.98 0.02 4.38 1.58 0.00 0.00 0.00 4.00 0.01 0.05 2.00 0.00 0.00 18.02 0.26
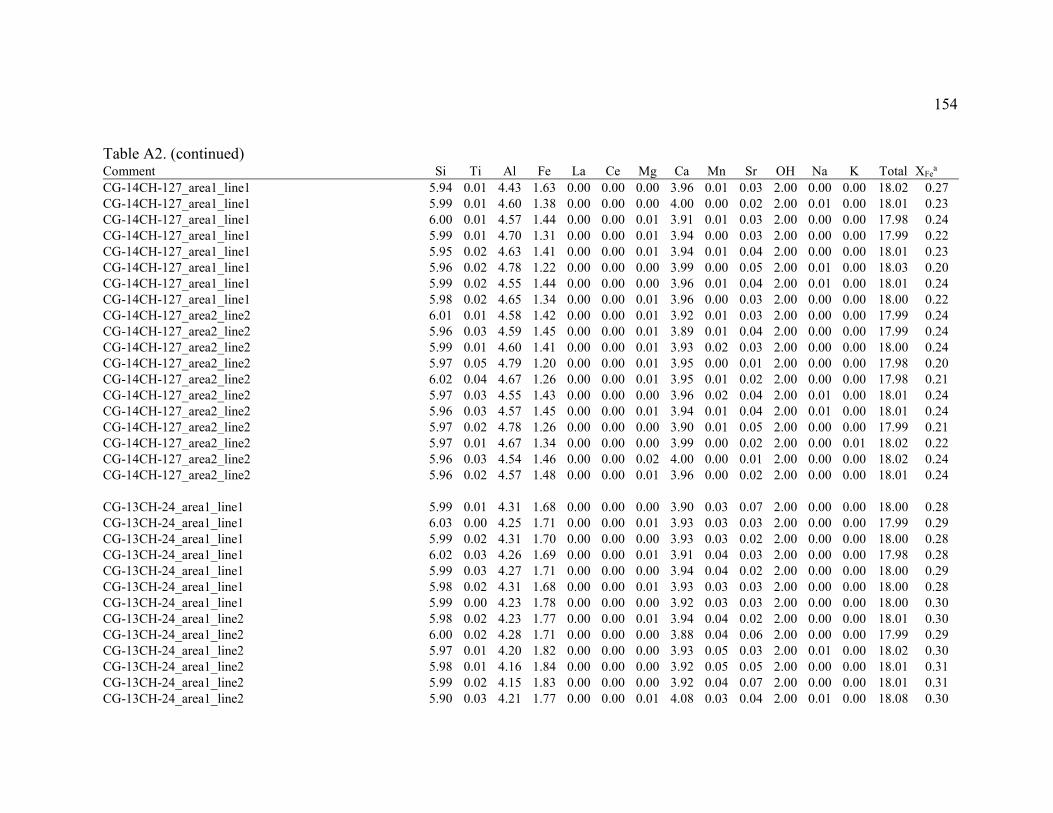
154
Table A2. (continued) Comment Si Ti Al Fe La Ce Mg Ca Mn Sr OH Na K Total XFe
a CG-14CH-127_area1_line1 5.94 0.01 4.43 1.63 0.00 0.00 0.00 3.96 0.01 0.03 2.00 0.00 0.00 18.02 0.27 CG-14CH-127_area1_line1 5.99 0.01 4.60 1.38 0.00 0.00 0.00 4.00 0.00 0.02 2.00 0.01 0.00 18.01 0.23 CG-14CH-127_area1_line1 6.00 0.01 4.57 1.44 0.00 0.00 0.01 3.91 0.01 0.03 2.00 0.00 0.00 17.98 0.24 CG-14CH-127_area1_line1 5.99 0.01 4.70 1.31 0.00 0.00 0.01 3.94 0.00 0.03 2.00 0.00 0.00 17.99 0.22 CG-14CH-127_area1_line1 5.95 0.02 4.63 1.41 0.00 0.00 0.01 3.94 0.01 0.04 2.00 0.00 0.00 18.01 0.23 CG-14CH-127_area1_line1 5.96 0.02 4.78 1.22 0.00 0.00 0.00 3.99 0.00 0.05 2.00 0.01 0.00 18.03 0.20 CG-14CH-127_area1_line1 5.99 0.02 4.55 1.44 0.00 0.00 0.00 3.96 0.01 0.04 2.00 0.01 0.00 18.01 0.24 CG-14CH-127_area1_line1 5.98 0.02 4.65 1.34 0.00 0.00 0.01 3.96 0.00 0.03 2.00 0.00 0.00 18.00 0.22 CG-14CH-127_area2_line2 6.01 0.01 4.58 1.42 0.00 0.00 0.01 3.92 0.01 0.03 2.00 0.00 0.00 17.99 0.24 CG-14CH-127_area2_line2 5.96 0.03 4.59 1.45 0.00 0.00 0.01 3.89 0.01 0.04 2.00 0.00 0.00 17.99 0.24 CG-14CH-127_area2_line2 5.99 0.01 4.60 1.41 0.00 0.00 0.01 3.93 0.02 0.03 2.00 0.00 0.00 18.00 0.24 CG-14CH-127_area2_line2 5.97 0.05 4.79 1.20 0.00 0.00 0.01 3.95 0.00 0.01 2.00 0.00 0.00 17.98 0.20 CG-14CH-127_area2_line2 6.02 0.04 4.67 1.26 0.00 0.00 0.01 3.95 0.01 0.02 2.00 0.00 0.00 17.98 0.21 CG-14CH-127_area2_line2 5.97 0.03 4.55 1.43 0.00 0.00 0.00 3.96 0.02 0.04 2.00 0.01 0.00 18.01 0.24 CG-14CH-127_area2_line2 5.96 0.03 4.57 1.45 0.00 0.00 0.01 3.94 0.01 0.04 2.00 0.01 0.00 18.01 0.24 CG-14CH-127_area2_line2 5.97 0.02 4.78 1.26 0.00 0.00 0.00 3.90 0.01 0.05 2.00 0.00 0.00 17.99 0.21 CG-14CH-127_area2_line2 5.97 0.01 4.67 1.34 0.00 0.00 0.00 3.99 0.00 0.02 2.00 0.00 0.01 18.02 0.22 CG-14CH-127_area2_line2 5.96 0.03 4.54 1.46 0.00 0.00 0.02 4.00 0.00 0.01 2.00 0.00 0.00 18.02 0.24 CG-14CH-127_area2_line2 5.96 0.02 4.57 1.48 0.00 0.00 0.01 3.96 0.00 0.02 2.00 0.00 0.00 18.01 0.24
CG-13CH-24_area1_line1 5.99 0.01 4.31 1.68 0.00 0.00 0.00 3.90 0.03 0.07 2.00 0.00 0.00 18.00 0.28 CG-13CH-24_area1_line1 6.03 0.00 4.25 1.71 0.00 0.00 0.01 3.93 0.03 0.03 2.00 0.00 0.00 17.99 0.29 CG-13CH-24_area1_line1 5.99 0.02 4.31 1.70 0.00 0.00 0.00 3.93 0.03 0.02 2.00 0.00 0.00 18.00 0.28 CG-13CH-24_area1_line1 6.02 0.03 4.26 1.69 0.00 0.00 0.01 3.91 0.04 0.03 2.00 0.00 0.00 17.98 0.28 CG-13CH-24_area1_line1 5.99 0.03 4.27 1.71 0.00 0.00 0.00 3.94 0.04 0.02 2.00 0.00 0.00 18.00 0.29 CG-13CH-24_area1_line1 5.98 0.02 4.31 1.68 0.00 0.00 0.01 3.93 0.03 0.03 2.00 0.00 0.00 18.00 0.28 CG-13CH-24_area1_line1 5.99 0.00 4.23 1.78 0.00 0.00 0.00 3.92 0.03 0.03 2.00 0.00 0.00 18.00 0.30 CG-13CH-24_area1_line2 5.98 0.02 4.23 1.77 0.00 0.00 0.01 3.94 0.04 0.02 2.00 0.00 0.00 18.01 0.30 CG-13CH-24_area1_line2 6.00 0.02 4.28 1.71 0.00 0.00 0.00 3.88 0.04 0.06 2.00 0.00 0.00 17.99 0.29 CG-13CH-24_area1_line2 5.97 0.01 4.20 1.82 0.00 0.00 0.00 3.93 0.05 0.03 2.00 0.01 0.00 18.02 0.30 CG-13CH-24_area1_line2 5.98 0.01 4.16 1.84 0.00 0.00 0.00 3.92 0.05 0.05 2.00 0.00 0.00 18.01 0.31 CG-13CH-24_area1_line2 5.99 0.02 4.15 1.83 0.00 0.00 0.00 3.92 0.04 0.07 2.00 0.00 0.00 18.01 0.31 CG-13CH-24_area1_line2 5.90 0.03 4.21 1.77 0.00 0.00 0.01 4.08 0.03 0.04 2.00 0.01 0.00 18.08 0.30
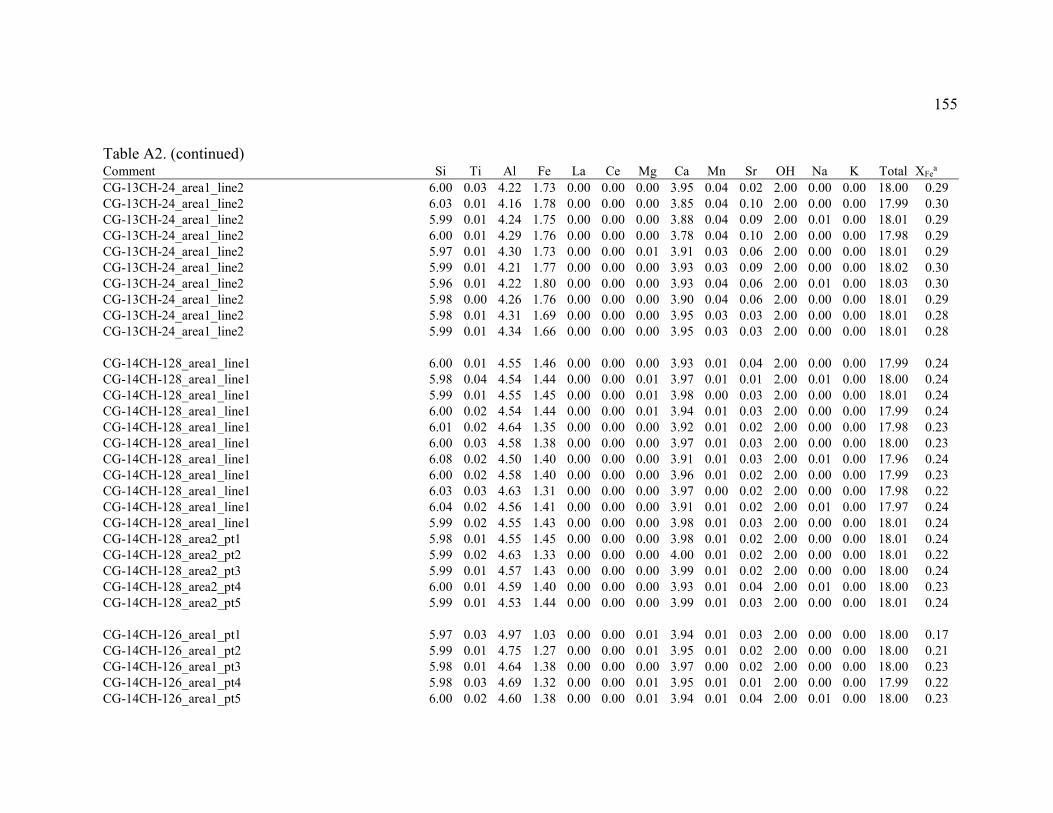
155
Table A2. (continued) Comment Si Ti Al Fe La Ce Mg Ca Mn Sr OH Na K Total XFe
a CG-13CH-24_area1_line2 6.00 0.03 4.22 1.73 0.00 0.00 0.00 3.95 0.04 0.02 2.00 0.00 0.00 18.00 0.29 CG-13CH-24_area1_line2 6.03 0.01 4.16 1.78 0.00 0.00 0.00 3.85 0.04 0.10 2.00 0.00 0.00 17.99 0.30 CG-13CH-24_area1_line2 5.99 0.01 4.24 1.75 0.00 0.00 0.00 3.88 0.04 0.09 2.00 0.01 0.00 18.01 0.29 CG-13CH-24_area1_line2 6.00 0.01 4.29 1.76 0.00 0.00 0.00 3.78 0.04 0.10 2.00 0.00 0.00 17.98 0.29 CG-13CH-24_area1_line2 5.97 0.01 4.30 1.73 0.00 0.00 0.01 3.91 0.03 0.06 2.00 0.00 0.00 18.01 0.29 CG-13CH-24_area1_line2 5.99 0.01 4.21 1.77 0.00 0.00 0.00 3.93 0.03 0.09 2.00 0.00 0.00 18.02 0.30 CG-13CH-24_area1_line2 5.96 0.01 4.22 1.80 0.00 0.00 0.00 3.93 0.04 0.06 2.00 0.01 0.00 18.03 0.30 CG-13CH-24_area1_line2 5.98 0.00 4.26 1.76 0.00 0.00 0.00 3.90 0.04 0.06 2.00 0.00 0.00 18.01 0.29 CG-13CH-24_area1_line2 5.98 0.01 4.31 1.69 0.00 0.00 0.00 3.95 0.03 0.03 2.00 0.00 0.00 18.01 0.28 CG-13CH-24_area1_line2 5.99 0.01 4.34 1.66 0.00 0.00 0.00 3.95 0.03 0.03 2.00 0.00 0.00 18.01 0.28
CG-14CH-128_area1_line1 6.00 0.01 4.55 1.46 0.00 0.00 0.00 3.93 0.01 0.04 2.00 0.00 0.00 17.99 0.24 CG-14CH-128_area1_line1 5.98 0.04 4.54 1.44 0.00 0.00 0.01 3.97 0.01 0.01 2.00 0.01 0.00 18.00 0.24 CG-14CH-128_area1_line1 5.99 0.01 4.55 1.45 0.00 0.00 0.01 3.98 0.00 0.03 2.00 0.00 0.00 18.01 0.24 CG-14CH-128_area1_line1 6.00 0.02 4.54 1.44 0.00 0.00 0.01 3.94 0.01 0.03 2.00 0.00 0.00 17.99 0.24 CG-14CH-128_area1_line1 6.01 0.02 4.64 1.35 0.00 0.00 0.00 3.92 0.01 0.02 2.00 0.00 0.00 17.98 0.23 CG-14CH-128_area1_line1 6.00 0.03 4.58 1.38 0.00 0.00 0.00 3.97 0.01 0.03 2.00 0.00 0.00 18.00 0.23 CG-14CH-128_area1_line1 6.08 0.02 4.50 1.40 0.00 0.00 0.00 3.91 0.01 0.03 2.00 0.01 0.00 17.96 0.24 CG-14CH-128_area1_line1 6.00 0.02 4.58 1.40 0.00 0.00 0.00 3.96 0.01 0.02 2.00 0.00 0.00 17.99 0.23 CG-14CH-128_area1_line1 6.03 0.03 4.63 1.31 0.00 0.00 0.00 3.97 0.00 0.02 2.00 0.00 0.00 17.98 0.22 CG-14CH-128_area1_line1 6.04 0.02 4.56 1.41 0.00 0.00 0.00 3.91 0.01 0.02 2.00 0.01 0.00 17.97 0.24 CG-14CH-128_area1_line1 5.99 0.02 4.55 1.43 0.00 0.00 0.00 3.98 0.01 0.03 2.00 0.00 0.00 18.01 0.24 CG-14CH-128_area2_pt1 5.98 0.01 4.55 1.45 0.00 0.00 0.00 3.98 0.01 0.02 2.00 0.00 0.00 18.01 0.24 CG-14CH-128_area2_pt2 5.99 0.02 4.63 1.33 0.00 0.00 0.00 4.00 0.01 0.02 2.00 0.00 0.00 18.01 0.22 CG-14CH-128_area2_pt3 5.99 0.01 4.57 1.43 0.00 0.00 0.00 3.99 0.01 0.02 2.00 0.00 0.00 18.00 0.24 CG-14CH-128_area2_pt4 6.00 0.01 4.59 1.40 0.00 0.00 0.00 3.93 0.01 0.04 2.00 0.01 0.00 18.00 0.23 CG-14CH-128_area2_pt5 5.99 0.01 4.53 1.44 0.00 0.00 0.00 3.99 0.01 0.03 2.00 0.00 0.00 18.01 0.24
CG-14CH-126_area1_pt1 5.97 0.03 4.97 1.03 0.00 0.00 0.01 3.94 0.01 0.03 2.00 0.00 0.00 18.00 0.17 CG-14CH-126_area1_pt2 5.99 0.01 4.75 1.27 0.00 0.00 0.01 3.95 0.01 0.02 2.00 0.00 0.00 18.00 0.21 CG-14CH-126_area1_pt3 5.98 0.01 4.64 1.38 0.00 0.00 0.00 3.97 0.00 0.02 2.00 0.00 0.00 18.00 0.23 CG-14CH-126_area1_pt4 5.98 0.03 4.69 1.32 0.00 0.00 0.01 3.95 0.01 0.01 2.00 0.00 0.00 17.99 0.22 CG-14CH-126_area1_pt5 6.00 0.02 4.60 1.38 0.00 0.00 0.01 3.94 0.01 0.04 2.00 0.01 0.00 18.00 0.23
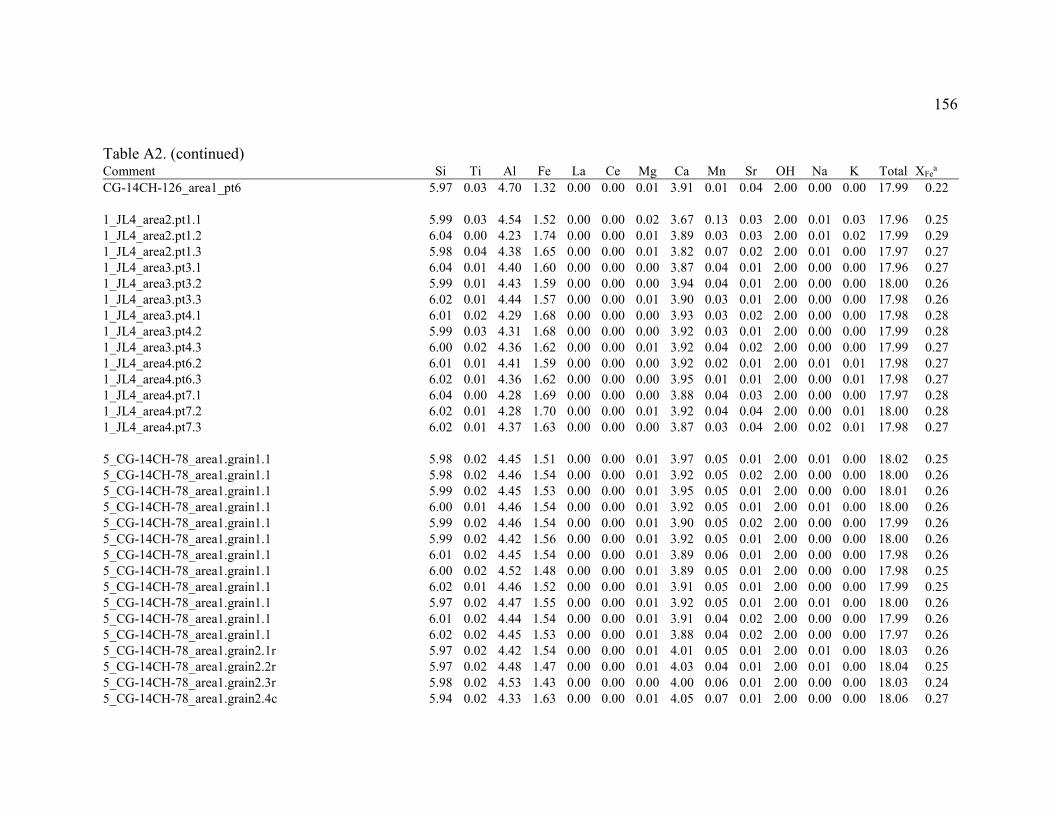
156
Table A2. (continued) Comment Si Ti Al Fe La Ce Mg Ca Mn Sr OH Na K Total XFe
a CG-14CH-126_area1_pt6 5.97 0.03 4.70 1.32 0.00 0.00 0.01 3.91 0.01 0.04 2.00 0.00 0.00 17.99 0.22
1_JL4_area2.pt1.1 5.99 0.03 4.54 1.52 0.00 0.00 0.02 3.67 0.13 0.03 2.00 0.01 0.03 17.96 0.25 1_JL4_area2.pt1.2 6.04 0.00 4.23 1.74 0.00 0.00 0.01 3.89 0.03 0.03 2.00 0.01 0.02 17.99 0.29 1_JL4_area2.pt1.3 5.98 0.04 4.38 1.65 0.00 0.00 0.01 3.82 0.07 0.02 2.00 0.01 0.00 17.97 0.27 1_JL4_area3.pt3.1 6.04 0.01 4.40 1.60 0.00 0.00 0.00 3.87 0.04 0.01 2.00 0.00 0.00 17.96 0.27 1_JL4_area3.pt3.2 5.99 0.01 4.43 1.59 0.00 0.00 0.00 3.94 0.04 0.01 2.00 0.00 0.00 18.00 0.26 1_JL4_area3.pt3.3 6.02 0.01 4.44 1.57 0.00 0.00 0.01 3.90 0.03 0.01 2.00 0.00 0.00 17.98 0.26 1_JL4_area3.pt4.1 6.01 0.02 4.29 1.68 0.00 0.00 0.00 3.93 0.03 0.02 2.00 0.00 0.00 17.98 0.28 1_JL4_area3.pt4.2 5.99 0.03 4.31 1.68 0.00 0.00 0.00 3.92 0.03 0.01 2.00 0.00 0.00 17.99 0.28 1_JL4_area3.pt4.3 6.00 0.02 4.36 1.62 0.00 0.00 0.01 3.92 0.04 0.02 2.00 0.00 0.00 17.99 0.27 1_JL4_area4.pt6.2 6.01 0.01 4.41 1.59 0.00 0.00 0.00 3.92 0.02 0.01 2.00 0.01 0.01 17.98 0.27 1_JL4_area4.pt6.3 6.02 0.01 4.36 1.62 0.00 0.00 0.00 3.95 0.01 0.01 2.00 0.00 0.01 17.98 0.27 1_JL4_area4.pt7.1 6.04 0.00 4.28 1.69 0.00 0.00 0.00 3.88 0.04 0.03 2.00 0.00 0.00 17.97 0.28 1_JL4_area4.pt7.2 6.02 0.01 4.28 1.70 0.00 0.00 0.01 3.92 0.04 0.04 2.00 0.00 0.01 18.00 0.28 1_JL4_area4.pt7.3 6.02 0.01 4.37 1.63 0.00 0.00 0.00 3.87 0.03 0.04 2.00 0.02 0.01 17.98 0.27
5_CG-14CH-78_area1.grain1.1 5.98 0.02 4.45 1.51 0.00 0.00 0.01 3.97 0.05 0.01 2.00 0.01 0.00 18.02 0.25 5_CG-14CH-78_area1.grain1.1 5.98 0.02 4.46 1.54 0.00 0.00 0.01 3.92 0.05 0.02 2.00 0.00 0.00 18.00 0.26 5_CG-14CH-78_area1.grain1.1 5.99 0.02 4.45 1.53 0.00 0.00 0.01 3.95 0.05 0.01 2.00 0.00 0.00 18.01 0.26 5_CG-14CH-78_area1.grain1.1 6.00 0.01 4.46 1.54 0.00 0.00 0.01 3.92 0.05 0.01 2.00 0.01 0.00 18.00 0.26 5_CG-14CH-78_area1.grain1.1 5.99 0.02 4.46 1.54 0.00 0.00 0.01 3.90 0.05 0.02 2.00 0.00 0.00 17.99 0.26 5_CG-14CH-78_area1.grain1.1 5.99 0.02 4.42 1.56 0.00 0.00 0.01 3.92 0.05 0.01 2.00 0.00 0.00 18.00 0.26 5_CG-14CH-78_area1.grain1.1 6.01 0.02 4.45 1.54 0.00 0.00 0.01 3.89 0.06 0.01 2.00 0.00 0.00 17.98 0.26 5_CG-14CH-78_area1.grain1.1 6.00 0.02 4.52 1.48 0.00 0.00 0.01 3.89 0.05 0.01 2.00 0.00 0.00 17.98 0.25 5_CG-14CH-78_area1.grain1.1 6.02 0.01 4.46 1.52 0.00 0.00 0.01 3.91 0.05 0.01 2.00 0.00 0.00 17.99 0.25 5_CG-14CH-78_area1.grain1.1 5.97 0.02 4.47 1.55 0.00 0.00 0.01 3.92 0.05 0.01 2.00 0.01 0.00 18.00 0.26 5_CG-14CH-78_area1.grain1.1 6.01 0.02 4.44 1.54 0.00 0.00 0.01 3.91 0.04 0.02 2.00 0.00 0.00 17.99 0.26 5_CG-14CH-78_area1.grain1.1 6.02 0.02 4.45 1.53 0.00 0.00 0.01 3.88 0.04 0.02 2.00 0.00 0.00 17.97 0.26 5_CG-14CH-78_area1.grain2.1r 5.97 0.02 4.42 1.54 0.00 0.00 0.01 4.01 0.05 0.01 2.00 0.01 0.00 18.03 0.26 5_CG-14CH-78_area1.grain2.2r 5.97 0.02 4.48 1.47 0.00 0.00 0.01 4.03 0.04 0.01 2.00 0.01 0.00 18.04 0.25 5_CG-14CH-78_area1.grain2.3r 5.98 0.02 4.53 1.43 0.00 0.00 0.00 4.00 0.06 0.01 2.00 0.00 0.00 18.03 0.24 5_CG-14CH-78_area1.grain2.4c 5.94 0.02 4.33 1.63 0.00 0.00 0.01 4.05 0.07 0.01 2.00 0.00 0.00 18.06 0.27
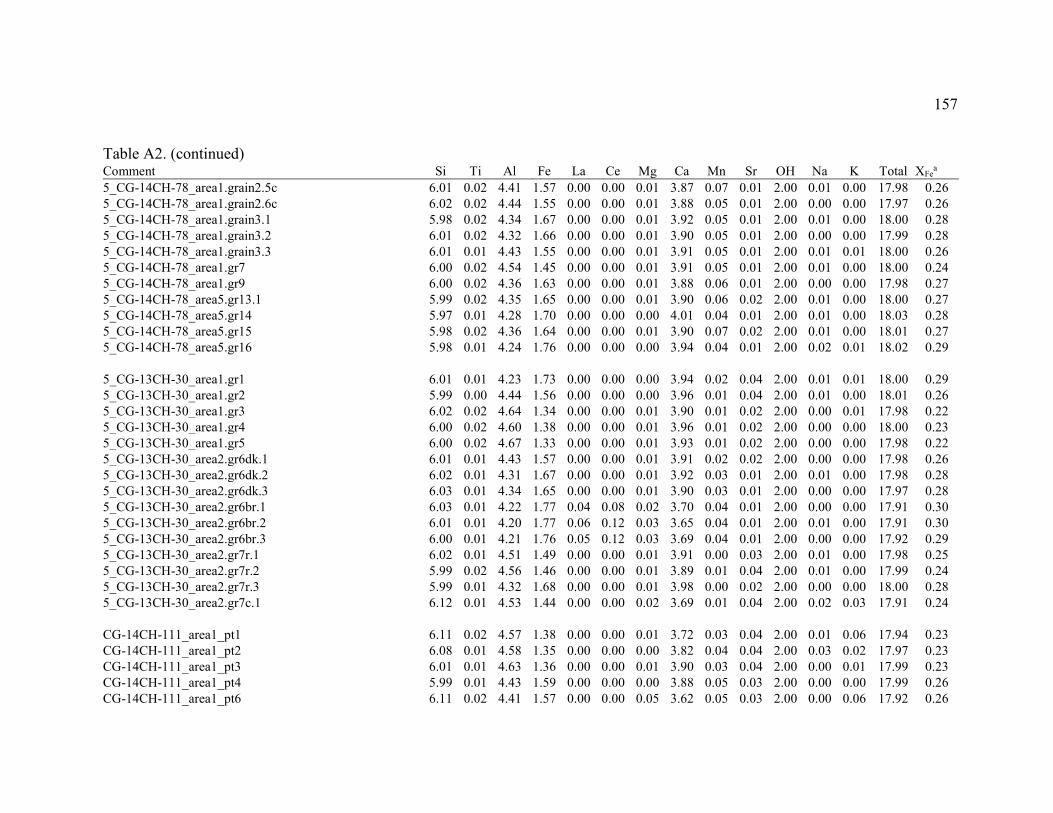
157
Table A2. (continued) Comment Si Ti Al Fe La Ce Mg Ca Mn Sr OH Na K Total XFe
a 5_CG-14CH-78_area1.grain2.5c 6.01 0.02 4.41 1.57 0.00 0.00 0.01 3.87 0.07 0.01 2.00 0.01 0.00 17.98 0.26 5_CG-14CH-78_area1.grain2.6c 6.02 0.02 4.44 1.55 0.00 0.00 0.01 3.88 0.05 0.01 2.00 0.00 0.00 17.97 0.26 5_CG-14CH-78_area1.grain3.1 5.98 0.02 4.34 1.67 0.00 0.00 0.01 3.92 0.05 0.01 2.00 0.01 0.00 18.00 0.28 5_CG-14CH-78_area1.grain3.2 6.01 0.02 4.32 1.66 0.00 0.00 0.01 3.90 0.05 0.01 2.00 0.00 0.00 17.99 0.28 5_CG-14CH-78_area1.grain3.3 6.01 0.01 4.43 1.55 0.00 0.00 0.01 3.91 0.05 0.01 2.00 0.01 0.01 18.00 0.26 5_CG-14CH-78_area1.gr7 6.00 0.02 4.54 1.45 0.00 0.00 0.01 3.91 0.05 0.01 2.00 0.01 0.00 18.00 0.24 5_CG-14CH-78_area1.gr9 6.00 0.02 4.36 1.63 0.00 0.00 0.01 3.88 0.06 0.01 2.00 0.00 0.00 17.98 0.27 5_CG-14CH-78_area5.gr13.1 5.99 0.02 4.35 1.65 0.00 0.00 0.01 3.90 0.06 0.02 2.00 0.01 0.00 18.00 0.27 5_CG-14CH-78_area5.gr14 5.97 0.01 4.28 1.70 0.00 0.00 0.00 4.01 0.04 0.01 2.00 0.01 0.00 18.03 0.28 5_CG-14CH-78_area5.gr15 5.98 0.02 4.36 1.64 0.00 0.00 0.01 3.90 0.07 0.02 2.00 0.01 0.00 18.01 0.27 5_CG-14CH-78_area5.gr16 5.98 0.01 4.24 1.76 0.00 0.00 0.00 3.94 0.04 0.01 2.00 0.02 0.01 18.02 0.29
5_CG-13CH-30_area1.gr1 6.01 0.01 4.23 1.73 0.00 0.00 0.00 3.94 0.02 0.04 2.00 0.01 0.01 18.00 0.29 5_CG-13CH-30_area1.gr2 5.99 0.00 4.44 1.56 0.00 0.00 0.00 3.96 0.01 0.04 2.00 0.01 0.00 18.01 0.26 5_CG-13CH-30_area1.gr3 6.02 0.02 4.64 1.34 0.00 0.00 0.01 3.90 0.01 0.02 2.00 0.00 0.01 17.98 0.22 5_CG-13CH-30_area1.gr4 6.00 0.02 4.60 1.38 0.00 0.00 0.01 3.96 0.01 0.02 2.00 0.00 0.00 18.00 0.23 5_CG-13CH-30_area1.gr5 6.00 0.02 4.67 1.33 0.00 0.00 0.01 3.93 0.01 0.02 2.00 0.00 0.00 17.98 0.22 5_CG-13CH-30_area2.gr6dk.1 6.01 0.01 4.43 1.57 0.00 0.00 0.01 3.91 0.02 0.02 2.00 0.00 0.00 17.98 0.26 5_CG-13CH-30_area2.gr6dk.2 6.02 0.01 4.31 1.67 0.00 0.00 0.01 3.92 0.03 0.01 2.00 0.01 0.00 17.98 0.28 5_CG-13CH-30_area2.gr6dk.3 6.03 0.01 4.34 1.65 0.00 0.00 0.01 3.90 0.03 0.01 2.00 0.00 0.00 17.97 0.28 5_CG-13CH-30_area2.gr6br.1 6.03 0.01 4.22 1.77 0.04 0.08 0.02 3.70 0.04 0.01 2.00 0.00 0.00 17.91 0.30 5_CG-13CH-30_area2.gr6br.2 6.01 0.01 4.20 1.77 0.06 0.12 0.03 3.65 0.04 0.01 2.00 0.01 0.00 17.91 0.30 5_CG-13CH-30_area2.gr6br.3 6.00 0.01 4.21 1.76 0.05 0.12 0.03 3.69 0.04 0.01 2.00 0.00 0.00 17.92 0.29 5_CG-13CH-30_area2.gr7r.1 6.02 0.01 4.51 1.49 0.00 0.00 0.01 3.91 0.00 0.03 2.00 0.01 0.00 17.98 0.25 5_CG-13CH-30_area2.gr7r.2 5.99 0.02 4.56 1.46 0.00 0.00 0.01 3.89 0.01 0.04 2.00 0.01 0.00 17.99 0.24 5_CG-13CH-30_area2.gr7r.3 5.99 0.01 4.32 1.68 0.00 0.00 0.01 3.98 0.00 0.02 2.00 0.00 0.00 18.00 0.28 5_CG-13CH-30_area2.gr7c.1 6.12 0.01 4.53 1.44 0.00 0.00 0.02 3.69 0.01 0.04 2.00 0.02 0.03 17.91 0.24
CG-14CH-111_area1_pt1 6.11 0.02 4.57 1.38 0.00 0.00 0.01 3.72 0.03 0.04 2.00 0.01 0.06 17.94 0.23 CG-14CH-111_area1_pt2 6.08 0.01 4.58 1.35 0.00 0.00 0.00 3.82 0.04 0.04 2.00 0.03 0.02 17.97 0.23 CG-14CH-111_area1_pt3 6.01 0.01 4.63 1.36 0.00 0.00 0.01 3.90 0.03 0.04 2.00 0.00 0.01 17.99 0.23 CG-14CH-111_area1_pt4 5.99 0.01 4.43 1.59 0.00 0.00 0.00 3.88 0.05 0.03 2.00 0.00 0.00 17.99 0.26 CG-14CH-111_area1_pt6 6.11 0.02 4.41 1.57 0.00 0.00 0.05 3.62 0.05 0.03 2.00 0.00 0.06 17.92 0.26
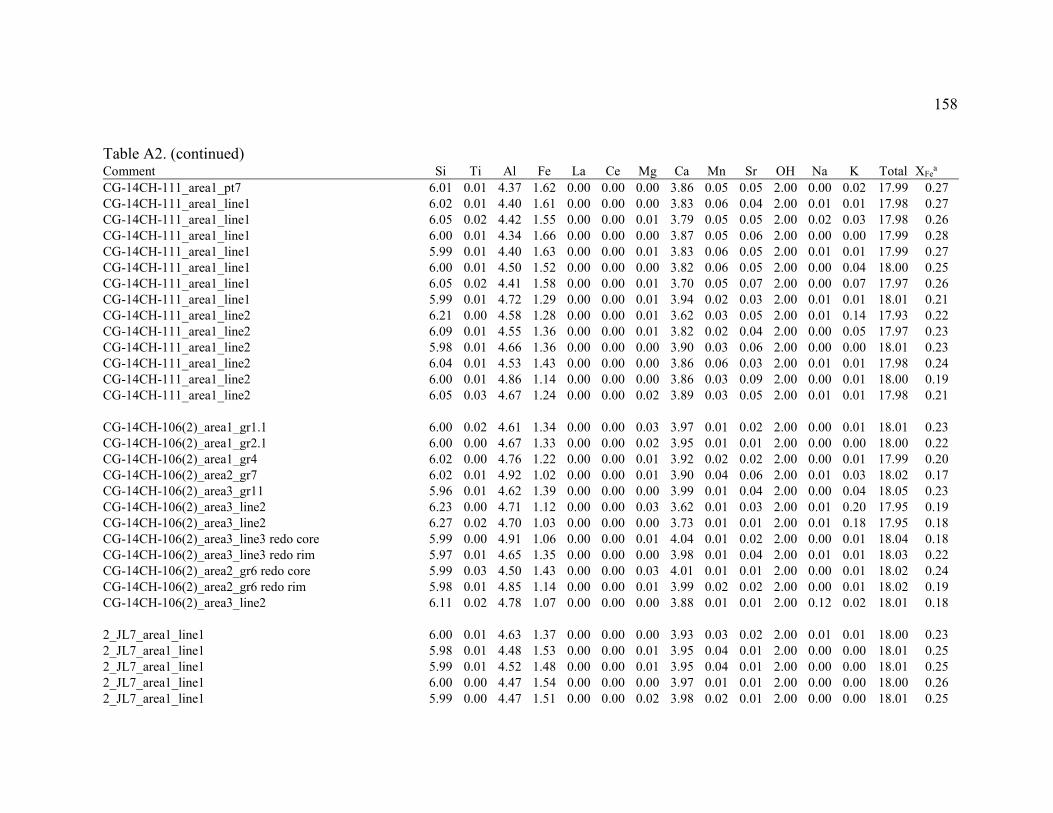
158
Table A2. (continued) Comment Si Ti Al Fe La Ce Mg Ca Mn Sr OH Na K Total XFe
a CG-14CH-111_area1_pt7 6.01 0.01 4.37 1.62 0.00 0.00 0.00 3.86 0.05 0.05 2.00 0.00 0.02 17.99 0.27 CG-14CH-111_area1_line1 6.02 0.01 4.40 1.61 0.00 0.00 0.00 3.83 0.06 0.04 2.00 0.01 0.01 17.98 0.27 CG-14CH-111_area1_line1 6.05 0.02 4.42 1.55 0.00 0.00 0.01 3.79 0.05 0.05 2.00 0.02 0.03 17.98 0.26 CG-14CH-111_area1_line1 6.00 0.01 4.34 1.66 0.00 0.00 0.00 3.87 0.05 0.06 2.00 0.00 0.00 17.99 0.28 CG-14CH-111_area1_line1 5.99 0.01 4.40 1.63 0.00 0.00 0.01 3.83 0.06 0.05 2.00 0.01 0.01 17.99 0.27 CG-14CH-111_area1_line1 6.00 0.01 4.50 1.52 0.00 0.00 0.00 3.82 0.06 0.05 2.00 0.00 0.04 18.00 0.25 CG-14CH-111_area1_line1 6.05 0.02 4.41 1.58 0.00 0.00 0.01 3.70 0.05 0.07 2.00 0.00 0.07 17.97 0.26 CG-14CH-111_area1_line1 5.99 0.01 4.72 1.29 0.00 0.00 0.01 3.94 0.02 0.03 2.00 0.01 0.01 18.01 0.21 CG-14CH-111_area1_line2 6.21 0.00 4.58 1.28 0.00 0.00 0.01 3.62 0.03 0.05 2.00 0.01 0.14 17.93 0.22 CG-14CH-111_area1_line2 6.09 0.01 4.55 1.36 0.00 0.00 0.01 3.82 0.02 0.04 2.00 0.00 0.05 17.97 0.23 CG-14CH-111_area1_line2 5.98 0.01 4.66 1.36 0.00 0.00 0.00 3.90 0.03 0.06 2.00 0.00 0.00 18.01 0.23 CG-14CH-111_area1_line2 6.04 0.01 4.53 1.43 0.00 0.00 0.00 3.86 0.06 0.03 2.00 0.01 0.01 17.98 0.24 CG-14CH-111_area1_line2 6.00 0.01 4.86 1.14 0.00 0.00 0.00 3.86 0.03 0.09 2.00 0.00 0.01 18.00 0.19 CG-14CH-111_area1_line2 6.05 0.03 4.67 1.24 0.00 0.00 0.02 3.89 0.03 0.05 2.00 0.01 0.01 17.98 0.21
CG-14CH-106(2)_area1_gr1.1 6.00 0.02 4.61 1.34 0.00 0.00 0.03 3.97 0.01 0.02 2.00 0.00 0.01 18.01 0.23 CG-14CH-106(2)_area1_gr2.1 6.00 0.00 4.67 1.33 0.00 0.00 0.02 3.95 0.01 0.01 2.00 0.00 0.00 18.00 0.22 CG-14CH-106(2)_area1_gr4 6.02 0.00 4.76 1.22 0.00 0.00 0.01 3.92 0.02 0.02 2.00 0.00 0.01 17.99 0.20 CG-14CH-106(2)_area2_gr7 6.02 0.01 4.92 1.02 0.00 0.00 0.01 3.90 0.04 0.06 2.00 0.01 0.03 18.02 0.17 CG-14CH-106(2)_area3_gr11 5.96 0.01 4.62 1.39 0.00 0.00 0.00 3.99 0.01 0.04 2.00 0.00 0.04 18.05 0.23 CG-14CH-106(2)_area3_line2 6.23 0.00 4.71 1.12 0.00 0.00 0.03 3.62 0.01 0.03 2.00 0.01 0.20 17.95 0.19 CG-14CH-106(2)_area3_line2 6.27 0.02 4.70 1.03 0.00 0.00 0.00 3.73 0.01 0.01 2.00 0.01 0.18 17.95 0.18 CG-14CH-106(2)_area3_line3 redo core 5.99 0.00 4.91 1.06 0.00 0.00 0.01 4.04 0.01 0.02 2.00 0.00 0.01 18.04 0.18 CG-14CH-106(2)_area3_line3 redo rim 5.97 0.01 4.65 1.35 0.00 0.00 0.00 3.98 0.01 0.04 2.00 0.01 0.01 18.03 0.22 CG-14CH-106(2)_area2_gr6 redo core 5.99 0.03 4.50 1.43 0.00 0.00 0.03 4.01 0.01 0.01 2.00 0.00 0.01 18.02 0.24 CG-14CH-106(2)_area2_gr6 redo rim 5.98 0.01 4.85 1.14 0.00 0.00 0.01 3.99 0.02 0.02 2.00 0.00 0.01 18.02 0.19 CG-14CH-106(2)_area3_line2 6.11 0.02 4.78 1.07 0.00 0.00 0.00 3.88 0.01 0.01 2.00 0.12 0.02 18.01 0.18
2_JL7_area1_line1 6.00 0.01 4.63 1.37 0.00 0.00 0.00 3.93 0.03 0.02 2.00 0.01 0.01 18.00 0.23 2_JL7_area1_line1 5.98 0.01 4.48 1.53 0.00 0.00 0.01 3.95 0.04 0.01 2.00 0.00 0.00 18.01 0.25 2_JL7_area1_line1 5.99 0.01 4.52 1.48 0.00 0.00 0.01 3.95 0.04 0.01 2.00 0.00 0.00 18.01 0.25 2_JL7_area1_line1 6.00 0.00 4.47 1.54 0.00 0.00 0.00 3.97 0.01 0.01 2.00 0.00 0.00 18.00 0.26 2_JL7_area1_line1 5.99 0.00 4.47 1.51 0.00 0.00 0.02 3.98 0.02 0.01 2.00 0.00 0.00 18.01 0.25
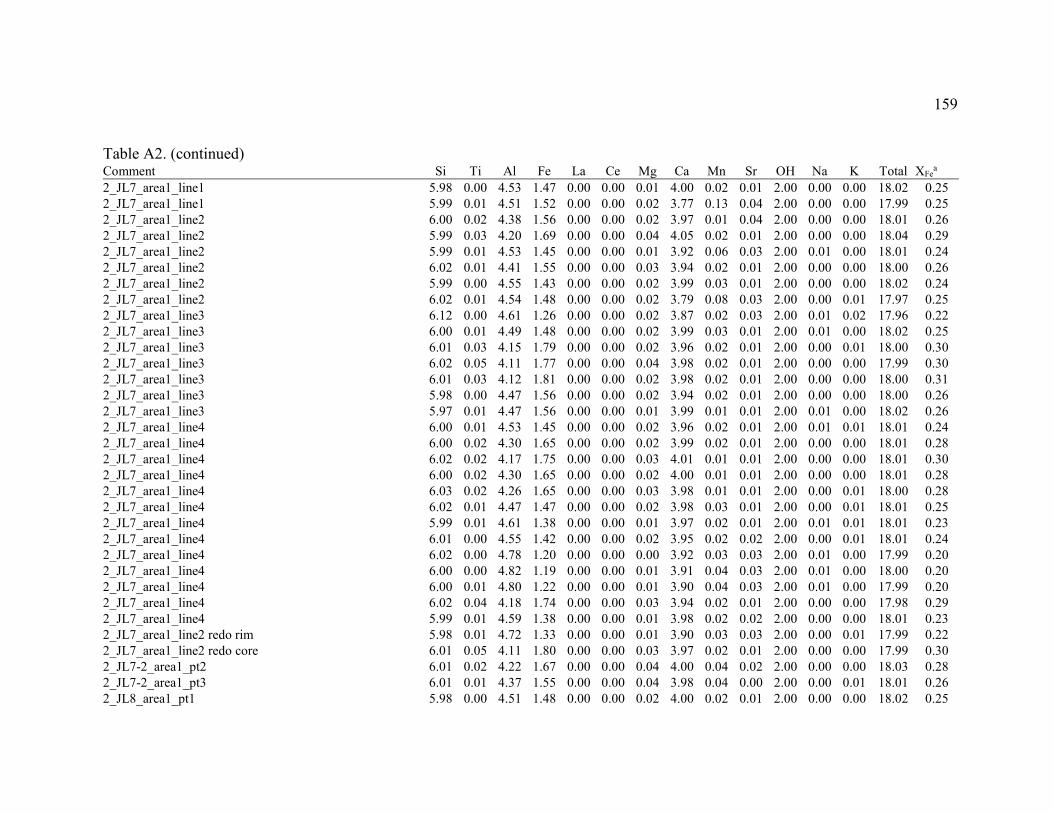
159
Table A2. (continued) Comment Si Ti Al Fe La Ce Mg Ca Mn Sr OH Na K Total XFe
a 2_JL7_area1_line1 5.98 0.00 4.53 1.47 0.00 0.00 0.01 4.00 0.02 0.01 2.00 0.00 0.00 18.02 0.25 2_JL7_area1_line1 5.99 0.01 4.51 1.52 0.00 0.00 0.02 3.77 0.13 0.04 2.00 0.00 0.00 17.99 0.25 2_JL7_area1_line2 6.00 0.02 4.38 1.56 0.00 0.00 0.02 3.97 0.01 0.04 2.00 0.00 0.00 18.01 0.26 2_JL7_area1_line2 5.99 0.03 4.20 1.69 0.00 0.00 0.04 4.05 0.02 0.01 2.00 0.00 0.00 18.04 0.29 2_JL7_area1_line2 5.99 0.01 4.53 1.45 0.00 0.00 0.01 3.92 0.06 0.03 2.00 0.01 0.00 18.01 0.24 2_JL7_area1_line2 6.02 0.01 4.41 1.55 0.00 0.00 0.03 3.94 0.02 0.01 2.00 0.00 0.00 18.00 0.26 2_JL7_area1_line2 5.99 0.00 4.55 1.43 0.00 0.00 0.02 3.99 0.03 0.01 2.00 0.00 0.00 18.02 0.24 2_JL7_area1_line2 6.02 0.01 4.54 1.48 0.00 0.00 0.02 3.79 0.08 0.03 2.00 0.00 0.01 17.97 0.25 2_JL7_area1_line3 6.12 0.00 4.61 1.26 0.00 0.00 0.02 3.87 0.02 0.03 2.00 0.01 0.02 17.96 0.22 2_JL7_area1_line3 6.00 0.01 4.49 1.48 0.00 0.00 0.02 3.99 0.03 0.01 2.00 0.01 0.00 18.02 0.25 2_JL7_area1_line3 6.01 0.03 4.15 1.79 0.00 0.00 0.02 3.96 0.02 0.01 2.00 0.00 0.01 18.00 0.30 2_JL7_area1_line3 6.02 0.05 4.11 1.77 0.00 0.00 0.04 3.98 0.02 0.01 2.00 0.00 0.00 17.99 0.30 2_JL7_area1_line3 6.01 0.03 4.12 1.81 0.00 0.00 0.02 3.98 0.02 0.01 2.00 0.00 0.00 18.00 0.31 2_JL7_area1_line3 5.98 0.00 4.47 1.56 0.00 0.00 0.02 3.94 0.02 0.01 2.00 0.00 0.00 18.00 0.26 2_JL7_area1_line3 5.97 0.01 4.47 1.56 0.00 0.00 0.01 3.99 0.01 0.01 2.00 0.01 0.00 18.02 0.26 2_JL7_area1_line4 6.00 0.01 4.53 1.45 0.00 0.00 0.02 3.96 0.02 0.01 2.00 0.01 0.01 18.01 0.24 2_JL7_area1_line4 6.00 0.02 4.30 1.65 0.00 0.00 0.02 3.99 0.02 0.01 2.00 0.00 0.00 18.01 0.28 2_JL7_area1_line4 6.02 0.02 4.17 1.75 0.00 0.00 0.03 4.01 0.01 0.01 2.00 0.00 0.00 18.01 0.30 2_JL7_area1_line4 6.00 0.02 4.30 1.65 0.00 0.00 0.02 4.00 0.01 0.01 2.00 0.00 0.00 18.01 0.28 2_JL7_area1_line4 6.03 0.02 4.26 1.65 0.00 0.00 0.03 3.98 0.01 0.01 2.00 0.00 0.01 18.00 0.28 2_JL7_area1_line4 6.02 0.01 4.47 1.47 0.00 0.00 0.02 3.98 0.03 0.01 2.00 0.00 0.01 18.01 0.25 2_JL7_area1_line4 5.99 0.01 4.61 1.38 0.00 0.00 0.01 3.97 0.02 0.01 2.00 0.01 0.01 18.01 0.23 2_JL7_area1_line4 6.01 0.00 4.55 1.42 0.00 0.00 0.02 3.95 0.02 0.02 2.00 0.00 0.01 18.01 0.24 2_JL7_area1_line4 6.02 0.00 4.78 1.20 0.00 0.00 0.00 3.92 0.03 0.03 2.00 0.01 0.00 17.99 0.20 2_JL7_area1_line4 6.00 0.00 4.82 1.19 0.00 0.00 0.01 3.91 0.04 0.03 2.00 0.01 0.00 18.00 0.20 2_JL7_area1_line4 6.00 0.01 4.80 1.22 0.00 0.00 0.01 3.90 0.04 0.03 2.00 0.01 0.00 17.99 0.20 2_JL7_area1_line4 6.02 0.04 4.18 1.74 0.00 0.00 0.03 3.94 0.02 0.01 2.00 0.00 0.00 17.98 0.29 2_JL7_area1_line4 5.99 0.01 4.59 1.38 0.00 0.00 0.01 3.98 0.02 0.02 2.00 0.00 0.00 18.01 0.23 2_JL7_area1_line2 redo rim 5.98 0.01 4.72 1.33 0.00 0.00 0.01 3.90 0.03 0.03 2.00 0.00 0.01 17.99 0.22 2_JL7_area1_line2 redo core 6.01 0.05 4.11 1.80 0.00 0.00 0.03 3.97 0.02 0.01 2.00 0.00 0.00 17.99 0.30 2_JL7-2_area1_pt2 6.01 0.02 4.22 1.67 0.00 0.00 0.04 4.00 0.04 0.02 2.00 0.00 0.00 18.03 0.28 2_JL7-2_area1_pt3 6.01 0.01 4.37 1.55 0.00 0.00 0.04 3.98 0.04 0.00 2.00 0.00 0.01 18.01 0.26 2_JL8_area1_pt1 5.98 0.00 4.51 1.48 0.00 0.00 0.02 4.00 0.02 0.01 2.00 0.00 0.00 18.02 0.25
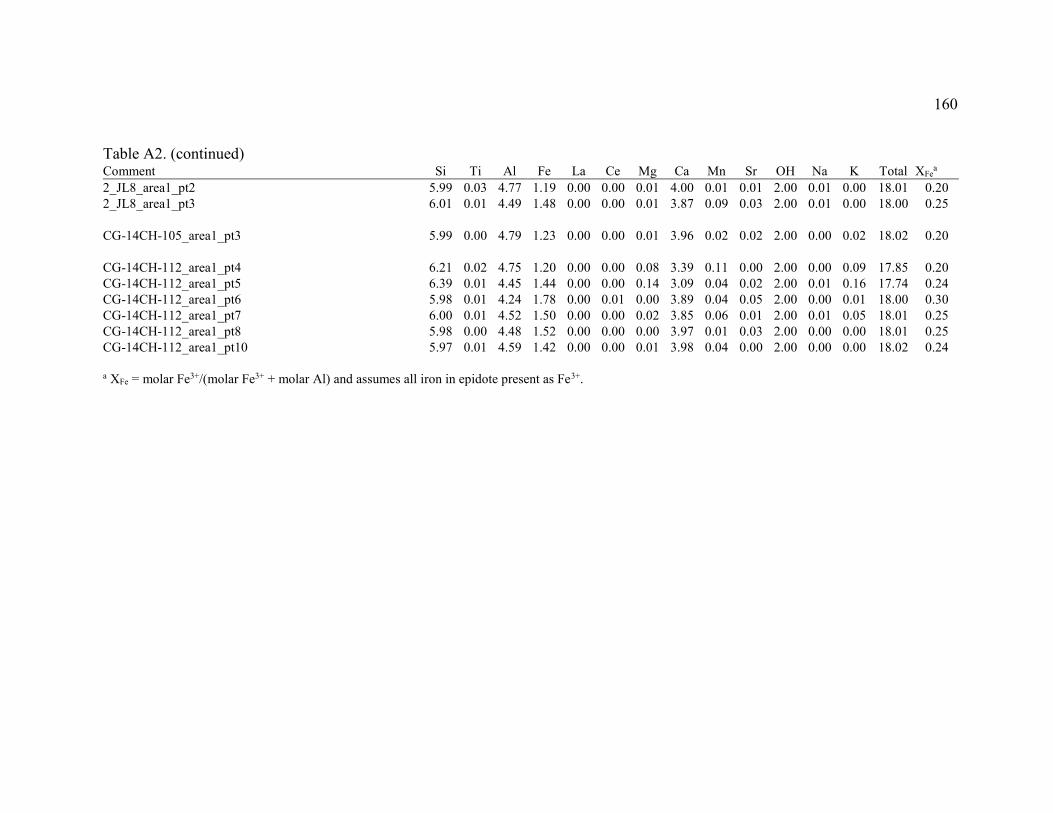
160
Table A2. (continued) Comment Si Ti Al Fe La Ce Mg Ca Mn Sr OH Na K Total XFe
a 2_JL8_area1_pt2 5.99 0.03 4.77 1.19 0.00 0.00 0.01 4.00 0.01 0.01 2.00 0.01 0.00 18.01 0.20 2_JL8_area1_pt3 6.01 0.01 4.49 1.48 0.00 0.00 0.01 3.87 0.09 0.03 2.00 0.01 0.00 18.00 0.25
CG-14CH-105_area1_pt3 5.99 0.00 4.79 1.23 0.00 0.00 0.01 3.96 0.02 0.02 2.00 0.00 0.02 18.02 0.20
CG-14CH-112_area1_pt4 6.21 0.02 4.75 1.20 0.00 0.00 0.08 3.39 0.11 0.00 2.00 0.00 0.09 17.85 0.20 CG-14CH-112_area1_pt5 6.39 0.01 4.45 1.44 0.00 0.00 0.14 3.09 0.04 0.02 2.00 0.01 0.16 17.74 0.24 CG-14CH-112_area1_pt6 5.98 0.01 4.24 1.78 0.00 0.01 0.00 3.89 0.04 0.05 2.00 0.00 0.01 18.00 0.30 CG-14CH-112_area1_pt7 6.00 0.01 4.52 1.50 0.00 0.00 0.02 3.85 0.06 0.01 2.00 0.01 0.05 18.01 0.25 CG-14CH-112_area1_pt8 5.98 0.00 4.48 1.52 0.00 0.00 0.00 3.97 0.01 0.03 2.00 0.00 0.00 18.01 0.25 CG-14CH-112_area1_pt10 5.97 0.01 4.59 1.42 0.00 0.00 0.01 3.98 0.04 0.00 2.00 0.00 0.00 18.02 0.24
a XFe = molar Fe3+/(molar Fe3+ + molar Al) and assumes all iron in epidote present as Fe3+.
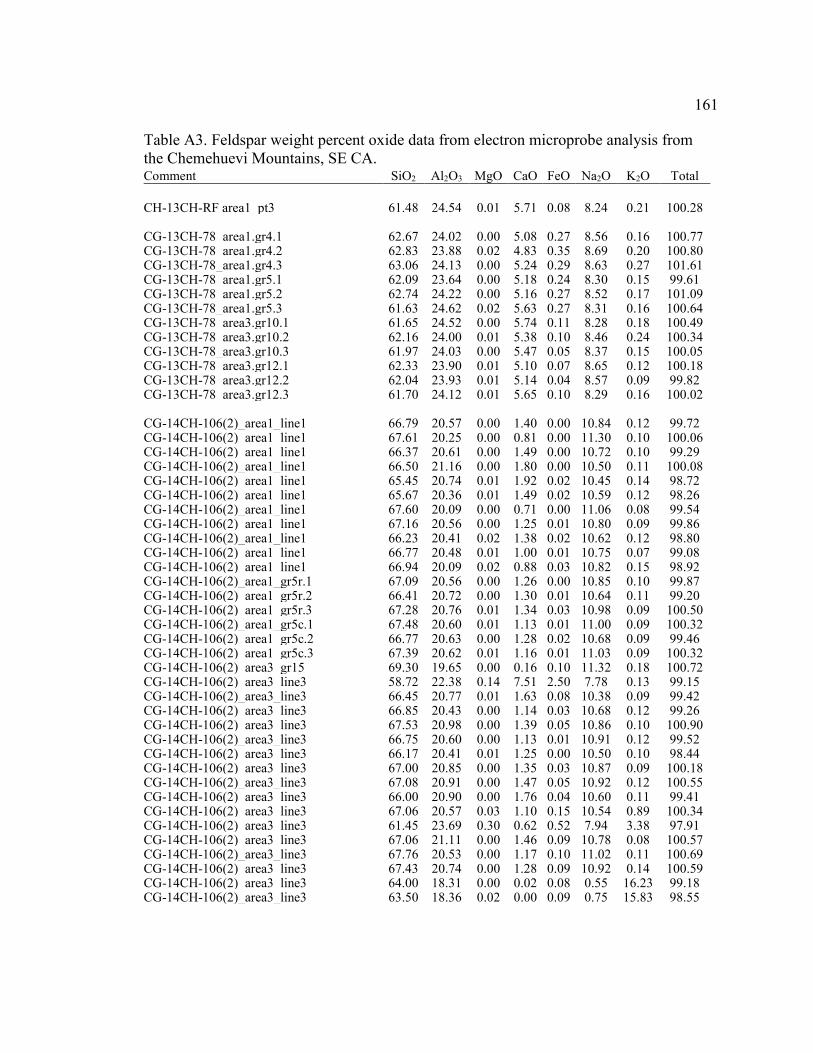
161
Table A3. Feldspar weight percent oxide data from electron microprobe analysis from the Chemehuevi Mountains, SE CA. Comment SiO2 Al2O3 MgO CaO FeO Na2O K2O Total
CH-13CH-RF area1_pt3 61.48 24.54 0.01 5.71 0.08 8.24 0.21 100.28
CG-13CH-78_area1.gr4.1 62.67 24.02 0.00 5.08 0.27 8.56 0.16 100.77 CG-13CH-78_area1.gr4.2 62.83 23.88 0.02 4.83 0.35 8.69 0.20 100.80 CG-13CH-78_area1.gr4.3 63.06 24.13 0.00 5.24 0.29 8.63 0.27 101.61 CG-13CH-78_area1.gr5.1 62.09 23.64 0.00 5.18 0.24 8.30 0.15 99.61 CG-13CH-78_area1.gr5.2 62.74 24.22 0.00 5.16 0.27 8.52 0.17 101.09 CG-13CH-78_area1.gr5.3 61.63 24.62 0.02 5.63 0.27 8.31 0.16 100.64 CG-13CH-78_area3.gr10.1 61.65 24.52 0.00 5.74 0.11 8.28 0.18 100.49 CG-13CH-78_area3.gr10.2 62.16 24.00 0.01 5.38 0.10 8.46 0.24 100.34 CG-13CH-78_area3.gr10.3 61.97 24.03 0.00 5.47 0.05 8.37 0.15 100.05 CG-13CH-78_area3.gr12.1 62.33 23.90 0.01 5.10 0.07 8.65 0.12 100.18 CG-13CH-78_area3.gr12.2 62.04 23.93 0.01 5.14 0.04 8.57 0.09 99.82 CG-13CH-78_area3.gr12.3 61.70 24.12 0.01 5.65 0.10 8.29 0.16 100.02
CG-14CH-106(2)_area1_line1 66.79 20.57 0.00 1.40 0.00 10.84 0.12 99.72 CG-14CH-106(2)_area1_line1 67.61 20.25 0.00 0.81 0.00 11.30 0.10 100.06 CG-14CH-106(2)_area1_line1 66.37 20.61 0.00 1.49 0.00 10.72 0.10 99.29 CG-14CH-106(2)_area1_line1 66.50 21.16 0.00 1.80 0.00 10.50 0.11 100.08 CG-14CH-106(2)_area1_line1 65.45 20.74 0.01 1.92 0.02 10.45 0.14 98.72 CG-14CH-106(2)_area1_line1 65.67 20.36 0.01 1.49 0.02 10.59 0.12 98.26 CG-14CH-106(2)_area1_line1 67.60 20.09 0.00 0.71 0.00 11.06 0.08 99.54 CG-14CH-106(2)_area1_line1 67.16 20.56 0.00 1.25 0.01 10.80 0.09 99.86 CG-14CH-106(2)_area1_line1 66.23 20.41 0.02 1.38 0.02 10.62 0.12 98.80 CG-14CH-106(2)_area1_line1 66.77 20.48 0.01 1.00 0.01 10.75 0.07 99.08 CG-14CH-106(2)_area1_line1 66.94 20.09 0.02 0.88 0.03 10.82 0.15 98.92 CG-14CH-106(2)_area1_gr5r.1 67.09 20.56 0.00 1.26 0.00 10.85 0.10 99.87 CG-14CH-106(2)_area1_gr5r.2 66.41 20.72 0.00 1.30 0.01 10.64 0.11 99.20 CG-14CH-106(2)_area1_gr5r.3 67.28 20.76 0.01 1.34 0.03 10.98 0.09 100.50 CG-14CH-106(2)_area1_gr5c.1 67.48 20.60 0.01 1.13 0.01 11.00 0.09 100.32 CG-14CH-106(2)_area1_gr5c.2 66.77 20.63 0.00 1.28 0.02 10.68 0.09 99.46 CG-14CH-106(2)_area1_gr5c.3 67.39 20.62 0.01 1.16 0.01 11.03 0.09 100.32 CG-14CH-106(2)_area3_gr15 69.30 19.65 0.00 0.16 0.10 11.32 0.18 100.72 CG-14CH-106(2)_area3_line3 58.72 22.38 0.14 7.51 2.50 7.78 0.13 99.15 CG-14CH-106(2)_area3_line3 66.45 20.77 0.01 1.63 0.08 10.38 0.09 99.42 CG-14CH-106(2)_area3_line3 66.85 20.43 0.00 1.14 0.03 10.68 0.12 99.26 CG-14CH-106(2)_area3_line3 67.53 20.98 0.00 1.39 0.05 10.86 0.10 100.90 CG-14CH-106(2)_area3_line3 66.75 20.60 0.00 1.13 0.01 10.91 0.12 99.52 CG-14CH-106(2)_area3_line3 66.17 20.41 0.01 1.25 0.00 10.50 0.10 98.44 CG-14CH-106(2)_area3_line3 67.00 20.85 0.00 1.35 0.03 10.87 0.09 100.18 CG-14CH-106(2)_area3_line3 67.08 20.91 0.00 1.47 0.05 10.92 0.12 100.55 CG-14CH-106(2)_area3_line3 66.00 20.90 0.00 1.76 0.04 10.60 0.11 99.41 CG-14CH-106(2)_area3_line3 67.06 20.57 0.03 1.10 0.15 10.54 0.89 100.34 CG-14CH-106(2)_area3_line3 61.45 23.69 0.30 0.62 0.52 7.94 3.38 97.91 CG-14CH-106(2)_area3_line3 67.06 21.11 0.00 1.46 0.09 10.78 0.08 100.57 CG-14CH-106(2)_area3_line3 67.76 20.53 0.00 1.17 0.10 11.02 0.11 100.69 CG-14CH-106(2)_area3_line3 67.43 20.74 0.00 1.28 0.09 10.92 0.14 100.59 CG-14CH-106(2)_area3_line3 64.00 18.31 0.00 0.02 0.08 0.55 16.23 99.18 CG-14CH-106(2)_area3_line3 63.50 18.36 0.02 0.00 0.09 0.75 15.83 98.55
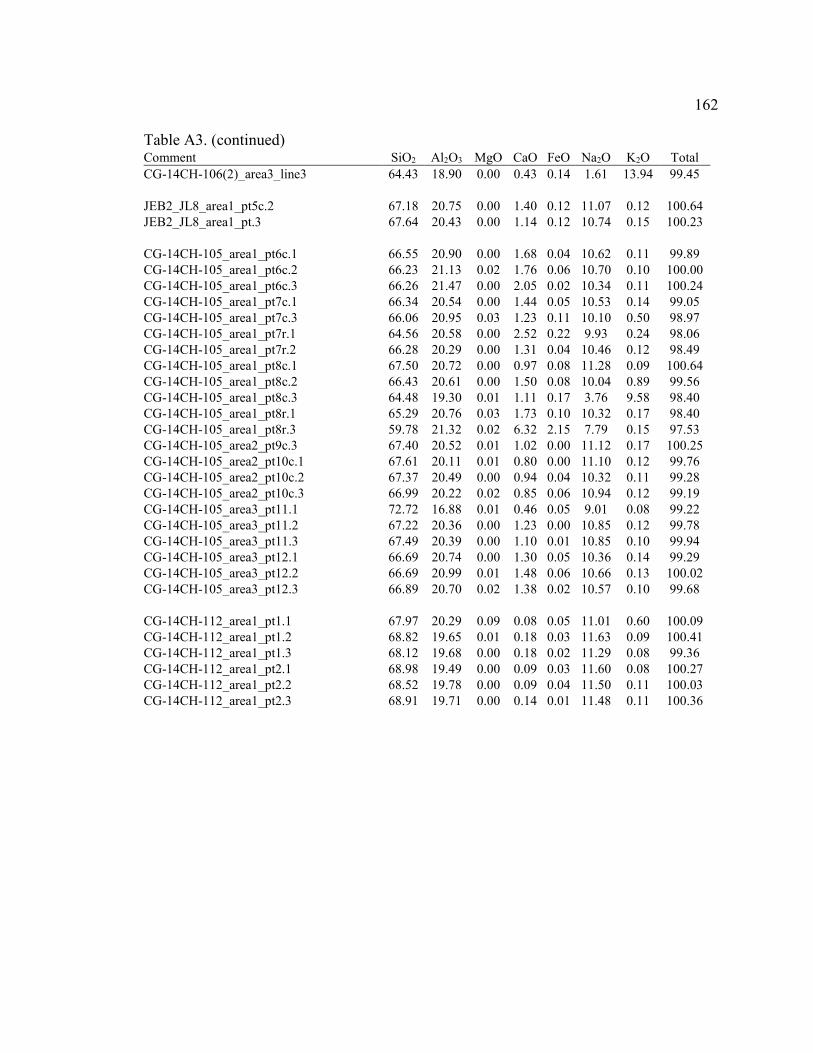
162
Table A3. (continued) Comment SiO2 Al2O3 MgO CaO FeO Na2O K2O Total
CG-14CH-106(2)_area3_line3 64.43 18.90 0.00 0.43 0.14 1.61 13.94 99.45
JEB2_JL8_area1_pt5c.2 67.18 20.75 0.00 1.40 0.12 11.07 0.12 100.64 JEB2_JL8_area1_pt.3 67.64 20.43 0.00 1.14 0.12 10.74 0.15 100.23
CG-14CH-105_area1_pt6c.1 66.55 20.90 0.00 1.68 0.04 10.62 0.11 99.89 CG-14CH-105_area1_pt6c.2 66.23 21.13 0.02 1.76 0.06 10.70 0.10 100.00 CG-14CH-105_area1_pt6c.3 66.26 21.47 0.00 2.05 0.02 10.34 0.11 100.24 CG-14CH-105_area1_pt7c.1 66.34 20.54 0.00 1.44 0.05 10.53 0.14 99.05 CG-14CH-105_area1_pt7c.3 66.06 20.95 0.03 1.23 0.11 10.10 0.50 98.97 CG-14CH-105_area1_pt7r.1 64.56 20.58 0.00 2.52 0.22 9.93 0.24 98.06 CG-14CH-105_area1_pt7r.2 66.28 20.29 0.00 1.31 0.04 10.46 0.12 98.49 CG-14CH-105_area1_pt8c.1 67.50 20.72 0.00 0.97 0.08 11.28 0.09 100.64 CG-14CH-105_area1_pt8c.2 66.43 20.61 0.00 1.50 0.08 10.04 0.89 99.56 CG-14CH-105_area1_pt8c.3 64.48 19.30 0.01 1.11 0.17 3.76 9.58 98.40 CG-14CH-105_area1_pt8r.1 65.29 20.76 0.03 1.73 0.10 10.32 0.17 98.40 CG-14CH-105_area1_pt8r.3 59.78 21.32 0.02 6.32 2.15 7.79 0.15 97.53 CG-14CH-105_area2_pt9c.3 67.40 20.52 0.01 1.02 0.00 11.12 0.17 100.25 CG-14CH-105_area2_pt10c.1 67.61 20.11 0.01 0.80 0.00 11.10 0.12 99.76 CG-14CH-105_area2_pt10c.2 67.37 20.49 0.00 0.94 0.04 10.32 0.11 99.28 CG-14CH-105_area2_pt10c.3 66.99 20.22 0.02 0.85 0.06 10.94 0.12 99.19 CG-14CH-105_area3_pt11.1 72.72 16.88 0.01 0.46 0.05 9.01 0.08 99.22 CG-14CH-105_area3_pt11.2 67.22 20.36 0.00 1.23 0.00 10.85 0.12 99.78 CG-14CH-105_area3_pt11.3 67.49 20.39 0.00 1.10 0.01 10.85 0.10 99.94 CG-14CH-105_area3_pt12.1 66.69 20.74 0.00 1.30 0.05 10.36 0.14 99.29 CG-14CH-105_area3_pt12.2 66.69 20.99 0.01 1.48 0.06 10.66 0.13 100.02 CG-14CH-105_area3_pt12.3 66.89 20.70 0.02 1.38 0.02 10.57 0.10 99.68
CG-14CH-112_area1_pt1.1 67.97 20.29 0.09 0.08 0.05 11.01 0.60 100.09 CG-14CH-112_area1_pt1.2 68.82 19.65 0.01 0.18 0.03 11.63 0.09 100.41 CG-14CH-112_area1_pt1.3 68.12 19.68 0.00 0.18 0.02 11.29 0.08 99.36 CG-14CH-112_area1_pt2.1 68.98 19.49 0.00 0.09 0.03 11.60 0.08 100.27 CG-14CH-112_area1_pt2.2 68.52 19.78 0.00 0.09 0.04 11.50 0.11 100.03 CG-14CH-112_area1_pt2.3 68.91 19.71 0.00 0.14 0.01 11.48 0.11 100.36
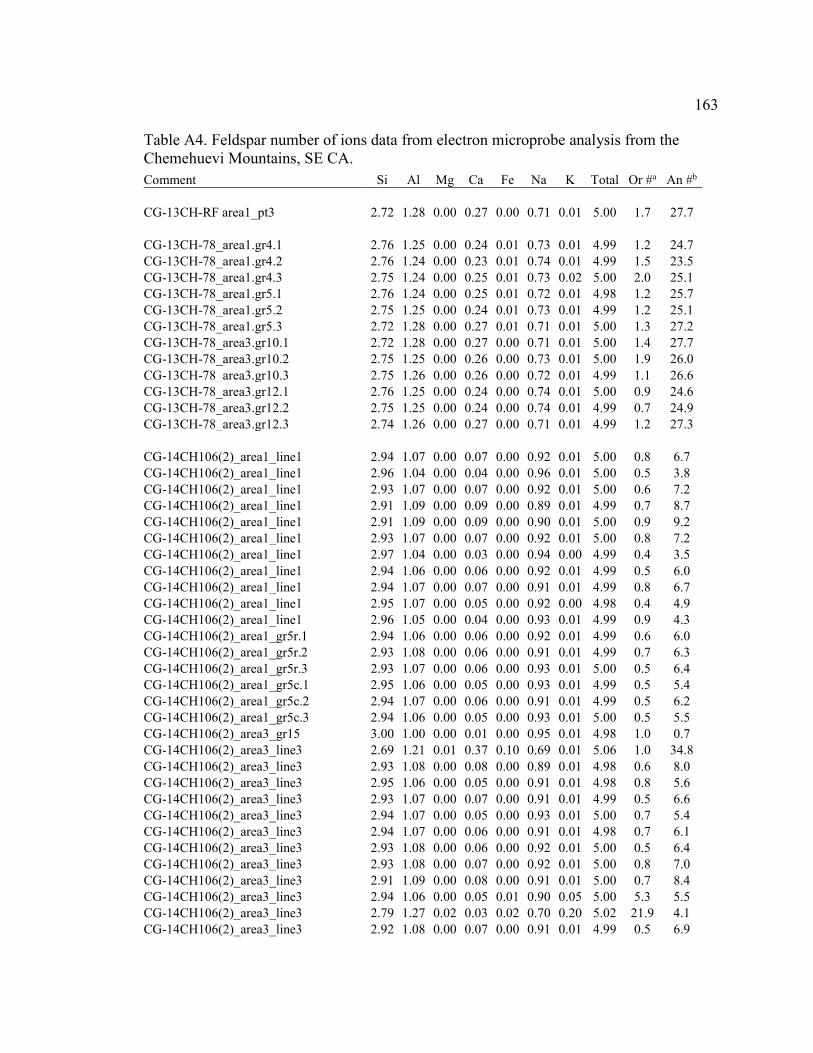
163
Table A4. Feldspar number of ions data from electron microprobe analysis from the Chemehuevi Mountains, SE CA. Comment Si Al Mg Ca Fe Na K Total Or #a An #b
CG-13CH-RF area1_pt3 2.72 1.28 0.00 0.27 0.00 0.71 0.01 5.00 1.7 27.7
CG-13CH-78_area1.gr4.1 2.76 1.25 0.00 0.24 0.01 0.73 0.01 4.99 1.2 24.7 CG-13CH-78_area1.gr4.2 2.76 1.24 0.00 0.23 0.01 0.74 0.01 4.99 1.5 23.5 CG-13CH-78_area1.gr4.3 2.75 1.24 0.00 0.25 0.01 0.73 0.02 5.00 2.0 25.1 CG-13CH-78_area1.gr5.1 2.76 1.24 0.00 0.25 0.01 0.72 0.01 4.98 1.2 25.7 CG-13CH-78_area1.gr5.2 2.75 1.25 0.00 0.24 0.01 0.73 0.01 4.99 1.2 25.1 CG-13CH-78_area1.gr5.3 2.72 1.28 0.00 0.27 0.01 0.71 0.01 5.00 1.3 27.2 CG-13CH-78_area3.gr10.1 2.72 1.28 0.00 0.27 0.00 0.71 0.01 5.00 1.4 27.7 CG-13CH-78_area3.gr10.2 2.75 1.25 0.00 0.26 0.00 0.73 0.01 5.00 1.9 26.0 CG-13CH-78_area3.gr10.3 2.75 1.26 0.00 0.26 0.00 0.72 0.01 4.99 1.1 26.6 CG-13CH-78_area3.gr12.1 2.76 1.25 0.00 0.24 0.00 0.74 0.01 5.00 0.9 24.6 CG-13CH-78_area3.gr12.2 2.75 1.25 0.00 0.24 0.00 0.74 0.01 4.99 0.7 24.9 CG-13CH-78_area3.gr12.3 2.74 1.26 0.00 0.27 0.00 0.71 0.01 4.99 1.2 27.3
CG-14CH106(2)_area1_line1 2.94 1.07 0.00 0.07 0.00 0.92 0.01 5.00 0.8 6.7 CG-14CH106(2)_area1_line1 2.96 1.04 0.00 0.04 0.00 0.96 0.01 5.00 0.5 3.8 CG-14CH106(2)_area1_line1 2.93 1.07 0.00 0.07 0.00 0.92 0.01 5.00 0.6 7.2 CG-14CH106(2)_area1_line1 2.91 1.09 0.00 0.09 0.00 0.89 0.01 4.99 0.7 8.7 CG-14CH106(2)_area1_line1 2.91 1.09 0.00 0.09 0.00 0.90 0.01 5.00 0.9 9.2 CG-14CH106(2)_area1_line1 2.93 1.07 0.00 0.07 0.00 0.92 0.01 5.00 0.8 7.2 CG-14CH106(2)_area1_line1 2.97 1.04 0.00 0.03 0.00 0.94 0.00 4.99 0.4 3.5 CG-14CH106(2)_area1_line1 2.94 1.06 0.00 0.06 0.00 0.92 0.01 4.99 0.5 6.0 CG-14CH106(2)_area1_line1 2.94 1.07 0.00 0.07 0.00 0.91 0.01 4.99 0.8 6.7 CG-14CH106(2)_area1_line1 2.95 1.07 0.00 0.05 0.00 0.92 0.00 4.98 0.4 4.9 CG-14CH106(2)_area1_line1 2.96 1.05 0.00 0.04 0.00 0.93 0.01 4.99 0.9 4.3 CG-14CH106(2)_area1_gr5r.1 2.94 1.06 0.00 0.06 0.00 0.92 0.01 4.99 0.6 6.0 CG-14CH106(2)_area1_gr5r.2 2.93 1.08 0.00 0.06 0.00 0.91 0.01 4.99 0.7 6.3 CG-14CH106(2)_area1_gr5r.3 2.93 1.07 0.00 0.06 0.00 0.93 0.01 5.00 0.5 6.4 CG-14CH106(2)_area1_gr5c.1 2.95 1.06 0.00 0.05 0.00 0.93 0.01 4.99 0.5 5.4 CG-14CH106(2)_area1_gr5c.2 2.94 1.07 0.00 0.06 0.00 0.91 0.01 4.99 0.5 6.2 CG-14CH106(2)_area1_gr5c.3 2.94 1.06 0.00 0.05 0.00 0.93 0.01 5.00 0.5 5.5 CG-14CH106(2)_area3_gr15 3.00 1.00 0.00 0.01 0.00 0.95 0.01 4.98 1.0 0.7 CG-14CH106(2)_area3_line3 2.69 1.21 0.01 0.37 0.10 0.69 0.01 5.06 1.0 34.8 CG-14CH106(2)_area3_line3 2.93 1.08 0.00 0.08 0.00 0.89 0.01 4.98 0.6 8.0 CG-14CH106(2)_area3_line3 2.95 1.06 0.00 0.05 0.00 0.91 0.01 4.98 0.8 5.6 CG-14CH106(2)_area3_line3 2.93 1.07 0.00 0.07 0.00 0.91 0.01 4.99 0.5 6.6 CG-14CH106(2)_area3_line3 2.94 1.07 0.00 0.05 0.00 0.93 0.01 5.00 0.7 5.4 CG-14CH106(2)_area3_line3 2.94 1.07 0.00 0.06 0.00 0.91 0.01 4.98 0.7 6.1 CG-14CH106(2)_area3_line3 2.93 1.08 0.00 0.06 0.00 0.92 0.01 5.00 0.5 6.4 CG-14CH106(2)_area3_line3 2.93 1.08 0.00 0.07 0.00 0.92 0.01 5.00 0.8 7.0 CG-14CH106(2)_area3_line3 2.91 1.09 0.00 0.08 0.00 0.91 0.01 5.00 0.7 8.4 CG-14CH106(2)_area3_line3 2.94 1.06 0.00 0.05 0.01 0.90 0.05 5.00 5.3 5.5 CG-14CH106(2)_area3_line3 2.79 1.27 0.02 0.03 0.02 0.70 0.20 5.02 21.9 4.1 CG-14CH106(2)_area3_line3 2.92 1.08 0.00 0.07 0.00 0.91 0.01 4.99 0.5 6.9
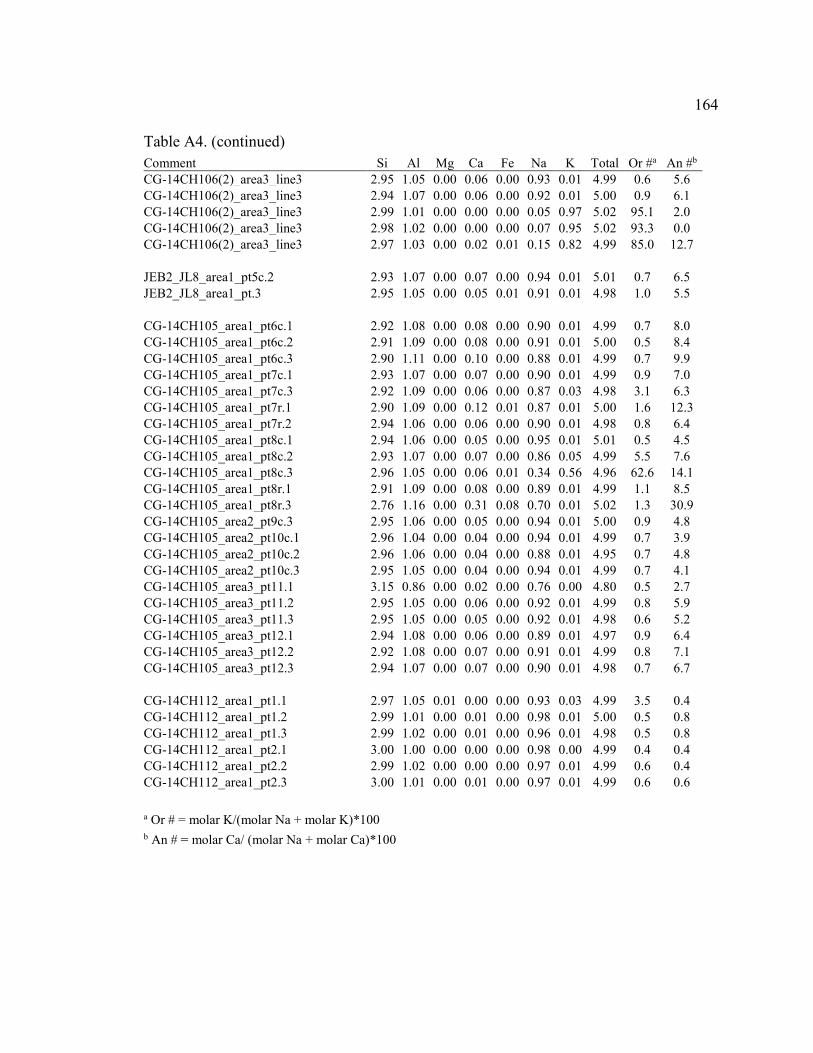
164
Table A4. (continued) Comment Si Al Mg Ca Fe Na K Total Or #a An #b
CG-14CH106(2)_area3_line3 2.95 1.05 0.00 0.06 0.00 0.93 0.01 4.99 0.6 5.6 CG-14CH106(2)_area3_line3 2.94 1.07 0.00 0.06 0.00 0.92 0.01 5.00 0.9 6.1 CG-14CH106(2)_area3_line3 2.99 1.01 0.00 0.00 0.00 0.05 0.97 5.02 95.1 2.0 CG-14CH106(2)_area3_line3 2.98 1.02 0.00 0.00 0.00 0.07 0.95 5.02 93.3 0.0 CG-14CH106(2)_area3_line3 2.97 1.03 0.00 0.02 0.01 0.15 0.82 4.99 85.0 12.7
JEB2_JL8_area1_pt5c.2 2.93 1.07 0.00 0.07 0.00 0.94 0.01 5.01 0.7 6.5 JEB2_JL8_area1_pt.3 2.95 1.05 0.00 0.05 0.01 0.91 0.01 4.98 1.0 5.5
CG-14CH105_area1_pt6c.1 2.92 1.08 0.00 0.08 0.00 0.90 0.01 4.99 0.7 8.0 CG-14CH105_area1_pt6c.2 2.91 1.09 0.00 0.08 0.00 0.91 0.01 5.00 0.5 8.4 CG-14CH105_area1_pt6c.3 2.90 1.11 0.00 0.10 0.00 0.88 0.01 4.99 0.7 9.9 CG-14CH105_area1_pt7c.1 2.93 1.07 0.00 0.07 0.00 0.90 0.01 4.99 0.9 7.0 CG-14CH105_area1_pt7c.3 2.92 1.09 0.00 0.06 0.00 0.87 0.03 4.98 3.1 6.3 CG-14CH105_area1_pt7r.1 2.90 1.09 0.00 0.12 0.01 0.87 0.01 5.00 1.6 12.3 CG-14CH105_area1_pt7r.2 2.94 1.06 0.00 0.06 0.00 0.90 0.01 4.98 0.8 6.4 CG-14CH105_area1_pt8c.1 2.94 1.06 0.00 0.05 0.00 0.95 0.01 5.01 0.5 4.5 CG-14CH105_area1_pt8c.2 2.93 1.07 0.00 0.07 0.00 0.86 0.05 4.99 5.5 7.6 CG-14CH105_area1_pt8c.3 2.96 1.05 0.00 0.06 0.01 0.34 0.56 4.96 62.6 14.1 CG-14CH105_area1_pt8r.1 2.91 1.09 0.00 0.08 0.00 0.89 0.01 4.99 1.1 8.5 CG-14CH105_area1_pt8r.3 2.76 1.16 0.00 0.31 0.08 0.70 0.01 5.02 1.3 30.9 CG-14CH105_area2_pt9c.3 2.95 1.06 0.00 0.05 0.00 0.94 0.01 5.00 0.9 4.8 CG-14CH105_area2_pt10c.1 2.96 1.04 0.00 0.04 0.00 0.94 0.01 4.99 0.7 3.9 CG-14CH105_area2_pt10c.2 2.96 1.06 0.00 0.04 0.00 0.88 0.01 4.95 0.7 4.8 CG-14CH105_area2_pt10c.3 2.95 1.05 0.00 0.04 0.00 0.94 0.01 4.99 0.7 4.1 CG-14CH105_area3_pt11.1 3.15 0.86 0.00 0.02 0.00 0.76 0.00 4.80 0.5 2.7 CG-14CH105_area3_pt11.2 2.95 1.05 0.00 0.06 0.00 0.92 0.01 4.99 0.8 5.9 CG-14CH105_area3_pt11.3 2.95 1.05 0.00 0.05 0.00 0.92 0.01 4.98 0.6 5.2 CG-14CH105_area3_pt12.1 2.94 1.08 0.00 0.06 0.00 0.89 0.01 4.97 0.9 6.4 CG-14CH105_area3_pt12.2 2.92 1.08 0.00 0.07 0.00 0.91 0.01 4.99 0.8 7.1 CG-14CH105_area3_pt12.3 2.94 1.07 0.00 0.07 0.00 0.90 0.01 4.98 0.7 6.7
CG-14CH112_area1_pt1.1 2.97 1.05 0.01 0.00 0.00 0.93 0.03 4.99 3.5 0.4 CG-14CH112_area1_pt1.2 2.99 1.01 0.00 0.01 0.00 0.98 0.01 5.00 0.5 0.8 CG-14CH112_area1_pt1.3 2.99 1.02 0.00 0.01 0.00 0.96 0.01 4.98 0.5 0.8 CG-14CH112_area1_pt2.1 3.00 1.00 0.00 0.00 0.00 0.98 0.00 4.99 0.4 0.4 CG-14CH112_area1_pt2.2 2.99 1.02 0.00 0.00 0.00 0.97 0.01 4.99 0.6 0.4 CG-14CH112_area1_pt2.3 3.00 1.01 0.00 0.01 0.00 0.97 0.01 4.99 0.6 0.6
a Or # = molar K/(molar Na + molar K)*100 b An # = molar Ca/ (molar Na + molar Ca)*100
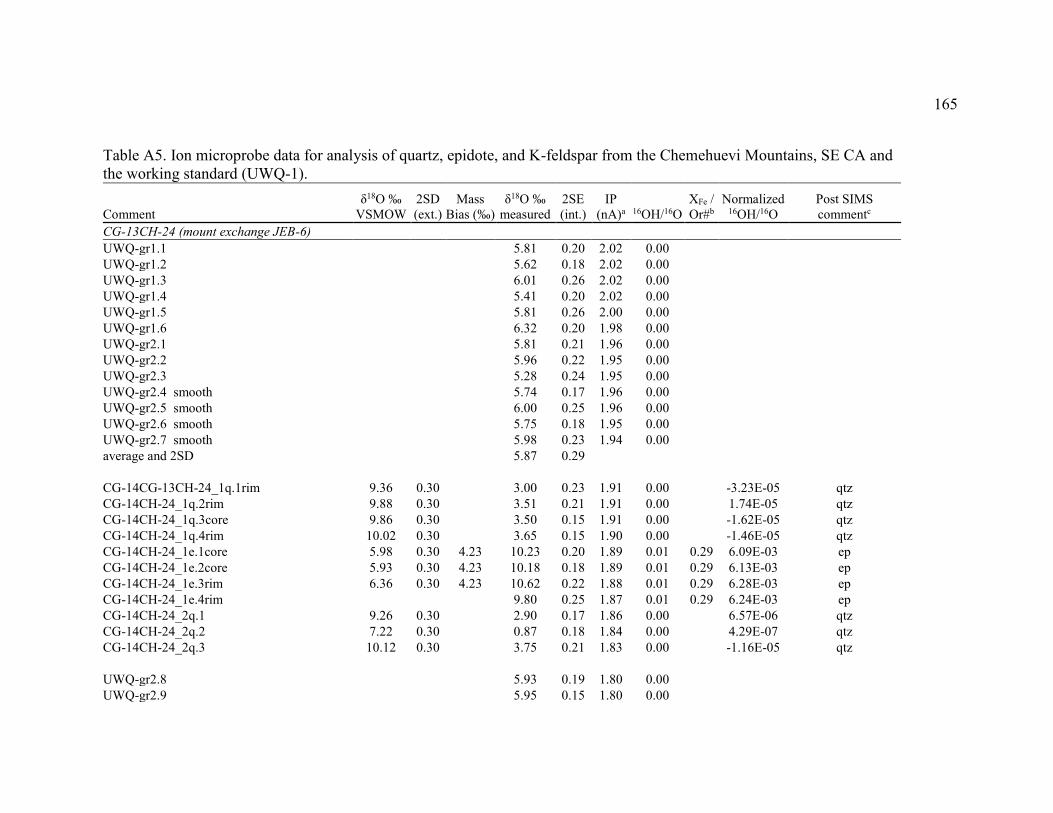
165
Table A5. Ion microprobe data for analysis of quartz, epidote, and K-feldspar from the Chemehuevi Mountains, SE CA and the working standard (UWQ-1).
Comment δ18O ‰
VSMOW 2SD (ext.)
Mass Bias (‰)
δ18O ‰ measured
2SE (int.)
IP (nA)a 16OH/16O
XFe / Or#b
Normalized 16OH/16O
Post SIMS commentc
CG-13CH-24 (mount exchange JEB-6) UWQ-gr1.1
5.81 0.20 2.02 0.00
UWQ-gr1.2
5.62 0.18 2.02 0.00 UWQ-gr1.3
6.01 0.26 2.02 0.00
UWQ-gr1.4
5.41 0.20 2.02 0.00 UWQ-gr1.5
5.81 0.26 2.00 0.00
UWQ-gr1.6
6.32 0.20 1.98 0.00 UWQ-gr2.1
5.81 0.21 1.96 0.00
UWQ-gr2.2
5.96 0.22 1.95 0.00 UWQ-gr2.3
5.28 0.24 1.95 0.00
UWQ-gr2.4 smooth
5.74 0.17 1.96 0.00 UWQ-gr2.5 smooth
6.00 0.25 1.96 0.00
UWQ-gr2.6 smooth
5.75 0.18 1.95 0.00 UWQ-gr2.7 smooth
5.98 0.23 1.94 0.00
average and 2SD
5.87 0.29
CG-14CG-13CH-24_1q.1rim 9.36 0.30
3.00 0.23 1.91 0.00
-3.23E-05 qtz CG-14CH-24_1q.2rim 9.88 0.30
3.51 0.21 1.91 0.00
1.74E-05 qtz
CG-14CH-24_1q.3core 9.86 0.30
3.50 0.15 1.91 0.00
-1.62E-05 qtz CG-14CH-24_1q.4rim 10.02 0.30
3.65 0.15 1.90 0.00
-1.46E-05 qtz
CG-14CH-24_1e.1core 5.98 0.30 4.23 10.23 0.20 1.89 0.01 0.29 6.09E-03 ep CG-14CH-24_1e.2core 5.93 0.30 4.23 10.18 0.18 1.89 0.01 0.29 6.13E-03 ep CG-14CH-24_1e.3rim 6.36 0.30 4.23 10.62 0.22 1.88 0.01 0.29 6.28E-03 ep CG-14CH-24_1e.4rim
9.80 0.25 1.87 0.01 0.29 6.24E-03 ep
CG-14CH-24_2q.1 9.26 0.30
2.90 0.17 1.86 0.00
6.57E-06 qtz CG-14CH-24_2q.2 7.22 0.30
0.87 0.18 1.84 0.00
4.29E-07 qtz
CG-14CH-24_2q.3 10.12 0.30
3.75 0.21 1.83 0.00
-1.16E-05 qtz
UWQ-gr2.8
5.93 0.19 1.80 0.00 UWQ-gr2.9
5.95 0.15 1.80 0.00
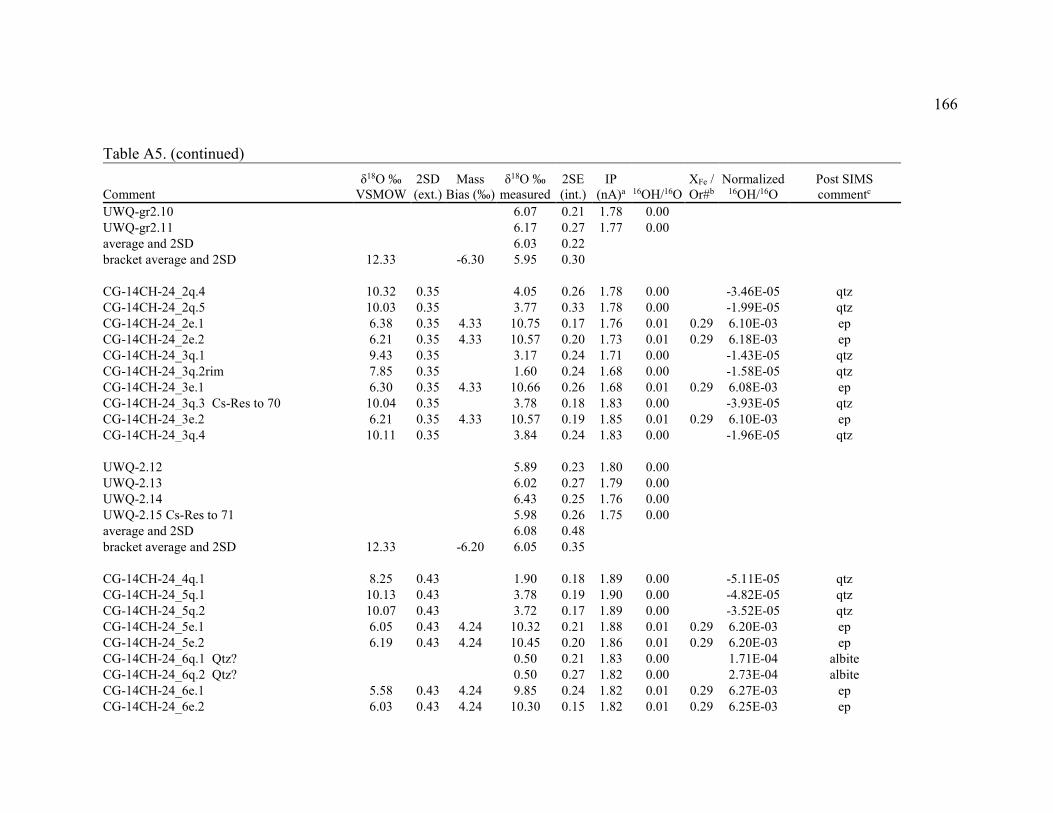
166
Table A5. (continued)
Comment δ18O ‰
VSMOW 2SD (ext.)
Mass Bias (‰)
δ18O ‰ measured
2SE (int.)
IP (nA)a 16OH/16O
XFe / Or#b
Normalized 16OH/16O
Post SIMS commentc
UWQ-gr2.10
6.07 0.21 1.78 0.00 UWQ-gr2.11
6.17 0.27 1.77 0.00
average and 2SD
6.03 0.22 bracket average and 2SD 12.33
-6.30 5.95 0.30
CG-14CH-24_2q.4 10.32 0.35
4.05 0.26 1.78 0.00
-3.46E-05 qtz
CG-14CH-24_2q.5 10.03 0.35
3.77 0.33 1.78 0.00
-1.99E-05 qtz CG-14CH-24_2e.1 6.38 0.35 4.33 10.75 0.17 1.76 0.01 0.29 6.10E-03 ep CG-14CH-24_2e.2 6.21 0.35 4.33 10.57 0.20 1.73 0.01 0.29 6.18E-03 ep CG-14CH-24_3q.1 9.43 0.35
3.17 0.24 1.71 0.00
-1.43E-05 qtz
CG-14CH-24_3q.2rim 7.85 0.35
1.60 0.24 1.68 0.00
-1.58E-05 qtz CG-14CH-24_3e.1 6.30 0.35 4.33 10.66 0.26 1.68 0.01 0.29 6.08E-03 ep CG-14CH-24_3q.3 Cs-Res to 70 10.04 0.35
3.78 0.18 1.83 0.00
-3.93E-05 qtz
CG-14CH-24_3e.2 6.21 0.35 4.33 10.57 0.19 1.85 0.01 0.29 6.10E-03 ep CG-14CH-24_3q.4 10.11 0.35
3.84 0.24 1.83 0.00
-1.96E-05 qtz
UWQ-2.12
5.89 0.23 1.80 0.00 UWQ-2.13
6.02 0.27 1.79 0.00
UWQ-2.14
6.43 0.25 1.76 0.00 UWQ-2.15 Cs-Res to 71
5.98 0.26 1.75 0.00
average and 2SD
6.08 0.48 bracket average and 2SD 12.33
-6.20 6.05 0.35
CG-14CH-24_4q.1 8.25 0.43
1.90 0.18 1.89 0.00
-5.11E-05 qtz
CG-14CH-24_5q.1 10.13 0.43
3.78 0.19 1.90 0.00
-4.82E-05 qtz CG-14CH-24_5q.2 10.07 0.43
3.72 0.17 1.89 0.00
-3.52E-05 qtz
CG-14CH-24_5e.1 6.05 0.43 4.24 10.32 0.21 1.88 0.01 0.29 6.20E-03 ep CG-14CH-24_5e.2 6.19 0.43 4.24 10.45 0.20 1.86 0.01 0.29 6.20E-03 ep CG-14CH-24_6q.1 Qtz?
0.50 0.21 1.83 0.00
1.71E-04 albite
CG-14CH-24_6q.2 Qtz?
0.50 0.27 1.82 0.00
2.73E-04 albite CG-14CH-24_6e.1 5.58 0.43 4.24 9.85 0.24 1.82 0.01 0.29 6.27E-03 ep CG-14CH-24_6e.2 6.03 0.43 4.24 10.30 0.15 1.82 0.01 0.29 6.25E-03 ep
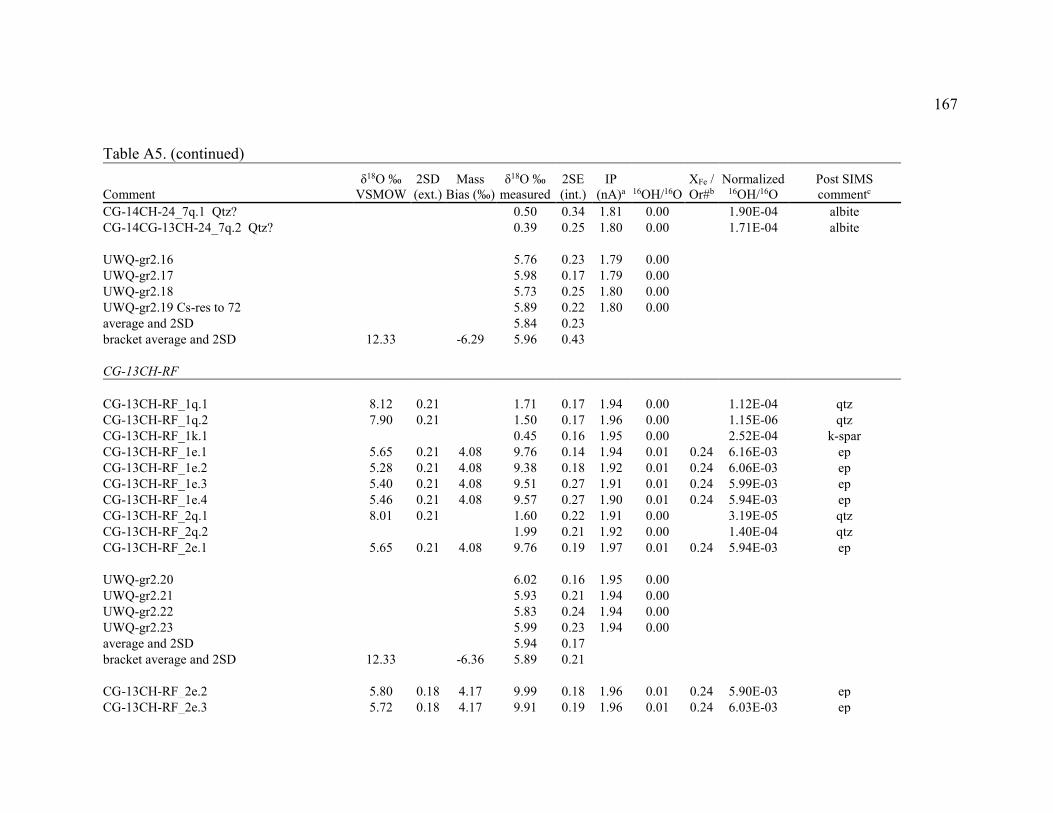
167
Table A5. (continued)
Comment δ18O ‰
VSMOW 2SD (ext.)
Mass Bias (‰)
δ18O ‰ measured
2SE (int.)
IP (nA)a 16OH/16O
XFe / Or#b
Normalized 16OH/16O
Post SIMS commentc
CG-14CH-24_7q.1 Qtz?
0.50 0.34 1.81 0.00
1.90E-04 albite CG-14CG-13CH-24_7q.2 Qtz?
0.39 0.25 1.80 0.00
1.71E-04 albite
UWQ-gr2.16
5.76 0.23 1.79 0.00 UWQ-gr2.17
5.98 0.17 1.79 0.00
UWQ-gr2.18
5.73 0.25 1.80 0.00 UWQ-gr2.19 Cs-res to 72
5.89 0.22 1.80 0.00
average and 2SD
5.84 0.23 bracket average and 2SD 12.33
-6.29 5.96 0.43
CG-13CH-RF
CG-13CH-RF_1q.1 8.12 0.21
1.71 0.17 1.94 0.00
1.12E-04 qtz CG-13CH-RF_1q.2 7.90 0.21
1.50 0.17 1.96 0.00
1.15E-06 qtz
CG-13CH-RF_1k.1
0.45 0.16 1.95 0.00
2.52E-04 k-spar CG-13CH-RF_1e.1 5.65 0.21 4.08 9.76 0.14 1.94 0.01 0.24 6.16E-03 ep CG-13CH-RF_1e.2 5.28 0.21 4.08 9.38 0.18 1.92 0.01 0.24 6.06E-03 ep CG-13CH-RF_1e.3 5.40 0.21 4.08 9.51 0.27 1.91 0.01 0.24 5.99E-03 ep CG-13CH-RF_1e.4 5.46 0.21 4.08 9.57 0.27 1.90 0.01 0.24 5.94E-03 ep CG-13CH-RF_2q.1 8.01 0.21
1.60 0.22 1.91 0.00
3.19E-05 qtz
CG-13CH-RF_2q.2
1.99 0.21 1.92 0.00
1.40E-04 qtz CG-13CH-RF_2e.1 5.65 0.21 4.08 9.76 0.19 1.97 0.01 0.24 5.94E-03 ep
UWQ-gr2.20
6.02 0.16 1.95 0.00 UWQ-gr2.21
5.93 0.21 1.94 0.00
UWQ-gr2.22
5.83 0.24 1.94 0.00 UWQ-gr2.23
5.99 0.23 1.94 0.00
average and 2SD
5.94 0.17 bracket average and 2SD 12.33
-6.36 5.89 0.21
CG-13CH-RF_2e.2 5.80 0.18 4.17 9.99 0.18 1.96 0.01 0.24 5.90E-03 ep CG-13CH-RF_2e.3 5.72 0.18 4.17 9.91 0.19 1.96 0.01 0.24 6.03E-03 ep
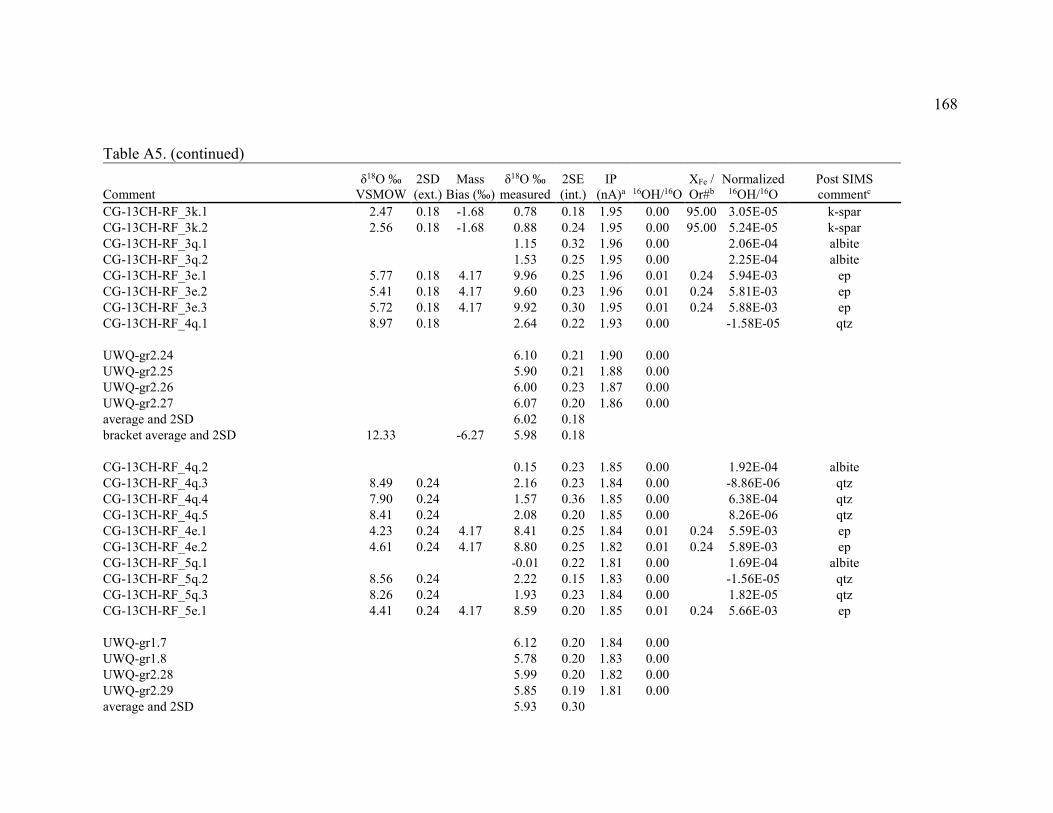
168
Table A5. (continued)
Comment δ18O ‰
VSMOW 2SD (ext.)
Mass Bias (‰)
δ18O ‰ measured
2SE (int.)
IP (nA)a 16OH/16O
XFe / Or#b
Normalized 16OH/16O
Post SIMS commentc
CG-13CH-RF_3k.1 2.47 0.18 -1.68 0.78 0.18 1.95 0.00 95.00 3.05E-05 k-spar CG-13CH-RF_3k.2 2.56 0.18 -1.68 0.88 0.24 1.95 0.00 95.00 5.24E-05 k-spar CG-13CH-RF_3q.1
1.15 0.32 1.96 0.00
2.06E-04 albite
CG-13CH-RF_3q.2
1.53 0.25 1.95 0.00
2.25E-04 albite CG-13CH-RF_3e.1 5.77 0.18 4.17 9.96 0.25 1.96 0.01 0.24 5.94E-03 ep CG-13CH-RF_3e.2 5.41 0.18 4.17 9.60 0.23 1.96 0.01 0.24 5.81E-03 ep CG-13CH-RF_3e.3 5.72 0.18 4.17 9.92 0.30 1.95 0.01 0.24 5.88E-03 ep CG-13CH-RF_4q.1 8.97 0.18
2.64 0.22 1.93 0.00
-1.58E-05 qtz
UWQ-gr2.24
6.10 0.21 1.90 0.00 UWQ-gr2.25
5.90 0.21 1.88 0.00
UWQ-gr2.26
6.00 0.23 1.87 0.00 UWQ-gr2.27
6.07 0.20 1.86 0.00
average and 2SD
6.02 0.18 bracket average and 2SD 12.33
-6.27 5.98 0.18
CG-13CH-RF_4q.2
0.15 0.23 1.85 0.00
1.92E-04 albite
CG-13CH-RF_4q.3 8.49 0.24
2.16 0.23 1.84 0.00
-8.86E-06 qtz CG-13CH-RF_4q.4 7.90 0.24
1.57 0.36 1.85 0.00
6.38E-04 qtz
CG-13CH-RF_4q.5 8.41 0.24
2.08 0.20 1.85 0.00
8.26E-06 qtz CG-13CH-RF_4e.1 4.23 0.24 4.17 8.41 0.25 1.84 0.01 0.24 5.59E-03 ep CG-13CH-RF_4e.2 4.61 0.24 4.17 8.80 0.25 1.82 0.01 0.24 5.89E-03 ep CG-13CH-RF_5q.1
-0.01 0.22 1.81 0.00
1.69E-04 albite
CG-13CH-RF_5q.2 8.56 0.24
2.22 0.15 1.83 0.00
-1.56E-05 qtz CG-13CH-RF_5q.3 8.26 0.24
1.93 0.23 1.84 0.00
1.82E-05 qtz
CG-13CH-RF_5e.1 4.41 0.24 4.17 8.59 0.20 1.85 0.01 0.24 5.66E-03 ep
UWQ-gr1.7
6.12 0.20 1.84 0.00 UWQ-gr1.8
5.78 0.20 1.83 0.00
UWQ-gr2.28
5.99 0.20 1.82 0.00 UWQ-gr2.29
5.85 0.19 1.81 0.00
average and 2SD
5.93 0.30
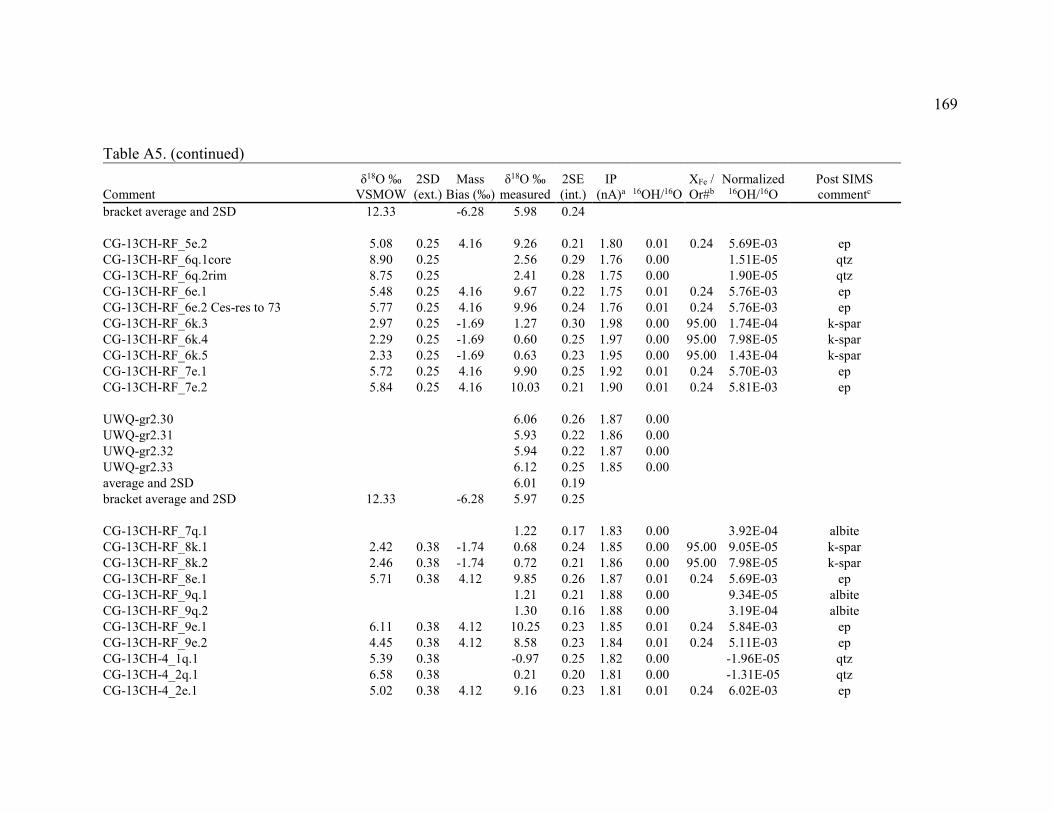
169
Table A5. (continued)
Comment δ18O ‰
VSMOW 2SD (ext.)
Mass Bias (‰)
δ18O ‰ measured
2SE (int.)
IP (nA)a 16OH/16O
XFe / Or#b
Normalized 16OH/16O
Post SIMS commentc
bracket average and 2SD 12.33
-6.28 5.98 0.24
CG-13CH-RF_5e.2 5.08 0.25 4.16 9.26 0.21 1.80 0.01 0.24 5.69E-03 ep CG-13CH-RF_6q.1core 8.90 0.25
2.56 0.29 1.76 0.00
1.51E-05 qtz
CG-13CH-RF_6q.2rim 8.75 0.25
2.41 0.28 1.75 0.00
1.90E-05 qtz CG-13CH-RF_6e.1 5.48 0.25 4.16 9.67 0.22 1.75 0.01 0.24 5.76E-03 ep CG-13CH-RF_6e.2 Ces-res to 73 5.77 0.25 4.16 9.96 0.24 1.76 0.01 0.24 5.76E-03 ep CG-13CH-RF_6k.3 2.97 0.25 -1.69 1.27 0.30 1.98 0.00 95.00 1.74E-04 k-spar CG-13CH-RF_6k.4 2.29 0.25 -1.69 0.60 0.25 1.97 0.00 95.00 7.98E-05 k-spar CG-13CH-RF_6k.5 2.33 0.25 -1.69 0.63 0.23 1.95 0.00 95.00 1.43E-04 k-spar CG-13CH-RF_7e.1 5.72 0.25 4.16 9.90 0.25 1.92 0.01 0.24 5.70E-03 ep CG-13CH-RF_7e.2 5.84 0.25 4.16 10.03 0.21 1.90 0.01 0.24 5.81E-03 ep
UWQ-gr2.30
6.06 0.26 1.87 0.00 UWQ-gr2.31
5.93 0.22 1.86 0.00
UWQ-gr2.32
5.94 0.22 1.87 0.00 UWQ-gr2.33
6.12 0.25 1.85 0.00
average and 2SD
6.01 0.19 bracket average and 2SD 12.33
-6.28 5.97 0.25
CG-13CH-RF_7q.1
1.22 0.17 1.83 0.00
3.92E-04 albite
CG-13CH-RF_8k.1 2.42 0.38 -1.74 0.68 0.24 1.85 0.00 95.00 9.05E-05 k-spar CG-13CH-RF_8k.2 2.46 0.38 -1.74 0.72 0.21 1.86 0.00 95.00 7.98E-05 k-spar CG-13CH-RF_8e.1 5.71 0.38 4.12 9.85 0.26 1.87 0.01 0.24 5.69E-03 ep CG-13CH-RF_9q.1
1.21 0.21 1.88 0.00
9.34E-05 albite
CG-13CH-RF_9q.2
1.30 0.16 1.88 0.00
3.19E-04 albite CG-13CH-RF_9e.1 6.11 0.38 4.12 10.25 0.23 1.85 0.01 0.24 5.84E-03 ep CG-13CH-RF_9e.2 4.45 0.38 4.12 8.58 0.23 1.84 0.01 0.24 5.11E-03 ep CG-13CH-4_1q.1 5.39 0.38
-0.97 0.25 1.82 0.00
-1.96E-05 qtz
CG-13CH-4_2q.1 6.58 0.38
0.21 0.20 1.81 0.00
-1.31E-05 qtz CG-13CH-4_2e.1 5.02 0.38 4.12 9.16 0.23 1.81 0.01 0.24 6.02E-03 ep
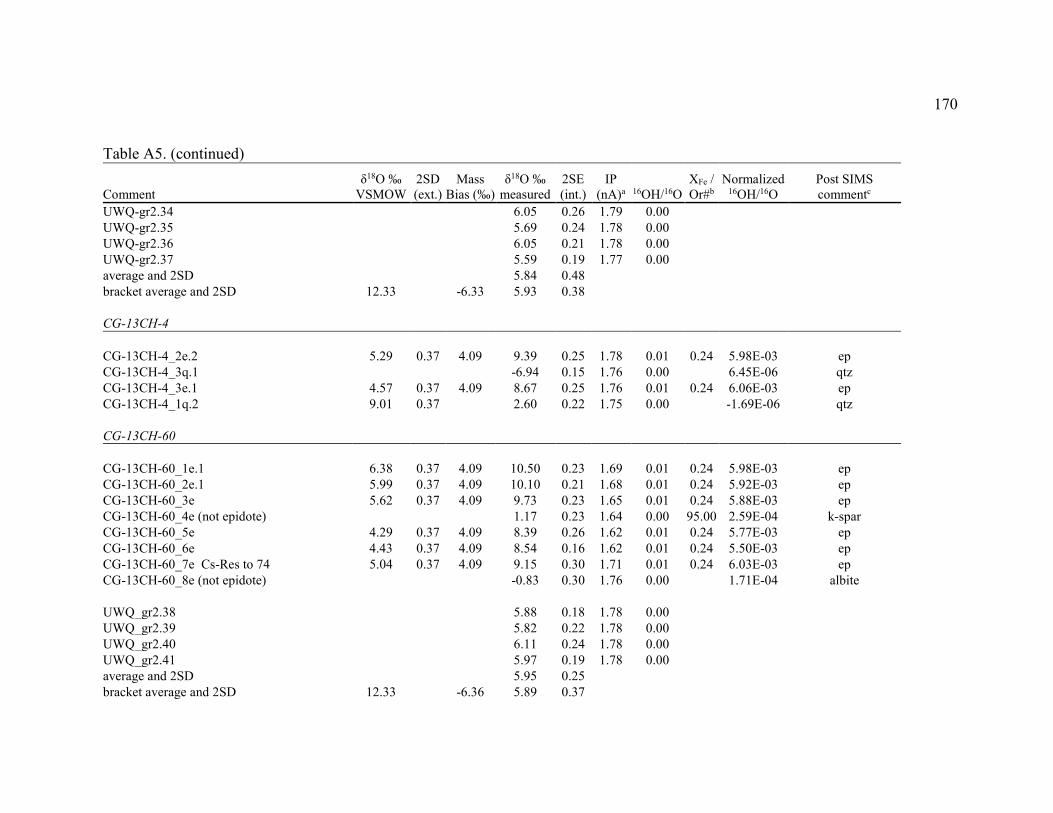
170
Table A5. (continued)
Comment δ18O ‰
VSMOW 2SD (ext.)
Mass Bias (‰)
δ18O ‰ measured
2SE (int.)
IP (nA)a 16OH/16O
XFe / Or#b
Normalized 16OH/16O
Post SIMS commentc
UWQ-gr2.34
6.05 0.26 1.79 0.00 UWQ-gr2.35
5.69 0.24 1.78 0.00
UWQ-gr2.36
6.05 0.21 1.78 0.00 UWQ-gr2.37
5.59 0.19 1.77 0.00
average and 2SD
5.84 0.48 bracket average and 2SD 12.33
-6.33 5.93 0.38
CG-13CH-4
CG-13CH-4_2e.2 5.29 0.37 4.09 9.39 0.25 1.78 0.01 0.24 5.98E-03 ep CG-13CH-4_3q.1
-6.94 0.15 1.76 0.00
6.45E-06 qtz
CG-13CH-4_3e.1 4.57 0.37 4.09 8.67 0.25 1.76 0.01 0.24 6.06E-03 ep CG-13CH-4_1q.2 9.01 0.37
2.60 0.22 1.75 0.00
-1.69E-06 qtz
CG-13CH-60
CG-13CH-60_1e.1 6.38 0.37 4.09 10.50 0.23 1.69 0.01 0.24 5.98E-03 ep CG-13CH-60_2e.1 5.99 0.37 4.09 10.10 0.21 1.68 0.01 0.24 5.92E-03 ep CG-13CH-60_3e 5.62 0.37 4.09 9.73 0.23 1.65 0.01 0.24 5.88E-03 ep CG-13CH-60_4e (not epidote)
1.17 0.23 1.64 0.00 95.00 2.59E-04 k-spar
CG-13CH-60_5e 4.29 0.37 4.09 8.39 0.26 1.62 0.01 0.24 5.77E-03 ep CG-13CH-60_6e 4.43 0.37 4.09 8.54 0.16 1.62 0.01 0.24 5.50E-03 ep CG-13CH-60_7e Cs-Res to 74 5.04 0.37 4.09 9.15 0.30 1.71 0.01 0.24 6.03E-03 ep CG-13CH-60_8e (not epidote)
-0.83 0.30 1.76 0.00
1.71E-04 albite
UWQ_gr2.38
5.88 0.18 1.78 0.00 UWQ_gr2.39
5.82 0.22 1.78 0.00
UWQ_gr2.40
6.11 0.24 1.78 0.00 UWQ_gr2.41
5.97 0.19 1.78 0.00
average and 2SD
5.95 0.25 bracket average and 2SD 12.33
-6.36 5.89 0.37
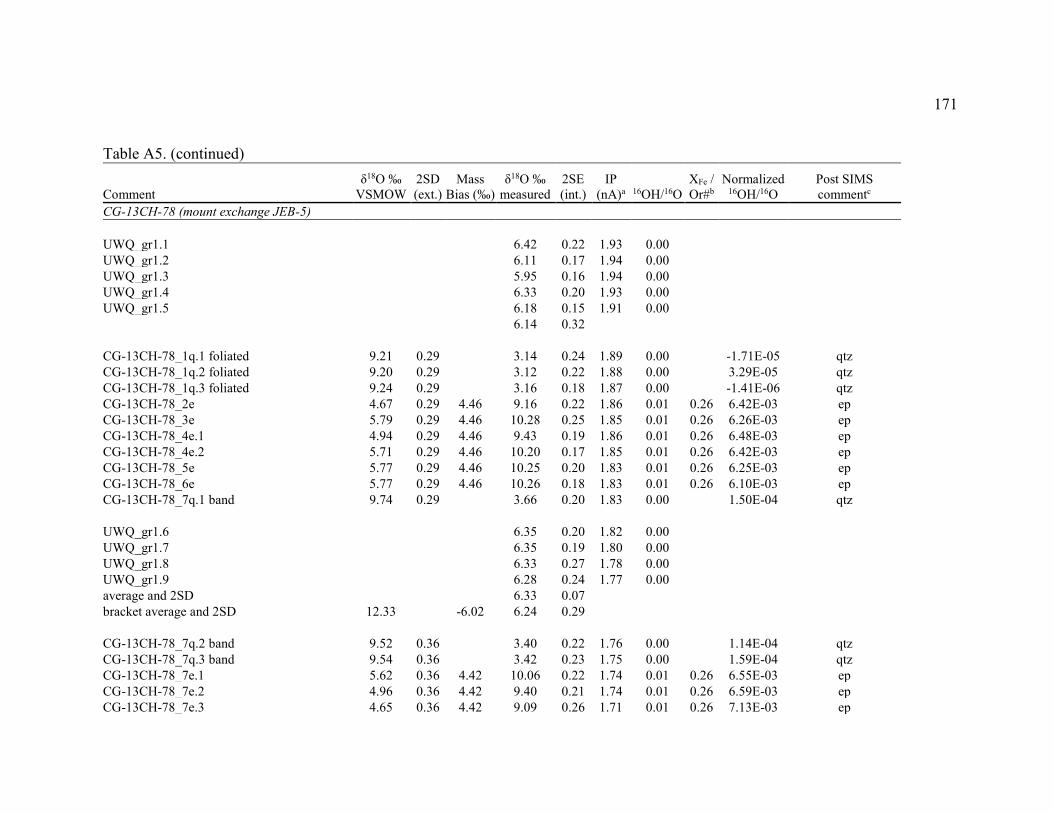
171
Table A5. (continued)
Comment δ18O ‰
VSMOW 2SD (ext.)
Mass Bias (‰)
δ18O ‰ measured
2SE (int.)
IP (nA)a 16OH/16O
XFe / Or#b
Normalized 16OH/16O
Post SIMS commentc
CG-13CH-78 (mount exchange JEB-5)
UWQ_gr1.1
6.42 0.22 1.93 0.00 UWQ_gr1.2
6.11 0.17 1.94 0.00
UWQ_gr1.3
5.95 0.16 1.94 0.00 UWQ_gr1.4
6.33 0.20 1.93 0.00
UWQ_gr1.5
6.18 0.15 1.91 0.00
6.14 0.32
CG-13CH-78_1q.1 foliated 9.21 0.29
3.14 0.24 1.89 0.00
-1.71E-05 qtz
CG-13CH-78_1q.2 foliated 9.20 0.29
3.12 0.22 1.88 0.00
3.29E-05 qtz CG-13CH-78_1q.3 foliated 9.24 0.29
3.16 0.18 1.87 0.00
-1.41E-06 qtz
CG-13CH-78_2e 4.67 0.29 4.46 9.16 0.22 1.86 0.01 0.26 6.42E-03 ep CG-13CH-78_3e 5.79 0.29 4.46 10.28 0.25 1.85 0.01 0.26 6.26E-03 ep CG-13CH-78_4e.1 4.94 0.29 4.46 9.43 0.19 1.86 0.01 0.26 6.48E-03 ep CG-13CH-78_4e.2 5.71 0.29 4.46 10.20 0.17 1.85 0.01 0.26 6.42E-03 ep CG-13CH-78_5e 5.77 0.29 4.46 10.25 0.20 1.83 0.01 0.26 6.25E-03 ep CG-13CH-78_6e 5.77 0.29 4.46 10.26 0.18 1.83 0.01 0.26 6.10E-03 ep CG-13CH-78_7q.1 band 9.74 0.29
3.66 0.20 1.83 0.00
1.50E-04 qtz
UWQ_gr1.6
6.35 0.20 1.82 0.00 UWQ_gr1.7
6.35 0.19 1.80 0.00
UWQ_gr1.8
6.33 0.27 1.78 0.00 UWQ_gr1.9
6.28 0.24 1.77 0.00
average and 2SD
6.33 0.07 bracket average and 2SD 12.33
-6.02 6.24 0.29
CG-13CH-78_7q.2 band 9.52 0.36
3.40 0.22 1.76 0.00
1.14E-04 qtz
CG-13CH-78_7q.3 band 9.54 0.36
3.42 0.23 1.75 0.00
1.59E-04 qtz CG-13CH-78_7e.1 5.62 0.36 4.42 10.06 0.22 1.74 0.01 0.26 6.55E-03 ep CG-13CH-78_7e.2 4.96 0.36 4.42 9.40 0.21 1.74 0.01 0.26 6.59E-03 ep CG-13CH-78_7e.3 4.65 0.36 4.42 9.09 0.26 1.71 0.01 0.26 7.13E-03 ep
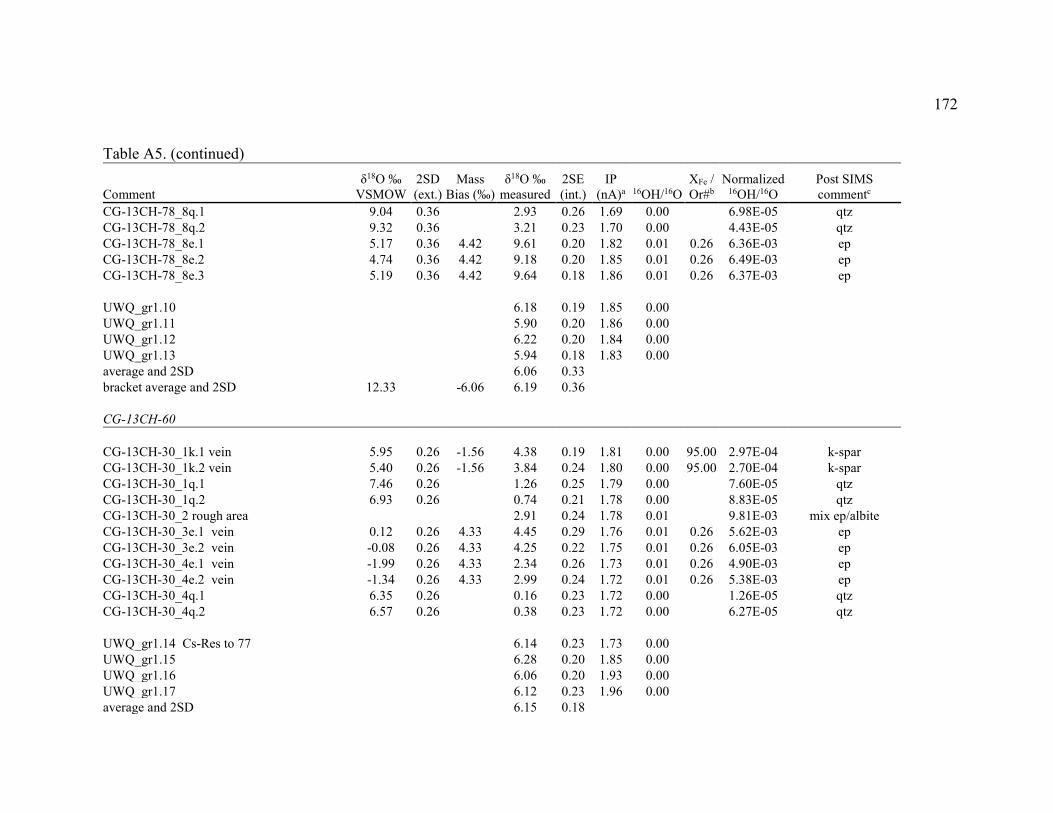
172
Table A5. (continued)
Comment δ18O ‰
VSMOW 2SD (ext.)
Mass Bias (‰)
δ18O ‰ measured
2SE (int.)
IP (nA)a 16OH/16O
XFe / Or#b
Normalized 16OH/16O
Post SIMS commentc
CG-13CH-78_8q.1 9.04 0.36
2.93 0.26 1.69 0.00
6.98E-05 qtz CG-13CH-78_8q.2 9.32 0.36
3.21 0.23 1.70 0.00
4.43E-05 qtz
CG-13CH-78_8e.1 5.17 0.36 4.42 9.61 0.20 1.82 0.01 0.26 6.36E-03 ep CG-13CH-78_8e.2 4.74 0.36 4.42 9.18 0.20 1.85 0.01 0.26 6.49E-03 ep CG-13CH-78_8e.3 5.19 0.36 4.42 9.64 0.18 1.86 0.01 0.26 6.37E-03 ep
UWQ_gr1.10
6.18 0.19 1.85 0.00 UWQ_gr1.11
5.90 0.20 1.86 0.00
UWQ_gr1.12
6.22 0.20 1.84 0.00 UWQ_gr1.13
5.94 0.18 1.83 0.00
average and 2SD
6.06 0.33 bracket average and 2SD 12.33
-6.06 6.19 0.36
CG-13CH-60
CG-13CH-30_1k.1 vein 5.95 0.26 -1.56 4.38 0.19 1.81 0.00 95.00 2.97E-04 k-spar CG-13CH-30_1k.2 vein 5.40 0.26 -1.56 3.84 0.24 1.80 0.00 95.00 2.70E-04 k-spar CG-13CH-30_1q.1 7.46 0.26
1.26 0.25 1.79 0.00
7.60E-05 qtz
CG-13CH-30_1q.2 6.93 0.26
0.74 0.21 1.78 0.00
8.83E-05 qtz CG-13CH-30_2 rough area
2.91 0.24 1.78 0.01
9.81E-03 mix ep/albite
CG-13CH-30_3e.1 vein 0.12 0.26 4.33 4.45 0.29 1.76 0.01 0.26 5.62E-03 ep CG-13CH-30_3e.2 vein -0.08 0.26 4.33 4.25 0.22 1.75 0.01 0.26 6.05E-03 ep CG-13CH-30_4e.1 vein -1.99 0.26 4.33 2.34 0.26 1.73 0.01 0.26 4.90E-03 ep CG-13CH-30_4e.2 vein -1.34 0.26 4.33 2.99 0.24 1.72 0.01 0.26 5.38E-03 ep CG-13CH-30_4q.1 6.35 0.26
0.16 0.23 1.72 0.00
1.26E-05 qtz
CG-13CH-30_4q.2 6.57 0.26
0.38 0.23 1.72 0.00
6.27E-05 qtz
UWQ_gr1.14 Cs-Res to 77
6.14 0.23 1.73 0.00 UWQ_gr1.15
6.28 0.20 1.85 0.00
UWQ_gr1.16
6.06 0.20 1.93 0.00 UWQ_gr1.17
6.12 0.23 1.96 0.00
average and 2SD
6.15 0.18
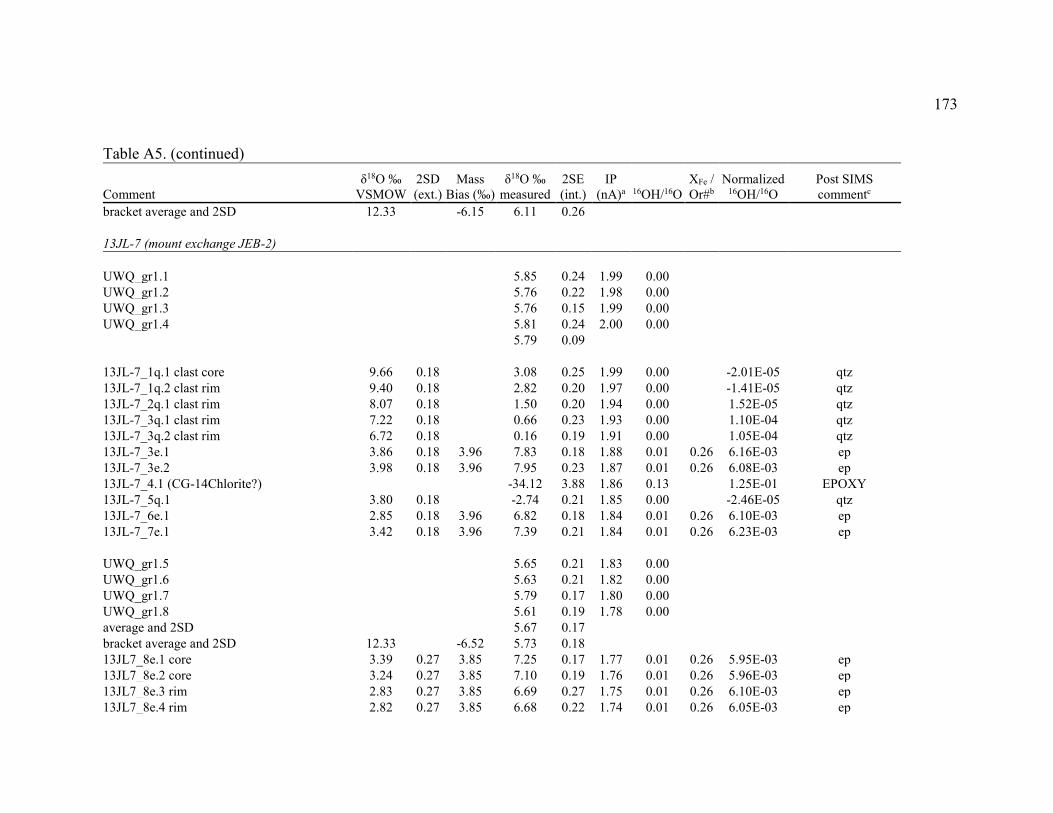
173
Table A5. (continued)
Comment δ18O ‰
VSMOW 2SD (ext.)
Mass Bias (‰)
δ18O ‰ measured
2SE (int.)
IP (nA)a 16OH/16O
XFe / Or#b
Normalized 16OH/16O
Post SIMS commentc
bracket average and 2SD 12.33
-6.15 6.11 0.26
13JL-7 (mount exchange JEB-2)
UWQ_gr1.1
5.85 0.24 1.99 0.00 UWQ_gr1.2
5.76 0.22 1.98 0.00
UWQ_gr1.3
5.76 0.15 1.99 0.00 UWQ_gr1.4
5.81 0.24 2.00 0.00
5.79 0.09
13JL-7_1q.1 clast core 9.66 0.18
3.08 0.25 1.99 0.00
-2.01E-05 qtz 13JL-7_1q.2 clast rim 9.40 0.18
2.82 0.20 1.97 0.00
-1.41E-05 qtz
13JL-7_2q.1 clast rim 8.07 0.18
1.50 0.20 1.94 0.00
1.52E-05 qtz 13JL-7_3q.1 clast rim 7.22 0.18
0.66 0.23 1.93 0.00
1.10E-04 qtz
13JL-7_3q.2 clast rim 6.72 0.18
0.16 0.19 1.91 0.00
1.05E-04 qtz 13JL-7_3e.1 3.86 0.18 3.96 7.83 0.18 1.88 0.01 0.26 6.16E-03 ep 13JL-7_3e.2 3.98 0.18 3.96 7.95 0.23 1.87 0.01 0.26 6.08E-03 ep 13JL-7_4.1 (CG-14Chlorite?)
-34.12 3.88 1.86 0.13
1.25E-01 EPOXY
13JL-7_5q.1 3.80 0.18
-2.74 0.21 1.85 0.00
-2.46E-05 qtz 13JL-7_6e.1 2.85 0.18 3.96 6.82 0.18 1.84 0.01 0.26 6.10E-03 ep 13JL-7_7e.1 3.42 0.18 3.96 7.39 0.21 1.84 0.01 0.26 6.23E-03 ep
UWQ_gr1.5
5.65 0.21 1.83 0.00 UWQ_gr1.6
5.63 0.21 1.82 0.00
UWQ_gr1.7
5.79 0.17 1.80 0.00 UWQ_gr1.8
5.61 0.19 1.78 0.00
average and 2SD
5.67 0.17 bracket average and 2SD 12.33
-6.52 5.73 0.18
13JL7_8e.1 core 3.39 0.27 3.85 7.25 0.17 1.77 0.01 0.26 5.95E-03 ep 13JL7_8e.2 core 3.24 0.27 3.85 7.10 0.19 1.76 0.01 0.26 5.96E-03 ep 13JL7_8e.3 rim 2.83 0.27 3.85 6.69 0.27 1.75 0.01 0.26 6.10E-03 ep 13JL7_8e.4 rim 2.82 0.27 3.85 6.68 0.22 1.74 0.01 0.26 6.05E-03 ep
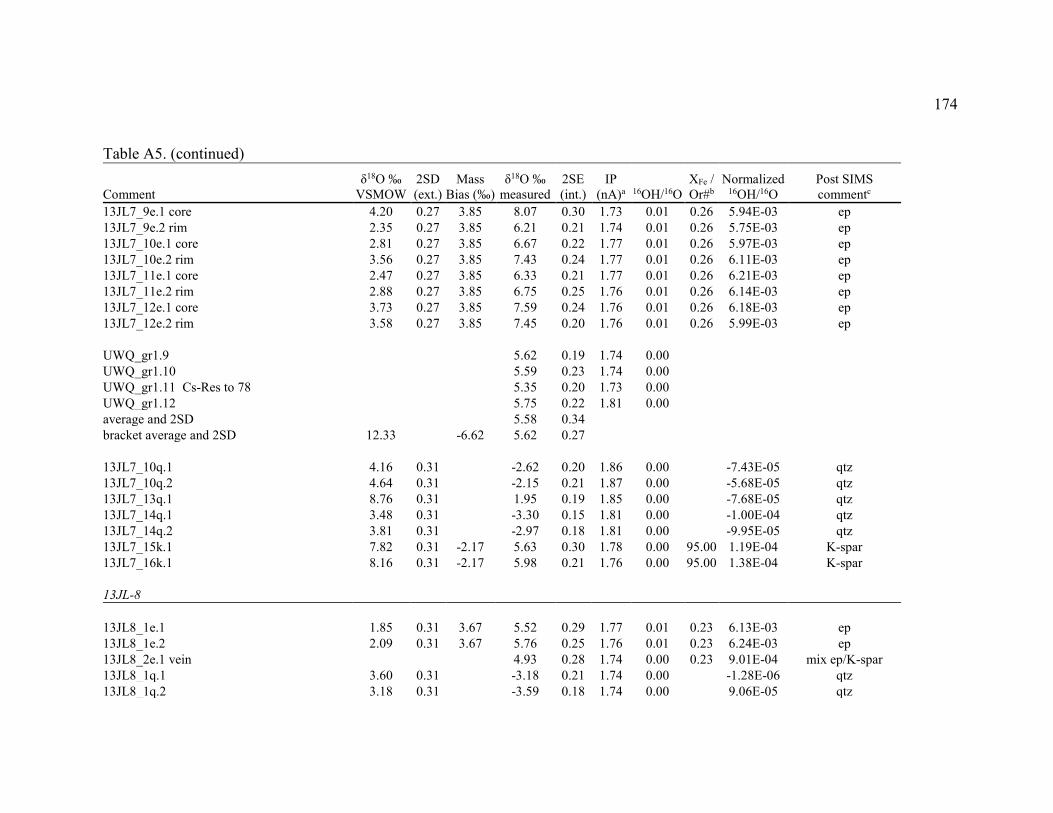
174
Table A5. (continued)
Comment δ18O ‰
VSMOW 2SD (ext.)
Mass Bias (‰)
δ18O ‰ measured
2SE (int.)
IP (nA)a 16OH/16O
XFe / Or#b
Normalized 16OH/16O
Post SIMS commentc
13JL7_9e.1 core 4.20 0.27 3.85 8.07 0.30 1.73 0.01 0.26 5.94E-03 ep 13JL7_9e.2 rim 2.35 0.27 3.85 6.21 0.21 1.74 0.01 0.26 5.75E-03 ep 13JL7_10e.1 core 2.81 0.27 3.85 6.67 0.22 1.77 0.01 0.26 5.97E-03 ep 13JL7_10e.2 rim 3.56 0.27 3.85 7.43 0.24 1.77 0.01 0.26 6.11E-03 ep 13JL7_11e.1 core 2.47 0.27 3.85 6.33 0.21 1.77 0.01 0.26 6.21E-03 ep 13JL7_11e.2 rim 2.88 0.27 3.85 6.75 0.25 1.76 0.01 0.26 6.14E-03 ep 13JL7_12e.1 core 3.73 0.27 3.85 7.59 0.24 1.76 0.01 0.26 6.18E-03 ep 13JL7_12e.2 rim 3.58 0.27 3.85 7.45 0.20 1.76 0.01 0.26 5.99E-03 ep
UWQ_gr1.9
5.62 0.19 1.74 0.00 UWQ_gr1.10
5.59 0.23 1.74 0.00
UWQ_gr1.11 Cs-Res to 78
5.35 0.20 1.73 0.00 UWQ_gr1.12
5.75 0.22 1.81 0.00
average and 2SD
5.58 0.34 bracket average and 2SD 12.33
-6.62 5.62 0.27
13JL7_10q.1 4.16 0.31
-2.62 0.20 1.86 0.00
-7.43E-05 qtz
13JL7_10q.2 4.64 0.31
-2.15 0.21 1.87 0.00
-5.68E-05 qtz 13JL7_13q.1 8.76 0.31
1.95 0.19 1.85 0.00
-7.68E-05 qtz
13JL7_14q.1 3.48 0.31
-3.30 0.15 1.81 0.00
-1.00E-04 qtz 13JL7_14q.2 3.81 0.31
-2.97 0.18 1.81 0.00
-9.95E-05 qtz
13JL7_15k.1 7.82 0.31 -2.17 5.63 0.30 1.78 0.00 95.00 1.19E-04 K-spar 13JL7_16k.1 8.16 0.31 -2.17 5.98 0.21 1.76 0.00 95.00 1.38E-04 K-spar
13JL-8
13JL8_1e.1 1.85 0.31 3.67 5.52 0.29 1.77 0.01 0.23 6.13E-03 ep 13JL8_1e.2 2.09 0.31 3.67 5.76 0.25 1.76 0.01 0.23 6.24E-03 ep 13JL8_2e.1 vein
4.93 0.28 1.74 0.00 0.23 9.01E-04 mix ep/K-spar
13JL8_1q.1 3.60 0.31
-3.18 0.21 1.74 0.00
-1.28E-06 qtz 13JL8_1q.2 3.18 0.31
-3.59 0.18 1.74 0.00
9.06E-05 qtz
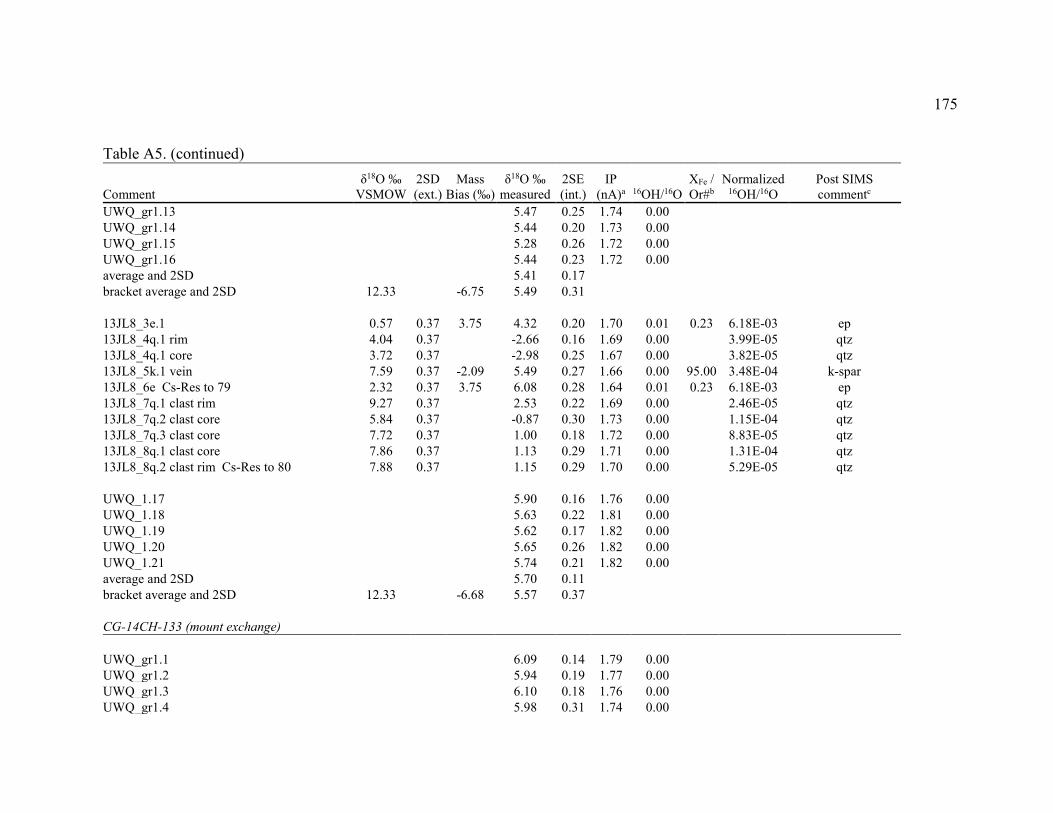
175
Table A5. (continued)
Comment δ18O ‰
VSMOW 2SD (ext.)
Mass Bias (‰)
δ18O ‰ measured
2SE (int.)
IP (nA)a 16OH/16O
XFe / Or#b
Normalized 16OH/16O
Post SIMS commentc
UWQ_gr1.13
5.47 0.25 1.74 0.00 UWQ_gr1.14
5.44 0.20 1.73 0.00
UWQ_gr1.15
5.28 0.26 1.72 0.00 UWQ_gr1.16
5.44 0.23 1.72 0.00
average and 2SD
5.41 0.17 bracket average and 2SD 12.33
-6.75 5.49 0.31
13JL8_3e.1 0.57 0.37 3.75 4.32 0.20 1.70 0.01 0.23 6.18E-03 ep 13JL8_4q.1 rim 4.04 0.37
-2.66 0.16 1.69 0.00
3.99E-05 qtz
13JL8_4q.1 core 3.72 0.37
-2.98 0.25 1.67 0.00
3.82E-05 qtz 13JL8_5k.1 vein 7.59 0.37 -2.09 5.49 0.27 1.66 0.00 95.00 3.48E-04 k-spar 13JL8_6e Cs-Res to 79 2.32 0.37 3.75 6.08 0.28 1.64 0.01 0.23 6.18E-03 ep 13JL8_7q.1 clast rim 9.27 0.37
2.53 0.22 1.69 0.00
2.46E-05 qtz
13JL8_7q.2 clast core 5.84 0.37
-0.87 0.30 1.73 0.00
1.15E-04 qtz 13JL8_7q.3 clast core 7.72 0.37
1.00 0.18 1.72 0.00
8.83E-05 qtz
13JL8_8q.1 clast core 7.86 0.37
1.13 0.29 1.71 0.00
1.31E-04 qtz 13JL8_8q.2 clast rim Cs-Res to 80 7.88 0.37
1.15 0.29 1.70 0.00
5.29E-05 qtz
UWQ_1.17
5.90 0.16 1.76 0.00 UWQ_1.18
5.63 0.22 1.81 0.00
UWQ_1.19
5.62 0.17 1.82 0.00 UWQ_1.20
5.65 0.26 1.82 0.00
UWQ_1.21
5.74 0.21 1.82 0.00 average and 2SD
5.70 0.11
bracket average and 2SD 12.33
-6.68 5.57 0.37
CG-14CH-133 (mount exchange)
UWQ_gr1.1
6.09 0.14 1.79 0.00 UWQ_gr1.2
5.94 0.19 1.77 0.00
UWQ_gr1.3
6.10 0.18 1.76 0.00 UWQ_gr1.4
5.98 0.31 1.74 0.00
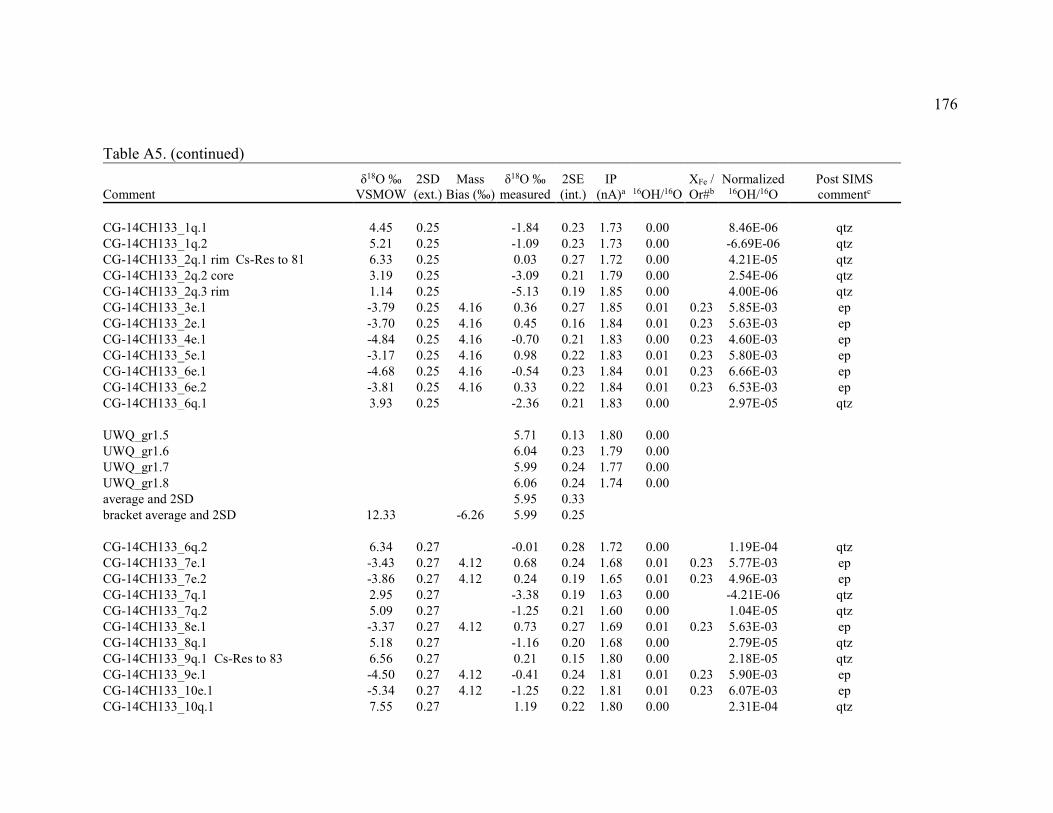
176
Table A5. (continued)
Comment δ18O ‰
VSMOW 2SD (ext.)
Mass Bias (‰)
δ18O ‰ measured
2SE (int.)
IP (nA)a 16OH/16O
XFe / Or#b
Normalized 16OH/16O
Post SIMS commentc
CG-14CH133_1q.1 4.45 0.25
-1.84 0.23 1.73 0.00
8.46E-06 qtz CG-14CH133_1q.2 5.21 0.25
-1.09 0.23 1.73 0.00
-6.69E-06 qtz
CG-14CH133_2q.1 rim Cs-Res to 81 6.33 0.25
0.03 0.27 1.72 0.00
4.21E-05 qtz CG-14CH133_2q.2 core 3.19 0.25
-3.09 0.21 1.79 0.00
2.54E-06 qtz
CG-14CH133_2q.3 rim 1.14 0.25
-5.13 0.19 1.85 0.00
4.00E-06 qtz CG-14CH133_3e.1 -3.79 0.25 4.16 0.36 0.27 1.85 0.01 0.23 5.85E-03 ep CG-14CH133_2e.1 -3.70 0.25 4.16 0.45 0.16 1.84 0.01 0.23 5.63E-03 ep CG-14CH133_4e.1 -4.84 0.25 4.16 -0.70 0.21 1.83 0.00 0.23 4.60E-03 ep CG-14CH133_5e.1 -3.17 0.25 4.16 0.98 0.22 1.83 0.01 0.23 5.80E-03 ep CG-14CH133_6e.1 -4.68 0.25 4.16 -0.54 0.23 1.84 0.01 0.23 6.66E-03 ep CG-14CH133_6e.2 -3.81 0.25 4.16 0.33 0.22 1.84 0.01 0.23 6.53E-03 ep CG-14CH133_6q.1 3.93 0.25
-2.36 0.21 1.83 0.00
2.97E-05 qtz
UWQ_gr1.5
5.71 0.13 1.80 0.00 UWQ_gr1.6
6.04 0.23 1.79 0.00
UWQ_gr1.7
5.99 0.24 1.77 0.00 UWQ_gr1.8
6.06 0.24 1.74 0.00
average and 2SD
5.95 0.33 bracket average and 2SD 12.33
-6.26 5.99 0.25
CG-14CH133_6q.2 6.34 0.27
-0.01 0.28 1.72 0.00
1.19E-04 qtz
CG-14CH133_7e.1 -3.43 0.27 4.12 0.68 0.24 1.68 0.01 0.23 5.77E-03 ep CG-14CH133_7e.2 -3.86 0.27 4.12 0.24 0.19 1.65 0.01 0.23 4.96E-03 ep CG-14CH133_7q.1 2.95 0.27
-3.38 0.19 1.63 0.00
-4.21E-06 qtz
CG-14CH133_7q.2 5.09 0.27
-1.25 0.21 1.60 0.00
1.04E-05 qtz CG-14CH133_8e.1 -3.37 0.27 4.12 0.73 0.27 1.69 0.01 0.23 5.63E-03 ep CG-14CH133_8q.1 5.18 0.27
-1.16 0.20 1.68 0.00
2.79E-05 qtz
CG-14CH133_9q.1 Cs-Res to 83 6.56 0.27
0.21 0.15 1.80 0.00
2.18E-05 qtz CG-14CH133_9e.1 -4.50 0.27 4.12 -0.41 0.24 1.81 0.01 0.23 5.90E-03 ep CG-14CH133_10e.1 -5.34 0.27 4.12 -1.25 0.22 1.81 0.01 0.23 6.07E-03 ep CG-14CH133_10q.1 7.55 0.27
1.19 0.22 1.80 0.00
2.31E-04 qtz
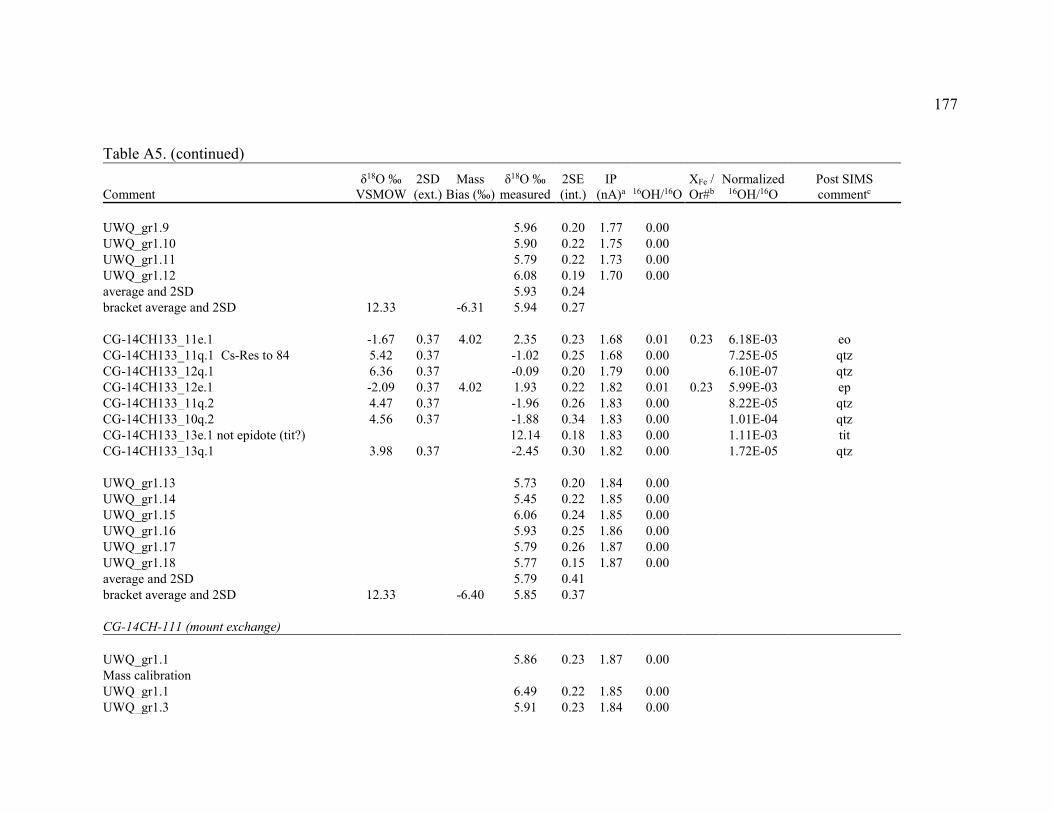
177
Table A5. (continued)
Comment δ18O ‰
VSMOW 2SD (ext.)
Mass Bias (‰)
δ18O ‰ measured
2SE (int.)
IP (nA)a 16OH/16O
XFe / Or#b
Normalized 16OH/16O
Post SIMS commentc
UWQ_gr1.9
5.96 0.20 1.77 0.00 UWQ_gr1.10
5.90 0.22 1.75 0.00
UWQ_gr1.11
5.79 0.22 1.73 0.00 UWQ_gr1.12
6.08 0.19 1.70 0.00
average and 2SD
5.93 0.24 bracket average and 2SD 12.33
-6.31 5.94 0.27
CG-14CH133_11e.1 -1.67 0.37 4.02 2.35 0.23 1.68 0.01 0.23 6.18E-03 eo CG-14CH133_11q.1 Cs-Res to 84 5.42 0.37
-1.02 0.25 1.68 0.00
7.25E-05 qtz
CG-14CH133_12q.1 6.36 0.37
-0.09 0.20 1.79 0.00
6.10E-07 qtz CG-14CH133_12e.1 -2.09 0.37 4.02 1.93 0.22 1.82 0.01 0.23 5.99E-03 ep CG-14CH133_11q.2 4.47 0.37
-1.96 0.26 1.83 0.00
8.22E-05 qtz
CG-14CH133_10q.2 4.56 0.37
-1.88 0.34 1.83 0.00
1.01E-04 qtz CG-14CH133_13e.1 not epidote (tit?)
12.14 0.18 1.83 0.00
1.11E-03 tit
CG-14CH133_13q.1 3.98 0.37
-2.45 0.30 1.82 0.00
1.72E-05 qtz
UWQ_gr1.13
5.73 0.20 1.84 0.00 UWQ_gr1.14
5.45 0.22 1.85 0.00
UWQ_gr1.15
6.06 0.24 1.85 0.00 UWQ_gr1.16
5.93 0.25 1.86 0.00
UWQ_gr1.17
5.79 0.26 1.87 0.00 UWQ_gr1.18
5.77 0.15 1.87 0.00
average and 2SD
5.79 0.41 bracket average and 2SD 12.33
-6.40 5.85 0.37
CG-14CH-111 (mount exchange)
UWQ_gr1.1
5.86 0.23 1.87 0.00 Mass calibration
UWQ_gr1.1
6.49 0.22 1.85 0.00 UWQ_gr1.3
5.91 0.23 1.84 0.00
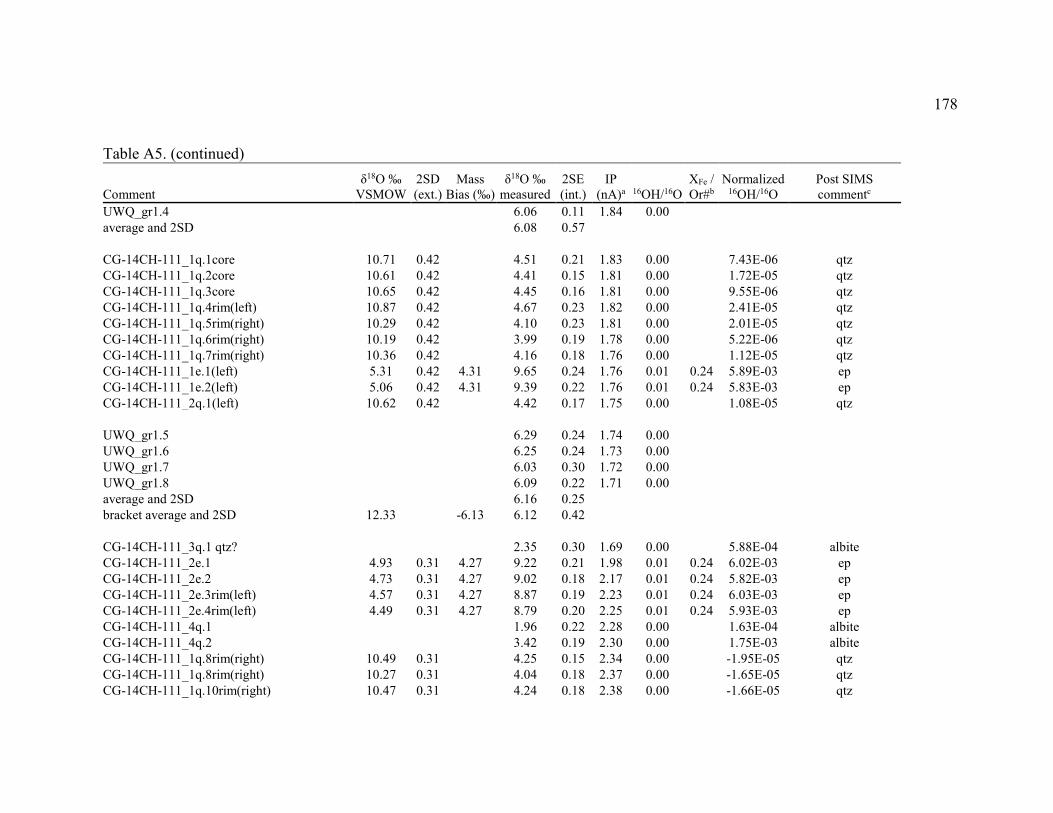
178
Table A5. (continued)
Comment δ18O ‰
VSMOW 2SD (ext.)
Mass Bias (‰)
δ18O ‰ measured
2SE (int.)
IP (nA)a 16OH/16O
XFe / Or#b
Normalized 16OH/16O
Post SIMS commentc
UWQ_gr1.4
6.06 0.11 1.84 0.00 average and 2SD
6.08 0.57
CG-14CH-111_1q.1core 10.71 0.42
4.51 0.21 1.83 0.00
7.43E-06 qtz
CG-14CH-111_1q.2core 10.61 0.42
4.41 0.15 1.81 0.00
1.72E-05 qtz CG-14CH-111_1q.3core 10.65 0.42
4.45 0.16 1.81 0.00
9.55E-06 qtz
CG-14CH-111_1q.4rim(left) 10.87 0.42
4.67 0.23 1.82 0.00
2.41E-05 qtz CG-14CH-111_1q.5rim(right) 10.29 0.42
4.10 0.23 1.81 0.00
2.01E-05 qtz
CG-14CH-111_1q.6rim(right) 10.19 0.42
3.99 0.19 1.78 0.00
5.22E-06 qtz CG-14CH-111_1q.7rim(right) 10.36 0.42
4.16 0.18 1.76 0.00
1.12E-05 qtz
CG-14CH-111_1e.1(left) 5.31 0.42 4.31 9.65 0.24 1.76 0.01 0.24 5.89E-03 ep CG-14CH-111_1e.2(left) 5.06 0.42 4.31 9.39 0.22 1.76 0.01 0.24 5.83E-03 ep CG-14CH-111_2q.1(left) 10.62 0.42
4.42 0.17 1.75 0.00
1.08E-05 qtz
UWQ_gr1.5
6.29 0.24 1.74 0.00 UWQ_gr1.6
6.25 0.24 1.73 0.00
UWQ_gr1.7
6.03 0.30 1.72 0.00 UWQ_gr1.8
6.09 0.22 1.71 0.00
average and 2SD
6.16 0.25 bracket average and 2SD 12.33
-6.13 6.12 0.42
CG-14CH-111_3q.1 qtz?
2.35 0.30 1.69 0.00
5.88E-04 albite
CG-14CH-111_2e.1 4.93 0.31 4.27 9.22 0.21 1.98 0.01 0.24 6.02E-03 ep CG-14CH-111_2e.2 4.73 0.31 4.27 9.02 0.18 2.17 0.01 0.24 5.82E-03 ep CG-14CH-111_2e.3rim(left) 4.57 0.31 4.27 8.87 0.19 2.23 0.01 0.24 6.03E-03 ep CG-14CH-111_2e.4rim(left) 4.49 0.31 4.27 8.79 0.20 2.25 0.01 0.24 5.93E-03 ep CG-14CH-111_4q.1
1.96 0.22 2.28 0.00
1.63E-04 albite
CG-14CH-111_4q.2
3.42 0.19 2.30 0.00
1.75E-03 albite CG-14CH-111_1q.8rim(right) 10.49 0.31
4.25 0.15 2.34 0.00
-1.95E-05 qtz
CG-14CH-111_1q.8rim(right) 10.27 0.31
4.04 0.18 2.37 0.00
-1.65E-05 qtz CG-14CH-111_1q.10rim(right) 10.47 0.31
4.24 0.18 2.38 0.00
-1.66E-05 qtz
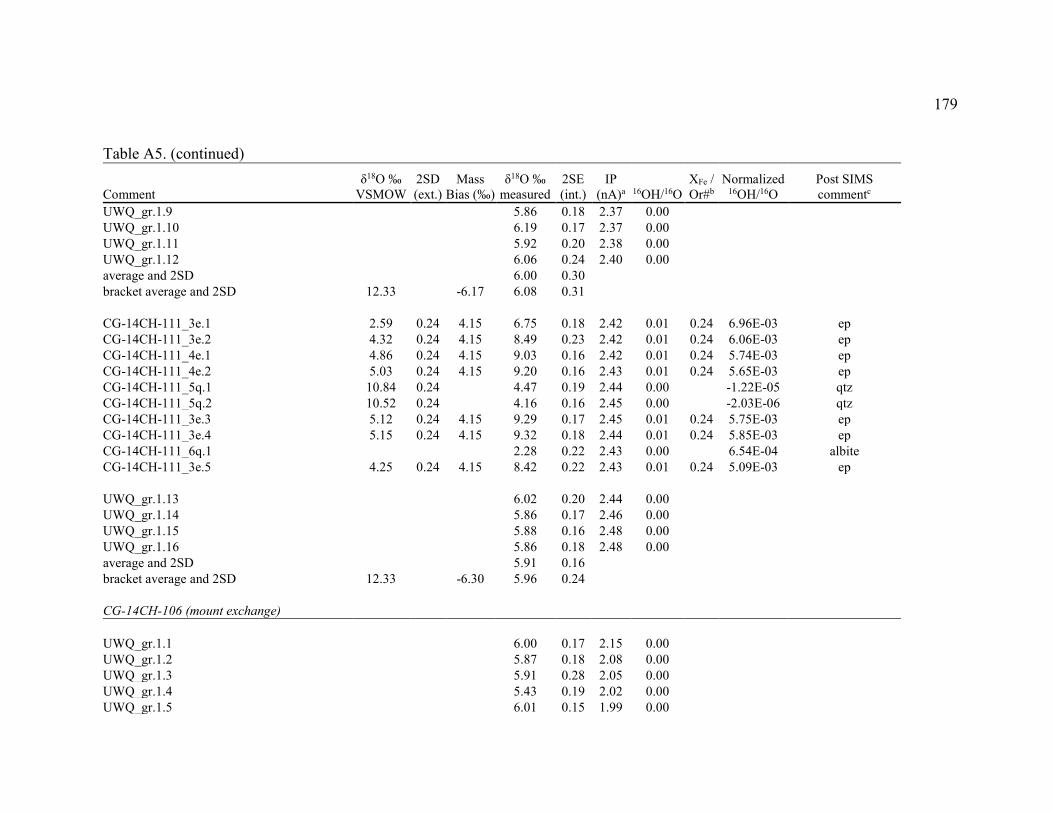
179
Table A5. (continued)
Comment δ18O ‰
VSMOW 2SD (ext.)
Mass Bias (‰)
δ18O ‰ measured
2SE (int.)
IP (nA)a 16OH/16O
XFe / Or#b
Normalized 16OH/16O
Post SIMS commentc
UWQ_gr.1.9
5.86 0.18 2.37 0.00 UWQ_gr.1.10
6.19 0.17 2.37 0.00
UWQ_gr.1.11
5.92 0.20 2.38 0.00 UWQ_gr.1.12
6.06 0.24 2.40 0.00
average and 2SD
6.00 0.30 bracket average and 2SD 12.33
-6.17 6.08 0.31
CG-14CH-111_3e.1 2.59 0.24 4.15 6.75 0.18 2.42 0.01 0.24 6.96E-03 ep CG-14CH-111_3e.2 4.32 0.24 4.15 8.49 0.23 2.42 0.01 0.24 6.06E-03 ep CG-14CH-111_4e.1 4.86 0.24 4.15 9.03 0.16 2.42 0.01 0.24 5.74E-03 ep CG-14CH-111_4e.2 5.03 0.24 4.15 9.20 0.16 2.43 0.01 0.24 5.65E-03 ep CG-14CH-111_5q.1 10.84 0.24
4.47 0.19 2.44 0.00
-1.22E-05 qtz
CG-14CH-111_5q.2 10.52 0.24
4.16 0.16 2.45 0.00
-2.03E-06 qtz CG-14CH-111_3e.3 5.12 0.24 4.15 9.29 0.17 2.45 0.01 0.24 5.75E-03 ep CG-14CH-111_3e.4 5.15 0.24 4.15 9.32 0.18 2.44 0.01 0.24 5.85E-03 ep CG-14CH-111_6q.1
2.28 0.22 2.43 0.00
6.54E-04 albite
CG-14CH-111_3e.5 4.25 0.24 4.15 8.42 0.22 2.43 0.01 0.24 5.09E-03 ep
UWQ_gr.1.13
6.02 0.20 2.44 0.00 UWQ_gr.1.14
5.86 0.17 2.46 0.00
UWQ_gr.1.15
5.88 0.16 2.48 0.00 UWQ_gr.1.16
5.86 0.18 2.48 0.00
average and 2SD
5.91 0.16 bracket average and 2SD 12.33
-6.30 5.96 0.24
CG-14CH-106 (mount exchange)
UWQ_gr.1.1
6.00 0.17 2.15 0.00 UWQ_gr.1.2
5.87 0.18 2.08 0.00
UWQ_gr.1.3
5.91 0.28 2.05 0.00 UWQ_gr.1.4
5.43 0.19 2.02 0.00
UWQ_gr.1.5
6.01 0.15 1.99 0.00
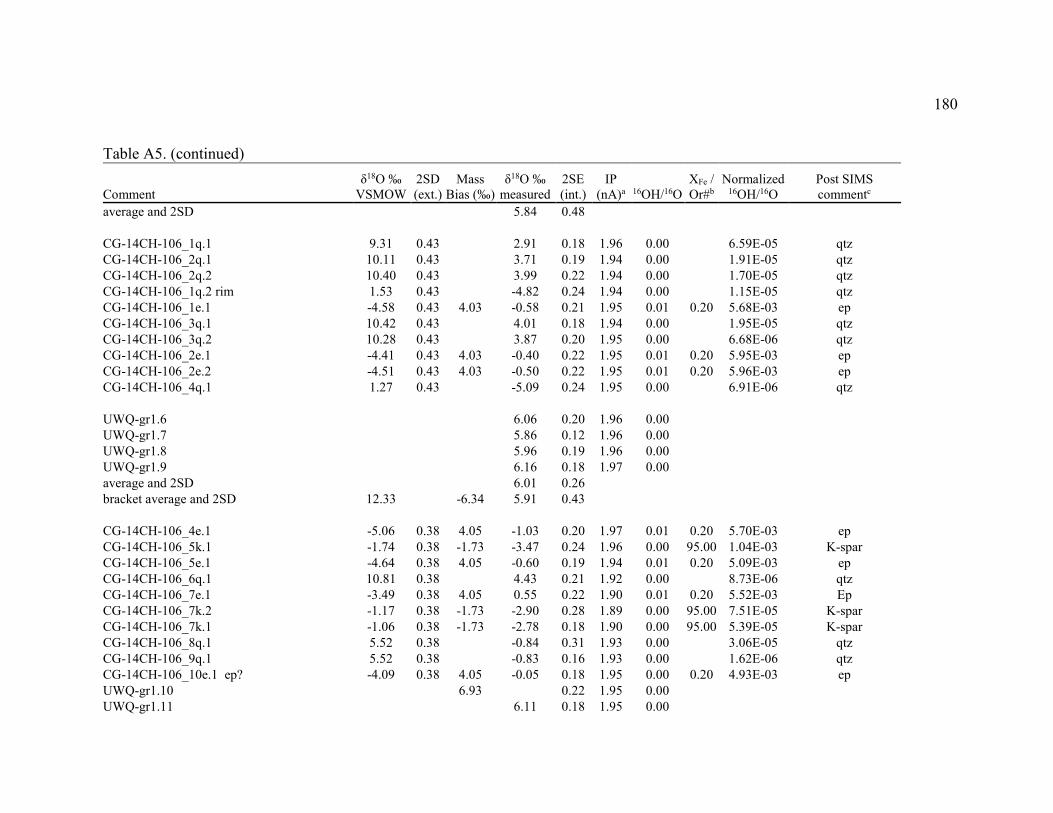
180
Table A5. (continued)
Comment δ18O ‰
VSMOW 2SD (ext.)
Mass Bias (‰)
δ18O ‰ measured
2SE (int.)
IP (nA)a 16OH/16O
XFe / Or#b
Normalized 16OH/16O
Post SIMS commentc
average and 2SD
5.84 0.48
CG-14CH-106_1q.1 9.31 0.43
2.91 0.18 1.96 0.00
6.59E-05 qtz CG-14CH-106_2q.1 10.11 0.43
3.71 0.19 1.94 0.00
1.91E-05 qtz
CG-14CH-106_2q.2 10.40 0.43
3.99 0.22 1.94 0.00
1.70E-05 qtz CG-14CH-106_1q.2 rim 1.53 0.43
-4.82 0.24 1.94 0.00
1.15E-05 qtz
CG-14CH-106_1e.1 -4.58 0.43 4.03 -0.58 0.21 1.95 0.01 0.20 5.68E-03 ep CG-14CH-106_3q.1 10.42 0.43
4.01 0.18 1.94 0.00
1.95E-05 qtz
CG-14CH-106_3q.2 10.28 0.43
3.87 0.20 1.95 0.00
6.68E-06 qtz CG-14CH-106_2e.1 -4.41 0.43 4.03 -0.40 0.22 1.95 0.01 0.20 5.95E-03 ep CG-14CH-106_2e.2 -4.51 0.43 4.03 -0.50 0.22 1.95 0.01 0.20 5.96E-03 ep CG-14CH-106_4q.1 1.27 0.43
-5.09 0.24 1.95 0.00
6.91E-06 qtz
UWQ-gr1.6
6.06 0.20 1.96 0.00 UWQ-gr1.7
5.86 0.12 1.96 0.00
UWQ-gr1.8
5.96 0.19 1.96 0.00 UWQ-gr1.9
6.16 0.18 1.97 0.00
average and 2SD
6.01 0.26 bracket average and 2SD 12.33
-6.34 5.91 0.43
CG-14CH-106_4e.1 -5.06 0.38 4.05 -1.03 0.20 1.97 0.01 0.20 5.70E-03 ep CG-14CH-106_5k.1 -1.74 0.38 -1.73 -3.47 0.24 1.96 0.00 95.00 1.04E-03 K-spar CG-14CH-106_5e.1 -4.64 0.38 4.05 -0.60 0.19 1.94 0.01 0.20 5.09E-03 ep CG-14CH-106_6q.1 10.81 0.38
4.43 0.21 1.92 0.00
8.73E-06 qtz
CG-14CH-106_7e.1 -3.49 0.38 4.05 0.55 0.22 1.90 0.01 0.20 5.52E-03 Ep CG-14CH-106_7k.2 -1.17 0.38 -1.73 -2.90 0.28 1.89 0.00 95.00 7.51E-05 K-spar CG-14CH-106_7k.1 -1.06 0.38 -1.73 -2.78 0.18 1.90 0.00 95.00 5.39E-05 K-spar CG-14CH-106_8q.1 5.52 0.38
-0.84 0.31 1.93 0.00
3.06E-05 qtz
CG-14CH-106_9q.1 5.52 0.38
-0.83 0.16 1.93 0.00
1.62E-06 qtz CG-14CH-106_10e.1 ep? -4.09 0.38 4.05 -0.05 0.18 1.95 0.00 0.20 4.93E-03 ep UWQ-gr1.10
6.93
0.22 1.95 0.00
UWQ-gr1.11
6.11 0.18 1.95 0.00
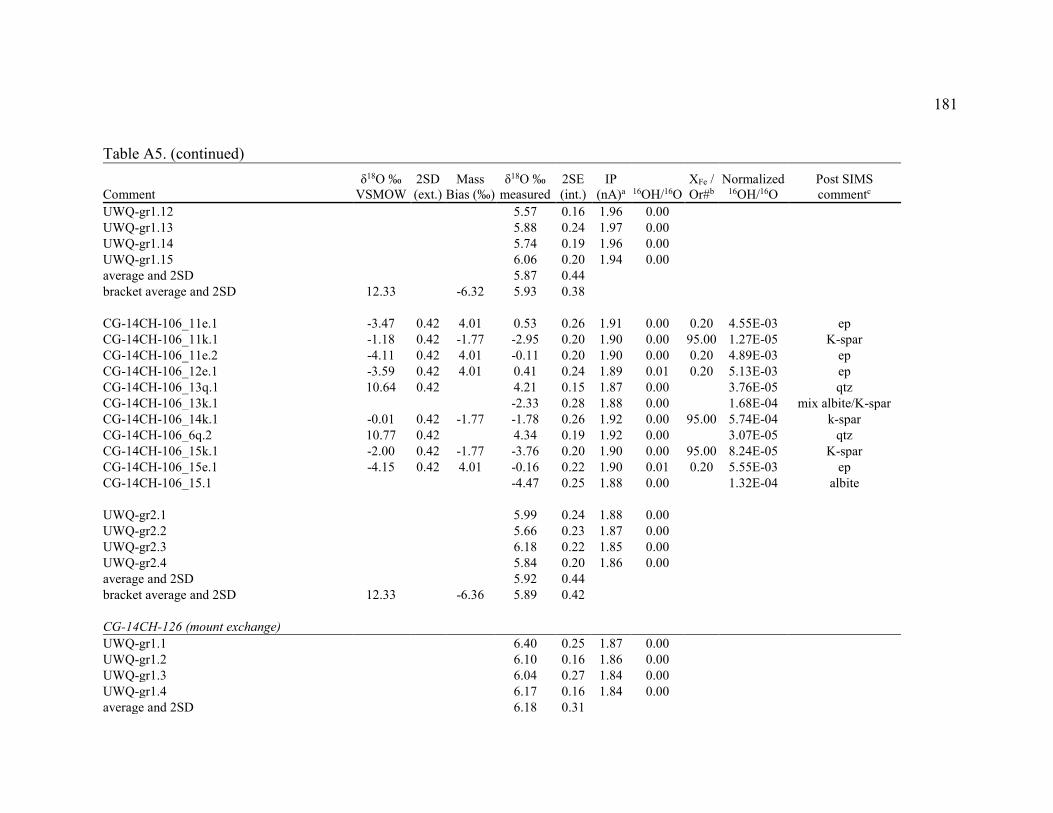
181
Table A5. (continued)
Comment δ18O ‰
VSMOW 2SD (ext.)
Mass Bias (‰)
δ18O ‰ measured
2SE (int.)
IP (nA)a 16OH/16O
XFe / Or#b
Normalized 16OH/16O
Post SIMS commentc
UWQ-gr1.12
5.57 0.16 1.96 0.00 UWQ-gr1.13
5.88 0.24 1.97 0.00
UWQ-gr1.14
5.74 0.19 1.96 0.00 UWQ-gr1.15
6.06 0.20 1.94 0.00
average and 2SD
5.87 0.44 bracket average and 2SD 12.33
-6.32 5.93 0.38
CG-14CH-106_11e.1 -3.47 0.42 4.01 0.53 0.26 1.91 0.00 0.20 4.55E-03 ep CG-14CH-106_11k.1 -1.18 0.42 -1.77 -2.95 0.20 1.90 0.00 95.00 1.27E-05 K-spar CG-14CH-106_11e.2 -4.11 0.42 4.01 -0.11 0.20 1.90 0.00 0.20 4.89E-03 ep CG-14CH-106_12e.1 -3.59 0.42 4.01 0.41 0.24 1.89 0.01 0.20 5.13E-03 ep CG-14CH-106_13q.1 10.64 0.42
4.21 0.15 1.87 0.00
3.76E-05 qtz
CG-14CH-106_13k.1
-2.33 0.28 1.88 0.00
1.68E-04 mix albite/K-spar CG-14CH-106_14k.1 -0.01 0.42 -1.77 -1.78 0.26 1.92 0.00 95.00 5.74E-04 k-spar CG-14CH-106_6q.2 10.77 0.42
4.34 0.19 1.92 0.00
3.07E-05 qtz
CG-14CH-106_15k.1 -2.00 0.42 -1.77 -3.76 0.20 1.90 0.00 95.00 8.24E-05 K-spar CG-14CH-106_15e.1 -4.15 0.42 4.01 -0.16 0.22 1.90 0.01 0.20 5.55E-03 ep CG-14CH-106_15.1
-4.47 0.25 1.88 0.00
1.32E-04 albite
UWQ-gr2.1
5.99 0.24 1.88 0.00 UWQ-gr2.2
5.66 0.23 1.87 0.00
UWQ-gr2.3
6.18 0.22 1.85 0.00 UWQ-gr2.4
5.84 0.20 1.86 0.00
average and 2SD
5.92 0.44 bracket average and 2SD 12.33
-6.36 5.89 0.42
CG-14CH-126 (mount exchange) UWQ-gr1.1
6.40 0.25 1.87 0.00
UWQ-gr1.2
6.10 0.16 1.86 0.00 UWQ-gr1.3
6.04 0.27 1.84 0.00
UWQ-gr1.4
6.17 0.16 1.84 0.00 average and 2SD
6.18 0.31
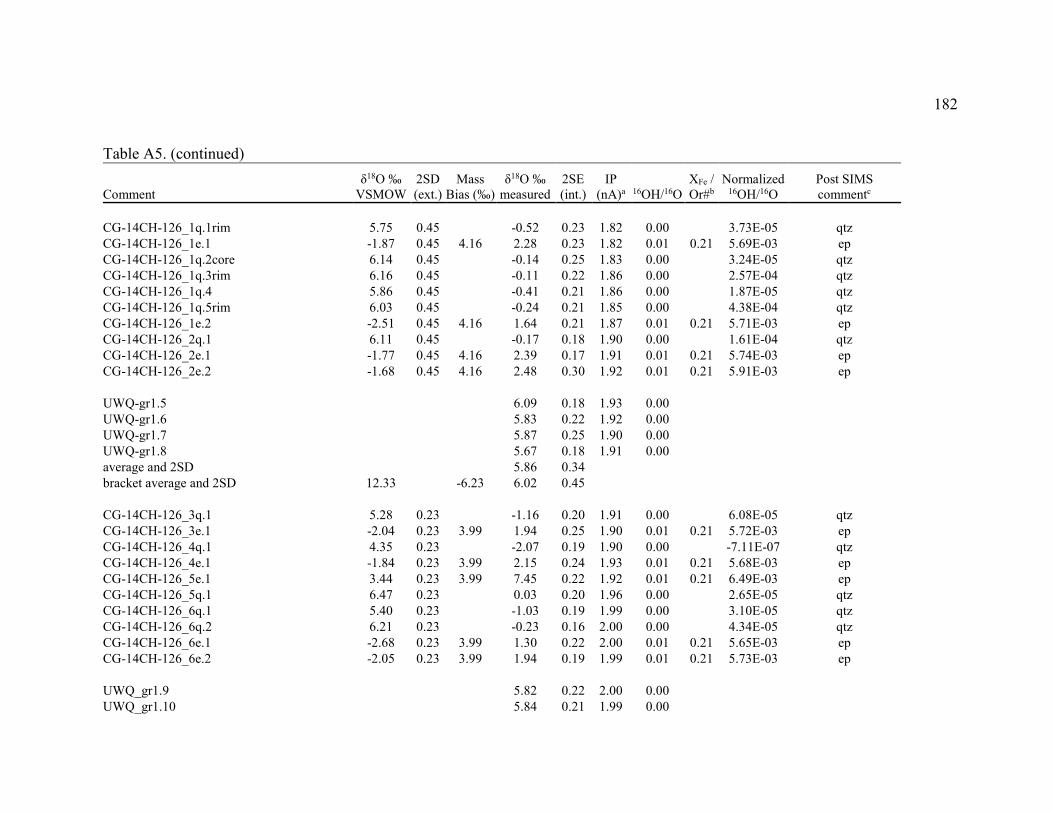
182
Table A5. (continued)
Comment δ18O ‰
VSMOW 2SD (ext.)
Mass Bias (‰)
δ18O ‰ measured
2SE (int.)
IP (nA)a 16OH/16O
XFe / Or#b
Normalized 16OH/16O
Post SIMS commentc
CG-14CH-126_1q.1rim 5.75 0.45
-0.52 0.23 1.82 0.00
3.73E-05 qtz CG-14CH-126_1e.1 -1.87 0.45 4.16 2.28 0.23 1.82 0.01 0.21 5.69E-03 ep CG-14CH-126_1q.2core 6.14 0.45
-0.14 0.25 1.83 0.00
3.24E-05 qtz
CG-14CH-126_1q.3rim 6.16 0.45
-0.11 0.22 1.86 0.00
2.57E-04 qtz CG-14CH-126_1q.4 5.86 0.45
-0.41 0.21 1.86 0.00
1.87E-05 qtz
CG-14CH-126_1q.5rim 6.03 0.45
-0.24 0.21 1.85 0.00
4.38E-04 qtz CG-14CH-126_1e.2 -2.51 0.45 4.16 1.64 0.21 1.87 0.01 0.21 5.71E-03 ep CG-14CH-126_2q.1 6.11 0.45
-0.17 0.18 1.90 0.00
1.61E-04 qtz
CG-14CH-126_2e.1 -1.77 0.45 4.16 2.39 0.17 1.91 0.01 0.21 5.74E-03 ep CG-14CH-126_2e.2 -1.68 0.45 4.16 2.48 0.30 1.92 0.01 0.21 5.91E-03 ep
UWQ-gr1.5
6.09 0.18 1.93 0.00 UWQ-gr1.6
5.83 0.22 1.92 0.00
UWQ-gr1.7
5.87 0.25 1.90 0.00 UWQ-gr1.8
5.67 0.18 1.91 0.00
average and 2SD
5.86 0.34 bracket average and 2SD 12.33
-6.23 6.02 0.45
CG-14CH-126_3q.1 5.28 0.23
-1.16 0.20 1.91 0.00
6.08E-05 qtz
CG-14CH-126_3e.1 -2.04 0.23 3.99 1.94 0.25 1.90 0.01 0.21 5.72E-03 ep CG-14CH-126_4q.1 4.35 0.23
-2.07 0.19 1.90 0.00
-7.11E-07 qtz
CG-14CH-126_4e.1 -1.84 0.23 3.99 2.15 0.24 1.93 0.01 0.21 5.68E-03 ep CG-14CH-126_5e.1 3.44 0.23 3.99 7.45 0.22 1.92 0.01 0.21 6.49E-03 ep CG-14CH-126_5q.1 6.47 0.23
0.03 0.20 1.96 0.00
2.65E-05 qtz
CG-14CH-126_6q.1 5.40 0.23
-1.03 0.19 1.99 0.00
3.10E-05 qtz CG-14CH-126_6q.2 6.21 0.23
-0.23 0.16 2.00 0.00
4.34E-05 qtz
CG-14CH-126_6e.1 -2.68 0.23 3.99 1.30 0.22 2.00 0.01 0.21 5.65E-03 ep CG-14CH-126_6e.2 -2.05 0.23 3.99 1.94 0.19 1.99 0.01 0.21 5.73E-03 ep
UWQ_gr1.9
5.82 0.22 2.00 0.00 UWQ_gr1.10
5.84 0.21 1.99 0.00
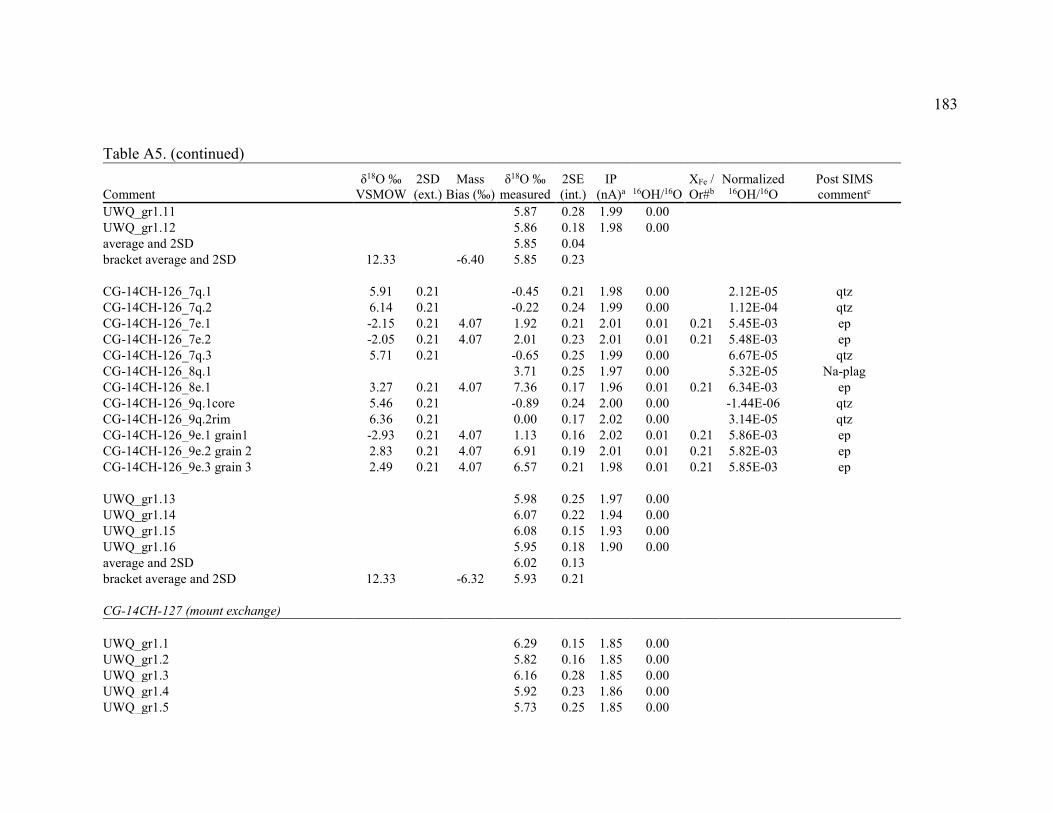
183
Table A5. (continued)
Comment δ18O ‰
VSMOW 2SD (ext.)
Mass Bias (‰)
δ18O ‰ measured
2SE (int.)
IP (nA)a 16OH/16O
XFe / Or#b
Normalized 16OH/16O
Post SIMS commentc
UWQ_gr1.11
5.87 0.28 1.99 0.00 UWQ_gr1.12
5.86 0.18 1.98 0.00
average and 2SD
5.85 0.04 bracket average and 2SD 12.33
-6.40 5.85 0.23
CG-14CH-126_7q.1 5.91 0.21
-0.45 0.21 1.98 0.00
2.12E-05 qtz
CG-14CH-126_7q.2 6.14 0.21
-0.22 0.24 1.99 0.00
1.12E-04 qtz CG-14CH-126_7e.1 -2.15 0.21 4.07 1.92 0.21 2.01 0.01 0.21 5.45E-03 ep CG-14CH-126_7e.2 -2.05 0.21 4.07 2.01 0.23 2.01 0.01 0.21 5.48E-03 ep CG-14CH-126_7q.3 5.71 0.21
-0.65 0.25 1.99 0.00
6.67E-05 qtz
CG-14CH-126_8q.1
3.71 0.25 1.97 0.00
5.32E-05 Na-plag CG-14CH-126_8e.1 3.27 0.21 4.07 7.36 0.17 1.96 0.01 0.21 6.34E-03 ep CG-14CH-126_9q.1core 5.46 0.21
-0.89 0.24 2.00 0.00
-1.44E-06 qtz
CG-14CH-126_9q.2rim 6.36 0.21
0.00 0.17 2.02 0.00
3.14E-05 qtz CG-14CH-126_9e.1 grain1 -2.93 0.21 4.07 1.13 0.16 2.02 0.01 0.21 5.86E-03 ep CG-14CH-126_9e.2 grain 2 2.83 0.21 4.07 6.91 0.19 2.01 0.01 0.21 5.82E-03 ep CG-14CH-126_9e.3 grain 3 2.49 0.21 4.07 6.57 0.21 1.98 0.01 0.21 5.85E-03 ep
UWQ_gr1.13
5.98 0.25 1.97 0.00 UWQ_gr1.14
6.07 0.22 1.94 0.00
UWQ_gr1.15
6.08 0.15 1.93 0.00 UWQ_gr1.16
5.95 0.18 1.90 0.00
average and 2SD
6.02 0.13 bracket average and 2SD 12.33
-6.32 5.93 0.21
CG-14CH-127 (mount exchange)
UWQ_gr1.1
6.29 0.15 1.85 0.00 UWQ_gr1.2
5.82 0.16 1.85 0.00
UWQ_gr1.3
6.16 0.28 1.85 0.00 UWQ_gr1.4
5.92 0.23 1.86 0.00
UWQ_gr1.5
5.73 0.25 1.85 0.00

184
Table A5. (continued)
Comment δ18O ‰
VSMOW 2SD (ext.)
Mass Bias (‰)
δ18O ‰ measured
2SE (int.)
IP (nA)a 16OH/16O
XFe / Or#b
Normalized 16OH/16O
Post SIMS commentc
average and 2SD
5.91 0.37
CG-14CH-127_1q.1 rim 2.44 0.46
-3.74 0.16 1.84 0.00
-7.62E-06 qtz CG-14CH-127_1q.2 rim 3.06 0.46
-3.13 0.25 1.82 0.00
-2.76E-06 qtz
CG-14CH-127_1q.3 core 2.35 0.46
-3.83 0.18 1.80 0.00
3.05E-06 qtz CG-14CH-127_2e.1 -2.08 0.46 4.26 2.17 0.27 1.80 0.01 0.23 5.79E-03 ep CG-14CH-127_3e -2.40 0.46 4.26 1.85 0.23 1.78 0.01 0.23 5.70E-03 ep CG-14CH-127_4e -2.77 0.46 4.26 1.48 0.24 1.77 0.01 0.23 5.70E-03 ep CG-14CH-127_5e -2.75 0.46 4.26 1.50 0.25 1.76 0.01 0.23 5.64E-03 ep CG-14CH-127_5q 3.02 0.46
-3.16 0.23 1.75 0.00
5.19E-05 qtz
CG-14CH-127_6q 2.43 0.46
-3.75 0.28 1.73 0.00
1.57E-06 qtz CG-14CH-127_7e -2.67 0.46 4.26 1.58 0.21 1.71 0.01 0.23 5.86E-03 ep
UWQ_gr1.6
6.46 0.20 1.70 0.00 UWQ_gr1.7
6.09 0.21 1.70 0.00
UWQ_gr1.8
6.03 0.29 1.69 0.00 UWQ_gr1.9
6.16 0.24 1.67 0.00
UWQ_gr1.10
6.40 0.17 1.77 0.00 UWQ_gr1.11
5.94 0.17 1.81 0.00
average and 2SD
6.18 0.42 bracket average and 2SD 12.33
-6.17 6.09 0.46
CG-14CH-127_8q.1 rim 2.73 0.36
-3.47 0.22 1.82 0.00
2.05E-05 qtz
CG-14CH-127_8q.2 core 8.61 0.36
2.37 0.25 1.82 0.00
-1.20E-05 qtz CG-14CH-127_8q.3 core 9.07 0.36
2.83 0.22 1.82 0.00
-1.28E-05 qtz
CG-14CH-127_8q.4 rim 3.33 0.36
-2.87 0.25 1.80 0.00
2.51E-05 qtz CG-14CH-127_8q.5 rim 2.22 0.36
-3.98 0.22 1.81 0.00
-9.85E-06 qtz
CG-14CH-127_8e.1 rim -2.38 0.36 4.24 1.85 0.24 1.82 0.01 0.23 5.64E-03 ep CG-14CH-127_8e.2 core -2.18 0.36 4.24 2.05 0.25 1.83 0.01 0.23 5.87E-03 ep CG-14CH-127_8e.3 core -2.54 0.36 4.24 1.69 0.16 1.83 0.01 0.23 5.61E-03 ep CG-14CH-127_8e.4 rim -2.59 0.36 4.24 1.64 0.29 1.82 0.01 0.23 5.94E-03 ep CG-14CH-127_8e.5 rim -2.17 0.36 4.24 2.06 0.24 1.83 0.01 0.23 5.68E-03 ep
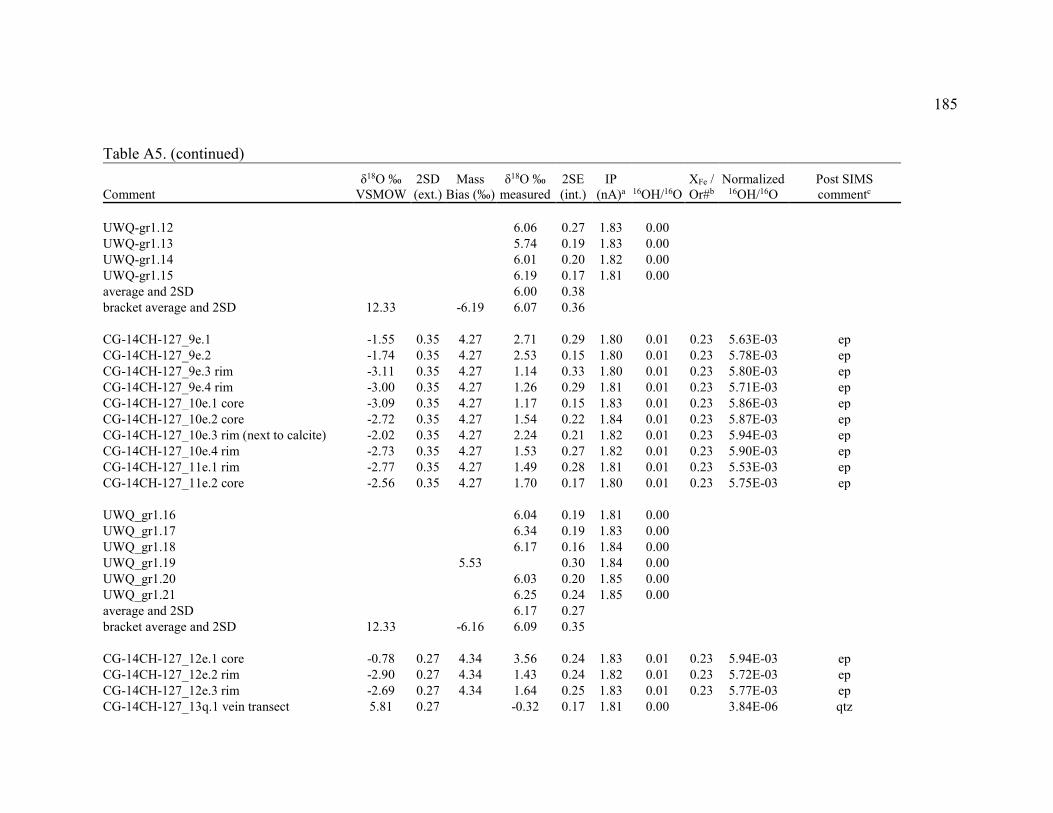
185
Table A5. (continued)
Comment δ18O ‰
VSMOW 2SD (ext.)
Mass Bias (‰)
δ18O ‰ measured
2SE (int.)
IP (nA)a 16OH/16O
XFe / Or#b
Normalized 16OH/16O
Post SIMS commentc
UWQ-gr1.12
6.06 0.27 1.83 0.00 UWQ-gr1.13
5.74 0.19 1.83 0.00
UWQ-gr1.14
6.01 0.20 1.82 0.00 UWQ-gr1.15
6.19 0.17 1.81 0.00
average and 2SD
6.00 0.38 bracket average and 2SD 12.33
-6.19 6.07 0.36
CG-14CH-127_9e.1 -1.55 0.35 4.27 2.71 0.29 1.80 0.01 0.23 5.63E-03 ep CG-14CH-127_9e.2 -1.74 0.35 4.27 2.53 0.15 1.80 0.01 0.23 5.78E-03 ep CG-14CH-127_9e.3 rim -3.11 0.35 4.27 1.14 0.33 1.80 0.01 0.23 5.80E-03 ep CG-14CH-127_9e.4 rim -3.00 0.35 4.27 1.26 0.29 1.81 0.01 0.23 5.71E-03 ep CG-14CH-127_10e.1 core -3.09 0.35 4.27 1.17 0.15 1.83 0.01 0.23 5.86E-03 ep CG-14CH-127_10e.2 core -2.72 0.35 4.27 1.54 0.22 1.84 0.01 0.23 5.87E-03 ep CG-14CH-127_10e.3 rim (next to calcite) -2.02 0.35 4.27 2.24 0.21 1.82 0.01 0.23 5.94E-03 ep CG-14CH-127_10e.4 rim -2.73 0.35 4.27 1.53 0.27 1.82 0.01 0.23 5.90E-03 ep CG-14CH-127_11e.1 rim -2.77 0.35 4.27 1.49 0.28 1.81 0.01 0.23 5.53E-03 ep CG-14CH-127_11e.2 core -2.56 0.35 4.27 1.70 0.17 1.80 0.01 0.23 5.75E-03 ep
UWQ_gr1.16
6.04 0.19 1.81 0.00 UWQ_gr1.17
6.34 0.19 1.83 0.00
UWQ_gr1.18
6.17 0.16 1.84 0.00 UWQ_gr1.19
5.53
0.30 1.84 0.00
UWQ_gr1.20
6.03 0.20 1.85 0.00 UWQ_gr1.21
6.25 0.24 1.85 0.00
average and 2SD
6.17 0.27 bracket average and 2SD 12.33
-6.16 6.09 0.35
CG-14CH-127_12e.1 core -0.78 0.27 4.34 3.56 0.24 1.83 0.01 0.23 5.94E-03 ep CG-14CH-127_12e.2 rim -2.90 0.27 4.34 1.43 0.24 1.82 0.01 0.23 5.72E-03 ep CG-14CH-127_12e.3 rim -2.69 0.27 4.34 1.64 0.25 1.83 0.01 0.23 5.77E-03 ep CG-14CH-127_13q.1 vein transect 5.81 0.27
-0.32 0.17 1.81 0.00
3.84E-06 qtz
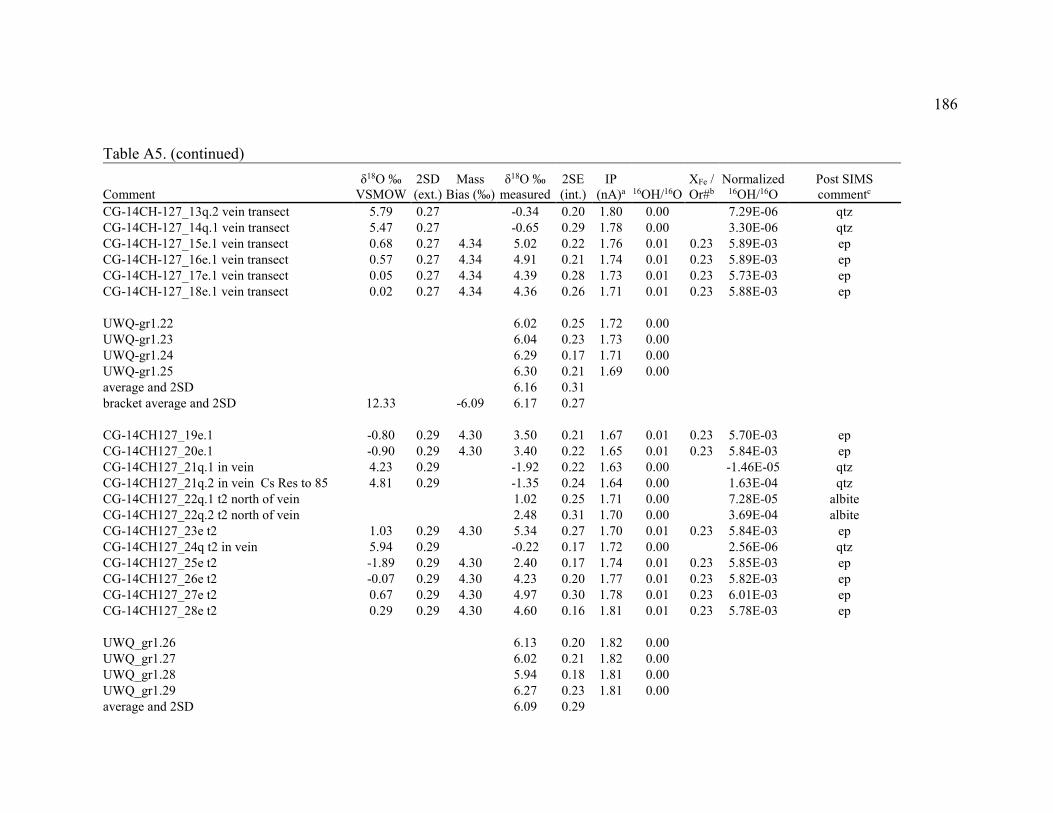
186
Table A5. (continued)
Comment δ18O ‰
VSMOW 2SD (ext.)
Mass Bias (‰)
δ18O ‰ measured
2SE (int.)
IP (nA)a 16OH/16O
XFe / Or#b
Normalized 16OH/16O
Post SIMS commentc
CG-14CH-127_13q.2 vein transect 5.79 0.27
-0.34 0.20 1.80 0.00
7.29E-06 qtz CG-14CH-127_14q.1 vein transect 5.47 0.27
-0.65 0.29 1.78 0.00
3.30E-06 qtz
CG-14CH-127_15e.1 vein transect 0.68 0.27 4.34 5.02 0.22 1.76 0.01 0.23 5.89E-03 ep CG-14CH-127_16e.1 vein transect 0.57 0.27 4.34 4.91 0.21 1.74 0.01 0.23 5.89E-03 ep CG-14CH-127_17e.1 vein transect 0.05 0.27 4.34 4.39 0.28 1.73 0.01 0.23 5.73E-03 ep CG-14CH-127_18e.1 vein transect 0.02 0.27 4.34 4.36 0.26 1.71 0.01 0.23 5.88E-03 ep
UWQ-gr1.22
6.02 0.25 1.72 0.00 UWQ-gr1.23
6.04 0.23 1.73 0.00
UWQ-gr1.24
6.29 0.17 1.71 0.00 UWQ-gr1.25
6.30 0.21 1.69 0.00
average and 2SD
6.16 0.31 bracket average and 2SD 12.33
-6.09 6.17 0.27
CG-14CH127_19e.1 -0.80 0.29 4.30 3.50 0.21 1.67 0.01 0.23 5.70E-03 ep CG-14CH127_20e.1 -0.90 0.29 4.30 3.40 0.22 1.65 0.01 0.23 5.84E-03 ep CG-14CH127_21q.1 in vein 4.23 0.29
-1.92 0.22 1.63 0.00
-1.46E-05 qtz
CG-14CH127_21q.2 in vein Cs Res to 85 4.81 0.29
-1.35 0.24 1.64 0.00
1.63E-04 qtz CG-14CH127_22q.1 t2 north of vein
1.02 0.25 1.71 0.00
7.28E-05 albite
CG-14CH127_22q.2 t2 north of vein
2.48 0.31 1.70 0.00
3.69E-04 albite CG-14CH127_23e t2 1.03 0.29 4.30 5.34 0.27 1.70 0.01 0.23 5.84E-03 ep CG-14CH127_24q t2 in vein 5.94 0.29
-0.22 0.17 1.72 0.00
2.56E-06 qtz
CG-14CH127_25e t2 -1.89 0.29 4.30 2.40 0.17 1.74 0.01 0.23 5.85E-03 ep CG-14CH127_26e t2 -0.07 0.29 4.30 4.23 0.20 1.77 0.01 0.23 5.82E-03 ep CG-14CH127_27e t2 0.67 0.29 4.30 4.97 0.30 1.78 0.01 0.23 6.01E-03 ep CG-14CH127_28e t2 0.29 0.29 4.30 4.60 0.16 1.81 0.01 0.23 5.78E-03 ep
UWQ_gr1.26
6.13 0.20 1.82 0.00 UWQ_gr1.27
6.02 0.21 1.82 0.00
UWQ_gr1.28
5.94 0.18 1.81 0.00 UWQ_gr1.29
6.27 0.23 1.81 0.00
average and 2SD
6.09 0.29
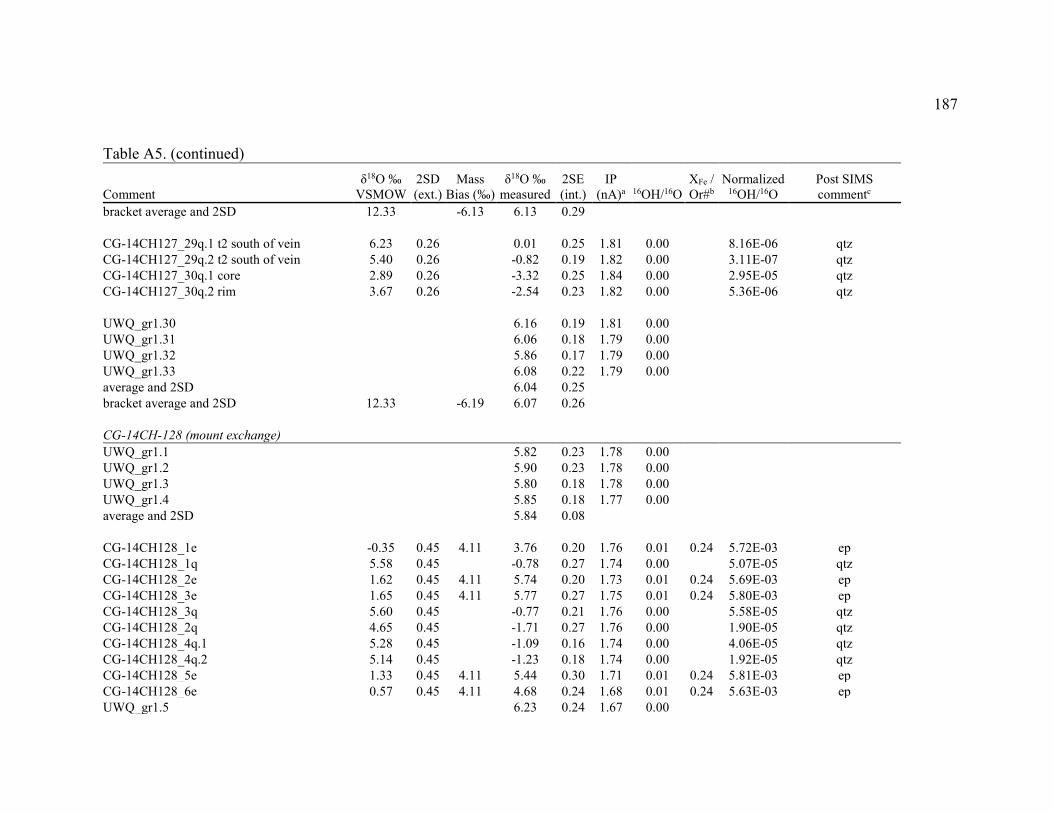
187
Table A5. (continued)
Comment δ18O ‰
VSMOW 2SD (ext.)
Mass Bias (‰)
δ18O ‰ measured
2SE (int.)
IP (nA)a 16OH/16O
XFe / Or#b
Normalized 16OH/16O
Post SIMS commentc
bracket average and 2SD 12.33
-6.13 6.13 0.29
CG-14CH127_29q.1 t2 south of vein 6.23 0.26
0.01 0.25 1.81 0.00
8.16E-06 qtz CG-14CH127_29q.2 t2 south of vein 5.40 0.26
-0.82 0.19 1.82 0.00
3.11E-07 qtz
CG-14CH127_30q.1 core 2.89 0.26
-3.32 0.25 1.84 0.00
2.95E-05 qtz CG-14CH127_30q.2 rim 3.67 0.26
-2.54 0.23 1.82 0.00
5.36E-06 qtz
UWQ_gr1.30
6.16 0.19 1.81 0.00 UWQ_gr1.31
6.06 0.18 1.79 0.00
UWQ_gr1.32
5.86 0.17 1.79 0.00 UWQ_gr1.33
6.08 0.22 1.79 0.00
average and 2SD
6.04 0.25 bracket average and 2SD 12.33
-6.19 6.07 0.26
CG-14CH-128 (mount exchange) UWQ_gr1.1
5.82 0.23 1.78 0.00
UWQ_gr1.2
5.90 0.23 1.78 0.00 UWQ_gr1.3
5.80 0.18 1.78 0.00
UWQ_gr1.4
5.85 0.18 1.77 0.00 average and 2SD
5.84 0.08
CG-14CH128_1e -0.35 0.45 4.11 3.76 0.20 1.76 0.01 0.24 5.72E-03 ep CG-14CH128_1q 5.58 0.45
-0.78 0.27 1.74 0.00
5.07E-05 qtz
CG-14CH128_2e 1.62 0.45 4.11 5.74 0.20 1.73 0.01 0.24 5.69E-03 ep CG-14CH128_3e 1.65 0.45 4.11 5.77 0.27 1.75 0.01 0.24 5.80E-03 ep CG-14CH128_3q 5.60 0.45
-0.77 0.21 1.76 0.00
5.58E-05 qtz
CG-14CH128_2q 4.65 0.45
-1.71 0.27 1.76 0.00
1.90E-05 qtz CG-14CH128_4q.1 5.28 0.45
-1.09 0.16 1.74 0.00
4.06E-05 qtz
CG-14CH128_4q.2 5.14 0.45
-1.23 0.18 1.74 0.00
1.92E-05 qtz CG-14CH128_5e 1.33 0.45 4.11 5.44 0.30 1.71 0.01 0.24 5.81E-03 ep CG-14CH128_6e 0.57 0.45 4.11 4.68 0.24 1.68 0.01 0.24 5.63E-03 ep UWQ_gr1.5
6.23 0.24 1.67 0.00
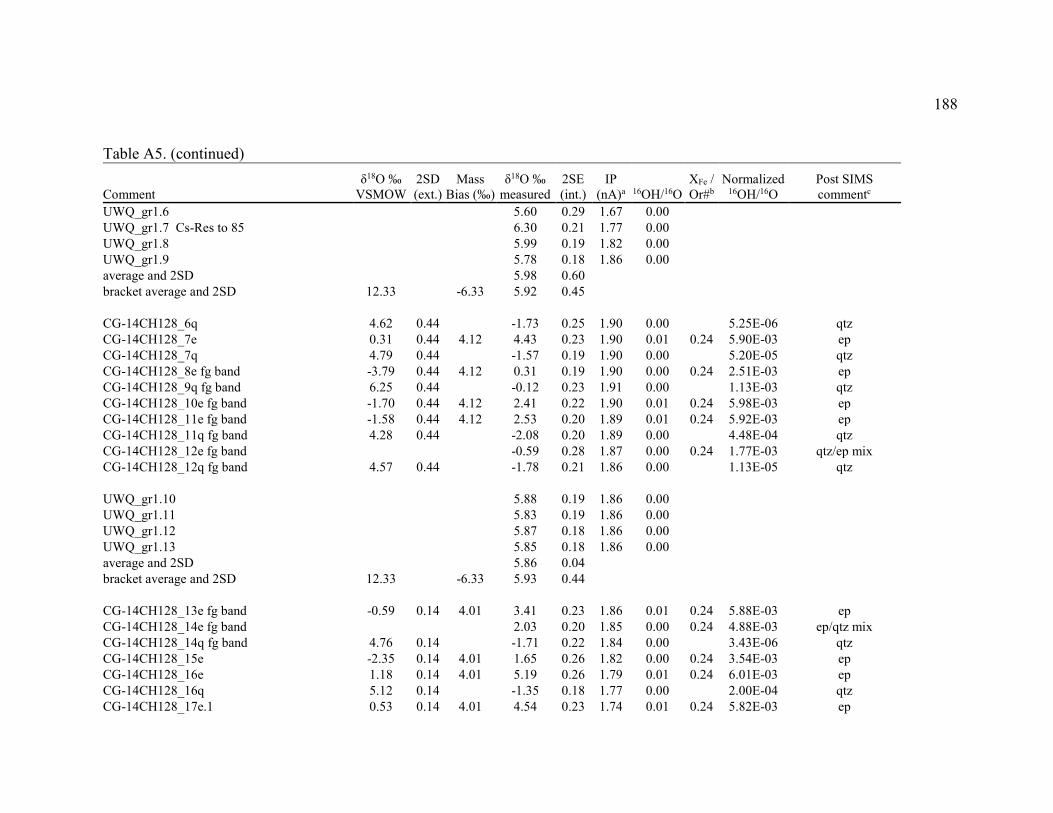
188
Table A5. (continued)
Comment δ18O ‰
VSMOW 2SD (ext.)
Mass Bias (‰)
δ18O ‰ measured
2SE (int.)
IP (nA)a 16OH/16O
XFe / Or#b
Normalized 16OH/16O
Post SIMS commentc
UWQ_gr1.6
5.60 0.29 1.67 0.00 UWQ_gr1.7 Cs-Res to 85
6.30 0.21 1.77 0.00
UWQ_gr1.8
5.99 0.19 1.82 0.00 UWQ_gr1.9
5.78 0.18 1.86 0.00
average and 2SD
5.98 0.60 bracket average and 2SD 12.33
-6.33 5.92 0.45
CG-14CH128_6q 4.62 0.44
-1.73 0.25 1.90 0.00
5.25E-06 qtz
CG-14CH128_7e 0.31 0.44 4.12 4.43 0.23 1.90 0.01 0.24 5.90E-03 ep CG-14CH128_7q 4.79 0.44
-1.57 0.19 1.90 0.00
5.20E-05 qtz
CG-14CH128_8e fg band -3.79 0.44 4.12 0.31 0.19 1.90 0.00 0.24 2.51E-03 ep CG-14CH128_9q fg band 6.25 0.44
-0.12 0.23 1.91 0.00
1.13E-03 qtz
CG-14CH128_10e fg band -1.70 0.44 4.12 2.41 0.22 1.90 0.01 0.24 5.98E-03 ep CG-14CH128_11e fg band -1.58 0.44 4.12 2.53 0.20 1.89 0.01 0.24 5.92E-03 ep CG-14CH128_11q fg band 4.28 0.44
-2.08 0.20 1.89 0.00
4.48E-04 qtz
CG-14CH128_12e fg band
-0.59 0.28 1.87 0.00 0.24 1.77E-03 qtz/ep mix CG-14CH128_12q fg band 4.57 0.44
-1.78 0.21 1.86 0.00
1.13E-05 qtz
UWQ_gr1.10
5.88 0.19 1.86 0.00 UWQ_gr1.11
5.83 0.19 1.86 0.00
UWQ_gr1.12
5.87 0.18 1.86 0.00 UWQ_gr1.13
5.85 0.18 1.86 0.00
average and 2SD
5.86 0.04 bracket average and 2SD 12.33
-6.33 5.93 0.44
CG-14CH128_13e fg band -0.59 0.14 4.01 3.41 0.23 1.86 0.01 0.24 5.88E-03 ep CG-14CH128_14e fg band
2.03 0.20 1.85 0.00 0.24 4.88E-03 ep/qtz mix
CG-14CH128_14q fg band 4.76 0.14
-1.71 0.22 1.84 0.00
3.43E-06 qtz CG-14CH128_15e -2.35 0.14 4.01 1.65 0.26 1.82 0.00 0.24 3.54E-03 ep CG-14CH128_16e 1.18 0.14 4.01 5.19 0.26 1.79 0.01 0.24 6.01E-03 ep CG-14CH128_16q 5.12 0.14
-1.35 0.18 1.77 0.00
2.00E-04 qtz
CG-14CH128_17e.1 0.53 0.14 4.01 4.54 0.23 1.74 0.01 0.24 5.82E-03 ep
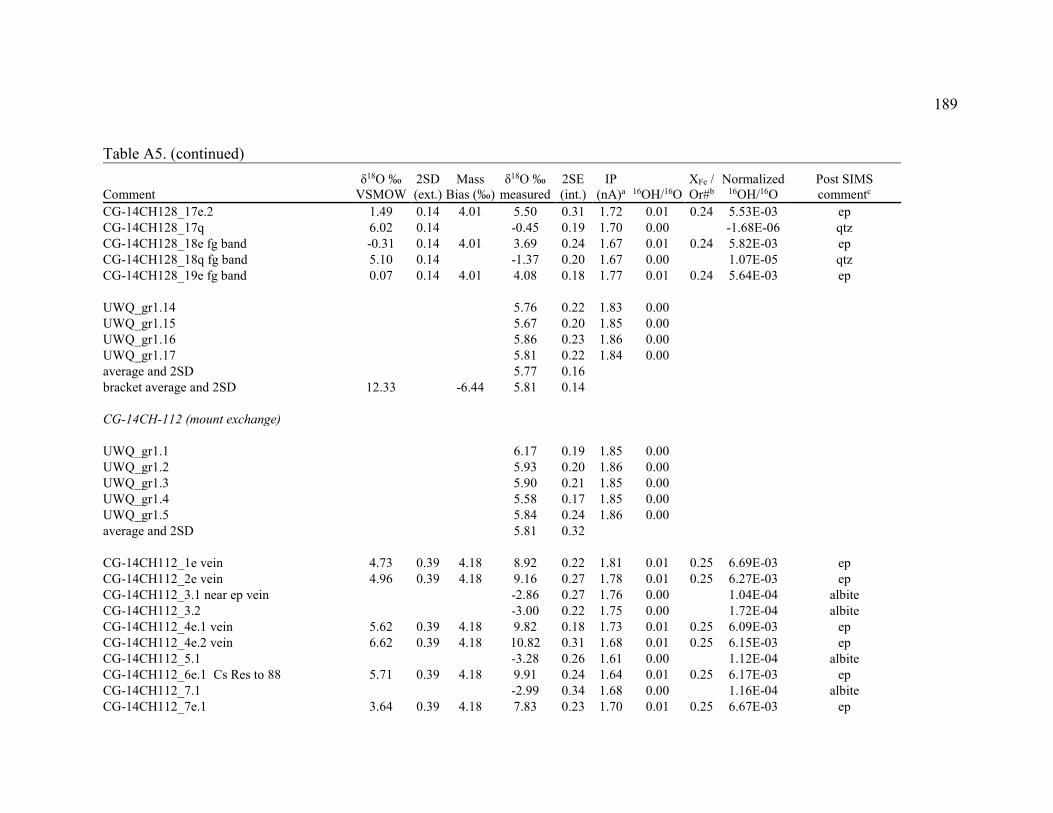
189
Table A5. (continued)
Comment δ18O ‰
VSMOW 2SD (ext.)
Mass Bias (‰)
δ18O ‰ measured
2SE (int.)
IP (nA)a 16OH/16O
XFe / Or#b
Normalized 16OH/16O
Post SIMS commentc
CG-14CH128_17e.2 1.49 0.14 4.01 5.50 0.31 1.72 0.01 0.24 5.53E-03 ep CG-14CH128_17q 6.02 0.14
-0.45 0.19 1.70 0.00
-1.68E-06 qtz
CG-14CH128_18e fg band -0.31 0.14 4.01 3.69 0.24 1.67 0.01 0.24 5.82E-03 ep CG-14CH128_18q fg band 5.10 0.14
-1.37 0.20 1.67 0.00
1.07E-05 qtz
CG-14CH128_19e fg band 0.07 0.14 4.01 4.08 0.18 1.77 0.01 0.24 5.64E-03 ep
UWQ_gr1.14
5.76 0.22 1.83 0.00 UWQ_gr1.15
5.67 0.20 1.85 0.00
UWQ_gr1.16
5.86 0.23 1.86 0.00 UWQ_gr1.17
5.81 0.22 1.84 0.00
average and 2SD
5.77 0.16 bracket average and 2SD 12.33
-6.44 5.81 0.14
CG-14CH-112 (mount exchange)
UWQ_gr1.1
6.17 0.19 1.85 0.00
UWQ_gr1.2
5.93 0.20 1.86 0.00 UWQ_gr1.3
5.90 0.21 1.85 0.00
UWQ_gr1.4
5.58 0.17 1.85 0.00 UWQ_gr1.5
5.84 0.24 1.86 0.00
average and 2SD
5.81 0.32
CG-14CH112_1e vein 4.73 0.39 4.18 8.92 0.22 1.81 0.01 0.25 6.69E-03 ep CG-14CH112_2e vein 4.96 0.39 4.18 9.16 0.27 1.78 0.01 0.25 6.27E-03 ep CG-14CH112_3.1 near ep vein
-2.86 0.27 1.76 0.00
1.04E-04 albite
CG-14CH112_3.2
-3.00 0.22 1.75 0.00
1.72E-04 albite CG-14CH112_4e.1 vein 5.62 0.39 4.18 9.82 0.18 1.73 0.01 0.25 6.09E-03 ep CG-14CH112_4e.2 vein 6.62 0.39 4.18 10.82 0.31 1.68 0.01 0.25 6.15E-03 ep CG-14CH112_5.1
-3.28 0.26 1.61 0.00
1.12E-04 albite
CG-14CH112_6e.1 Cs Res to 88 5.71 0.39 4.18 9.91 0.24 1.64 0.01 0.25 6.17E-03 ep CG-14CH112_7.1
-2.99 0.34 1.68 0.00
1.16E-04 albite
CG-14CH112_7e.1 3.64 0.39 4.18 7.83 0.23 1.70 0.01 0.25 6.67E-03 ep
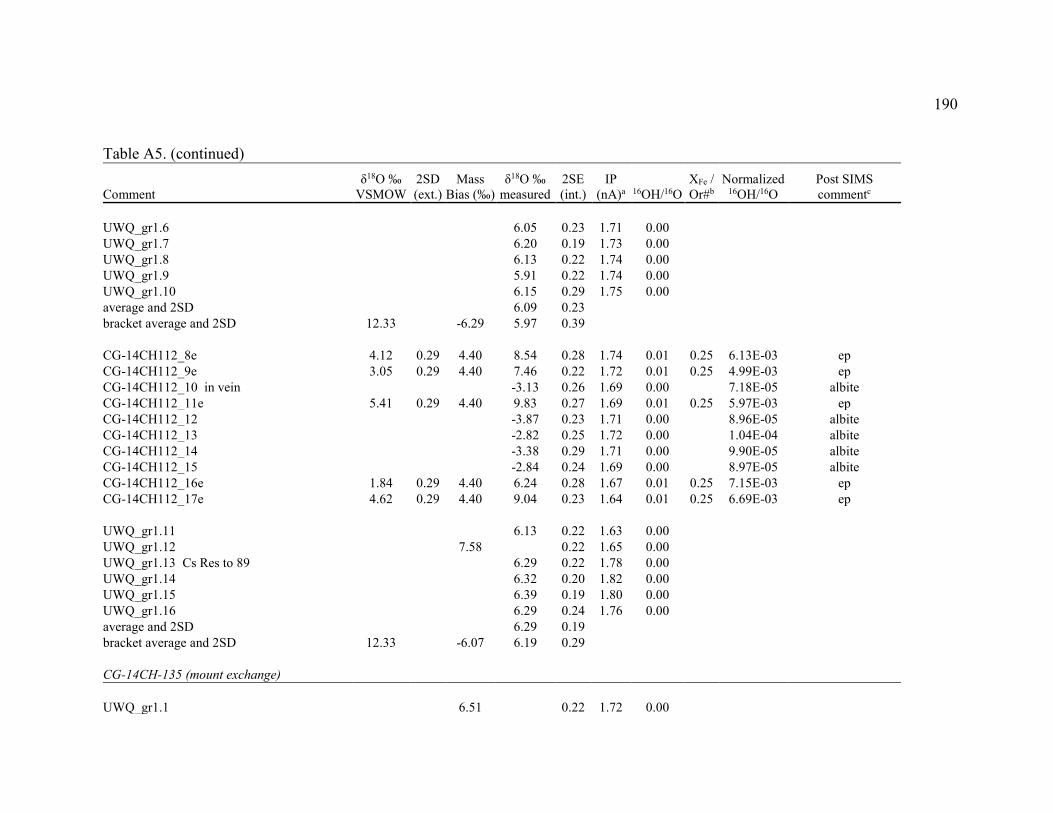
190
Table A5. (continued)
Comment δ18O ‰
VSMOW 2SD (ext.)
Mass Bias (‰)
δ18O ‰ measured
2SE (int.)
IP (nA)a 16OH/16O
XFe / Or#b
Normalized 16OH/16O
Post SIMS commentc
UWQ_gr1.6
6.05 0.23 1.71 0.00 UWQ_gr1.7
6.20 0.19 1.73 0.00
UWQ_gr1.8
6.13 0.22 1.74 0.00 UWQ_gr1.9
5.91 0.22 1.74 0.00
UWQ_gr1.10
6.15 0.29 1.75 0.00 average and 2SD
6.09 0.23
bracket average and 2SD 12.33
-6.29 5.97 0.39
CG-14CH112_8e 4.12 0.29 4.40 8.54 0.28 1.74 0.01 0.25 6.13E-03 ep CG-14CH112_9e 3.05 0.29 4.40 7.46 0.22 1.72 0.01 0.25 4.99E-03 ep CG-14CH112_10 in vein
-3.13 0.26 1.69 0.00
7.18E-05 albite
CG-14CH112_11e 5.41 0.29 4.40 9.83 0.27 1.69 0.01 0.25 5.97E-03 ep CG-14CH112_12
-3.87 0.23 1.71 0.00
8.96E-05 albite
CG-14CH112_13
-2.82 0.25 1.72 0.00
1.04E-04 albite CG-14CH112_14
-3.38 0.29 1.71 0.00
9.90E-05 albite
CG-14CH112_15
-2.84 0.24 1.69 0.00
8.97E-05 albite CG-14CH112_16e 1.84 0.29 4.40 6.24 0.28 1.67 0.01 0.25 7.15E-03 ep CG-14CH112_17e 4.62 0.29 4.40 9.04 0.23 1.64 0.01 0.25 6.69E-03 ep
UWQ_gr1.11
6.13 0.22 1.63 0.00 UWQ_gr1.12
7.58
0.22 1.65 0.00
UWQ_gr1.13 Cs Res to 89
6.29 0.22 1.78 0.00 UWQ_gr1.14
6.32 0.20 1.82 0.00
UWQ_gr1.15
6.39 0.19 1.80 0.00 UWQ_gr1.16
6.29 0.24 1.76 0.00
average and 2SD
6.29 0.19 bracket average and 2SD 12.33
-6.07 6.19 0.29
CG-14CH-135 (mount exchange)
UWQ_gr1.1
6.51
0.22 1.72 0.00
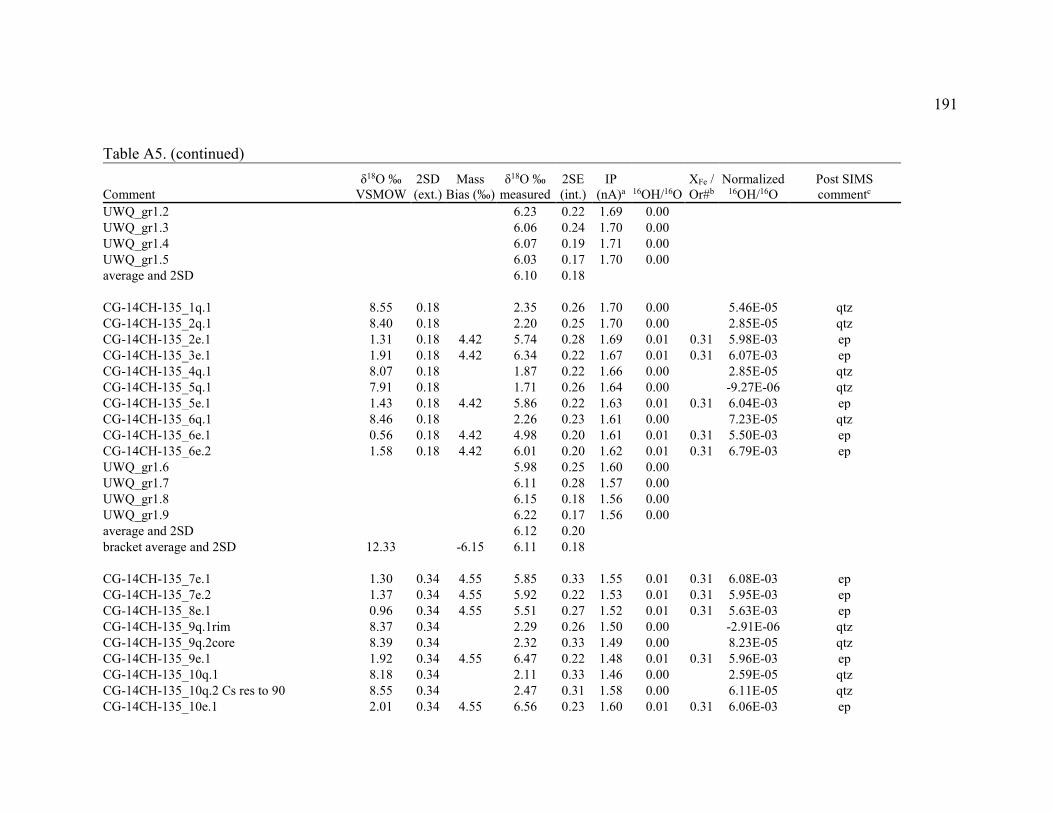
191
Table A5. (continued)
Comment δ18O ‰
VSMOW 2SD (ext.)
Mass Bias (‰)
δ18O ‰ measured
2SE (int.)
IP (nA)a 16OH/16O
XFe / Or#b
Normalized 16OH/16O
Post SIMS commentc
UWQ_gr1.2
6.23 0.22 1.69 0.00 UWQ_gr1.3
6.06 0.24 1.70 0.00
UWQ_gr1.4
6.07 0.19 1.71 0.00 UWQ_gr1.5
6.03 0.17 1.70 0.00
average and 2SD
6.10 0.18
CG-14CH-135_1q.1 8.55 0.18
2.35 0.26 1.70 0.00
5.46E-05 qtz CG-14CH-135_2q.1 8.40 0.18
2.20 0.25 1.70 0.00
2.85E-05 qtz
CG-14CH-135_2e.1 1.31 0.18 4.42 5.74 0.28 1.69 0.01 0.31 5.98E-03 ep CG-14CH-135_3e.1 1.91 0.18 4.42 6.34 0.22 1.67 0.01 0.31 6.07E-03 ep CG-14CH-135_4q.1 8.07 0.18
1.87 0.22 1.66 0.00
2.85E-05 qtz
CG-14CH-135_5q.1 7.91 0.18
1.71 0.26 1.64 0.00
-9.27E-06 qtz CG-14CH-135_5e.1 1.43 0.18 4.42 5.86 0.22 1.63 0.01 0.31 6.04E-03 ep CG-14CH-135_6q.1 8.46 0.18
2.26 0.23 1.61 0.00
7.23E-05 qtz
CG-14CH-135_6e.1 0.56 0.18 4.42 4.98 0.20 1.61 0.01 0.31 5.50E-03 ep CG-14CH-135_6e.2 1.58 0.18 4.42 6.01 0.20 1.62 0.01 0.31 6.79E-03 ep UWQ_gr1.6
5.98 0.25 1.60 0.00
UWQ_gr1.7
6.11 0.28 1.57 0.00 UWQ_gr1.8
6.15 0.18 1.56 0.00
UWQ_gr1.9
6.22 0.17 1.56 0.00 average and 2SD
6.12 0.20
bracket average and 2SD 12.33
-6.15 6.11 0.18
CG-14CH-135_7e.1 1.30 0.34 4.55 5.85 0.33 1.55 0.01 0.31 6.08E-03 ep CG-14CH-135_7e.2 1.37 0.34 4.55 5.92 0.22 1.53 0.01 0.31 5.95E-03 ep CG-14CH-135_8e.1 0.96 0.34 4.55 5.51 0.27 1.52 0.01 0.31 5.63E-03 ep CG-14CH-135_9q.1rim 8.37 0.34
2.29 0.26 1.50 0.00
-2.91E-06 qtz
CG-14CH-135_9q.2core 8.39 0.34
2.32 0.33 1.49 0.00
8.23E-05 qtz CG-14CH-135_9e.1 1.92 0.34 4.55 6.47 0.22 1.48 0.01 0.31 5.96E-03 ep CG-14CH-135_10q.1 8.18 0.34
2.11 0.33 1.46 0.00
2.59E-05 qtz
CG-14CH-135_10q.2 Cs res to 90 8.55 0.34
2.47 0.31 1.58 0.00
6.11E-05 qtz CG-14CH-135_10e.1 2.01 0.34 4.55 6.56 0.23 1.60 0.01 0.31 6.06E-03 ep
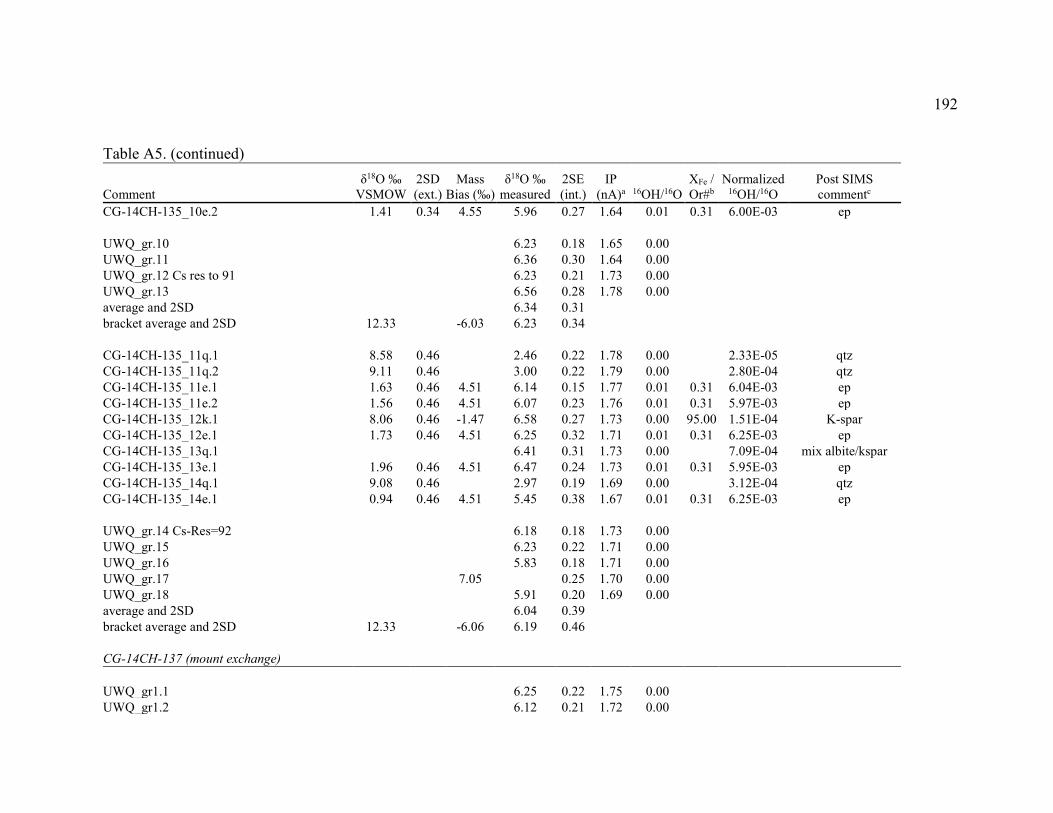
192
Table A5. (continued)
Comment δ18O ‰
VSMOW 2SD (ext.)
Mass Bias (‰)
δ18O ‰ measured
2SE (int.)
IP (nA)a 16OH/16O
XFe / Or#b
Normalized 16OH/16O
Post SIMS commentc
CG-14CH-135_10e.2 1.41 0.34 4.55 5.96 0.27 1.64 0.01 0.31 6.00E-03 ep
UWQ_gr.10
6.23 0.18 1.65 0.00 UWQ_gr.11
6.36 0.30 1.64 0.00
UWQ_gr.12 Cs res to 91
6.23 0.21 1.73 0.00 UWQ_gr.13
6.56 0.28 1.78 0.00
average and 2SD
6.34 0.31 bracket average and 2SD 12.33
-6.03 6.23 0.34
CG-14CH-135_11q.1 8.58 0.46
2.46 0.22 1.78 0.00
2.33E-05 qtz
CG-14CH-135_11q.2 9.11 0.46
3.00 0.22 1.79 0.00
2.80E-04 qtz CG-14CH-135_11e.1 1.63 0.46 4.51 6.14 0.15 1.77 0.01 0.31 6.04E-03 ep CG-14CH-135_11e.2 1.56 0.46 4.51 6.07 0.23 1.76 0.01 0.31 5.97E-03 ep CG-14CH-135_12k.1 8.06 0.46 -1.47 6.58 0.27 1.73 0.00 95.00 1.51E-04 K-spar CG-14CH-135_12e.1 1.73 0.46 4.51 6.25 0.32 1.71 0.01 0.31 6.25E-03 ep CG-14CH-135_13q.1
6.41 0.31 1.73 0.00
7.09E-04 mix albite/kspar
CG-14CH-135_13e.1 1.96 0.46 4.51 6.47 0.24 1.73 0.01 0.31 5.95E-03 ep CG-14CH-135_14q.1 9.08 0.46
2.97 0.19 1.69 0.00
3.12E-04 qtz
CG-14CH-135_14e.1 0.94 0.46 4.51 5.45 0.38 1.67 0.01 0.31 6.25E-03 ep
UWQ_gr.14 Cs-Res=92
6.18 0.18 1.73 0.00 UWQ_gr.15
6.23 0.22 1.71 0.00
UWQ_gr.16
5.83 0.18 1.71 0.00 UWQ_gr.17
7.05
0.25 1.70 0.00
UWQ_gr.18
5.91 0.20 1.69 0.00 average and 2SD
6.04 0.39
bracket average and 2SD 12.33
-6.06 6.19 0.46
CG-14CH-137 (mount exchange)
UWQ_gr1.1
6.25 0.22 1.75 0.00 UWQ_gr1.2
6.12 0.21 1.72 0.00
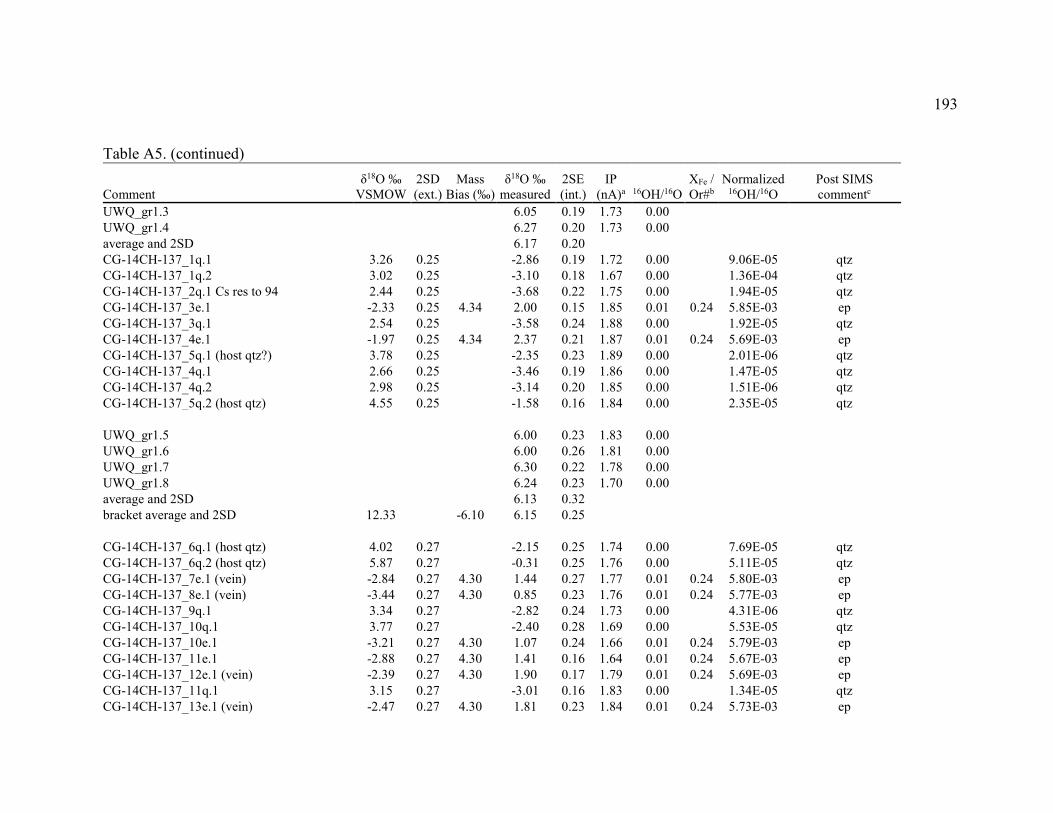
193
Table A5. (continued)
Comment δ18O ‰
VSMOW 2SD (ext.)
Mass Bias (‰)
δ18O ‰ measured
2SE (int.)
IP (nA)a 16OH/16O
XFe / Or#b
Normalized 16OH/16O
Post SIMS commentc
UWQ_gr1.3
6.05 0.19 1.73 0.00 UWQ_gr1.4
6.27 0.20 1.73 0.00
average and 2SD
6.17 0.20 CG-14CH-137_1q.1 3.26 0.25
-2.86 0.19 1.72 0.00
9.06E-05 qtz
CG-14CH-137_1q.2 3.02 0.25
-3.10 0.18 1.67 0.00
1.36E-04 qtz CG-14CH-137_2q.1 Cs res to 94 2.44 0.25
-3.68 0.22 1.75 0.00
1.94E-05 qtz
CG-14CH-137_3e.1 -2.33 0.25 4.34 2.00 0.15 1.85 0.01 0.24 5.85E-03 ep CG-14CH-137_3q.1 2.54 0.25
-3.58 0.24 1.88 0.00
1.92E-05 qtz
CG-14CH-137_4e.1 -1.97 0.25 4.34 2.37 0.21 1.87 0.01 0.24 5.69E-03 ep CG-14CH-137_5q.1 (host qtz?) 3.78 0.25
-2.35 0.23 1.89 0.00
2.01E-06 qtz
CG-14CH-137_4q.1 2.66 0.25
-3.46 0.19 1.86 0.00
1.47E-05 qtz CG-14CH-137_4q.2 2.98 0.25
-3.14 0.20 1.85 0.00
1.51E-06 qtz
CG-14CH-137_5q.2 (host qtz) 4.55 0.25
-1.58 0.16 1.84 0.00
2.35E-05 qtz
UWQ_gr1.5
6.00 0.23 1.83 0.00 UWQ_gr1.6
6.00 0.26 1.81 0.00
UWQ_gr1.7
6.30 0.22 1.78 0.00 UWQ_gr1.8
6.24 0.23 1.70 0.00
average and 2SD
6.13 0.32 bracket average and 2SD 12.33
-6.10 6.15 0.25
CG-14CH-137_6q.1 (host qtz) 4.02 0.27
-2.15 0.25 1.74 0.00
7.69E-05 qtz
CG-14CH-137_6q.2 (host qtz) 5.87 0.27
-0.31 0.25 1.76 0.00
5.11E-05 qtz CG-14CH-137_7e.1 (vein) -2.84 0.27 4.30 1.44 0.27 1.77 0.01 0.24 5.80E-03 ep CG-14CH-137_8e.1 (vein) -3.44 0.27 4.30 0.85 0.23 1.76 0.01 0.24 5.77E-03 ep CG-14CH-137_9q.1 3.34 0.27
-2.82 0.24 1.73 0.00
4.31E-06 qtz
CG-14CH-137_10q.1 3.77 0.27
-2.40 0.28 1.69 0.00
5.53E-05 qtz CG-14CH-137_10e.1 -3.21 0.27 4.30 1.07 0.24 1.66 0.01 0.24 5.79E-03 ep CG-14CH-137_11e.1 -2.88 0.27 4.30 1.41 0.16 1.64 0.01 0.24 5.67E-03 ep CG-14CH-137_12e.1 (vein) -2.39 0.27 4.30 1.90 0.17 1.79 0.01 0.24 5.69E-03 ep CG-14CH-137_11q.1 3.15 0.27
-3.01 0.16 1.83 0.00
1.34E-05 qtz
CG-14CH-137_13e.1 (vein) -2.47 0.27 4.30 1.81 0.23 1.84 0.01 0.24 5.73E-03 ep
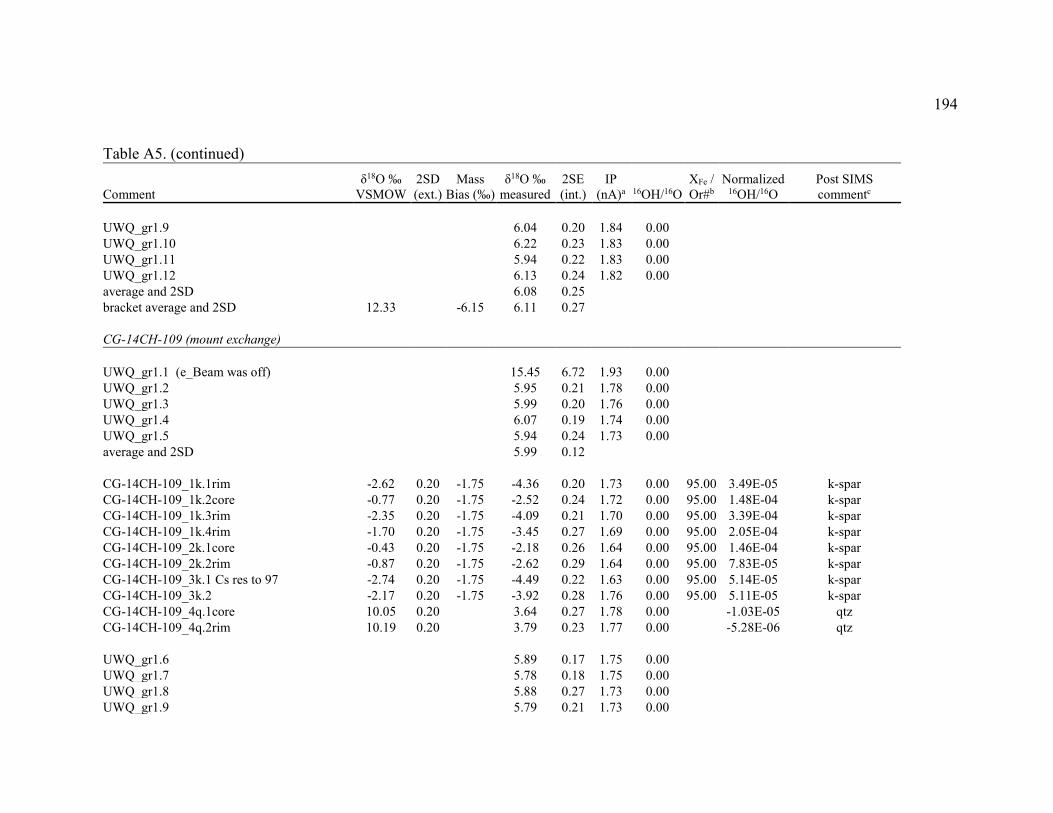
194
Table A5. (continued)
Comment δ18O ‰
VSMOW 2SD (ext.)
Mass Bias (‰)
δ18O ‰ measured
2SE (int.)
IP (nA)a 16OH/16O
XFe / Or#b
Normalized 16OH/16O
Post SIMS commentc
UWQ_gr1.9
6.04 0.20 1.84 0.00 UWQ_gr1.10
6.22 0.23 1.83 0.00
UWQ_gr1.11
5.94 0.22 1.83 0.00 UWQ_gr1.12
6.13 0.24 1.82 0.00
average and 2SD
6.08 0.25 bracket average and 2SD 12.33
-6.15 6.11 0.27
CG-14CH-109 (mount exchange)
UWQ_gr1.1 (e_Beam was off)
15.45 6.72 1.93 0.00 UWQ_gr1.2
5.95 0.21 1.78 0.00
UWQ_gr1.3
5.99 0.20 1.76 0.00 UWQ_gr1.4
6.07 0.19 1.74 0.00
UWQ_gr1.5
5.94 0.24 1.73 0.00 average and 2SD
5.99 0.12
CG-14CH-109_1k.1rim -2.62 0.20 -1.75 -4.36 0.20 1.73 0.00 95.00 3.49E-05 k-spar CG-14CH-109_1k.2core -0.77 0.20 -1.75 -2.52 0.24 1.72 0.00 95.00 1.48E-04 k-spar CG-14CH-109_1k.3rim -2.35 0.20 -1.75 -4.09 0.21 1.70 0.00 95.00 3.39E-04 k-spar CG-14CH-109_1k.4rim -1.70 0.20 -1.75 -3.45 0.27 1.69 0.00 95.00 2.05E-04 k-spar CG-14CH-109_2k.1core -0.43 0.20 -1.75 -2.18 0.26 1.64 0.00 95.00 1.46E-04 k-spar CG-14CH-109_2k.2rim -0.87 0.20 -1.75 -2.62 0.29 1.64 0.00 95.00 7.83E-05 k-spar CG-14CH-109_3k.1 Cs res to 97 -2.74 0.20 -1.75 -4.49 0.22 1.63 0.00 95.00 5.14E-05 k-spar CG-14CH-109_3k.2 -2.17 0.20 -1.75 -3.92 0.28 1.76 0.00 95.00 5.11E-05 k-spar CG-14CH-109_4q.1core 10.05 0.20
3.64 0.27 1.78 0.00
-1.03E-05 qtz
CG-14CH-109_4q.2rim 10.19 0.20
3.79 0.23 1.77 0.00
-5.28E-06 qtz
UWQ_gr1.6
5.89 0.17 1.75 0.00 UWQ_gr1.7
5.78 0.18 1.75 0.00
UWQ_gr1.8
5.88 0.27 1.73 0.00 UWQ_gr1.9
5.79 0.21 1.73 0.00
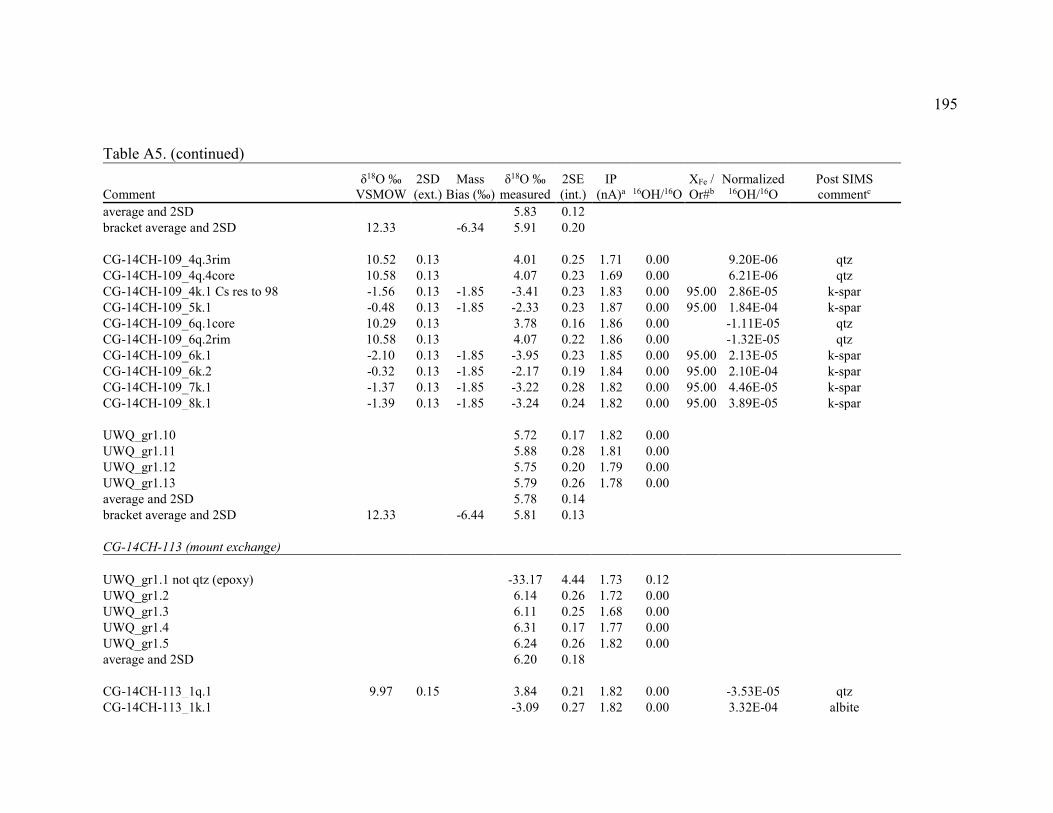
195
Table A5. (continued)
Comment δ18O ‰
VSMOW 2SD (ext.)
Mass Bias (‰)
δ18O ‰ measured
2SE (int.)
IP (nA)a 16OH/16O
XFe / Or#b
Normalized 16OH/16O
Post SIMS commentc
average and 2SD
5.83 0.12 bracket average and 2SD 12.33
-6.34 5.91 0.20
CG-14CH-109_4q.3rim 10.52 0.13
4.01 0.25 1.71 0.00
9.20E-06 qtz
CG-14CH-109_4q.4core 10.58 0.13
4.07 0.23 1.69 0.00
6.21E-06 qtz CG-14CH-109_4k.1 Cs res to 98 -1.56 0.13 -1.85 -3.41 0.23 1.83 0.00 95.00 2.86E-05 k-spar CG-14CH-109_5k.1 -0.48 0.13 -1.85 -2.33 0.23 1.87 0.00 95.00 1.84E-04 k-spar CG-14CH-109_6q.1core 10.29 0.13
3.78 0.16 1.86 0.00
-1.11E-05 qtz
CG-14CH-109_6q.2rim 10.58 0.13
4.07 0.22 1.86 0.00
-1.32E-05 qtz CG-14CH-109_6k.1 -2.10 0.13 -1.85 -3.95 0.23 1.85 0.00 95.00 2.13E-05 k-spar CG-14CH-109_6k.2 -0.32 0.13 -1.85 -2.17 0.19 1.84 0.00 95.00 2.10E-04 k-spar CG-14CH-109_7k.1 -1.37 0.13 -1.85 -3.22 0.28 1.82 0.00 95.00 4.46E-05 k-spar CG-14CH-109_8k.1 -1.39 0.13 -1.85 -3.24 0.24 1.82 0.00 95.00 3.89E-05 k-spar
UWQ_gr1.10
5.72 0.17 1.82 0.00 UWQ_gr1.11
5.88 0.28 1.81 0.00
UWQ_gr1.12
5.75 0.20 1.79 0.00 UWQ_gr1.13
5.79 0.26 1.78 0.00
average and 2SD
5.78 0.14 bracket average and 2SD 12.33
-6.44 5.81 0.13
CG-14CH-113 (mount exchange)
UWQ_gr1.1 not qtz (epoxy)
-33.17 4.44 1.73 0.12 UWQ_gr1.2
6.14 0.26 1.72 0.00
UWQ_gr1.3
6.11 0.25 1.68 0.00 UWQ_gr1.4
6.31 0.17 1.77 0.00
UWQ_gr1.5
6.24 0.26 1.82 0.00 average and 2SD
6.20 0.18
CG-14CH-113_1q.1 9.97 0.15
3.84 0.21 1.82 0.00
-3.53E-05 qtz
CG-14CH-113_1k.1
-3.09 0.27 1.82 0.00
3.32E-04 albite
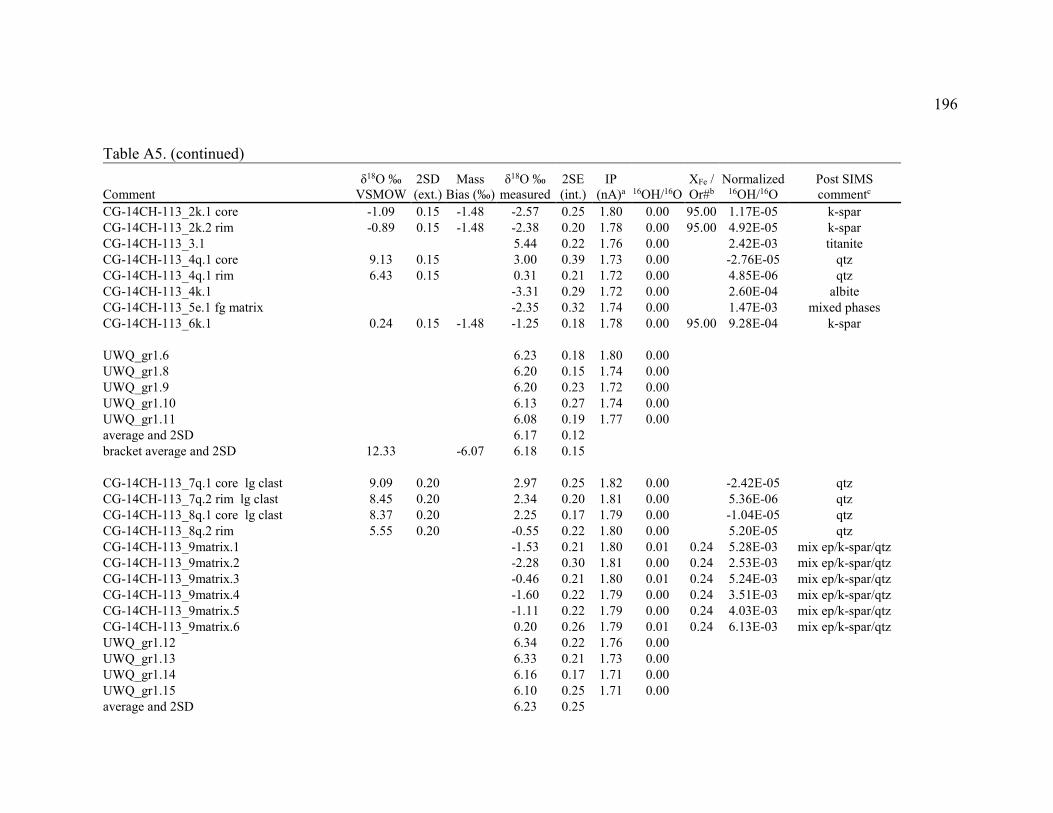
196
Table A5. (continued)
Comment δ18O ‰
VSMOW 2SD (ext.)
Mass Bias (‰)
δ18O ‰ measured
2SE (int.)
IP (nA)a 16OH/16O
XFe / Or#b
Normalized 16OH/16O
Post SIMS commentc
CG-14CH-113_2k.1 core -1.09 0.15 -1.48 -2.57 0.25 1.80 0.00 95.00 1.17E-05 k-spar CG-14CH-113_2k.2 rim -0.89 0.15 -1.48 -2.38 0.20 1.78 0.00 95.00 4.92E-05 k-spar CG-14CH-113_3.1
5.44 0.22 1.76 0.00
2.42E-03 titanite
CG-14CH-113_4q.1 core 9.13 0.15
3.00 0.39 1.73 0.00
-2.76E-05 qtz CG-14CH-113_4q.1 rim 6.43 0.15
0.31 0.21 1.72 0.00
4.85E-06 qtz
CG-14CH-113_4k.1
-3.31 0.29 1.72 0.00
2.60E-04 albite CG-14CH-113_5e.1 fg matrix
-2.35 0.32 1.74 0.00
1.47E-03 mixed phases
CG-14CH-113_6k.1 0.24 0.15 -1.48 -1.25 0.18 1.78 0.00 95.00 9.28E-04 k-spar
UWQ_gr1.6
6.23 0.18 1.80 0.00 UWQ_gr1.8
6.20 0.15 1.74 0.00
UWQ_gr1.9
6.20 0.23 1.72 0.00 UWQ_gr1.10
6.13 0.27 1.74 0.00
UWQ_gr1.11
6.08 0.19 1.77 0.00 average and 2SD
6.17 0.12
bracket average and 2SD 12.33
-6.07 6.18 0.15
CG-14CH-113_7q.1 core lg clast 9.09 0.20
2.97 0.25 1.82 0.00
-2.42E-05 qtz CG-14CH-113_7q.2 rim lg clast 8.45 0.20
2.34 0.20 1.81 0.00
5.36E-06 qtz
CG-14CH-113_8q.1 core lg clast 8.37 0.20
2.25 0.17 1.79 0.00
-1.04E-05 qtz CG-14CH-113_8q.2 rim 5.55 0.20
-0.55 0.22 1.80 0.00
5.20E-05 qtz
CG-14CH-113_9matrix.1
-1.53 0.21 1.80 0.01 0.24 5.28E-03 mix ep/k-spar/qtz CG-14CH-113_9matrix.2
-2.28 0.30 1.81 0.00 0.24 2.53E-03 mix ep/k-spar/qtz
CG-14CH-113_9matrix.3
-0.46 0.21 1.80 0.01 0.24 5.24E-03 mix ep/k-spar/qtz CG-14CH-113_9matrix.4
-1.60 0.22 1.79 0.00 0.24 3.51E-03 mix ep/k-spar/qtz
CG-14CH-113_9matrix.5
-1.11 0.22 1.79 0.00 0.24 4.03E-03 mix ep/k-spar/qtz CG-14CH-113_9matrix.6
0.20 0.26 1.79 0.01 0.24 6.13E-03 mix ep/k-spar/qtz
UWQ_gr1.12
6.34 0.22 1.76 0.00 UWQ_gr1.13
6.33 0.21 1.73 0.00
UWQ_gr1.14
6.16 0.17 1.71 0.00 UWQ_gr1.15
6.10 0.25 1.71 0.00
average and 2SD
6.23 0.25
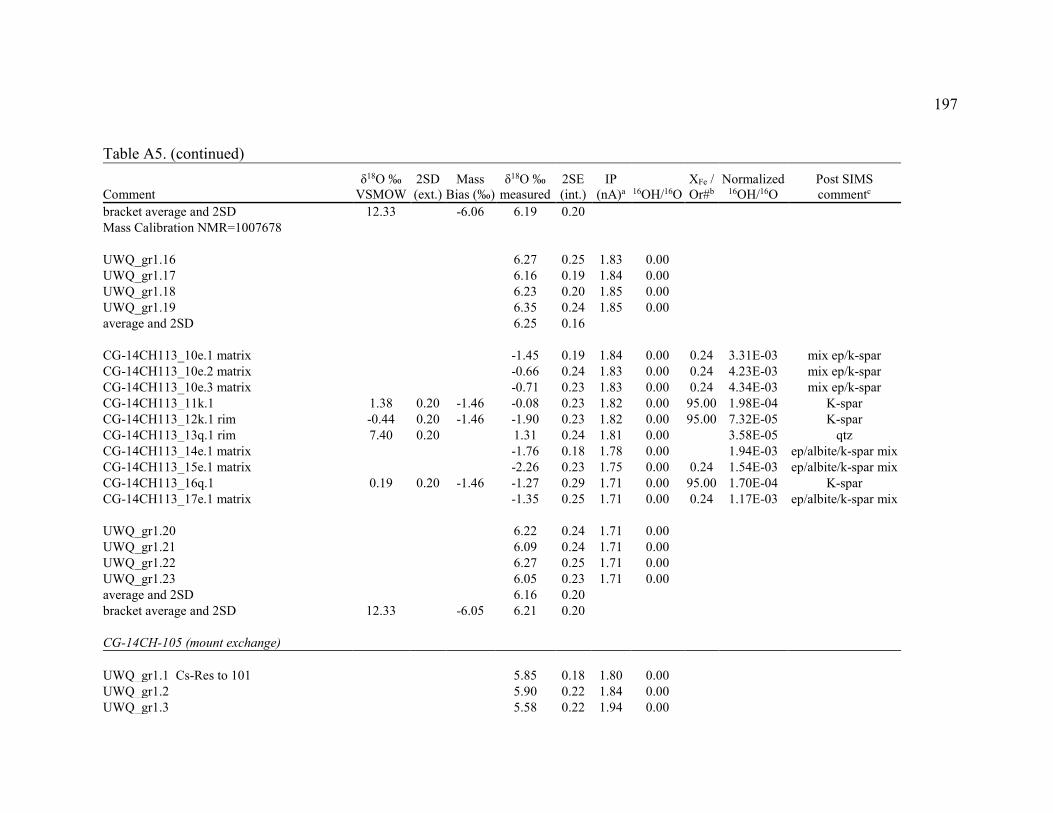
197
Table A5. (continued)
Comment δ18O ‰
VSMOW 2SD (ext.)
Mass Bias (‰)
δ18O ‰ measured
2SE (int.)
IP (nA)a 16OH/16O
XFe / Or#b
Normalized 16OH/16O
Post SIMS commentc
bracket average and 2SD 12.33
-6.06 6.19 0.20 Mass Calibration NMR=1007678
UWQ_gr1.16
6.27 0.25 1.83 0.00
UWQ_gr1.17
6.16 0.19 1.84 0.00 UWQ_gr1.18
6.23 0.20 1.85 0.00
UWQ_gr1.19
6.35 0.24 1.85 0.00 average and 2SD
6.25 0.16
CG-14CH113_10e.1 matrix
-1.45 0.19 1.84 0.00 0.24 3.31E-03 mix ep/k-spar
CG-14CH113_10e.2 matrix
-0.66 0.24 1.83 0.00 0.24 4.23E-03 mix ep/k-spar CG-14CH113_10e.3 matrix
-0.71 0.23 1.83 0.00 0.24 4.34E-03 mix ep/k-spar
CG-14CH113_11k.1 1.38 0.20 -1.46 -0.08 0.23 1.82 0.00 95.00 1.98E-04 K-spar CG-14CH113_12k.1 rim -0.44 0.20 -1.46 -1.90 0.23 1.82 0.00 95.00 7.32E-05 K-spar CG-14CH113_13q.1 rim 7.40 0.20
1.31 0.24 1.81 0.00
3.58E-05 qtz
CG-14CH113_14e.1 matrix
-1.76 0.18 1.78 0.00
1.94E-03 ep/albite/k-spar mix CG-14CH113_15e.1 matrix
-2.26 0.23 1.75 0.00 0.24 1.54E-03 ep/albite/k-spar mix
CG-14CH113_16q.1 0.19 0.20 -1.46 -1.27 0.29 1.71 0.00 95.00 1.70E-04 K-spar CG-14CH113_17e.1 matrix
-1.35 0.25 1.71 0.00 0.24 1.17E-03 ep/albite/k-spar mix
UWQ_gr1.20
6.22 0.24 1.71 0.00 UWQ_gr1.21
6.09 0.24 1.71 0.00
UWQ_gr1.22
6.27 0.25 1.71 0.00 UWQ_gr1.23
6.05 0.23 1.71 0.00
average and 2SD
6.16 0.20 bracket average and 2SD 12.33
-6.05 6.21 0.20
CG-14CH-105 (mount exchange)
UWQ_gr1.1 Cs-Res to 101
5.85 0.18 1.80 0.00 UWQ_gr1.2
5.90 0.22 1.84 0.00
UWQ_gr1.3
5.58 0.22 1.94 0.00
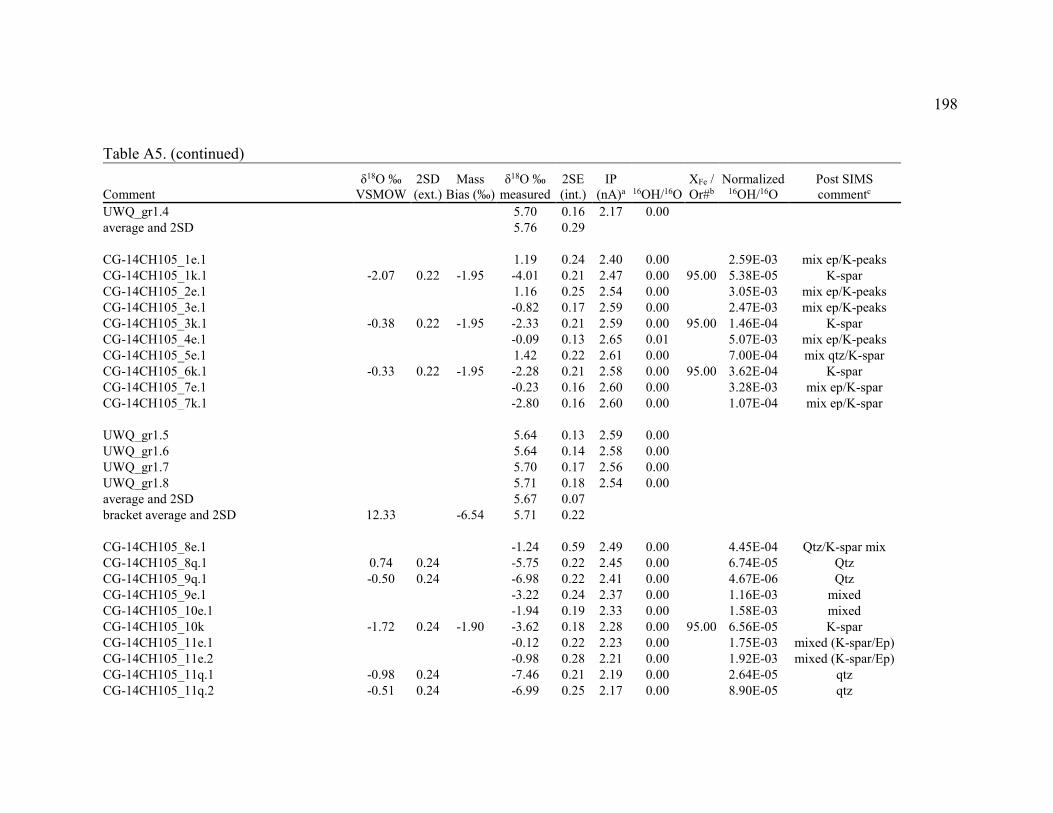
198
Table A5. (continued)
Comment δ18O ‰
VSMOW 2SD (ext.)
Mass Bias (‰)
δ18O ‰ measured
2SE (int.)
IP (nA)a 16OH/16O
XFe / Or#b
Normalized 16OH/16O
Post SIMS commentc
UWQ_gr1.4
5.70 0.16 2.17 0.00 average and 2SD
5.76 0.29
CG-14CH105_1e.1
1.19 0.24 2.40 0.00
2.59E-03 mix ep/K-peaks
CG-14CH105_1k.1 -2.07 0.22 -1.95 -4.01 0.21 2.47 0.00 95.00 5.38E-05 K-spar CG-14CH105_2e.1
1.16 0.25 2.54 0.00
3.05E-03 mix ep/K-peaks
CG-14CH105_3e.1
-0.82 0.17 2.59 0.00
2.47E-03 mix ep/K-peaks CG-14CH105_3k.1 -0.38 0.22 -1.95 -2.33 0.21 2.59 0.00 95.00 1.46E-04 K-spar CG-14CH105_4e.1
-0.09 0.13 2.65 0.01
5.07E-03 mix ep/K-peaks
CG-14CH105_5e.1
1.42 0.22 2.61 0.00
7.00E-04 mix qtz/K-spar CG-14CH105_6k.1 -0.33 0.22 -1.95 -2.28 0.21 2.58 0.00 95.00 3.62E-04 K-spar CG-14CH105_7e.1
-0.23 0.16 2.60 0.00
3.28E-03 mix ep/K-spar
CG-14CH105_7k.1
-2.80 0.16 2.60 0.00
1.07E-04 mix ep/K-spar
UWQ_gr1.5
5.64 0.13 2.59 0.00 UWQ_gr1.6
5.64 0.14 2.58 0.00
UWQ_gr1.7
5.70 0.17 2.56 0.00 UWQ_gr1.8
5.71 0.18 2.54 0.00
average and 2SD
5.67 0.07 bracket average and 2SD 12.33
-6.54 5.71 0.22
CG-14CH105_8e.1
-1.24 0.59 2.49 0.00
4.45E-04 Qtz/K-spar mix
CG-14CH105_8q.1 0.74 0.24
-5.75 0.22 2.45 0.00
6.74E-05 Qtz CG-14CH105_9q.1 -0.50 0.24
-6.98 0.22 2.41 0.00
4.67E-06 Qtz
CG-14CH105_9e.1
-3.22 0.24 2.37 0.00
1.16E-03 mixed CG-14CH105_10e.1
-1.94 0.19 2.33 0.00
1.58E-03 mixed
CG-14CH105_10k -1.72 0.24 -1.90 -3.62 0.18 2.28 0.00 95.00 6.56E-05 K-spar CG-14CH105_11e.1
-0.12 0.22 2.23 0.00
1.75E-03 mixed (K-spar/Ep)
CG-14CH105_11e.2
-0.98 0.28 2.21 0.00
1.92E-03 mixed (K-spar/Ep) CG-14CH105_11q.1 -0.98 0.24
-7.46 0.21 2.19 0.00
2.64E-05 qtz
CG-14CH105_11q.2 -0.51 0.24
-6.99 0.25 2.17 0.00
8.90E-05 qtz
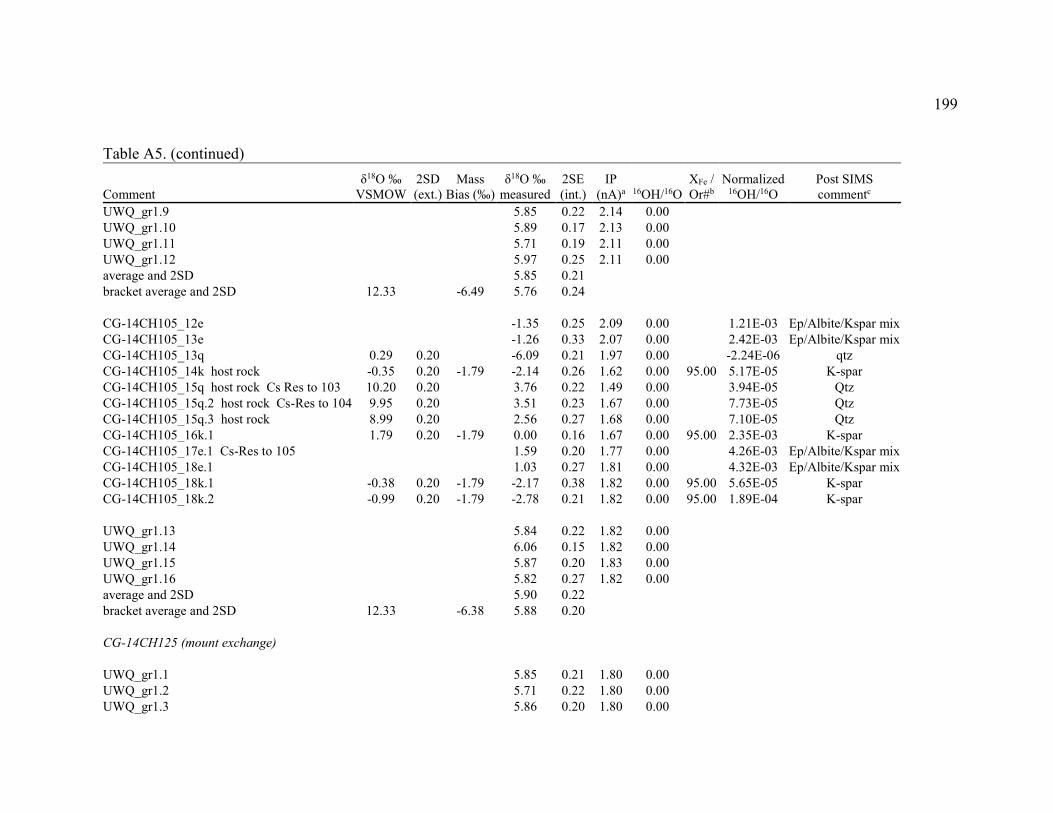
199
Table A5. (continued)
Comment δ18O ‰
VSMOW 2SD (ext.)
Mass Bias (‰)
δ18O ‰ measured
2SE (int.)
IP (nA)a 16OH/16O
XFe / Or#b
Normalized 16OH/16O
Post SIMS commentc
UWQ_gr1.9
5.85 0.22 2.14 0.00 UWQ_gr1.10
5.89 0.17 2.13 0.00
UWQ_gr1.11
5.71 0.19 2.11 0.00 UWQ_gr1.12
5.97 0.25 2.11 0.00
average and 2SD
5.85 0.21 bracket average and 2SD 12.33
-6.49 5.76 0.24
CG-14CH105_12e
-1.35 0.25 2.09 0.00
1.21E-03 Ep/Albite/Kspar mix
CG-14CH105_13e
-1.26 0.33 2.07 0.00
2.42E-03 Ep/Albite/Kspar mix CG-14CH105_13q 0.29 0.20
-6.09 0.21 1.97 0.00
-2.24E-06 qtz
CG-14CH105_14k host rock -0.35 0.20 -1.79 -2.14 0.26 1.62 0.00 95.00 5.17E-05 K-spar CG-14CH105_15q host rock Cs Res to 103 10.20 0.20
3.76 0.22 1.49 0.00
3.94E-05 Qtz
CG-14CH105_15q.2 host rock Cs-Res to 104 9.95 0.20
3.51 0.23 1.67 0.00
7.73E-05 Qtz CG-14CH105_15q.3 host rock 8.99 0.20
2.56 0.27 1.68 0.00
7.10E-05 Qtz
CG-14CH105_16k.1 1.79 0.20 -1.79 0.00 0.16 1.67 0.00 95.00 2.35E-03 K-spar CG-14CH105_17e.1 Cs-Res to 105
1.59 0.20 1.77 0.00
4.26E-03 Ep/Albite/Kspar mix
CG-14CH105_18e.1
1.03 0.27 1.81 0.00
4.32E-03 Ep/Albite/Kspar mix CG-14CH105_18k.1 -0.38 0.20 -1.79 -2.17 0.38 1.82 0.00 95.00 5.65E-05 K-spar CG-14CH105_18k.2 -0.99 0.20 -1.79 -2.78 0.21 1.82 0.00 95.00 1.89E-04 K-spar
UWQ_gr1.13
5.84 0.22 1.82 0.00 UWQ_gr1.14
6.06 0.15 1.82 0.00
UWQ_gr1.15
5.87 0.20 1.83 0.00 UWQ_gr1.16
5.82 0.27 1.82 0.00
average and 2SD
5.90 0.22 bracket average and 2SD 12.33
-6.38 5.88 0.20
CG-14CH125 (mount exchange)
UWQ_gr1.1
5.85 0.21 1.80 0.00
UWQ_gr1.2
5.71 0.22 1.80 0.00 UWQ_gr1.3
5.86 0.20 1.80 0.00
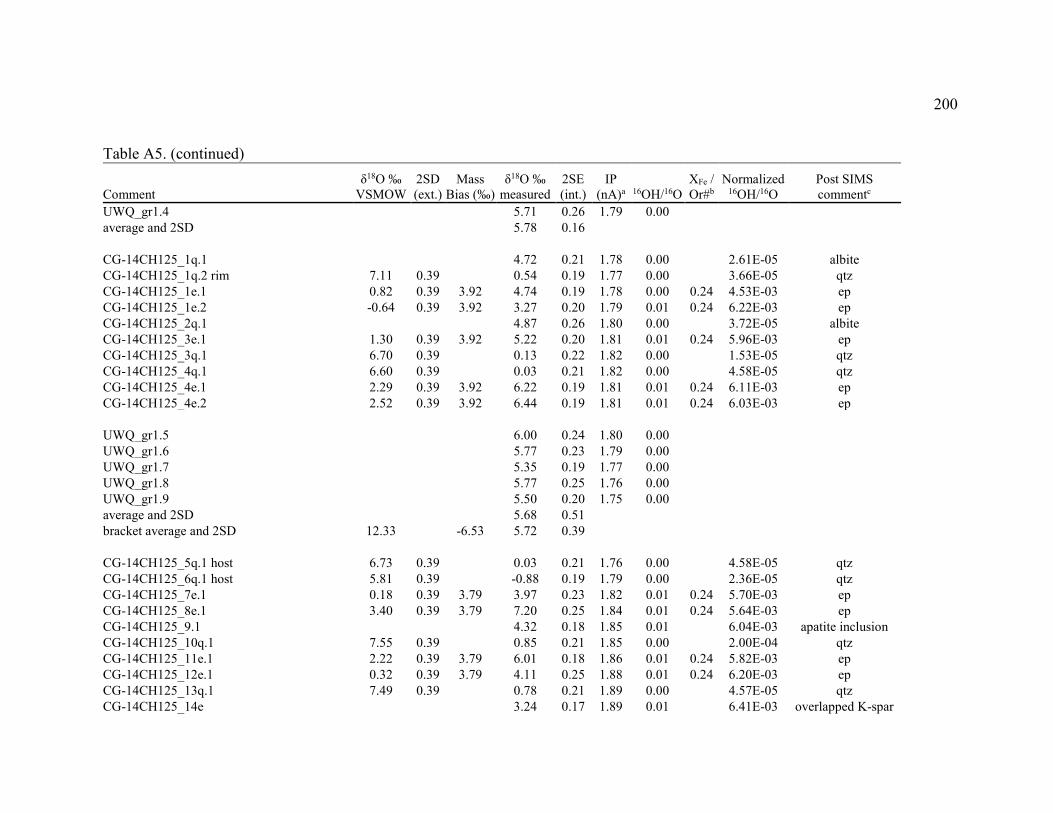
200
Table A5. (continued)
Comment δ18O ‰
VSMOW 2SD (ext.)
Mass Bias (‰)
δ18O ‰ measured
2SE (int.)
IP (nA)a 16OH/16O
XFe / Or#b
Normalized 16OH/16O
Post SIMS commentc
UWQ_gr1.4
5.71 0.26 1.79 0.00 average and 2SD
5.78 0.16
CG-14CH125_1q.1
4.72 0.21 1.78 0.00
2.61E-05 albite
CG-14CH125_1q.2 rim 7.11 0.39
0.54 0.19 1.77 0.00
3.66E-05 qtz CG-14CH125_1e.1 0.82 0.39 3.92 4.74 0.19 1.78 0.00 0.24 4.53E-03 ep CG-14CH125_1e.2 -0.64 0.39 3.92 3.27 0.20 1.79 0.01 0.24 6.22E-03 ep CG-14CH125_2q.1
4.87 0.26 1.80 0.00
3.72E-05 albite
CG-14CH125_3e.1 1.30 0.39 3.92 5.22 0.20 1.81 0.01 0.24 5.96E-03 ep CG-14CH125_3q.1 6.70 0.39
0.13 0.22 1.82 0.00
1.53E-05 qtz
CG-14CH125_4q.1 6.60 0.39
0.03 0.21 1.82 0.00
4.58E-05 qtz CG-14CH125_4e.1 2.29 0.39 3.92 6.22 0.19 1.81 0.01 0.24 6.11E-03 ep CG-14CH125_4e.2 2.52 0.39 3.92 6.44 0.19 1.81 0.01 0.24 6.03E-03 ep
UWQ_gr1.5
6.00 0.24 1.80 0.00 UWQ_gr1.6
5.77 0.23 1.79 0.00
UWQ_gr1.7
5.35 0.19 1.77 0.00 UWQ_gr1.8
5.77 0.25 1.76 0.00
UWQ_gr1.9
5.50 0.20 1.75 0.00 average and 2SD
5.68 0.51
bracket average and 2SD 12.33
-6.53 5.72 0.39
CG-14CH125_5q.1 host 6.73 0.39
0.03 0.21 1.76 0.00
4.58E-05 qtz CG-14CH125_6q.1 host 5.81 0.39
-0.88 0.19 1.79 0.00
2.36E-05 qtz
CG-14CH125_7e.1 0.18 0.39 3.79 3.97 0.23 1.82 0.01 0.24 5.70E-03 ep CG-14CH125_8e.1 3.40 0.39 3.79 7.20 0.25 1.84 0.01 0.24 5.64E-03 ep CG-14CH125_9.1
4.32 0.18 1.85 0.01
6.04E-03 apatite inclusion
CG-14CH125_10q.1 7.55 0.39
0.85 0.21 1.85 0.00
2.00E-04 qtz CG-14CH125_11e.1 2.22 0.39 3.79 6.01 0.18 1.86 0.01 0.24 5.82E-03 ep CG-14CH125_12e.1 0.32 0.39 3.79 4.11 0.25 1.88 0.01 0.24 6.20E-03 ep CG-14CH125_13q.1 7.49 0.39
0.78 0.21 1.89 0.00
4.57E-05 qtz
CG-14CH125_14e
3.24 0.17 1.89 0.01
6.41E-03 overlapped K-spar
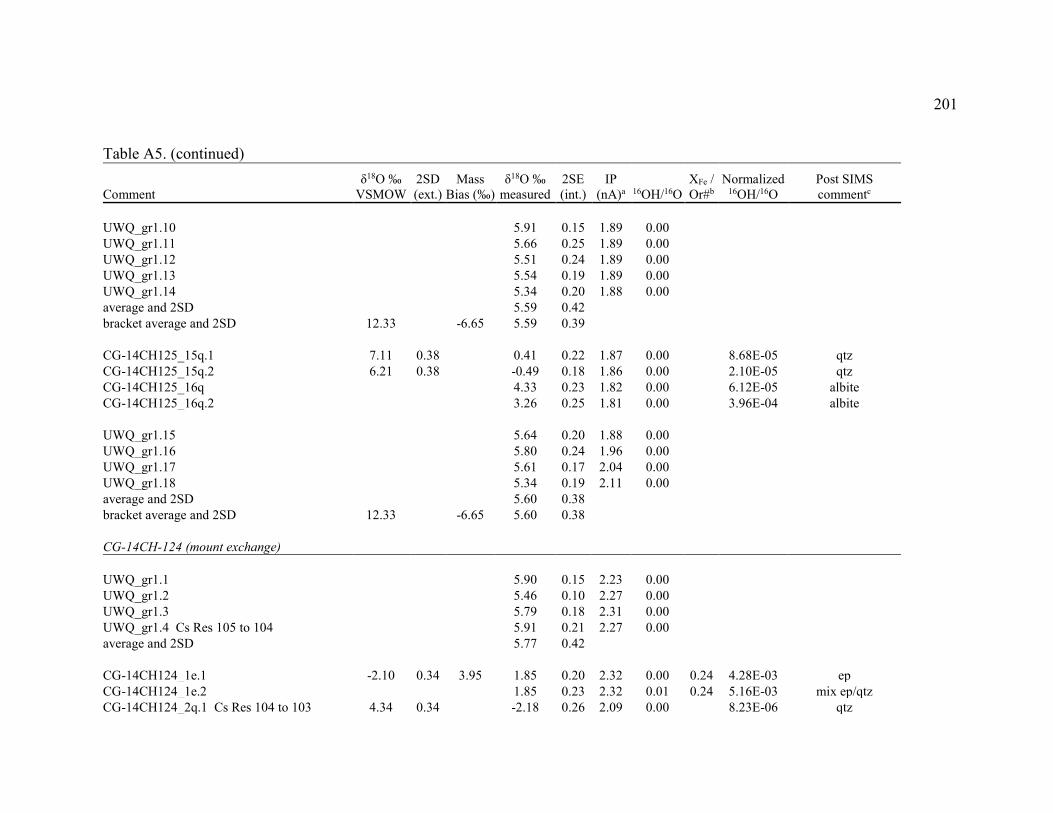
201
Table A5. (continued)
Comment δ18O ‰
VSMOW 2SD (ext.)
Mass Bias (‰)
δ18O ‰ measured
2SE (int.)
IP (nA)a 16OH/16O
XFe / Or#b
Normalized 16OH/16O
Post SIMS commentc
UWQ_gr1.10
5.91 0.15 1.89 0.00 UWQ_gr1.11
5.66 0.25 1.89 0.00
UWQ_gr1.12
5.51 0.24 1.89 0.00 UWQ_gr1.13
5.54 0.19 1.89 0.00
UWQ_gr1.14
5.34 0.20 1.88 0.00 average and 2SD
5.59 0.42
bracket average and 2SD 12.33
-6.65 5.59 0.39
CG-14CH125_15q.1 7.11 0.38
0.41 0.22 1.87 0.00
8.68E-05 qtz CG-14CH125_15q.2 6.21 0.38
-0.49 0.18 1.86 0.00
2.10E-05 qtz
CG-14CH125_16q
4.33 0.23 1.82 0.00
6.12E-05 albite CG-14CH125_16q.2
3.26 0.25 1.81 0.00
3.96E-04 albite
UWQ_gr1.15
5.64 0.20 1.88 0.00 UWQ_gr1.16
5.80 0.24 1.96 0.00
UWQ_gr1.17
5.61 0.17 2.04 0.00 UWQ_gr1.18
5.34 0.19 2.11 0.00
average and 2SD
5.60 0.38 bracket average and 2SD 12.33
-6.65 5.60 0.38
CG-14CH-124 (mount exchange)
UWQ_gr1.1
5.90 0.15 2.23 0.00 UWQ_gr1.2
5.46 0.10 2.27 0.00
UWQ_gr1.3
5.79 0.18 2.31 0.00 UWQ_gr1.4 Cs Res 105 to 104
5.91 0.21 2.27 0.00
average and 2SD
5.77 0.42
CG-14CH124_1e.1 -2.10 0.34 3.95 1.85 0.20 2.32 0.00 0.24 4.28E-03 ep CG-14CH124_1e.2
1.85 0.23 2.32 0.01 0.24 5.16E-03 mix ep/qtz
CG-14CH124_2q.1 Cs Res 104 to 103 4.34 0.34
-2.18 0.26 2.09 0.00
8.23E-06 qtz
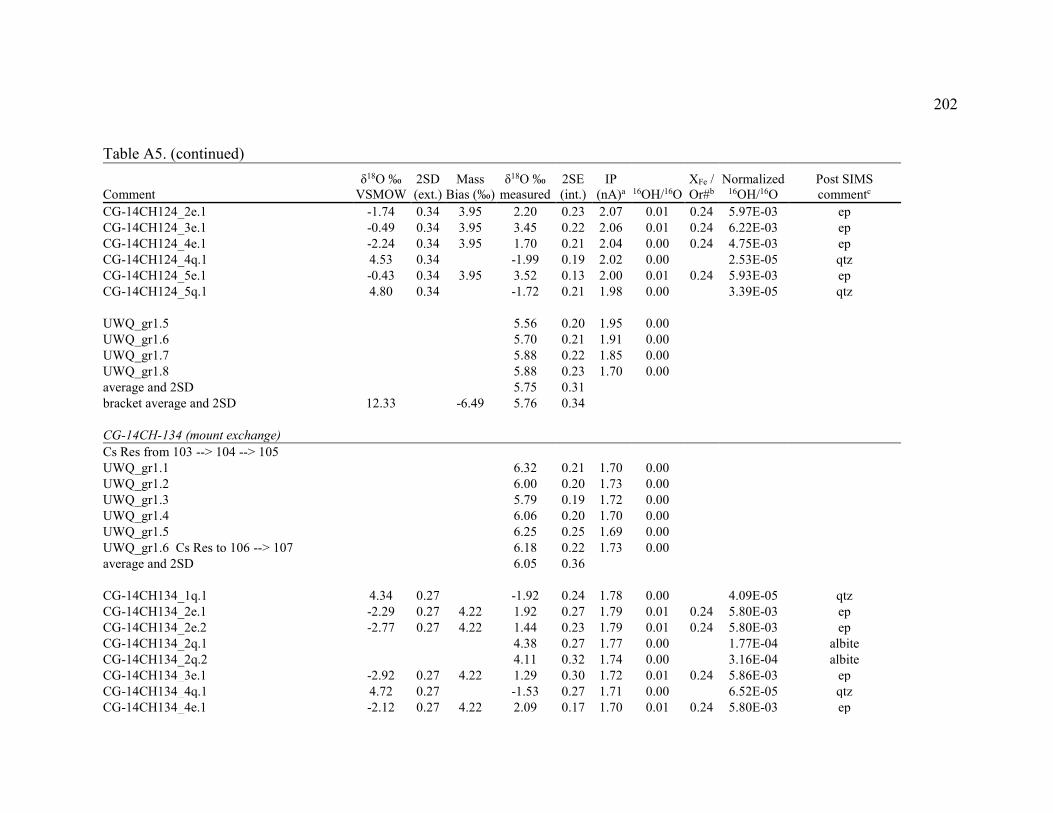
202
Table A5. (continued)
Comment δ18O ‰
VSMOW 2SD (ext.)
Mass Bias (‰)
δ18O ‰ measured
2SE (int.)
IP (nA)a 16OH/16O
XFe / Or#b
Normalized 16OH/16O
Post SIMS commentc
CG-14CH124_2e.1 -1.74 0.34 3.95 2.20 0.23 2.07 0.01 0.24 5.97E-03 ep CG-14CH124_3e.1 -0.49 0.34 3.95 3.45 0.22 2.06 0.01 0.24 6.22E-03 ep CG-14CH124_4e.1 -2.24 0.34 3.95 1.70 0.21 2.04 0.00 0.24 4.75E-03 ep CG-14CH124_4q.1 4.53 0.34
-1.99 0.19 2.02 0.00
2.53E-05 qtz
CG-14CH124_5e.1 -0.43 0.34 3.95 3.52 0.13 2.00 0.01 0.24 5.93E-03 ep CG-14CH124_5q.1 4.80 0.34
-1.72 0.21 1.98 0.00
3.39E-05 qtz
UWQ_gr1.5
5.56 0.20 1.95 0.00 UWQ_gr1.6
5.70 0.21 1.91 0.00
UWQ_gr1.7
5.88 0.22 1.85 0.00 UWQ_gr1.8
5.88 0.23 1.70 0.00
average and 2SD
5.75 0.31 bracket average and 2SD 12.33
-6.49 5.76 0.34
CG-14CH-134 (mount exchange) Cs Res from 103 --> 104 --> 105
UWQ_gr1.1
6.32 0.21 1.70 0.00 UWQ_gr1.2
6.00 0.20 1.73 0.00
UWQ_gr1.3
5.79 0.19 1.72 0.00 UWQ_gr1.4
6.06 0.20 1.70 0.00
UWQ_gr1.5
6.25 0.25 1.69 0.00 UWQ_gr1.6 Cs Res to 106 --> 107
6.18 0.22 1.73 0.00
average and 2SD
6.05 0.36
CG-14CH134_1q.1 4.34 0.27
-1.92 0.24 1.78 0.00
4.09E-05 qtz CG-14CH134_2e.1 -2.29 0.27 4.22 1.92 0.27 1.79 0.01 0.24 5.80E-03 ep CG-14CH134_2e.2 -2.77 0.27 4.22 1.44 0.23 1.79 0.01 0.24 5.80E-03 ep CG-14CH134_2q.1
4.38 0.27 1.77 0.00
1.77E-04 albite
CG-14CH134_2q.2
4.11 0.32 1.74 0.00
3.16E-04 albite CG-14CH134_3e.1 -2.92 0.27 4.22 1.29 0.30 1.72 0.01 0.24 5.86E-03 ep CG-14CH134_4q.1 4.72 0.27
-1.53 0.27 1.71 0.00
6.52E-05 qtz
CG-14CH134_4e.1 -2.12 0.27 4.22 2.09 0.17 1.70 0.01 0.24 5.80E-03 ep
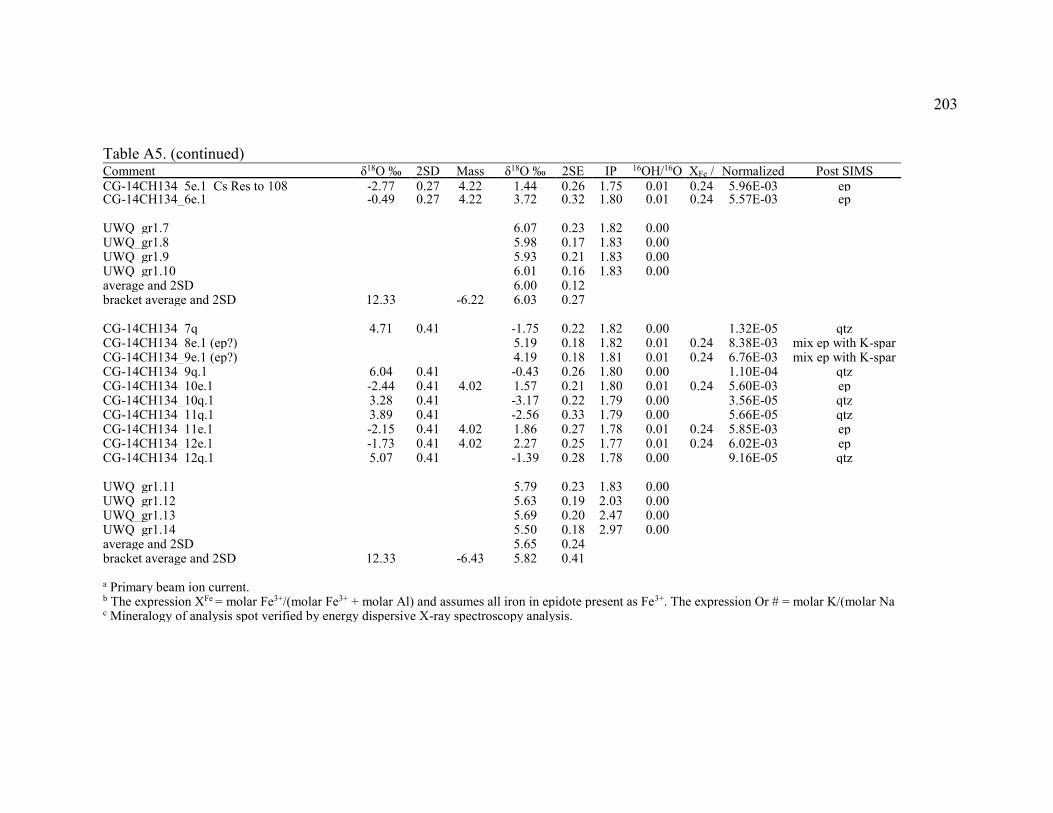
203
Table A5. (continued) Comment δ18O ‰
VSMOW 2SD (ext.)
Mass Bias (‰)
δ18O ‰ measured
2SE (int.)
IP (nA)a
16OH/16O XFe / Or#b
Normalized 16OH/16O
Post SIMS commentc CG-14CH134_5e.1 Cs Res to 108 -2.77 0.27 4.22 1.44 0.26 1.75 0.01 0.24 5.96E-03 ep
CG-14CH134_6e.1 -0.49 0.27 4.22 3.72 0.32 1.80 0.01 0.24 5.57E-03 ep
UWQ_gr1.7
6.07 0.23 1.82 0.00 UWQ_gr1.8
5.98 0.17 1.83 0.00
UWQ_gr1.9
5.93 0.21 1.83 0.00 UWQ_gr1.10
6.01 0.16 1.83 0.00
average and 2SD
6.00 0.12 bracket average and 2SD 12.33
-6.22 6.03 0.27
CG-14CH134_7q 4.71 0.41
-1.75 0.22 1.82 0.00
1.32E-05 qtz
CG-14CH134_8e.1 (ep?)
5.19 0.18 1.82 0.01 0.24 8.38E-03 mix ep with K-spar CG-14CH134_9e.1 (ep?)
4.19 0.18 1.81 0.01 0.24 6.76E-03 mix ep with K-spar
CG-14CH134_9q.1 6.04 0.41
-0.43 0.26 1.80 0.00
1.10E-04 qtz CG-14CH134_10e.1 -2.44 0.41 4.02 1.57 0.21 1.80 0.01 0.24 5.60E-03 ep CG-14CH134_10q.1 3.28 0.41
-3.17 0.22 1.79 0.00
3.56E-05 qtz
CG-14CH134_11q.1 3.89 0.41
-2.56 0.33 1.79 0.00
5.66E-05 qtz CG-14CH134_11e.1 -2.15 0.41 4.02 1.86 0.27 1.78 0.01 0.24 5.85E-03 ep CG-14CH134_12e.1 -1.73 0.41 4.02 2.27 0.25 1.77 0.01 0.24 6.02E-03 ep CG-14CH134_12q.1 5.07 0.41
-1.39 0.28 1.78 0.00
9.16E-05 qtz
UWQ_gr1.11
5.79 0.23 1.83 0.00 UWQ_gr1.12
5.63 0.19 2.03 0.00
UWQ_gr1.13
5.69 0.20 2.47 0.00 UWQ_gr1.14
5.50 0.18 2.97 0.00
average and 2SD
5.65 0.24 bracket average and 2SD 12.33
-6.43 5.82 0.41
a Primary beam ion current.
b The expression XFe = molar Fe3+/(molar Fe3+ + molar Al) and assumes all iron in epidote present as Fe3+. The expression Or # = molar K/(molar Na + molar K)*100. c Mineralogy of analysis spot verified by energy dispersive X-ray spectroscopy analysis.

!!!!!!!!!!!!!!!!!!!!!!!!!!!!!!!!!!!!!!!
!!
Thesis and Dissertation Services