Embed Size (px)
Citation preview
267
Chapter -7
Receivables Management – Analysis
7.1 Introduction
7.2 Size and Trends in Receivables
7.3 Circulation of Receivables
7.4 Debtors exceeding six months as a % of total debtors
7.5 Hypotheses Testing
7.6 Receivables Management Practices
References
268
7.1 Introduction
Receivables occupy second place, in order of investment, among the various component of
current assets in cement manufacturing companies. The main purpose of maintaining receivables
is to push up sales and ultimately profits by allowing certain credits to the potential customers
who otherwise may find it difficult to make cash purchases. Moreover, receivables being near-
cash item improve the liquidity position of an enterprise. The volume, composition and
movements of receivables are required to be designed and maintained in such a way that it
ultimately results into wealth maximization toward the shareholders. In fact, the receivables
should be managed in such a way that the sales expanded to an extent where risk remains within
the acceptable limits.
In order to evaluate and examine the receivables management performance in the cement
companies, an attempt has been made to analyze size, trend, composition, turnover ratio and
growth of receivables in the selected companies of cement industry during the study period.
Apart from this, the credit and collection polices and practices have been examined with the help
of responses of executives towards the questionnaire circulated to them.
7.2 Size and Trends in Receivables
Table 7.1.1 to table 7.1.6 comprises of the data related to size and trend of receivables in the
cement companies under the study. Sundry debtors are the part of the current assets. The level of
current asset is a key component in liquidity position of the company. Higher the level of sundry
debtor distorts the liquidity of the company. Here we talk about the overall industry’s sundry
debtors. In the 2003-04 total sundry debtor of the cement industry was nearly 64.17 crores. It
was increased at the rate of 4.10% in year 2004-05 to the 68.14 crores. In the year 2005-06 it
grows at the pace of 6.78 % and reach to 71.80 crores, so average rate of increase was around 4%
to 5.5% year on year. At the end of the 2008-09 it was reached to the 64.17 crores. The average
sundry debtor of the industry was 77.83 crores. The mean of the A C C Ltd’s sundry debtors was
230.92 crores and standard deviation of the company was 54.72 crores. So that coefficient of
variance was 23.70%. The maximum level of sundry debtors during this six year was 310.17
crores and minimum was 182.37 crores. Ambuja Cements Ltd had much lower then the average
sundry debtors. So it shows that company has faster collection cycle of debt compare to overall
cement industry. Andhra Cements Ltd. had sundry debtor much lower than the overall cement
269
industry. In the year 2003-04 it was around 14.82 crores, and it increased to 18.69 crores, Binani
Cement Ltd had 0.78 crore Sundry debtors in 2003-04 it was decrease to 0.43 in 2004-05. And
after that it reduced to 0.01 crore in 2007-08. Compare to industry average of sundry debtors
77.83 crore, If we talk about Dalmia Cement (Bharat) Ltd it had 26.15 crore of debtors in 2003-
04 and increased to 214.05 crore in 2008-09,
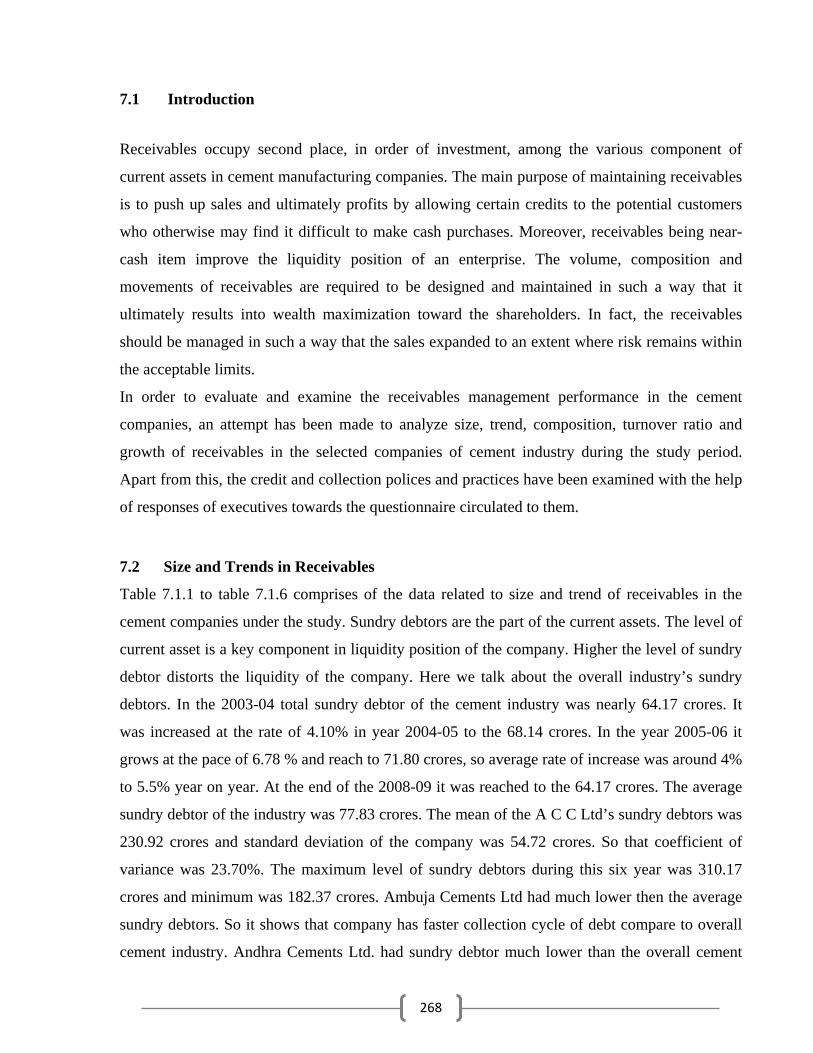
Table-7.1
Investment in Sundry Debtors (Rs. in Crores)
Sr. No. Name of Company 2003-04 2004-05 2005-06 2006-07 2007-08 2008-09
1 A C C Ltd. 182.37 190.54 199.17 213.96 289.29 310.17
2 Ambuja Cements Ltd. 45.94 42.71 45.84 89.95 145.68 224.60
3 Andhra Cements Ltd. 14.82 15.38 0.00 10.70 22.14 18.69
4 Binani Cement Ltd. 0.78 0.43 0.23 0.00 0.01 0.00
5 Birla Corporation Ltd. 29.96 56.22 22.49 27.23 31.71 20.00
6 Century Textiles & Inds. Ltd. 209.22 207.80 168.28 196.90 164.91 150.89
7 Dalmia Cement (Bharat) Ltd. 26.15 51.70 59.76 82.08 105.07 214.05
8 Gujarat Sidhee Cement Ltd. 25.70 13.89 14.03 20.07 0.00 18.95
9 Heidelberg Cement India Ltd. 21.39 27.08 18.94 16.11 12.49 19.89
10 India Cements Ltd. 145.17 183.38 240.59 260.21 311.08 353.98
11 J K Lakshmi Cement Ltd. 29.40 16.25 20.99 17.77 18.61 23.32
12 K C P Ltd. 13.69 15.35 13.38 27.88 53.31 64.08
13 Madras Cements Ltd. 42.67 45.27 49.35 65.34 61.61 89.80
14 Mangalam Cement Ltd. 5.95 4.10 8.71 3.35 5.39 5.76
15 N C L Industries Ltd. 12.99 12.97 22.28 27.58 34.84 48.10
16 O C L India Ltd. 80.79 86.75 89.18 83.10 93.61 115.88
17 Prism Cement Ltd. 26.81 18.83 12.89 14.55 3.57 0.00
18 Shree Digvijay Cement Co. Ltd. 9.56 11.66 6.28 10.75 7.82 14.25
19 Ultratech Cement Ltd. 177.57 171.95 172.55 183.50 216.61 186.18
20 AVERAGE 182.37 190.54 199.17 213.96 289.29 310.17(Source: PROWESS, CMIE Database)
270
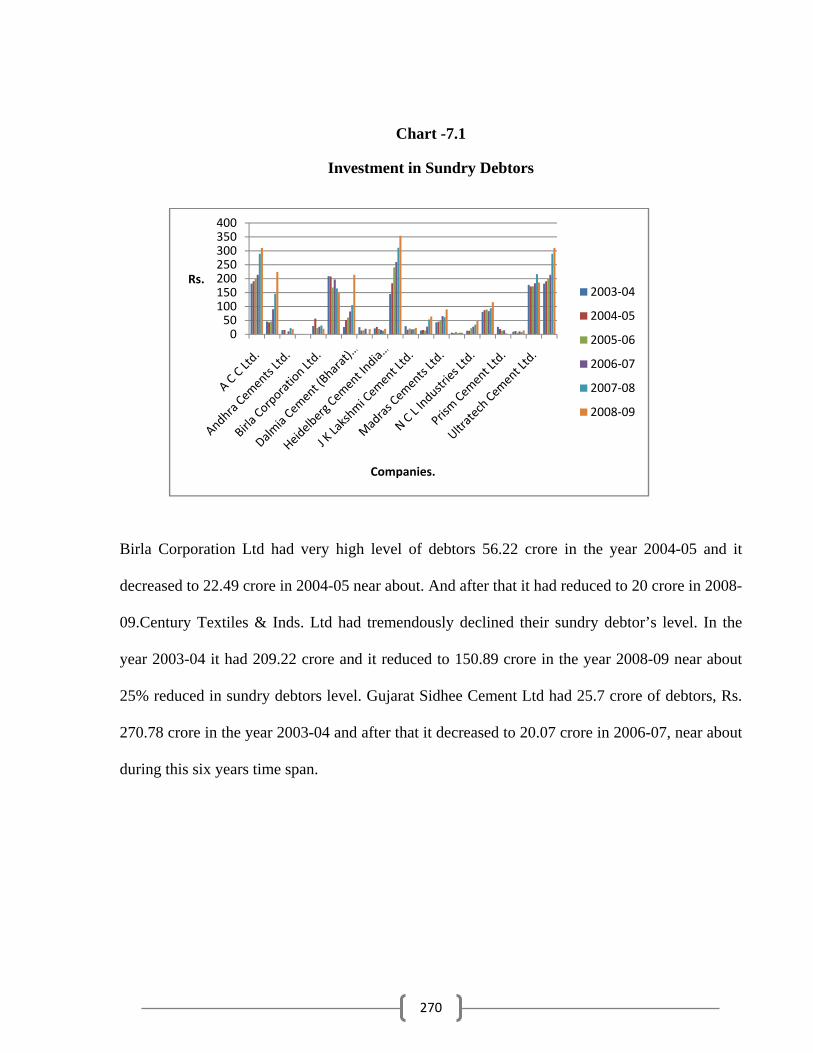
Chart -7.1
Investment in Sundry Debtors
Birla Corporation Ltd had very high level of debtors 56.22 crore in the year 2004-05 and it
decreased to 22.49 crore in 2004-05 near about. And after that it had reduced to 20 crore in 2008-
09.Century Textiles & Inds. Ltd had tremendously declined their sundry debtor’s level. In the
year 2003-04 it had 209.22 crore and it reduced to 150.89 crore in the year 2008-09 near about
25% reduced in sundry debtors level. Gujarat Sidhee Cement Ltd had 25.7 crore of debtors, Rs.
270.78 crore in the year 2003-04 and after that it decreased to 20.07 crore in 2006-07, near about
during this six years time span.
050100150200250300350400
Rs.
Companies.
2003‐04
2004‐05
2005‐06
2006‐07
2007‐08
2008‐09
271
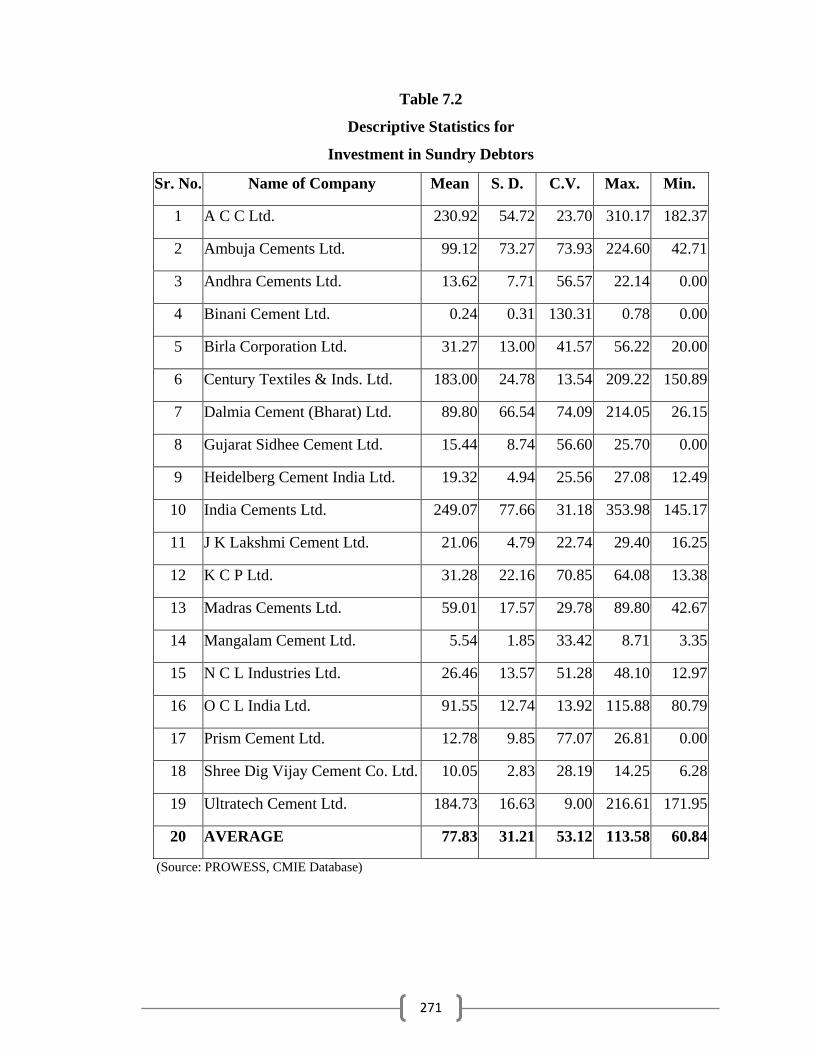
Table 7.2
Descriptive Statistics for
Investment in Sundry Debtors
Sr. No. Name of Company Mean S. D. C.V. Max. Min.
1 A C C Ltd. 230.92 54.72 23.70 310.17 182.37
2 Ambuja Cements Ltd. 99.12 73.27 73.93 224.60 42.71
3 Andhra Cements Ltd. 13.62 7.71 56.57 22.14 0.00
4 Binani Cement Ltd. 0.24 0.31 130.31 0.78 0.00
5 Birla Corporation Ltd. 31.27 13.00 41.57 56.22 20.00
6 Century Textiles & Inds. Ltd. 183.00 24.78 13.54 209.22 150.89
7 Dalmia Cement (Bharat) Ltd. 89.80 66.54 74.09 214.05 26.15
8 Gujarat Sidhee Cement Ltd. 15.44 8.74 56.60 25.70 0.00
9 Heidelberg Cement India Ltd. 19.32 4.94 25.56 27.08 12.49
10 India Cements Ltd. 249.07 77.66 31.18 353.98 145.17
11 J K Lakshmi Cement Ltd. 21.06 4.79 22.74 29.40 16.25
12 K C P Ltd. 31.28 22.16 70.85 64.08 13.38
13 Madras Cements Ltd. 59.01 17.57 29.78 89.80 42.67
14 Mangalam Cement Ltd. 5.54 1.85 33.42 8.71 3.35
15 N C L Industries Ltd. 26.46 13.57 51.28 48.10 12.97
16 O C L India Ltd. 91.55 12.74 13.92 115.88 80.79
17 Prism Cement Ltd. 12.78 9.85 77.07 26.81 0.00
18 Shree Dig Vijay Cement Co. Ltd. 10.05 2.83 28.19 14.25 6.28
19 Ultratech Cement Ltd. 184.73 16.63 9.00 216.61 171.95
20 AVERAGE 77.83 31.21 53.12 113.58 60.84
(Source: PROWESS, CMIE Database)
272
Heidelberg Cement India Ltd. had very high level of sundry debtors of 21.39 crore in the year
2003-04 and tries to maintain severely to 19.89 crore in the year 2008-09.India Cements Ltd. had
145.17 crores sundry debtors in the year 2003-04 which was much lower than the industry
average sundry debtors. It was increased to 183.38 crores in next year. After that it was increased
drastically at the rate of 42% annual compounded. J K Lakshmi Cement Ltd had 29.4 crores
sundry debtors which show that company had much lower amount of debtors, so it indicate that
company’s working capital cycle were very fast compared to other company in industry. But in
2003-04 it was increased steadily year on year and reach to 23.32 crores.K C P Ltd had sundry
debtors of 13.69 crores in 1997-2003-04, which was lower than industry average debtors. And
after that it was drastically increased to 27.88crores which shows that company had control over
collection of cash. It indicated that company’s receivable turnover ratio was increased.
Madras Cements Ltd had total sundry debtors of 45.77 crores in the year 2003-04 and company
had maintained the level of debtor around it. In the year 2008-09 it touch at the level of 89.8
crores after increasingly slowly. Mangalam Cement Ltd had 5.95 crores of level of sundry
debtors in the year 2003-04 which was lower than industry average. In last 6 year it was below
the industry average debtors. So indicate that company had good receivable turnover ratio, which
was increasing drastically over a period of time.
273
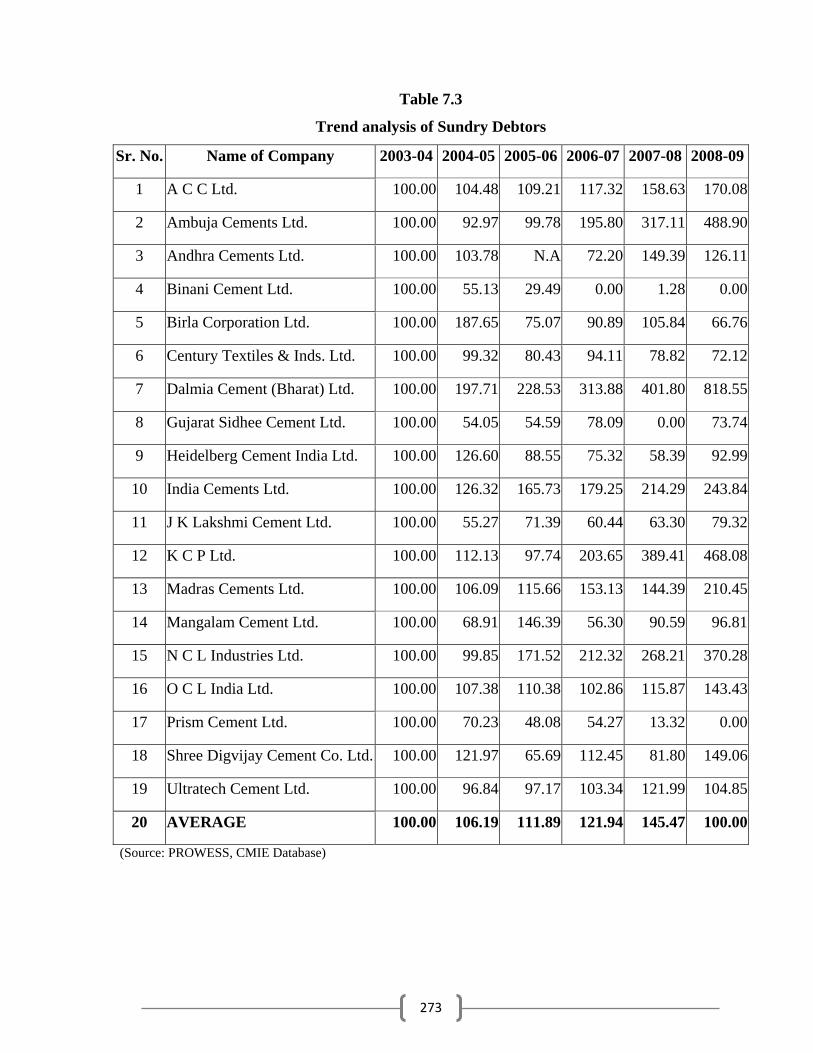
Table 7.3
Trend analysis of Sundry Debtors
Sr. No. Name of Company 2003-04 2004-05 2005-06 2006-07 2007-08 2008-09
1 A C C Ltd. 100.00 104.48 109.21 117.32 158.63 170.08
2 Ambuja Cements Ltd. 100.00 92.97 99.78 195.80 317.11 488.90
3 Andhra Cements Ltd. 100.00 103.78 N.A 72.20 149.39 126.11
4 Binani Cement Ltd. 100.00 55.13 29.49 0.00 1.28 0.00
5 Birla Corporation Ltd. 100.00 187.65 75.07 90.89 105.84 66.76
6 Century Textiles & Inds. Ltd. 100.00 99.32 80.43 94.11 78.82 72.12
7 Dalmia Cement (Bharat) Ltd. 100.00 197.71 228.53 313.88 401.80 818.55
8 Gujarat Sidhee Cement Ltd. 100.00 54.05 54.59 78.09 0.00 73.74
9 Heidelberg Cement India Ltd. 100.00 126.60 88.55 75.32 58.39 92.99
10 India Cements Ltd. 100.00 126.32 165.73 179.25 214.29 243.84
11 J K Lakshmi Cement Ltd. 100.00 55.27 71.39 60.44 63.30 79.32
12 K C P Ltd. 100.00 112.13 97.74 203.65 389.41 468.08
13 Madras Cements Ltd. 100.00 106.09 115.66 153.13 144.39 210.45
14 Mangalam Cement Ltd. 100.00 68.91 146.39 56.30 90.59 96.81
15 N C L Industries Ltd. 100.00 99.85 171.52 212.32 268.21 370.28
16 O C L India Ltd. 100.00 107.38 110.38 102.86 115.87 143.43
17 Prism Cement Ltd. 100.00 70.23 48.08 54.27 13.32 0.00
18 Shree Digvijay Cement Co. Ltd. 100.00 121.97 65.69 112.45 81.80 149.06
19 Ultratech Cement Ltd. 100.00 96.84 97.17 103.34 121.99 104.85
20 AVERAGE 100.00 106.19 111.89 121.94 145.47 100.00
(Source: PROWESS, CMIE Database)
274
N C L Industries Ltd had 12.99 crores of sundry debtors in the year 2003-04. Initially it was
decreased and after that it increased steadily to the level 48.1 crores in 2008-09.O C L India Ltd
had sundry debtors of 80.79 crores in 2003-04 and after that increased rapidly. In the year 115.88
it was one and half time of initially level, which show that company provide credit to the
customers. Prism Cement Ltd one of the company had highest level of sundry debtors in the
industry. In the year 2003-04, it was 26.81 crores of sundry debtors shows that company’s higher
portion of current assets block in the sundry debtors. After that it increased very fast in the next
year and reach to the level of 115.88 crores in the year 2008-09.Shree Digvijay Cement Co. Ltd
had 27.79 crores sundry debtors in the year 2003-04 and after that increased year over year. In
the year 2008-09 it double to the level of 14.25 crores. Ultratech Cement Ltd had 177.57 crores
sundry debtors in the year 2003-04, it was increased in the next year 2008-09 by 186.18 crores
and after that declined steadily to reach 6 crores in the year 2008-09, so it show that company’s
collection cycle moved very fast.
7.2 Circulation of Receivables
To analyze the circulations of receivables, attempt has been made to understand the behaviour of
receivable turnover ratio and receivables to current assets ratio. Table 7.2.1 depicts receivables
turnover ratio and table 7.2.3 depicts the receivables to current assets ratio for cement companies
under the study for the study period.
Receivables turnover ratio refers to sales to receivables ratio. It shows how fast company can
collect its receivables arising out of credit sales. Higher turnover ratio shows the lesser
investment in receivables and fast collections while lower turnover ratio indicates vice versa.
Cement industry on aggregate basis has receivables turnover ratio in the range of 28.7to 30.7
times during the study period.
The mean or average receivables turnover ratio is 43.90 times with 37.55% of coefficient of
variation. Most of the companies show their receivables turnover ratio around 40 t0 50 times
which is near or equal to industry average.
275
Three companies named A C C Ltd, Ambuja Cements Ltd Ambuja Cements Ltd has reported
their mean receivables turnover ratio of 20 to 30 times which is less than industry average. These
companies have outperformed because they have fastened their collections and have
comparatively high level of sales volume and lower level of receivable investment.
Binani Cement Ltd. has mean receivables turnover ratio of 20.1 times with 49.4% of coefficient
of variation. It has shown upward trend in the said ratio. In 2003-04, it was 14.7times which was
in five years and reached to 13.9 times in the year 2008-09.
Birla Corporation Ltd. has outperformed industry in the said ratio as it has declined its
receivables drastically. In 2003-04, its receivables turnover ratio was 32.7 times which decreased
and reached to 26.2 times, in the year 2008-09.
Century Textiles & Inds. Ltd also has the same upward trend in receivables turnover ratio. It has
also fastened its collections. Its receivables turnover ratio was 38.7 times in 2003-04, which
increases to 37.2 times in 37.2. Its mean receivables turnover ratio is 5 times with 9.8% of
coefficient of variations.
Dalmia Cement (Bharat) Ltd has also upward trend in the said ratio with 31.7 times of mean
value with 25% of coefficient of variations. Dalmia Cement (Bharat) Ltd’s receivables turnover
ratio is rising at very slow pace and remained in the range of 21 to 42.3 times during the study
period.
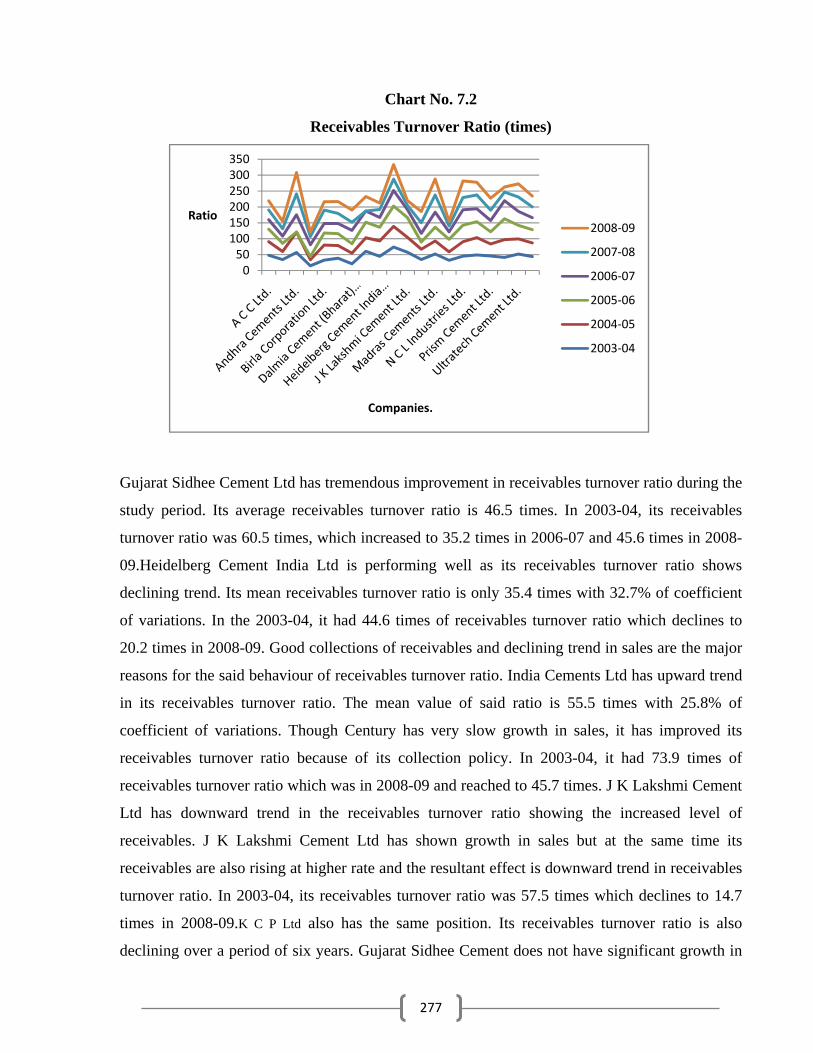
Gujarat Sidhee Cement Ltd has tremendous improvement in receivables turnover ratio during the
study period. Its average receivables turnover ratio is 46.5 times. In 2003-04, its receivables
turnover ratio was 60.5 times, which increased to 35.2 times in 2006-07 and 45.6 times in 2008-
09.
276
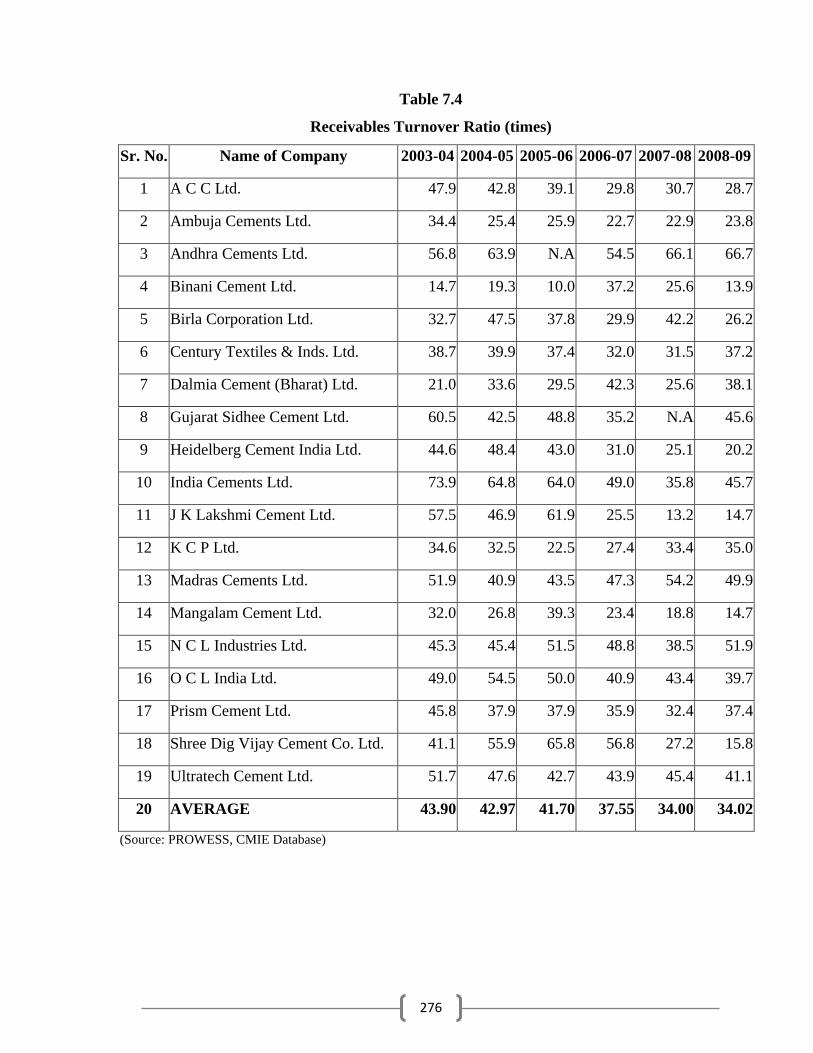
Table 7.4
Receivables Turnover Ratio (times)
Sr. No. Name of Company 2003-04 2004-05 2005-06 2006-07 2007-08 2008-09
1 A C C Ltd. 47.9 42.8 39.1 29.8 30.7 28.7
2 Ambuja Cements Ltd. 34.4 25.4 25.9 22.7 22.9 23.8
3 Andhra Cements Ltd. 56.8 63.9 N.A 54.5 66.1 66.7
4 Binani Cement Ltd. 14.7 19.3 10.0 37.2 25.6 13.9
5 Birla Corporation Ltd. 32.7 47.5 37.8 29.9 42.2 26.2
6 Century Textiles & Inds. Ltd. 38.7 39.9 37.4 32.0 31.5 37.2
7 Dalmia Cement (Bharat) Ltd. 21.0 33.6 29.5 42.3 25.6 38.1
8 Gujarat Sidhee Cement Ltd. 60.5 42.5 48.8 35.2 N.A 45.6
9 Heidelberg Cement India Ltd. 44.6 48.4 43.0 31.0 25.1 20.2
10 India Cements Ltd. 73.9 64.8 64.0 49.0 35.8 45.7
11 J K Lakshmi Cement Ltd. 57.5 46.9 61.9 25.5 13.2 14.7
12 K C P Ltd. 34.6 32.5 22.5 27.4 33.4 35.0
13 Madras Cements Ltd. 51.9 40.9 43.5 47.3 54.2 49.9
14 Mangalam Cement Ltd. 32.0 26.8 39.3 23.4 18.8 14.7
15 N C L Industries Ltd. 45.3 45.4 51.5 48.8 38.5 51.9
16 O C L India Ltd. 49.0 54.5 50.0 40.9 43.4 39.7
17 Prism Cement Ltd. 45.8 37.9 37.9 35.9 32.4 37.4
18 Shree Dig Vijay Cement Co. Ltd. 41.1 55.9 65.8 56.8 27.2 15.8
19 Ultratech Cement Ltd. 51.7 47.6 42.7 43.9 45.4 41.1
20 AVERAGE 43.90 42.97 41.70 37.55 34.00 34.02
(Source: PROWESS, CMIE Database)
277
Chart No. 7.2
Receivables Turnover Ratio (times)
Gujarat Sidhee Cement Ltd has tremendous improvement in receivables turnover ratio during the
study period. Its average receivables turnover ratio is 46.5 times. In 2003-04, its receivables
turnover ratio was 60.5 times, which increased to 35.2 times in 2006-07 and 45.6 times in 2008-
09.Heidelberg Cement India Ltd is performing well as its receivables turnover ratio shows
declining trend. Its mean receivables turnover ratio is only 35.4 times with 32.7% of coefficient
of variations. In the 2003-04, it had 44.6 times of receivables turnover ratio which declines to
20.2 times in 2008-09. Good collections of receivables and declining trend in sales are the major
reasons for the said behaviour of receivables turnover ratio. India Cements Ltd has upward trend
in its receivables turnover ratio. The mean value of said ratio is 55.5 times with 25.8% of
coefficient of variations. Though Century has very slow growth in sales, it has improved its
receivables turnover ratio because of its collection policy. In 2003-04, it had 73.9 times of
receivables turnover ratio which was in 2008-09 and reached to 45.7 times. J K Lakshmi Cement
Ltd has downward trend in the receivables turnover ratio showing the increased level of
receivables. J K Lakshmi Cement Ltd has shown growth in sales but at the same time its
receivables are also rising at higher rate and the resultant effect is downward trend in receivables
turnover ratio. In 2003-04, its receivables turnover ratio was 57.5 times which declines to 14.7
times in 2008-09.K C P Ltd also has the same position. Its receivables turnover ratio is also
declining over a period of six years. Gujarat Sidhee Cement does not have significant growth in
050100150200250300350
Ratio
Companies.
2008‐09
2007‐08
2006‐07
2005‐06
2004‐05
2003‐04
278
sales and due to its poor collection policy it has shown downward trend in receivables turnover
ratio. Its mean receivables turnover ratio is 30.9 times with 16% of coefficient of variations.
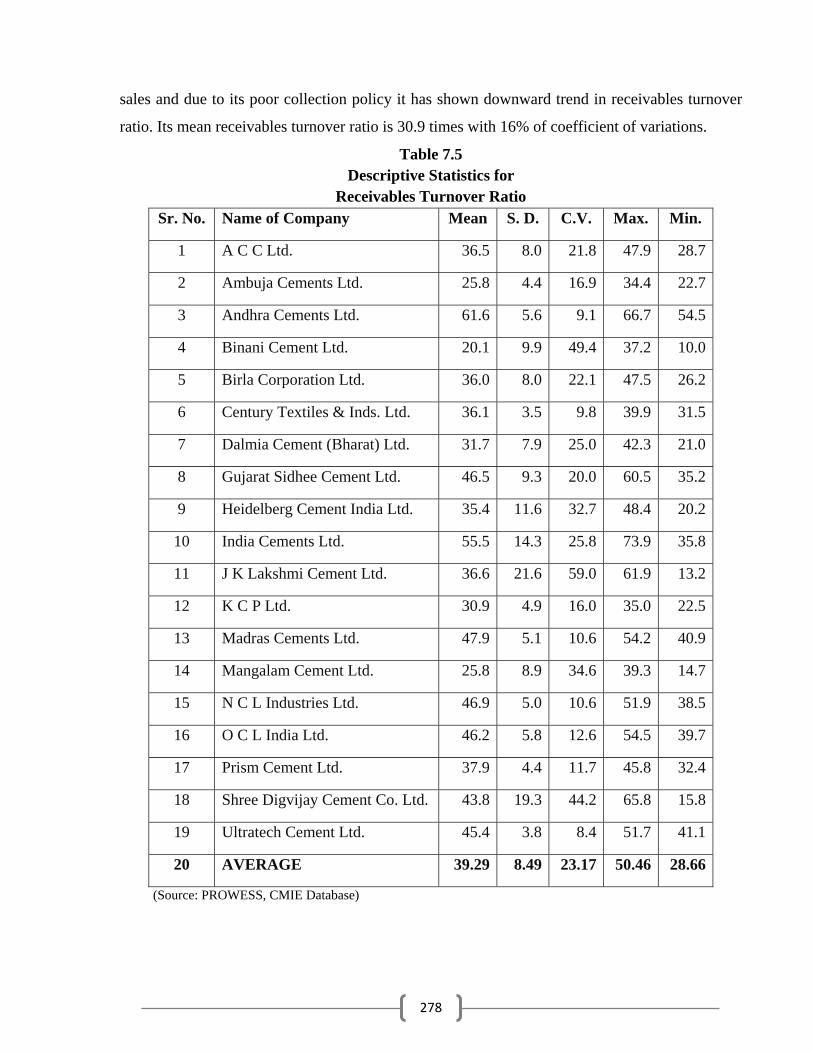
Table 7.5 Descriptive Statistics for
Receivables Turnover Ratio Sr. No. Name of Company Mean S. D. C.V. Max. Min.
1 A C C Ltd. 36.5 8.0 21.8 47.9 28.7
2 Ambuja Cements Ltd. 25.8 4.4 16.9 34.4 22.7
3 Andhra Cements Ltd. 61.6 5.6 9.1 66.7 54.5
4 Binani Cement Ltd. 20.1 9.9 49.4 37.2 10.0
5 Birla Corporation Ltd. 36.0 8.0 22.1 47.5 26.2
6 Century Textiles & Inds. Ltd. 36.1 3.5 9.8 39.9 31.5
7 Dalmia Cement (Bharat) Ltd. 31.7 7.9 25.0 42.3 21.0
8 Gujarat Sidhee Cement Ltd. 46.5 9.3 20.0 60.5 35.2
9 Heidelberg Cement India Ltd. 35.4 11.6 32.7 48.4 20.2
10 India Cements Ltd. 55.5 14.3 25.8 73.9 35.8
11 J K Lakshmi Cement Ltd. 36.6 21.6 59.0 61.9 13.2
12 K C P Ltd. 30.9 4.9 16.0 35.0 22.5
13 Madras Cements Ltd. 47.9 5.1 10.6 54.2 40.9
14 Mangalam Cement Ltd. 25.8 8.9 34.6 39.3 14.7
15 N C L Industries Ltd. 46.9 5.0 10.6 51.9 38.5
16 O C L India Ltd. 46.2 5.8 12.6 54.5 39.7
17 Prism Cement Ltd. 37.9 4.4 11.7 45.8 32.4
18 Shree Digvijay Cement Co. Ltd. 43.8 19.3 44.2 65.8 15.8
19 Ultratech Cement Ltd. 45.4 3.8 8.4 51.7 41.1
20 AVERAGE 39.29 8.49 23.17 50.46 28.66
(Source: PROWESS, CMIE Database)
279
Madras Cements Ltd. has mean receivables turnover ratio of 47.9 times only. It has declining
sales trend and due to this its receivables turnover ratio is declining. In 2003-04, it was 51.9
times, which increases to 49.9 times in 2008-09.
Mangalam Cement Ltd has not very consistent receivables turnover ratio over a period of six
years. Its mean receivables turnover ratio is 25.8 times with 34.6% of coefficient of variations.
The said ratio ranges between 14.7 to 39.3 times and showing upward trend.N C L Industries
Ltd. N C L Industries Ltd. has very good performance with respect to said ratio. It has more than
industry average ratio of receivables turnover ratio.O C L India Ltd. receivables turnover ratio
ranges between 39.7 to 54.5 times during the study period. It’s said mean ratio of 46.2 times is
more than industry average. Prism Cement Ltd has on an average 37.9 times of receivables
turnover ratio which is less than industry average of 6 times. Prism Cement Ltd has also
downward trend in the said ratio stating its loose collection policy.Shree Dig Vijay Cement Co.
Ltd has improved its receivables turnover ratio from 41.1 times in 2003-04 to 15.8 times in 2008-
09. Its mean receivables turnover ratio of 43.8 times is less than industry average. Ultratech
Cement Ltd. has also downward trend in receivables turnover ratio. In 2003-04, it was 51.7
times, which decreased to 41.1 in 2008-09 with coefficient of variations of 8.4%.Its mean
receivables turnover ratio is 45.4 times with 3.8% of standard deviations. Receivable to current
asset ratio compares the level of receivable to total current assets. Higher the ratio shows
company’s liquidity is not up to the par and company need to look after it to lower the ratio. In
the year 2003-04, over all cement industry ratio is 73.93%. It reached to its highest level of
65.78% in 2005-06 and then it starts declining. In the year 2008-09, it reached to 66.74%. The
mean receivable to current ratio for industry aggregate is 61.6% with 59% of co-efficient of
variation.
280
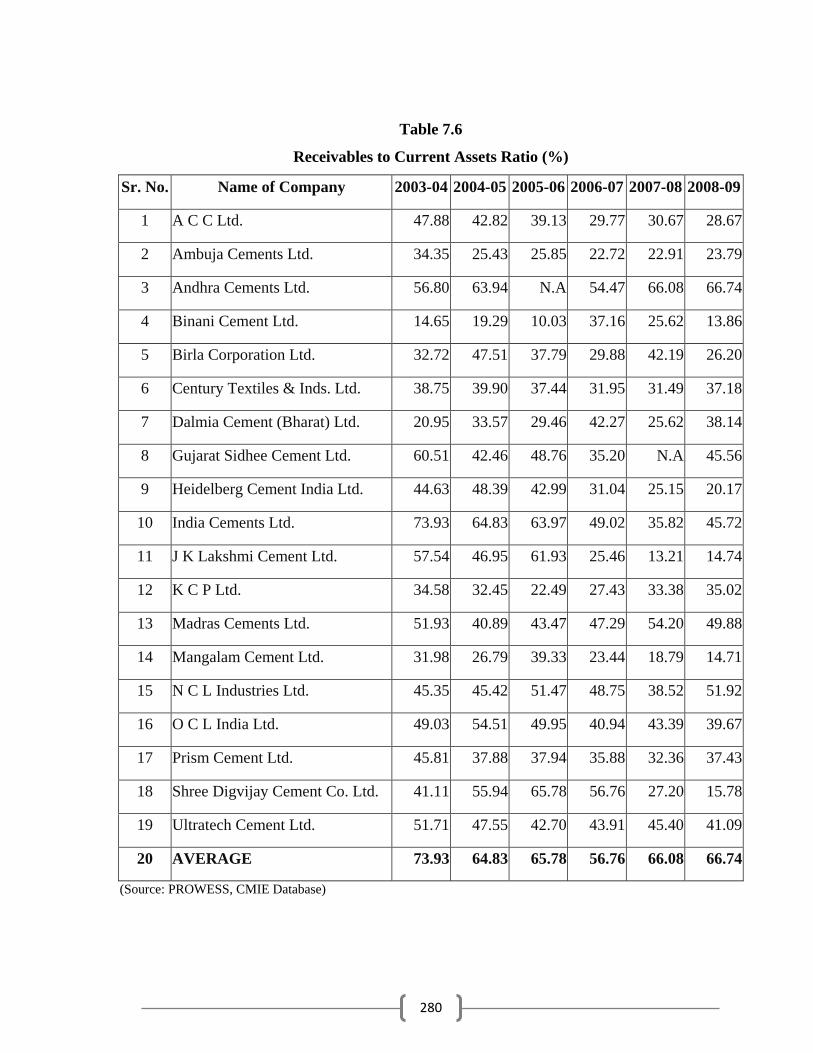
Table 7.6
Receivables to Current Assets Ratio (%)
Sr. No. Name of Company 2003-04 2004-05 2005-06 2006-07 2007-08 2008-09
1 A C C Ltd. 47.88 42.82 39.13 29.77 30.67 28.67
2 Ambuja Cements Ltd. 34.35 25.43 25.85 22.72 22.91 23.79
3 Andhra Cements Ltd. 56.80 63.94 N.A 54.47 66.08 66.74
4 Binani Cement Ltd. 14.65 19.29 10.03 37.16 25.62 13.86
5 Birla Corporation Ltd. 32.72 47.51 37.79 29.88 42.19 26.20
6 Century Textiles & Inds. Ltd. 38.75 39.90 37.44 31.95 31.49 37.18
7 Dalmia Cement (Bharat) Ltd. 20.95 33.57 29.46 42.27 25.62 38.14
8 Gujarat Sidhee Cement Ltd. 60.51 42.46 48.76 35.20 N.A 45.56
9 Heidelberg Cement India Ltd. 44.63 48.39 42.99 31.04 25.15 20.17
10 India Cements Ltd. 73.93 64.83 63.97 49.02 35.82 45.72
11 J K Lakshmi Cement Ltd. 57.54 46.95 61.93 25.46 13.21 14.74
12 K C P Ltd. 34.58 32.45 22.49 27.43 33.38 35.02
13 Madras Cements Ltd. 51.93 40.89 43.47 47.29 54.20 49.88
14 Mangalam Cement Ltd. 31.98 26.79 39.33 23.44 18.79 14.71
15 N C L Industries Ltd. 45.35 45.42 51.47 48.75 38.52 51.92
16 O C L India Ltd. 49.03 54.51 49.95 40.94 43.39 39.67
17 Prism Cement Ltd. 45.81 37.88 37.94 35.88 32.36 37.43
18 Shree Digvijay Cement Co. Ltd. 41.11 55.94 65.78 56.76 27.20 15.78
19 Ultratech Cement Ltd. 51.71 47.55 42.70 43.91 45.40 41.09
20 AVERAGE 73.93 64.83 65.78 56.76 66.08 66.74
(Source: PROWESS, CMIE Database)
281
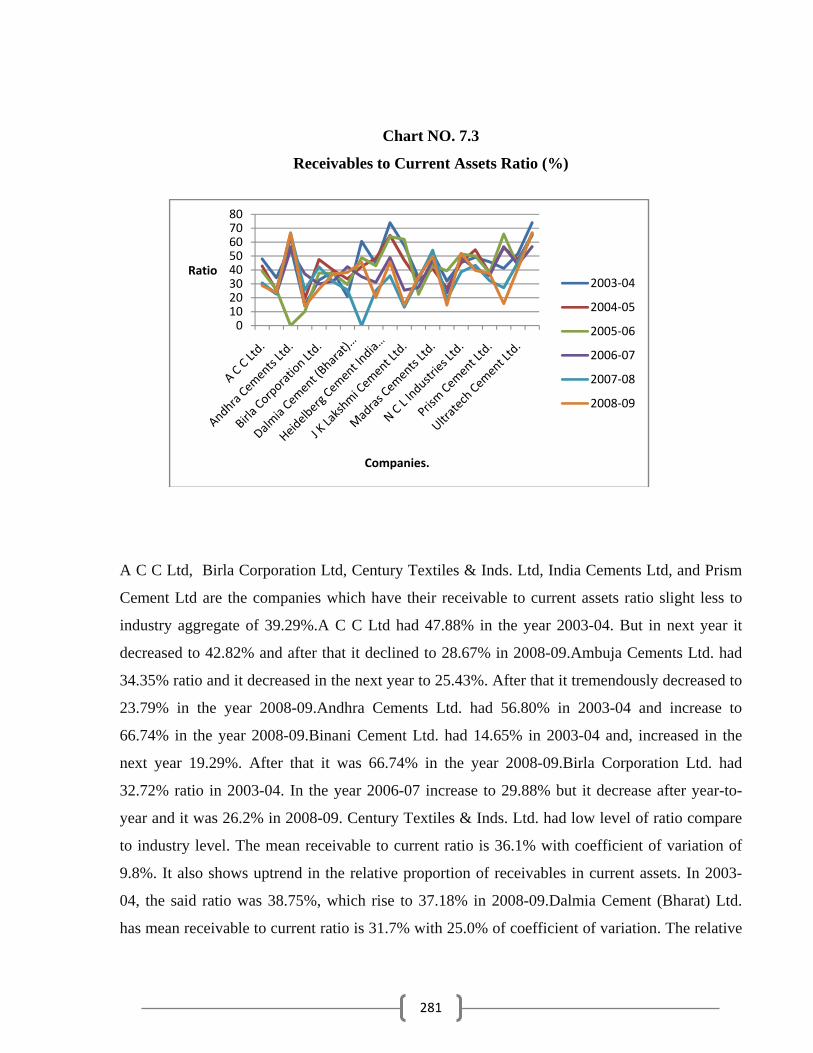
Chart NO. 7.3
Receivables to Current Assets Ratio (%)
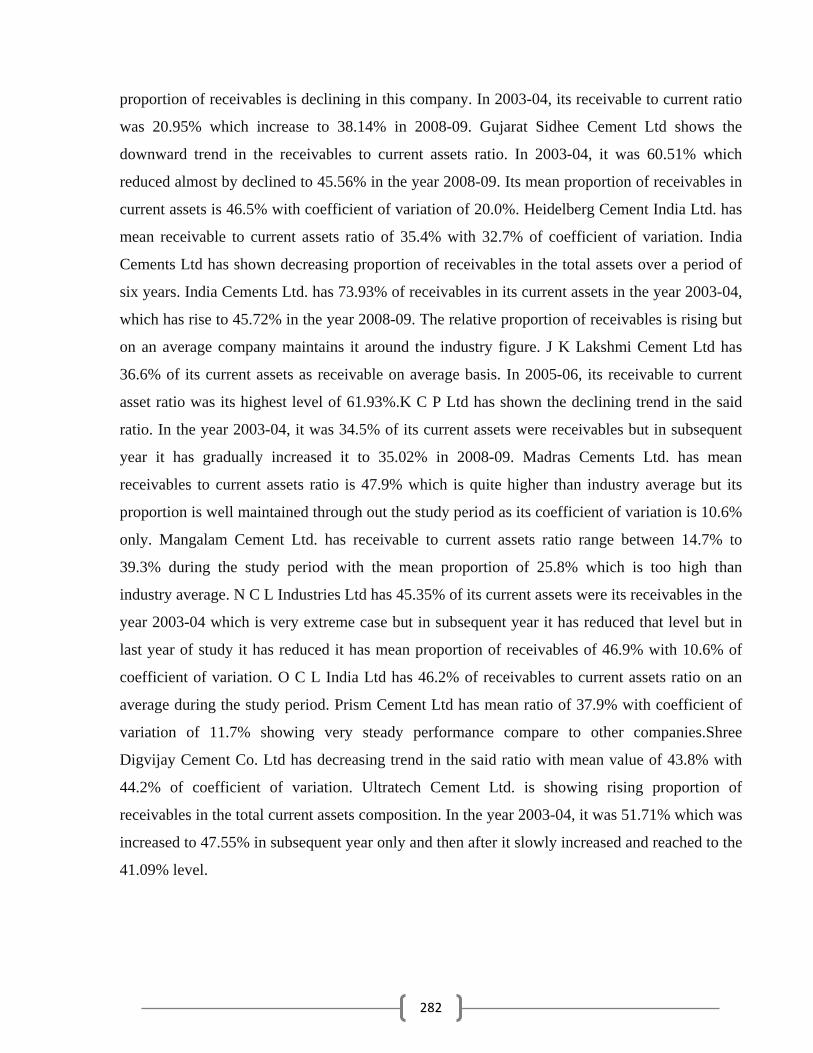
A C C Ltd, Birla Corporation Ltd, Century Textiles & Inds. Ltd, India Cements Ltd, and Prism
Cement Ltd are the companies which have their receivable to current assets ratio slight less to
industry aggregate of 39.29%.A C C Ltd had 47.88% in the year 2003-04. But in next year it
decreased to 42.82% and after that it declined to 28.67% in 2008-09.Ambuja Cements Ltd. had
34.35% ratio and it decreased in the next year to 25.43%. After that it tremendously decreased to
23.79% in the year 2008-09.Andhra Cements Ltd. had 56.80% in 2003-04 and increase to
66.74% in the year 2008-09.Binani Cement Ltd. had 14.65% in 2003-04 and, increased in the
next year 19.29%. After that it was 66.74% in the year 2008-09.Birla Corporation Ltd. had
32.72% ratio in 2003-04. In the year 2006-07 increase to 29.88% but it decrease after year-to-
year and it was 26.2% in 2008-09. Century Textiles & Inds. Ltd. had low level of ratio compare
to industry level. The mean receivable to current ratio is 36.1% with coefficient of variation of
9.8%. It also shows uptrend in the relative proportion of receivables in current assets. In 2003-
04, the said ratio was 38.75%, which rise to 37.18% in 2008-09.Dalmia Cement (Bharat) Ltd.
has mean receivable to current ratio is 31.7% with 25.0% of coefficient of variation. The relative
01020304050607080
Ratio
Companies.
2003‐04
2004‐05
2005‐06
2006‐07
2007‐08
2008‐09
282
proportion of receivables is declining in this company. In 2003-04, its receivable to current ratio
was 20.95% which increase to 38.14% in 2008-09. Gujarat Sidhee Cement Ltd shows the
downward trend in the receivables to current assets ratio. In 2003-04, it was 60.51% which
reduced almost by declined to 45.56% in the year 2008-09. Its mean proportion of receivables in
current assets is 46.5% with coefficient of variation of 20.0%. Heidelberg Cement India Ltd. has
mean receivable to current assets ratio of 35.4% with 32.7% of coefficient of variation. India
Cements Ltd has shown decreasing proportion of receivables in the total assets over a period of
six years. India Cements Ltd. has 73.93% of receivables in its current assets in the year 2003-04,
which has rise to 45.72% in the year 2008-09. The relative proportion of receivables is rising but
on an average company maintains it around the industry figure. J K Lakshmi Cement Ltd has
36.6% of its current assets as receivable on average basis. In 2005-06, its receivable to current
asset ratio was its highest level of 61.93%.K C P Ltd has shown the declining trend in the said
ratio. In the year 2003-04, it was 34.5% of its current assets were receivables but in subsequent
year it has gradually increased it to 35.02% in 2008-09. Madras Cements Ltd. has mean
receivables to current assets ratio is 47.9% which is quite higher than industry average but its
proportion is well maintained through out the study period as its coefficient of variation is 10.6%
only. Mangalam Cement Ltd. has receivable to current assets ratio range between 14.7% to
39.3% during the study period with the mean proportion of 25.8% which is too high than
industry average. N C L Industries Ltd has 45.35% of its current assets were its receivables in the
year 2003-04 which is very extreme case but in subsequent year it has reduced that level but in
last year of study it has reduced it has mean proportion of receivables of 46.9% with 10.6% of
coefficient of variation. O C L India Ltd has 46.2% of receivables to current assets ratio on an
average during the study period. Prism Cement Ltd has mean ratio of 37.9% with coefficient of
variation of 11.7% showing very steady performance compare to other companies.Shree
Digvijay Cement Co. Ltd has decreasing trend in the said ratio with mean value of 43.8% with
44.2% of coefficient of variation. Ultratech Cement Ltd. is showing rising proportion of
receivables in the total current assets composition. In the year 2003-04, it was 51.71% which was
increased to 47.55% in subsequent year only and then after it slowly increased and reached to the
41.09% level.
283
Table 7.7
Descriptive Statistics for
Receivables to Current Assets Ratio
Sr. No. Name of Company Mean S. D. C.V. Max. Min.
1 A C C Ltd. 36.5 8.0 21.8 47.9 28.7
2 Ambuja Cements Ltd. 25.8 4.4 16.9 34.4 22.7
3 Andhra Cements Ltd. 61.6 5.6 9.1 66.7 54.5
4 Binani Cement Ltd. 20.1 9.9 49.4 37.2 10.0
5 Birla Corporation Ltd. 36.0 8.0 22.1 47.5 26.2
6 Century Textiles & Inds. Ltd. 36.1 3.5 9.8 39.9 31.5
7 Dalmia Cement (Bharat) Ltd. 31.7 7.9 25.0 42.3 21.0
8 Gujarat Sidhee Cement Ltd. 46.5 9.3 20.0 60.5 35.2
9 Heidelberg Cement India Ltd. 35.4 11.6 32.7 48.4 20.2
10 India Cements Ltd. 55.5 14.3 25.8 73.9 35.8
11 J K Lakshmi Cement Ltd. 36.6 21.6 59.0 61.9 13.2
12 K C P Ltd. 30.9 4.9 16.0 35.0 22.5
13 Madras Cements Ltd. 47.9 5.1 10.6 54.2 40.9
14 Mangalam Cement Ltd. 25.8 8.9 34.6 39.3 14.7
15 N C L Industries Ltd. 46.9 5.0 10.6 51.9 38.5
16 O C L India Ltd. 46.2 5.8 12.6 54.5 39.7
17 Prism Cement Ltd. 37.9 4.4 11.7 45.8 32.4
18 Shree Digvijay Cement Co. Ltd. 43.8 19.3 44.2 65.8 15.8
19 Ultratech Cement Ltd. 45.4 3.8 8.4 51.7 41.1
20 AVERAGE 39.29 8.49 23.17 50.46 28.66
(Source: PROWESS, CMIE Database)
284
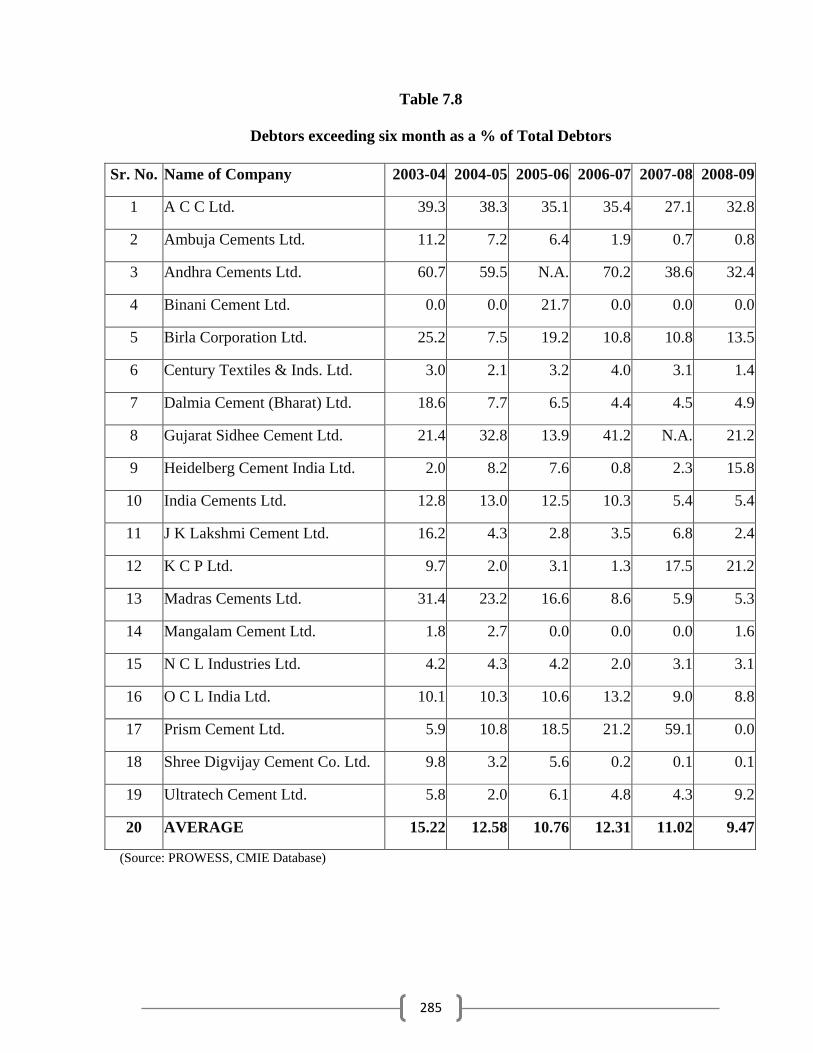
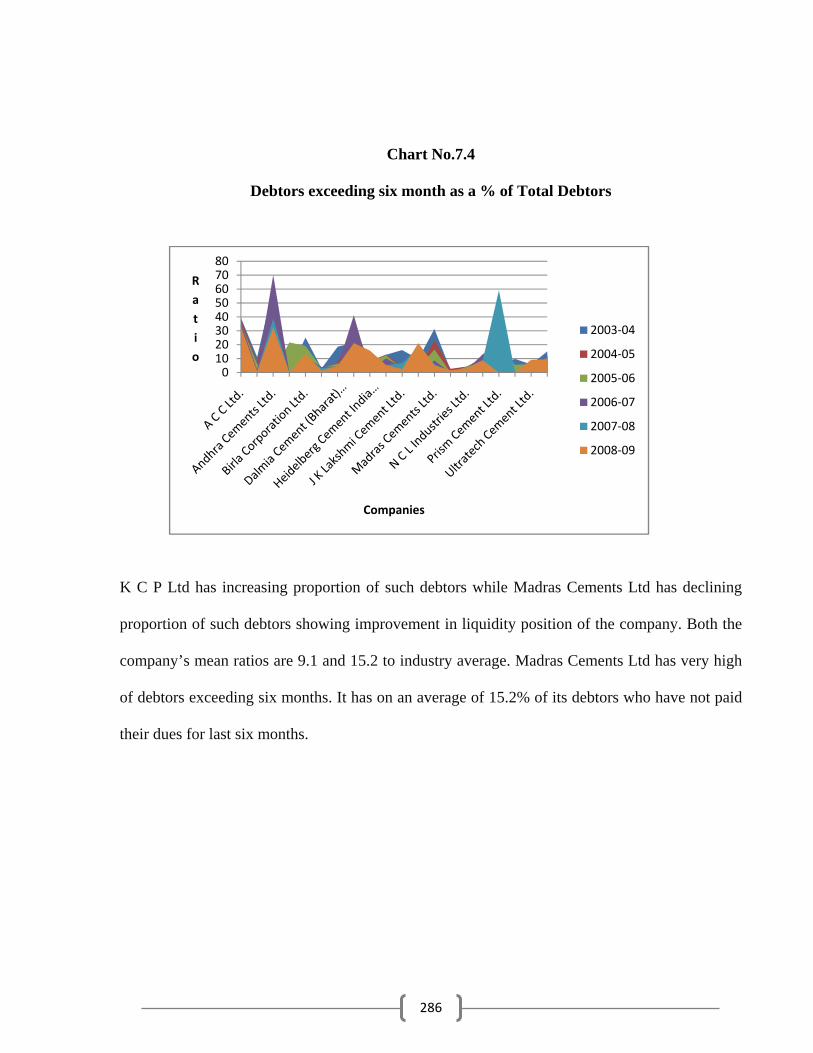
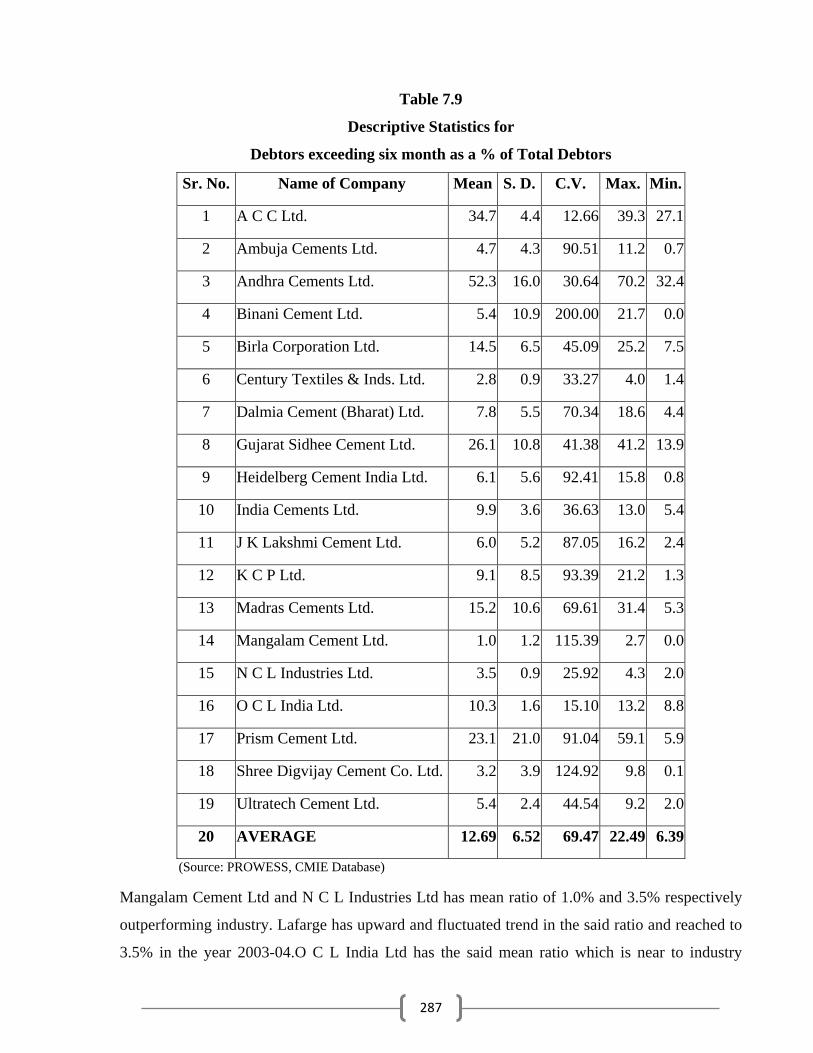
7.4 Debtors exceeding six months as a % of total debtors
Cement Industry on aggregate basis has 12.69% of its total debtors as debtors exceeding six
month. It ranges from 11.02% to 9.47% during the study period. Their dues are more than six
month. The high level of this ratio is not good for the company as it blocks the investment and
company suffers on liquidity as well profitability aspects. Out of 19 companies under study,
there are 6 companies who have this ratio of more than industry average. There are 12 companies
who have the said ratio lower than 10%. These companies are very good at their collection
policy and managing their debtors efficiently. A C C Ltd has shown downward trend in the said
ratio and reached to just 32.8% in the year 2008-09.Ambuja Cements Ltd has very steep
downward trend as from 11.2% in the 2003-04, it has reached to the level of 0.8% in the year
2008-09.Andhra Cements Ltd has 60.7% of debtors exceeding six months in the beginning of
study period which rise to 32.4% in the year 2008-09.Binani Cement Ltd. has mean ratio of 5.4%
showing very high percentage of debtors have not paid their due for last six months. It has also
downward trend in the said ratio during the study period. In the year 2008-09, it has reached to
the level of 0.00% which is not good for the company’s liquidity position. Birla Corporation Ltd
has downward trend in the said ratio. In the year 2003-04, it has 25.2% of its debtors exceeding
six months. The said ratio reached to 46.74% in the year 200.00. Its mean ratio is 13.5% with
13.5% of coefficient of variation. Century Textiles & Inds. Ltd. has mean ratio of 2.8%
indicating its debtors exceeding six months is lower than industry average. Dalmia Cement
(Bharat) Ltd has moderate level of debtors exceeding six months. The said ratio has mean value
of 7.8% with the highest level of 18.6% in the year 2003-04.Gujarat Sidhee Cement Ltd has
downward trend indicating improved collections. Its average debtors exceeding six month is
26.1%.Heidelberg Cement India Ltd has also same improving position as the said ratio has
increased from 2.3% to 15.8% during the last two years. India Cements Ltd has mean ratio of
9.9% and J K Lakshmi Cement Ltd has the said mean ratio of 6.0% with coefficient of variation
36.63% and 87.05% respectively.
285
Table 7.8
Debtors exceeding six month as a % of Total Debtors
Sr. No. Name of Company 2003-04 2004-05 2005-06 2006-07 2007-08 2008-09
1 A C C Ltd. 39.3 38.3 35.1 35.4 27.1 32.8
2 Ambuja Cements Ltd. 11.2 7.2 6.4 1.9 0.7 0.8
3 Andhra Cements Ltd. 60.7 59.5 N.A. 70.2 38.6 32.4
4 Binani Cement Ltd. 0.0 0.0 21.7 0.0 0.0 0.0
5 Birla Corporation Ltd. 25.2 7.5 19.2 10.8 10.8 13.5
6 Century Textiles & Inds. Ltd. 3.0 2.1 3.2 4.0 3.1 1.4
7 Dalmia Cement (Bharat) Ltd. 18.6 7.7 6.5 4.4 4.5 4.9
8 Gujarat Sidhee Cement Ltd. 21.4 32.8 13.9 41.2 N.A. 21.2
9 Heidelberg Cement India Ltd. 2.0 8.2 7.6 0.8 2.3 15.8
10 India Cements Ltd. 12.8 13.0 12.5 10.3 5.4 5.4
11 J K Lakshmi Cement Ltd. 16.2 4.3 2.8 3.5 6.8 2.4
12 K C P Ltd. 9.7 2.0 3.1 1.3 17.5 21.2
13 Madras Cements Ltd. 31.4 23.2 16.6 8.6 5.9 5.3
14 Mangalam Cement Ltd. 1.8 2.7 0.0 0.0 0.0 1.6
15 N C L Industries Ltd. 4.2 4.3 4.2 2.0 3.1 3.1
16 O C L India Ltd. 10.1 10.3 10.6 13.2 9.0 8.8
17 Prism Cement Ltd. 5.9 10.8 18.5 21.2 59.1 0.0
18 Shree Digvijay Cement Co. Ltd. 9.8 3.2 5.6 0.2 0.1 0.1
19 Ultratech Cement Ltd. 5.8 2.0 6.1 4.8 4.3 9.2
20 AVERAGE 15.22 12.58 10.76 12.31 11.02 9.47
(Source: PROWESS, CMIE Database)
286
Chart No.7.4
Debtors exceeding six month as a % of Total Debtors
K C P Ltd has increasing proportion of such debtors while Madras Cements Ltd has declining
proportion of such debtors showing improvement in liquidity position of the company. Both the
company’s mean ratios are 9.1 and 15.2 to industry average. Madras Cements Ltd has very high
of debtors exceeding six months. It has on an average of 15.2% of its debtors who have not paid
their dues for last six months.
01020304050607080
Ratio
Companies
2003‐04
2004‐05
2005‐06
2006‐07
2007‐08
2008‐09
287
Table 7.9
Descriptive Statistics for
Debtors exceeding six month as a % of Total Debtors
Sr. No. Name of Company Mean S. D. C.V. Max. Min.
1 A C C Ltd. 34.7 4.4 12.66 39.3 27.1
2 Ambuja Cements Ltd. 4.7 4.3 90.51 11.2 0.7
3 Andhra Cements Ltd. 52.3 16.0 30.64 70.2 32.4
4 Binani Cement Ltd. 5.4 10.9 200.00 21.7 0.0
5 Birla Corporation Ltd. 14.5 6.5 45.09 25.2 7.5
6 Century Textiles & Inds. Ltd. 2.8 0.9 33.27 4.0 1.4
7 Dalmia Cement (Bharat) Ltd. 7.8 5.5 70.34 18.6 4.4
8 Gujarat Sidhee Cement Ltd. 26.1 10.8 41.38 41.2 13.9
9 Heidelberg Cement India Ltd. 6.1 5.6 92.41 15.8 0.8
10 India Cements Ltd. 9.9 3.6 36.63 13.0 5.4
11 J K Lakshmi Cement Ltd. 6.0 5.2 87.05 16.2 2.4
12 K C P Ltd. 9.1 8.5 93.39 21.2 1.3
13 Madras Cements Ltd. 15.2 10.6 69.61 31.4 5.3
14 Mangalam Cement Ltd. 1.0 1.2 115.39 2.7 0.0
15 N C L Industries Ltd. 3.5 0.9 25.92 4.3 2.0
16 O C L India Ltd. 10.3 1.6 15.10 13.2 8.8
17 Prism Cement Ltd. 23.1 21.0 91.04 59.1 5.9
18 Shree Digvijay Cement Co. Ltd. 3.2 3.9 124.92 9.8 0.1
19 Ultratech Cement Ltd. 5.4 2.4 44.54 9.2 2.0
20 AVERAGE 12.69 6.52 69.47 22.49 6.39
(Source: PROWESS, CMIE Database)
Mangalam Cement Ltd and N C L Industries Ltd has mean ratio of 1.0% and 3.5% respectively
outperforming industry. Lafarge has upward and fluctuated trend in the said ratio and reached to
3.5% in the year 2003-04.O C L India Ltd has the said mean ratio which is near to industry
288
average. It is 10.3% with 15.10% of coefficient of variation. In the year 2006-07, it has highest
level of 13.2% of its debtors exceeding six months. Prism Cement Ltd. has the mean value of
said ratio of 23.1% which is more than industry average figure but its debtors exceeding six
months are showing upward trend. In 2003-04, it was just 5.9%, which doubled in five years and
reached to 0.0% in 2008-09.Shree Digvijay Cement Co. Ltd has also just 3.2% of mean ratio
with 124.92% of coefficient of variations. Ultratech Cement Ltd has declined its debtors
exceeding six months significantly during this study period as from 5.8% in 2003-04 to 9.2% in
2008-09.
7.5 Hypotheses Testing
The followings hypotheses are tested with the help of ANOVA (Single factor) F test. Analysis of
variance (ANOVA) enables us to test for the significance of the differences among more than
two sample means. Using analysis of variance, we will be able to make inferences about whether
our samples are drawn from populations having the same mean.
1. Null Hypothesis: Debtors Turnover Ratio of cement companies does not differ
significantly among the years.
SUMMARY
Groups Count Sum Average Variance
2003-04 19 834.1 43.90000 197.5311
2004-05 19 816.5 42.97368 148.6143
2005-06 19 750.6 39.50526 288.1916
2006-07 19 713.5 37.55263 108.5737
2007-08 19 612.0 32.21053 217.5654
2008-09 19 646.3 34.01579 216.6725
289
Above table state that the calculated value of F ratio (2.142) is lower than the table value of F (2.2984) at 5% significance level; This lead to the acceptance of null hypothesis at 5% significance level. I conclude that Debtors turnover ratio of cement companies does not differ significantly among the years.
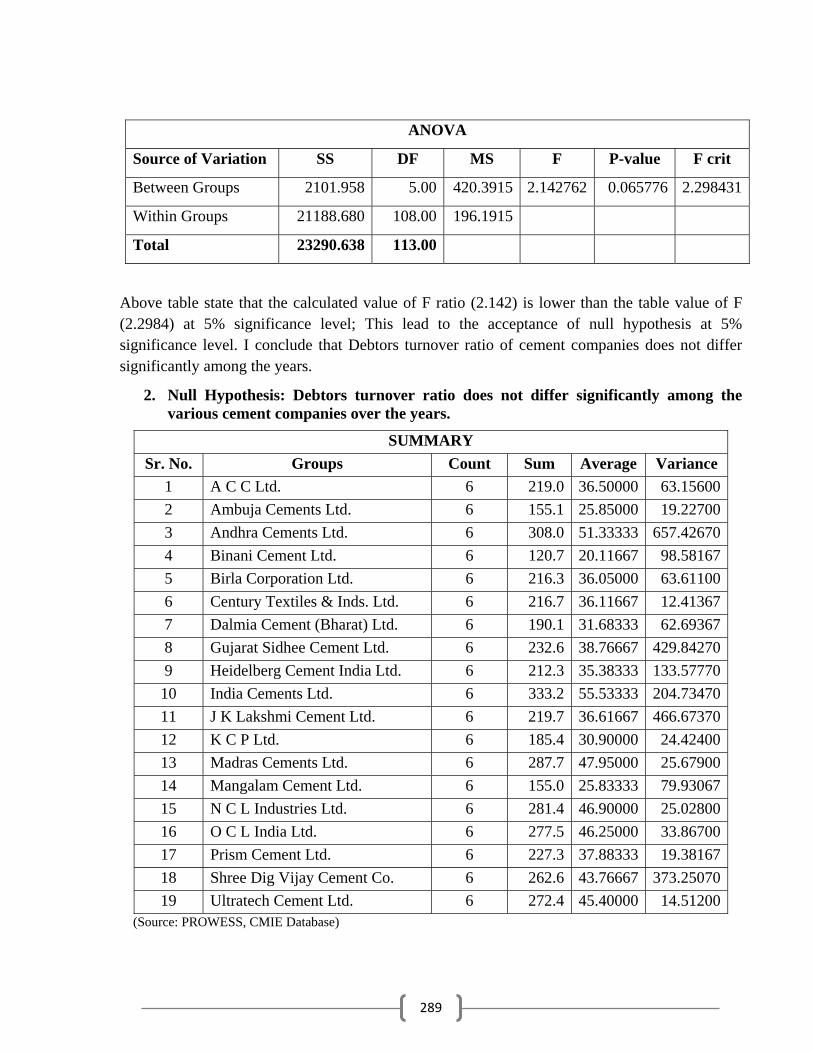
2. Null Hypothesis: Debtors turnover ratio does not differ significantly among the various cement companies over the years.
(Source: PROWESS, CMIE Database)
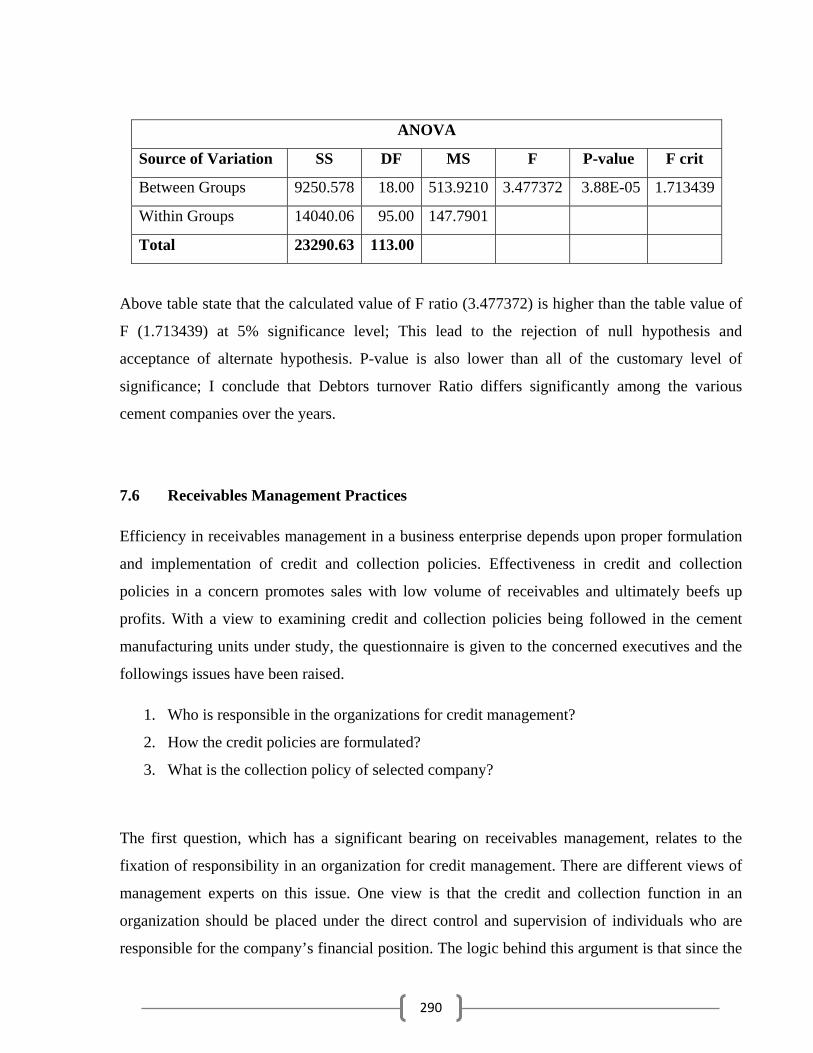
ANOVA
Source of Variation SS DF MS F P-value F crit
Between Groups 2101.958 5.00 420.3915 2.142762 0.065776 2.298431
Within Groups 21188.680 108.00 196.1915
Total 23290.638 113.00
SUMMARY Sr. No. Groups Count Sum Average Variance
1 A C C Ltd. 6 219.0 36.50000 63.156002 Ambuja Cements Ltd. 6 155.1 25.85000 19.227003 Andhra Cements Ltd. 6 308.0 51.33333 657.426704 Binani Cement Ltd. 6 120.7 20.11667 98.581675 Birla Corporation Ltd. 6 216.3 36.05000 63.611006 Century Textiles & Inds. Ltd. 6 216.7 36.11667 12.413677 Dalmia Cement (Bharat) Ltd. 6 190.1 31.68333 62.693678 Gujarat Sidhee Cement Ltd. 6 232.6 38.76667 429.842709 Heidelberg Cement India Ltd. 6 212.3 35.38333 133.5777010 India Cements Ltd. 6 333.2 55.53333 204.7347011 J K Lakshmi Cement Ltd. 6 219.7 36.61667 466.6737012 K C P Ltd. 6 185.4 30.90000 24.4240013 Madras Cements Ltd. 6 287.7 47.95000 25.6790014 Mangalam Cement Ltd. 6 155.0 25.83333 79.9306715 N C L Industries Ltd. 6 281.4 46.90000 25.0280016 O C L India Ltd. 6 277.5 46.25000 33.8670017 Prism Cement Ltd. 6 227.3 37.88333 19.3816718 Shree Dig Vijay Cement Co.
d6 262.6 43.76667 373.25070
19 Ultratech Cement Ltd. 6 272.4 45.40000 14.51200
290
ANOVA
Source of Variation SS DF MS F P-value F crit
Between Groups 9250.578 18.00 513.9210 3.477372 3.88E-05 1.713439
Within Groups 14040.06 95.00 147.7901
Total 23290.63 113.00
Above table state that the calculated value of F ratio (3.477372) is higher than the table value of
F (1.713439) at 5% significance level; This lead to the rejection of null hypothesis and
acceptance of alternate hypothesis. P-value is also lower than all of the customary level of
significance; I conclude that Debtors turnover Ratio differs significantly among the various
cement companies over the years.
7.6 Receivables Management Practices
Efficiency in receivables management in a business enterprise depends upon proper formulation
and implementation of credit and collection policies. Effectiveness in credit and collection
policies in a concern promotes sales with low volume of receivables and ultimately beefs up
profits. With a view to examining credit and collection policies being followed in the cement
manufacturing units under study, the questionnaire is given to the concerned executives and the
followings issues have been raised.
1. Who is responsible in the organizations for credit management?
2. How the credit policies are formulated?
3. What is the collection policy of selected company?
The first question, which has a significant bearing on receivables management, relates to the
fixation of responsibility in an organization for credit management. There are different views of
management experts on this issue. One view is that the credit and collection function in an
organization should be placed under the direct control and supervision of individuals who are
responsible for the company’s financial position. The logic behind this argument is that since the
291
receivables management affects the flow of funds directly and it is a function of financial nature,
it should be responsibility of financial executives to formulate and implement credit and
collection policies. There are others who suggest that business organizations should depend on
their sales department to manage receivables. There view is that sales are incomplete until the
value thereof is realized. Hence, the proponents of this view are of the opinion that credit and
collection function should be under the direct charge of marketing executives and sales
department. It has been found in the course of the study that in the selected units credit and
collection policies are being chalked out by the top executives on the advice of the finance
division. However, the execution of the policies has been entrusted to sales division in the
organization of various companies. Credit policy is an integral part of marketing process. During
the course of investigation, it has been revealed by the company executives that they have
adopted the policy of limited credit and open credit with approval. All the 24 companies have
same credit policy and the credit period is depending up on the credit standards of the customers.
It has been asked to executives they why they are giving credit. Eleven executives replied that it
is only because of competition in the market while thirteen said it all about industry norms. Five
executives said both competition and industry practices are the prime reason for giving credit.
The percentage of credit sales in not static, it varies upon from company to company and also
depends on sales level. The success or failure of a credit policy mainly depends on the selection
of credit risk. The selection involves identification of customers to whom credit is to be allowed.
Proper evaluation of credit-worthiness of the customer is essential. It is a sort of preventive
measure by which those customers who lack credit worthiness are eliminated from the list of
prospective debtors. During the course of investigation, it is found that all the companies are
doing numerical credit scoring of their customers and then classifying it in different categories.
Cement manufacturing companies are looking at the capacity and collateral parameter that is
they are giving more weight to operating income and collaterals of their client for credit granting
decision. To get the information on these aspects mainly they are using Bank Reference and their
own past dealing with the clients. Cement manufacturing companies are using techniques like
Aging schedule, Collection matrix and Days sales’ outstanding to control accounts receivables.
DSO and Aging schedule is most preferable techniques for controlling accounts receivables.
292
References:
• O.M. Introduction to Financial Management (Home wood illnois: Richard D. Irwin, 1978).
• Lawrence D. Schal and Charles W.Haley, Financial Management, 3rd Edition, New York McGraw Hill, 1973).
• S.E.Bolten, Managerial Finance, (Boston : Houghton Mitten Co., 1976)
• R.J.Chambers, Financial Management, (Sydney : GTE law book company Ltd,. 1967)
• Josheph L.Wood, ‘Credit and Collections” in Daris Lillian, ed., Business Finance Handbook, (Englewood, cliffs, New Jersey: Prentice Hall, 1962.)
• Martin h. Seiden, the Quantity of Trade Credit (New York : National Bureau of Economic Research, 1964)
• Martin h. Seiden, the Quantity of Trade Credit (New York: National Bureau of Economic Research, 1964),p-42.
• Therodore N.Backman, Credit and Collection : Management and Theory (New York : McGraw Hill Book Company,1962)
• Therodore N.Backman, Credit and Collection : Management and Theory (New York : McGraw Hill Book Company,1962)


![UNDESCENDED OVARY PRESENTED WITH ...A].pdf272 273 274 UNDESCENDED OVARY PRESENTED WITH fPARAOVARIAN CYST Guldeniz ,Aksan DESTELI1T urk a n GURS1 ,HlimeCEVIK2lsi BuletZEYNELOL3 1 D](https://img.pdfslide.us/doc/110x75/5fc9b82ef7f5f41d2e282d63/undescended-ovary-presented-with-apdf-272-273-274-undescended-ovary-presented.jpg)