Embed Size (px)
Citation preview
Rearrangements and Duplications in Tumor Genomes
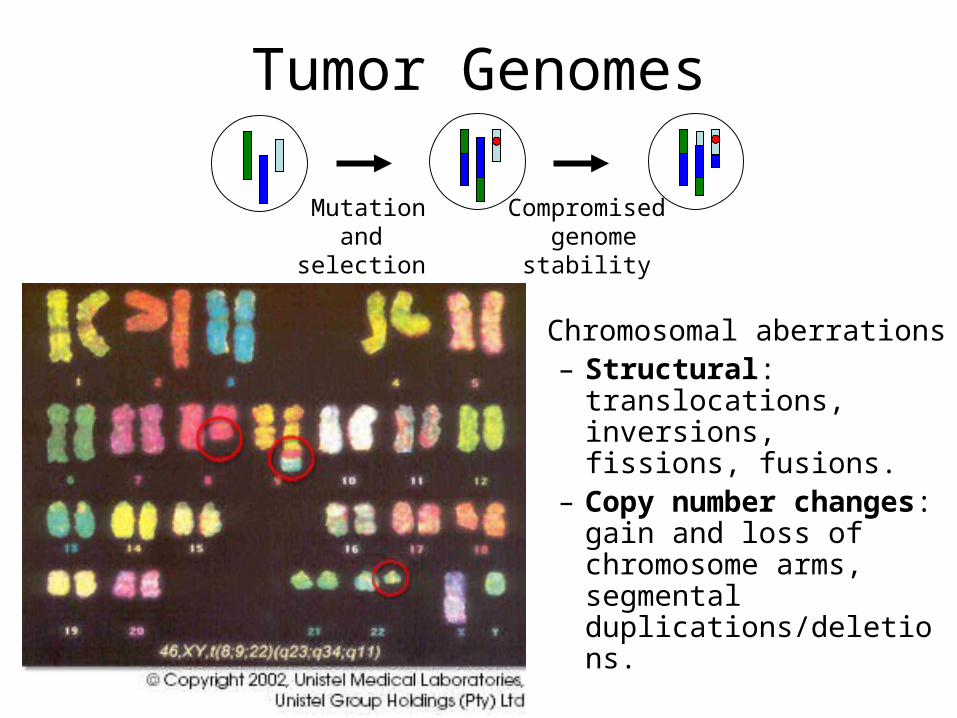
Tumor Genomes
Compromised genomestability
Mutation and selection
• Chromosomal aberrations– Structural:
translocations, inversions, fissions, fusions.
– Copy number changes: gain and loss of chromosome arms, segmental duplications/deletions.
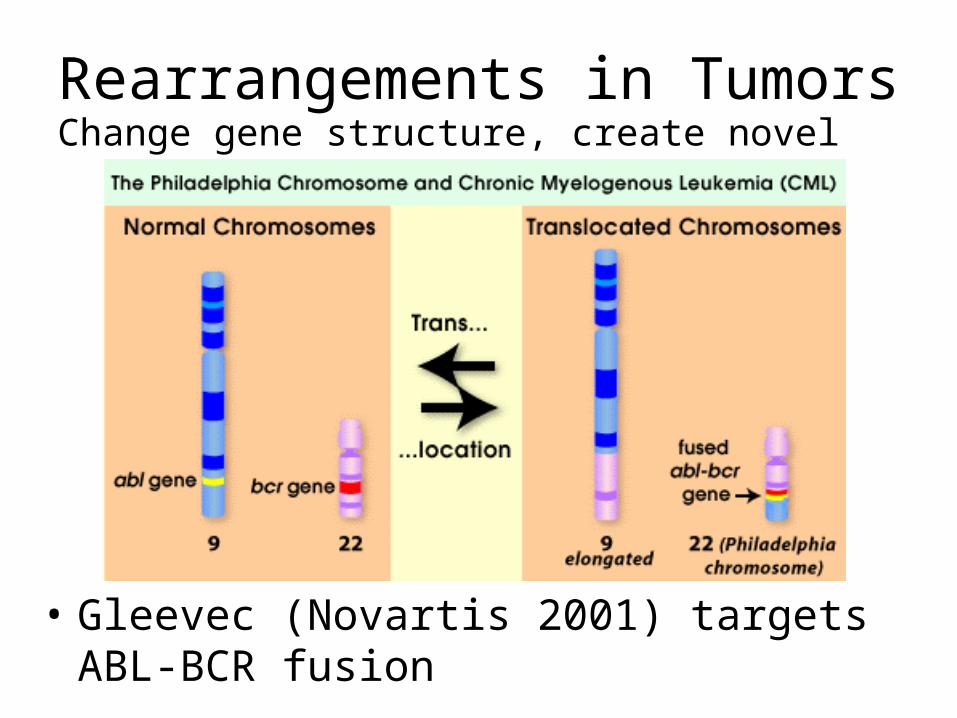
Rearrangements in TumorsChange gene structure, create novel fusion genes
• Gleevec (Novartis 2001) targets ABL-BCR fusion
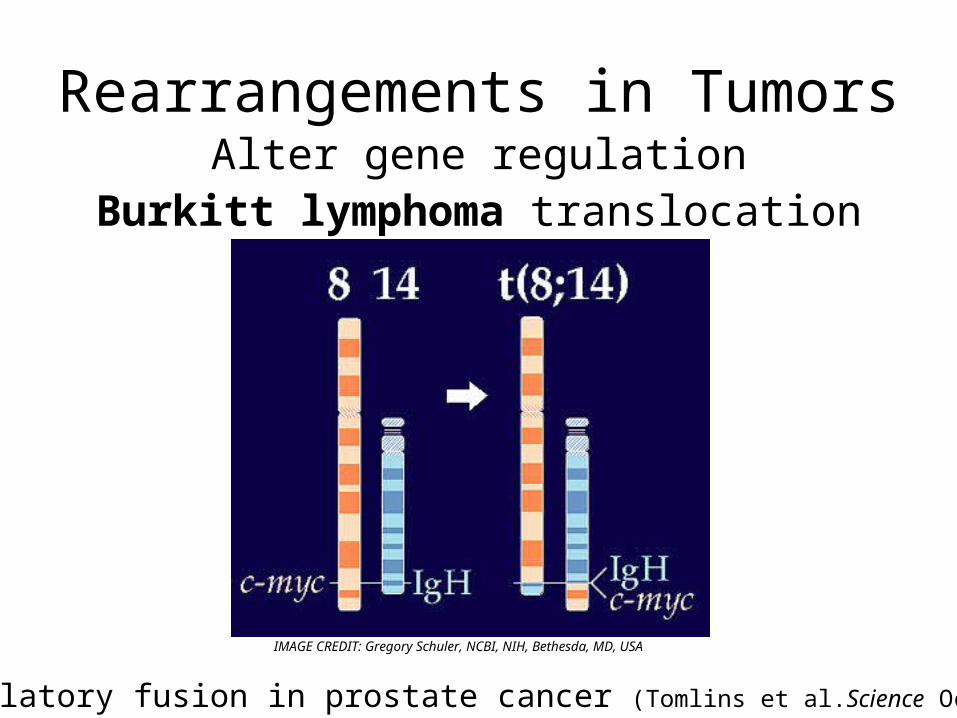
Rearrangements in TumorsAlter gene regulation
Burkitt lymphoma translocation
IMAGE CREDIT: Gregory Schuler, NCBI, NIH, Bethesda, MD, USA
Regulatory fusion in prostate cancer (Tomlins et al.Science Oct. 2005)
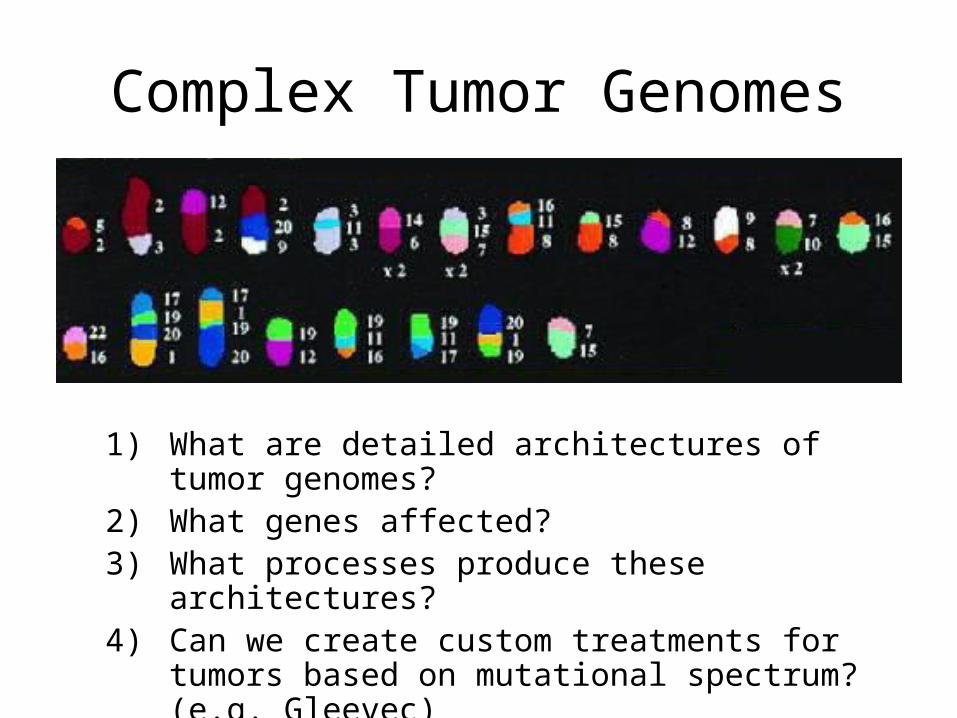
Complex Tumor Genomes
1) What are detailed architectures of tumor genomes?
2) What genes affected?3) What processes produce these architectures?4) Can we create custom treatments for tumors
based on mutational spectrum? (e.g. Gleevec)
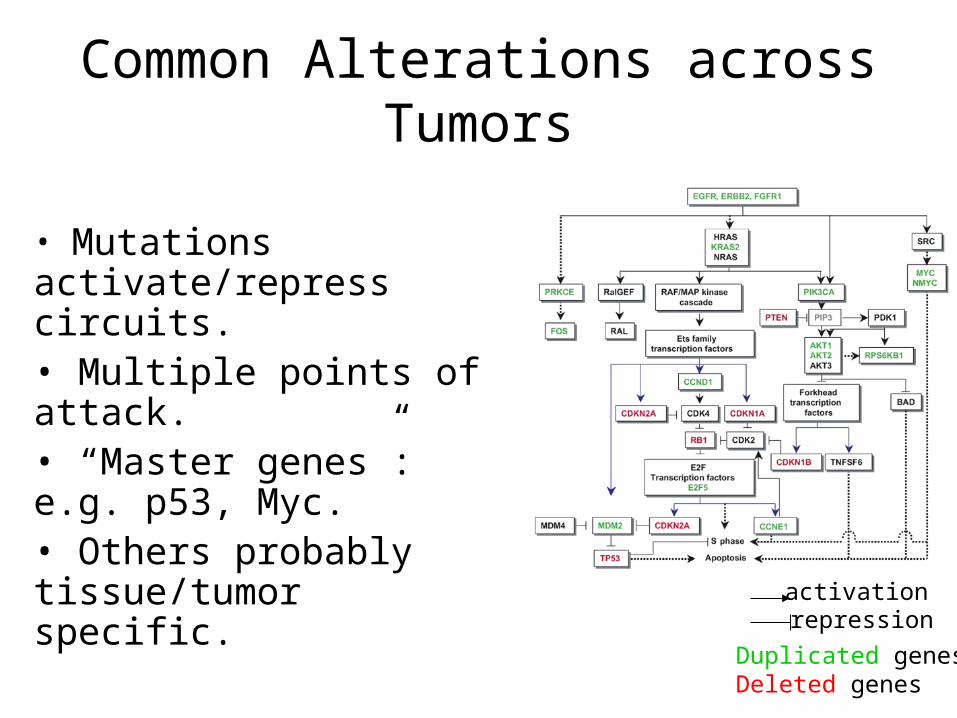
Common Alterations across Tumors
• Mutations activate/repress circuits. • Multiple points of attack. • “Master genes”: e.g. p53, Myc.• Others probably tissue/tumor specific.
repressionactivation
Duplicated genesDeleted genes
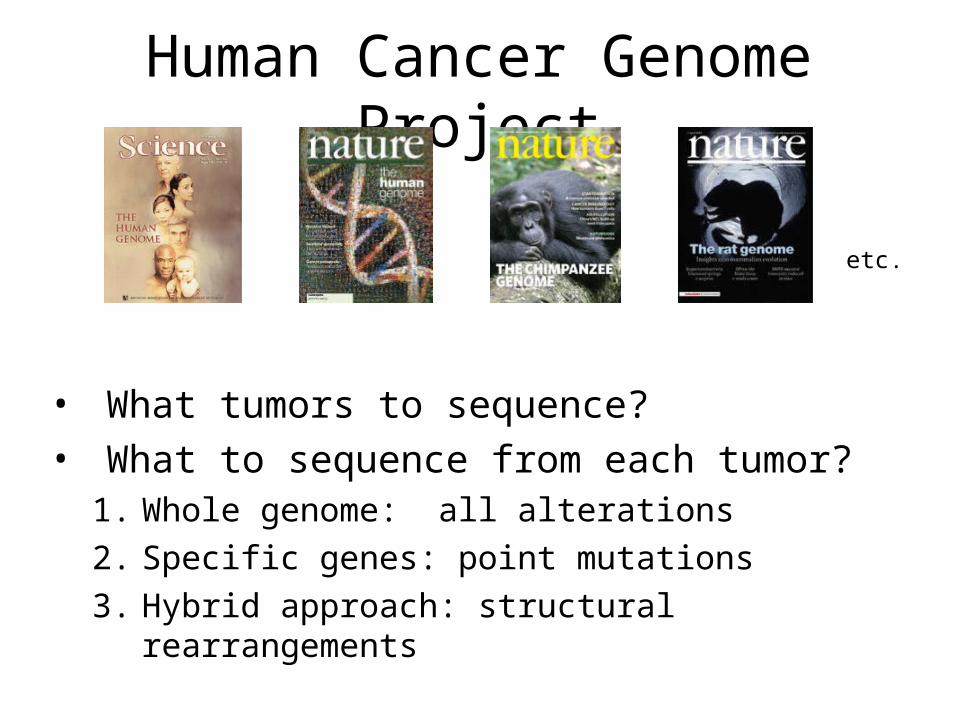
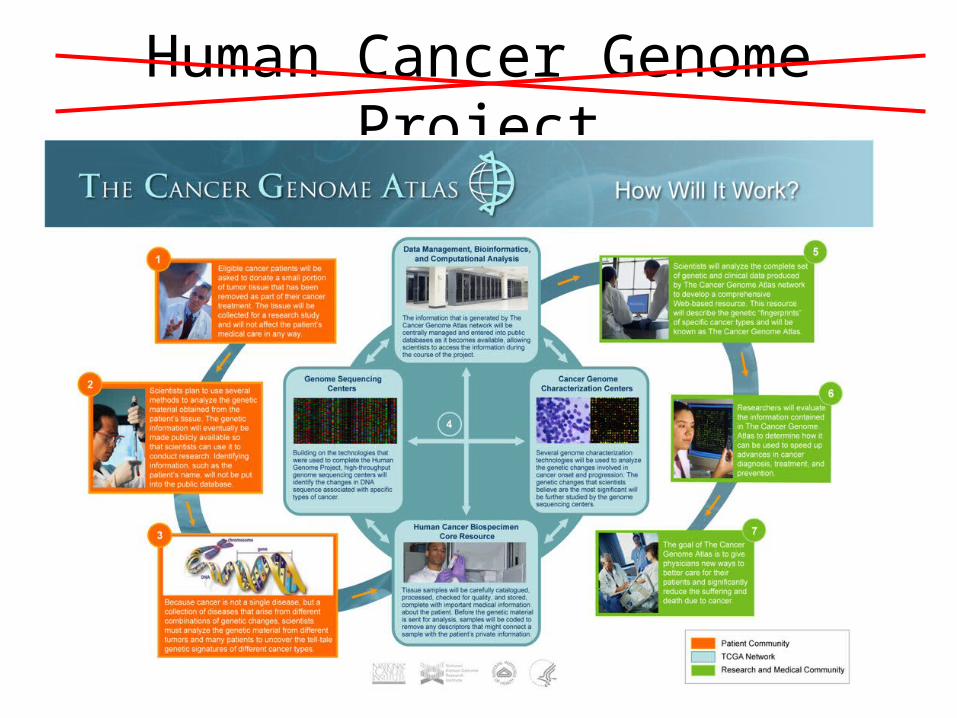
Human Cancer Genome Project
• What tumors to sequence?
• What to sequence from each tumor?1. Whole genome: all alterations
2. Specific genes: point mutations
3. Hybrid approach: structural rearrangements
etc.
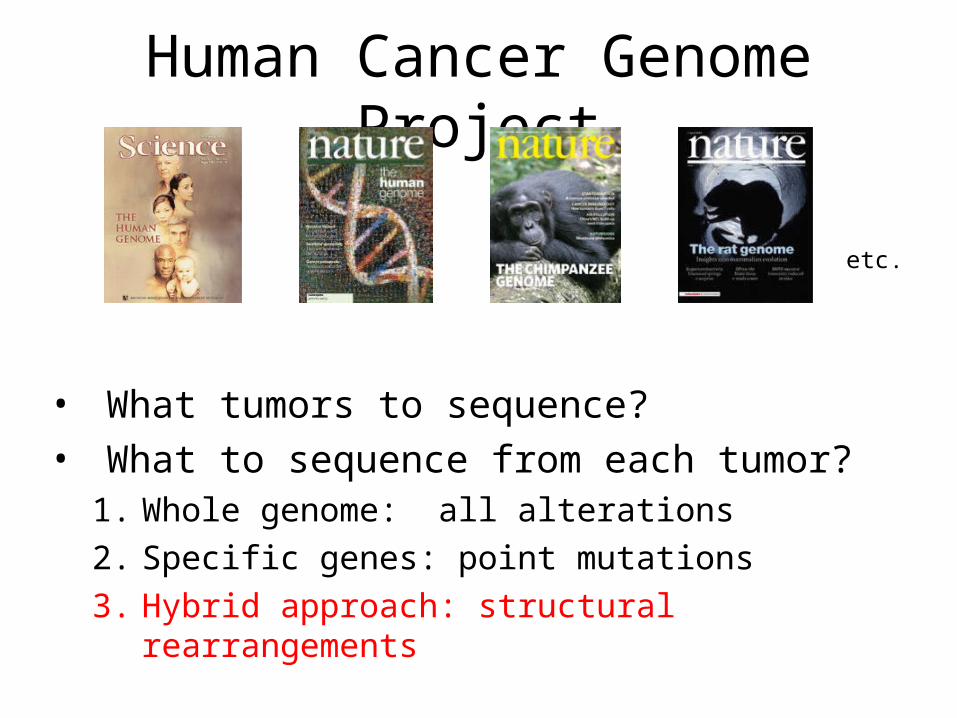
Human Cancer Genome Project
• What tumors to sequence?
• What to sequence from each tumor?1. Whole genome: all alterations
2. Specific genes: point mutations
3. Hybrid approach: structural rearrangements
etc.
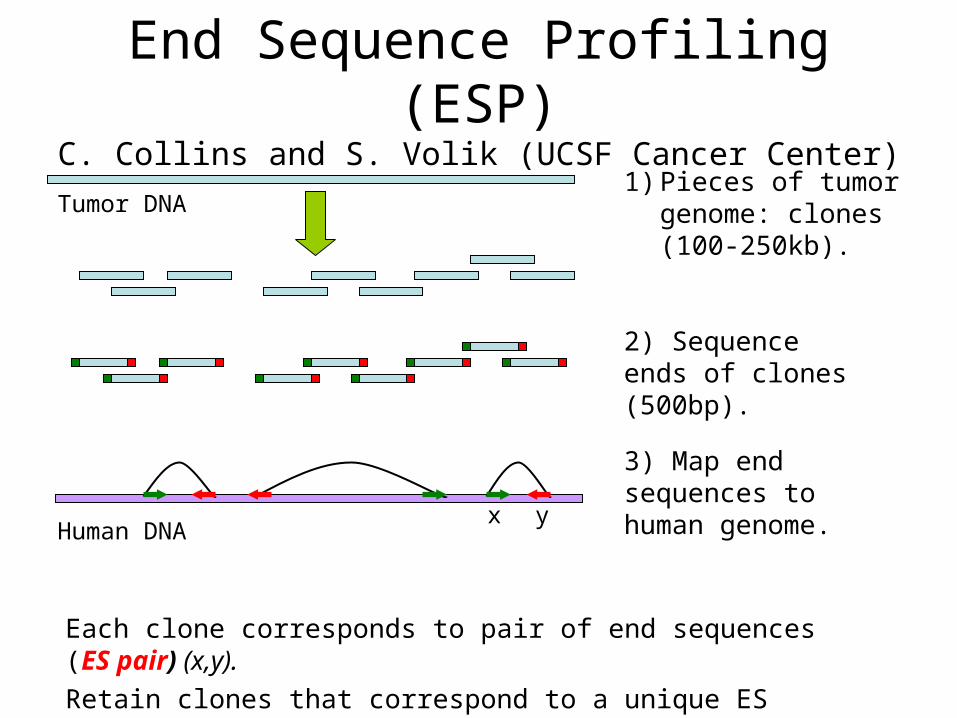
End Sequence Profiling (ESP)C. Collins and S. Volik (UCSF Cancer Center)
1) Pieces of tumor genome: clones (100-250kb).
Human DNA
2) Sequence ends of clones (500bp).
3) Map end sequences to human genome.
Tumor DNA
Each clone corresponds to pair of end sequences (ES pair) (x,y).
Retain clones that correspond to a unique ES pair.
yx
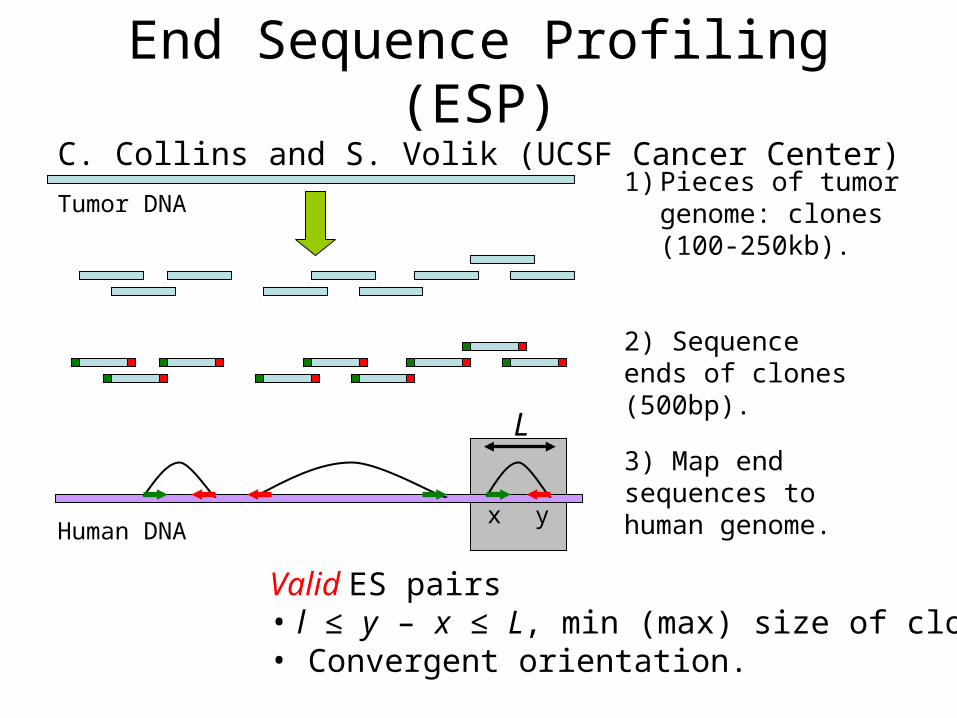
Valid ES pairs• l ≤ y – x ≤ L, min (max) size of clone.• Convergent orientation.
End Sequence Profiling (ESP)C. Collins and S. Volik (UCSF Cancer Center)
1) Pieces of tumor genome: clones (100-250kb).
Human DNA
2) Sequence ends of clones (500bp).
3) Map end sequences to human genome.
Tumor DNA
yx
L
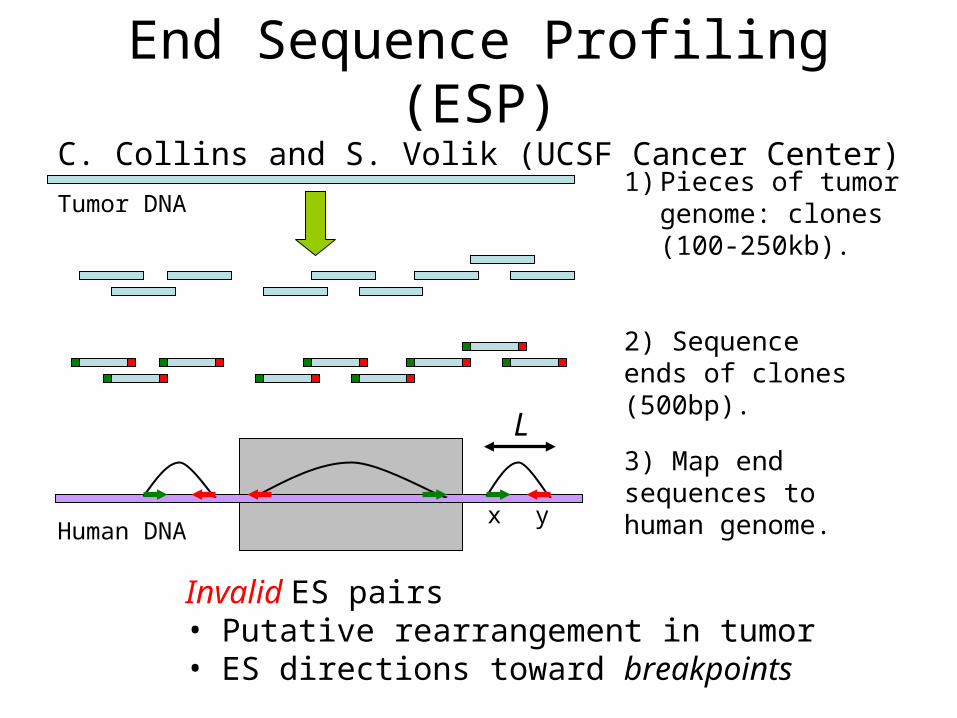
End Sequence Profiling (ESP)C. Collins and S. Volik (UCSF Cancer Center)
1) Pieces of tumor genome: clones (100-250kb).
Human DNA
2) Sequence ends of clones (500bp).
3) Map end sequences to human genome.
Tumor DNA
yx
Invalid ES pairs• Putative rearrangement in tumor• ES directions toward breakpoints
L
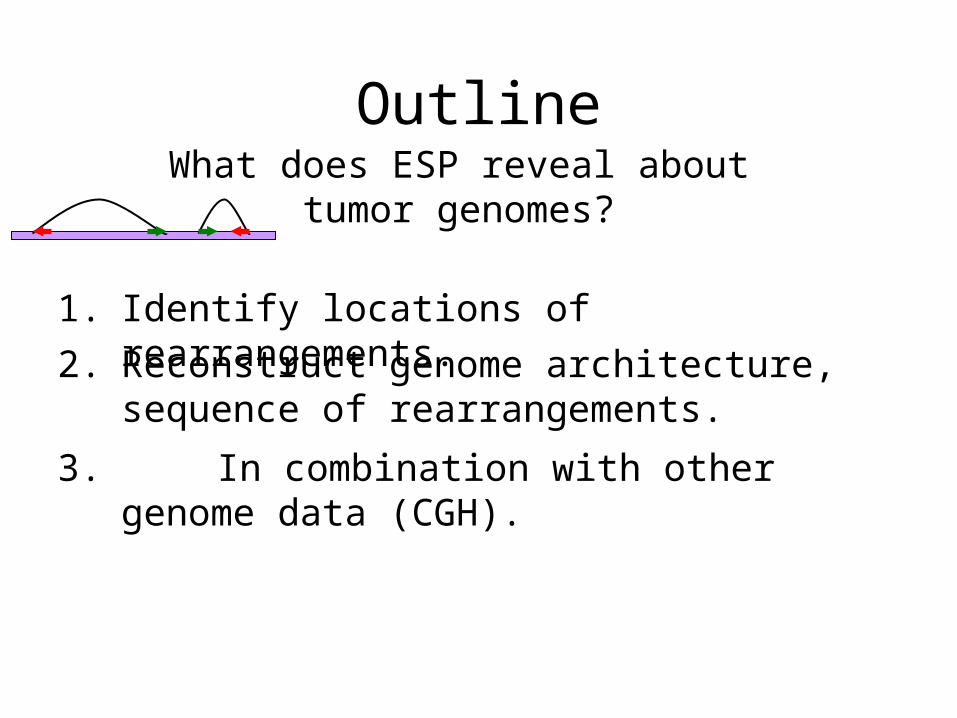
OutlineWhat does ESP reveal about tumor
genomes?
1. Identify locations of rearrangements.
2. Reconstruct genome architecture, sequence of rearrangements.
3. In combination with other genome data (CGH).
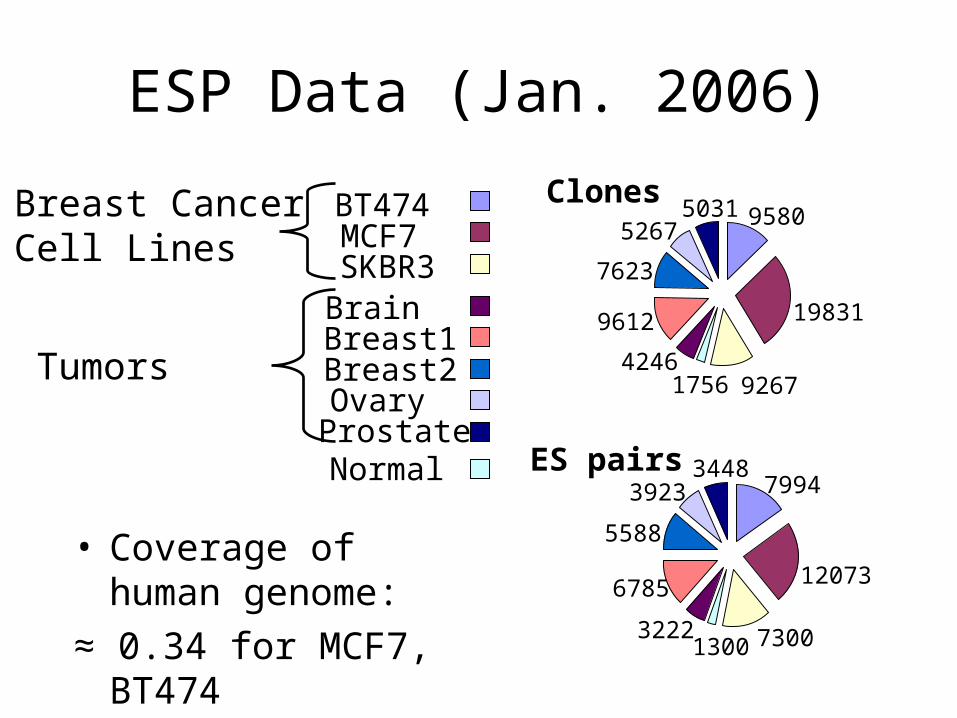
ESP Data (Jan. 2006)
• Coverage of human genome:
≈ 0.34 for MCF7, BT474
ES pairs7994
12073
730013003222
6785
5588
39233448
Clones9580
19831
926717564246
9612
7623
52675031BT474
MCF7SKBR3
Normal
BrainBreast1Breast2OvaryProstate
Breast CancerCell Lines
Tumors
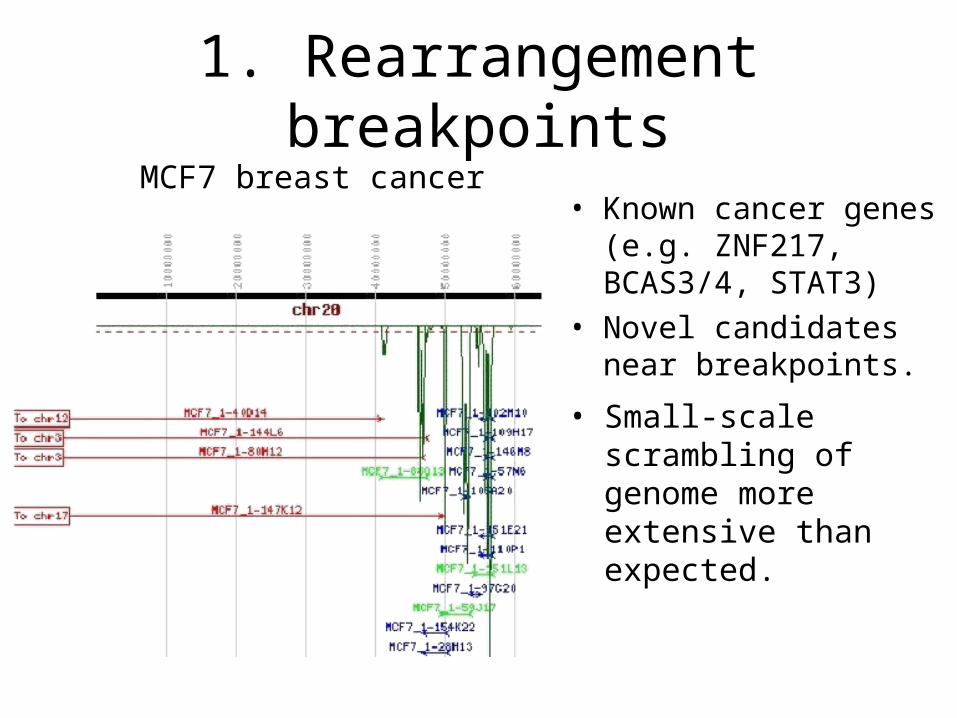
1. Rearrangement breakpoints
• Known cancer genes (e.g. ZNF217, BCAS3/4, STAT3)
• Novel candidates near breakpoints.
MCF7 breast cancer
• Small-scale scrambling of genome more extensive than expected.
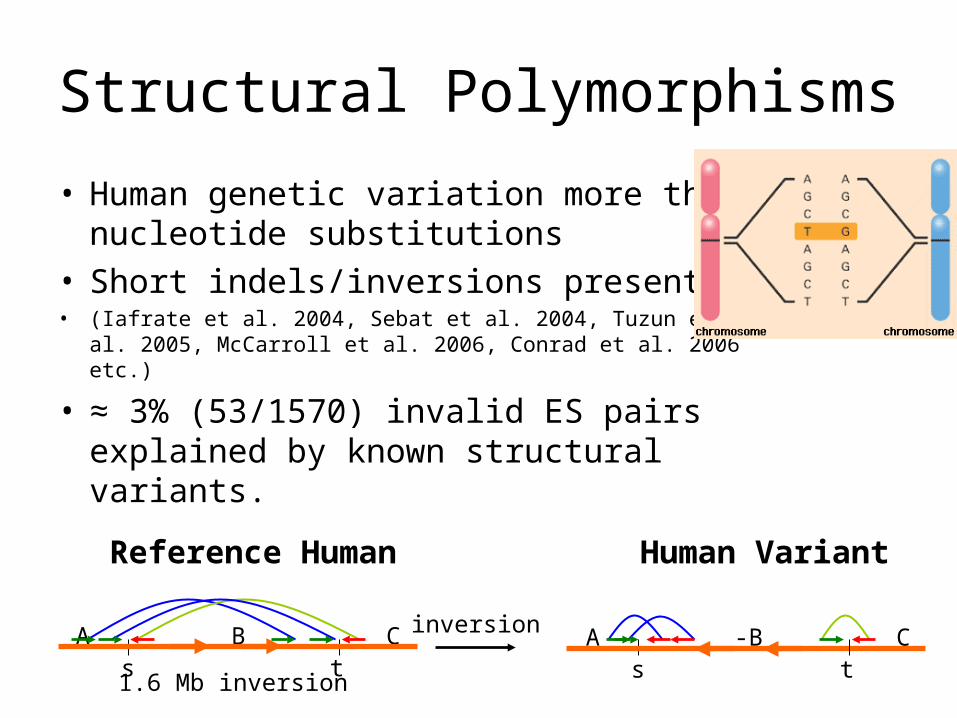
Structural Polymorphisms
• Human genetic variation more than nucleotide substitutions
• Short indels/inversions present • (Iafrate et al. 2004, Sebat et al. 2004, Tuzun et al. 2005,
McCarroll et al. 2006, Conrad et al. 2006 etc.)
• ≈ 3% (53/1570) invalid ES pairs explained by known structural variants.
s1.6 Mb inversion s
At
C-Binversion
Human Variant
A CB
Reference Human
t
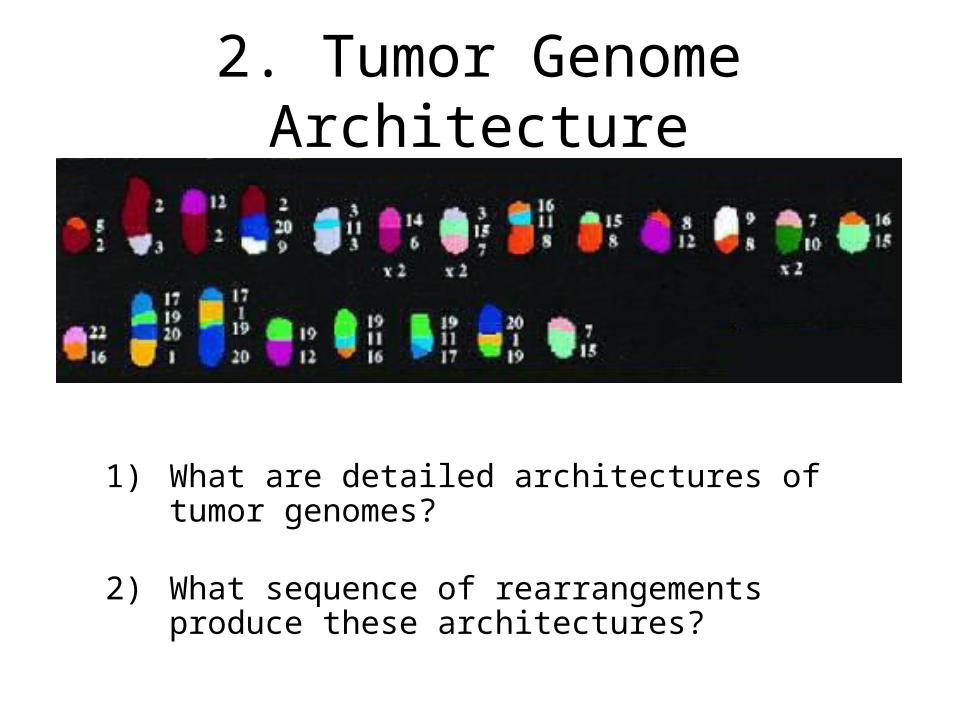
2. Tumor Genome Architecture
1) What are detailed architectures of tumor genomes?
2) What sequence of rearrangements produce these architectures?
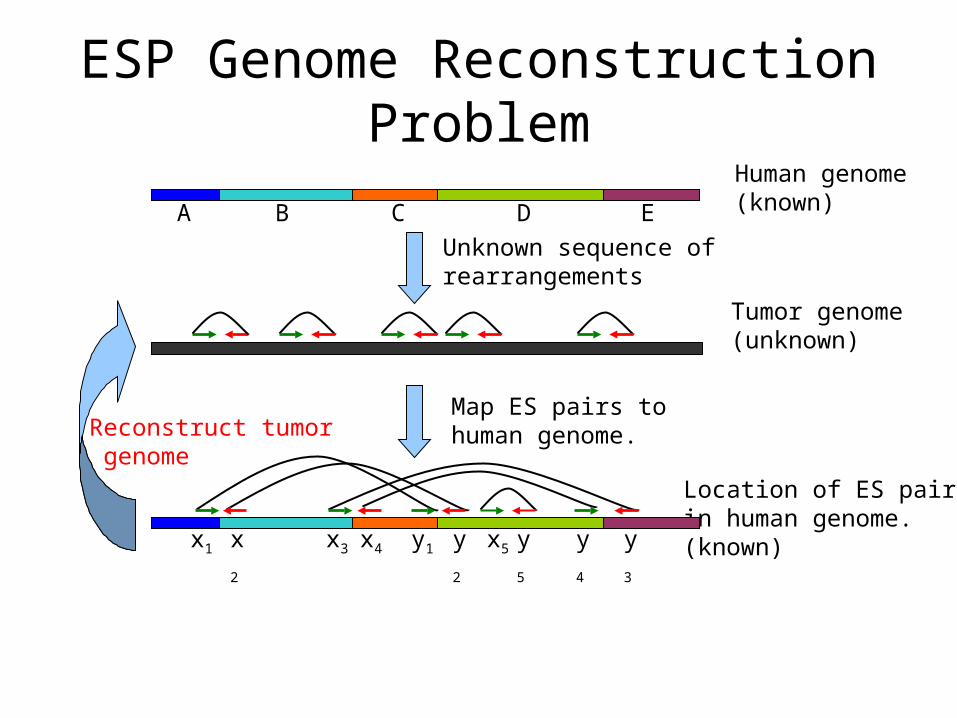
Human genome(known)
Tumor genome(unknown)
Unknown sequence of rearrangements
Location of ES pairsin human genome.(known)
Map ES pairs tohuman genome.
B C EA D
x2 y2x3 x4 y1 x5 y5 y4 y3x1
ESP Genome Reconstruction Problem
Reconstruct tumor genome
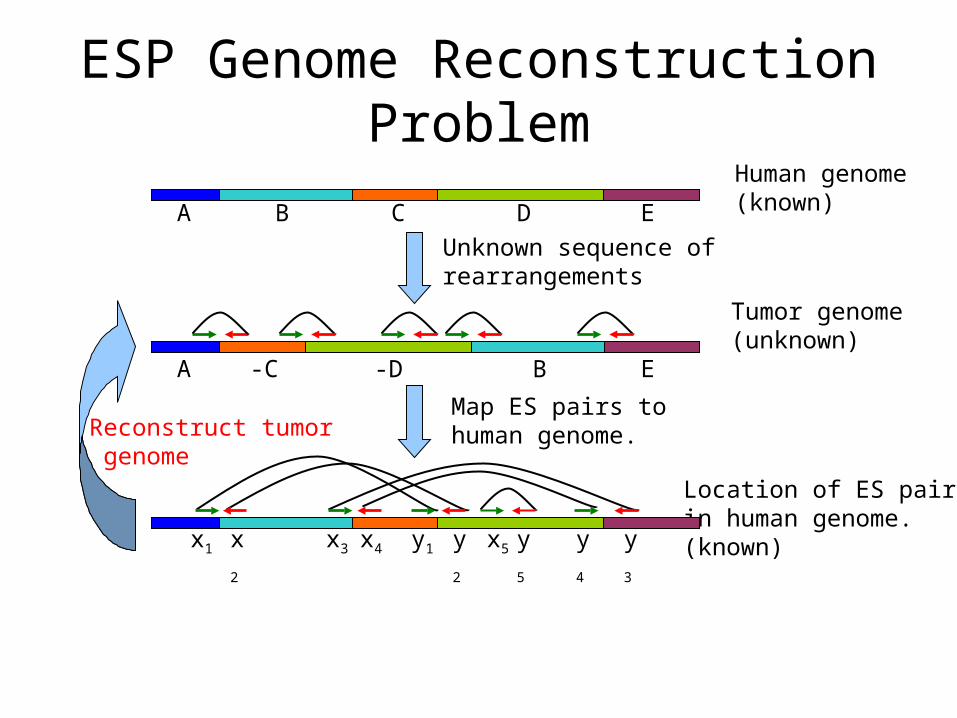
Human genome(known)
Tumor genome(unknown)
Unknown sequence of rearrangements
Location of ES pairsin human genome.(known)
Map ES pairs tohuman genome.
-C -D EA B
B C EA D
x2 y2x3 x4 y1 x5 y5 y4 y3x1
ESP Genome Reconstruction Problem
Reconstruct tumor genome
-C
-D
E
A
B
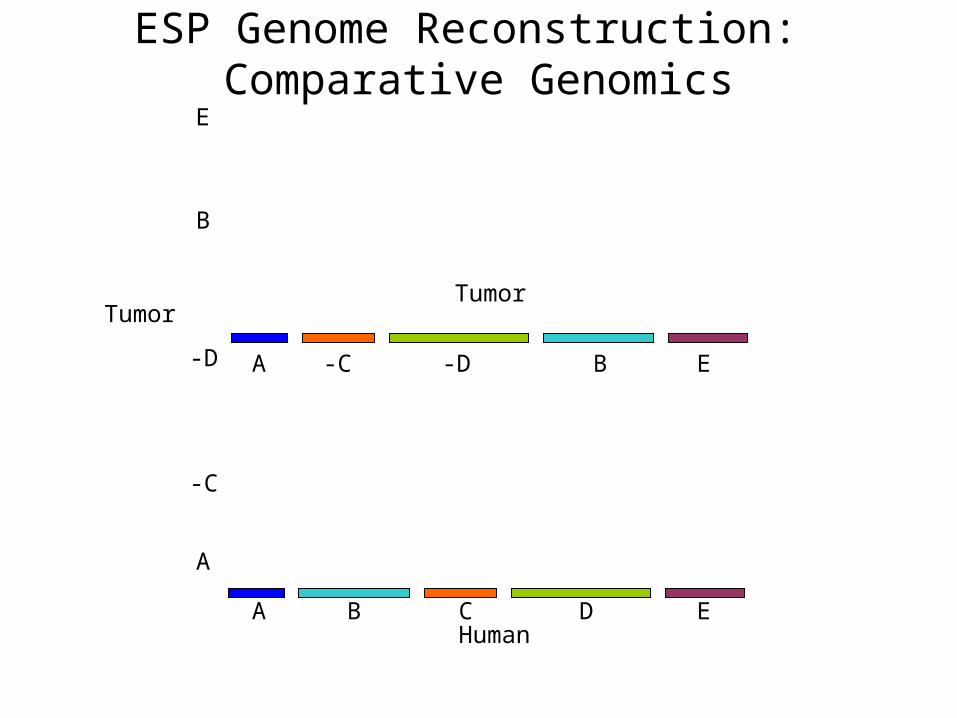
-C -D EA B
Tumor
Human
ESP Genome Reconstruction: Comparative Genomics
B C EA D
Tumor
B C EA D
-C
-D
E
A
B
Tumor
Human
ESP Genome Reconstruction: Comparative Genomics
B C EA D
-C
-D
E
A
B
Tumor
Human
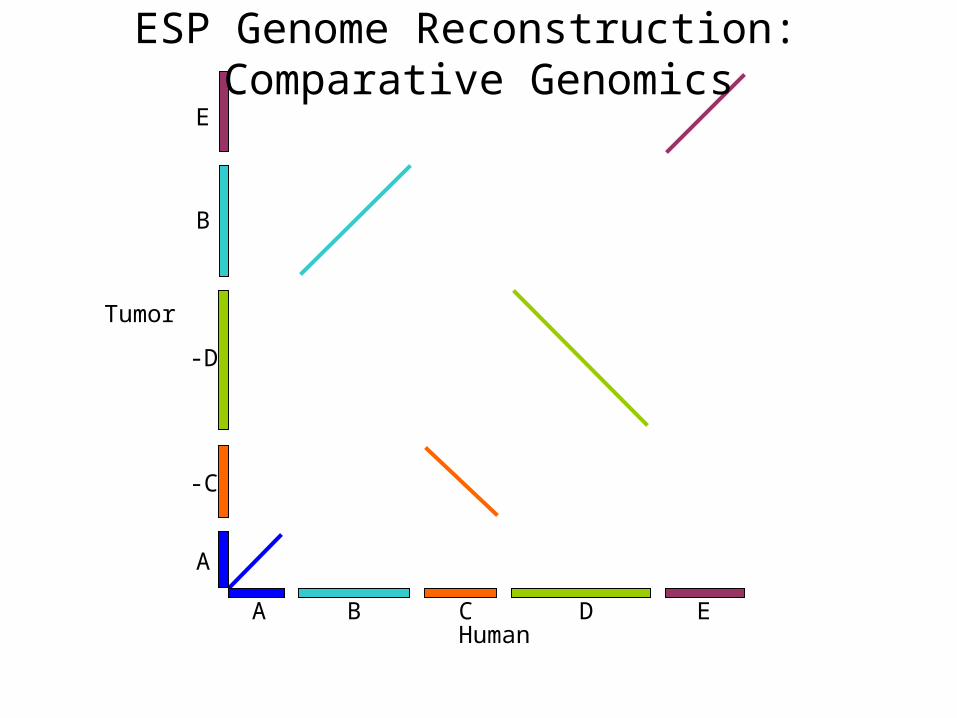
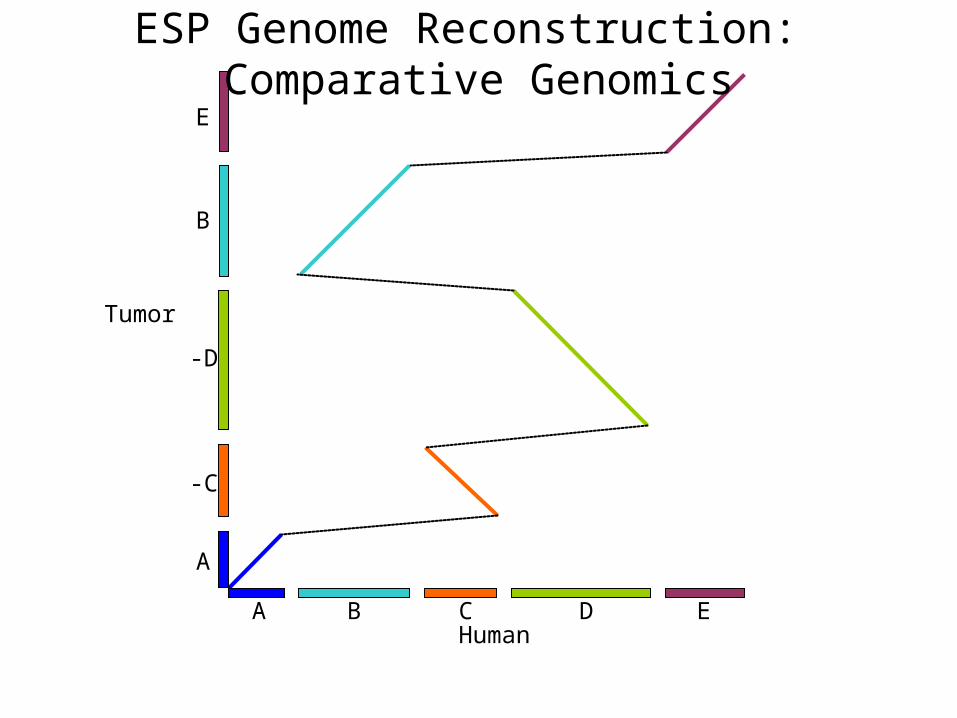
ESP Genome Reconstruction: Comparative Genomics
B C EA D
-C
-D
E
A
B
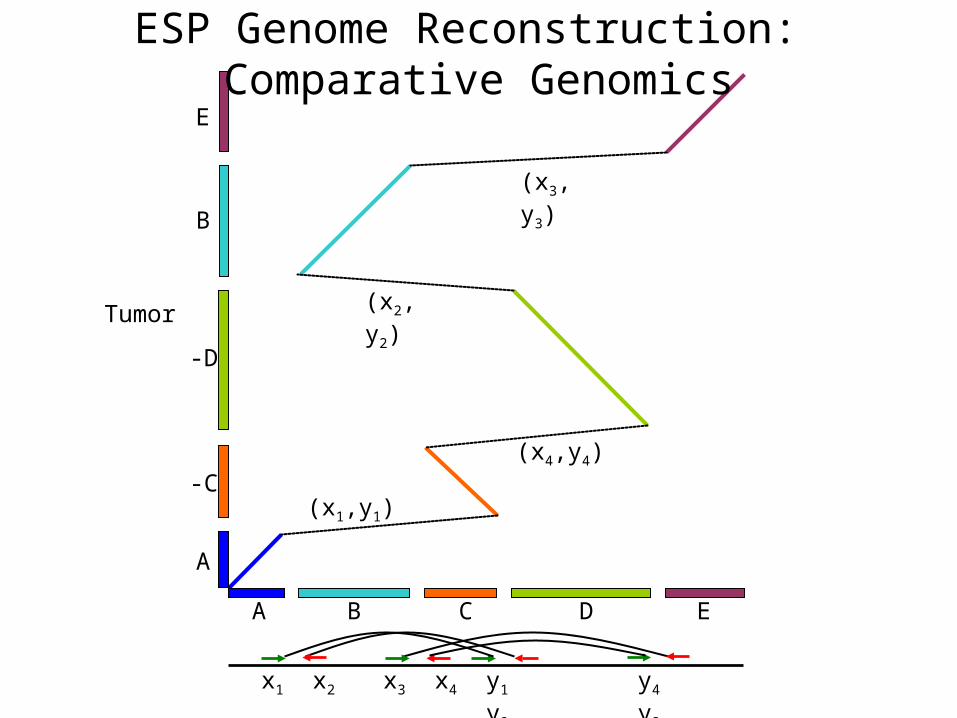
Tumor (x2,y2)
(x3,y3)
(x4,y4)
(x1,y1)
y4 y3x1 x2 x3 x4 y1 y2
ESP Genome Reconstruction: Comparative Genomics
B
C
E
A
D
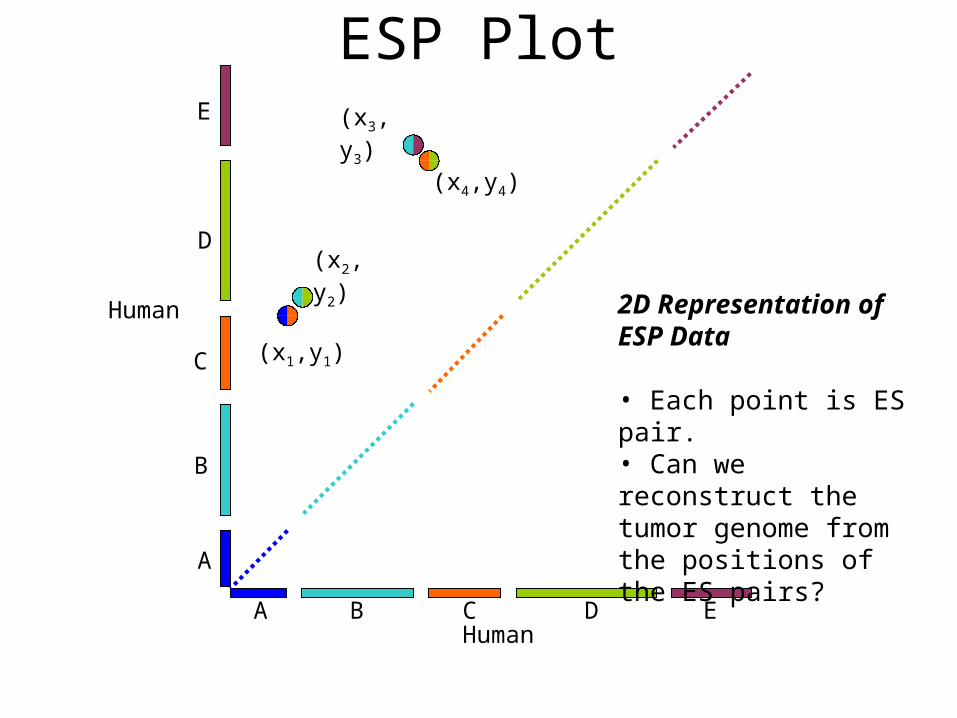
Human
B C EA D
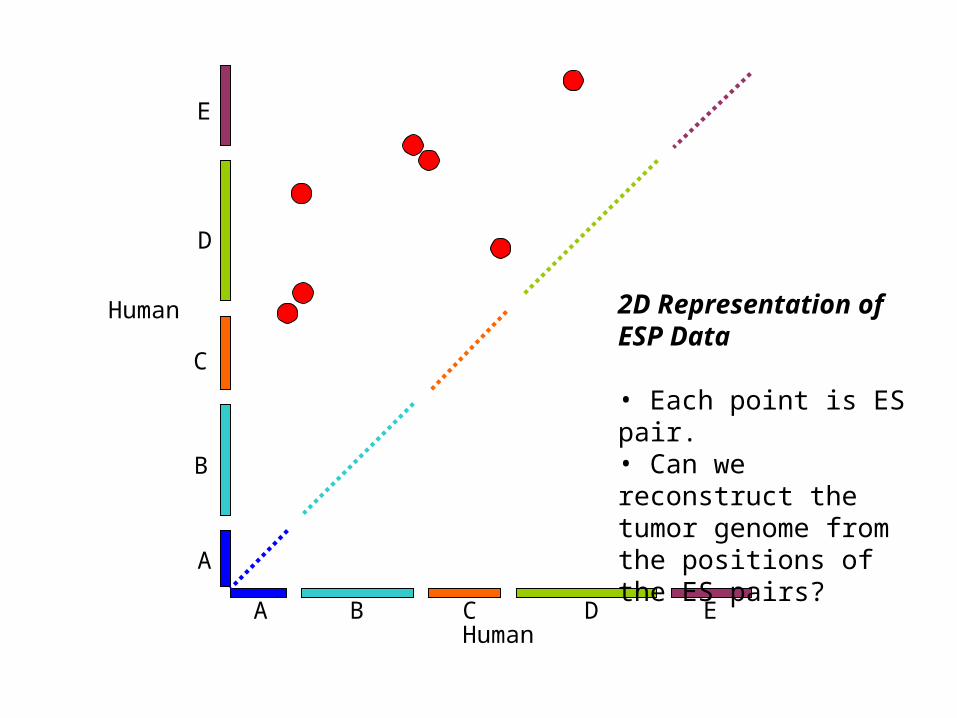
2D Representation of ESP Data
• Each point is ES pair.• Can we reconstruct the tumor genome from the positions of the ES pairs?
(x2,y2)
(x3,y3)
(x4,y4)
(x1,y1)
ESP Plot
Human
B
C
E
A
D
Human
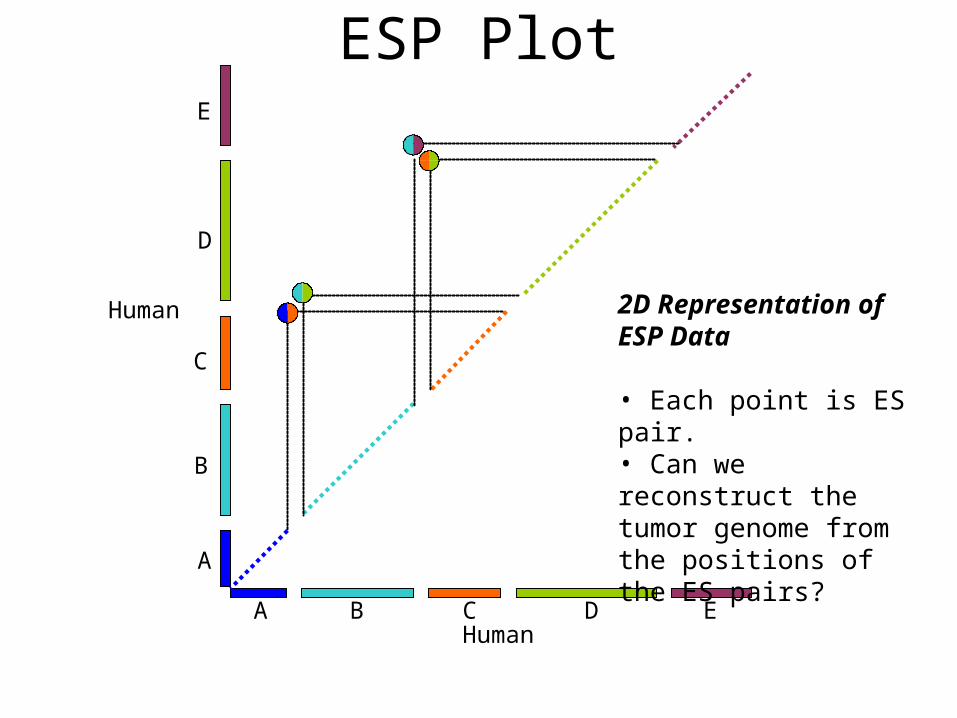
Human
B C EA D
2D Representation of ESP Data
• Each point is ES pair.• Can we reconstruct the tumor genome from the positions of the ES pairs?
ESP Plot
B
C
E
A
D
Human
Human
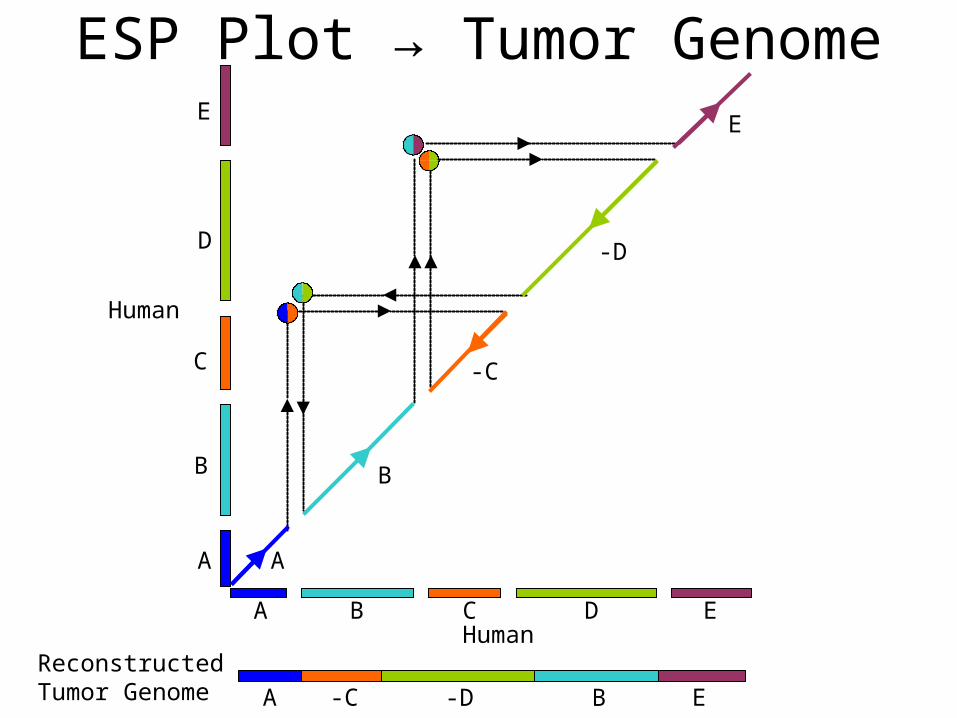
B
-D
E
A
DA C
E
-C
B
-C -D EA B
ReconstructedTumor Genome
ESP Plot → Tumor Genome
B
C
E
A
D
Human
Human
B C EA D
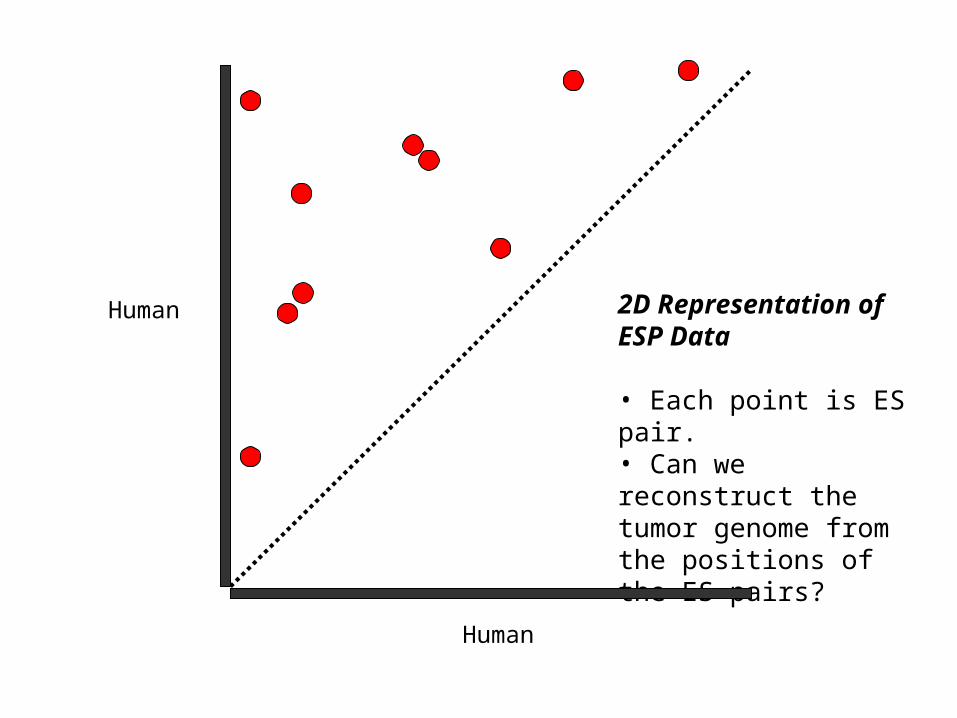
2D Representation of ESP Data
• Each point is ES pair.• Can we reconstruct the tumor genome from the positions of the ES pairs?
Human
Human 2D Representation of ESP Data
• Each point is ES pair.• Can we reconstruct the tumor genome from the positions of the ES pairs?
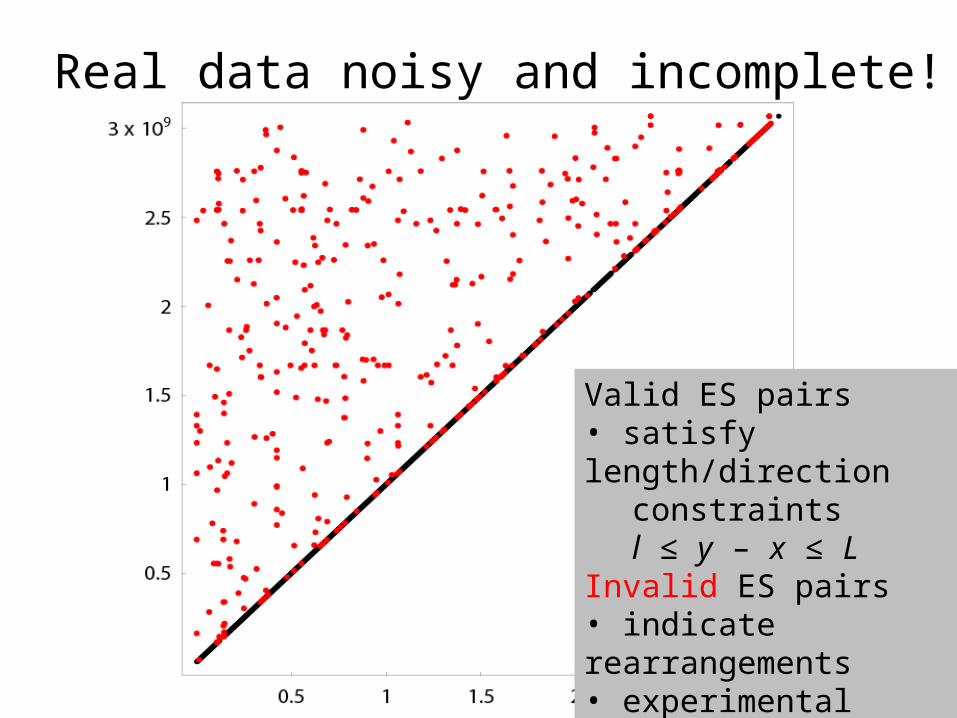
Real data noisy and incomplete!
Valid ES pairs• satisfy length/direction
constraints l ≤ y – x ≤ L
Invalid ES pairs• indicate rearrangements• experimental errors
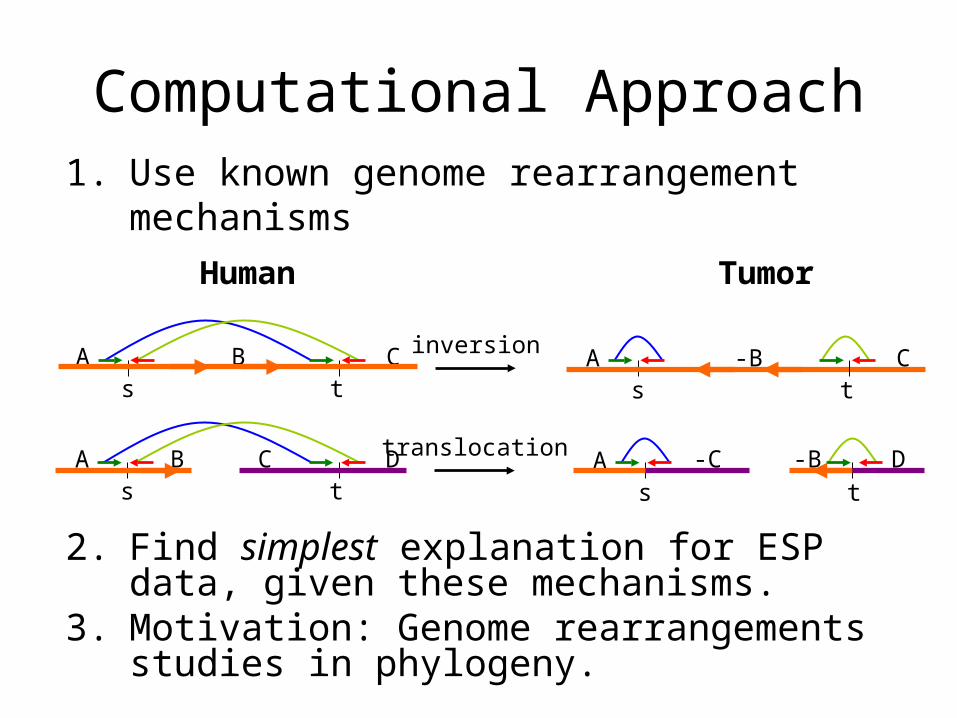
Computational Approach
2. Find simplest explanation for ESP data, given these mechanisms.
3. Motivation: Genome rearrangements studies in phylogeny.
1. Use known genome rearrangement mechanisms
sA
tC-B
sA
tCB inversion
Human Tumor
sA
t
-Bs
At
-CB DC D translocation
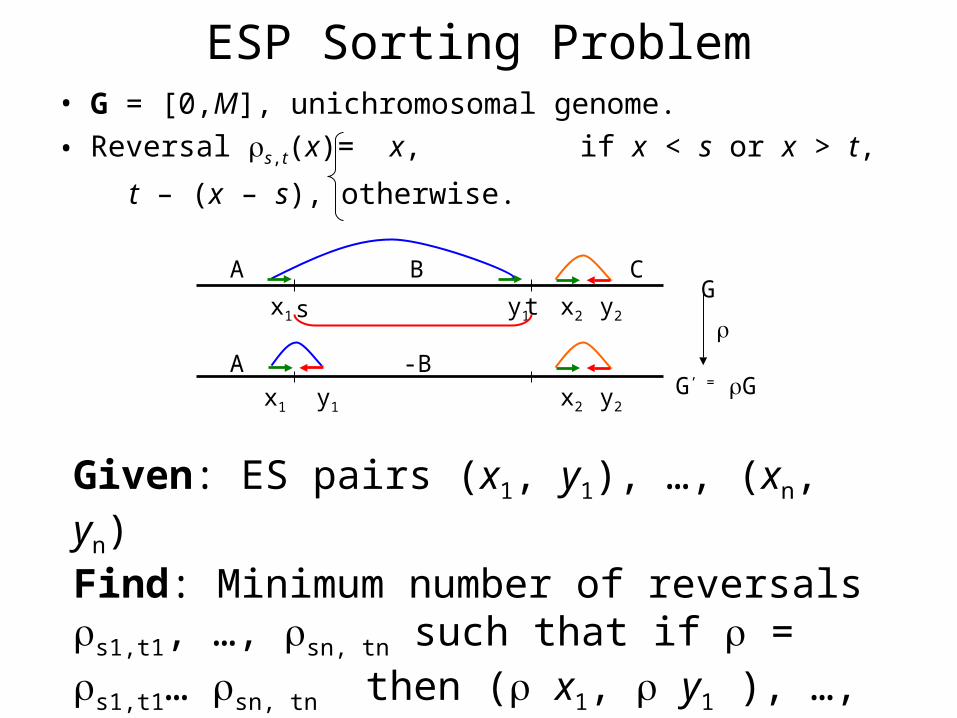
• G = [0,M], unichromosomal genome.
• Reversal s,t(x)= x, if x < s or x > t,
t – (x – s), otherwise.
Given: ES pairs (x1, y1), …, (xn, yn) Find: Minimum number of reversals s1,t1, …, sn, tn such that if = s1,t1… sn, tn then ( x1, y1 ), …, ( xn, yn) are valid ES pairs.
x1 y1G’ = G
x1 y1
GB CA
-BA
x2 y2
x2 y2
ts
ESP Sorting Problem
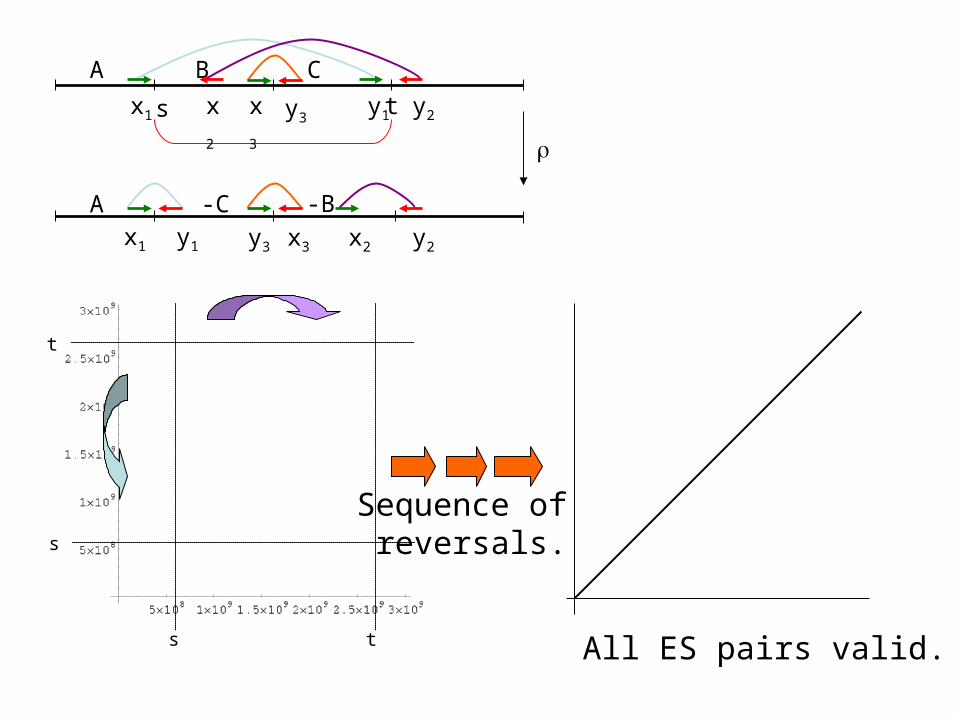
All ES pairs valid.
t
s
Sequence of reversals.
s t
x1 y1
x1 y1
B CA
-C -BA
y3 x3 y2
y3
ts x3
x2
y2x2
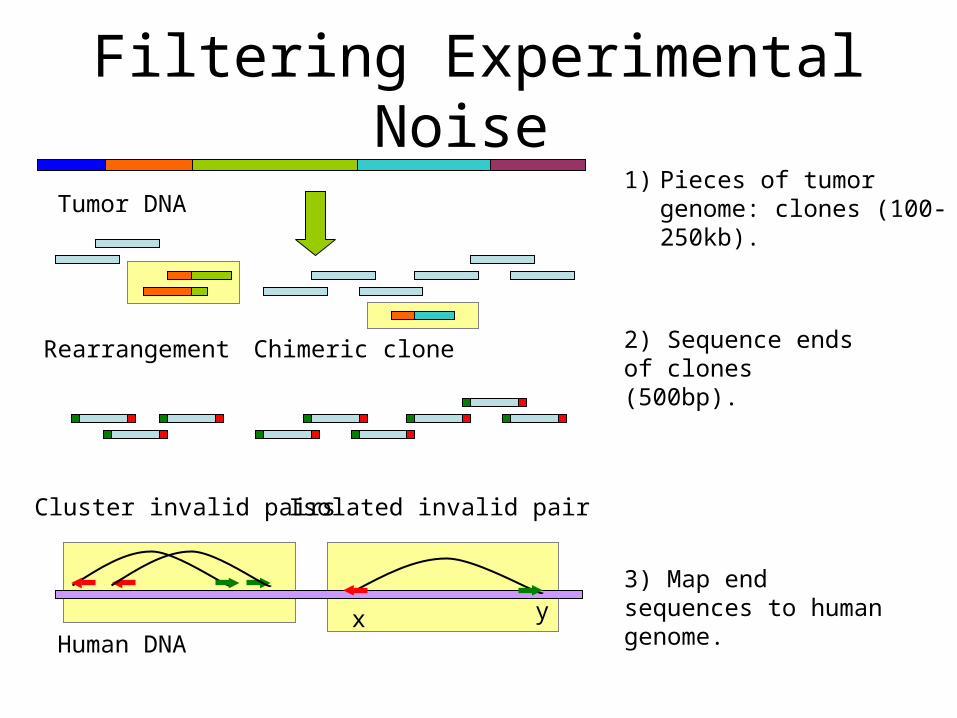
Filtering Experimental Noise 1) Pieces of tumor genome:
clones (100-250kb).
Human DNA
2) Sequence ends of clones (500bp).
3) Map end sequences to human genome.
Tumor DNA
Rearrangement
Cluster invalid pairs
Chimeric clone
Isolated invalid pair
yx
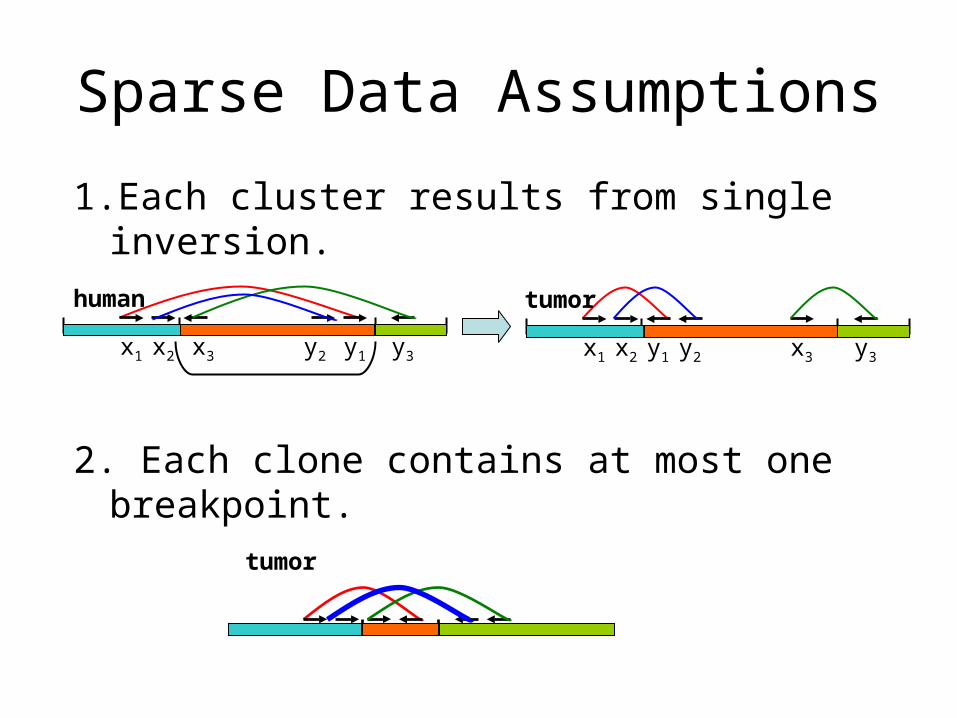
Sparse Data Assumptions
tumor
1.Each cluster results from single inversion.
2. Each clone contains at most one breakpoint.
human
y1x2 x3 y3y2x1 y1x2 x3 y3y2x1
tumor
Human
Human
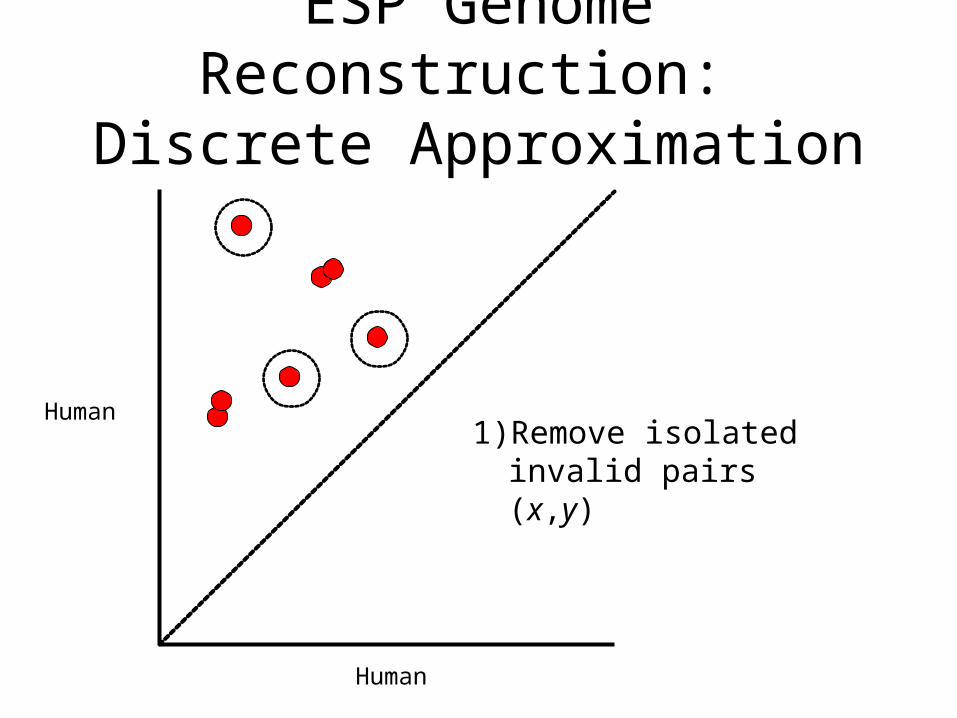
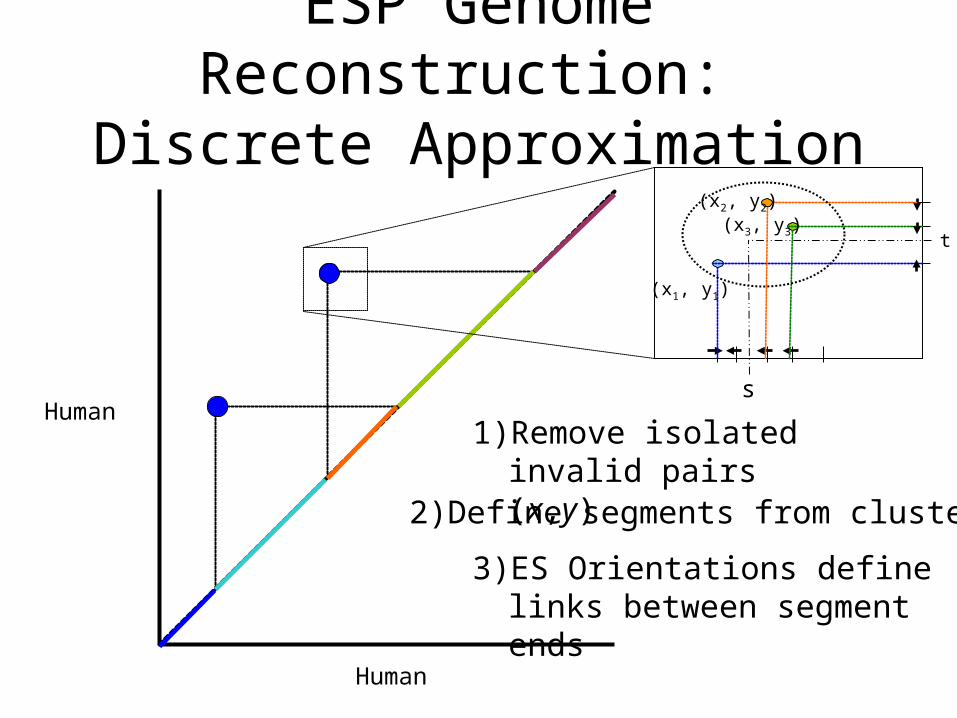
ESP Genome Reconstruction: Discrete Approximation
1) Remove isolated invalid pairs (x,y)
Human
Human
2) Define segments from clusters
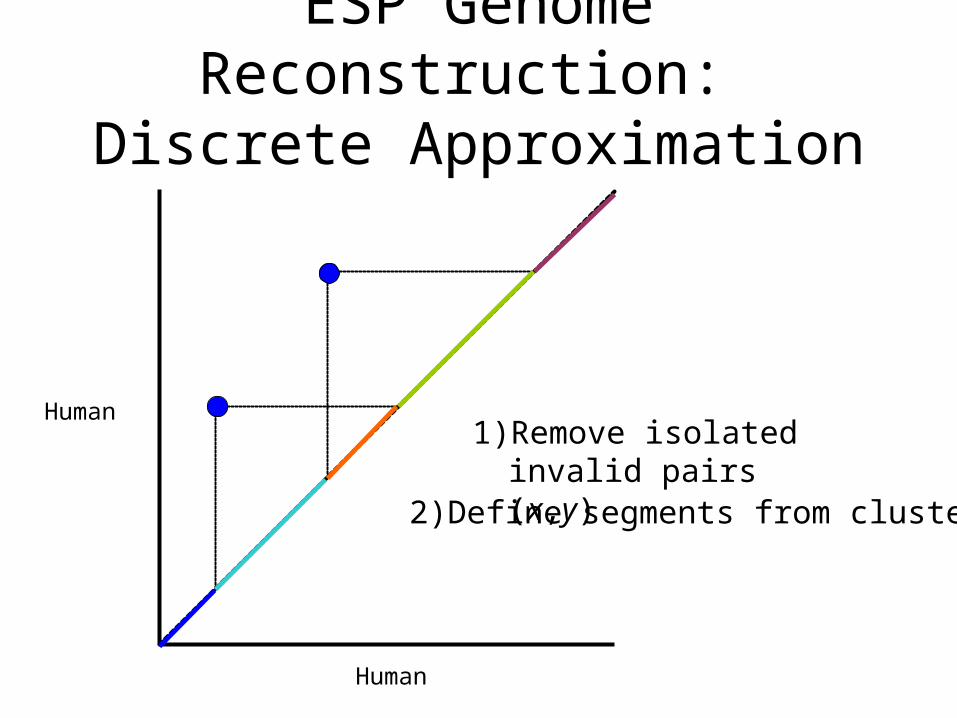
ESP Genome Reconstruction: Discrete Approximation
1) Remove isolated invalid pairs (x,y)
Human
Human
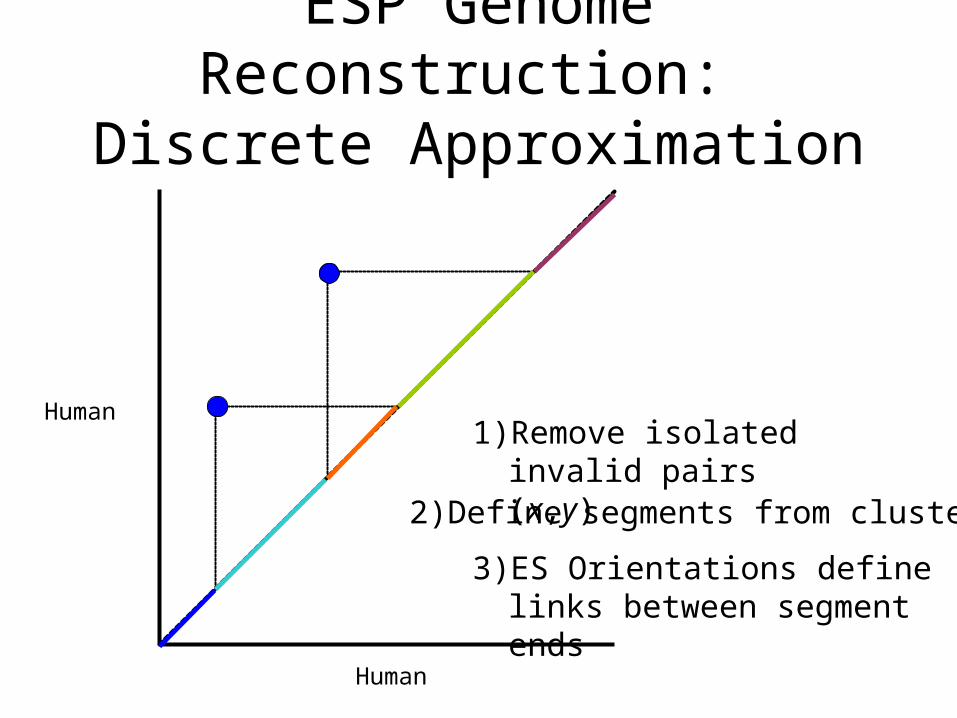
3) ES Orientations define links between segment ends
ESP Genome Reconstruction: Discrete Approximation
2) Define segments from clusters
1) Remove isolated invalid pairs (x,y)
Human
Human
ESP Genome Reconstruction: Discrete Approximation
(x2, y2)(x3, y3)
(x1, y1)
t
s
3) ES Orientations define links between segment ends
2) Define segments from clusters
1) Remove isolated invalid pairs (x,y)
2
3
5
1
4
2
3
5
1
4
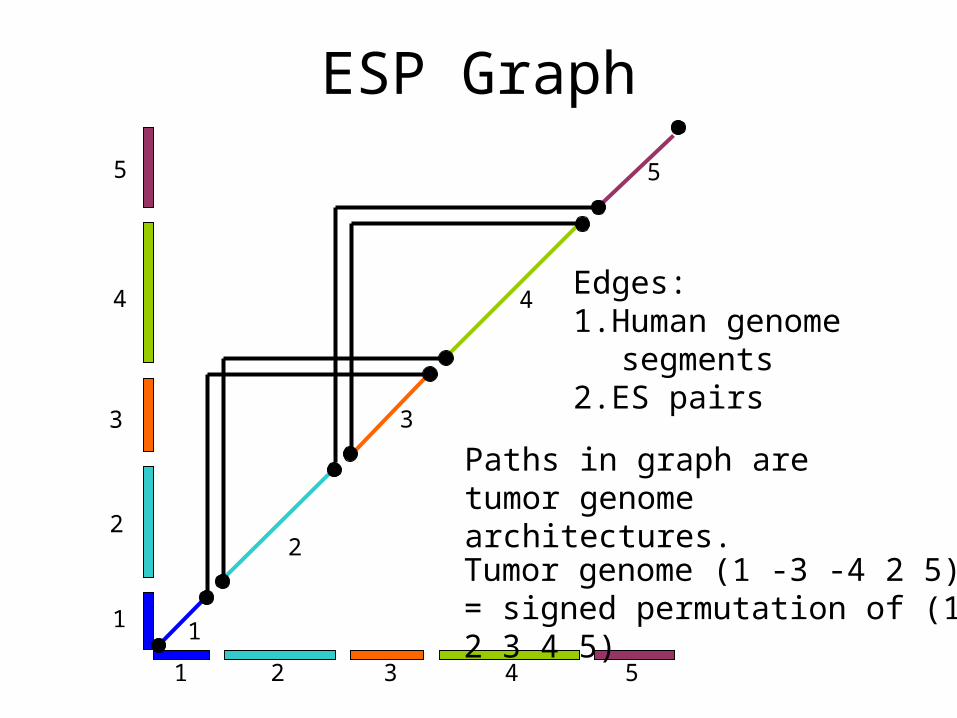
ESP Graph
2 3 51 4
Tumor genome (1 -3 -4 2 5)= signed permutation of (1 2 3 4 5)
Paths in graph are tumor genome architectures.
Edges:1. Human genome
segments2. ES pairs
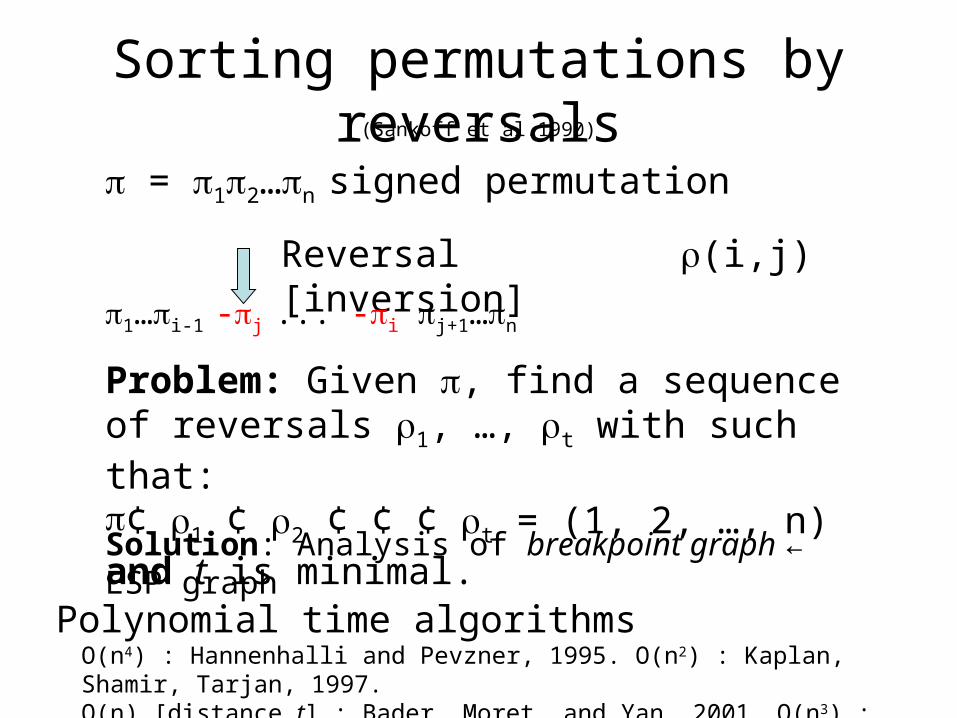
(Sankoff et al.1990)Sorting permutations by reversals
Polynomial time algorithms O(n4) : Hannenhalli and Pevzner, 1995. O(n2) : Kaplan, Shamir, Tarjan, 1997.O(n) [distance t] : Bader, Moret, and Yan, 2001. O(n3) : Bergeron, 2001.
Reversal (i,j) [inversion]
= 12…n signed permutation
Problem: Given , find a sequence of reversals 1, …, t with such that: ¢ 1 ¢ 2 ¢ ¢ ¢ t = (1, 2, …, n) and t is minimal.
1…i-1 -j ... -i j+1…n
Solution: Analysis of breakpoint graph ← ESP graph
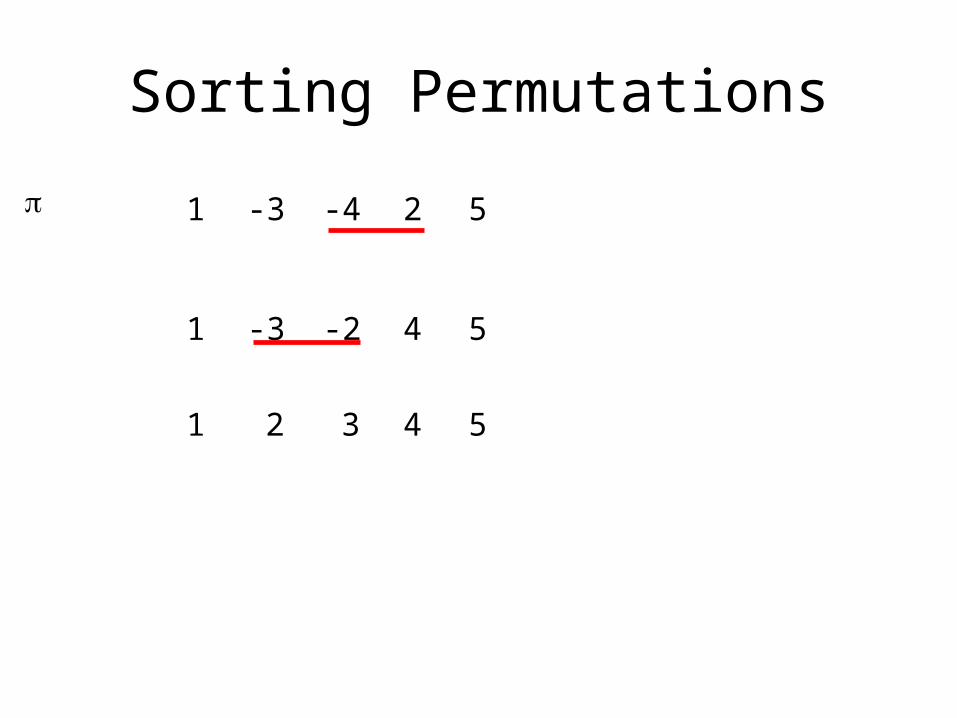
Sorting Permutations
2 3 4 51
-4 2 5-31
-3 -2 4 51
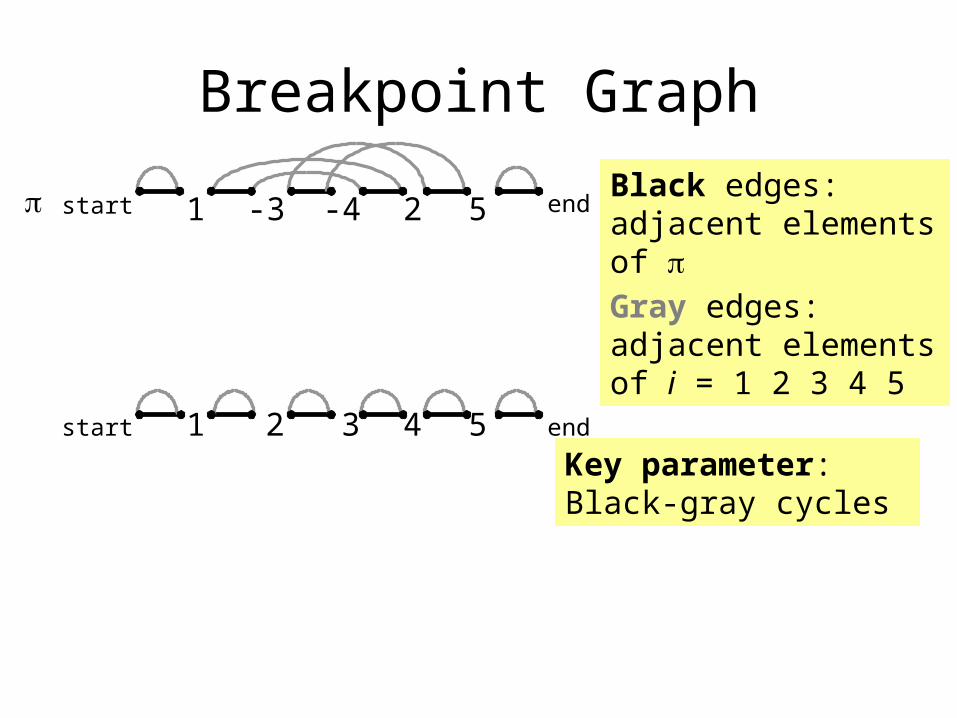
Breakpoint Graph
end
2 3 4 51
-4 2 5-31start
start
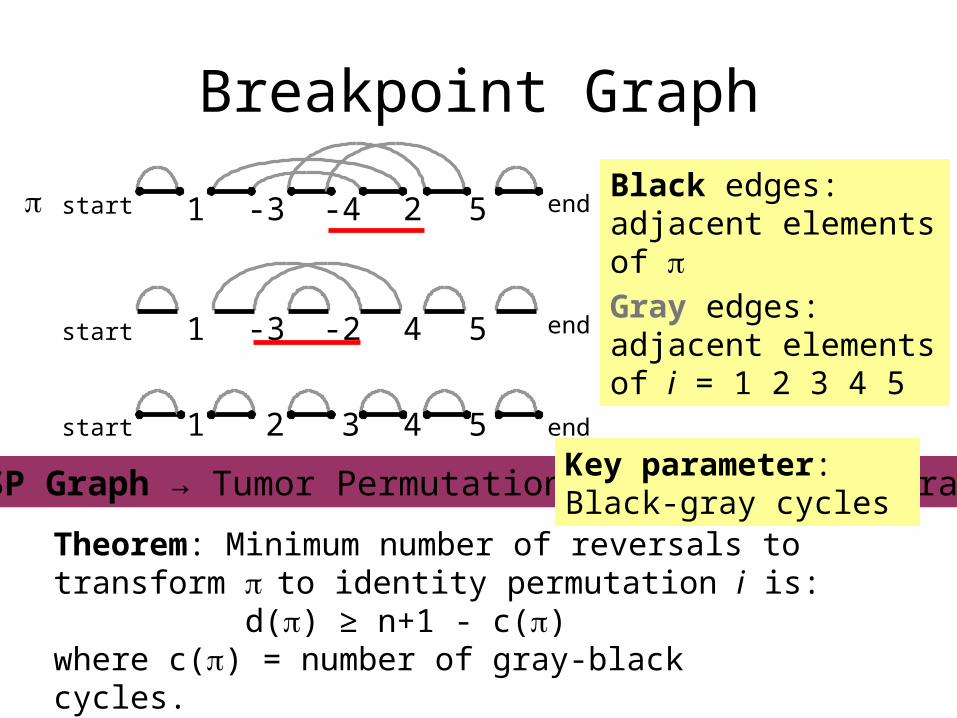
Black edges: adjacent elements of
end
Gray edges: adjacent elements of i = 1 2 3 4 5
Key parameter: Black-gray cycles
Breakpoint Graph
end
2 3 4 51
-4 2 5-31start
start
Theorem: Minimum number of reversals to transform to identity permutation i is:
d() ≥ n+1 - c()where c() = number of gray-black cycles.
Black edges: adjacent elements of
end
start -3 -2 4 51 endGray edges: adjacent elements of i = 1 2 3 4 5
ESP Graph → Tumor Permutation and Breakpoint GraphKey parameter: Black-gray cycles
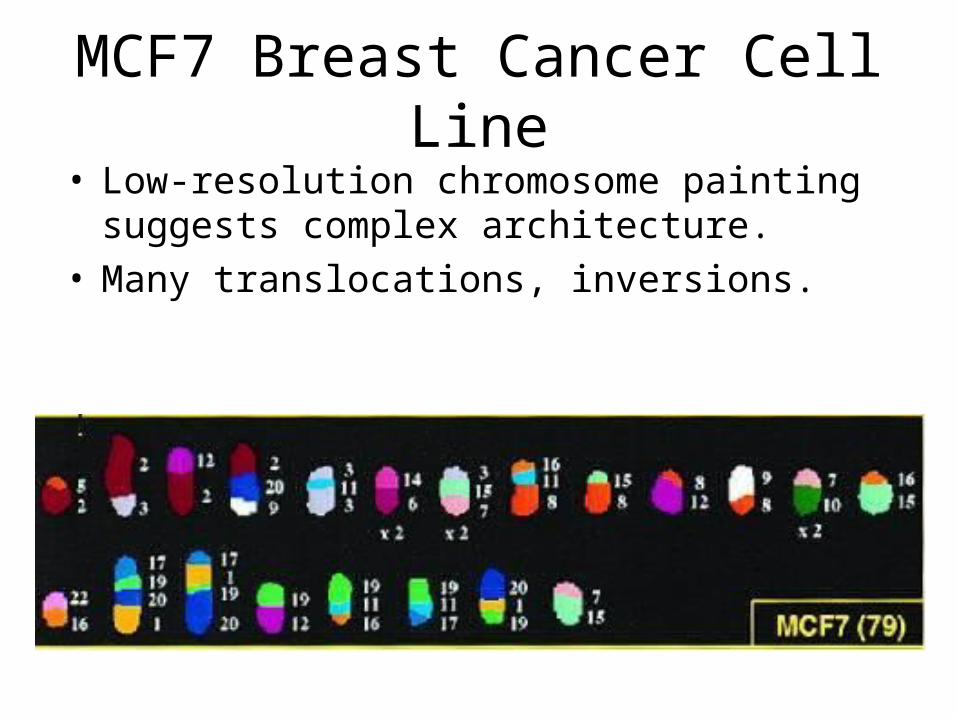
MCF7 Breast Cancer Cell Line• Low-resolution chromosome painting suggests
complex architecture.• Many translocations, inversions.
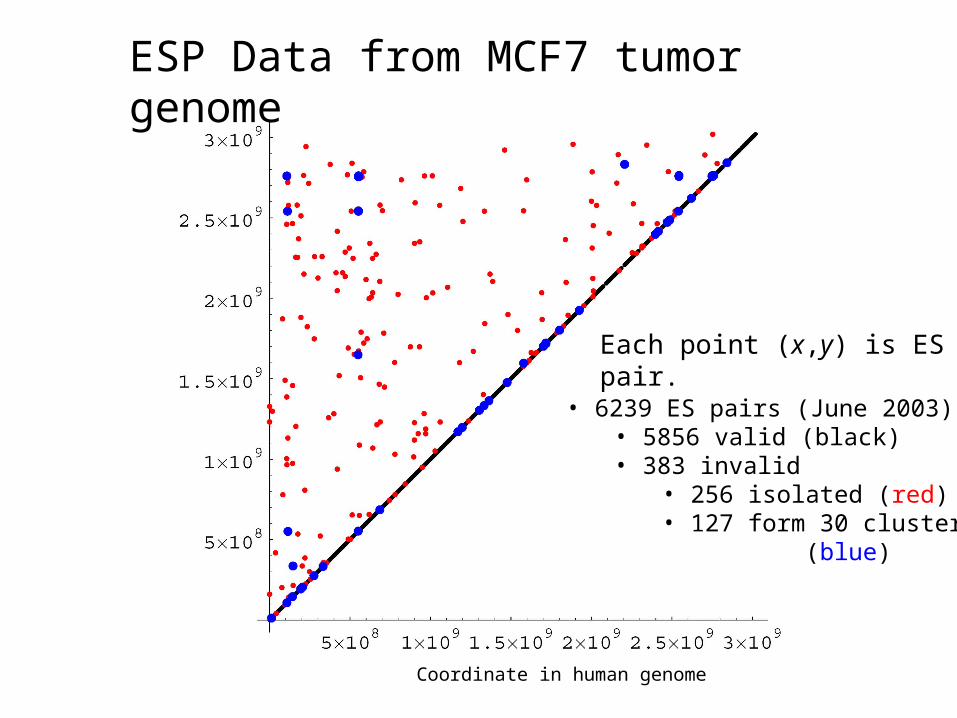
ESP Data from MCF7 tumor genome
Each point (x,y) is ES pair.
Coordinate in human genome
• 6239 ES pairs (June 2003)• 5856 valid (black)• 383 invalid
• 256 isolated (red)• 127 form 30 clusters
(blue)
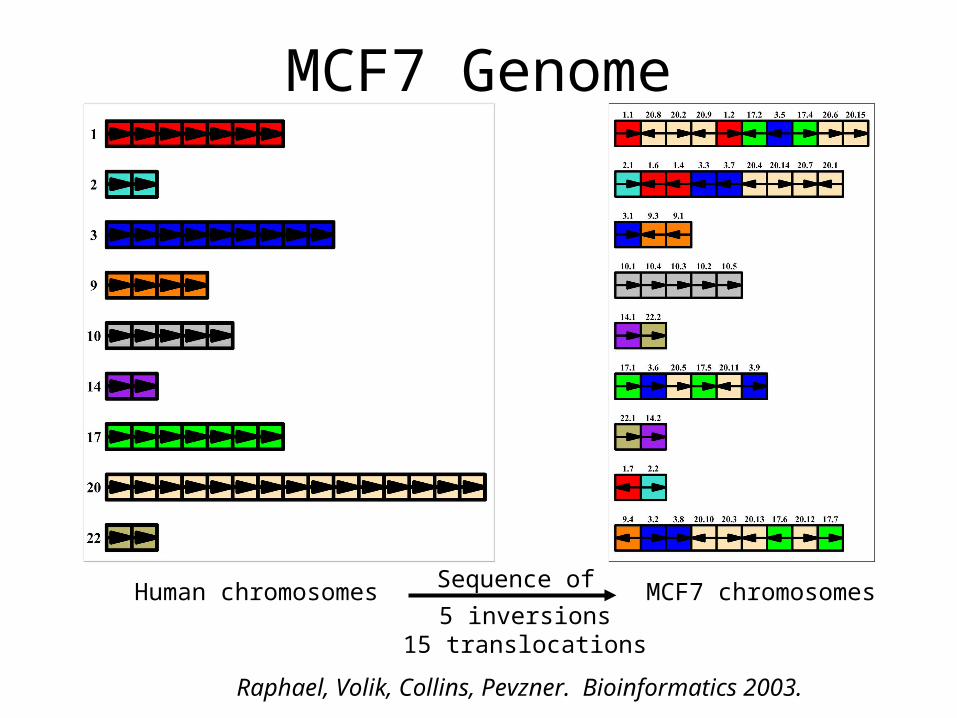
MCF7 Genome
Human chromosomes MCF7 chromosomes5 inversions
15 translocations
Raphael, Volik, Collins, Pevzner. Bioinformatics 2003.
Sequence of
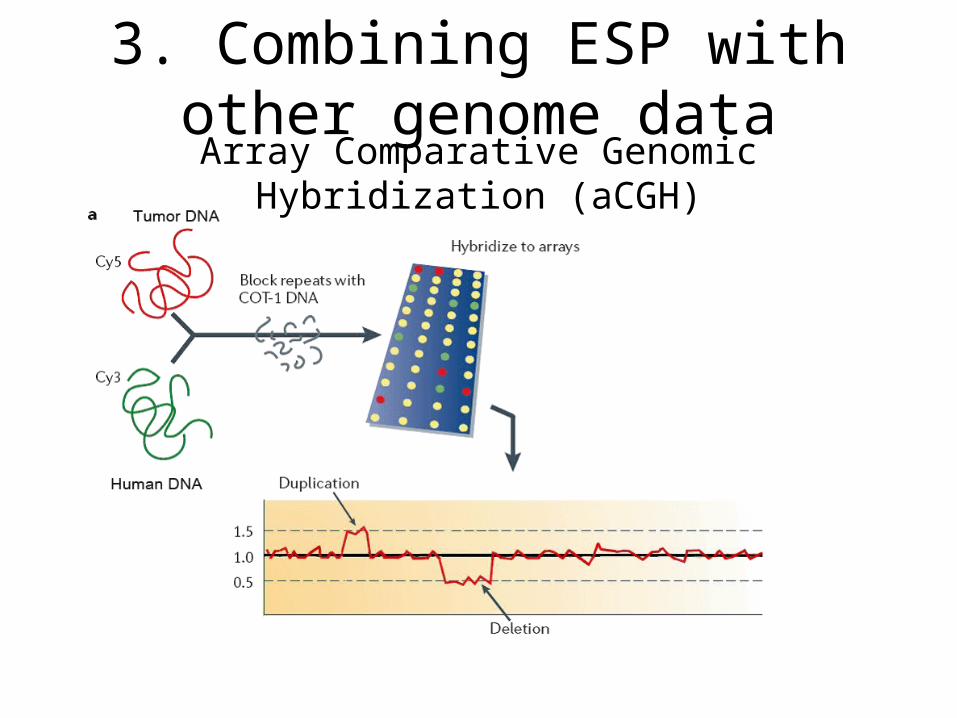
Array Comparative Genomic Hybridization (aCGH)
3. Combining ESP with other genome data
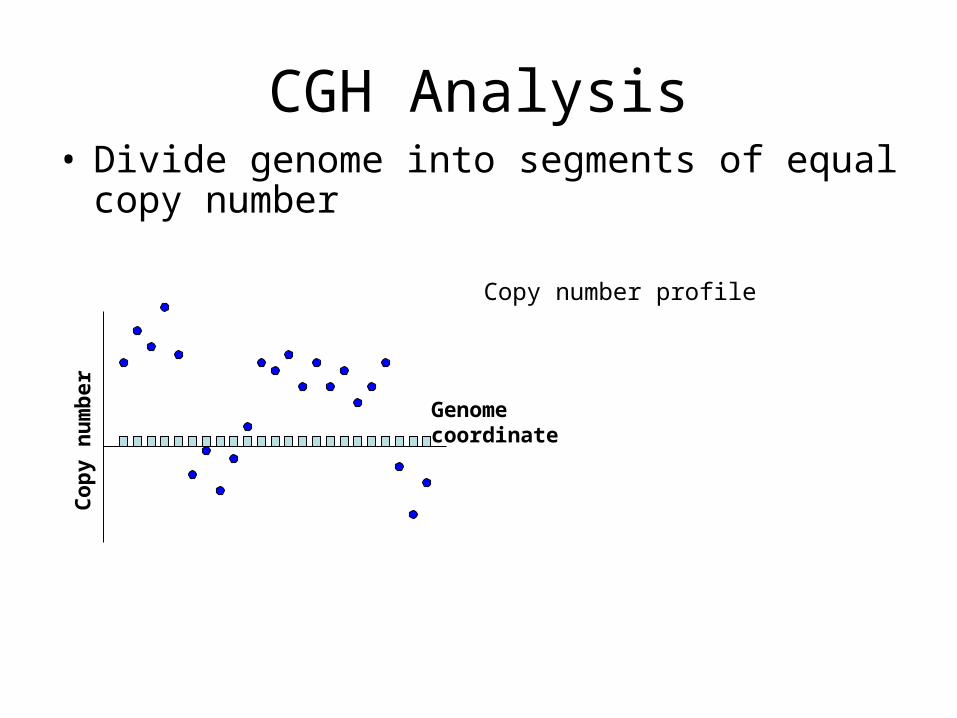
CGH Analysis• Divide genome into segments of equal copy
number
Copy number profile
Co
py
nu
mb
er
Genomecoordinate
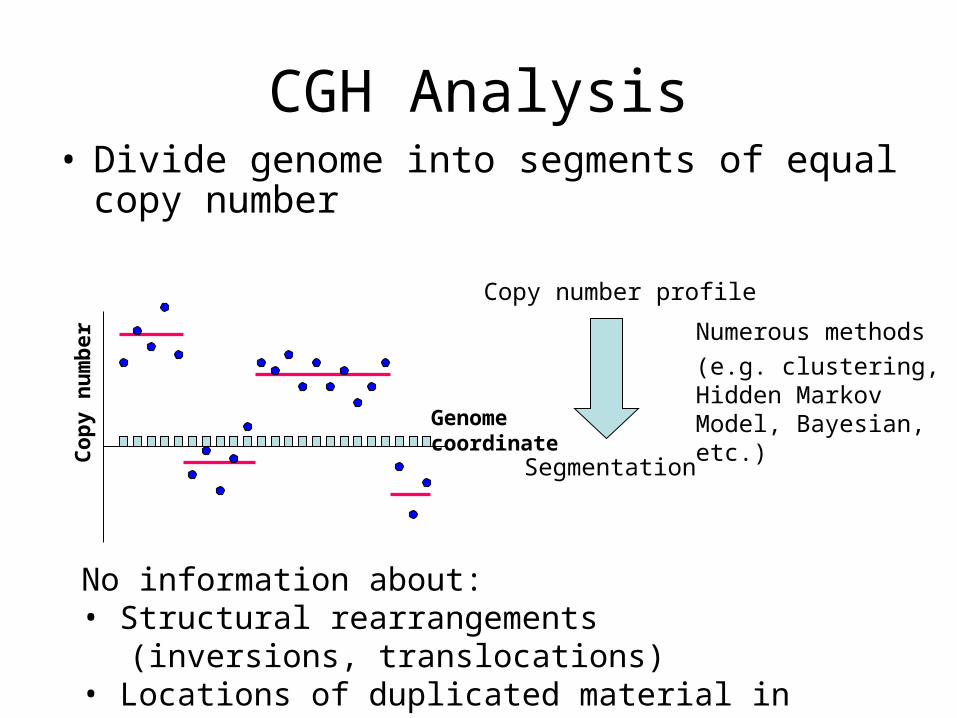
CGH Analysis• Divide genome into segments of equal copy
number
Copy number profile
Numerous methods
(e.g. clustering, Hidden Markov Model, Bayesian, etc.)
Segmentation
No information about:• Structural rearrangements
(inversions, translocations)• Locations of duplicated material in tumor genome.
Co
py
nu
mb
er
Genomecoordinate
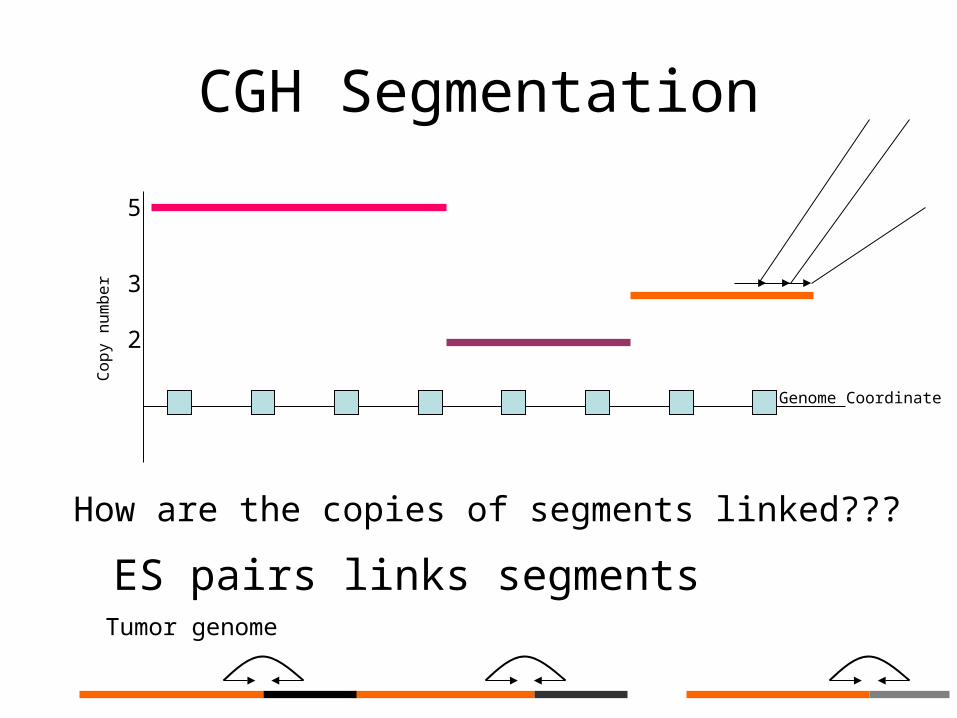
CGH Segmentation
How are the copies of segments linked???
Co
py
nu
mb
er
Genome Coordinate
3
2
5
Tumor genome
ES pairs links segments
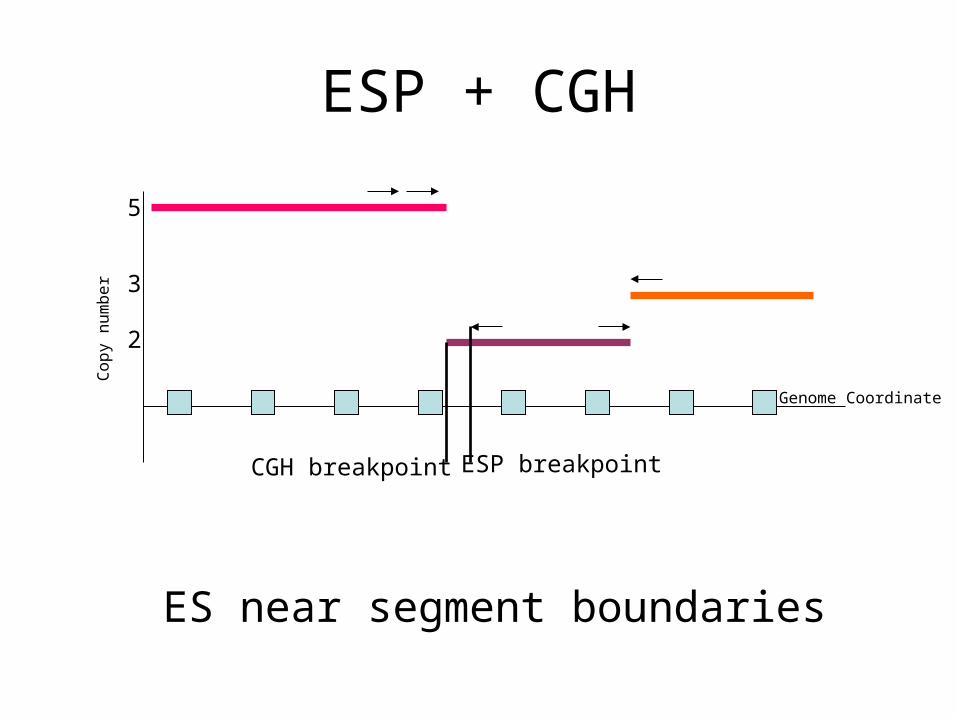
ESP + CGH
ES near segment boundaries
Co
py
nu
mb
er
Genome Coordinate
3
2
5
CGH breakpoint ESP breakpoint
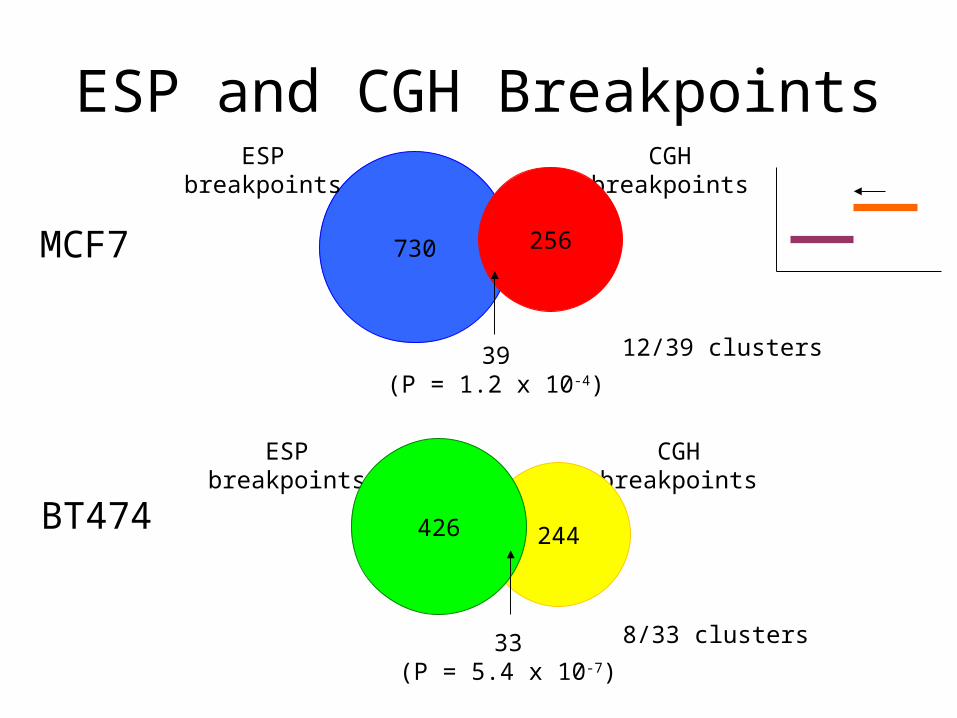
ESP and CGH Breakpoints
BT474
MCF7
ESPbreakpoints
CGHbreakpoints
33(P = 5.4 x 10⁻⁷)
244426
39(P = 1.2 x 10⁻⁴)
730
ESPbreakpoints
CGHbreakpoints
256
12/39 clusters
8/33 clusters
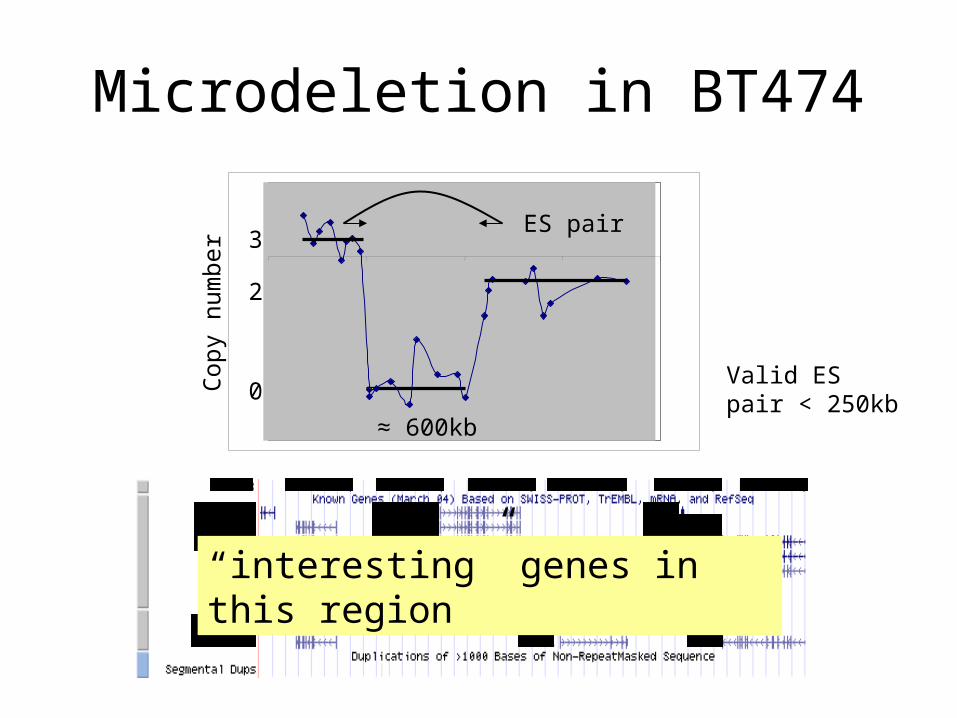
Microdeletion in BT474
3
2
0
Cop
y nu
mbe
rES pair
≈ 600kb
Valid ESpair < 250kb
“interesting” genes in this region
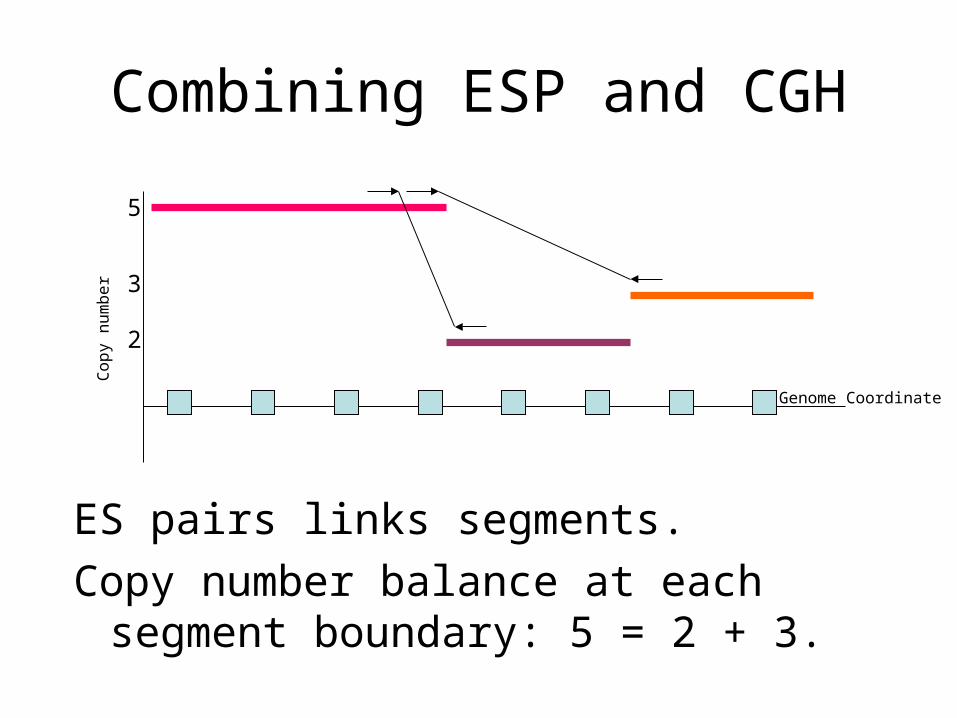
Combining ESP and CGH
ES pairs links segments.
Copy number balance at each segment boundary: 5 = 2 + 3.
Co
py
nu
mb
er
Genome Coordinate
3
2
5
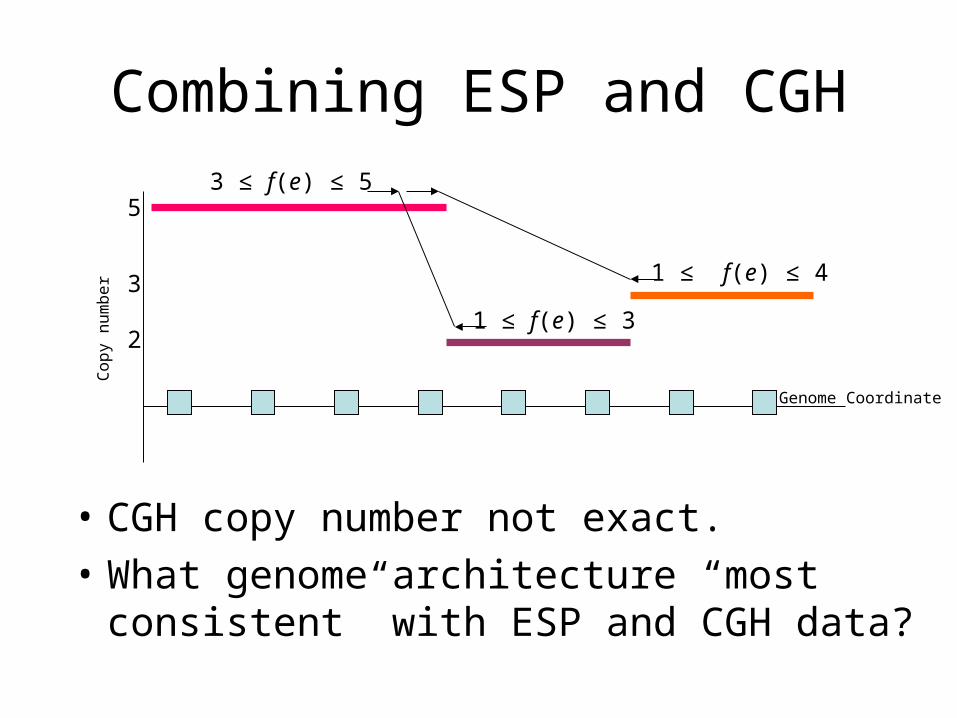
Combining ESP and CGH
• CGH copy number not exact.
• What genome architecture “most consistent” with ESP and CGH data?
Co
py
nu
mb
er
Genome Coordinate
3
2
53 ≤ f(e) ≤ 5
1 ≤ f(e) ≤ 3
1 ≤ f(e) ≤ 4
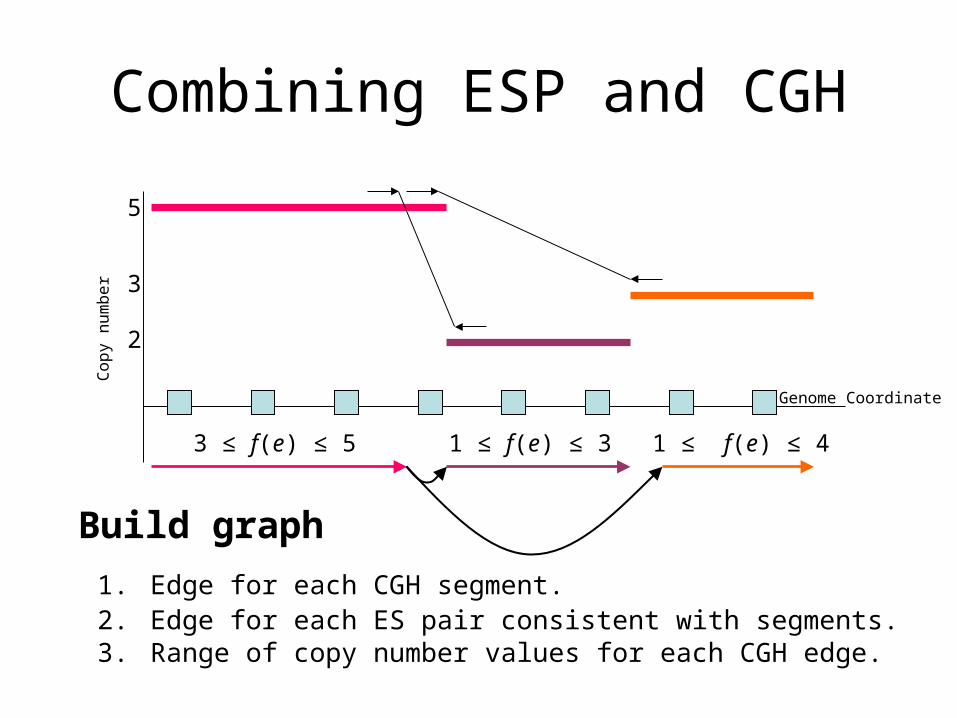
Combining ESP and CGHC
op
y n
um
be
r
Genome Coordinate
3
2
5
1. Edge for each CGH segment. 2. Edge for each ES pair consistent with segments.3. Range of copy number values for each CGH edge.
Build graph
3 ≤ f(e) ≤ 5 1 ≤ f(e) ≤ 3 1 ≤ f(e) ≤ 4
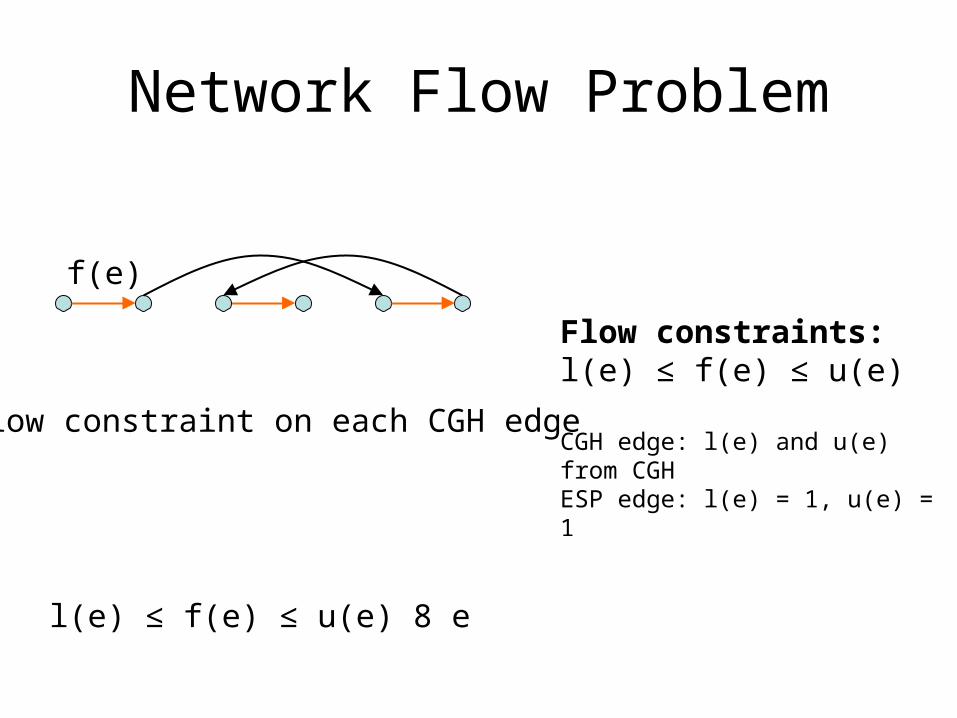
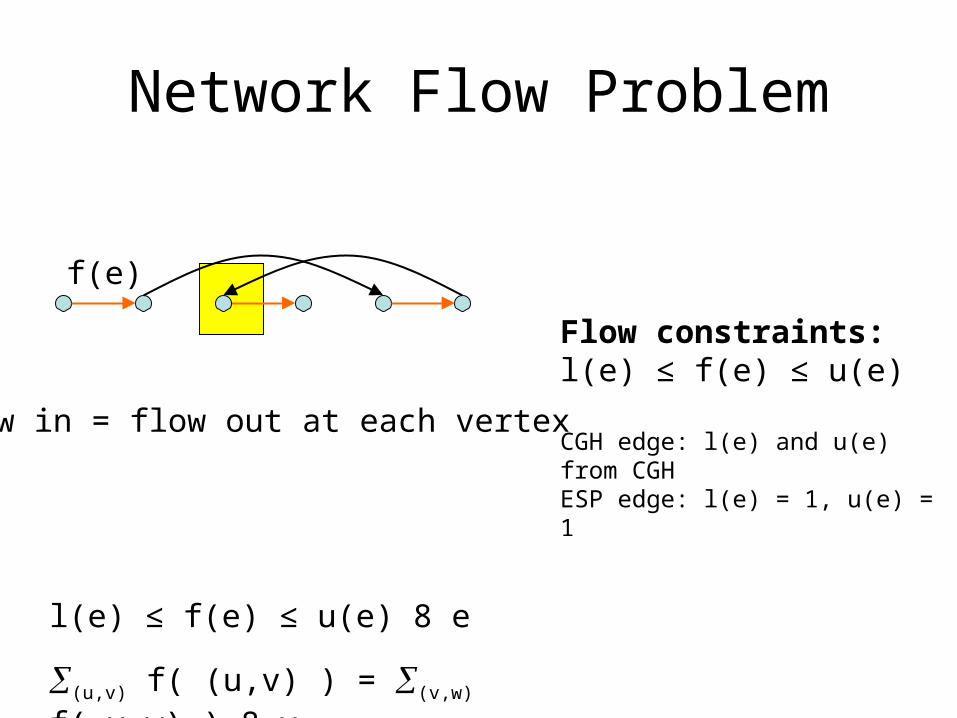
Network Flow Problem
Flow constraints:l(e) ≤ f(e) ≤ u(e)
CGH edge: l(e) and u(e) from CGHESP edge: l(e) = 1, u(e) = 1
f(e)
Flow constraint on each CGH edge
l(e) ≤ f(e) ≤ u(e) 8 e
Network Flow Problem
Flow constraints:l(e) ≤ f(e) ≤ u(e)
CGH edge: l(e) and u(e) from CGHESP edge: l(e) = 1, u(e) = 1
f(e)
Flow in = flow out at each vertex
(u,v) f( (u,v) ) = (v,w) f( v,w) ) 8 v
l(e) ≤ f(e) ≤ u(e) 8 e
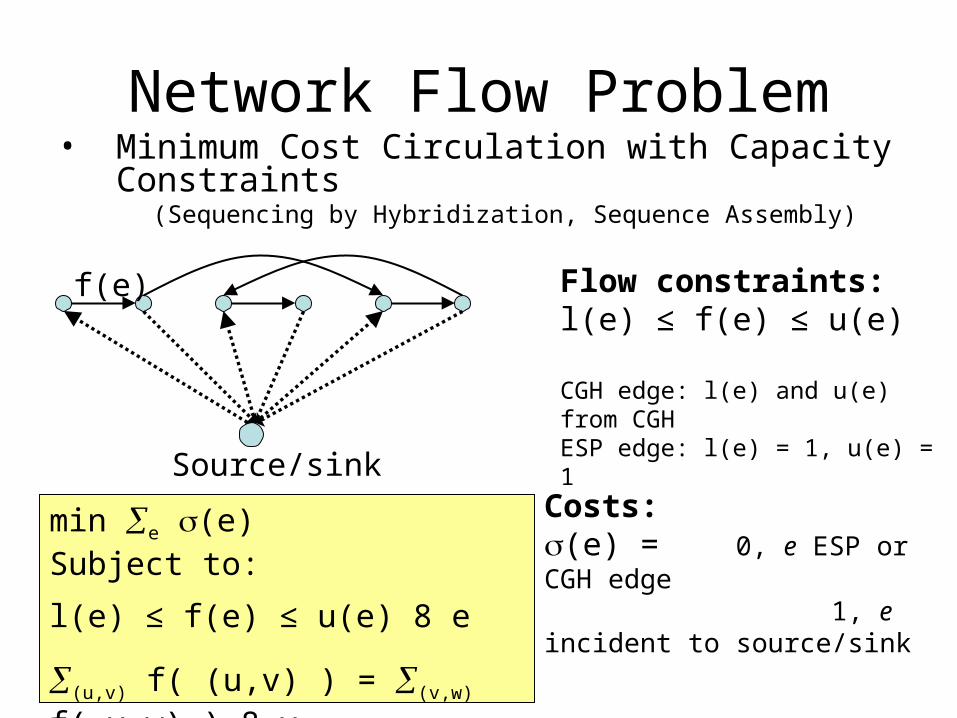
Network Flow Problem• Minimum Cost Circulation with Capacity
Constraints (Sequencing by Hybridization, Sequence Assembly)
Source/sink
min e (e)Subject to:
Costs: (e) = 0, e ESP or CGH edge 1, e incident to source/sink
f(e)
(u,v) f( (u,v) ) = (v,w) f( v,w) ) 8 v
l(e) ≤ f(e) ≤ u(e) 8 e
Flow constraints:l(e) ≤ f(e) ≤ u(e)
CGH edge: l(e) and u(e) from CGHESP edge: l(e) = 1, u(e) = 1
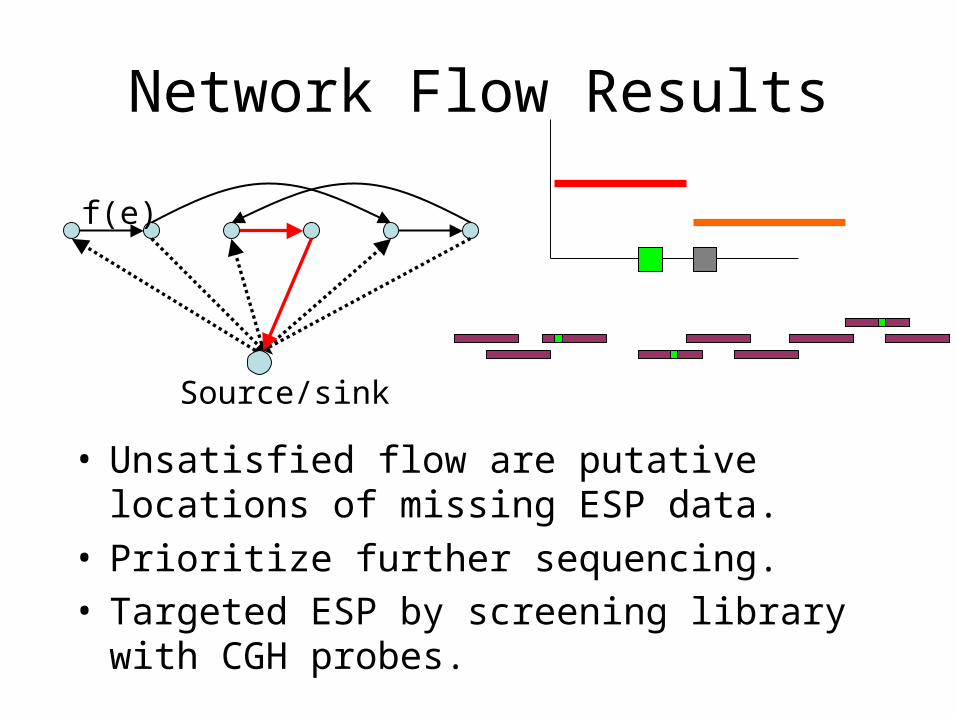
Network Flow Results
• Unsatisfied flow are putative locations of missing ESP data.
• Prioritize further sequencing.
Source/sink
f(e)
• Targeted ESP by screening library with CGH probes.
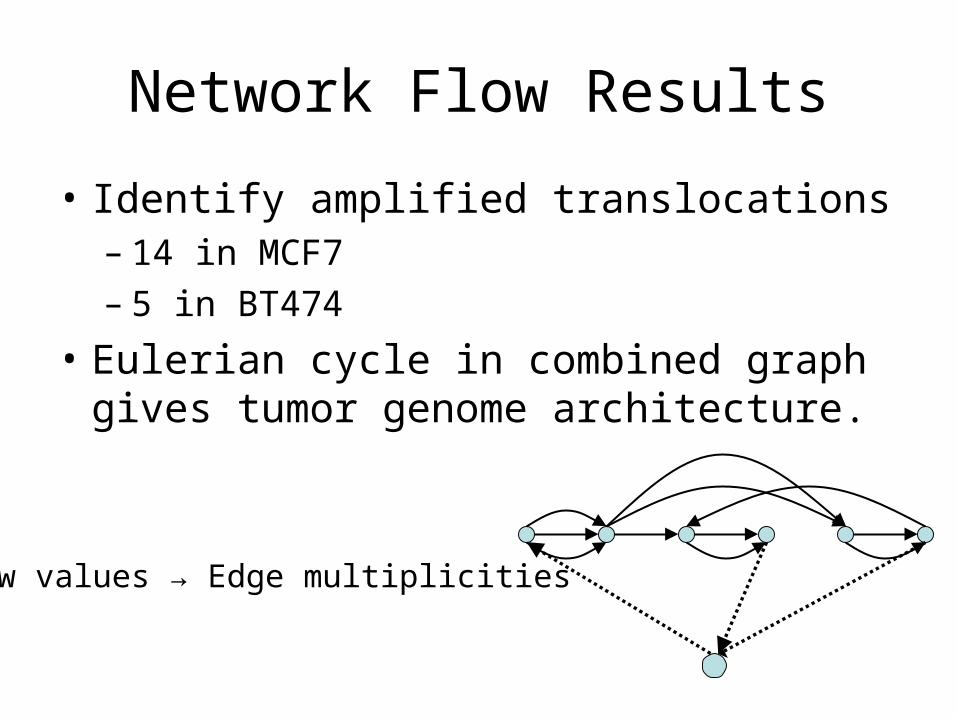
Network Flow Results
• Identify amplified translocations– 14 in MCF7– 5 in BT474
• Eulerian cycle in combined graph gives tumor genome architecture.
Flow values → Edge multiplicities

Human Cancer Genome Project
• What tumors to sequence?
• What to sequence from each tumor?1. Whole genome: all alterations
2. Specific genes: point mutations
3. Hybrid approach: structural rearrangements
etc.
Human Cancer Genome Project


![35 [2,3]-sigmatropic rearrangements](https://img.pdfslide.us/doc/110x75/55504042b4c905b2788b48e9/35-23-sigmatropic-rearrangements.jpg)