Embed Size (px)
Citation preview

Real-time in situ measurements of atmospheric opticalabsorption in the visible via photoacoustic spectroscopy.1: Evaluation of photoacoustic cells
Karen M. Adams
Four configurations of resonant photoacoustic cells were evaluated for maximum signal sensitivity to lightabsorption by the sample, with minimal noise and background. Theoretical and experimental data arediscussed. Azimuthal and radial resonant modes were compared for one cell. Of the four, the best cell was abrass cylinder, 2.5-cm radius and 9.5-cm length, which was operated in the azimuthal mode. An argon-ionlaser (X = 514.5 nm) was the light source. A continuous sample flow through the cell, required for real-time insitu atmospheric measurements, gave an acceptable noise level and time for signal response at -500 cc/min.Linearity of the photoacoustic signal was checked in the range applicable to atmospheric absorption. At asignal-to-noise ratio (SNR) equal to 1, a light absorption detection limit of 4.7 X 10⁻⁶ m- 1 could be achieved.
1. Introduction
The photoacoustic effect, discovered around 1880,was first reported by Alexander Graham Bell.1 2
Technical and historical reviews of this subject can befound in several sources.3-6 The basic experimentalarrangement for producing this effect consists of amodulated light beam which is passed through a sam-ple-containing cell. Light energy absorbed by thesample is transferred as heat energy to the surroundinggas in the cell. Subsequent expansion of the heatedgas causes a pressure rise which cycles according to themodulation frequency of the light. This pressure vari-ation is a sound wave which can be detected with amicrophone. Applications of the photoacoustic effectwere few before sensitive microphones became avail-able around 1940, and subsequently were limited, ingeneral, to absorption spectroscopic analysis, includ-ing concentration determination, of gas samples. Itwas not until around 1970 that solids and other non-gaseous substances were studied with this method.The feasibility for in situ aerosol measurements, whichare important for atmospheric applications, was firstreported in 1977.7,8 However, Bell (see Ref. 6) and
The author is with Ford Motor Company, Scientific ResearchStaff, P.O. Box 2053, Dearborn, Michigan 48121-2053.
Received 22 February 1988.0003-6935/88/194052-05$02.00/0.( 1988 Optical Society of America.
Preece (see Ref. 4) were probably among the first toobserve a photoacoustic signal for an aerosol when theyexperimented with cigar smoke.
In this paper, several photoacoustic cells have beenevaluated for maximum signal sensitivity, with mini-mal noise and background, for application to real-timein situ atmospheric measurements. The photoacous-tic, spectroscopic technique measures the energy ofabsorbed light, and differs from conventional opticalspectroscopies which measure light attenuation or ex-tinction, i.e., scattering and absorption. Absorption ofvisible light in the atmosphere contributes significant-ly to the total atmospheric light extinction and is duealmost exclusively to aerosol elemental carbon andgaseous nitrogen dioxide.9 For the optical propertiesof atmospheric elemental carbon aerosol,10 11 more isstill to be learned. Atmospheric elemental carbon hasgenerally been sampled on filters thereby complicatingthe measurement and analysis of its optical properties.In the companion paper12 the practical use of photo-acoustic spectroscopy to measure real-time in situ at-mospheric optical absorption is described, signal inter-ferences are addressed, and validation data for mea-surements of in situ atmospheric elemental carbonaerosol are presented.
II. Experimental
The light source for this photoacoustic study was anargon-ion laser (cw) operated at X = 514.5 nm, general-ly with 1-W optical output. The light beam was modu-lated with a variable speed chopper operated at theappropriate resonant frequency of the cell.
4052 APPLIED OPTICS / Vol. 27, No. 19 / 1 October 1988
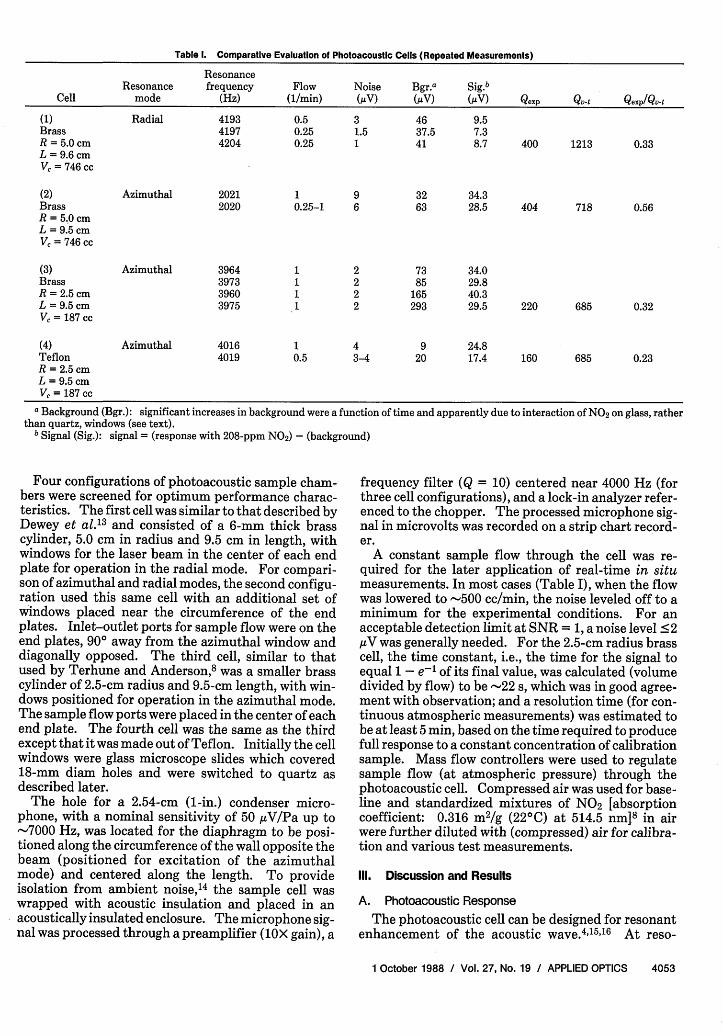
Table I. Comparative Evaluation of Photoacoustic Cells (Repeated Measurements)
ResonanceResonance frequency Flow Noise Bgr.a Sig.b
Cell mode (Hz) (1/min) (,UV) (,tV) (tV) Qexp Qu-t Qexp/Qv-t
(1) Radial 4193 0.5 3 46 9.5Brass 4197 0.25 1.5 37.5 7.3R = 5.0 cm 4204 0.25 1 41 8.7 400 1213 0.33L = 9.6 cmV = 746 cc
(2) Azimuthal 2021 1 9 32 34.3Brass 2020 0.25-1 6 63 28.5 404 718 0.56R = 5.0 cmL = 9.5 cmV = 746 cc
(3) Azimuthal 3964 1 2 73 34.0Brass 3973 1 2 85 29.8R = 2.5cm 3960 1 2 165 40.3L = 9.5 cm 3975 1 2 293 29.5 220 685 0.32V = 187 cc
(4) Azimuthal 4016 1 4 9 24.8Teflon 4019 0.5 3-4 20 17.4 160 685 0.23R = 2.5 cmL = 9.5 cmV = 187 cc
a Background (Bgr.): significant increases in background were a function of time and apparently due to interaction of NO2 on glass, ratherthan quartz, windows (see text).
b Signal (Sig.): signal = (response with 208-ppm NO2) - (background)
Four configurations of photoacoustic sample cham-bers were screened for optimum performance charac-teristics. The first cell was similar to that described byDewey et al.13 and consisted of a 6-mm thick brasscylinder, 5.0 cm in radius and 9.5 cm in length, withwindows for the laser beam in the center of each endplate for operation in the radial mode. For compari-son of azimuthal and radial modes, the second configu-ration used this same cell with an additional set ofwindows placed near the circumference of the endplates. Inlet-outlet ports for sample flow were on theend plates, 90° away from the azimuthal window anddiagonally opposed. The third cell, similar to thatused by Terhune and Anderson,8 was a smaller brasscylinder of 2.5-cm radius and 9.5-cm length, with win-dows positioned for operation in the azimuthal mode.The sample flow ports were placed in the center of eachend plate. The fourth cell was the same as the thirdexcept that it was made out of Teflon. Initially the cellwindows were glass microscope slides which covered18-mm diam holes and were switched to quartz asdescribed later.
The hole for a 2.54-cm (1-in.) condenser micro-phone, with a nominal sensitivity of 50 uV/Pa up to-7000 Hz, was located for the diaphragm to be posi-tioned along the circumference of the wall opposite thebeam (positioned for excitation of the azimuthalmode) and centered along the length. To provideisolation from ambient noise,14 the sample cell waswrapped with acoustic insulation and placed in anacoustically insulated enclosure. The microphone sig-nal was processed through a preamplifier (OX gain), a
frequency filter (Q = 10) centered near 4000 Hz (forthree cell configurations), and a lock-in analyzer refer-enced to the chopper. The processed microphone sig-nal in microvolts was recorded on a strip chart record-er.
A constant sample flow through the cell was re-quired for the later application of real-time in situmeasurements. In most cases (Table I), when the flowwas lowered to -500 cc/min, the noise leveled off to aminimum for the experimental conditions. For anacceptable detection limit at SNR = 1, a noise level <2/V was generally needed. For the 2.5-cm radius brasscell, the time constant, i.e., the time for the signal toequal 1 - e-1 of its final value, was calculated (volumedivided by flow) to be -22 s, which was in good agree-ment with observation; and a resolution time (for con-tinuous atmospheric measurements) was estimated tobe at least 5 min, based on the time required to producefull response to a constant concentration of calibrationsample. Mass flow controllers were used to regulatesample flow (at atmospheric pressure) through thephotoacoustic cell. Compressed air was used for base-line and standardized mixtures of NO2 [absorptioncoefficient: 0.316 m2/g (220 C) at 514.5 nm]8 in airwere further diluted with (compressed) air for calibra-tion and various test measurements.
Ill. Discussion and Results
A. Photoacoustic Response
The photoacoustic cell can be designed for resonantenhancement of the acoustic wave.4 516 At reso-
1 October 1988 / Vol. 27, No. 19 / APPLIED OPTICS 4053

nance, the standing wave can accumulate energy to anextent much larger than the energy input per cycle. Aconvenient cell geometry for this type of operation is acylinder.13 The normal vibration modes, pj, of anenclosed cylinder of length L and radius R are de-scribed by the solution to the wave equation'7:
pj = Pj sin(mo) cos(k7rz/L)Jm(amnirr/R) exp(-iwjt), (1)
wj = rco[(k/L)2 + (am n/R)2 ] 2, (2)
where wj is the frequency of the jth mode;P. is a normalization coefficient such that
Vc PPkdV = 1 forj = k and forj #d k, V,is the chamber volume, and p; is the complexconjugate of pj;
k,m,n are eigenvalues defining the longitudinal,azimuthal, and radial modes, respectively;
z,r, are standard cylindrical coordinates;Jm is the Bessel function;
am,n is the nth solution of (dJm/dr) = 0 at r = R;t is time; and
co is the speed of sound in the gas in the cylinder.A laser beam can best excite the radial mode of the
cell when it is coincident with the radial axis of thecylinder, while the azimuthal mode excitation is maxi-mized with the laser beam positioned near the endplate circumference and parallel to the radial axis.When the laser beam is modulated, the induced pres-sure within the cell can be described by4"15"16
such that
Aj =
P(M) = E Ajpj
-iw(y - 1)f3(Vd-' fJ pIdV
W2[1 - (w/wj)2 - i(1/WjQj)J
where y is the ratio of the specific heats, Cp/Cv, atconstant pressure and volume, respectively;
,B is the optical absorbance;I describes the spatial variation of the beam
intensity; andQj is the resonant enhancement factor for the
acoustic mode.The integral, V1 f p-Id V, represents the coupling
between the spatial profile of the beam intensity andthe normal mode, pj. When this coupling integral isevaluated with the spatial profile of the beam assumedidentical to the normal mode, giving perfect overlap, itreduces to IbV0' J pjpjdV = Ib, the beam intensity,where the beam power W is given by IbVc/L. Thisgives an upper limit for evaluation of the inducedpressure amplitude, which for the first-order radialmode of the frequency wool (i.e., k = 0, m =0, n = 1), canbe expressed as
P(Wool) = (y - 1)Q 1 WL PJo(ra 0 lr/R), (5)
where Pool = [Jo(7rao)]-l is the normalization coeffi-cient Pj for this mode. At r = R (the location of themicrophone), POOIJo(raol) = 1. For the lowest-order
azimuthal mode, an upper limit of the induced pres-sure at r = R and k = 90° is given by
P(W010) = ( - 1)Q010 WL PoloJl(7ra10 ), (6)Caj10 VI
where P010 = 21/2[J(7ralo) - J(-oa1)J 2(7ralo)]-l 2 is thenormalization coefficient for the first-order azimuthalmode. :Elsewhere,15l8 the effect of beam diameter onthis coupling integral for the lowest-order radial modewas evaluated with the beam profile represented by aGaussian function; the result was essentially insensi-tive to the beam diameter as long as there is strongoverlap of the spatial profiles of the beam and thenormal mode. This suggests that the above evaluationof the upper limit of the induced pressure amplitudemay be acceptable.
When there is no resonant enhancement, the zero-order pressure is simplified as
P(w) = (Y -1) WL *(7)C. V~
Comparison of this with Eqs. (5) and (6) indicates thatnonresonant operation can compete with resonant en-hancement at much lower frequencies and smaller cellvolumes; however, a number of practical difficultieshave been cited. At low frequencies, gas inlet-outletports act as pneumatic short circuits for the inducedpressure.19 Noise from external acoustics and sampleflow increases as 1/f.19 Excess acoustic energy in pre-vious cycles of the modulated light can produce noisein the nonresonant signal, while in resonant operationthis type of noise is avoided because the energy in eachcycle contributes to a standing wave.18 For the small,nonresonant cell, attachment of the microphone can beawkward and lead to difficulties in extracting the opti-mum pressure response signal.15
Another serious problem can be the background sig-nal caused by absorption of incident light by cell win-dows and by absorption of scattered light by cellwalls.20 In principle background can be handled bysubtracting it from the signal,21 but it should be mini-mized because uncertainty in background leads to un-certainty in signal. Theoretically, background fromabsorption of scattered light by the cell walls should beeliminated by resonant operation because the spaceand time properties of these background sound waveswould not be expected to couple to the resonantwave13; however this has been shown to be only partial-ly true. 5" 8 For real-time photoacoustic measure-ments of light absorbing atmospheric species, back-ground from light scattering species in theatmospheric sample cannot be correctly subtracteddue to the uncertainty of its magnitude as a function oftime. Evaluation of background signal from lightscattering atmospheric species is discussed further inthe second paper.12
B. Comparison of Cells
The four cell configurations described in Sec. II wereevaluated for maximum signal with minimal noise andbackground. The data for these four cell configura-
4054 APPLIED OPTICS / Vol. 27, No. 19 / 1 October 1988

tions are given in Table I. Noise and background weredetermined with air (from a compressed gas cylinder)at a constant flow rate through the cell. The noise wasreduced and leveled off by reducing the gas flow rate,'4as seen in Table I. The second cell configuration,which had the lowest resonant frequency, had the mostnoise as would be expected for 1/f dependence.' Asignificant portion of the background was determinedto be due to light absorption by the cell windows, and itgradually increased over time (weeks) with exposure ofthe cell windows to NO2 calibration gas, particularlyfor configuration (3) as indicated in Table I. This wasapparently due to adsorption and/or reaction of NO2on glass windows, since the background stabilizedwhen quartz windows were used.
The data summarized in Table I were generatedwith a standard mixture of 208-ppm NO2 in air as thesample gas. The signal values tabulated have back-ground subtracted. Comparison between measuredand theoretical signal levels can be analyzed with Eqs.(5) and (6). Four of the terms in this equation, Q, ,V,, and the Bessel term(s), vary depending on the cellconfiguration. The Q, co, and V, have been measuredfor each configuration. When the radial and azimuth-al modes for the same cell were compared, i.e., the firstand second cell configurations in Table I, the measuredQ values were essentially the same, the resonant fre-quency of the radial mode was twice that of the azi-muthal mode, and the V, values were identical. TheBessel terms were evaluated and found to bePooiJo(iraoi) = 1.0 and PoloJ(7ralo) = 1.7 (calculatedfrom values in Morse'7 ). Substitution and compari-son of the relative values of these four factors into Eqs.(5) and (6) predict that the signal from the azimuthalmode should be 3.4 times that from the radial mode.This is in agreement with the threefold to fourfoldsignal enhancement reported in Table I.
When the azimuthal mode for two cell sizes arecompared (second and third configurations of Table I),the Bessel terms should be the same, the second cellhas a volume four times the third, a resonant frequencyhalf of the third, and a Q twice the third. Using Eq.(6), these factors predict that the two cells should havenearly the same signal, as is observed (Table I). How-ever, since the smaller cell was operated at twice thefrequency, it has the practical advantage of much low-er noise19 and therefore a better detection limit. Thisthird cell configuration was extensively evaluated foruse in ambient atmospheric measurements.
The fourth cell configuration, which was a Teflonversion of the third, had a higher noise level, probablydue to less dampening of ambient acoustics by Tefloncompared to brass. The lower signal for the Tefloncell was directly proportional to the lower Q.
Experimental estimates of the Q values in Table Icame from determining j/Aw where Aw is the half-power bandwidth of the resonant peak.'8 Theoreticalestimates of Q are difficult,822 but some qualitativeanalysis of their magnitude can be made to examinethe experimental Q values. 1/Q is a measure of the
acoustic energy loss, which causes the wave to dissi-pate, relative to the total energy in the standing wave,such that 1/Q = EL/27rET, where EL is the energy lossper cycle and ET is the total energy. Energy is lostfrom volumetric effects of internal acoustic processesand from surface effects of wave interaction with thecell walls and structures. The volumetric effects aregenerally minor, but when water vapor is present theyhave been estimated to be as high as 20% of the totalenergy loss.'8 The surface effects include: (1) vis-cous-thermal losses in the cell boundary layer; (2) re-flection losses; (3) scattering losses from surface ob-structions; and (4) energy absorption by themicrophone diaphragm. Viscous-thermal losses ap-pear to contribute 23-56% of the total energy lossindicated by the theoretical calculations for Q-t inTable I. Theoretical estimates of reflection losseswere 2 orders of magnitude lower than the viscous-thermal losses (1 order of magnitude lower for theTeflon cell). Scattering losses were extremely diffi-cult to estimate but have been suggested to be a majorprocess for the total energy loss.'8 Microphone losseswere also extremely difficult to evaluate, but an upperlimit can be estimated by assuming the microphoneabsorbs all the wave energy contacting it.18 In thatcase, the maximum fraction of the total energy loss tothe microphone would be the ratio of the surface areaof the microphone to that of the inside of the cell. ForKamm,'8 the surface area of the microphone dia-phragm was relatively small such that its maximumcontribution to Q would be negligible. For the photoa-coustic cells discussed herein, this estimate of the mi-crophone energy loss is interesting. If it were thedominant loss mechanism, the experimental Q valuesin Table I would depend, for the most part, on therelative surface area of the cylinder where the waveimpinges, and this appears to be the case. The upperlimit Q values for microphone losses are calculated tobe 540 for the 5.0-cm radius cells and 270 for the 2.5-cmradius cell, and are comparable to the observed valuesin Table I. This suggests that the microphone lossesare dominant for these cells.
C. Signal Linearity
The linearity of the photoacoustic signal as a func-tion of NO2 concentration was examined for the thirdcell configuration. Figure 1 shows the signal, with thebackground subtracted, for NO2 concentrations be-tween 1000 and 20 ppb, at -22 0C. The latter concen-tration is obtained at the lowest reliable dilution of thestandard gas (4.85-ppm NO2 in air) and is equal to anoptical absorption of 1.2 X 10⁻⁵ m-1 . Linear regres-sion of the data in Fig. 1 gave the following coefficients:
y = 0.1296(+0.0005)x - 1.1(+0.6), (8)
where y is the signal in juV and x is the concentration ofNO2 in ppb, with the correlation coefficient r =0.99992. The y intercept was within the experimentallimit of the signal noise, which was -1 ,V, and this lineessentially goes through the origin, as expected theo-retically.18
1 October 1988 / Vol. 27, No. 19 / APPLIED OPTICS 4055

40
120
3-J
U)
100
80
60
40
20
0 200 400 600 800 1000 1200CONCENTRATION NO2 (ppb)
Fig. 1. Linearity of the photoacoustic spectrometer signal as afunction of NO 2 concentration.
This figure demonstrates the applicability of thetechnique to the in situ measurement of light absorp-tion by atmospheric aerosols, an approach which isexamined in the second paper.' 2 For example, in ur-ban areas and in the northeast United States aerosollight absorption is generally dominated by elementalcarbon present at levels of 1-10 ,g/m 3. Assuming anabsorption coefficient for aerosol elemental carbon of9.5 m2/g,23 this is equivalent to aerosol light absorptionin the range of 10-5_10-4 m- 1 .
IV. Conclusion
Several photoacoustic cells were evaluated hereinfor application to real-time in situ atmospheric mea-surements of optical absorption. The best cell config-uration of the four examined was a brass cylinder of2.5-cm radius and 9.5-cm length with the first-orderazimuthal mode excited. Linearity was demonstratedin the range of atmospheric interest using NO2 stan-dards. At flow rates <500 cc/min, noise of -1 uVyielded a detection limit of 7.8-ppb NO2 , or 4.7 X 10⁻⁶m-' [calculated with 1000-ppb NO2 substituted intoEq. (8)] for SNR = 1. The cell volume, 187 cc, wassmall enough to give a time constant, -22 s, reasonablefor real-time in situ sampling. In the next paper,' 2 anumber of practical issues are addressed and actualatmospheric measurements are made.
The author would like to thank several people, J. E.Anderson, A. D. Brailsford, S. M. Japar, J. T. Kummer,J. M. Norbeck, W. R. Pierson, R. W. Terhune, and L. I.Davis, Jr., for their helpful discussions throughout thecourse of this work.
References1. A. G. Bell, "Article 34 on the Production and Reproduction of
Sound by Light," Am. J. Sci. 20, 305 (1880).2. A. G. Bell, "Upon the Production of Sound by Radiant Energy,"
Philos Mag. 11, 510 (1881).3. Y.-H. Pao, Ed., Optoacostic Spectroscopy and Detection (Aca-
demic, New York, 1977).4. A. Rosencwaig, Photoacoustics and Photoacoustic Spectrosco-
py (Wiley, New York, 1980).5. R. Kaiser, "On the Theory of the Spectrophone," Can. J. Phys.
37, 1499 (1959).6. M. J. Colles, N. R. Geddes, and E. Mehdzadek, "The Optoacous-
tic Effect," Contemp. Phys. 20, 11 (1979).7. C. W. Bruce and R. G. Pinnick, "In situ Measurements of
Aerosol Absorption with a Resonant cw Laser Spectrophone,"Appl. Opt. 16, 1762 (1977).
8. R. W. Terhune and J. E. Anderson, "Spectrophone Measure-ments of the Absorption of Visible Light by Aerosols in theAtmosphere," Opt. Lett. , 70 (1977).
9. B. J. Finlayson-Pitts and J. N. Pitts, Jr., Atmospheric Chemis-try: Fundamentals and Experimental Techniques (Wiley, NewYork, 1986), pp. 759-775.
10. H. E. Gerber and E. E. Hindman Eds., Light Absorption byAerosol Particles (Spectrum Press, Hampton, VA, 1982).
11. E. D. Goldberg, Black Carbon in the Environment (Wiley, NewYork, 1985), pp. 13-16.
12. K. M. Adams, L. I. Davis, Jr., S. M. Japar, and W. R. Pierson,"Real-Time, in situ Measurements of Atmospheric Optical Ab-sorption in the Visible Via Photoacoustic Spectroscopy. II.Validation for Atmospheric Elemental Carbon Aerosol," Atmo-spheric Environment (1988) accepted for publication.
13. C. F. Dewey, Jr., R. D. Kamm, and C. E. Hackett, "AcousticAmplifier for Detection of Atmospheric Pollutants," Appl.Phys. Lett. 23, 633 (1973).
14. E. Max and L.-G. Rosengren, "Characteristics of a ResonantOpto-Acoustic Gas Concentration Detector," Opt. Commun. 1 1,422 (1974).
15. C. F. Dewey, Jr., "Design of Optoacoustic Systems," in Optoa-coustic Spectroscopy and Detection, Y.-H. Pao, Ed. (Academic,New York, 1977), pp. 47-77.
16. L. B. Kreuzer, "The Physics of Signal Generation and Detec-tion," in Optoacoustic Spectrtoscopy and Detection, Y.-H. Pao,Ed. (Academic, New York, 1977), pp. 1-25.
17. P. M. Morse, Vibration and Sound (McGraw-Hill, New York,1936), pp. 231-234, 291-299.
18. R. D. Kamm, "Detection of Weakly Absorbing Gases UsingResonant Optoacoustic Method," J. Appl. Phys. 47,3550 (1976).
19. E. M. Kritchman, S. Shtrikman, and M. Slatkine, "ResonantOptoacoustic cells for Trace Gas Analysis," J. Opt. Soc. Am. 68,1257 (1978).
20. L. B. Kreuzer, "Ultralow Gas Concentration Infrared Absorp-tion Spectroscopy," J. Appl. Phys. 42, 2934 (1971).
21. L.-G. Rosengren, "Optimal Optoacoustic Detector Design,"Appl. Opt. 14, 1960 (1975).
22. P. M. Morse and K. V. Ingard, Theoretical Acoustics (McGraw-Hill, New York, 1968).
23. S. M. Japar, A. C. Szkarlat, and W. R. Pierson, "The Determina-tion of the Optical Properties of Airborne Particle Emissionsfrom Diesel Vehicles," Sci. Total Environ. 36, 121 (1984).
4056 APPLIED OPTICS / Vol. 27, No. 19 / 1 October 1988