Embed Size (px)
Citation preview
Recording Membrane Potential Changes through
Photoacoustic Voltage Sensitive Dye
Haichong K. Zhang,a Jeeun Kanga, Ping Yanb, Diane S. Abouc, Hanh N. D. Led,
Daniel L. J. Thorekc,e, Jin U. Kangd, Albert Gjeddef, Arman Rahmimc,d, Dean F. Wongc,g,h,i,
Leslie M. Loewb, Emad M. Boctora,c,d
aDepartment of Computer Science, The Johns Hopkins university, bR. D. Berlin Center for Cell Analysis and Modeling, University of Connecticut School of Medicine, cRussell H. Morgan Department of Radiology, The Johns Hopkins University School of Medicine, dDepartment of Electrical and Computer Engineering, The Johns Hopkins university, eDepartment of Oncology, Sidney Kimmel Comprehensive Cancer Center, The Johns Hopkins
University School of Medicine, fDepartment of Neuroscience and Pharmacology, University of Copenhagen, gDepartment of Neuroscience, The Johns Hopkins University, hDepartment of Psychiatry and Behavioral Sciences, The Johns Hopkins University, iDepartment of Neurology, The Johns Hopkins University.
ABSTRACT
Monitoring of the membrane potential is possible using voltage sensitive dyes (VSD), where fluorescence intensity
changes in response to neuronal electrical activity. However, fluorescence imaging is limited by depth of penetration and
high scattering losses, which leads to low sensitivity in vivo systems for external detection. In contrast, photoacoustic (PA)
imaging, an emerging modality, is capable of deep tissue, noninvasive imaging by combining near infrared light excitation
and ultrasound detection. In this work, we develop the theoretical concept whereby the voltage-dependent quenching of
dye fluorescence leads to a reciprocal enhancement of PA intensity. Based on this concept, we synthesized a novel near
infrared photoacoustic VSD (PA-VSD) whose PA intensity change is sensitive to membrane potential. In the polarized
state, this cyanine-based probe enhances PA intensity while decreasing fluorescence output in a lipid vesicle membrane
model. With a 3-9 μM VSD concentration, we measured a PA signal increase in the range of 5.3 % to 18.1 %, and observed
a corresponding signal reduction in fluorescence emission of 30.0 % to 48.7 %. A theoretical model successfully accounts
for how the experimental PA intensity change depends on fluorescence and absorbance properties of the dye. These results
not only demonstrate the voltage sensing capability of the dye, but also indicate the necessity of considering both
fluorescence and absorbance spectral sensitivities in order to optimize the characteristics of improved photoacoustic probes.
Together, our results demonstrate photoacoustic sensing as a potential new modality for sub-second recording and external
imaging of electrophysiological and neurochemical events in the brain.
Keywords: voltage sensitive dye, photoacoustics, fluorescence, membrane potential
1. INTRODUCTION
The quantification of neurotransmitter (NT) activity with high temporal resolution is essential to build a comprehensive
map of brain function. We need to improve upon the low temporal resolution, but high pharmacological specificity, of
PET and higher spatial and temporal resolution, but less specific, MRI. Membrane potential measurements utilizing direct
electrical recording or by imaging using voltage sensitive dyes (VSD), have been used to observe spontaneous NT events
by means of voltage fluctuations caused by ionic currents. Imaging approaches have the advantage, in general, that patterns
of activity can be studied with high resolution over large areas of brain [1]. However, purely optical based detection
approaches have several limitations which include a small dynamic range and only shallow penetration depth due to light
scattering and absorbance of overlying tissue in vivo.
Photons Plus Ultrasound: Imaging and Sensing 2017, edited by Alexander A. Oraevsky, Lihong V. Wang, Proc.of SPIE Vol. 10064, 1006407 · © 2017 SPIE · CCC code: 1605-7422/17/$18 · doi: 10.1117/12.2252442
Proc. of SPIE Vol. 10064 1006407-1
Downloaded From: http://proceedings.spiedigitallibrary.org/ on 03/28/2017 Terms of Use: http://spiedigitallibrary.org/ss/termsofuse.aspx
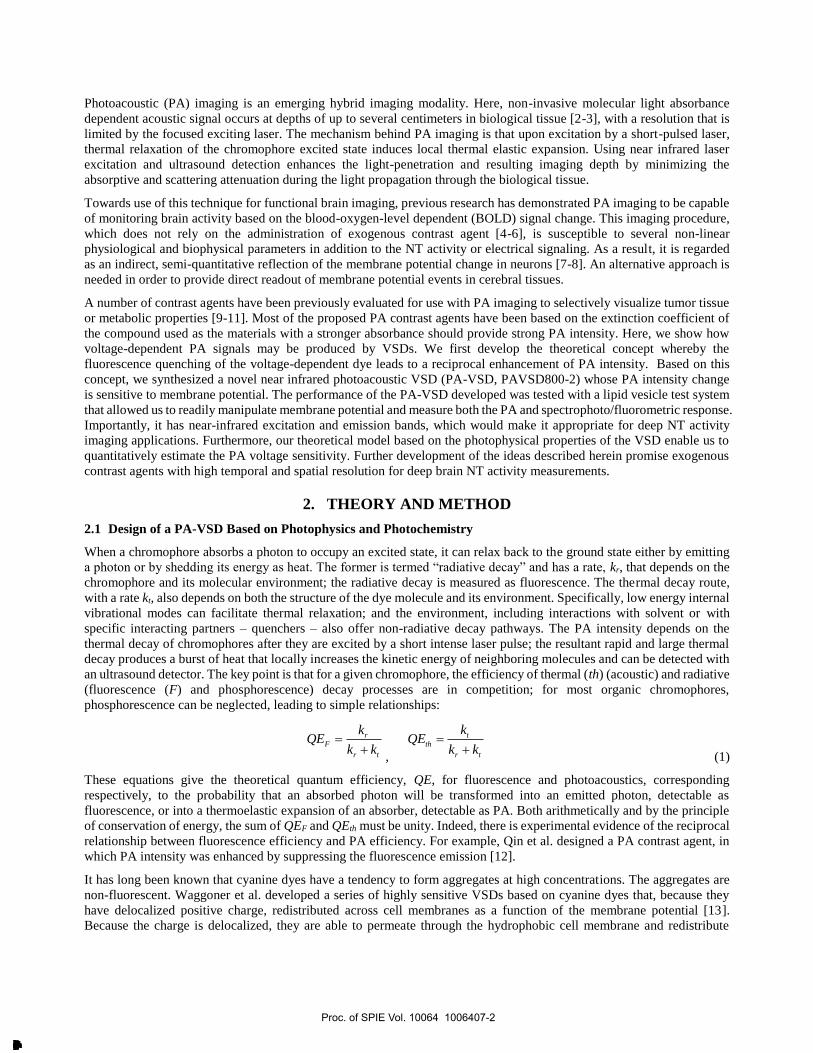
Photoacoustic (PA) imaging is an emerging hybrid imaging modality. Here, non-invasive molecular light absorbance
dependent acoustic signal occurs at depths of up to several centimeters in biological tissue [2-3], with a resolution that is
limited by the focused exciting laser. The mechanism behind PA imaging is that upon excitation by a short-pulsed laser,
thermal relaxation of the chromophore excited state induces local thermal elastic expansion. Using near infrared laser
excitation and ultrasound detection enhances the light-penetration and resulting imaging depth by minimizing the
absorptive and scattering attenuation during the light propagation through the biological tissue.
Towards use of this technique for functional brain imaging, previous research has demonstrated PA imaging to be capable
of monitoring brain activity based on the blood-oxygen-level dependent (BOLD) signal change. This imaging procedure,
which does not rely on the administration of exogenous contrast agent [4-6], is susceptible to several non-linear
physiological and biophysical parameters in addition to the NT activity or electrical signaling. As a result, it is regarded
as an indirect, semi-quantitative reflection of the membrane potential change in neurons [7-8]. An alternative approach is
needed in order to provide direct readout of membrane potential events in cerebral tissues.
A number of contrast agents have been previously evaluated for use with PA imaging to selectively visualize tumor tissue
or metabolic properties [9-11]. Most of the proposed PA contrast agents have been based on the extinction coefficient of
the compound used as the materials with a stronger absorbance should provide strong PA intensity. Here, we show how
voltage-dependent PA signals may be produced by VSDs. We first develop the theoretical concept whereby the
fluorescence quenching of the voltage-dependent dye leads to a reciprocal enhancement of PA intensity. Based on this
concept, we synthesized a novel near infrared photoacoustic VSD (PA-VSD, PAVSD800-2) whose PA intensity change
is sensitive to membrane potential. The performance of the PA-VSD developed was tested with a lipid vesicle test system
that allowed us to readily manipulate membrane potential and measure both the PA and spectrophoto/fluorometric response.
Importantly, it has near-infrared excitation and emission bands, which would make it appropriate for deep NT activity
imaging applications. Furthermore, our theoretical model based on the photophysical properties of the VSD enable us to
quantitatively estimate the PA voltage sensitivity. Further development of the ideas described herein promise exogenous
contrast agents with high temporal and spatial resolution for deep brain NT activity measurements.
2. THEORY AND METHOD
2.1 Design of a PA-VSD Based on Photophysics and Photochemistry
When a chromophore absorbs a photon to occupy an excited state, it can relax back to the ground state either by emitting
a photon or by shedding its energy as heat. The former is termed “radiative decay” and has a rate, kr, that depends on the
chromophore and its molecular environment; the radiative decay is measured as fluorescence. The thermal decay route,
with a rate kt, also depends on both the structure of the dye molecule and its environment. Specifically, low energy internal
vibrational modes can facilitate thermal relaxation; and the environment, including interactions with solvent or with
specific interacting partners – quenchers – also offer non-radiative decay pathways. The PA intensity depends on the
thermal decay of chromophores after they are excited by a short intense laser pulse; the resultant rapid and large thermal
decay produces a burst of heat that locally increases the kinetic energy of neighboring molecules and can be detected with
an ultrasound detector. The key point is that for a given chromophore, the efficiency of thermal (th) (acoustic) and radiative
(fluorescence (F) and phosphorescence) decay processes are in competition; for most organic chromophores,
phosphorescence can be neglected, leading to simple relationships:
r
F
r t
kQE
k k
,
t
th
r t
kQE
k k
(1)
These equations give the theoretical quantum efficiency, QE, for fluorescence and photoacoustics, corresponding
respectively, to the probability that an absorbed photon will be transformed into an emitted photon, detectable as
fluorescence, or into a thermoelastic expansion of an absorber, detectable as PA. Both arithmetically and by the principle
of conservation of energy, the sum of QEF and QEth must be unity. Indeed, there is experimental evidence of the reciprocal
relationship between fluorescence efficiency and PA efficiency. For example, Qin et al. designed a PA contrast agent, in
which PA intensity was enhanced by suppressing the fluorescence emission [12].
It has long been known that cyanine dyes have a tendency to form aggregates at high concentrations. The aggregates are
non-fluorescent. Waggoner et al. developed a series of highly sensitive VSDs based on cyanine dyes that, because they
have delocalized positive charge, redistributed across cell membranes as a function of the membrane potential [13].
Because the charge is delocalized, they are able to permeate through the hydrophobic cell membrane and redistribute
Proc. of SPIE Vol. 10064 1006407-2
Downloaded From: http://proceedings.spiedigitallibrary.org/ on 03/28/2017 Terms of Use: http://spiedigitallibrary.org/ss/termsofuse.aspx
, 4
PY6050
Polarized cell state
..
,uo
its
40 p o toits+t es v Atat
Iéi v its_ 0 mV
bDepolarized cell state
Axon
ytoplasm
NucleusDendrites
Membrane potentialpropagation Myelin sheath
Axon terminal
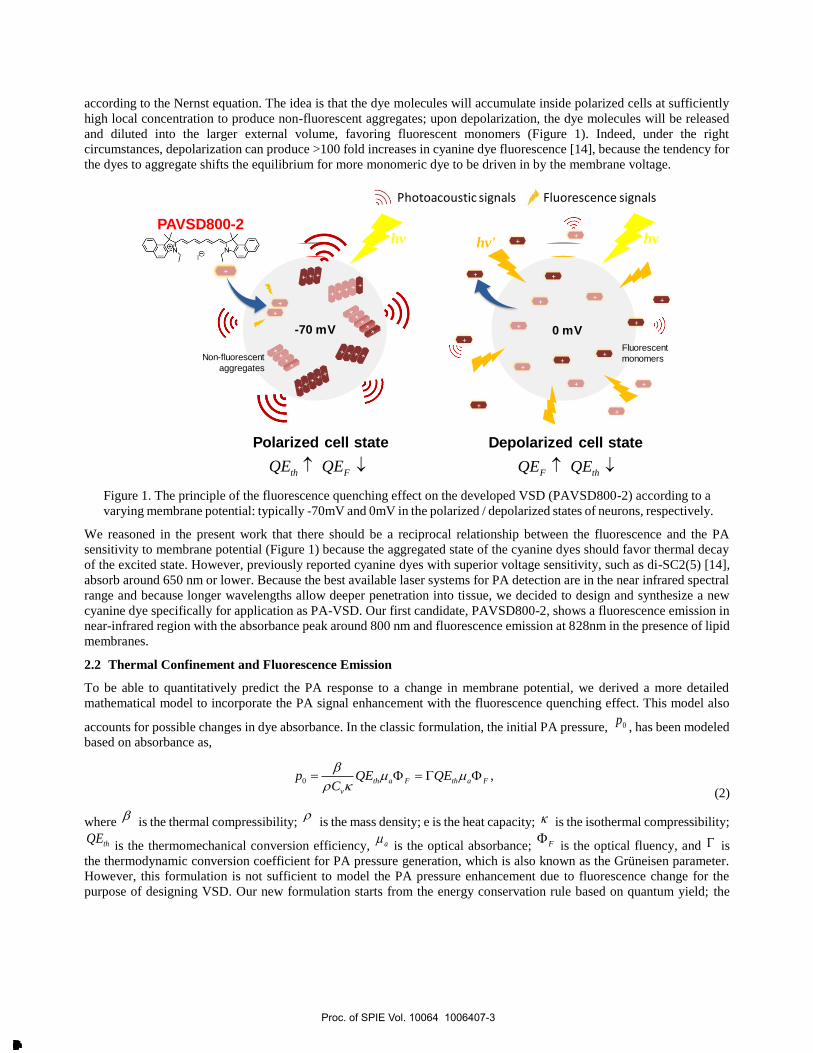
according to the Nernst equation. The idea is that the dye molecules will accumulate inside polarized cells at sufficiently
high local concentration to produce non-fluorescent aggregates; upon depolarization, the dye molecules will be released
and diluted into the larger external volume, favoring fluorescent monomers (Figure 1). Indeed, under the right
circumstances, depolarization can produce >100 fold increases in cyanine dye fluorescence [14], because the tendency for
the dyes to aggregate shifts the equilibrium for more monomeric dye to be driven in by the membrane voltage.
Figure 1. The principle of the fluorescence quenching effect on the developed VSD (PAVSD800-2) according to a
varying membrane potential: typically -70mV and 0mV in the polarized / depolarized states of neurons, respectively.
We reasoned in the present work that there should be a reciprocal relationship between the fluorescence and the PA
sensitivity to membrane potential (Figure 1) because the aggregated state of the cyanine dyes should favor thermal decay
of the excited state. However, previously reported cyanine dyes with superior voltage sensitivity, such as di-SC2(5) [14],
absorb around 650 nm or lower. Because the best available laser systems for PA detection are in the near infrared spectral
range and because longer wavelengths allow deeper penetration into tissue, we decided to design and synthesize a new
cyanine dye specifically for application as PA-VSD. Our first candidate, PAVSD800-2, shows a fluorescence emission in
near-infrared region with the absorbance peak around 800 nm and fluorescence emission at 828nm in the presence of lipid
membranes.
2.2 Thermal Confinement and Fluorescence Emission
To be able to quantitatively predict the PA response to a change in membrane potential, we derived a more detailed
mathematical model to incorporate the PA signal enhancement with the fluorescence quenching effect. This model also
accounts for possible changes in dye absorbance. In the classic formulation, the initial PA pressure, 0p, has been modeled
based on absorbance as,
0 ,th a F th a F
v
p QE QEC
(2)
where
is the thermal compressibility;
is the mass density; e is the heat capacity; is the isothermal compressibility;
thQE is the thermomechanical conversion efficiency, a is the optical absorbance; F
is the optical fluency, and is
the thermodynamic conversion coefficient for PA pressure generation, which is also known as the Grüneisen parameter.
However, this formulation is not sufficient to model the PA pressure enhancement due to fluorescence change for the
purpose of designing VSD. Our new formulation starts from the energy conservation rule based on quantum yield; the
+
+
+
++
+
+
Depolarized cell state
+++++-70 mV
+
+
Polarized cell state
++
+0 mV
+
+ +
+
PAVSD800-2
+
+
+
+
hv
Non-fluorescent
aggregates
Fluorescent
monomers
hv' hv
F thQE QE th FQE QE
Photoacoustic signals Fluorescence signals
Proc. of SPIE Vol. 10064 1006407-3
Downloaded From: http://proceedings.spiedigitallibrary.org/ on 03/28/2017 Terms of Use: http://spiedigitallibrary.org/ss/termsofuse.aspx
total amount of absorbed energy by an absorber (i.e., abs a FE ) will be converted into thermal energy ( thE
), and light
re-emission like fluorescence ( FE), and other photochemical reactions ( othersE
):
,abs th F othersE E E E (3)
and the substitution of Eq. (3) into the Eq. (2) gives
0 .th abs F othersp E E E E (4)
Now, the PA pressure change ratio (i.e., PAC) depending on the neural depolarization can be expressed as
0
0
( ),
( )
abs F
PA
abs F
p E EC
p E E
(5)
where 0p and 0p
are the initial PA pressures generated by PA-VSD at resting and depolarized states of neurons, assuming
othersEis negligible compared to FE
. absE and FE
are the total energy amount of absorbance and fluorescence emission
in action state, respectively.
Correspondingly, the total amount of absorbance and fluorescence change depending on the depolarization state of a
neuron can be given by
abs
abs
abs
EC
E
and (6)
.F
F
F
EC
E
(7)
In addition, the ratio of fluorescence energy compared to total optical absorbance in resting state, which is same as the
quantum yield FQE can be given by
.absF
F F
abs F
CEQE QE
E C
(8)
In all, the PA pressure change ratio in Eq. (5) can be reformulated as
2
.1
F abs F abs F F
PA
abs F abs F F
C C QE C QE CC
C C C QE QE
(9)
Hence, the PA signal change in response to neuronal depolarization is determined by the combination of the absorbance
and fluorescence changes, as well as the ratio of the fluorescence energy and the absorbance energy in the depolarized
state.
3. MATERIALS AND METHODS
3.1 Lipid Vesicle Preparation
Lipid vesicles were prepared from 25 mg soybean phosphatidylcholine (Type II) suspended in 1 mL of K+ buffer, which
contains 100 mM K2SO4, and 20 mM HEPES. This suspension was vortexed for 10 min and sonicated in bath-type
sonicator for 60 min, yielding a translucent vesicle suspension. A Na+ buffer containing 100 mM Na2SO4, and 20 mM
HEPES was prepared. During experiments 10 µL of vesicle suspension was added to 1 mL of Na+ buffer, resulting in an
approximately 100:1 K+ gradient across vesicle membrane. VSD was added to this suspension. When 2.5 µL of 10 µM
valinomycin, a K+ specific ionophore, was added K+ ions were transported from inside to outside of vesicle membranes,
Proc. of SPIE Vol. 10064 1006407-4
Downloaded From: http://proceedings.spiedigitallibrary.org/ on 03/28/2017 Terms of Use: http://spiedigitallibrary.org/ss/termsofuse.aspx
resulting in a negative membrane potential. This negative potential drives the positively charged VSDs inside the vesicles,
which causes aggregation of dyes and quenching of fluorescence. Subsequent addition of 2.5 µL of 1 mM gramicidin, a
non-specific monovalent cation ionophore, allows Na+ cations to move from outside to inside of vesicle membranes to
short circuit the membrane potential.
3.2 Experimental Setup for PA-VSD Characterization
Spectroscopic/fluorometric VSD characterization. A combined spectrophoto/fluorometer system (Spectramax i3x,
Molecular Devices) was used to measure both fluorescence and absorbance of the PA-VSD with 1, 3, 6, and 9 µM
concentrations. For fluorescence, the measurement was conducted for the spectral range from 750 nm to 850 nm at 10-nm
increment, and the absorbance was measured in the range from 600 nm to 900 nm at 5-nm increment. Note that 720 nm
wavelength was used for excitation during spectrofluorometry of the PA-VSD.
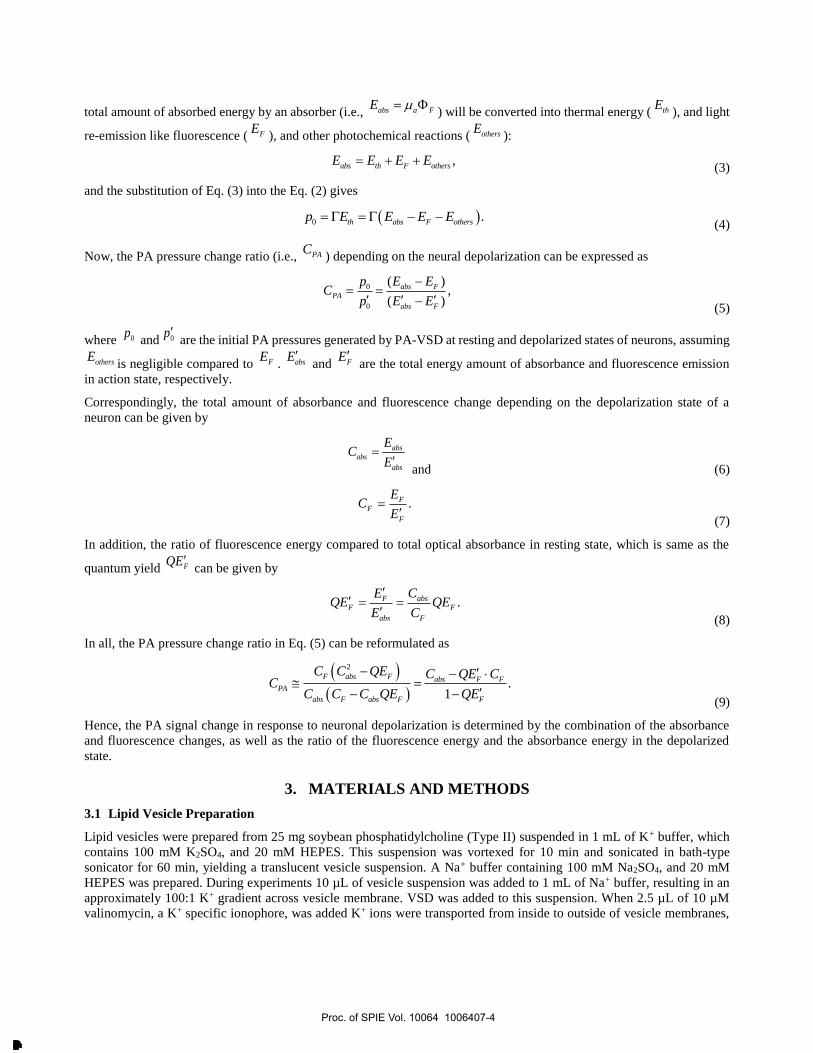
Phantom experimental setup for PA-VSD sensing. The PA sensing system was employed for the characterization of the
synthesized PA-VSD (Fig. 2); A Q-switched Nd:YAG laser integrated with an Optical Parametric Oscillator (OPO)
(Phocus Inline and MagicPrism, Opotek Inc.) was used for PA signal generation. With the tunability of the laser system,
the spectral responses for near-infrared wavelengths (i.e. 700-850 nm at 10-nm interval) were scanned with 20-Hz pulsed
repetition frequency and 5 nm pulse duration. The PA-VSD in the lipid vesicles suspension was loaded into transparent
tubes with 1.27-mm diameter (AAQ04133, Tygon®, Saint-Gobain Corp.), which were located at around 30 mm depth in
the water tank. Note that the temperature of the water was consistently maintained at 22ºC during the experiments.
Figure 2. Phantom experiment setup for PA characterization of PAVSD800-2 developed.
A 10-MHz linear ultrasound probe (L14-5/38, Ultrasonix Corp.) was used for PA-VSD sensing in practical circumstance
with a limited bandwidth (i.e., 75% -6 dB fractional bandwidth). Similarly, a hydrophone with wide flat bandwidth from
250kHz to 20MHz (HGL-1000, Onda Corp., CA, USA) was used to collect single line radio-frequency (RF) PA pressure
signal. Three sets of PA data were collected, in which two of them were collected through the linear array transducer, and
the other was through the hydrophone, and the average and standard deviation values were calculated. The PA signals
acquired at the depth of target were used to form an averaged RF signal, which is further processed to present PA intensity
at each optical wavelength; this permitted an accurate correlation with the spectrophotometric measurements. For the
imaging setup, one set of data was obtained using the linear array transducer from 9 µM PA-VSD at 800-nm optical
wavelength, and the differentiation between the resting and polarized states was analyzed.
4. RESULTS
4.1 Spectrophoto/fluorometric PA-VSD Characterization
The spectrophoto/fluorometric results of the dye with different concentrations are shown in Figs. 3-5. In the absorbance
results, Fig. 3(a) shows the absorbance spectrum for PAVSD800-2 at 6 μM concentration, and the peak was determined
to be 800 nm. The absorbance slightly decreased in response to the membrane potential at the addition of valinomycin. As
the negative control, adding gramicidin into the suspension with valinomycin recovered its absorbance intensity. When
Ultrasound probe
Hydrophone
Optical fiber bundle
Water tank
Data Acquisition System
Laser System
Sync
Proc. of SPIE Vol. 10064 1006407-5
Downloaded From: http://proceedings.spiedigitallibrary.org/ on 03/28/2017 Terms of Use: http://spiedigitallibrary.org/ss/termsofuse.aspx
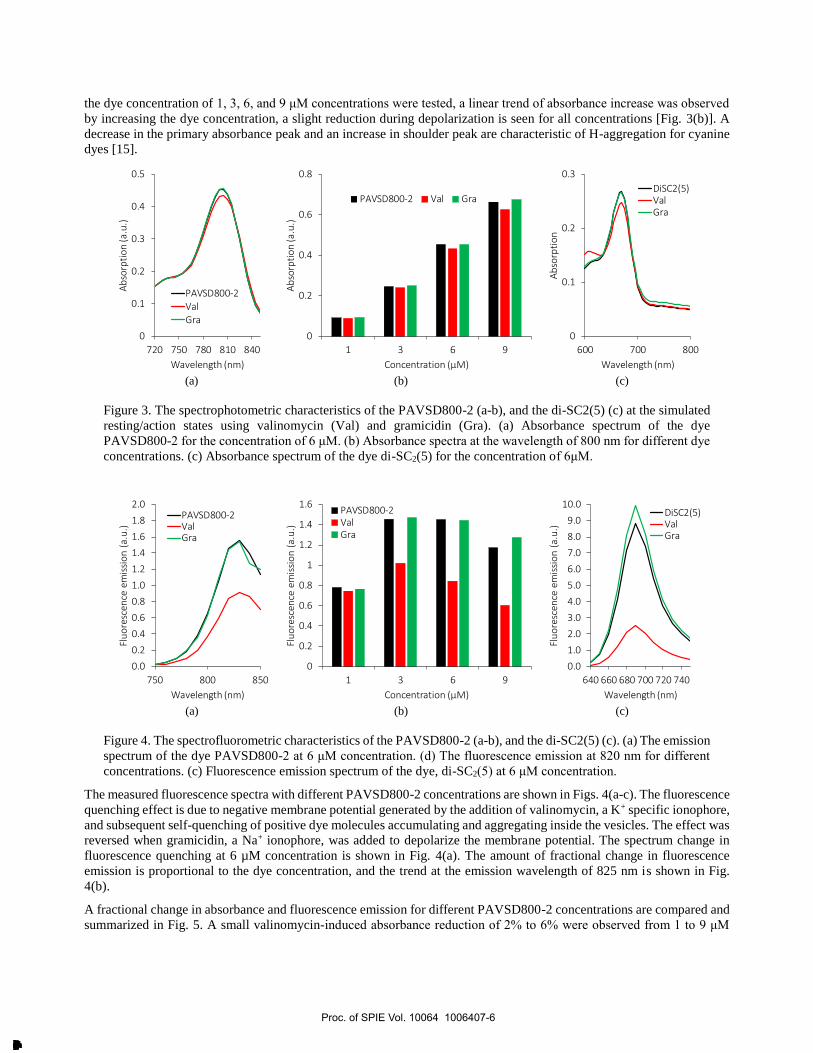
the dye concentration of 1, 3, 6, and 9 μM concentrations were tested, a linear trend of absorbance increase was observed
by increasing the dye concentration, a slight reduction during depolarization is seen for all concentrations [Fig. 3(b)]. A
decrease in the primary absorbance peak and an increase in shoulder peak are characteristic of H-aggregation for cyanine
dyes [15].
Figure 3. The spectrophotometric characteristics of the PAVSD800-2 (a-b), and the di-SC2(5) (c) at the simulated
resting/action states using valinomycin (Val) and gramicidin (Gra). (a) Absorbance spectrum of the dye
PAVSD800-2 for the concentration of 6 μM. (b) Absorbance spectra at the wavelength of 800 nm for different dye
concentrations. (c) Absorbance spectrum of the dye di-SC2(5) for the concentration of 6μM.
Figure 4. The spectrofluorometric characteristics of the PAVSD800-2 (a-b), and the di-SC2(5) (c). (a) The emission
spectrum of the dye PAVSD800-2 at 6 μM concentration. (d) The fluorescence emission at 820 nm for different
concentrations. (c) Fluorescence emission spectrum of the dye, di-SC2(5) at 6 μM concentration.
The measured fluorescence spectra with different PAVSD800-2 concentrations are shown in Figs. 4(a-c). The fluorescence
quenching effect is due to negative membrane potential generated by the addition of valinomycin, a K+ specific ionophore,
and subsequent self-quenching of positive dye molecules accumulating and aggregating inside the vesicles. The effect was
reversed when gramicidin, a Na+ ionophore, was added to depolarize the membrane potential. The spectrum change in
fluorescence quenching at 6 µM concentration is shown in Fig. 4(a). The amount of fractional change in fluorescence
emission is proportional to the dye concentration, and the trend at the emission wavelength of 825 nm is shown in Fig.
4(b).
A fractional change in absorbance and fluorescence emission for different PAVSD800-2 concentrations are compared and
summarized in Fig. 5. A small valinomycin-induced absorbance reduction of 2% to 6% were observed from 1 to 9 μM
0
0.2
0.4
0.6
0.8
1 3 6 9
Ab
sorp
tio
n (a
.u.)
Concentration (μM)
PAVSD800-2 Val Gra
0
0.1
0.2
0.3
0.4
0.5
720 750 780 810 840
Ab
sorp
tio
n (a
.u.)
Wavelength (nm)
PAVSD800-2ValGra
0
0.1
0.2
0.3
600 700 800
Ab
sorp
tio
n
Wavelength (nm)
DiSC2(5)ValGra
(a) (b) (c)
0.0
1.0
2.0
3.0
4.0
5.0
6.0
7.0
8.0
9.0
10.0
640 660 680 700 720 740
Flu
ore
scen
ce e
mis
sio
n (
a.u
.)
Wavelength (nm)
DiSC2(5)ValGra
0.0
0.2
0.4
0.6
0.8
1.0
1.2
1.4
1.6
1.8
2.0
750 800 850
Flu
ore
scen
ce e
mis
sio
n (
a.u
.)
Wavelength (nm)
PAVSD800-2ValGra
0
0.2
0.4
0.6
0.8
1
1.2
1.4
1.6
1 3 6 9
Flu
ore
scen
ce e
mis
sio
n (
a.u
.)
Concentration (μM)
PAVSD800-2ValGra
(a) (b) (c)
Proc. of SPIE Vol. 10064 1006407-6
Downloaded From: http://proceedings.spiedigitallibrary.org/ on 03/28/2017 Terms of Use: http://spiedigitallibrary.org/ss/termsofuse.aspx
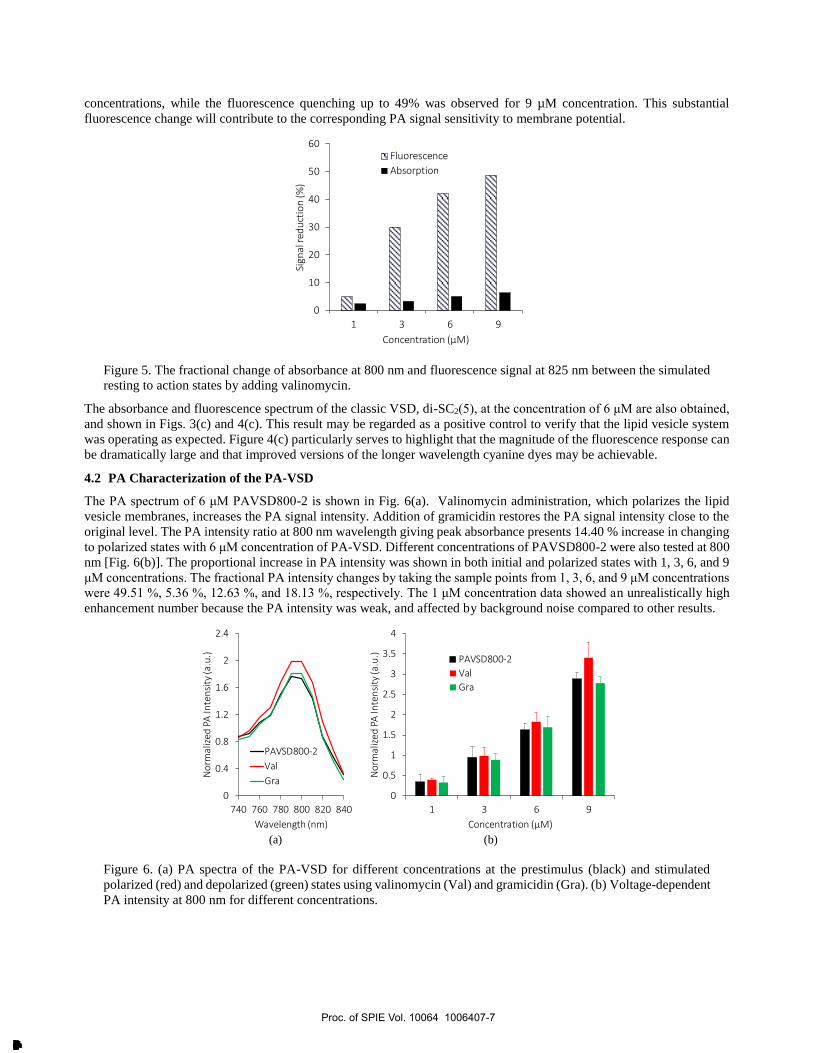
concentrations, while the fluorescence quenching up to 49% was observed for 9 µM concentration. This substantial
fluorescence change will contribute to the corresponding PA signal sensitivity to membrane potential.
Figure 5. The fractional change of absorbance at 800 nm and fluorescence signal at 825 nm between the simulated
resting to action states by adding valinomycin.
The absorbance and fluorescence spectrum of the classic VSD, di-SC2(5), at the concentration of 6 μM are also obtained,
and shown in Figs. 3(c) and 4(c). This result may be regarded as a positive control to verify that the lipid vesicle system
was operating as expected. Figure 4(c) particularly serves to highlight that the magnitude of the fluorescence response can
be dramatically large and that improved versions of the longer wavelength cyanine dyes may be achievable.
4.2 PA Characterization of the PA-VSD
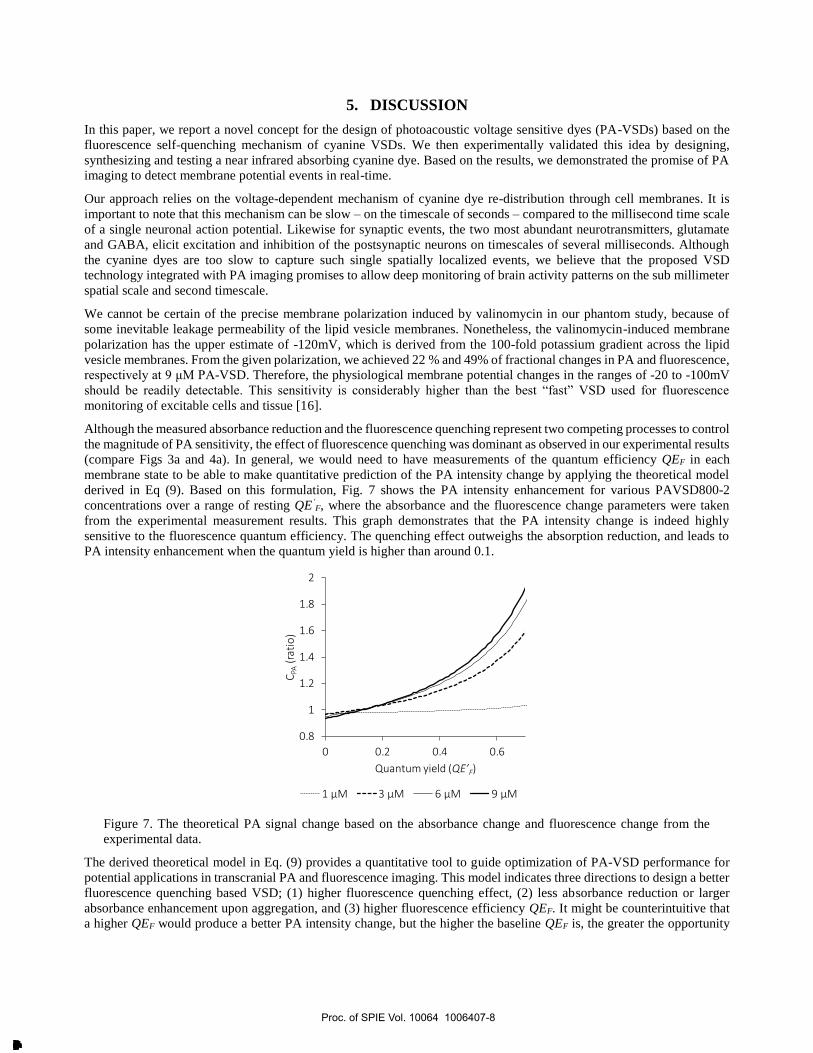
The PA spectrum of 6 μM PAVSD800-2 is shown in Fig. 6(a). Valinomycin administration, which polarizes the lipid
vesicle membranes, increases the PA signal intensity. Addition of gramicidin restores the PA signal intensity close to the
original level. The PA intensity ratio at 800 nm wavelength giving peak absorbance presents 14.40 % increase in changing
to polarized states with 6 μM concentration of PA-VSD. Different concentrations of PAVSD800-2 were also tested at 800
nm [Fig. 6(b)]. The proportional increase in PA intensity was shown in both initial and polarized states with 1, 3, 6, and 9
μM concentrations. The fractional PA intensity changes by taking the sample points from 1, 3, 6, and 9 μM concentrations
were 49.51 %, 5.36 %, 12.63 %, and 18.13 %, respectively. The 1 μM concentration data showed an unrealistically high
enhancement number because the PA intensity was weak, and affected by background noise compared to other results.
Figure 6. (a) PA spectra of the PA-VSD for different concentrations at the prestimulus (black) and stimulated
polarized (red) and depolarized (green) states using valinomycin (Val) and gramicidin (Gra). (b) Voltage-dependent
PA intensity at 800 nm for different concentrations.
0
10
20
30
40
50
60
1 3 6 9
Sign
al r
edu
ctio
n (%
)
Concentration (μM)
Fluorescence
Absorption
0
0.4
0.8
1.2
1.6
2
2.4
740 760 780 800 820 840
No
rmal
ized
PA
Inte
nsi
ty (a
.u.)
Wavelength (nm)
PAVSD800-2
Val
Gra
0
0.5
1
1.5
2
2.5
3
3.5
4
1 3 6 9
No
rmal
ized
PA
Inte
nsi
ty (a
.u.)
Concentration (μM)
PAVSD800-2
Val
Gra
(a) (b)
Proc. of SPIE Vol. 10064 1006407-7
Downloaded From: http://proceedings.spiedigitallibrary.org/ on 03/28/2017 Terms of Use: http://spiedigitallibrary.org/ss/termsofuse.aspx
5. DISCUSSION
In this paper, we report a novel concept for the design of photoacoustic voltage sensitive dyes (PA-VSDs) based on the
fluorescence self-quenching mechanism of cyanine VSDs. We then experimentally validated this idea by designing,
synthesizing and testing a near infrared absorbing cyanine dye. Based on the results, we demonstrated the promise of PA
imaging to detect membrane potential events in real-time.
Our approach relies on the voltage-dependent mechanism of cyanine dye re-distribution through cell membranes. It is
important to note that this mechanism can be slow – on the timescale of seconds – compared to the millisecond time scale
of a single neuronal action potential. Likewise for synaptic events, the two most abundant neurotransmitters, glutamate
and GABA, elicit excitation and inhibition of the postsynaptic neurons on timescales of several milliseconds. Although
the cyanine dyes are too slow to capture such single spatially localized events, we believe that the proposed VSD
technology integrated with PA imaging promises to allow deep monitoring of brain activity patterns on the sub millimeter
spatial scale and second timescale.
We cannot be certain of the precise membrane polarization induced by valinomycin in our phantom study, because of
some inevitable leakage permeability of the lipid vesicle membranes. Nonetheless, the valinomycin-induced membrane
polarization has the upper estimate of -120mV, which is derived from the 100-fold potassium gradient across the lipid
vesicle membranes. From the given polarization, we achieved 22 % and 49% of fractional changes in PA and fluorescence,
respectively at 9 μM PA-VSD. Therefore, the physiological membrane potential changes in the ranges of -20 to -100mV
should be readily detectable. This sensitivity is considerably higher than the best “fast” VSD used for fluorescence
monitoring of excitable cells and tissue [16].
Although the measured absorbance reduction and the fluorescence quenching represent two competing processes to control
the magnitude of PA sensitivity, the effect of fluorescence quenching was dominant as observed in our experimental results
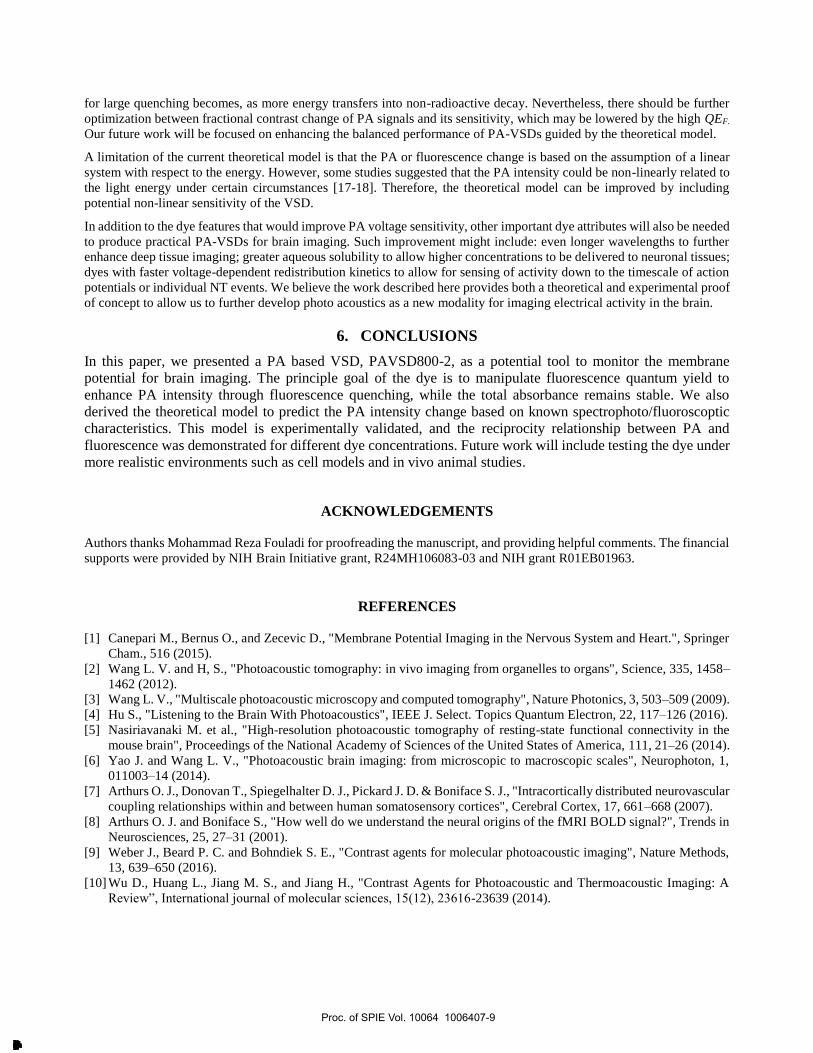
(compare Figs 3a and 4a). In general, we would need to have measurements of the quantum efficiency QEF in each
membrane state to be able to make quantitative prediction of the PA intensity change by applying the theoretical model
derived in Eq (9). Based on this formulation, Fig. 7 shows the PA intensity enhancement for various PAVSD800-2
concentrations over a range of resting QE’F, where the absorbance and the fluorescence change parameters were taken
from the experimental measurement results. This graph demonstrates that the PA intensity change is indeed highly
sensitive to the fluorescence quantum efficiency. The quenching effect outweighs the absorption reduction, and leads to
PA intensity enhancement when the quantum yield is higher than around 0.1.
Figure 7. The theoretical PA signal change based on the absorbance change and fluorescence change from the
experimental data.
The derived theoretical model in Eq. (9) provides a quantitative tool to guide optimization of PA-VSD performance for
potential applications in transcranial PA and fluorescence imaging. This model indicates three directions to design a better
fluorescence quenching based VSD; (1) higher fluorescence quenching effect, (2) less absorbance reduction or larger
absorbance enhancement upon aggregation, and (3) higher fluorescence efficiency QEF. It might be counterintuitive that
a higher QEF would produce a better PA intensity change, but the higher the baseline QEF is, the greater the opportunity
0.8
1
1.2
1.4
1.6
1.8
2
0 0.2 0.4 0.6
CPA
(rat
io)
Quantum yield (QE’F)
1 μM 3 μM 6 μM 9 μM
Proc. of SPIE Vol. 10064 1006407-8
Downloaded From: http://proceedings.spiedigitallibrary.org/ on 03/28/2017 Terms of Use: http://spiedigitallibrary.org/ss/termsofuse.aspx
for large quenching becomes, as more energy transfers into non-radioactive decay. Nevertheless, there should be further
optimization between fractional contrast change of PA signals and its sensitivity, which may be lowered by the high QEF.
Our future work will be focused on enhancing the balanced performance of PA-VSDs guided by the theoretical model.
A limitation of the current theoretical model is that the PA or fluorescence change is based on the assumption of a linear
system with respect to the energy. However, some studies suggested that the PA intensity could be non-linearly related to
the light energy under certain circumstances [17-18]. Therefore, the theoretical model can be improved by including
potential non-linear sensitivity of the VSD.
In addition to the dye features that would improve PA voltage sensitivity, other important dye attributes will also be needed
to produce practical PA-VSDs for brain imaging. Such improvement might include: even longer wavelengths to further
enhance deep tissue imaging; greater aqueous solubility to allow higher concentrations to be delivered to neuronal tissues;
dyes with faster voltage-dependent redistribution kinetics to allow for sensing of activity down to the timescale of action
potentials or individual NT events. We believe the work described here provides both a theoretical and experimental proof
of concept to allow us to further develop photo acoustics as a new modality for imaging electrical activity in the brain.
6. CONCLUSIONS
In this paper, we presented a PA based VSD, PAVSD800-2, as a potential tool to monitor the membrane
potential for brain imaging. The principle goal of the dye is to manipulate fluorescence quantum yield to
enhance PA intensity through fluorescence quenching, while the total absorbance remains stable. We also
derived the theoretical model to predict the PA intensity change based on known spectrophoto/fluoroscoptic
characteristics. This model is experimentally validated, and the reciprocity relationship between PA and
fluorescence was demonstrated for different dye concentrations. Future work will include testing the dye under
more realistic environments such as cell models and in vivo animal studies.
ACKNOWLEDGEMENTS
Authors thanks Mohammad Reza Fouladi for proofreading the manuscript, and providing helpful comments. The financial
supports were provided by NIH Brain Initiative grant, R24MH106083-03 and NIH grant R01EB01963.
REFERENCES
[1] Canepari M., Bernus O., and Zecevic D., "Membrane Potential Imaging in the Nervous System and Heart.", Springer
Cham., 516 (2015).
[2] Wang L. V. and H, S., "Photoacoustic tomography: in vivo imaging from organelles to organs", Science, 335, 1458–
1462 (2012).
[3] Wang L. V., "Multiscale photoacoustic microscopy and computed tomography", Nature Photonics, 3, 503–509 (2009).
[4] Hu S., "Listening to the Brain With Photoacoustics", IEEE J. Select. Topics Quantum Electron, 22, 117–126 (2016).
[5] Nasiriavanaki M. et al., "High-resolution photoacoustic tomography of resting-state functional connectivity in the
mouse brain", Proceedings of the National Academy of Sciences of the United States of America, 111, 21–26 (2014).
[6] Yao J. and Wang L. V., "Photoacoustic brain imaging: from microscopic to macroscopic scales", Neurophoton, 1,
011003–14 (2014).
[7] Arthurs O. J., Donovan T., Spiegelhalter D. J., Pickard J. D. & Boniface S. J., "Intracortically distributed neurovascular
coupling relationships within and between human somatosensory cortices", Cerebral Cortex, 17, 661–668 (2007).
[8] Arthurs O. J. and Boniface S., "How well do we understand the neural origins of the fMRI BOLD signal?", Trends in
Neurosciences, 25, 27–31 (2001).
[9] Weber J., Beard P. C. and Bohndiek S. E., "Contrast agents for molecular photoacoustic imaging", Nature Methods,
13, 639–650 (2016).
[10] Wu D., Huang L., Jiang M. S., and Jiang H., "Contrast Agents for Photoacoustic and Thermoacoustic Imaging: A
Review”, International journal of molecular sciences, 15(12), 23616-23639 (2014).
Proc. of SPIE Vol. 10064 1006407-9
Downloaded From: http://proceedings.spiedigitallibrary.org/ on 03/28/2017 Terms of Use: http://spiedigitallibrary.org/ss/termsofuse.aspx
[11] Luke G. P., Yeager D., and Emelianov S. Y., “Biomedical applications of photoacoustic imaging with exogenous
contrast agents”, Annals of biomedical engineering, 40(2), 422-437 (2012)
[12] Qin H., Zhou T., Yang S. and Xing D., "Fluorescence Quenching Nanoprobes Dedicated to In Vivo Photoacoustic
Imaging and High‐Efficient Tumor Therapy in Deep‐Seated Tissue", Small, 11, 2675–2686 (2015).
[13] Sims P. J., Waggoner A. S., Wang C.-H., and Hoffman J. F., “Studies on the Mechanism by Which Cyanine Dyes
Measure Membrane Potential in Red Blood Cells and Phosphotidylcholine”, Biochemistry, 13, 3315-3330 (1974).
[14] Loew L. M., Benson L., Lazarovici P., and Rosenberg I., “Fluorometric analysis of transferable membrane pores”,
Biochemistry, 24, 2101-2104 (1985).
[15] McArthur E. A., Godbe J. M., Tice D. B., Weiss E. A., “A Study of the Binding of Cyanine Dyes to Colloidal Quantum
Dots using Spectral Signatures of Dye Aggregation”, J. Phys. Chem. C, 116, 6136 (2012).
[16] Yan P., Acker C. D., Zhou W. L., Lee P., Bollensdorff C., Negrean A., Lotti J., Sacconi L., Antic S. D., Kohl P.,
Mansvelder H. D., Pavone F. S., and Loew L. M., “A palette of fluorinated voltage sensitive hemicyanine dyes”,
Proceedings of the National Academy of Sciences of the United States of America, 109, 20443-20448 (2012).
[17] Chen H., Diebold G., “Chemical Generation of Acoustic Waves: A Giant Photoacoustic Effect”, Science, 270(5238),
963-966 (1995).
[18] Sarimollaoglu M., Nedosekin D. A., Menyaev Y. A., Juratli M. A., Zharov V. P., “Nonlinear photoacoustic signal
amplification from single targets in absorption background”, Photoacoustics, 2(1), 1-11 (2014).
Proc. of SPIE Vol. 10064 1006407-10
Downloaded From: http://proceedings.spiedigitallibrary.org/ on 03/28/2017 Terms of Use: http://spiedigitallibrary.org/ss/termsofuse.aspx