Embed Size (px)
Citation preview
ARTICLE IN PRESS
Real-Time Imaging 11 (2005) 257–269
1077-2014/$ - se
doi:10.1016/j.rt
�Correspond
fax: +44113 34
E-mail addr
www.elsevier.com/locate/rti
Real-time automated visual inspection system for contaminantremoval from wool
Liwei Zhanga, Abbas Dehghanib,�, Zhenwei Sua, Tim Kingb, Barry Greenwooda,Martin Levesleyb
aSchool of Design, University of Leeds, Woodhouse Lane, Leeds, West Yorkshire, LS2 9JT, UKbSchool of Mechanical Engineering, University of Leeds, Woodhouse Lane, Leeds, West Yorkshire, LS2 9JT, UK
Available online 15 June 2005
Abstract
In the textile industry, scoured wool contains different types of foreign materials (contaminants) that need to be separated out
before it goes into further processing, so that the textile machines are protected from damage and the quality of the final woollen
products is ensured. This paper presents an automated visual inspection (AVI) system for detecting and sorting contaminants from
wool in real time. The techniques were first developed in the lab and subsequently applied to a large-scale factory system. The
combinative use of image processing algorithms in RGB and HSV colour spaces can segment 96% of contaminant types (minimum
size around 4 cm long and 5mm in diameter) in real-time on the lab test rig. One of the most important aspects of the system is to use
the non-linear colour space transformation and merge the threshold algorithm in HSV colour space into the image processing
algorithms in RGB colour space to enhance the contaminant identification in real time. The real-time capability of the system is also
analysed in detail. The experimental results demonstrate that the factory AVI system could identify and remove the contaminants at
a camera speed of around 800 lines/s and the conveyor speed of 20m/min in real time.
r 2004 Elsevier Ltd. All rights reserved.
1. Introduction
Over the past 30 years, as machine vision technologyhas been improved, automated visual inspection (AVI)systems have become more widely used in many fields[1–4]. An AVI system usually requires real-time opera-tion to enable the inspection process to keep up with themanufacturing process. This is the most challenging taskwhen developing an AVI system in which products(objects) are transported at high speed. One of the mostcritical timing measurements is the cycle time betweenthe presentations of successive images requiring analysis[4]. The image processing and analysis must take lessthan the image acquisition cycle time in order to copewith the requirement of the real-time operation. There-fore, it is vital to develop computationally efficient
e front matter r 2004 Elsevier Ltd. All rights reserved.
i.2004.09.003
ing author. Tel.: +44113 343 2906;
3 2150.
ess: [email protected] (A. Dehghani).
vision algorithms. In this paper, a computationallyefficient vision algorithm is presented for contaminantdetection and removal from wool.
There are two common types of visual inspections—product defect detection and detection of foreignmaterials. For defect detection of products such asfoodstuffs and textiles [5,6], the surface is highlyvariable, so inspection demands greater amounts ofchecking and computation if the template matchingmethod is used, which limits the real-time operation ofthe AVI system [7]. Foreign materials are not simple todetect due to their unpredictability in size, shape,material or nature, position and orientation especiallyagainst a textured background. Obviously, thresholdtechniques can be used to identify these foreignmaterials automatically. However, simple thresholdingcan only detect foreign materials that have high contrastwith the background. Fortunately, colour imagesare available for image processing, which can providemore information than grey-scale images. In present
ARTICLE IN PRESSL. Zhang et al. / Real-Time Imaging 11 (2005) 257–269258
electronic imaging devices, colour is most often quanti-tatively specified by RGB colour features. The RGBvalues can be used in several ways for AVI: (i) The pixelvalues can be directly used. (ii) Every colour channel(red, green and blue) can be separately processed bygrey-scale image segmentation methods [8] and thenmerged together. (iii) Pixel values in RGB colour spacecan be converted to another colour space (HIS, lab or
Luv) for use. Normally, it takes a long time for the RGBcolour space to be transformed to another colour spaceas the transformation is nonlinear, which restricts thereal-time application of other colour spaces. However,colour space transformations have been increasinglyused in some real-time applications [9,10] as availablecomputing hardware becomes faster. This paper gives anexample of the real-time application of colour spacetransformation.
Contaminants are always present in raw wool used fortextile manufacture. The main contaminants are poly-propylene baler twines, packaging materials and plasticmaterials in varying types, sizes (4–20 cm long) andcolours. For many applications, their presence seriouslyaffects the qualities of the final wool products.Currently, these contaminants are removed during thewool scouring process by human visual inspection andhand picking. Although AVI systems for the inspectionsof fabric defects, foreign materials and fibre structurehave been increasingly developed in the textile industry,which give real advantages such as high efficiencywithout fatigue [11–14], the contaminant automaticdetection and removal from wool has remained achallenging problem. The scoured wool tufts in differentsizes form variably textural background. Moreover, thecontaminant appearance is not predictable. All theseincrease the difficulty in the development of real-timeimage processing algorithms for the AVI system.
Earlier research work on contaminant detection inwool was done by Chudleigh et al. [15,16]. They tried todetect coloured contaminants from webs of white wool,but the references only presented a development of anillumination system for image acquisition. Before 1995,there are few examples that reported in detail theautomatic contaminant detection in wool. Earlier workon contaminant removal from wool and other fibrescomes from CSIRO Division of Wool Technology,Australia [17]. The efficiency and performance of thesorting were not promising in this system. Althoughthere exist two examples [18,19] for automatic con-taminant removal from cotton, automatic contaminantdetection and removal from wool could not be traced inprevious research works.
In this paper, an AVI system is presented forautomatic contaminant detection and removal fromwool in real time. The system uses nonlinear colourspace transformation and merges the threshold algo-rithm in Hue, Saturation and Value (HSV) colour space
into the image processing algorithms in RGB colourspace to increase the contaminant identification rate inreal time, which was not previously possible in real-timeapplications as the computing hardware was not power-ful enough.
In the following sections, we describe the proposedAVI system in terms of its experimental set-up,acquisition architecture and its inspection algorithms.In the section prior to the conclusions, emphasis is givento the results of an extensive performance evaluationtest.
2. System configuration
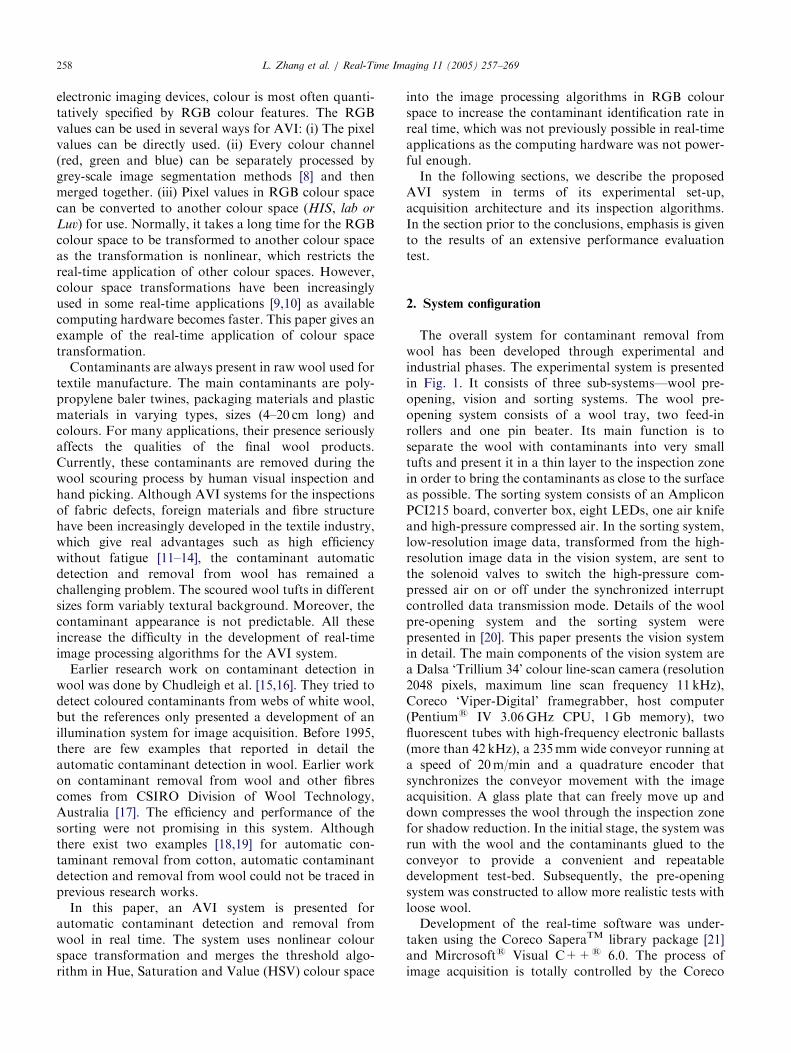
The overall system for contaminant removal fromwool has been developed through experimental andindustrial phases. The experimental system is presentedin Fig. 1. It consists of three sub-systems—wool pre-opening, vision and sorting systems. The wool pre-opening system consists of a wool tray, two feed-inrollers and one pin beater. Its main function is toseparate the wool with contaminants into very smalltufts and present it in a thin layer to the inspection zonein order to bring the contaminants as close to the surfaceas possible. The sorting system consists of an AmpliconPCI215 board, converter box, eight LEDs, one air knifeand high-pressure compressed air. In the sorting system,low-resolution image data, transformed from the high-resolution image data in the vision system, are sent tothe solenoid valves to switch the high-pressure com-pressed air on or off under the synchronized interruptcontrolled data transmission mode. Details of the woolpre-opening system and the sorting system werepresented in [20]. This paper presents the vision systemin detail. The main components of the vision system area Dalsa ‘Trillium 34’ colour line-scan camera (resolution2048 pixels, maximum line scan frequency 11 kHz),Coreco ‘Viper-Digital’ framegrabber, host computer(Pentiums IV 3.06GHz CPU, 1Gb memory), twofluorescent tubes with high-frequency electronic ballasts(more than 42 kHz), a 235mm wide conveyor running ata speed of 20m/min and a quadrature encoder thatsynchronizes the conveyor movement with the imageacquisition. A glass plate that can freely move up anddown compresses the wool through the inspection zonefor shadow reduction. In the initial stage, the system wasrun with the wool and the contaminants glued to theconveyor to provide a convenient and repeatabledevelopment test-bed. Subsequently, the pre-openingsystem was constructed to allow more realistic tests withloose wool.
Development of the real-time software was under-taken using the Coreco SaperaTM library package [21]and Mircrosofts Visual C++s 6.0. The process ofimage acquisition is totally controlled by the Coreco
ARTICLE IN PRESS
Fig. 1. Test rig for the AVI system in the lab.
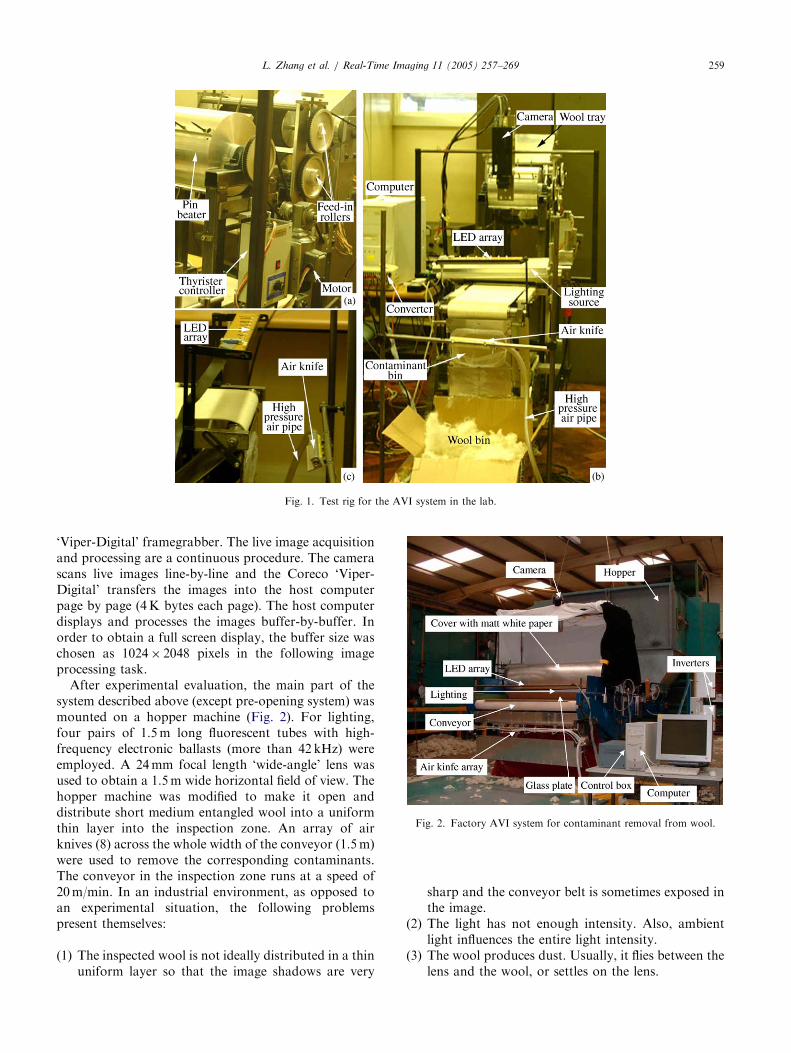
Fig. 2. Factory AVI system for contaminant removal from wool.
L. Zhang et al. / Real-Time Imaging 11 (2005) 257–269 259
‘Viper-Digital’ framegrabber. The live image acquisitionand processing are a continuous procedure. The camerascans live images line-by-line and the Coreco ‘Viper-Digital’ transfers the images into the host computerpage by page (4K bytes each page). The host computerdisplays and processes the images buffer-by-buffer. Inorder to obtain a full screen display, the buffer size waschosen as 1024� 2048 pixels in the following imageprocessing task.
After experimental evaluation, the main part of thesystem described above (except pre-opening system) wasmounted on a hopper machine (Fig. 2). For lighting,four pairs of 1.5m long fluorescent tubes with high-frequency electronic ballasts (more than 42 kHz) wereemployed. A 24mm focal length ‘wide-angle’ lens wasused to obtain a 1.5m wide horizontal field of view. Thehopper machine was modified to make it open anddistribute short medium entangled wool into a uniformthin layer into the inspection zone. An array of airknives (8) across the whole width of the conveyor (1.5m)were used to remove the corresponding contaminants.The conveyor in the inspection zone runs at a speed of20m/min. In an industrial environment, as opposed toan experimental situation, the following problemspresent themselves:
(1)
The inspected wool is not ideally distributed in a thinuniform layer so that the image shadows are verysharp and the conveyor belt is sometimes exposed inthe image.
(2)
The light has not enough intensity. Also, ambientlight influences the entire light intensity.(3)
The wool produces dust. Usually, it flies between thelens and the wool, or settles on the lens.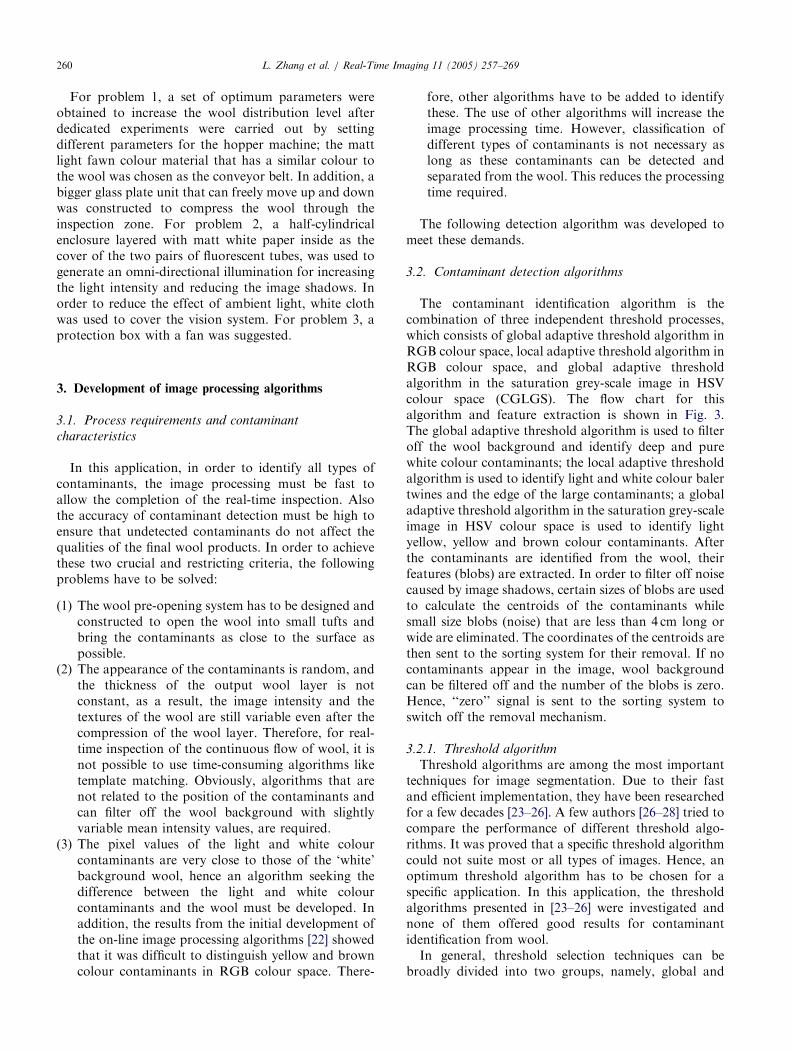
ARTICLE IN PRESSL. Zhang et al. / Real-Time Imaging 11 (2005) 257–269260
For problem 1, a set of optimum parameters wereobtained to increase the wool distribution level afterdedicated experiments were carried out by settingdifferent parameters for the hopper machine; the mattlight fawn colour material that has a similar colour tothe wool was chosen as the conveyor belt. In addition, abigger glass plate unit that can freely move up and downwas constructed to compress the wool through theinspection zone. For problem 2, a half-cylindricalenclosure layered with matt white paper inside as thecover of the two pairs of fluorescent tubes, was used togenerate an omni-directional illumination for increasingthe light intensity and reducing the image shadows. Inorder to reduce the effect of ambient light, white clothwas used to cover the vision system. For problem 3, aprotection box with a fan was suggested.
3. Development of image processing algorithms
3.1. Process requirements and contaminant
characteristics
In this application, in order to identify all types ofcontaminants, the image processing must be fast toallow the completion of the real-time inspection. Alsothe accuracy of contaminant detection must be high toensure that undetected contaminants do not affect thequalities of the final wool products. In order to achievethese two crucial and restricting criteria, the followingproblems have to be solved:
(1)
The wool pre-opening system has to be designed andconstructed to open the wool into small tufts andbring the contaminants as close to the surface aspossible.(2)
The appearance of the contaminants is random, andthe thickness of the output wool layer is notconstant, as a result, the image intensity and thetextures of the wool are still variable even after thecompression of the wool layer. Therefore, for real-time inspection of the continuous flow of wool, it isnot possible to use time-consuming algorithms liketemplate matching. Obviously, algorithms that arenot related to the position of the contaminants andcan filter off the wool background with slightlyvariable mean intensity values, are required.(3)
The pixel values of the light and white colourcontaminants are very close to those of the ‘white’background wool, hence an algorithm seeking thedifference between the light and white colourcontaminants and the wool must be developed. Inaddition, the results from the initial development ofthe on-line image processing algorithms [22] showedthat it was difficult to distinguish yellow and browncolour contaminants in RGB colour space. There-fore, other algorithms have to be added to identifythese. The use of other algorithms will increase theimage processing time. However, classification ofdifferent types of contaminants is not necessary aslong as these contaminants can be detected andseparated from the wool. This reduces the processingtime required.
The following detection algorithm was developed tomeet these demands.
3.2. Contaminant detection algorithms
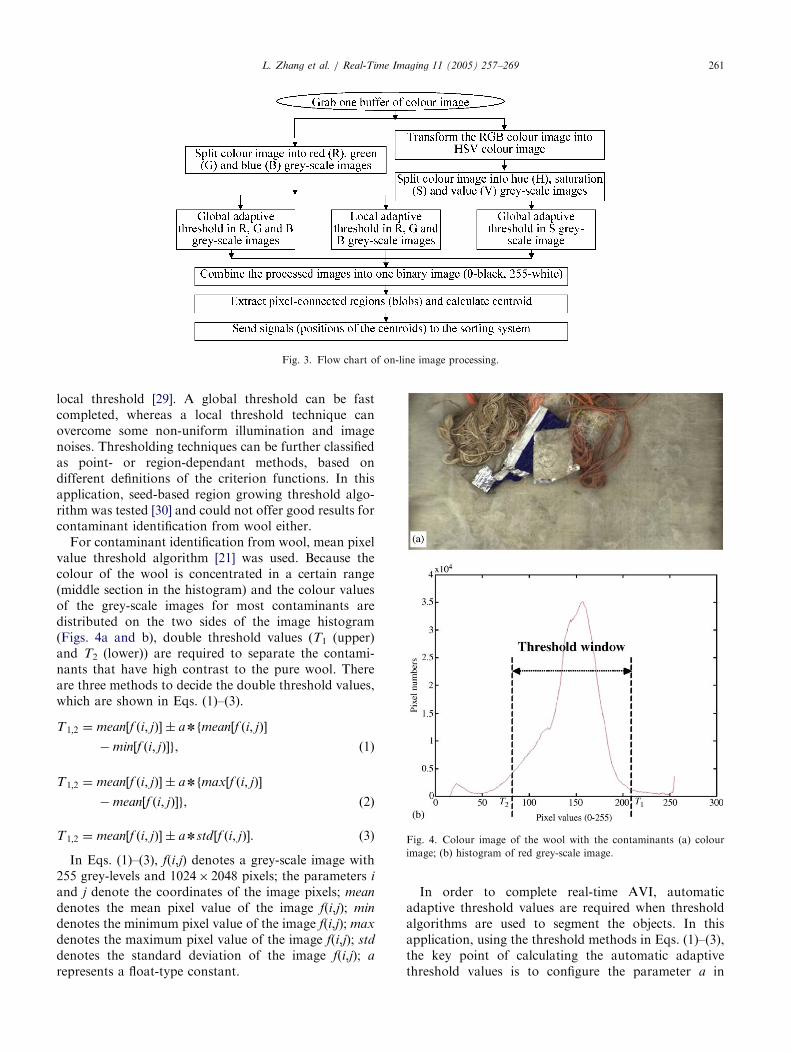
The contaminant identification algorithm is thecombination of three independent threshold processes,which consists of global adaptive threshold algorithm inRGB colour space, local adaptive threshold algorithm inRGB colour space, and global adaptive thresholdalgorithm in the saturation grey-scale image in HSVcolour space (CGLGS). The flow chart for thisalgorithm and feature extraction is shown in Fig. 3.The global adaptive threshold algorithm is used to filteroff the wool background and identify deep and purewhite colour contaminants; the local adaptive thresholdalgorithm is used to identify light and white colour balertwines and the edge of the large contaminants; a globaladaptive threshold algorithm in the saturation grey-scaleimage in HSV colour space is used to identify lightyellow, yellow and brown colour contaminants. Afterthe contaminants are identified from the wool, theirfeatures (blobs) are extracted. In order to filter off noisecaused by image shadows, certain sizes of blobs are usedto calculate the centroids of the contaminants whilesmall size blobs (noise) that are less than 4 cm long orwide are eliminated. The coordinates of the centroids arethen sent to the sorting system for their removal. If nocontaminants appear in the image, wool backgroundcan be filtered off and the number of the blobs is zero.Hence, ‘‘zero’’ signal is sent to the sorting system toswitch off the removal mechanism.
3.2.1. Threshold algorithm
Threshold algorithms are among the most importanttechniques for image segmentation. Due to their fastand efficient implementation, they have been researchedfor a few decades [23–26]. A few authors [26–28] tried tocompare the performance of different threshold algo-rithms. It was proved that a specific threshold algorithmcould not suite most or all types of images. Hence, anoptimum threshold algorithm has to be chosen for aspecific application. In this application, the thresholdalgorithms presented in [23–26] were investigated andnone of them offered good results for contaminantidentification from wool.
In general, threshold selection techniques can bebroadly divided into two groups, namely, global and
ARTICLE IN PRESS
Fig. 3. Flow chart of on-line image processing.
Fig. 4. Colour image of the wool with the contaminants (a) colour
image; (b) histogram of red grey-scale image.
L. Zhang et al. / Real-Time Imaging 11 (2005) 257–269 261
local threshold [29]. A global threshold can be fastcompleted, whereas a local threshold technique canovercome some non-uniform illumination and imagenoises. Thresholding techniques can be further classifiedas point- or region-dependant methods, based ondifferent definitions of the criterion functions. In thisapplication, seed-based region growing threshold algo-rithm was tested [30] and could not offer good results forcontaminant identification from wool either.
For contaminant identification from wool, mean pixelvalue threshold algorithm [21] was used. Because thecolour of the wool is concentrated in a certain range(middle section in the histogram) and the colour valuesof the grey-scale images for most contaminants aredistributed on the two sides of the image histogram(Figs. 4a and b), double threshold values (T1 (upper)and T2 (lower)) are required to separate the contami-nants that have high contrast to the pure wool. Thereare three methods to decide the double threshold values,which are shown in Eqs. (1)–(3).
T1;2 ¼ mean½f ði; jÞ� � an fmean½f ði; jÞ�
min½f ði; jÞ�g, ð1Þ
T1;2 ¼ mean½f ði; jÞ� � an fmax½f ði; jÞ�
mean½f ði; jÞ�g, ð2Þ
T1;2 ¼ mean½f ði; jÞ� � an std½f ði; jÞ�. (3)
In Eqs. (1)–(3), f(i,j) denotes a grey-scale image with255 grey-levels and 1024� 2048 pixels; the parameters i
and j denote the coordinates of the image pixels; mean
denotes the mean pixel value of the image f(i,j); min
denotes the minimum pixel value of the image f(i,j); max
denotes the maximum pixel value of the image f(i,j); std
denotes the standard deviation of the image f(i,j); a
represents a float-type constant.
In order to complete real-time AVI, automaticadaptive threshold values are required when thresholdalgorithms are used to segment the objects. In thisapplication, using the threshold methods in Eqs. (1)–(3),the key point of calculating the automatic adaptivethreshold values is to configure the parameter a in
ARTICLE IN PRESSL. Zhang et al. / Real-Time Imaging 11 (2005) 257–269262
advance. Before formal inspection, the system is rununder the same conditions at those in the formalinspection and a series of reference images for wooland wool with contaminants are taken and saved in thehost computer. The pure wool images are used to train asuitable value for the parameter a. The wool image withcontaminants are used to verify the accuracy of theparameter a. In the colour images, the parameter a forevery grey-scale image can be directly input from thesoftware user interface. The mean and standard devia-tion pixel values of every grey-scale image can bedirectly displayed on the user interface, which arereferred to configure a suitable parameter value a.Practical image processing experiments proved that thesame processing results could be obtained by separatelyusing the above three threshold methods. However, thethird method (Eq. (3)) is a better one to obtain thedouble threshold values as the parameter a can be easilytrained between the float type value ‘‘2’’ and ‘‘4’’ usingthe normal distribution rule.
3.2.2. Combination of three-independent threshold
processes
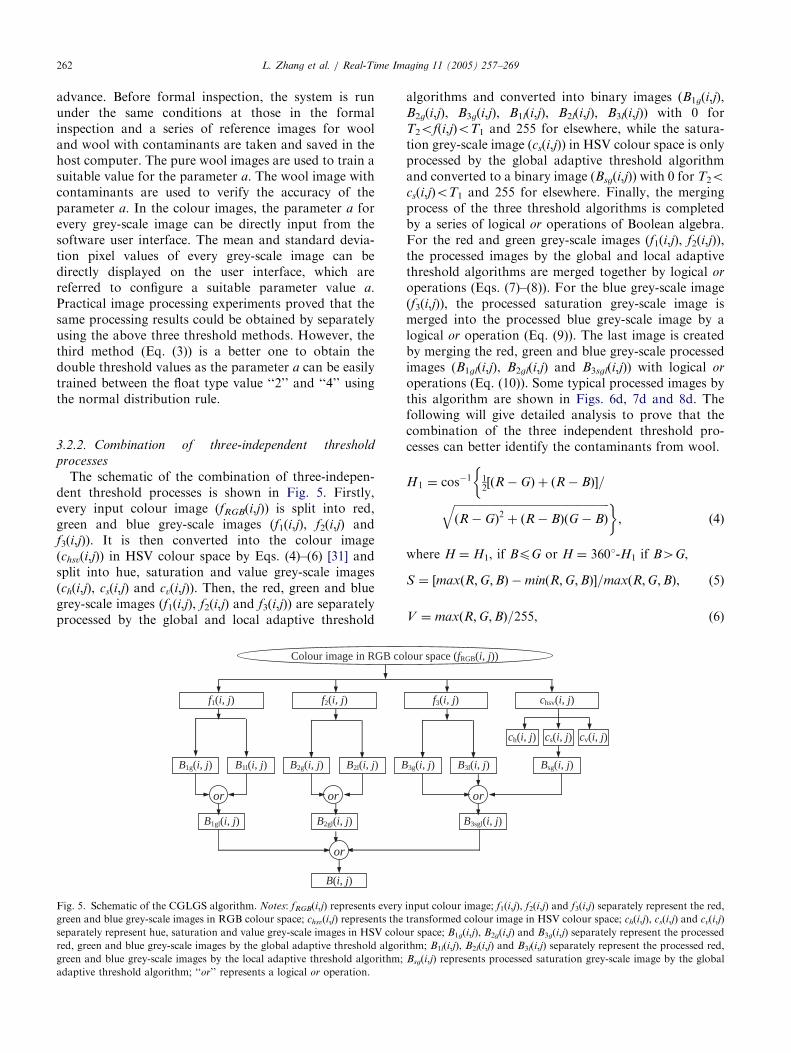
The schematic of the combination of three-indepen-dent threshold processes is shown in Fig. 5. Firstly,every input colour image (fRGB(i,j)) is split into red,green and blue grey-scale images (f1(i,j), f2(i,j) andf3(i,j)). It is then converted into the colour image(chsv(i,j)) in HSV colour space by Eqs. (4)–(6) [31] andsplit into hue, saturation and value grey-scale images(ch(i,j), cs(i,j) and cv(i,j)). Then, the red, green and bluegrey-scale images (f1(i,j), f2(i,j) and f3(i,j)) are separatelyprocessed by the global and local adaptive threshold
Colour image in RGB co
f1(i, j) f2(i, j)
B1gl(i, j)
BB2l(i, j) B2g(i, j) B1l(i, j) B1g(i, j)
or or
B2gl(i, j)
B(i, j)
or
Fig. 5. Schematic of the CGLGS algorithm. Notes: fRGB(i,j) represents every
green and blue grey-scale images in RGB colour space; chsv(i,j) represents the
separately represent hue, saturation and value grey-scale images in HSV colo
red, green and blue grey-scale images by the global adaptive threshold algor
green and blue grey-scale images by the local adaptive threshold algorithm;
adaptive threshold algorithm; ‘‘or’’ represents a logical or operation.
algorithms and converted into binary images (B1g(i,j),B2g(i,j), B3g(i,j), B1l(i,j), B2l(i,j), B3l(i,j)) with 0 forT2of(i,j)oT1 and 255 for elsewhere, while the satura-tion grey-scale image (cs(i,j)) in HSV colour space is onlyprocessed by the global adaptive threshold algorithmand converted to a binary image (Bsg(i,j)) with 0 for T2ocs(i,j)oT1 and 255 for elsewhere. Finally, the mergingprocess of the three threshold algorithms is completedby a series of logical or operations of Boolean algebra.For the red and green grey-scale images (f1(i,j), f2(i,j)),the processed images by the global and local adaptivethreshold algorithms are merged together by logical or
operations (Eqs. (7)–(8)). For the blue grey-scale image(f3(i,j)), the processed saturation grey-scale image ismerged into the processed blue grey-scale image by alogical or operation (Eq. (9)). The last image is createdby merging the red, green and blue grey-scale processedimages (B1gl(i,j), B2gl(i,j) and B3sgl(i,j)) with logical or
operations (Eq. (10)). Some typical processed images bythis algorithm are shown in Figs. 6d, 7d and 8d. Thefollowing will give detailed analysis to prove that thecombination of the three independent threshold pro-cesses can better identify the contaminants from wool.
H1 ¼ cos1 12½ðR GÞ þ ðR BÞ�=
�ffiffiffiffiffiffiffiffiffiffiffiffiffiffiffiffiffiffiffiffiffiffiffiffiffiffiffiffiffiffiffiffiffiffiffiffiffiffiffiffiffiffiffiffiffiffiffiffiffiffiffiffiffiffiffiffiðR GÞ
2þ ðR BÞðG BÞ
q �, ð4Þ
where H ¼ H1, if BpG or H ¼ 3601-H1 if B4G,
S ¼ ½maxðR;G;BÞ minðR;G;BÞ�=maxðR;G;BÞ, (5)
V ¼ maxðR;G;BÞ=255, (6)
lour space (fRGB(i, j))
f3(i, j) chsv(i, j)
ch(i, j) cs(i, j) cv(i, j)
Bsg(i, j) B3l(i, j) 3g(i, j)
or
B3sgl(i, j)
input colour image; f1(i,j), f2(i,j) and f3(i,j) separately represent the red,
transformed colour image in HSV colour space; ch(i,j), cs(i,j) and cv(i,j)
ur space; B1g(i,j), B2g(i,j) and B3g(i,j) separately represent the processed
ithm; B1l(i,j), B2l(i,j) and B3l(i,j) separately represent the processed red,
Bsg(i,j) represents processed saturation grey-scale image by the global
ARTICLE IN PRESS
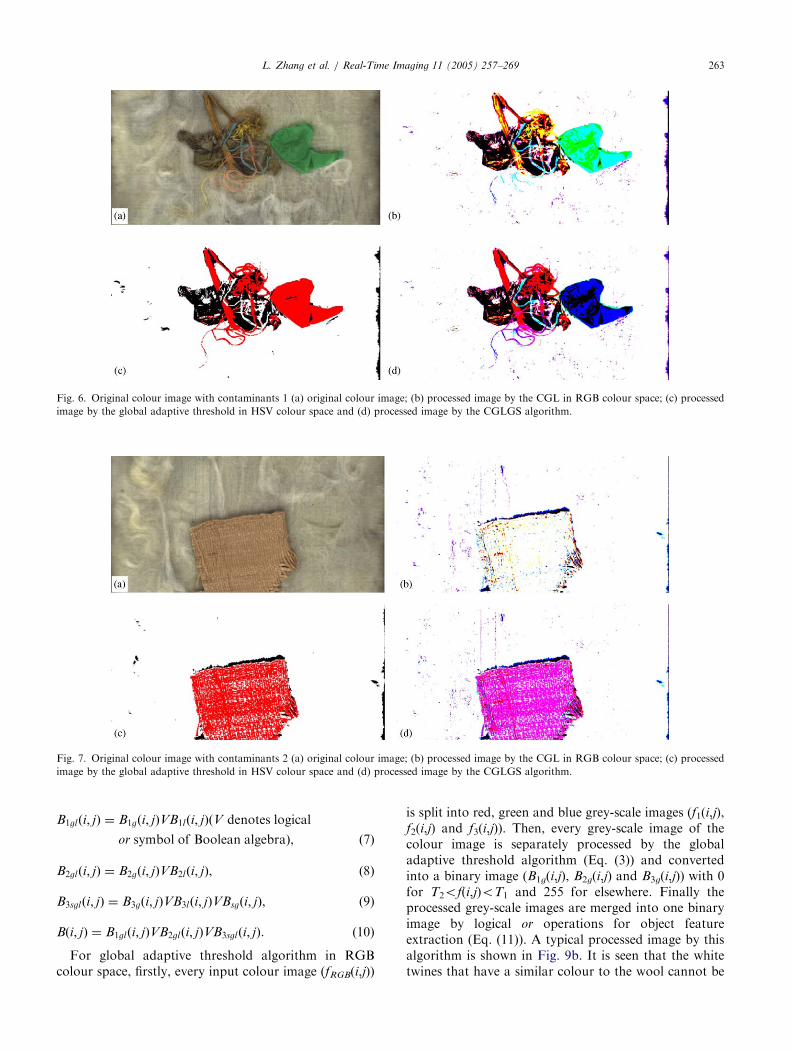
Fig. 6. Original colour image with contaminants 1 (a) original colour image; (b) processed image by the CGL in RGB colour space; (c) processed
image by the global adaptive threshold in HSV colour space and (d) processed image by the CGLGS algorithm.
Fig. 7. Original colour image with contaminants 2 (a) original colour image; (b) processed image by the CGL in RGB colour space; (c) processed
image by the global adaptive threshold in HSV colour space and (d) processed image by the CGLGS algorithm.
L. Zhang et al. / Real-Time Imaging 11 (2005) 257–269 263
B1glði; jÞ ¼ B1gði; jÞVB1lði; jÞðV denotes logical
or symbol of Boolean algebraÞ, ð7Þ
B2glði; jÞ ¼ B2gði; jÞVB2lði; jÞ, (8)
B3sglði; jÞ ¼ B3gði; jÞVB3lði; jÞVBsgði; jÞ, (9)
Bði; jÞ ¼ B1glði; jÞVB2glði; jÞVB3sglði; jÞ. (10)
For global adaptive threshold algorithm in RGBcolour space, firstly, every input colour image (fRGB(i,j))
is split into red, green and blue grey-scale images (f1(i,j),f2(i,j) and f3(i,j)). Then, every grey-scale image of thecolour image is separately processed by the globaladaptive threshold algorithm (Eq. (3)) and convertedinto a binary image (B1g(i,j), B2g(i,j) and B3g(i,j)) with 0for T2of(i,j)oT1 and 255 for elsewhere. Finally theprocessed grey-scale images are merged into one binaryimage by logical or operations for object featureextraction (Eq. (11)). A typical processed image by thisalgorithm is shown in Fig. 9b. It is seen that the whitetwines that have a similar colour to the wool cannot be
ARTICLE IN PRESS
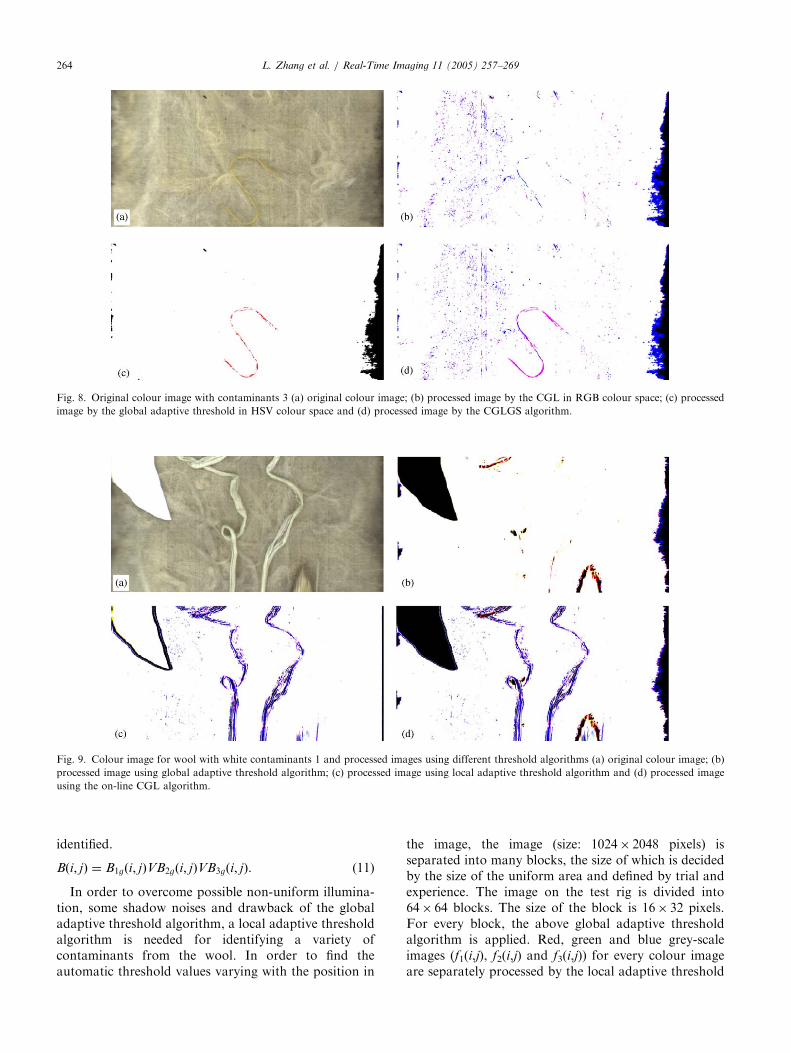
Fig. 8. Original colour image with contaminants 3 (a) original colour image; (b) processed image by the CGL in RGB colour space; (c) processed
image by the global adaptive threshold in HSV colour space and (d) processed image by the CGLGS algorithm.
Fig. 9. Colour image for wool with white contaminants 1 and processed images using different threshold algorithms (a) original colour image; (b)
processed image using global adaptive threshold algorithm; (c) processed image using local adaptive threshold algorithm and (d) processed image
using the on-line CGL algorithm.
L. Zhang et al. / Real-Time Imaging 11 (2005) 257–269264
identified.
Bði; jÞ ¼ B1gði; jÞVB2gði; jÞVB3gði; jÞ. (11)
In order to overcome possible non-uniform illumina-tion, some shadow noises and drawback of the globaladaptive threshold algorithm, a local adaptive thresholdalgorithm is needed for identifying a variety ofcontaminants from the wool. In order to find theautomatic threshold values varying with the position in
the image, the image (size: 1024� 2048 pixels) isseparated into many blocks, the size of which is decidedby the size of the uniform area and defined by trial andexperience. The image on the test rig is divided into64� 64 blocks. The size of the block is 16� 32 pixels.For every block, the above global adaptive thresholdalgorithm is applied. Red, green and blue grey-scaleimages (f1(i,j), f2(i,j) and f3(i,j)) for every colour imageare separately processed by the local adaptive threshold
ARTICLE IN PRESSL. Zhang et al. / Real-Time Imaging 11 (2005) 257–269 265
algorithm, and converted into a binary image (B1l(i,j),B2l(i,j) and B3l(i,j)) with 0 for T2of(i,j)oT1 and 255 forelsewhere. The last image (B(i,j)) is created by logical or
operations with the processed red, green and blue grey-scale images (Eq. (12)).
Bði; jÞ ¼ B1lði; jÞVB2lði; jÞVB3lði; jÞ. (12)
By this local adaptive threshold algorithm, only edgeof the large contaminants could be identified althoughsome light polypropylene twines could be fully identified(Fig. 9c). Therefore, the better results could be obtainedby merging the local adaptive threshold algorithm intothe global adaptive threshold algorithm. Firstly, the red,green and blue grey-scale images of the colour image areseparately processed by the global and local adaptivethreshold algorithms. Then, for every grey-scale image,the processed results by these two algorithms are mergedtogether by a logical or operation. Finally, the lastprocessed image is created by logical or operations withthe processed every grey-scale image. The processedimages by the Combination of Global and Localadaptive threshold algorithms (CGL) are shown in Figs.6b, 7b, 8b and 9d. From these processed images, it canbe seen that the CGL algorithm could not clearlyidentify the light yellow, yellow and brown colourcontaminants algorithm although it could completelyidentify light and white colour polypropylene twines.
For identification of the light yellow, yellow andbrown colour contaminants, colour space transforma-tions including NTSC and YcbCr colour spaces wereinitially investigated in the MatlabTM image processingtoolbox. Unfortunately, none of them provided goodresults for identification of these contaminants. Becausethe Hue, Saturation and Intensity (HSI) family of colourspace including the HSV model, has advantages overother colour spaces such as good compatibility withhuman intuition and separability of chromatic valuesfrom achromatic values, segmentation in some applica-tions is performed in HSV colour space [9,10]. In thisapplication, Image segmentation in HSV colour spacealso provides good results for identification of thesecontaminants.
Firstly, every input colour image (fRGB(i,j)) in RGBcolour space is transformed into a colour image (chsv(i,j))in HSV colour space by Eqs. (4)–(6) [31]. Then thecolour image in HSV colour space is split into hue,saturation and value grey-scale images ch(i,j), cs(i,j),cv(i,j)). Every grey-scale image is separately processed bythe global adaptive threshold algorithm (Eq. (3)). Thelast processed image (B(i,j)) is created by logical or
operations of every processed grey-scale images (Bhg(i,j)V Bsg(i,j) V Bvg(i,j)) in HSV colour space. The typicalprocessed images by the global adaptive thresholdalgorithm in HSV colour space are shown in Figs. 6c,7c, and 8c. It is seen that the global adaptive thresholdalgorithm in HSV colour space can adequately segment
the brown packaging bag, and light yellow and yellowtwines. However, it cannot segment the light blue andblue colour contaminants. Actually, the brown packa-ging bag, light yellow and yellow twines can beadequately identified by the Global adaptive thresholdalgorithm in Saturation grey-scale image (GS) in HSVcolour space by the practical image processing trials.Therefore, the combination of CGL in RGB colourspace and GS in HSV colour space (CGLGS) can bestsegment the contaminants from the wool background.The combinative process has been already described inSection 3.2.2.
In the processed images (Figs. 6d, 7d and 8d), it is alsoshown that the noises are very tiny points that will notbe counted as blobs. In this case, they do not affect thecontaminant identification. Therefore, any post-proces-sing operations like median filter or erosion and dilationto filter off the image noises were not necessary in orderto save the total image processing time.
3.2.3. Feature extraction algorithm
In order to remove the contaminants, the geometricalfeature (the coordinates of the contaminant centroids) isextracted from the processed binary image. Firstly, aconnectivity analysis on run lengths for every binaryimage is performed [21]. The connected regions of non-zero valued pixels are extracted in the form of blobvectors. The blob vectors are then used to extract theblob object features including measuring centroidlocation, major and minor axes, etc. The blob objectsless than 4 cm long or wide are considered as noise andeliminated. The coordinates of the centroids for thecontaminants are calculated by the Eqs. (13) and (14):
xc ¼ ðSpinxiÞ=Spi, (13)
yc ¼ ðSpinyiÞ=Spi, (14)
where pi is the value of pixel i in the blob object, and xi
and yi are its x and y coordinates.Finally, according to the positions of the contaminant
centroids in the image, the corresponding pixel values ofthe low-resolution image (2� 8) transformed from thehigh-resolution image (1024� 2048) are set to ‘‘1’’ withothers resetting ‘‘0’’. The low-resolution image data arethen used for contaminant removal in the sortingsystem.
4. Experiments and performance analysis
The performance of the AVI system can be evaluatedby the performance of image processing algorithms,real-time capability of the AVI system and accuracy andstability of the sorting system. The accuracy andstability of the sorting system were presented in [20].The performance of image processing algorithms and
ARTICLE IN PRESSL. Zhang et al. / Real-Time Imaging 11 (2005) 257–269266
real-time capability of the AVI system are described inthis section.
4.1. Contaminant identification rate
The performance of image processing algorithms isevaluated by the contaminant identification rate both onthe lab test rig and on the large-scale factory test rig.
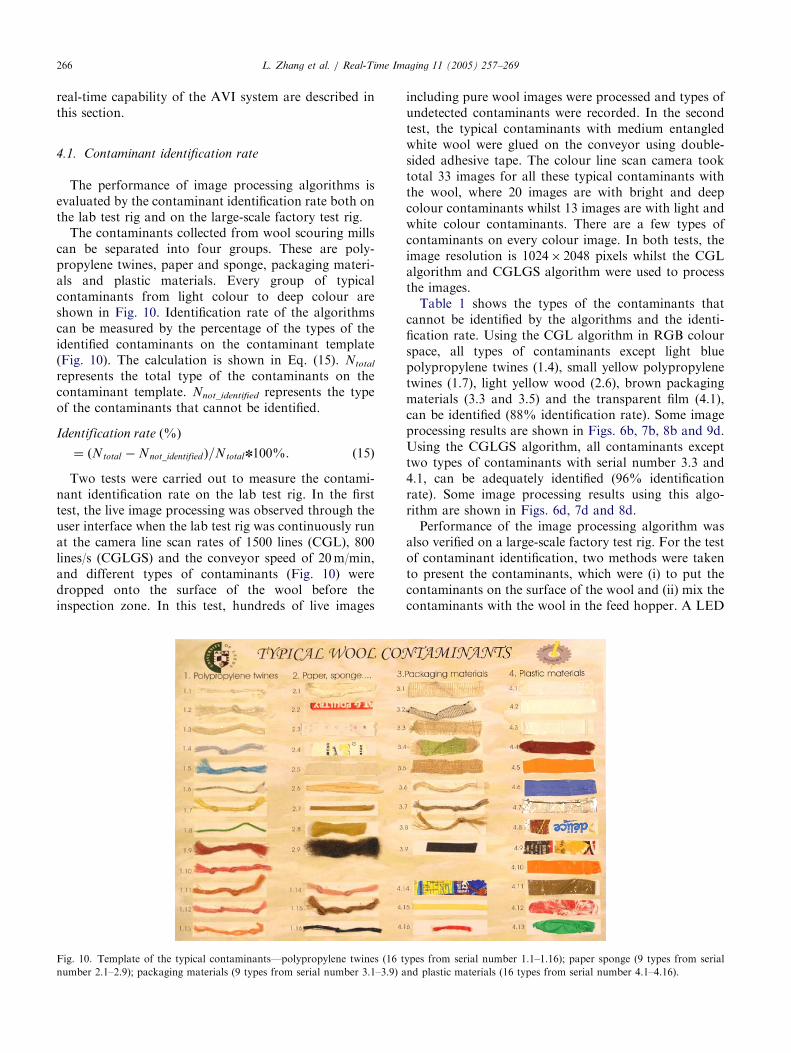
The contaminants collected from wool scouring millscan be separated into four groups. These are poly-propylene twines, paper and sponge, packaging materi-als and plastic materials. Every group of typicalcontaminants from light colour to deep colour areshown in Fig. 10. Identification rate of the algorithmscan be measured by the percentage of the types of theidentified contaminants on the contaminant template(Fig. 10). The calculation is shown in Eq. (15). Ntotal
represents the total type of the contaminants on thecontaminant template. Nnot_identified represents the typeof the contaminants that cannot be identified.
Identification rate ð%Þ
¼ ðNtotal Nnot_identified Þ=Ntotaln100%. ð15Þ
Two tests were carried out to measure the contami-nant identification rate on the lab test rig. In the firsttest, the live image processing was observed through theuser interface when the lab test rig was continuously runat the camera line scan rates of 1500 lines (CGL), 800lines/s (CGLGS) and the conveyor speed of 20m/min,and different types of contaminants (Fig. 10) weredropped onto the surface of the wool before theinspection zone. In this test, hundreds of live images
Fig. 10. Template of the typical contaminants—polypropylene twines (16 t
number 2.1–2.9); packaging materials (9 types from serial number 3.1–3.9) a
including pure wool images were processed and types ofundetected contaminants were recorded. In the secondtest, the typical contaminants with medium entangledwhite wool were glued on the conveyor using double-sided adhesive tape. The colour line scan camera tooktotal 33 images for all these typical contaminants withthe wool, where 20 images are with bright and deepcolour contaminants whilst 13 images are with light andwhite colour contaminants. There are a few types ofcontaminants on every colour image. In both tests, theimage resolution is 1024� 2048 pixels whilst the CGLalgorithm and CGLGS algorithm were used to processthe images.
Table 1 shows the types of the contaminants thatcannot be identified by the algorithms and the identi-fication rate. Using the CGL algorithm in RGB colourspace, all types of contaminants except light bluepolypropylene twines (1.4), small yellow polypropylenetwines (1.7), light yellow wood (2.6), brown packagingmaterials (3.3 and 3.5) and the transparent film (4.1),can be identified (88% identification rate). Some imageprocessing results are shown in Figs. 6b, 7b, 8b and 9d.Using the CGLGS algorithm, all contaminants excepttwo types of contaminants with serial number 3.3 and4.1, can be adequately identified (96% identificationrate). Some image processing results using this algo-rithm are shown in Figs. 6d, 7d and 8d.
Performance of the image processing algorithm wasalso verified on a large-scale factory test rig. For the testof contaminant identification, two methods were takento present the contaminants, which were (i) to put thecontaminants on the surface of the wool and (ii) mix thecontaminants with the wool in the feed hopper. A LED
ypes from serial number 1.1–1.16); paper sponge (9 types from serial
nd plastic materials (16 types from serial number 4.1–4.16).
ARTICLE IN PRESS
Table 1
Performance analysis of the algorithms
Algorithms Not identified contaminant typesa Identification rate for contaminant type (%)
Polypropylene twines Paper sponge Packaging materials Plastic materials
CGLb 1.4, 1.7 2.6 3.3, 3.5 4.1 88
CGLGSc None None 3.3 4.1 96
aSerial numbers of the contaminants shown in Fig. 10.bCGL: The combination of global and local adaptive threshold algorithms.cCGLGS: The combination of CGL in RGB colour space and global adaptive threshold in saturation grey-scale image in HSV colour space.
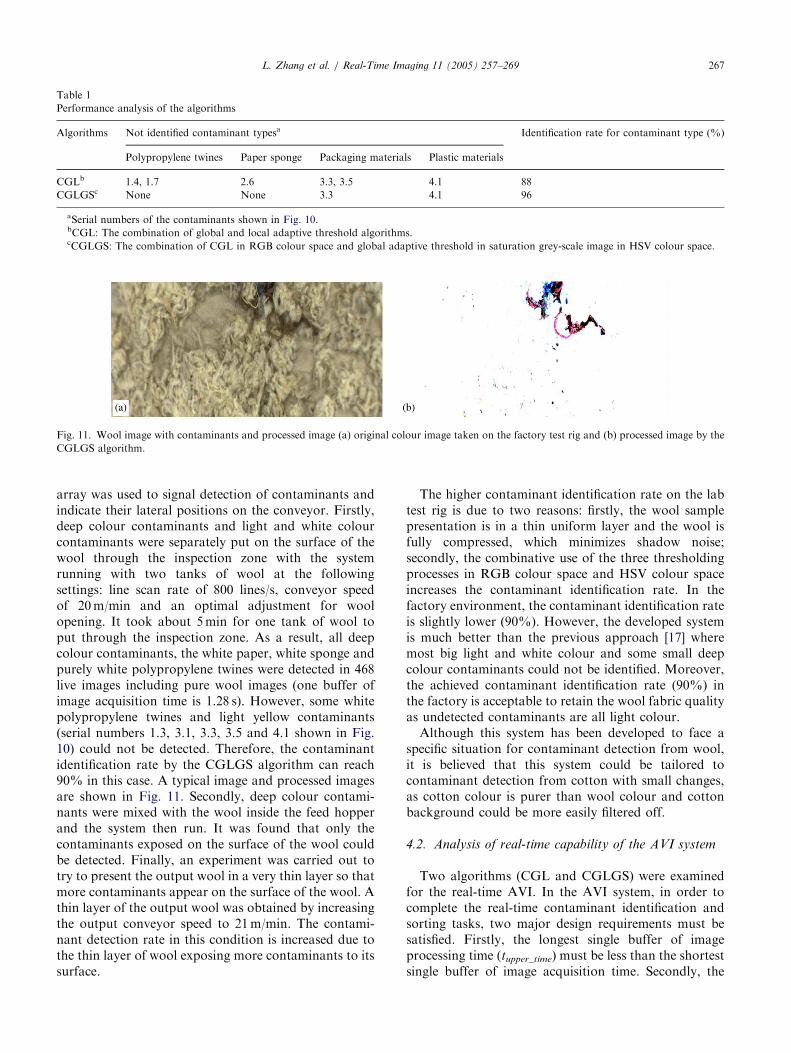
Fig. 11. Wool image with contaminants and processed image (a) original colour image taken on the factory test rig and (b) processed image by the
CGLGS algorithm.
L. Zhang et al. / Real-Time Imaging 11 (2005) 257–269 267
array was used to signal detection of contaminants andindicate their lateral positions on the conveyor. Firstly,deep colour contaminants and light and white colourcontaminants were separately put on the surface of thewool through the inspection zone with the systemrunning with two tanks of wool at the followingsettings: line scan rate of 800 lines/s, conveyor speedof 20m/min and an optimal adjustment for woolopening. It took about 5min for one tank of wool toput through the inspection zone. As a result, all deepcolour contaminants, the white paper, white sponge andpurely white polypropylene twines were detected in 468live images including pure wool images (one buffer ofimage acquisition time is 1.28 s). However, some whitepolypropylene twines and light yellow contaminants(serial numbers 1.3, 3.1, 3.3, 3.5 and 4.1 shown in Fig.10) could not be detected. Therefore, the contaminantidentification rate by the CGLGS algorithm can reach90% in this case. A typical image and processed imagesare shown in Fig. 11. Secondly, deep colour contami-nants were mixed with the wool inside the feed hopperand the system then run. It was found that only thecontaminants exposed on the surface of the wool couldbe detected. Finally, an experiment was carried out totry to present the output wool in a very thin layer so thatmore contaminants appear on the surface of the wool. Athin layer of the output wool was obtained by increasingthe output conveyor speed to 21m/min. The contami-nant detection rate in this condition is increased due tothe thin layer of wool exposing more contaminants to itssurface.
The higher contaminant identification rate on the labtest rig is due to two reasons: firstly, the wool samplepresentation is in a thin uniform layer and the wool isfully compressed, which minimizes shadow noise;secondly, the combinative use of the three thresholdingprocesses in RGB colour space and HSV colour spaceincreases the contaminant identification rate. In thefactory environment, the contaminant identification rateis slightly lower (90%). However, the developed systemis much better than the previous approach [17] wheremost big light and white colour and some small deepcolour contaminants could not be identified. Moreover,the achieved contaminant identification rate (90%) inthe factory is acceptable to retain the wool fabric qualityas undetected contaminants are all light colour.
Although this system has been developed to face aspecific situation for contaminant detection from wool,it is believed that this system could be tailored tocontaminant detection from cotton with small changes,as cotton colour is purer than wool colour and cottonbackground could be more easily filtered off.
4.2. Analysis of real-time capability of the AVI system
Two algorithms (CGL and CGLGS) were examinedfor the real-time AVI. In the AVI system, in order tocomplete the real-time contaminant identification andsorting tasks, two major design requirements must besatisfied. Firstly, the longest single buffer of imageprocessing time (tupper_time) must be less than the shortestsingle buffer of image acquisition time. Secondly, the
ARTICLE IN PRESS
Table 2
Parameters for analysis of real-time capability
Algorithms
Parameters CGL in RGB colour space CGLGS
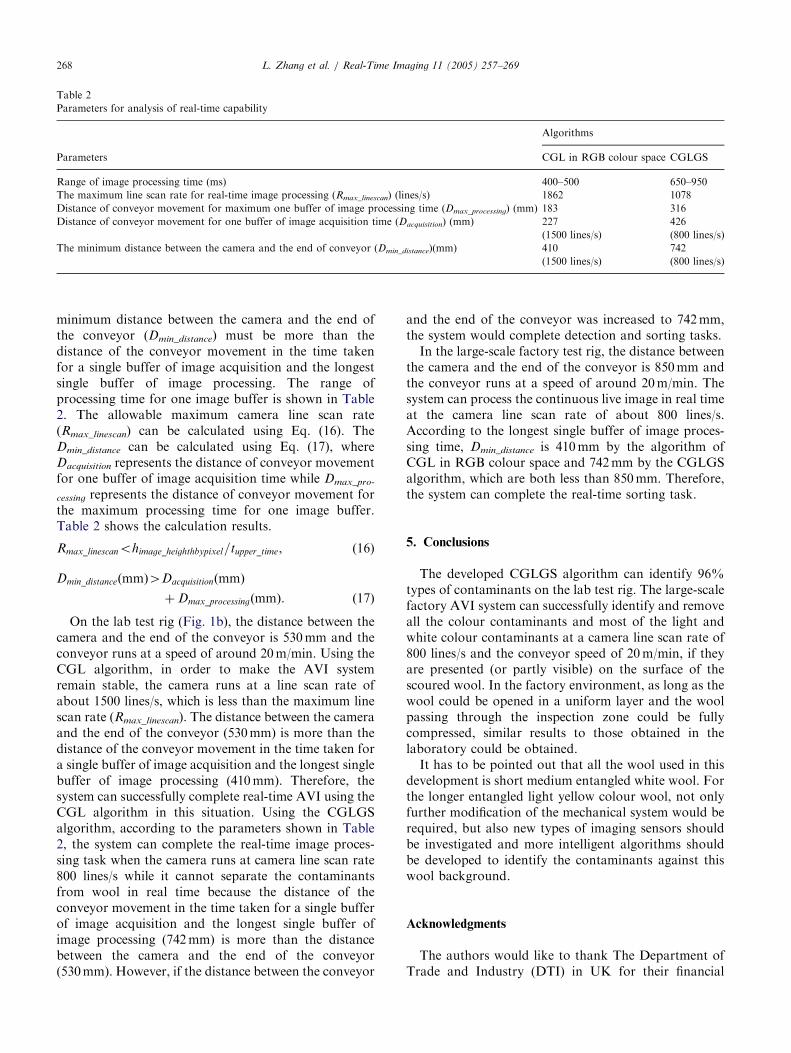
Range of image processing time (ms) 400–500 650–950
The maximum line scan rate for real-time image processing (Rmax_linescan) (lines/s) 1862 1078
Distance of conveyor movement for maximum one buffer of image processing time (Dmax_processing) (mm) 183 316
Distance of conveyor movement for one buffer of image acquisition time (Dacquisition) (mm) 227 426
(1500 lines/s) (800 lines/s)
The minimum distance between the camera and the end of conveyor (Dmin_distance)(mm) 410 742
(1500 lines/s) (800 lines/s)
L. Zhang et al. / Real-Time Imaging 11 (2005) 257–269268
minimum distance between the camera and the end ofthe conveyor (Dmin_distance) must be more than thedistance of the conveyor movement in the time takenfor a single buffer of image acquisition and the longestsingle buffer of image processing. The range ofprocessing time for one image buffer is shown in Table2. The allowable maximum camera line scan rate(Rmax_linescan) can be calculated using Eq. (16). TheDmin_distance can be calculated using Eq. (17), whereDacquisition represents the distance of conveyor movementfor one buffer of image acquisition time while Dmax_pro-
cessing represents the distance of conveyor movement forthe maximum processing time for one image buffer.Table 2 shows the calculation results.
Rmax_linescanohimage_heighthbypixel=tupper_time, (16)
Dmin_distanceðmmÞ4DacquisitionðmmÞ
þ Dmax_processingðmmÞ. ð17Þ
On the lab test rig (Fig. 1b), the distance between thecamera and the end of the conveyor is 530mm and theconveyor runs at a speed of around 20m/min. Using theCGL algorithm, in order to make the AVI systemremain stable, the camera runs at a line scan rate ofabout 1500 lines/s, which is less than the maximum linescan rate (Rmax_linescan). The distance between the cameraand the end of the conveyor (530mm) is more than thedistance of the conveyor movement in the time taken fora single buffer of image acquisition and the longest singlebuffer of image processing (410mm). Therefore, thesystem can successfully complete real-time AVI using theCGL algorithm in this situation. Using the CGLGSalgorithm, according to the parameters shown in Table2, the system can complete the real-time image proces-sing task when the camera runs at camera line scan rate800 lines/s while it cannot separate the contaminantsfrom wool in real time because the distance of theconveyor movement in the time taken for a single bufferof image acquisition and the longest single buffer ofimage processing (742mm) is more than the distancebetween the camera and the end of the conveyor(530mm). However, if the distance between the conveyor
and the end of the conveyor was increased to 742mm,the system would complete detection and sorting tasks.
In the large-scale factory test rig, the distance betweenthe camera and the end of the conveyor is 850mm andthe conveyor runs at a speed of around 20m/min. Thesystem can process the continuous live image in real timeat the camera line scan rate of about 800 lines/s.According to the longest single buffer of image proces-sing time, Dmin_distance is 410mm by the algorithm ofCGL in RGB colour space and 742mm by the CGLGSalgorithm, which are both less than 850mm. Therefore,the system can complete the real-time sorting task.
5. Conclusions
The developed CGLGS algorithm can identify 96%types of contaminants on the lab test rig. The large-scalefactory AVI system can successfully identify and removeall the colour contaminants and most of the light andwhite colour contaminants at a camera line scan rate of800 lines/s and the conveyor speed of 20m/min, if theyare presented (or partly visible) on the surface of thescoured wool. In the factory environment, as long as thewool could be opened in a uniform layer and the woolpassing through the inspection zone could be fullycompressed, similar results to those obtained in thelaboratory could be obtained.
It has to be pointed out that all the wool used in thisdevelopment is short medium entangled white wool. Forthe longer entangled light yellow colour wool, not onlyfurther modification of the mechanical system would berequired, but also new types of imaging sensors shouldbe investigated and more intelligent algorithms shouldbe developed to identify the contaminants against thiswool background.
Acknowledgments
The authors would like to thank The Department ofTrade and Industry (DTI) in UK for their financial
ARTICLE IN PRESSL. Zhang et al. / Real-Time Imaging 11 (2005) 257–269 269
support and Mr C. McBurney and Mr J. Mundh fortheir technical support as well as the help and advice oftheir UK collaborators: Buckfast Spinning, BritishWool Marketing Board, the Confederation of BritishWool Textiles, the Dawson Group, Haworth ScouringCo., Victoria Carpets, Thomas Chadwick & Sons andWira Instrumentation Ltd.
References
[1] Chin RT. Automated visual inspection: a survey. IEEE Transac-
tions on Pattern Analysis and Machine Intelligence 1982;4(6):
557–73.
[2] Chin RT. Survey: automated visual inspection: 1981 to 1987.
Computer Vision, Graphics and Image Processing 1988;41:
346–81.
[3] Newman TS, Jain AK. Survey of automated visual inspection.
Computer Vision and Image Understanding 1995;61(2):231–62.
[4] Thomas ADH, Rodd MG, Holt JD, Neill CJ. Real-time industrial
visual inspection: a review. Real-time Imaging 1995;1:139–58.
[5] Liao K, Paulsen MR, Reid JF. Real-time detection of colour
surface defects of maise kernels using machine vision. Journal of
Agriculture Engineering Research 1994;59:263–71.
[6] King TG, Tal LG. An incremental real-time pattern tracking
algorithm for line-scan camera application. Mechatronics 1994;
4(5):503–16.
[7] Davies ER. Machine vision, theory, algorithms, practicalities, 2nd
ed. San Diego, CA, USA: Academic Press Inc.; 1997. p. 488–92.
[8] Pal NR, Pal SK. A review on image segmentation techniques.
Pattern recognition 1993;26:1277–94.
[9] Li N, Bu JJ, Chen C. Real-time video object segmentation using
HSV colour space. Proceedings of 2002 international conference
on image processing, 22–25 September 2002, vol. 2. p. II-85–8.
[10] Sigal L, Sclaroff S, Athitsos V. Estimation and prediction of
evolving color distributions for skin segmentation under varying
illumination. Proceedings of IEEE conference on computer vision
and pattern recognition, 13–15 June 2000, vol. 2. p. 152–9.
[11] Baykut A, Ataly A, Erc- il A, Guler M. Real-time detect inspection
of textured surfaces. Real-time Imaging 2000;6:17–27.
[12] Hormes LL, Wulfhorst LB. Identification of trash particles using
digital image processing. ITB Yarn and Fabric Forming 1995; (2):
4–12.
[13] Ozkaya YA, Acar M, Jackson MR. Computer vision for yarn
characterization. Proceedings of mechatronics eighth interna-
tional forum conference 2002, 24–26 June 2002, University of
Twente, Holland, 2002. p. 675–85.
[14] King T. Vision-in-the-loop for control in manufacturing. Mecha-
tronics 2003;13(10):1123–47.
[15] Chudleigh PW, Foulds RA, Wong P. Detecting colored fiber
contaminants in wool top using balanced illumination. Textile
Research Journal 1985;55(4):233–8.
[16] Chudleigh PW. Detecting colored contaminants in wool using an
integrating sphere. Textile Research Journal 1991;61(10):568–74.
[17] Abbott GM. Automated color-sorting device for wool and other
fibers. Textile Research Journal 1995;65(6):331–8.
[18] Langenhove LV, Habets R, et al. Cotton fibre free of
contaminants. Wool textile congress on natural and natural
polymer fibres, July 1997, Huddersfield, UK, 1997. p. 231–9.
[19] Schilichter LS, Farber LC. A new system for the effective
control of foreign fibres. ITB International Textile Bulletin
2000;3:48–50.
[20] Zhang L, Dehghani A, Su Z, King T, Greenwood B, Levesley M.
Development and integration of a PC-based mechatronic sorting
system for removing contaminants from wool. IEEE/ASME
Transactions on Mechatronics 2005;10(3).
[21] Coreco Inc. Sapera smart series and processing modules
programmer’s manual. 4th ed. Part number OC-SAPM-SSPP0
2001. p. 1–298.
[22] Zhang L, Dehghani A, Su Z, King T, Greenwood BD.
Identification of white contaminants and their removal from
wool fibres. Proceedings of SPIE-IS&T electronic imaging 2003,
21–23 January 03, San Jose, CA, USA, SPIE vol. 5011. p. 22–31.
[23] Ostu N. A threshold selection method for grey-level histograms.
IEEE Transactions on System, Man, and Cybernetics 1979;9:
62–6.
[24] Kittler J, Illingworth J. Minimum error thresholding. Pattern
Recognition 1986;19(1):41–7.
[25] Tsai DM, Chen YH. A fast histogram clustering approach for
multi-level thresholding. Pattern Recognition Letter 1992;13:
245–52.
[26] Hannah I, Patel D, Davies R. The use of variance and entropic
thresholding methods for image segmentation. Pattern Recogni-
tion 1995;28(8):1135–43.
[27] Sahoo PK, Soltani S, Wong KC. A survey of thresholding
techniques. Computer Vision, Graphics, and Image Processing
1988;41:233–60.
[28] Lee SU, Chung SY, Park RH. A comparative performance study
of several global thresholding techniques for segmentation.
Computer Vision, Graphics and Image Processing 1990;52:
171–90.
[29] Wang AKC, Sahoo PK. A grey-level threshold selection method
based on maximum entropy principle. IEEE Transactions on
Systems, Man, and Cybernetics 1989;19(4):866–71.
[30] Zhang L. Mechatronics and machine vision for contaminant
removal from wool (Dissertation). Leeds (UK): University of
Leeds; 2004. p. 94–6.
[31] Plataniotis KN, Venetsanopoulos AN. Color image processing
and applications. Berlin: Springer, New York: Heidelberg; 2000.
p. 25–6.