Embed Size (px)
Citation preview

Real estate OppORtunities Fund ViI, l.p.

(This page has been left blank intentionally.)

oaktree real estate opportunities fund vii, l.p.
This presentation is provided for informational purposes only and does not constitute, and should not be construed as, an offer to sell, or a solicitation of an offer to buy, interests in Oaktree Real Estate Opportunities Fund VII, L.P. or its related feeder fund(s) and parallel fund(s), if any (individually or collectively, as the context requires, the “Fund”). Any such offer may only be made pursuant to the Fund’s confidential private placement memorandum and any related supplements (the “PPM”), subscription documents and constituent documents in their final form.
This presentation does not constitute and should not be construed as investment, legal or tax advice, or a recommendation or opinion regarding the merits of investing in the Fund. Each potential investor should consult its own counsel, accountant or investment adviser as to the legal, tax and related matters concerning its investment. A potential investor considering an investment in the Fund should read this presentation in conjunction with the PPM. The PPM contains a more complete description of the Fund’s investment strategy, practices, terms and conditions, restrictions, risks and other factors relevant to a decision to invest in the Fund, and also contains tax information and risk disclosures that are important to any investment decision. All information herein is subject to and qualified in its entirety by the PPM. No person has been authorized to make any statement concerning the Fund other than as set forth in the PPM and any such statements, if made, may not be relied upon. The date of the information is indicated herein, and Oaktree (as defined below) has no duty to update such information.
Responses to any inquiry that may involve the rendering of personalized investment advice or effecting or attempting to effect transactions in securities will not be made absent compliance with applicable laws or regulations (including broker dealer, investment adviser or applicable agent or representative registration requirements), or applicable exemptions or exclusions therefrom.
The term “Oaktree®” used herein refers to Oaktree Capital Management, L.P.™ or its affiliates, individually or collectively, as the context requires. Terms used but not defined herein shall have the meanings set forth in the PPM.
None of the information contained herein has been filed with the U.S. Securities and Exchange Commission, any securities administrator under any state securities laws or any other U.S. or non-U.S. governmental or self-regulatory authority. No governmental authority has passed on the merits of any offering of interests in the Fund or the adequacy of the information contained herein. Any representation to the contrary is unlawful.
This presentation is being provided on a confidential basis solely for the information of those persons to whom it is given. The materials, including the information contained herein, may not be copied, reproduced, republished, posted, transmitted, distributed, disseminated or disclosed, in whole or in part, to any other person in any way without the prior written consent of Oaktree. By accepting this presentation, you agree that you will comply with these confidentiality restrictions and acknowledge that your compliance is a material inducement to Oaktree providing this presentation to you.
U.S. securities laws (and the securities laws of certain non-U.S. jurisdictions) prohibit any person who has received material non-public information about a company from purchasing or selling securities of such company or from communicating such information to any other person when it is reasonably foreseeable that such other person is likely to purchase or sell such securities in reliance upon such information. By accepting this presentation, you acknowledge that this presentation may contain material, non-public information concerning Oaktree Capital Group, LLC or its securities and you agree not to trade in the securities of Oaktree Capital Group, LLC if you are in possession of material non-public information concerning Oaktree Capital Group, LLC unless such trading is permitted by applicable law.
The information contained herein is unaudited and is being shared with you to help you obtain a better understanding of the investments and performance of the Fund. Oaktree makes no representation or warranty regarding the accuracy or completeness of the information contained herein or whether it will assist you in connection with your due diligence.
This presentation is being provided by OCM® Investments, LLC (Member FINRA), a subsidiary of Oaktree. All inquiries regarding the Fund should be directed to a marketing representative of OCM Investments, LLC.
OCM Investments, LLC
333 S. Grand Avenue, 28th Floor 1301 Avenue of the Americas, 34th Floor Los Angeles, CA 90071 New York, NY 10019 Tel: +1 213 830 6300 Tel: +1 212 284 1900
CONFIDENTIAL

(This page has been left blank intentionally.)

OAKTREE REAL ESTATE OPPORTUNITIES FUND VII, L.P. Confidential
1
Table of Contents
1 | Executive Summary 2
2 | Oaktree Overview 4
3 | Oaktree Real Estate Overview 8
4 | Investment Track Record 16
5 | Investment Environment 20
6 | Summary Term Sheet 29
Appendices
I | Real Estate Team 32
II | Evolution of Six Areas of Focus – Sample Deals 34
III | Asset Management Overview 40
IV | Oaktree’s Real Estate Track Record 42
V | Performance Disclosures 43
VI | Legal Information 46

(This page has been left blank intentionally.)

1 | Executive Summary
OAKTREE REAL ESTATE OPPORTUNITIES FUND VII, L.P. Confidential
3
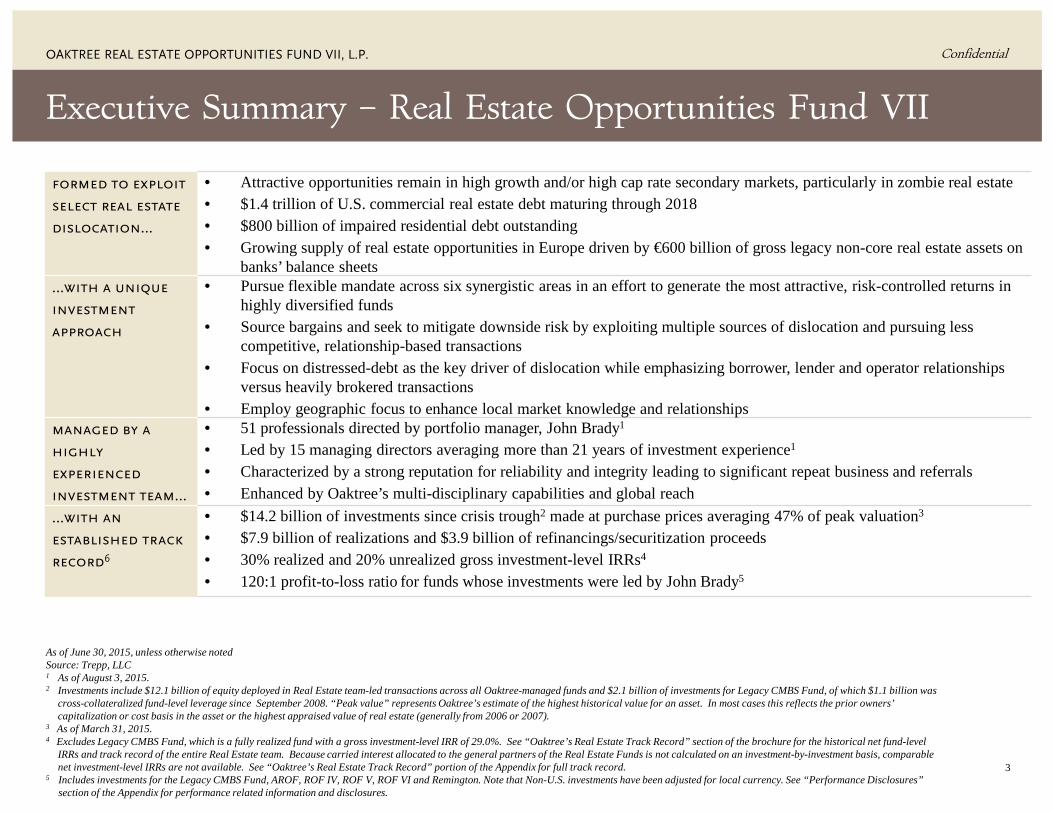
formed to exploit select real estate dislocation…
• Attractive opportunities remain in high growth and/or high cap rate secondary markets, particularly in zombie real estate • $1.4 trillion of U.S. commercial real estate debt maturing through 2018 • $800 billion of impaired residential debt outstanding • Growing supply of real estate opportunities in Europe driven by €600 billion of gross legacy non-core real estate assets on
banks’ balance sheets …with a unique investment approach
• Pursue flexible mandate across six synergistic areas in an effort to generate the most attractive, risk-controlled returns in highly diversified funds
• Source bargains and seek to mitigate downside risk by exploiting multiple sources of dislocation and pursuing less competitive, relationship-based transactions
• Focus on distressed-debt as the key driver of dislocation while emphasizing borrower, lender and operator relationships versus heavily brokered transactions
• Employ geographic focus to enhance local market knowledge and relationships managed by a highly experienced investment team…
• 51 professionals directed by portfolio manager, John Brady1
• Led by 15 managing directors averaging more than 21 years of investment experience1
• Characterized by a strong reputation for reliability and integrity leading to significant repeat business and referrals • Enhanced by Oaktree’s multi-disciplinary capabilities and global reach
…with an established track record6
• $14.2 billion of investments since crisis trough2 made at purchase prices averaging 47% of peak valuation3
• $7.9 billion of realizations and $3.9 billion of refinancings/securitization proceeds
• 30% realized and 20% unrealized gross investment-level IRRs4
• 120:1 profit-to-loss ratio for funds whose investments were led by John Brady5
Executive Summary – Real Estate Opportunities Fund VII
As of June 30, 2015, unless otherwise noted Source: Trepp, LLC 1 As of August 3, 2015. 2 Investments include $12.1 billion of equity deployed in Real Estate team-led transactions across all Oaktree-managed funds and $2.1 billion of investments for Legacy CMBS Fund, of which $1.1 billion was
cross-collateralized fund-level leverage since September 2008. “Peak value” represents Oaktree’s estimate of the highest historical value for an asset. In most cases this reflects the prior owners’ capitalization or cost basis in the asset or the highest appraised value of real estate (generally from 2006 or 2007).
3 As of March 31, 2015. 4 Excludes Legacy CMBS Fund, which is a fully realized fund with a gross investment-level IRR of 29.0%. See “Oaktree’s Real Estate Track Record” section of the brochure for the historical net fund-level
IRRs and track record of the entire Real Estate team. Because carried interest allocated to the general partners of the Real Estate Funds is not calculated on an investment-by-investment basis, comparable net investment-level IRRs are not available. See “Oaktree’s Real Estate Track Record” portion of the Appendix for full track record.
5 Includes investments for the Legacy CMBS Fund, AROF, ROF IV, ROF V, ROF VI and Remington. Note that Non-U.S. investments have been adjusted for local currency. See “Performance Disclosures” section of the Appendix for performance related information and disclosures.

2 | Oaktree Overview

OAKTREE REAL ESTATE OPPORTUNITIES FUND VII, L.P. Confidential
5
Oaktree Overview – Profile
• Founded April 1995
• Invests in less efficient and alternative markets
• $100.2 billion in assets under management across highly synergistic investment platforms
• Seven senior executives and over 900 staff members, with ownership held by senior personnel who comprise one-fourth of the Company
• Offices in 17 cities in 12 countries:
United States: Los Angeles (headquarters), New York, Houston and Stamford (Connecticut)
Europe & Middle East: Amsterdam1, Dubai, Dublin1, Frankfurt, London, Luxembourg1 and Paris
Asia: Beijing, Hong Kong, Seoul, Shanghai, Singapore and Tokyo
As of September 30, 2015 1 Office of affiliates of Oaktree-managed funds.

OAKTREE REAL ESTATE OPPORTUNITIES FUND VII, L.P. Confidential
6
Oaktree Overview – Asset Breakdown
Assets ($ in millions) % of Assets
Public Funds $27,022 27%
Corporate Pensions 16,157 16
Insurance Companies 9,239 9
Sovereign Wealth Funds 8,485 9
Corporate 7,669 8
Sub-Advisory – Mutual Funds 6,915 7
Endowments/Foundations 6,637 7
Private – HNW/Family Office 5,511 5
Fund of Funds 2,202 2
Unions 2,132 2
Oaktree and Other 8,268 8
Total $100,237 100% CONVERTIBLE SECURITIES
U.S. Convertibles $4,488
Non-U.S. Convertibles 2,298
High Income Convertibles 877
Subtotal $7,663
DISTRESSED DEBT
Distressed Opportunities $23,801
Value Opportunities 1,511
Emerging Markets Opportunities 793
Subtotal $26,105
LISTED EQUITIES
Emerging Markets Equities $3,243
Emerging Markets Absolute Return
142
Value Equities 311
Japan Opportunities 110
Subtotal $3,806
CONTROL INVESTING
Global Principal $5,635
European Principal 6,100
Asia Principal 256
Infrastructure Investing 2,587
Power Opportunities 1,631
Subtotal $16,209
REAL ESTATE
Real Estate Opportunities $7,388
Real Estate Debt 1,361
Subtotal $8,749
Assets ($ millions)
Open-end $35,914
Closed-end 59,318
Evergreen 5,005
Total $100,237
As of September 30, 2015 1Global High Yield Bond AUM consists of $2,925 million of U.S. High Yield Bond AUM and $1,348 million of European High Yield Bond AUM.
investment areas Assets ($ in millions)
Total $100,237
clients
investment structure
CORPORATE DEBT
U.S. High Yield Bonds $15,316
Global High Yield Bonds1 4,273
European High Yield Bonds 1,144
U.S. Senior Loans 8,955
European Senior Loans 2,536
Strategic Credit 3,040
Mezzanine Finance 1,657
European Private Debt 622
Emerging Markets Total Return 162
Subtotal $37,705

OAKTREE REAL ESTATE OPPORTUNITIES FUND VII, L.P. Confidential
7
Investment Philosophy
All of Oaktree’s strategies operate pursuant to an investment philosophy that has remained unchanged since our founding in 1995
the primacy of risk control “Avoid the losers and the winners will take care of themselves”
emphasis on consistency
A superior record is best built on a high batting average rather than great successes that outweigh dismal failures
importance of market
inefficiencies It is only in less-efficient markets that hard work and skill are likely to produce superior returns
benefits of specialization Our team members’ long-term experience gives us a substantial advantage
macro-forecasting not critical to
investing A bottom-up value approach to investing is most productive
disavowal of market timing Bargains are purchased without reliance on guesses about the market’s future direction

3 | Oaktree Real Estate Overview

OAKTREE REAL ESTATE OPPORTUNITIES FUND VII, L.P. Confidential
9
focus strategy outlook
commercial • Acquire distressed real estate assets and recapitalize borrowers at discounts to peak value • Implement value-add asset management through asset repositioning strategies and execution of leasing/business plans
• Harvest healthy cash-on-cash returns and exit stabilized assets
non-u.s. • Pursue primarily commercial transactions in non-U.S. jurisdictions • Europe: emphasize commercial opportunity and non-performing loans (“NPLs”) • Asia: focus on micro dislocations in Japan and Korea and position for credit dislocation in China
residential
• Partner with land developers and homebuilders in strong markets – Small-scale, in-fill programs and lending platforms
• NPLs: Acquire NPL pools at deep discounts to current home values, employ a range of collaborative workouts and securitize a critical mass of loan pools
commercial npls
• Focus on smaller portfolios, proprietary transactions and strategic opportunities with banks and special servicers • Leverage existing staff of 165 professionals at Sabal Financial to service, asset manage and securitize assets1
corporate • Focus on limited proprietary off-market opportunities, including illiquid companies and platform build-ups
structured finance
• Focus on volatility by purchasing during periods of illiquidity and selling during periods of excessive momentum • Leverage Oaktree’s proprietary CMBS loan database and analytical infrastructure to capitalize on pooled and individual
loan opportunities
`
`
Six Areas of Investment Focus
`
`
`
As of June 30, 2015 1 Sabal currently provides services to real estate and other Oaktree funds. Oaktree owns a 50% interest in Sabal’s U.S. business and will own 90% of Sabal’s European business, but does not profit from
amounts paid by our funds to Sabal. Please refer to the PPM for additional information.
`

OAKTREE REAL ESTATE OPPORTUNITIES FUND VII, L.P. Confidential
10
focus team leaders
invested capital1
business highlights sample deals (see Appendix II) total rof vi
commercial Ambrose Fisher (LA) Todd Liker (NY)
$2,871 $1,874 • 21.9 million sq. ft. of office • 14.4 million sq. ft. of industrial • 8,182 hotel rooms • 4,250 multi-family apartment units
non-u.s. Ben Bianchi (London) Manish Desai (London) David Snelgrove (London) Toshi Kuroda (Tokyo) Steve Choi (Seoul) Yi Zhang (Hong Kong)
1,661 680 • 8.7 million sq. ft. of industrial • 7.3 million sq. ft. of mixed use • 2.0 million sq. ft. of office • 1.6 million sq. ft. of retail • 195 multi-family apartment units • 963 hotel rooms • Japanese residential REIT
residential
Jason Keller (LA)
3,321
645
• 28,125 single-family lots/homes • 2,059 attached for sale units • 21,857 loans • Eight portfolio securitizations • 10,188 NPL resolutions
commercial npls
Mark Jacobs (LA)
1,412 171 • 4,259 loans and REO properties • Three portfolio securitizations • Evaluated over 469 loan portfolios
corporate Todd Liker (NY) 2,214 115 • Eight distressed corporate debt investments • Four corporate platform investments
structured finance
Keith Gollenberg (NY) Justin Guichard (LA)
3,063 0 • 114 CMBS purchases
Regional Bank Commercial NPL Pool
Business Highlights – Real Estate Portfolio Overview
Anglesea Platform
Outlook
-
As of June 30, 2015 1 Total invested capital represents the aggregate gross invested capital for all Real Estate-led transactions completed from January 1, 2008 through June 30, 2015 (including recycling). ROF VI invested
capital represents the aggregate gross invested capital for the fund from inception through June 30, 2015.
Bascom Platform
Genesis Lending Platform
Kerzner CMBS
+
($ in millions)
Attractive opportunities still exist in secondary markets in the United States and Europe

OAKTREE REAL ESTATE OPPORTUNITIES FUND VII, L.P. Confidential
11
% purchase price average current
leverage2 average noi yield after debt
service4
focus total1 rof vi total3 rof vi3 total5 rof vi
commercial 56% of peak 69% of peak 56% 57% Current: 12% Stabilized: 15%
Current: 11% Stabilized: 15%
non-u.s. 60% of peak 58% of peak 57% 59% Current: 12% Stabilized: 14%
Current: 10% Stabilized: 17%
residential 41% of peak 44% of peak 36% 41% -- --
commercial npls
43% of unpaid principal balance “UPB” 32% of peak
47% of UPB, 34% of peak
36% 46% -- --
corporate 53% of peak -- 51% 50% -- --
structured finance
33% of peak -- 37% -- -- --
Business Highlights – Real Estate Portfolio Overview (continued)
As of June 30, 2015 1 Total includes all Real Estate-led transactions completed from January 1, 2008 through June 30, 2015. 2 Average current leverage represents the ratio of (a) the outstanding investment-level debt to (b) the sum of (i) the market value of current holdings and (ii) the outstanding investment-level debt. 3 Average current leverage for ROF VI excludes anticipated leverage on recent all-cash acquisitions. 4 Current: The ratio of current NOI, less debt service, to total equity, excluding any equity subordinate to the Funds' investment; reflects the levered cash yield to the Funds' investment before capital items;
stabilized: The return on equity advanced at acquisition, plus targeted equity contributions over the life of the investment, from the targeted stabilized net cash flow determined in the initial underwriting pro forma.
5 Total includes all real estate holdings in ROF IV, Remington, ROF V and ROF VI as of June 30, 2015.
Outlook +
-
Still able to source deals with attractive pricing and high current yields with modest leverage

OAKTREE REAL ESTATE OPPORTUNITIES FUND VII, L.P. Confidential
12
37%
7%
11% 9%
15%
14%
7%
Commencement of Operations 2008 2011 2012 2015
Committed Capital $450 million $1.3 billion $2.7 billion $3.5 billion
Invested Capital $796 million1 $1.9 billion1 $3.6 billion1 n/a
Price as % of Peak Value 41% 48% 56% n/a
Loss Ratio2 2% 0% 0% n/a
Number of Deals 55 86 106 n/a
Average Invested Capital3 $14 million $22 million $34 million n/a
19%
14%
17%
4% 24%
22%
commercial
non-u.s.
residential
residential npls
commercial npls
corporate
structured finance
51%
21%
12%
6%
5% 4%
Shifting Investment Focus Based on Market Conditions rof iv rof v rof vi
50%
25%
10%
5% 5%
5%
rof vii target
As of June 30, 2015 Note: Investment category allocations reflect aggregate invested capital less any financing proceeds received within the first year of acquisition for each fund from inception through June 30, 2015. 1 The total invested capital exceeds the total committed capital of the fund because the fund has the ability to (i) reinvest proceeds from realized investments during its investment period and (ii) make certain
“follow-on” investments after its investment period with proceeds from realized investments. 2 Represents total realized and unrealized losses excluding forward contracts, divided by invested capital. 3 Excludes the impact of post-close financing and securitization.
Highly diversified portfolios through evolving market cycles

OAKTREE REAL ESTATE OPPORTUNITIES FUND VII, L.P. Confidential
13
Regulatory Compliance
Non-performing Loan Pools
Dislocation and Relationships Drive Deal Flow
The combination of dislocation and our relationship-driven proprietary deal flow provides us with unique opportunities to access deals at significant discounts to market value
over 95% of the $14.2 billion deployed was driven by some form (and often multiple forms) of dislocation. on average, at least four of the drivers below were present in each transaction.
property-level debt or capital market dislocation: >80%
property-type and market dislocation: >15%
Bank- or Borrower-led
Recapitalization
Discounted Payoff
A-B Restructuring
Rescue Capital
Debt-to-equity Recapitalization
Seller Financing
Zombie Real Estate
Over-leveraged Asset
Capital-starved Asset
Mismanaged Asset
Absentee Owner
Motivated / Forced Seller
Imminent Debt Maturity
Liquidity Needs
Failed Sales Process
Lender REO Sale
Life of Fund Limitation
Corporate Constraints
Balance Sheet Repair
Partner Differences
Capital Reallocation
Strategic Realignment
Non-core Asset Sale
Unmet Demand Platform Build-ups
Opportunistic Equity
Limited or No Competition
Lender / Borrower
Relationship
Operating Partner
Relationship
High Yield in Out of Favor
Markets
Programmatic JVs to fill
Liquidity Gaps
Market Arbitrage
Debt Purchases
Corporate Debt
CMBS and Other Securities
Syndicated Bank Debt
minimal dislocation: <5%
Competitive Equity
Widely Marketed
Competitively Bid
Sold to Highest Bidder
Fully-priced equity deals represent less than 5% of our business
FDIC Sales
Bank Portfolio
Sales
and
and
Market Momentum
and/or
As of June 30, 2015

OAKTREE REAL ESTATE OPPORTUNITIES FUND VII, L.P. Confidential
14
56% 27%
18%
Proprietary Limited Competition Competitive
Preferred Access to Deal Flow and Loyal Relationships
Disciplined and highly selective investment process (current team closed on less than 5% of all opportunities reviewed)
61%
39%
Repeat Partners New Relationship
(% of total net invested capital) (% of total net invested capital)
exclusive access to deal flow1 relationship driven opportunities1
As of June 30, 2015 Note: Because a majority of our CMBS and loan portfolio purchases are sold through an auction process, they are typically categorized as competitive, even though the universe of qualified bidders is limited. 1 Represents total net invested capital for ROF IV, ROF V, Remington Account and ROF VI.

OAKTREE REAL ESTATE OPPORTUNITIES FUND VII, L.P. Confidential
15
Diversified Assets across Regions
united states and canada (excluding $2.5 billion of u.s. cmbs)
europe
asia
($ in millions) ($ in millions)
($ in millions)
As of June 30, 2015 Maps present the aggregate gross invested capital for all real estate investments made in AROF, ROF IV, ROF V, Remington Account, ROF VI, REDF and related separate accounts. Excludes $2.5 billion of investments made by the Legacy CMBS Fund, ROF IV, ROF V and Remington Account.

| 4 Oaktree’s Real Estate Track Record

OAKTREE REAL ESTATE OPPORTUNITIES FUND VII, L.P. Confidential
17
hyper-liquidity global financial crisis recovery
2006 2007 2008 2009 2010 2011 2012 2013 2014 2015
4,000
3,000
2,000
1,000
0
1,000
2,000
3,000
$4,000
Purchased Sold
Disciplined Approach Over Last Nine Years
As of June 30, 2015 1 Includes purchase and sale activity for the following funds: ROF A, ROF B, ROF II, ROF III/IIIA, ROF IV, Remington Account, ROF V, ROF VI, AROF, Legacy CMBS Fund, REDF and all related separate accounts. 2 Includes transactions that the Real Estate team led for other Oaktree-managed funds and co-investment vehicles. 3 Capital deployed includes $12.1 billion of equity deployed in Real Estate team-led transactions across all Oaktree-managed funds and $2.1 billion of investments for Legacy CMBS Fund, of which $1.1 billion was
cross-collateralized fund-level leverage. Realizations include $7.9 billion of asset sales and an additional $3.9 billion of refinancing/securitization proceeds.
Oaktree’s Real Estate team has led the deployment of $14.2 billion of capital and the realization of $11.8 billion since the Global Financial Crisis3
Purc
hase
s Sa
les,
Liq
uida
tions
, R
esol
utio
ns, S
ecur
itiza
tions
an
d R
efin
anci
ngs
Real Estate Funds¹ Real Estate Funds¹ Co-Invested Capital² Co-Invested Capital²
($ in millions)

OAKTREE REAL ESTATE OPPORTUNITIES FUND VII, L.P. Confidential
18
12.1%
18.6%
11.5% 13.6% 14.2%
16.8%
0
4.0
8.0
12.0
16.0
20.0%
SCF VI - ROF III/IIIA³ Legacy CMBS Fund⁴ ROF IV Remington⁵ ROF V ROF VI
As of June 30, 2015 See “Performance Disclosures” section of the Appendix for performance related information and disclosures 1 Net Fund-Level figures are after management fees, expenses and actual or potential incentive allocation and reflect the returns/multiples of the unaffiliated limited partners. 2 Represents all funds that have realized 90% or more of investments. See footnote 7 below. 3 Consists of a roll-up of all net fund-level cash flows for the following funds: SCF VI, ROF A, ROF B, ROF II, ROF III/IIIA. See “Oaktree’s Real Estate Track Record” portion of the Appendix for full track
record. 4 Due to the structure of the Legacy CMBS Fund, the fund-level returns presented in this table are for a feeder fund and not for the Legacy CMBS Fund itself. 5 The Remington Account is a separate standalone account managed by Oaktree’s Real Estate team. 6 Fund-Level Multiple of Capital is calculated as (NAV + Distributions) divided by Contributed Capital. 7 Represents total realized proceeds as a percentage of the total fair market value of the fund. Total realized proceeds excludes any proceeds for financing obtained after the initial investment.
seasoning
net fund-level irr1
substantially realized2
Established Track Record
investing
Commencement of Operations 1994-2003 2010 2008
2010 2011 2012
Committed Capital ($mm) $2,266 $2,322 $450 $256 $1,283 $2,677 Net Fund-Level Multiple of Capital6 1.7x 1.3x 1.7x 1.6x 1.5x 1.3x % Realized7 99.0% 100.0% 78.8% 64.6% 52.7% 13.9% % Distributed 171.4% 132.1% 114.2% 95.4% 63.9% 0.2%
OAKTREE REAL ESTATE OPPORTUNITIES FUND VII, L.P. Confidential
19
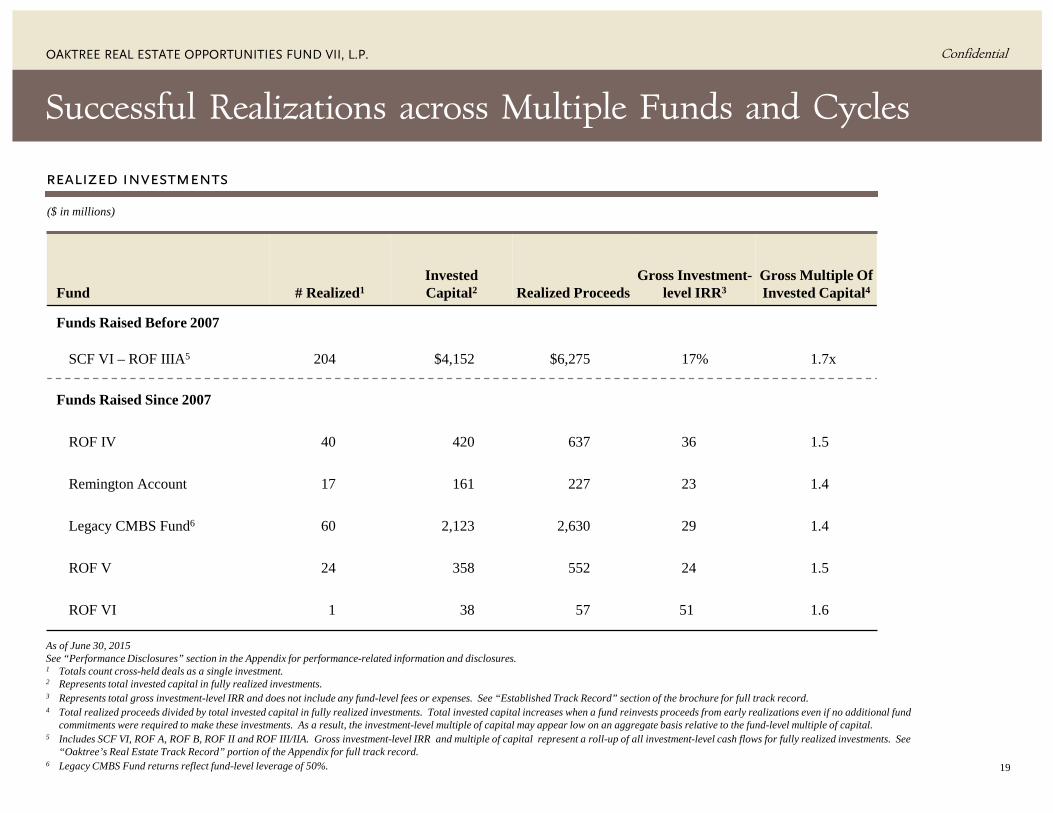
Successful Realizations across Multiple Funds and Cycles
realized investments
Fund # Realized1 Invested Capital2 Realized Proceeds
Gross Investment-level IRR3
Gross Multiple Of Invested Capital4
Funds Raised Before 2007
SCF VI – ROF IIIA5 204 $4,152 $6,275 17% 1.7x
Funds Raised Since 2007
ROF IV 40 420 637 36 1.5
Remington Account 17 161 227 23 1.4
Legacy CMBS Fund6 60 2,123 2,630 29 1.4
ROF V 24 358 552 24 1.5
ROF VI 1 38 57 51 1.6
($ in millions)
As of June 30, 2015 See “Performance Disclosures” section in the Appendix for performance-related information and disclosures. 1 Totals count cross-held deals as a single investment. 2 Represents total invested capital in fully realized investments. 3 Represents total gross investment-level IRR and does not include any fund-level fees or expenses. See “Established Track Record” section of the brochure for full track record. 4 Total realized proceeds divided by total invested capital in fully realized investments. Total invested capital increases when a fund reinvests proceeds from early realizations even if no additional fund
commitments were required to make these investments. As a result, the investment-level multiple of capital may appear low on an aggregate basis relative to the fund-level multiple of capital. 5 Includes SCF VI, ROF A, ROF B, ROF II and ROF III/IIA. Gross investment-level IRR and multiple of capital represent a roll-up of all investment-level cash flows for fully realized investments. See
“Oaktree’s Real Estate Track Record” portion of the Appendix for full track record. 6 Legacy CMBS Fund returns reflect fund-level leverage of 50%.

5 | Investment Environment

OAKTREE REAL ESTATE OPPORTUNITIES FUND VII, L.P. Confidential
21
2005–07 hyper-liquidity
2008–10 global financial crisis
2011–present recovery
market’s strategy Purchase at peak levels Work out bad assets and survive Buy core real estate
oaktree’s strategy Sell at peak levels Buy public securities at market trough
Buy private, over-leveraged assets at deep discounts
90
110
130
150
170
190
210
230
250
270
S&P Case Shiller 20-City Home Price Index Major Commercial Real Estate Markets¹Non-Major Commercial Real Estate Markets S&P Case Shiller Peak Value
Capitalizing on Opportunities through Cycles
As of May 31, 2015 Source: RCA and Moody’s Investors Service, LPS, Morgan Stanley, S&P Case-Shiller 1 Major Markets are the six gateway metropolitan areas: Boston, Chicago, Los Angeles, New York, San Francisco and Washington, D.C.
(Indexed to 100)
Significant value gap between major and non-
major markets
Still below peak value
Target Pricing
2001 2002 2003 2004 2005 2006 2007 2008 2009 2010 2011 2012 2013 2014 2015

OAKTREE REAL ESTATE OPPORTUNITIES FUND VII, L.P. Confidential
22
Jacksonville 27%
Milwaukee -7%
Nashville 43%
Population Growth Characteristics of Top 50 U.S. Markets
u.s. aggregate population growth (2000 to 2013) and invested capital in commercial investments
10.0 – 20.0
5.0 – 10.0
2.5 – 5.0
1.0 – 2.5
Population Size in Millions
Los Angeles/ Orange County
6%
New York 9%
Chicago 5%
Houston 35%
Dallas 30%
Philadelphia -2%
Washington D.C. 24%
Orlando 38%
Miami/Ft. Lauderdale 16%
Atlanta 30% Raleigh
52%
high growth
Tampa 20%
Charlotte 56%
Boston 7%
Seattle 19%
Salt Lake City 18% Denver
24%
San Jose 11%
San Francisco 10%
Las Vegas 47%
Phoenix 35%
Sacramento 23%
Portland 2%
Riverside/ San Bernardino
35%
San Diego 14%
Kansas City 12%
Cincinnati 6%
negative growth
Minneapolis 17%
St. Louis 8%
Indianapolis 22%
Detroit -21%
Cleveland -30%
Columbus 28%
Buffalo -3%
Baltimore 9%
Austin 51%
San Antonio 43%
New Orleans -7%
Birmingham 24%
Memphis 18%%
Pittsburgh 0%
Richmond, 25%
Louisville 23%
Providence 35%
Hartford 3%
Oklahoma City 22%
Virginia Beach 9%
high growth/ energy risk
high growth
*$853m (30% of total) 26% population growth
variable growth
37 Historically Active Oaktree Markets Major Markets Non-Major Markets
*$155m (5% of total) -3% population growth
*$1,340m (47% of total) 18% population growth
*$78m (3% of total) 35% population growth
*$298m (10% of total) 8% population growth
As of June 30, 2015. Source: U.S. Census Bureau * Map presents the aggregate gross invested capital and percentages for all commercial real estate investments made in the United States in ROF IV, ROF V, Remington Account, and ROF VI. Excludes approximately
$112 million of Hawaiian hotel investments (4% of total) and $29 million of other investments (1% of total). Percentage population growth reflects weighted average population growth of cities.

OAKTREE REAL ESTATE OPPORTUNITIES FUND VII, L.P. Confidential
23
Opportunity Drivers – Commercial
Over-leveraged and under-capitalized properties create a vicious cycle of value destruction
zombie real estate commercial real estate debt maturities
As of March 31, 2015 Source: Trepp
Property value less than debt amount
No incentive to invest additional capital
Inability to lease space at market
rents and offer tenant improvements
Loss of existing and prospective tenants
Decline in property value
1
2
3 4
5
3
($ in billions)
0
100
200
300
$400
2015 2016 2017 2018 2019
Other CRE CMBS
$1.4 trillion of debt maturities through 2018
Asset underperformance and substantial debt maturities produce significant opportunities

OAKTREE REAL ESTATE OPPORTUNITIES FUND VII, L.P. Confidential
24
State of the Market – Opportunity Drivers in Europe
opportunity set by country
As of June 30, 2015
Spain
France
UK
Ireland
Germany Poland
Denmark
Italy
Czech Republic
Belgium
Netherlands
Attractive Opportunities Select Opportunities Limited Opportunities
• United Kingdom: significant increase in the volume of impaired loans being sold by banks and institutions, creating opportunities for those positioned to acquire NPL portfolios, recapitalize borrowers and acquire sound assets that have suffered from underinvestment
• Germany: stable economy; steady flow of legacy loan book sales, particularly by foreign lenders; opportunities to recapitalize over-levered borrowers, acquire secondary assets and fund CAPEX repositionings
• Southern Europe: uncertain economic outlook, albeit positive trends; significant amount of impaired real estate loans only beginning to hit market; large number of foreign closed-end funds who need to liquidate; limited financing availability constraining most buyers; low but improving levels of liquidity
• Nordics: healthy economies; abundant pools of domestic capital; some opportunities to acquire legacy loan portfolios and neglected zombie real estate
• France & Benelux: uncertain economic outlook; arduous laws for foreign investors seeking to acquire loans or local real estate
• Central Europe: stable and growing economies; more limited opportunities to buy legacy loans or recap foreign borrowers who came in at the top of the market
Portugal
Norway Sweden
Finland
Switzerland

OAKTREE REAL ESTATE OPPORTUNITIES FUND VII, L.P. Confidential
25
State of the Market – Opportunity Drivers in Asia
asia: opportunity set by country
Attractive Opportunities Select Opportunities Limited Opportunities
India
Australia
China
Southeast Asia
Japan Korea
• Real GDP growth, growing consumer demand and stable unemployment rates point to economic resilience in the region. While still export-dependent, Asia remains a long-term growth story with pockets and intervals of dislocation
• China: increasing reliance on shadow banking suggests the real estate industry could be vulnerable to liquidity shocks
• Japan: re-inflationary policies of “Abenomics” produced positive short-term benefits, including a strengthening real estate market in Tokyo. Japan still needs to deliver structural reforms to sustain long-term growth
• Korea: export dependence remains a key issue; softness in domestic construction sector may lead a wave of second-tier multi-nationals to restructure
• Southeast Asia and India: undeveloped markets and legal systems and lack of transparency translates to unattractive risk/reward profile
• Australia: too much capital, too competitive
As of June 30, 2015

OAKTREE REAL ESTATE OPPORTUNITIES FUND VII, L.P. Confidential
26
Opportunity Drivers – Residential
Housing starts remain near 70-year lows, despite significant population growth and historically low interest rates
(in thousands)
u.s. housing starts
As of July 31, 2015 Source: U.S. Census Bureau
0
2
4
6
8
10
12
14
0
500
1,000
1,500
2,000
2,500
1940 1950 1960 1970 1980 1990 2000 2010
Housing Starts Starts per Million Population
U.S. Population (in millions)
131.7 150.7 179.3 203.2 226.5 248.7 281.4 308.7

OAKTREE REAL ESTATE OPPORTUNITIES FUND VII, L.P. Confidential
27
Opportunity Drivers – Residential
(%)
home price decline and recovery vary by market distressed mortgage loan inventory2
As of June 30, 2015 Source: Corelogic, LPS, Morgan Stanley 1 Peak occurred in 2006 for each market represented. The year in which states hit their trough varied, with Arizona and Florida in 2011, California, Georgia and New Jersey in 2012, and Illinois in 2013. 2 Represents the total number of U.S. homes in different states of delinquency foreclosure or REO.
0
10
20
30
40
50
60%
0
1
2
3
4
5
6
7
8
9
10
Jun-
05
Jun-
06
Jun-
07
Jun-
08
Jun-
09
Jun-
10
Jun-
11
Jun-
12
Jun-
13
Jun-
14
Jun-
15
% Severely D
elinquent
# of
Del
inqu
ent R
esid
entia
l Mor
tgag
es
(in m
illio
ns)
Residential Mortgage Delinquencies % Delinquent >12 months
(60)
(50)
(40)
(30)
(20)
(10)
0%
Arizona California Florida Georgia Illinois New Jersey
Peak to Current Peak to Trough
Cha
nges
in H
ome
Pric
es S
ince
200
51

OAKTREE REAL ESTATE OPPORTUNITIES FUND VII, L.P. Confidential
28
Opportunity Drivers – Commercial NPLs
While outstanding NPLs are decreasing, potential supply is still significant
($ in billions)
banks’ activity with npls1
0
1
2
3
4
5
6
7
8
9
$10
0
50
100
150
200
$250
Q1 Q2 Q3 Q4 Q1 Q2 Q3 Q4 Q1 Q2 Q3 Q4 Q1 Q2 Q3 Q4 Q1 Q2 Q3 Q4 Q1 Q2 Q3 Q4 Q1 Q2 Q3
Held for Sale Sales
Am
ount of NPL
s Sold A
mou
nt o
f NPL
s Hel
d fo
r Sa
le
As of September 30, 2014 Source: SNL Financial 1 All nonaccrual asset figures displayed may include assets guaranteed by the U.S. government. Limited to top-tier consolidated bank holding companies and thrift holding companies, based on data reported in
Federal Reserve Y-9C bank regulatory filings. Does not include savings institutions.
held for sale: $102bn 3q sales: $3bn
2010 2008 2009 2011 2012 2013 2014 YTD

(This page has been left blank intentionally.)

6 | Summary Term Sheet
OAKTREE REAL ESTATE OPPORTUNITIES FUND VII, L.P. Confidential
30
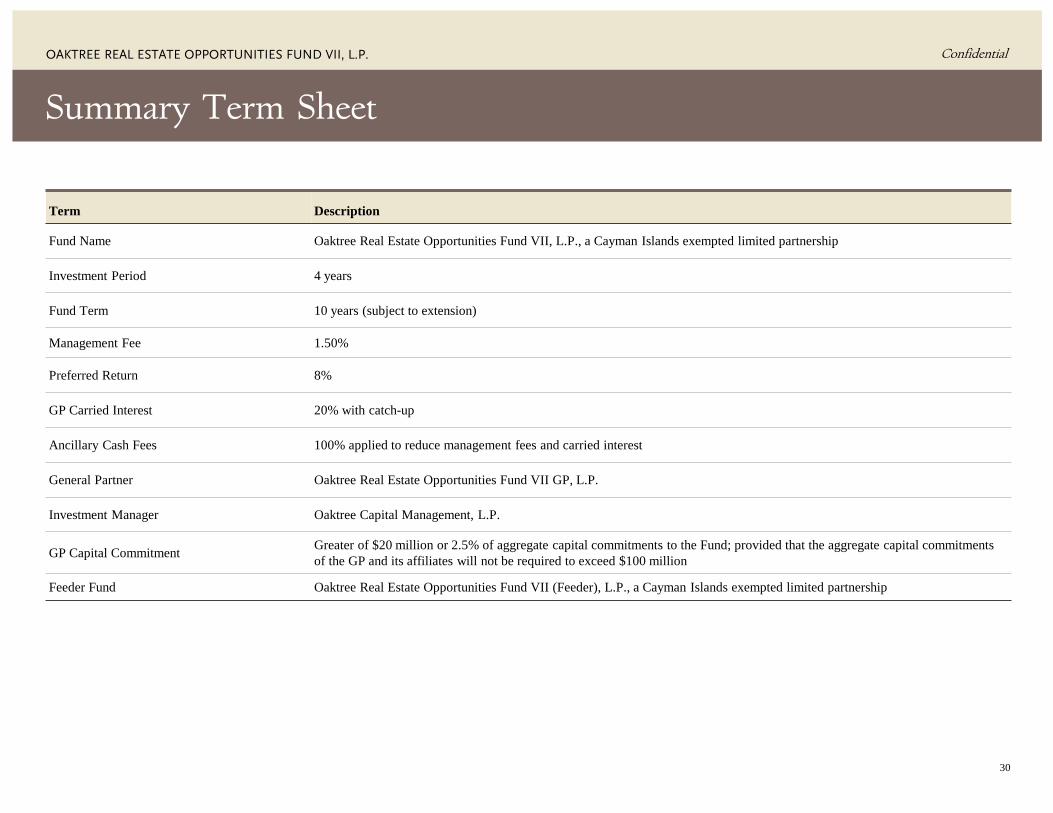
Summary Term Sheet
Term Description
Fund Name Oaktree Real Estate Opportunities Fund VII, L.P., a Cayman Islands exempted limited partnership
Investment Period 4 years
Fund Term 10 years (subject to extension)
Management Fee 1.50%
Preferred Return 8%
GP Carried Interest 20% with catch-up
Ancillary Cash Fees 100% applied to reduce management fees and carried interest
General Partner Oaktree Real Estate Opportunities Fund VII GP, L.P.
Investment Manager Oaktree Capital Management, L.P.
GP Capital Commitment Greater of $20 million or 2.5% of aggregate capital commitments to the Fund; provided that the aggregate capital commitments of the GP and its affiliates will not be required to exceed $100 million
Feeder Fund Oaktree Real Estate Opportunities Fund VII (Feeder), L.P., a Cayman Islands exempted limited partnership

Appendices

(This page has been left blank intentionally.)

OAKTREE REAL ESTATE OPPORTUNITIES FUND VII, L.P. Confidential
32
Appendix I: Real Estate Team Organization Chart
As of August 31, 2015
additional resources
sabal financial184 professionals
bellwether asset management
18 professionals
oaktree legal16 attorneys
oaktree trading4 professionals
oaktree distressed debt36 professionals
John BradyManaging Director and Portfolio Manager
John LeeAssociate
Mark SeagerAssociate
asia
Toshi KurodaManaging Director
Hideya TakahashiSenior Vice President
Steve ChoiManaging Director
Andrew LeeSenior Vice President
Rachel Park, CPASenior Vice President
Andie ShinAssociate
Yi Zhang, CFASenior Vice President
europe
london
u.s.
Jason KellerManaging Director
Taejo KimSenior Vice President
Cary KleinmanManaging Director
Samuel AverbachVice President
Ryan DelaneyHead of Asset Mgmt.Senior Vice President
Andrew LoebAsset Management
Vice President
Warren MinVice President
hong kong
Jenny LiVice President
Nick BruceAssociate
Alexander MackenzieVice President
Pablo Granell PerisAssociate
Beau BarronVice President
Heecheol PakAssociate
Don KimAssociate
Brad WeinbergAsset Management
Vice President
Justin ManalotoAssociate
Jared LazarusSenior Vice President
Derek SmithManaging Director
Bryan Sather, CFAAsset Management
Vice President
David BuckAssociate
Ambrose FisherManaging Director
Justin GuichardManaging Director
Mark JacobsManaging Director
los angeles new york
Benjamin BianchiManaging Director
David SnelgroveManaging Director
tokyo seoul
Freda DuanAssociate
Keith Gollenberg, CFAManaging Director
Todd LikerManaging Director
Raymond GongSenior Vice President
Amy JohannesSenior Vice President
Jimmy ZhanVice President
Vikas DesaiAssociate
Diana FedorovaAssociate
Bianca TomkoriaAssociate
Mark HulbertSenior Vice President
Jeffrey ChalmersVice President
Anindya DuttaAssociate
Callum ThorneycroftAsset Management
Vice President
Manish DesaiManaging Director
portfolio specialist
Bill LoskotaAssistant Vice President

OAKTREE REAL ESTATE OPPORTUNITIES FUND VII, L.P. Confidential
33
Appendix I: Senior Real Estate Team U.S. Regional Expertise
Name, Title, Years of Experience Region
Ben Bianchi Managing Director 16 years
Ambrose Fisher Managing Director 24 years
Keith Gollenberg Managing Director 33 years
Mark Jacobs Managing Director 21 years
Todd Liker Managing Director 19 years
Raymond Gong Senior Vice President 9 years
Amy Johannes Senior Vice President 12 years
Taejo Kim Senior Vice President 12 years
Jared Lazarus Senior Vice President 10 years
Pacific Northwest Midwest Northeast Mid-Atlantic
Southeast Texas Southwest California & Hawaii
As of August 3, 2015

OAKTREE REAL ESTATE OPPORTUNITIES FUND VII, L.P. Confidential
34
hyper-liquidity
global financial crisis
recovery
2006 2007 2008 2009 2010 2011 2012 2013 2014 2015
Appendix II: Evolution of Six Areas of Focus (Commercial)
(1,000)
(800)
(600)
(400)
(200)
0
200
400
600
800
1,000
$1,200
($ in millions)
Liq
uida
tions
and
R
efin
anci
ngs
Purc
hase
s
Opportunistic Private Market Frozen
Rescue Capital
Distress for Control
Aggressive Seller
sample deal: bascom platform • Investment date: June 24, 2014 • ROF VI investment: $77 million
investment profile • A joint venture with The Bascom Group to acquire distressed and
mismanaged properties that are underperforming their respective submarkets due to a lack of recent renovations, deferred maintenance issues, distressed ownership or poor management
• The portfolio consists of seven properties totaling 2,500 apartments throughout the United States in markets such as Corona, California; Henderson, Nevada; Tallahassee, Florida; Glendale, Arizona; and Atlanta, Georgia
investment thesis • The total purchase price of $194.0 million represents an average discount
from replacement cost of 30% • Through active asset management and injecting new capital to fund
renovations, the portfolio’s net operating income is trending higher than our budget, with all properties performing at or above our business plan
• Bascom is a very reputable Orange County-based real estate investment firm that invests exclusively in value-add multifamily properties, having acquired approximately 240 multifamily projects totaling over 65,000 units and nearly $9 billion in transaction value since its founding in 1996
As of June 30, 2015 Note: Reflects purchase and liquidation/refinancing activity for vehicles in the Real Estate Opportunities, Real Estate Debt and Distressed Debt strategies, as well as other certain Oaktree-managed funds and
accounts. Capital deployed includes $3.4 billion of equity for investments in Real Estate team-led transactions across all Oaktree-managed funds. Realizations include $1.9 billion of liquidations and an additional $771 million of refinancing proceeds.
This investment highlight represents the largest investment within the Commercial area of focus within the Oaktree Real Estate Opportunities Fund VI, L.P. See “Legal Information and Marketing Disclosures” section of the Appendix for important information regarding case studies.

OAKTREE REAL ESTATE OPPORTUNITIES FUND VII, L.P. Confidential
35
hyper-liquidity
global financial crisis
recovery
2006 2007 2008 2009 2010 2011 2012 2013 2014 2015
sample deal: anglesea platform
• Investment date: April 29, 2014 • ROF VI investment: $143 million
investment profile
• Programmatic joint venture with Anglesea Capital to acquire larger industrial assets across the United Kingdom
• Through June 2014, the platform has made two purchases, acquiring a total of 2.1 million square feet of properties comprised of a logistics warehouse and an office building in Cowley, an industrial suburb of Oxford, and four warehouse buildings in Branston, 25 miles northeast of Birmingham
• In July the platform completed a $3571 million follow-on investment consisting of 14 industrial warehouses, comprising 3.7 million square feet, and a 112,000 square foot office building located in key logistics markets
investment thesis
• Due to an extended exclusivity period, Cowley’s purchase price reflects pricing from six months prior to closing in April 2014, and there has been material yield compression in the UK logistics market over the same period
• Cowley and Branston have strong going-in cash-on-cash returns of 26% and 27%, respectively
• The UK large-scale logistics market is currently benefiting from very strong supply-demand fundamentals; of the 16 logistics assets in the UK that have over 750,000 square feet, none were vacant at the time of our purchase
Appendix II: Evolution of Six Areas of Focus (Non-U.S.)
(800)
(600)
(400)
(200)
0
200
400
600
800
$1,000
($ in millions)
Liq
uida
tions
and
R
efin
anci
ngs
Purc
hase
s
United Kingdom
Korea
Japan
As of June 30, 2015 Note: Reflects purchase and liquidation/refinancing activity for vehicles in the Real Estate Opportunities, Real Estate Debt and Distressed Debt strategies, as well as other certain Oaktree-managed funds and accounts. Capital deployed includes $2.1 billion of equity for investments in Real Estate team-led transactions across all Oaktree-managed funds. Realizations include $1.7 billion of liquidations and an additional $386 million of refinancing proceeds. This investment highlight represents the largest investment within the Non-U.S. area of expertise within the Oaktree Real Estate Opportunities Fund VI, L.P. See “Legal Information and Marketing
Disclosures” section of the Appendix for important information regarding case studies. 1 Represents the Fund’s gross purchase price prior to financing.

OAKTREE REAL ESTATE OPPORTUNITIES FUND VII, L.P. Confidential
36
hyper-liquidity
global financial crisis
recovery
2006 2007 2008 2009 2010 2011 2012 2013 2014 2015
sample deal: genesis lending platform
• Investment date: January 13, 2014 • ROF VI investment: $55 million ($125 million commitment) • Total Oaktree investment: $111 million ($250 million commitment)
investment profile
• Oaktree funds partnered with Genesis Capital Partners to grow a residential-lending platform that originates short-term loans to well established real estate investors in the distressed single-family residential marketplace
• Genesis seeks to make six- to nine-month, first lien loans to investors acquiring homes for purposes of refurbishment and short-term resale
investment thesis
• Benefits from conservative loan-to value ratios (60% to 75%), high annual interest rates ranging from 10% to 13%, and cross-collateralization with full recourse personal guaranties from borrowers
• Closed on an attractive credit facility with Wells Fargo
Appendix II: Evolution of Six Areas of Focus (Residential)
(750)
(500)
(250)
0
250
500
750
1,000
1,250
1,500
$1,750
($ in millions)
Sale
, Res
olut
ion
and
Secu
ritiz
atio
n Pu
rcha
ses
Homebuilder Joint Ventures
Land Re- entitlements Master Planned Communities
Residential Resort
Communities
Residential NPLs
As of June 30, 2015 Note: Reflects purchase and sales/resolution/securitization activity for vehicles in the Real Estate Opportunities, Real Estate Debt and Distressed Debt strategies, as well as other certain Oaktree-managed
funds and accounts. Capital deployed includes $3.4 billion of equity for investments in Real Estate team-led transactions across all Oaktree-managed funds. Realizations include $740 million of sales and resolutions and an additional $1.7 billion of securitization proceeds.
This investment highlight represents the largest investment within the Residential area of expertise within the Oaktree Real Estate Opportunities Fund VI, L.P. See “Legal Information and Marketing Disclosures” section of the Appendix for important information regarding case studies.

OAKTREE REAL ESTATE OPPORTUNITIES FUND VII, L.P. Confidential
37
hyper-liquidity
global financial crisis
recovery
2006 2007 2008 2009 2010 2011 2012 2013 2014 2015
sample deal: regional bank commercial npl pool
• Investment date: December 20, 2013 • ROF VI investment: $23 million • Total Oaktree investment: $33 million
investment profile
• Off-market transaction with a Florida-based bank looking to exit a loss-share agreement with the FDIC
• Oaktree funds purchased $359 million in UPB of NPLs and deficiency judgments – NPLs: $177 million in UPB consisting of 121 mortgage
loans – Deficiency judgments: $182 million in UPB consisting of
270 deficiency judgments
investment thesis
• Attractive purchase price of 54% of UPB and 2% for deficiency judgments; Purchased at 37% of peak value
• Diverse underlying collateral in Southeast • Affiliate-controlled servicing and asset management through
Sabal Financial Group1
(600)
(400)
(200)
0
200
400
600
$800
Appendix II: Evolution of Six Areas of Focus (Commercial NPLs)
As of June 30, 2015 Note: Reflects purchase and resolution/securitization activity for vehicles in the Real Estate Opportunities, Real Estate Debt and Distressed Debt strategies, as well as other certain Oaktree-managed funds
and accounts. Capital deployed includes $1.4 billion of equity for investments in Real Estate team-led transactions across all Oaktree-managed funds. Realizations include $595 million of resolutions and an additional $571 million of securitization proceeds.
This investment highlight represents the largest investment within the Commercial NPLs area of expertise within the Oaktree Real Estate Opportunities Fund VI, L.P. See “Legal Information and Marketing Disclosures” section of the Appendix for important information regarding case studies.
1 Sabal currently provides services to real estate and other Oaktree funds. Oaktree owns a 50% interest in Sabal, but does not profit from any amounts paid by our funds to Sabal.
($ in millions)
Res
olut
ion
and
Se
curi
tizat
ion
Purc
hase
s
Proprietary Portfolios
FDIC Portfolios
Distressed Private Bank Portfolios
Special Servicers’ Loan Portfolios

OAKTREE REAL ESTATE OPPORTUNITIES FUND VII, L.P. Confidential
38
hyper-liquidity
global financial crisis
recovery
2006 2007 2008 2009 2010 2011 2012 2013 2014 2015
sample deal: store (round 2) • Investment date: March 15, 2013 • ROF VI: $100 million • Total Oaktree Investment: $580 million
investment profile • In 2011, Oaktree funds and partners established a new single-
tenant operational real estate platform with a highly experience management team
• The platform provides financing solutions to customers operating businesses on freestanding real estate that is integral to the generation of the customers’ P&L
• Over the last three-plus years, we have acquired $2.5 billion in assets through the platform at an average cap rate of 8.5%
• Through use of conservative leverage (<60%), portfolio has generated returns of almost 14%
investment thesis • Nearly all of the major competitors in the middle-market sale-
leaseback business have exited the market, leaving a lending gap for owners of operationally essential real estate
• High lease rates relative to financing costs may create very attractive leveraged current cash returns
• REIT structure provides potential for multiple exit options
Appendix II: Evolution of Six Areas of Focus (Corporate)
(1,000)
(500)
0
500
1,000
$1,500
($ in millions)
Sale
s an
d R
efin
anci
ng
Purc
hase
s
Cyclical Platform Investments
Real Estate Corporate Bonds
Real Estate Corporate Bank Debt
As of June 30, 2015 Note: Reflects purchase and sale/refinancing activity for vehicles in the Real Estate Opportunities, Real Estate Debt and Distressed Debt strategies, as well as other certain Oaktree-managed funds and
accounts. Capital deployed includes $2.5 billion of equity for investments in Real Estate team-led transactions across all Oaktree-managed funds. Realizations include $1.8 billion of sales and an additional $339 million of refinancing proceeds.
This investment highlight represents the most recent investment within the Corporate area of expertise across real estate funds. See “Legal Information and Marketing Disclosures” section of the Appendix for important information regarding case studies.

OAKTREE REAL ESTATE OPPORTUNITIES FUND VII, L.P. Confidential
39
hyper-liquidity
global financial crisis
recovery
2006 2007 2008 2009 2010 2011 2012 2013 2014 2015
(1,500)
(1,000)
(500)
0
500
1,000
$1,500
Appendix II: Evolution of Six Areas of Focus (Structured Finance)
As of June 30, 2015 Note: Reflects purchase and sale activity for vehicles in the Real Estate Opportunities, Real Estate Debt and Distressed Debt strategies, as well as other certain Oaktree-managed funds and accounts.
Structured Finance capital deployed includes $1.0 billion of equity for investments in Real Estate team-led transactions across all Oaktree-managed funds and $2.1 billion of investments for Legacy CMBS Fund, of which $1.1 billion was cross-collateralized fund-level leverage. Realizations include $3.1 billion of sales.
This investment highlight represents the most recent investment within the Structured Finance area of expertise across real estate funds, excluding Legacy CMBS Fund. See “Legal Information and Marketing Disclosures” section of the Appendix for important information regarding case studies.
($ in millions)
Sale
s Pu
rcha
ses
Liquidations
Distressed Floating-rate CMBS
Senior Fixed-rate CMBS
sample deal: kerzner cmbs
• Investment date: May 1, 2009 • ROF IV, ROF V and Remington investment: $143.6 million (face),
$99.8 million (cost)
investment profile
• $1.25 billion 2006 floating-rate securitized loan as part of a $3.4 billion financing package
• Diverse portfolio of lodging assets primarily in Paradise Island, The Bahamas
• The main asset (83% of allocated balance) is an iconic, irreplaceable 2,917 room ultra-luxury resort
investment thesis
• Off-market transaction with a major Wall Street broker/dealer • Attractive risk-adjusted returns with significant downside protection • Conservative cash flow and cap rate assumptions • Attractive basis that represents a 74% discount to peak valuation • Great upside potential if able to purchase loans/assets out of trust

OAKTREE REAL ESTATE OPPORTUNITIES FUND VII, L.P. Confidential
40
Appendix III: Asset Management Process
onboarding & setup
asset & portfolio management
exit & realization
• Review and approve budgets, business plans, leases and capital projects
• Collaborate with operating partners, brokers and servicers
• Lead hands-on, value-add asset management strategies proactively
• Highly involved in day-to-day and strategic decisions
• Analyze and report on investment and property-level performance on a monthly basis
• Track execution of business plans and market fundamentals
• Identify opportunities and risks
• Optimize capital structure
• Execute capital markets strategy
• Develop disposition strategy
• Complete sale in an effort to maximize returns
• Capitalize on extensive experience in distressed real estate loan restructuring, bankruptcy expertise and the workout of underperforming assets
• Standard onboarding templates
• Set up information flow between deal team, partners and internal resources
• Onboard debt positions to loan servicing software
• Data management processes
• Document management system
deal teams and asset management team work collaboratively with our partners to pro-actively add value to investments
cradle-to-grave asset and risk management

OAKTREE REAL ESTATE OPPORTUNITIES FUND VII, L.P. Confidential
41
Appendix III: Risk Management Analytics
monthly quarterly
portfolio level
Monthly Holdings Report • Top down portfolio overview • Portfolio-level stratifications • Fund-level holdings in detail • Fund-level concentrations • Asset Management tools Portfolio Performance Dashboard • Summary of asset performance
by property type • Key performance indicators
Quarterly Valuations Overview • Re-forecasted fund-level
valuations and return metrics Investment Performance Summary • One-page fund-level
performance update
asset level
Monthly Flash Report • Quantitative review of asset
performance • Qualitative review of investment
and partner performance • Status updates on asset
management initiatives • Key takeaways and
recommendations • Conclusion on Oaktree
performance rating
Quarterly Valuations • Re-forecasted asset-level
valuations and return metrics Investment Performance Summary • One-page asset-level
performance update

OAKTREE REAL ESTATE OPPORTUNITIES FUND VII, L.P. Confidential
42
Real Estate Investment Funds 1,2
Substantially Realized3 Seasoning Investing
SCF VI ROF A ROF B ROF II ROF
III/IIIA4 Legacy
CMBS Fund5 ROF IV Remington6 ROF V ROF VI7
Commencement of Operations
August 1994
February 1996
March 1997
December 1998
October 2002
February 2010
June 2008
February 2010
February 2011
September 2012
Committed Capital $505.5 $303.7 $285.5 $463.5 $707.3 $2,321.6 $450.4 $256.3 $1,283.0 $2,677.2
Paid-in Capital 505.5 303.7 285.5 440.3 $707.3 1,111.8 450.4 $256.3 1,283.0 2,409.5
Gross Investment-level Profit8 684.8 267.6 189.3 293.0 689.3 507.4 446.5 182.2 921.1 913.1
Gross Investment-level IRR 23.2% 11.8% 9.2% 17.3% 18.3% 29.0% 19.1% 18.6% 20.9% 26.3%
Gross Fund-level IRR 21.1% 10.5% 8.2% 15.2% 15.6% 24.7% 16.9% 15.8% 19.4% 25.1%
Gross Fund-level Multiple of Capital9 2.4x 1.9x 1.7x 1.7x 2.0x 1.4x 2.0x 1.7x 1.7x 1.4x
Net Fund-level IRR 17.4% 8.4% 7.1% 11.1% 11.6% 18.6% 11.5% 13.6% 14.2% 16.8%
Net Fund-level Multiple of Capital9 2.1x 1.7x 1.6x 1.5x 1.7x 1.3x 1.7x 1.6x 1.5x 1.3x
Distributed Capital as a Percentage of Paid-in Capital 208.1% 165.6% 160.4% 148.4% 166.3% 132.1% 114.2% 95.4% 63.9% 0.2%
($ in millions)
As of June 30, 2015 1 This table excludes performance results for trusts and separate accounts related to ROF A, ROF B, ROF II, ROF III/IIIA, ROF IV, ROF V, ROF VI; however, the returns for each associated entity are similar to the results
for the fund to which it is related. 2 Gross Fund-Level figures are before management fees, expenses and actual or potential incentive allocation and reflect the returns/multiples of the partnership. Net Fund-Level figures are after management fees,
expenses and actual or potential incentive allocation and reflect the returns/multiples of the unaffiliated limited partners. 3 Represents all funds that have realized 90% or more of investments. 4 ROF III and ROF IIIA commenced operations on October 1, 2002 and May 30, 2003, respectively. 5 The data contained herein reflects the effect of leverage employed by the Legacy CMBS Fund, which invested in commercial mortgage-backed securities using both debt and equity capital at approximately a 1:1 ratio.
Due to the structure of the Legacy CMBS Fund, the fund-level returns presented in this table are for a feeder fund and not for the Legacy CMBS Fund itself. 6 The Remington Account is a separate standalone account managed by Oaktree’s Real Estate team. 7 ROF VI figures include two parallel funds. 8 Gross Investment-Level Profit represents all realized and unrealized gains/(losses). 9 Fund-Level Multiple of Capital is calculated as (NAV + Distributions) divided by Paid-in Capital.
Appendix IV: Oaktree’s Real Estate Track Record

(This page has been left blank intentionally.)

OAKTREE REAL ESTATE OPPORTUNITIES FUND VII, L.P. Confidential
43
Appendix V: Performance Disclosures
The performance information contained herein is provided for informational purposes only. Oaktree makes no representation, and it should not be assumed, that past performance is an indication of future results. There can be no assurance that the Oaktree’s Real Estate Opportunities Fund VII, L.P. will be able to earn the rates of return indicated herein. Indeed, wherever there is the potential for profit, there is also the possibility of loss. In reviewing the performance information included herein, please note the following:
Investment Valuations
U.S. GAAP establishes a hierarchal disclosure framework, which prioritizes the inputs used in measuring financial instruments at fair value into three levels based on their market observability. Market price observability is affected by a number of factors, including the type of instrument and the characteristics specific to the instrument. Financial instruments with readily available quoted prices from an active market or for which fair value can be measured based on actively quoted prices generally will have a higher degree of market price observability and a lesser degree of judgment inherent in measuring fair value.
Financial assets and liabilities measured and reported at fair value are classified as follows: • Level I – Quoted unadjusted prices for identical instruments in active markets to which the applicable fund has access at the date of measurement. The types of investments in Level I include exchange-traded equities, debt
and derivatives with quoted prices. • Level II – Quoted prices for similar instruments in active markets; quoted prices for identical or similar instruments in markets that are not active; and model-derived valuations in which all significant inputs are directly or
indirectly observable. Level II inputs include interest rates, yield curves, volatilities, prepayment risks, loss severities, credit risks and default rates. The types of investments in Level II generally include corporate bonds and loans, government and agency securities, less liquid and restricted equity investments, over-the-counter traded derivatives and other investments where the fair value is based on observable inputs.
• Level III – Valuations for which one or more significant inputs are unobservable. These inputs reflect the applicable general partner’s assessment of the assumptions that market participants use to value the investment based on the best available information. Level III inputs include prices of quoted securities in markets for which there are few transactions, less public information exists or prices vary among brokered market makers. The types of investments in Level III include non-publicly traded equity, debt, real estate and derivatives.
In some instances, an instrument may fall into different levels of the fair value hierarchy. In such instances, the instrument’s level within the fair value hierarchy is based on the lowest of the three levels (with Level III being the lowest) that is significant to the value measurement. The assessment of the significance of an input requires judgment and considers factors specific to the instrument. The transfer of assets into or out of each fair value hierarchy level is accounted for as of the beginning of the reporting period.
In the absence of observable market prices, the applicable general partner values Level III investments using valuation methodologies applied on a consistent basis. The quarterly valuation process for Level III investments begins with each portfolio company, property or security being initially valued by the investment or valuation teams. The valuations are then reviewed and approved by the valuation team and the valuation committee of each investment strategy, which consists of senior members of the investment team. All Level III investment values are ultimately approved by the valuation committees and designated investment professionals as well as the valuation officer who is independent of the investment teams and reports directly to Oaktree’s Managing Principal. Results of the valuation process are evaluated each quarter, including an assessment of whether the underlying calculations should be adjusted or recalibrated. In connection with this process, the applicable general partner evaluates changes in fair value measurements from period to period for reasonableness, considering items such as industry trends, general economic and market conditions, and factors specific to the investment.
Certain Level III assets are valued using prices obtained from brokers or pricing vendors. The applicable general partner obtains an average of one to two broker quotes. The applicable general partner seeks to obtain at least one price directly from a broker making a market for the asset and one price from a pricing vendor for the subject or similar securities. These investments are classified as Level III because the quoted prices may be indicative in nature for securities that are in an inactive market, may be for similar securities, or may require adjustment for investment-specific factors or restrictions. Generally, the applicable general partner does not adjust any of the prices received from these sources, and all prices are reviewed by the applicable general partner. The applicable general partner evaluates the prices obtained from brokers or pricing vendors based on available market information, including trading activity of the subject or similar securities, or by performing a comparable security analysis to ensure that fair values are reasonably estimated. The applicable general partner also performs back-testing of valuation information obtained from brokers and pricing vendors against actual prices received in transactions. In addition to on-going monitoring and back-testing, the applicable general partner performs due diligence procedures over pricing vendors to understand their methodology and controls to support their use in the valuation process.
Non-publicly traded debt and equity securities and other securities or instruments for which reliable market quotations are not available, are valued by the applicable general partner using valuation methodologies applied on a consistent basis. These securities may initially be valued at the acquisition price as the best indicator of fair value. The applicable general partner reviews the significant unobservable inputs, valuations of comparable investments and other similar transactions for investments valued at acquisition price to determine whether another valuation methodology should be utilized. Subsequent valuations will depend on facts and circumstances known as of the valuation date and the application of valuation methodologies further described below under “Non-Publicly Traded Equity Investments” and “Non-Publicly Traded Real Estate Investments.” The fair value may also be based on a pending transaction expected to close after the valuation date. These valuation methodologies involve a significant degree of management judgment. Accordingly, valuations do not necessarily represent the amounts which may eventually be realized from sales or other dispositions of investments. Fair values may differ from the values that would have been used had a ready market for the investment existed, and the differences could be material to the applicable fund’s financial statements.

OAKTREE REAL ESTATE OPPORTUNITIES FUND VII, L.P. Confidential
44
Appendix V: Performance Disclosures (continued)
Exchange-Traded Investments
Securities listed on one or more national securities exchanges are valued at their last reported sales price on the date of valuation. If no sale occurred on the valuation date, the security is valued at the mean of the last “bid” and “ask” prices on the valuation date. Securities that are not marketable due to legal restrictions that may limit or restrict transferability are generally valued at a discount from quoted market prices. The discount would reflect the amount market participants would require due to the risk relating to the inability to access a public market for the security for the specified period and would vary depending on the nature and duration of the restriction and the risk and volatility of the underlying securities. Securities with longer duration restrictions or higher volatility are generally valued at a higher discount. Such discounts are generally estimated based on put option models or analysis of market studies. Instances where discounts have been applied to quoted prices of restricted listed securities have been infrequent. The impact of such discounts is not material to the applicable fund’s financial statements.
Credit-Oriented Investments (including Real Estate Loan Portfolios)
Investments in corporate and government debt which are not listed or admitted to trading on any securities exchange are valued at the mean of the last bid and ask prices on the valuation date based on quotations supplied by recognized quotation services or by reputable broker-dealers.
The market yield approach is considered in the valuation of non-publicly traded debt investments, utilizing expected future cash flows, discounted using estimated current market rates. Discounted cash flow calculations may be adjusted to reflect current market conditions and/or the perceived credit risk of the borrowers. Consideration is also given to a borrower’s ability to meet principal and interest obligations; this may include an evaluation of collateral or the underlying value of the borrower utilizing techniques described below under “Non-Publicly Traded Equity Investments” and “Non-Publicly Traded Real Estate Investments.”
The valuation of securities may be impacted by expectations of investors’ receptiveness to a public offering of the securities, the size of the holding of the securities and any associated control, information with respect to transactions or offers for the securities (including the transaction pursuant to which the investment was made and the period of time elapsed from the date of the investment to the valuation date) and applicable restrictions on the transferability of the securities.
Non-Publicly Traded Equity Investments
The fair values of private equity investments are determined by using a market approach or income approach. A market approach utilizes valuations of comparable public companies or transactions and generally seeks to establish the enterprise value of the portfolio company using a market multiple approach. This approach takes into account a specific financial measure (such as EBITDA, adjusted EBITDA, free cash flow, net operating income, net income, book value or net asset value) believed to be most relevant for the given company. Consideration may also be given to such factors as acquisition price of the security, historical and projected operational and financial results for the portfolio company, the strengths and weaknesses of the portfolio company relative to its comparable companies, industry trends, general economic and market conditions and other factors deemed relevant. The income approach is typically a discounted cash flow method that incorporates expected timing and level of cash flows. It incorporates assumptions in determining growth rates, income and expense projections, discount rates, capital structure, terminal values and other factors. The applicability and weight assigned to market and income approaches are determined based on the availability of reliable projections and comparable companies and transactions.
Non-Publicly Traded Real Estate Investments
The fair values of real estate investments are determined by using a cost approach, market approach or income approach. A cost approach is based upon the current cost of reproducing a real estate investment less deterioration and functional and economic obsolescence. A market approach utilizes valuations of comparable properties or transactions and generally seeks to establish the enterprise value of investment property using a market multiple approach. This approach takes into account a specific financial measure (such as free cash flow, net operating income, net income, book value, net asset value, EBITDA or adjusted EBITDA) believed to be most relevant for the given investment property. Consideration may also be given to such factors as acquisition price of investment property, historical and projected operational and financial results for the property, the strengths and weaknesses of the investment property relative to comparable properties, industry trends, geographical factors, general economic and market conditions and other factors deemed relevant. The income approach is typically a discounted cash flow method that incorporates expected timing and level of cash flows. It incorporates assumptions in determining growth rates, income and expense projections, discount and capitalization rates, capital structure, and other factors. The applicability and weight assigned to market and income approaches are determined based on the availability of reliable projections and comparable properties and transactions.
Valuation of Unrealized Investments
The performance information set forth herein contains valuations of investments in companies that have not been fully realized as of September 30, 2014. There can be no assurance that any of these valuations will be attained as actual realized returns will depend upon, among other factors, future operating results, the value of the assets and market conditions at the time of disposition, any related transaction costs and the timing and manner of sale, all of which may differ from the assumptions upon which the valuations contained herein are based. Consequently, the actual realized returns may differ materially from the current returns indicated in this brochure. Nothing contained herein should be deemed to be a prediction or projection of future performance.

OAKTREE REAL ESTATE OPPORTUNITIES FUND VII, L.P. Confidential
45
Appendix V: Performance Disclosures (continued)
Internal Rate of Return
The internal rates of return (“IRR”) are the annualized implied discount rate calculated from a series of investment cash flows. It is the return that equates the present value of all capital invested in an investment to the present value of all returns of capital, or the discount rate that will provide a net present value of all cash flows equal to zero. Gross IRRs represent returns before the allocation of management fees, any expenses and any incentive fees or “carried interest” paid, accrued or allocated to the general partner or investment manager of the funds and accounts. Net IRRs represent returns after the allocation of management fees, all expenses of the funds and accounts and any incentive fees or “carried interest” paid, accrued or allocated to the general partner or investment manager of the funds and accounts. Because the “carried interest” allocated to the general partners of the relevant funds is not calculated on an investment-by-investment basis, but on an aggregate fund-by-fund basis only, comparable after-fee IRRs on an investment-by-investment basis are not available. As such, all net IRRs presented herein are on a fund-level basis only. The use of other calculation methodologies including different assumptions or methods may result in different and possibly lower IRRs. Furthermore, IRRs for funds or accounts in existence and investments held for less than one year may not be meaningful.
No Benchmark
No benchmarks are presented in this presentation, as Oaktree is not aware of any benchmarks that, in Oaktree’s opinion, provide a basis for measuring the performance of the relevant funds, particularly in light of the managers’ investment philosophy, strategy and implementation.

(This page has been left blank intentionally.)

OAKTREE REAL ESTATE OPPORTUNITIES FUND VII, L.P. Confidential
46
Appendix VI: Legal Information
An investment in the Fund is speculative and involves a high degree of risk. Such risks include, but are not limited to, those described below. An investment should only be made after consultation with independent qualified sources of investment, tax and legal advice. Please refer to the PPM for a more complete description of the Fund’s investment practices, terms and conditions, restrictions and other factors relevant to a decision to invest, as well as certain tax information and risk disclosures that are important to any investment decision.
Important Information About Investment Case Studies
The investment case studies presented herein are for informational purposes only. The purpose of these cases studies is to give an illustrative example of the types of investments made as well as an understanding of the amounts invested, the investment thesis and the related returns. The investments shown may be more favorable than, and not representative of, all of the investments that will be made by the Fund. As a result, these materials are not intended to be, and should not be read as, full and complete descriptions of each investment transaction within any particular Oaktree strategy. If you would like additional information regarding any other investments of the Fund not presented herein, please contact an Oaktree marketing representative. Neither Oaktree nor its affiliates make any representation, and it should not be assumed, that past investment performance is an indication of future returns, and there can be no assurance that the Fund will be able to earn the rates of return indicated in the case studies. Wherever there is the potential for profit there is also the possibility of loss.
Sabal
Sabal Financial Group, L.P. (“Sabal U.S.”) and Sabal Financial Europe, LLC (“Sabal Europe” and, together with Sabal U.S., “Sabal”) together comprise an international diversified financial services firm specializing in the valuation, management and servicing of commercial real estate and commercial and residential acquisition, development and construction loans and mortgages, as well as in providing assistance with bid submissions and other aspects of the acquisition process for such loans and mortgages. Sabal provides credit advisory services and loan portfolio management and performance assessments for investment and commercial banks and also has a lending operation for small- to mid-size real estate loans. Sabal currently provides services to portfolios of commercial NPLs and REO properties owned by certain Oaktree funds and oversees loan origination platforms for certain Oaktree funds. An affiliate of Oaktree owns a 50% interest in Sabal U.S. and will own a 90% interest in Sabal Europe, but does not profit from amounts paid by Oaktree funds to Sabal. (See “Overlaps of the Fund with Other Oaktree Funds and Accounts and Other Conflicts of Interest” in the PPM.)
Investments
The Fund will invest in securities and obligations that entail substantial risk. There can be no assurance that such investments will increase in value, that significant losses will not be incurred or that the objectives of the Fund will be achieved. In addition, investing in such securities and obligations may result in the incurrence of significant costs, fees and expenses, including legal, advisory and consulting fees and expenses, costs of regulatory compliance and costs of defending third-party litigation.
Investment Environment
Many factors affect the demand for and supply of the types of investments that the Fund may target and their valuations. Interest rates and general levels of economic activity may affect the value and number of investments made by the Fund or considered for investment. The Fund and its investments could be materially adversely affected by instability in global financial markets or changes in market, economic, political or regulatory conditions, as well as by other factors outside the control of Oaktree or its affiliates.
Investments in Real Estate
The value of real estate and real estate-related securities and investments can be seriously affected by interest rate fluctuations, bank liquidity and the availability of financing, as well as by regulatory or governmentally imposed factors such as a zoning change, an increase in property taxes, the imposition of height or density limitations, the requirement that buildings be accessible to disabled persons, the requirement for environmental impact studies, the potential costs of remediation of environmental contamination or damage, the imposition of special fines to reduce traffic congestion or to provide for housing, competition from other investors, changes in laws, wars and earthquakes, typhoons, terrorist attacks or similar events. Income from income-producing real estate may be adversely affected by general economic conditions, local conditions such as oversupply or reduction in demand for space in the area, competition from other available properties, inadequate maintenance and inadequate coverage by insurance. Certain significant expenditures associated with real estate (such as mortgage payments (to the extent leveraged), real estate taxes and maintenance costs) have no relationship with, and thus do not diminish in proportion to, a reduction in income from the property. Reductions in value or cash flow could impair the Fund’s ability to make distributions to investors, adversely impact its investment policy and reduce overall returns on investments.
Debt Securities
Investments in debt instruments entail normal credit risks (i.e., the risk of non-payment of interest and principal) and market risks (i.e., the risk that certain market factors will cause the value of the instrument to decline). A default on a loan or a sudden and extreme increase in prevailing interest rates may cause a decline in a portfolio holding such investments.
Fixed income securities may be subject to redemption at the option of the issuer. If a fixed income security is called for redemption, the holder may be required to permit the issuer to redeem the security, which could have an adverse effect on the holder’s ability to achieve its investment objectives.
Floating rate instruments such as bank loans pay interest based on EURIBOR or LIBOR. As a result, a significant decline in EURIBOR or LIBOR could negatively impact the expected return on such loans. While loans with EURIBOR or LIBOR interest rates are available at lower prices (ignoring those with EURIBOR or LIBOR floors), there can be no guarantee that such prices will offset losses in current income. Although the prices of floating rate instruments may be less sensitive to interest rate changes than the prices of fixed-rate obligations, interest rates on bank loans only reset periodically and may not perfectly correlate with prevailing interest rates, potentially subjecting floating-rate loans to the same fluctuations as fixed-rate obligations during the period in which their interest rates are fixed.

OAKTREE REAL ESTATE OPPORTUNITIES FUND VII, L.P. Confidential
47
Appendix VI: Legal Information (continued)
Bank Loans and Participations
Bank loans and participations are subject to unique risks, including: (a) the possible invalidation of an investment transaction, including the pledging of collateral, as a fraudulent conveyance under relevant creditors’ rights laws, (b) lender-liability claims by the issuer of the obligations, (c) environmental liabilities that may arise with respect to collateral securing the obligations, (d) the utilization of a floating interest rate instead of a fixed interest rate and (e) limitations on the ability of the holder to directly enforce its rights with respect to participations. In analyzing each bank loan or participation, Oaktree will compare the relative significance of the risks against the expected benefits of the investment. Some of these risks are also present for fixed income securities. In addition, participation in bank loans may entitle Oaktree to receive material, non-public information which may limit its ability to trade in the public securities of the borrower, including high yield fixed income securities.
Leverage of Portfolio Companies
The Fund’s investments are expected to include companies whose capital structures may have significant leverage. Such investments are inherently more sensitive to declines in revenues and to increases in expenses and interest rates, creating a greater possibility of default or bankruptcy of the borrower.
Nature of Bankruptcy Proceedings
The Fund may make investments that could require substantial workout negotiations or restructuring in the event of a default or bankruptcy, which could entail significant risks, time commitments and costs.
Mortgage Foreclosures
Oaktree may be required for business or other reasons to foreclose on one or more mortgages held in the Fund’s portfolio. Foreclosures can be lengthy and expensive and borrowers often assert claims, counterclaims and defenses to delay or prevent foreclosure actions. At any time during the proceedings the borrower may file for bankruptcy, which would have the effect of staying the foreclosure action and further delaying the process and materially increasing the expense thereof which expenses may or may not be recoverable by the Fund. In addition, anti-deficiency and related laws in certain states and countries limit recourse and remedies available against borrowers in connection with or as a result of foreclosure proceedings or other enforcement actions taken with respect to such borrowers. Such laws can result in the loss of liens on collateral or personal recourse against a borrower altogether.
Newly Completed Properties and Properties Under Construction
The Fund, in many instances with local partners, may invest in development projects and may purchase undeveloped land and construct new projects on it. Properties under construction are subject to various risks. Cost and timely construction may be adversely affected by strikes, shortages in materials, subsoil risks, uninsurable losses and other factors beyond the control of Oaktree. In addition, costs of construction and operation of properties may be increased by local, state or federal legislative or administrative action in areas including zoning regulations and land use controls, air and water quality standards, noise pollution and other environmental impacts and regulatory controls. These risks could result in substantial unanticipated delays or expenses and, under certain circumstances, could prevent completion of development activities once undertaken, any of which could adversely affect the Fund and its investors. Any investment in unimproved land will be subject to all the foregoing risks, as well as risks associated with locating a satisfactory developer, formulating development plans and obtaining construction financing. Furthermore, properties under development or properties acquired for development may receive little or no cash flow from the date of acquisition through the date of completion of development and may still experience operating deficits well after the date of completion. Finally, market conditions may change during the course of development that make such investments less attractive than they were at the time of acquisition.
Non-Payment of Mortgages Underlying CMBS
The collateral underlying CMBS generally consists of commercial mortgages or real property that have a multifamily or commercial use, such as retail space, office buildings, warehouse property and hotels. With most commercial mortgages underlying CMBS, the bulk of the loan balance is payable at maturity with a one-time payment, commonly known as a “balloon payment,” and are usually non-recourse against the commercial borrower. The prospect of full repayment of the commercial mortgage loans underlying CMBS depends on the ability of the borrower to generate current income from its commercial property. Also, the likelihood of the borrower repaying the commercial mortgage loan at maturity is heavily influenced by the borrower’s ability to secure subsequent financing, which can be negatively impacted by a difficult credit environment. If the borrower defaults on the mortgage loan underlying CMBS, the options for financial recovery are limited. In the event of default, the lender will have no right to assets beyond collateral attached to the commercial mortgage loan. In certain instances a negotiated settlement or an amendment to the terms of the commercial mortgage loan are the only options before an ultimate foreclosure on the property. The ultimate disposition of a foreclosed property may yield a price insufficient to cover the cost of the foreclosure process and the balance attached to the defaulted commercial mortgage loan.
The value of CMBS is also subject to risk from possible geographic or industry concentration. Certain geographic regions or industries may be more adversely affected from economic pressures when compared to other geographic regions or industries. A pool of CMBS backed by commercial mortgage loans with a substantial geographic or industry concentration will be more susceptible to the economic environment of such concentrated geographic regions or industries, and therefore may be at greater risk for a loss in value. There can be no guarantee that the Fund’s investments in CMBS will not be adversely affected by such risks.

OAKTREE REAL ESTATE OPPORTUNITIES FUND VII, L.P. Confidential
48
Appendix VI: Legal Information (continued)
Removal or Remediation Liabilities
Certain companies and investors may be considered an owner or operator of properties on or in which asbestos or other hazardous or toxic substances exist and, therefore, potentially liable for removal or remediation costs, as well as certain other related costs, including governmental fines and costs of injuries to persons and property. These costs can be substantially in excess of the value of the property. The presence of hazardous or toxic substances or the failure to properly remediate such substances may also adversely affect the value of a property. In addition, remediated property may attract a limited number of potential purchasers because of the property’s history of contamination, which may adversely affect the owner’s ability to sell the property. Further, a transfer of property may not relieve from liability a person who owned the property at a time when hazardous or toxic substances were disposed of on, or released from, such property.
The properties the Fund will target for investment will be subject to a variety of laws and regulations concerning the protection of health and the environment. The particular environmental laws that apply to any particular property can vary greatly based on its location, environmental conditions and present and former uses. Noncompliance with environmental regulations may allow a governmental authority to order the owner/operator to cease operations at the property or to incur substantial costs to bring the property into compliance through the implementation of burdensome remediation or prophylactic measures. Finally, environmental laws applicable to the Fund’s investments may be amended in the future in ways that could adversely affect such investments.
International Investments
Oaktree expects the Fund to invest internationally. Investments in different countries involve risks and special considerations to which investors may not be accustomed. Such risks include (a) the risk of nationalization or expropriation of assets or confiscatory taxation, (b) social, economic and political uncertainty, including war and revolution, (c) dependence on exports and the corresponding importance of international trade, (d) price fluctuations, market volatility, less liquidity and smaller capitalization of securities markets, (e) currency exchange rate fluctuations, (f) rates of inflation, (g) controls on, and changes in controls on, non-U.S. investments and limitations on repatriation of invested capital and on the ability to exchange local currencies for the Fund’s base currency, (h) governmental involvement in and control over the economies, (i) governmental decisions to discontinue support of economic reform programs generally and impose centrally planned economies, (j) differences in auditing and financial reporting standards which may result in the unavailability of material information about issuers, (k) less extensive regulation of the securities markets, (l) longer settlement periods for securities transactions, (m) less developed corporate laws regarding fiduciary duties and the protection of investors, (n) less reliable judicial systems to enforce contracts and applicable law, (o) certain considerations regarding the maintenance of the portfolio securities and cash with sub-custodians and securities depositories in different countries, (p) restrictions and prohibitions on ownership of property by foreign entities and changes in laws relating thereto and (q) terrorism. These factors may increase the likelihood of potential losses being incurred in connection with such investments.
Currency Risks and Foreign Exchange
The Fund may make investments denominated in currencies other than the base currency of the Fund. Changes in the rates of exchange between the Fund’s base currency and other currencies may have an adverse effect on the value of investments denominated in such other currencies, the performance of the Fund and the amounts of distributions, if any, to be made by the Fund. In addition, the Fund will incur costs in converting investment proceeds from one currency to another. The Fund may or may not attempt to hedge currency risk of the portfolio, but in any event it does not expect that the full risk of currency fluctuations can be eliminated due to the complexity of its investments and limitations in the foreign currency market.
Options
The Fund may purchase and sell covered and uncovered put and call options. The successful use of options depends principally on the price movements of the underlying securities. If the price of the underlying security does not rise (in the case of a call purchased by the Fund) or fall (in the case of a put purchased by the Fund) to an extent sufficient to cover the option premium and transaction costs, the Fund will lose part or all of its investment in the option. If the Fund sells puts or uncovered calls, unfavorable price movements could result in significant losses.
Short Sales
The Fund may sell securities short. A short sale involves the risk of a theoretically unlimited loss from a theoretically unlimited increase in the market price of the security sold short. Furthermore, there can be no assurance that the Fund will be able to purchase the securities necessary to cover a short position.
Swaps
The Fund may engage in swaps, which may include total return swaps, interest rate swaps and credit default swaps, in which case the Fund will usually have a contractual relationship only with the counterparty of such swap, and not the issuer, and will therefore be subject to the credit risk of the counterparty. In addition, certain swaps may be required to be submitted to a central clearing counterparty, in which case the Fund will be subject to the credit risk of the central clearing counterparty and any Futures Commodity Merchant that the Fund may use to access such central clearing counterparty. The regulation of derivatives transactions and funds that engage in such transactions is an evolving area of law and is subject to modification by governmental and judicial action. The effect of any future regulatory change on the Fund could be substantial and adverse.
Use of Leverage
The Fund may engage in certain investment activities that involve the use of leverage, including through swaps. While leverage presents opportunities for increasing the Fund’s total return, it has the potential to increase losses as well. Accordingly, any event that adversely affects the value of an investment made by the Fund would be magnified to the extent leverage is used.

OAKTREE REAL ESTATE OPPORTUNITIES FUND VII, L.P. Confidential
49
Appendix VI: Legal Information (continued)
Contingent Liabilities on Disposition of Investments
The Fund may be required to indemnify the purchasers of investments that it sells. Investors in the Fund may be required to return amounts distributed to them to fund the Fund’s indemnity obligations.
Illiquidity of Investments
The Fund’s investments may consist of securities and obligations which are thinly traded, securities and obligations for which no market exists, or securities and obligations which are restricted as to their transferability. These factors may limit the ability to sell such securities at their fair market value.
Insufficient Investment Opportunities
Oaktree may not be able to identify a sufficient number of investment opportunities to invest the full amount of the Fund’s committed capital.
Carried Interest
The performance element of the carried interest distribution arrangement may create an incentive for the Fund’s general partner to cause the Fund to make investments that are riskier or more speculative than would be the case without the carried interest distribution arrangement.
ERISA Plan Assets Status
A portion of the assets of the Fund may be deemed to be “plan assets” if “benefit plan investors” exceed more than 25% of any class of equity interests in the Fund. If that were to happen, the operation and administration of the Fund and the duties, obligations and liabilities of Oaktree and, to the extent determined under ERISA, the general partner will be subject to the fiduciary responsibility provisions of ERISA and the prohibited transactions provisions of ERISA and the Code, meaning that the Fund will be precluded from engaging in a broad range of direct or indirect “prohibited transactions.”
Regulatory Risks
Legal, tax and regulatory changes may adversely affect the Fund at any time during its term. The legal, tax and regulatory environment for funds that invest in alternative investments is evolving, and changes in the regulation and market perception of such funds, including changes to existing laws and regulations and increased criticism of the private equity and alternative asset industry by some politicians, regulators and market commentators, may adversely affect the ability of the Fund to pursue its investment strategy and the value of investments held by the Fund.
Market disruptions and dramatic increases in capital allocated to alternative investment strategies have led to increased governmental and self-regulatory scrutiny of alternative investments. Greater regulation of the industry has been considered by both legislators and regulators. The effect of any future changes in regulations applicable to the Fund, its general partner, Oaktree, the markets in which the Fund invests or the counterparties with which it does business are impossible to predict, but could be substantial and adverse.
Market Conditions and Governmental Actions
The securities, futures and certain other derivatives markets are subject to comprehensive statutes, regulations and margin requirements. Government regulators and self-regulatory organizations and exchanges are authorized to take extraordinary actions in the event of market emergencies. Regulators have the ability to limit or suspend trading in securities, which could expose the Fund to significant losses. The regulation of derivatives transactions and funds that engage in such transactions is an evolving area of law and is subject to modification by governmental and judicial action. The effect of any future regulatory change on the Fund could be substantial and adverse.
In recent years, world financial markets have experienced extraordinary market conditions. In reaction to these events, regulators in various countries have undertaken and continue to undertake unprecedented action to stabilize markets. The Fund may be adversely affected by unstable markets and significant new regulations could limit the Fund’s activities and investment opportunities or change the functioning of the capital markets. In the event of a severe economic downturn, the Fund could suffer significant losses.
Institutional Risk
The brokerage firms, banks and other institutions with which the Fund does business, or to which securities will be entrusted for custodial and prime brokerage purposes, may encounter financial difficulties, fail or otherwise become unable to meet their obligations. In addition, legal, regulatory, reputational or other risks affecting such institutions could have a material adverse effect on the Fund.
Illiquidity
Participation in the Fund is an illiquid investment. Investors generally are not permitted to withdraw from the Fund and may only transfer their interests in the Fund in limited circumstances.
Unspecified Use of Proceeds
The cash proceeds of the offering of the interests in the Fund are intended to be invested in investments which, as of the date of the PPM, have not yet been selected by Oaktree.

OAKTREE REAL ESTATE OPPORTUNITIES FUND VII, L.P. Confidential
50
Appendix VI: Legal Information (continued)
Passive Investment
As passive investors in the Fund, investors will have no opportunity to control the Fund’s day-to-day operations, including investment and disposition decisions. They must rely entirely on the Fund’s general partner to conduct and manage the affairs of the Fund.
Material Non-Public Information
In connection with the operation of the Fund or other activities, personnel of Oaktree may acquire confidential or material non-public information or otherwise be restricted from initiating transactions in certain securities. The Fund will not be free to act upon any such information and may not be able to initiate a transaction that it otherwise might have initiated.
Potential Conflicts of Interest
Oaktree and its affiliates manage a number of different funds and accounts (and may form additional funds and accounts) that invest in, and in some cases have priority ahead of the Fund with respect to, securities or obligations eligible for purchase by the Fund. This presents the possibility of overlapping investments, and thus the potential for conflicts of interest. To the extent permitted by law, Oaktree reserves the right to cause the Fund to take such steps as may be necessary to minimize or eliminate any conflict between the Fund and such other Oaktree-managed funds and accounts even if that requires the Fund to divest securities that, in the absence of such conflict, it would have continued to hold or otherwise take action that may benefit Oaktree or any other Oaktree-managed fund or account and that may not be in the best interests of the Fund or the investors of the Fund. Oaktree will seek to manage conflicts in good faith.
Tax Matters
There are a series of complex tax issues related to the investments that will be the focus of the Fund, as well as any investment in the Fund itself. In addition, changes in the tax laws may adversely affect the Fund’s ability to efficiently realize income or capital gains and could materially and adversely affect the after-tax returns to investors. There can be no assurance that the Fund’s distributions will be sufficient to satisfy any U.S. federal, state or local or non-U.S. income taxes imposed on the investors in respect of their distributive shares of the Fund’s taxable income. Prospective investors are urged to consult their own tax advisors regarding the possible tax consequences of an investment in the Fund.
Lack of Diversification
Other than as set forth in the Fund’s governing documents, the Fund will be under no obligation to diversify its investments. Accordingly, the investment portfolio of the Fund may be subject to more rapid changes in value than would be the case if the Fund were required to maintain broad diversification among companies, industries and types of securities.
Investment Company Act
The Fund will not be registered under the Investment Company Act and investors in the Fund will not be accorded the protections of the Investment Company Act.
Certain information contained herein concerning economic trends and performance is based on or derived from information provided by independent third party sources. Oaktree believes that such information is accurate and that the sources from which it has been obtained are reliable; however, Oaktree cannot guarantee the accuracy of such information and has not independently verified the accuracy or completeness of such information or the assumptions on which such information is based. Moreover, independent third-party sources cited in this brochure are not making any representations or warranties regarding any information attributed to them and shall have no liability in connection with the use of such information in this brochure.
In addition, certain information contained in this presentation is based on Oaktree’s assumptions and projections or otherwise constitute “forward looking statements,” which can be identified by the use of forward looking terminology such as “may,” “will,” “should,” “expect,” “anticipate,” “forecast,” “estimate,” “intend,” “continue” or “believe” or the negatives thereof or other variations thereon or other comparable terminology. Due to various risks and uncertainties, actual events or results or the actual performance of any scenarios or forecasts discussed herein may differ materially from those reflected or contemplated in such forward looking statements. Oaktree cannot offer assurances that any of the scenarios or forecasts described herein will actually transpire or occur, or if any of them do, what impact they will have on the returns of any investment. Prospective investors are cautioned not to put undue reliance on any of the assumptions, projections or other forward looking statements contained herein. No representation or warranty is made as to future performance or such forward looking statements.
Except where otherwise indicated herein, the information provided herein is based on matters as they exist as of the date of preparation of this presentation and not as of any future date. Oaktree does not undertake any obligation to revise or update any information contained herein in light of new information, future developments or otherwise after such date of preparation. This information is intended for informational purposes only. Prospective investors should not rely on it for any other purpose.