Embed Size (px)
Citation preview

[Type text]
Real Estate Markets Weather
Political and Economic Storms
Global Market Perspective | Q3 2016
COPYRIGHT © JONES LANG LASALLE IP, INC. 2016. All Rights Reserved 2
Global Market Perspective, Third Quarter 2016
Global Market Perspective
Contents
Real Estate Markets Weather Political and Economic Storms ...................................................................................... 3
Global Economy ................................................................................................................................................................ 6
Real Estate Capital Markets ............................................................................................................................................. 9
Investment Volumes ............................................................................................................................................................ 9
Capital Values and Yields ................................................................................................................................................. 14
Corporate Occupiers ...................................................................................................................................................... 15
Global Real Estate Health Monitor ................................................................................................................................. 17
Office Markets ................................................................................................................................................................. 18
Office Demand Dynamics ................................................................................................................................................. 18
Office Supply Trends ......................................................................................................................................................... 22
Office Rental Trends ......................................................................................................................................................... 25
Retail Markets .................................................................................................................................................................. 28
Industrial Warehousing Markets .................................................................................................................................... 30
Hotel Markets ................................................................................................................................................................... 31
Residential Markets ........................................................................................................................................................ 35
Key Investment Transactions in Q2 2016 ..................................................................................................................... 37
Illustrative Office Occupational Transactions in Q2 2016 ........................................................................................... 41
Global Market Perspective, Third Quarter 2016
COPYRIGHT © JONES LANG LASALLE IP, INC. 2016. All Rights Reserved 3
Real Estate Markets Weather Political and Economic Storms
Markets resilient during period of political and economic uncertainty
The world’s dominant commercial real estate markets have, so far, weathered the political and economic storms of 2016
comparatively well. Anxiety levels have certainly increased over the last quarter, prompting more cautious risk-off
strategies; but, nonetheless, global investment volumes are expected to remain at healthy levels throughout 2016.
Underlying market fundamentals are sound and corporate demand is holding up well, notably in the United States and
continental Europe. The UK is the biggest cause for concern following the surprise EU referendum result. Meanwhile, in
Asia Pacific, the slowdown in China’s economy and anticipation that the government will start to rein in credit, is affecting
sentiment and real estate activity.
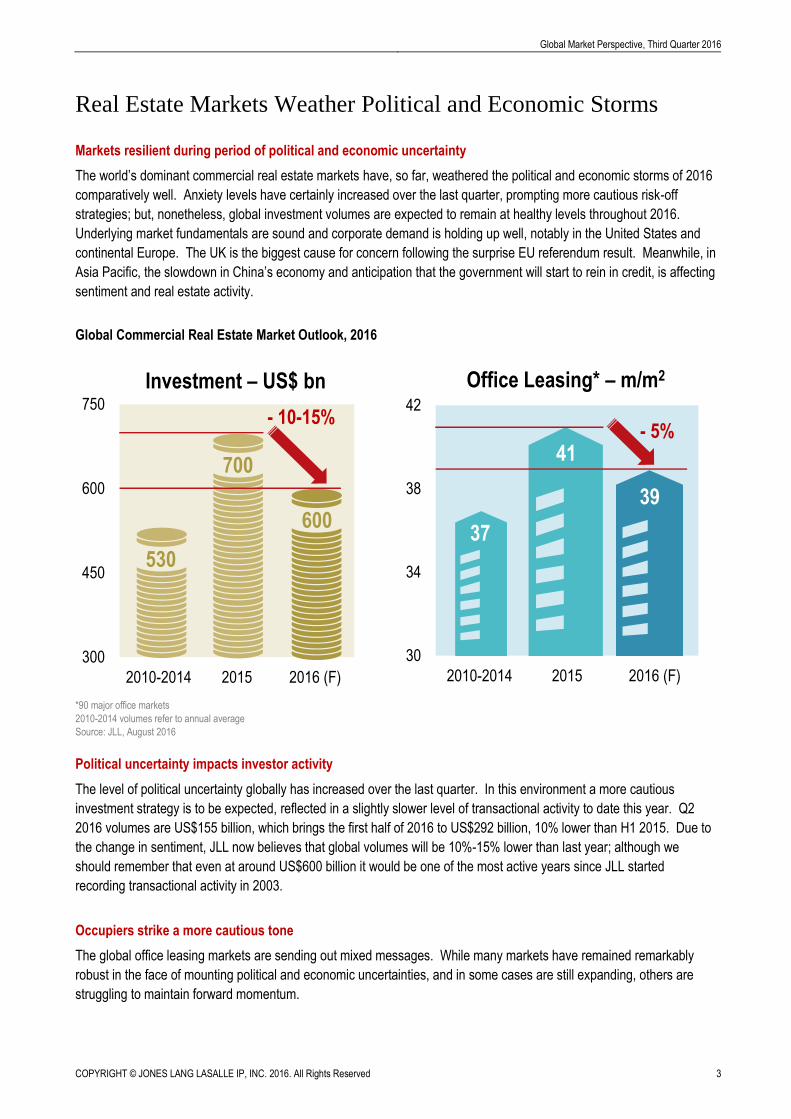
Global Commercial Real Estate Market Outlook, 2016
*90 major office markets
2010-2014 volumes refer to annual average
Source: JLL, August 2016
Political uncertainty impacts investor activity
The level of political uncertainty globally has increased over the last quarter. In this environment a more cautious
investment strategy is to be expected, reflected in a slightly slower level of transactional activity to date this year. Q2
2016 volumes are US$155 billion, which brings the first half of 2016 to US$292 billion, 10% lower than H1 2015. Due to
the change in sentiment, JLL now believes that global volumes will be 10%-15% lower than last year; although we
should remember that even at around US$600 billion it would be one of the most active years since JLL started
recording transactional activity in 2003.
Occupiers strike a more cautious tone
The global office leasing markets are sending out mixed messages. While many markets have remained remarkably
robust in the face of mounting political and economic uncertainties, and in some cases are still expanding, others are
struggling to maintain forward momentum.
300
450
600
750
2010-2014 2015 2016 (F)
30
34
38
42
2010-2014 2015 2016 (F)
Investment – US$ bn Office Leasing* – m/m2
- 10-15%- 5%
530
700
60039
41
37
COPYRIGHT © JONES LANG LASALLE IP, INC. 2016. All Rights Reserved 4
Global Market Perspective, Third Quarter 2016
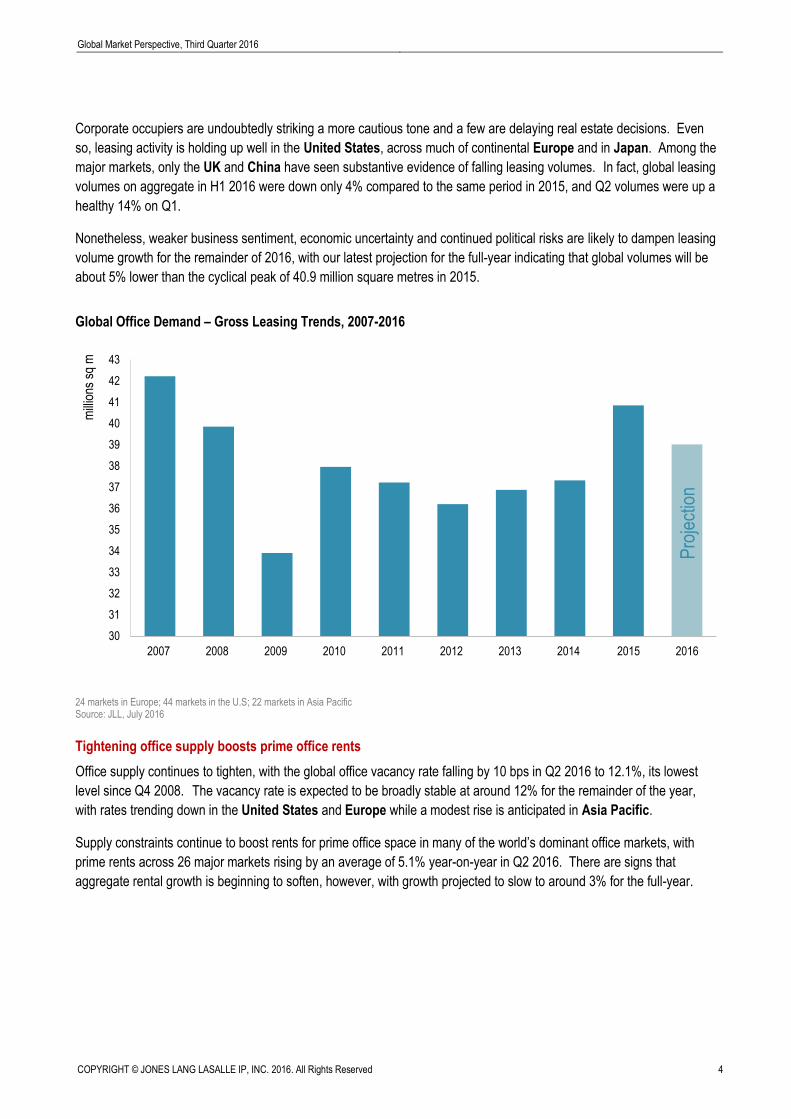
Corporate occupiers are undoubtedly striking a more cautious tone and a few are delaying real estate decisions. Even
so, leasing activity is holding up well in the United States, across much of continental Europe and in Japan. Among the
major markets, only the UK and China have seen substantive evidence of falling leasing volumes. In fact, global leasing
volumes on aggregate in H1 2016 were down only 4% compared to the same period in 2015, and Q2 volumes were up a
healthy 14% on Q1.
Nonetheless, weaker business sentiment, economic uncertainty and continued political risks are likely to dampen leasing
volume growth for the remainder of 2016, with our latest projection for the full-year indicating that global volumes will be
about 5% lower than the cyclical peak of 40.9 million square metres in 2015.
Global Office Demand – Gross Leasing Trends, 2007-2016
24 markets in Europe; 44 markets in the U.S; 22 markets in Asia Pacific Source: JLL, July 2016
Tightening office supply boosts prime office rents
Office supply continues to tighten, with the global office vacancy rate falling by 10 bps in Q2 2016 to 12.1%, its lowest
level since Q4 2008. The vacancy rate is expected to be broadly stable at around 12% for the remainder of the year,
with rates trending down in the United States and Europe while a modest rise is anticipated in Asia Pacific.
Supply constraints continue to boost rents for prime office space in many of the world’s dominant office markets, with
prime rents across 26 major markets rising by an average of 5.1% year-on-year in Q2 2016. There are signs that
aggregate rental growth is beginning to soften, however, with growth projected to slow to around 3% for the full-year.
30
31
32
33
34
35
36
37
38
39
40
41
42
43
2007 2008 2009 2010 2011 2012 2013 2014 2015 2016
mill
ions
sq
m
Pro
ject
ion
Global Market Perspective, Third Quarter 2016
COPYRIGHT © JONES LANG LASALLE IP, INC. 2016. All Rights Reserved 5
Demand for prime space drives retail rental growth in top-tier cities
Robust demand for prime retail space is fuelling solid rental growth in top-tier cities in the United States, Europe and
selectively in Asia Pacific. Rental uplifts in major global gateways and tourist markets continue to outpace the national
market in the U.S. Meanwhile, prime areas across Europe have strengthened further with Paris, leading German
markets and London registering vigorous rental growth over Q2. In Asia Pacific F&B was a major contributor to demand
in Q2 with healthy leasing activity evident in Tokyo’s prime shopping areas and in Australia, although rental levels have
been stable in most of Asia’s regional markets over the quarter.
Restructuring of logistics networks boosts demand
The need for corporates to restructure supply chain networks towards new omni-channel distribution models continues to
support relatively resilient corporate demand for logistics. Falling vacancy and new supply are still pushing rents
upwards in the U.S., while demand has carried on outstripping supply in Europe, which saw another quarter of above-
average occupier activity in Q2 2016. In Asia Pacific, third-party logistics providers and e-commerce retailers are
selectively boosting demand with stronger-than-expected occupier activity in Tokyo.
Asia becomes largest source of outbound global hotel investment
Following an exceptional year of global hotel transactions in 2015, deal activity in the first half of 2016 has declined 52%
year-on-year to US$24 billion. Uncertainty surrounding the global economic and political environment has contributed to
hotel investors adopting more of a wait-and-see approach towards investment decisions as underwriting future income
growth has become more difficult. The first six months of 2016 have seen Asia become the largest source of outbound
capital flowing into global hotel real estate, with China overtaking the Middle East in terms of outbound hotel investment,
marking a sign of the country’s long-term strategy to secure income through investing globally.
U.S. rental apartments on course despite major development cycle
Rental growth gained slightly in the U.S. multifamily market in Q2 despite a marginal increase in the national vacancy
rate on the back of an expanding development pipeline. Institutional investment markets continued to be lower in
Europe, with sales activity in the UK market modestly weaker in the lead-up to the EU referendum and a marked fall in
transaction volumes in Germany following a record 2015, although Sweden registered a record turnover in the first half
of 2016. In Asia, developer incentives supported an improvement in sales activity in Hong Kong and Singapore.
COPYRIGHT © JONES LANG LASALLE IP, INC. 2016. All Rights Reserved 6
Global Market Perspective, Third Quarter 2016
Global Economy
Surprise Brexit result brings new anxiety for the global economy
The unexpected result of the UK’s EU referendum hit world markets just as they were recovering from their New Year
hangover. Stock prices nosedived across the globe in the following days and, although a U.S.-led rally had more than
reversed the losses and moved into bull territory by mid-July, volatility has remained high. Market interest rates also
softened to new lows across the developed world, with the Bank of England expected to step in with its first rate cut in
the UK since 2009 and further action in prospect by the Bank of Japan. Sterling collapsed to a 30-year low against the
U.S. dollar after the vote, while oil prices pushed up to US$50pb, albeit inconsistently.
As markets adapt to the shock, concern has shifted to the impact of Brexit on the fragile global recovery. As the self-
inflicted wound originates in the world’s fifth (possibly now sixth) largest economy, the UK remains the biggest cause for
concern. Even before the vote, there were downward revisions in prospect, as the uncertainty began to weigh on
activity. Despite much gloom, Oxford Economics’ post-vote figures still show a relatively soft landing. Six months into
2016, UK growth is expected at 1.8% (a four-year low), dropping to just 1.1% next year (a post-GFC low).
Spillovers of Brexit to the rest of world are complex and uncertain
Spillovers from Brexit to the rest of the world beyond the financial markets remain complex and uncertain. The most
vulnerable economies appear to be the laggards of the Eurozone and Japan. A recent report by the IMF expressed
concern about the Eurozone because of the lack of policy buffers to counter any shocks after recent debt crises. There
have also been worries about the weakness of the latest Eurozone data (notwithstanding that this still refers to the pre-
vote period). But so far, Eurozone forecast revisions have been modest compared with the UK and, in part, the reverse
upside from early 2016.
In Japan, Brexit sustained the revival in the yen which has appreciated over 15% against the U.S. dollar in the last year.
This is expected to have adverse consequences for an economy where consumer demand has been exceptionally weak
and which continues to be heavily reliant on exports and investment for growth. These concerns are predicted to bring
further measures from the Bank of Japan, most probably an acceleration of asset purchases and possibly some fiscal
stimulus too.
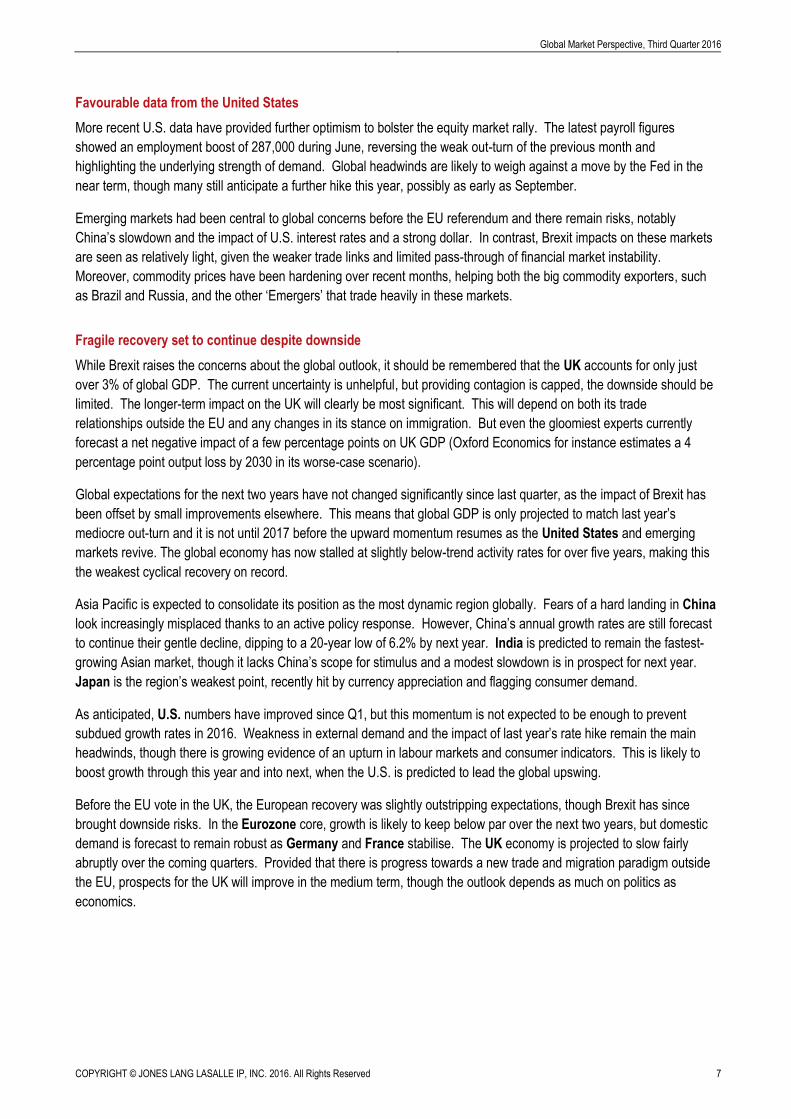
GDP Projections for 2016 in Major Economies – Recent Movements
Australia China France Germany India Japan UK U.S.
April 2.8 6.2 1.3 1.7 7.4 0.5 2.1 2.1
July (Latest) 2.9 6.5 1.6 1.7 7.5 0.1 1.8 2.0
Change (bps) +10 +30 +30 0 +10 -40 -30 -10 Source: Oxford Economics, July 2016
Global Market Perspective, Third Quarter 2016
COPYRIGHT © JONES LANG LASALLE IP, INC. 2016. All Rights Reserved 7
Favourable data from the United States
More recent U.S. data have provided further optimism to bolster the equity market rally. The latest payroll figures
showed an employment boost of 287,000 during June, reversing the weak out-turn of the previous month and
highlighting the underlying strength of demand. Global headwinds are likely to weigh against a move by the Fed in the
near term, though many still anticipate a further hike this year, possibly as early as September.
Emerging markets had been central to global concerns before the EU referendum and there remain risks, notably
China’s slowdown and the impact of U.S. interest rates and a strong dollar. In contrast, Brexit impacts on these markets
are seen as relatively light, given the weaker trade links and limited pass-through of financial market instability.
Moreover, commodity prices have been hardening over recent months, helping both the big commodity exporters, such
as Brazil and Russia, and the other ‘Emergers’ that trade heavily in these markets.
Fragile recovery set to continue despite downside
While Brexit raises the concerns about the global outlook, it should be remembered that the UK accounts for only just
over 3% of global GDP. The current uncertainty is unhelpful, but providing contagion is capped, the downside should be
limited. The longer-term impact on the UK will clearly be most significant. This will depend on both its trade
relationships outside the EU and any changes in its stance on immigration. But even the gloomiest experts currently
forecast a net negative impact of a few percentage points on UK GDP (Oxford Economics for instance estimates a 4
percentage point output loss by 2030 in its worse-case scenario).
Global expectations for the next two years have not changed significantly since last quarter, as the impact of Brexit has
been offset by small improvements elsewhere. This means that global GDP is only projected to match last year’s
mediocre out-turn and it is not until 2017 before the upward momentum resumes as the United States and emerging
markets revive. The global economy has now stalled at slightly below-trend activity rates for over five years, making this
the weakest cyclical recovery on record.
Asia Pacific is expected to consolidate its position as the most dynamic region globally. Fears of a hard landing in China
look increasingly misplaced thanks to an active policy response. However, China’s annual growth rates are still forecast
to continue their gentle decline, dipping to a 20-year low of 6.2% by next year. India is predicted to remain the fastest-
growing Asian market, though it lacks China’s scope for stimulus and a modest slowdown is in prospect for next year.
Japan is the region’s weakest point, recently hit by currency appreciation and flagging consumer demand.
As anticipated, U.S. numbers have improved since Q1, but this momentum is not expected to be enough to prevent
subdued growth rates in 2016. Weakness in external demand and the impact of last year’s rate hike remain the main
headwinds, though there is growing evidence of an upturn in labour markets and consumer indicators. This is likely to
boost growth through this year and into next, when the U.S. is predicted to lead the global upswing.
Before the EU vote in the UK, the European recovery was slightly outstripping expectations, though Brexit has since
brought downside risks. In the Eurozone core, growth is likely to keep below par over the next two years, but domestic
demand is forecast to remain robust as Germany and France stabilise. The UK economy is projected to slow fairly
abruptly over the coming quarters. Provided that there is progress towards a new trade and migration paradigm outside
the EU, prospects for the UK will improve in the medium term, though the outlook depends as much on politics as
economics.
COPYRIGHT © JONES LANG LASALLE IP, INC. 2016. All Rights Reserved 8
Global Market Perspective, Third Quarter 2016
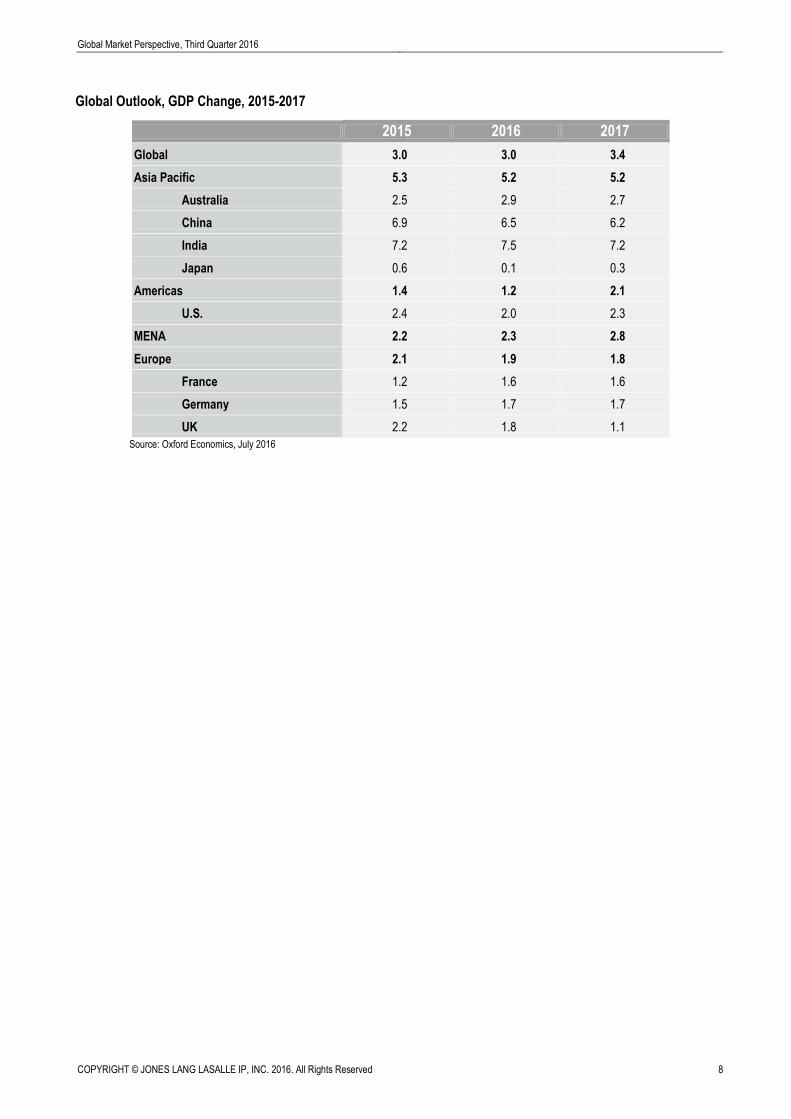
Global Outlook, GDP Change, 2015-2017
2015 2016 2017
Global 3.0 3.0 3.4
Asia Pacific 5.3 5.2 5.2
Australia 2.5 2.9 2.7
China 6.9 6.5 6.2
India 7.2 7.5 7.2
Japan 0.6 0.1 0.3
Americas 1.4 1.2 2.1
U.S. 2.4 2.0 2.3
MENA 2.2 2.3 2.8
Europe 2.1 1.9 1.8
France 1.2 1.6 1.6
Germany 1.5 1.7 1.7
UK 2.2 1.8 1.1
Source: Oxford Economics, July 2016
Global Market Perspective, Third Quarter 2016
COPYRIGHT © JONES LANG LASALLE IP, INC. 2016. All Rights Reserved 9
Real Estate Capital Markets
Investment Volumes
Year of political uncertainty makes investors more cautious
Second quarter 2016 investment volumes are US$155 billion, which brings the first half of 2016 to US$292 billion, 10%
lower than H1 2015. The level of political uncertainty globally has increased over the last quarter with many countries
going to the polls and producing inconclusive outcomes. In this environment a more cautious investment strategy is to
be expected, which is why we are seeing a slightly slower level of transactional activity so far this year.
Pace of slowdown consistent with the first quarter
Activity in the Americas has continued at more or less the same rate over the first half of the year, with Q2 volumes of
US$69 billion pushing first half activity to US$130 billion, 15% lower than a year ago and the biggest drop of all three
regions. The performance of the U.S. market has maintained a consistent pace following the disruption of the first few
weeks of the year. Elsewhere in the region, activity has been more volatile, with further falls in Brazil and Mexico
counterbalanced by rises in Canada and almost US$1 billion traded in Chile.
After the shock comes the search for opportunities
Probably the biggest surprise this quarter was the fact that European volumes at US$57 billion were consistent with
those of a year ago. This means that over the first half of 2016, Europe is down 5% at US$109 billion, comparable in
performance in both U.S. dollar and euro terms to last year. While UK performance has declined since the start of the
year, down 24% in local currency terms, the trend of investors looking continent-wide for opportunities continued in the
second quarter with activity in France, the Nordics and Central and Eastern Europe higher. However, Germany is down
4% over the first half, following a very active 2015.
Mega deal helps Singapore, but Japan and China are a drag on regional growth
Despite one of the biggest deals globally closing in Singapore (the sale of the Asia Square Tower 1), activity across
Asia Pacific has been more subdued. The US$28 billion transacted in Q2 is 8% below the same quarter in 2015, while
first half volumes of US$54 billion are 4% below a year ago. Alongside Singapore, both Australia and South Korea are
ahead at the end of the first half, but China and Japan are respectively 13% and 12% below last year’s H1 levels.
After five years of growth, time to think about the next phase of the cycle
Although we recorded a downturn in transactional activity in 2015, much of this was down to the strength of the U.S.
dollar, while activity at the local level remained robust. In 2016 there has been a notable change in investor sentiment
which is now directly feeding through to reduced transactional activity, and this is likely to last for the rest of 2016 given
the uncertain political environment. Economically, while global forecasts have been consistently trimmed, many of the
fundamentals are still strong, particularly in relation to companies looking to take more space and create more jobs. Due
to this change in sentiment we now believe that global volumes will be 10%-15% lower than last year at around US$600
billion. We should remember that even at around US$600 billion it would be the fifth most active year since JLL started
recording transactional activity in 2003. Furthermore, following a period of subdued market activity, the bounce-back
tends to be swift and sustained; historically, in the two periods after a fall in transactional activity the following year has
seen over US$100 billion added to overall global transactional volumes.
COPYRIGHT © JONES LANG LASALLE IP, INC. 2016. All Rights Reserved 10
Global Market Perspective, Third Quarter 2016
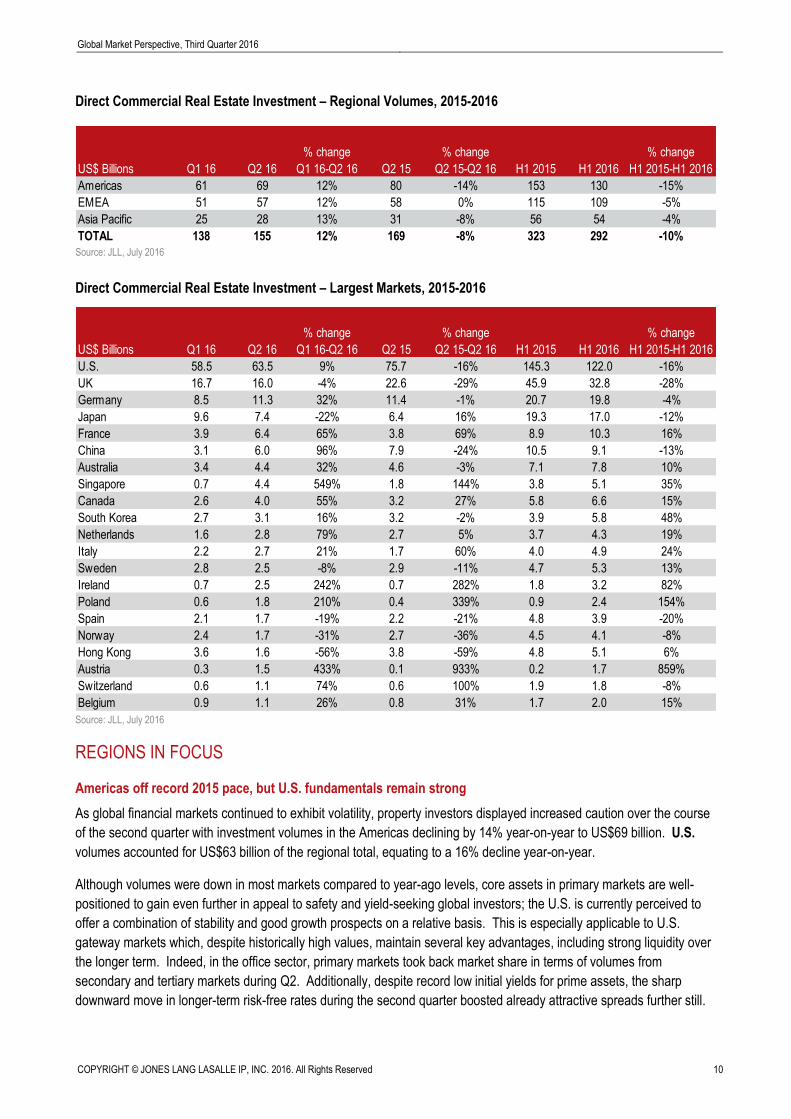
Direct Commercial Real Estate Investment – Regional Volumes, 2015-2016
Source: JLL, July 2016
Direct Commercial Real Estate Investment – Largest Markets, 2015-2016
Source: JLL, July 2016
REGIONS IN FOCUS
Americas off record 2015 pace, but U.S. fundamentals remain strong
As global financial markets continued to exhibit volatility, property investors displayed increased caution over the course
of the second quarter with investment volumes in the Americas declining by 14% year-on-year to US$69 billion. U.S.
volumes accounted for US$63 billion of the regional total, equating to a 16% decline year-on-year.
Although volumes were down in most markets compared to year-ago levels, core assets in primary markets are well-
positioned to gain even further in appeal to safety and yield-seeking global investors; the U.S. is currently perceived to
offer a combination of stability and good growth prospects on a relative basis. This is especially applicable to U.S.
gateway markets which, despite historically high values, maintain several key advantages, including strong liquidity over
the longer term. Indeed, in the office sector, primary markets took back market share in terms of volumes from
secondary and tertiary markets during Q2. Additionally, despite record low initial yields for prime assets, the sharp
downward move in longer-term risk-free rates during the second quarter boosted already attractive spreads further still.
US$ Billions Q1 16 Q2 16
% change
Q1 16-Q2 16 Q2 15
% change
Q2 15-Q2 16 H1 2015 H1 2016
% change
H1 2015-H1 2016
Americas 61 69 12% 80 -14% 153 130 -15%
EMEA 51 57 12% 58 0% 115 109 -5%
Asia Pacific 25 28 13% 31 -8% 56 54 -4%
TOTAL 138 155 12% 169 -8% 323 292 -10%
US$ Billions Q1 16 Q2 16
% change
Q1 16-Q2 16 Q2 15
% change
Q2 15-Q2 16 H1 2015 H1 2016
% change
H1 2015-H1 2016
U.S. 58.5 63.5 9% 75.7 -16% 145.3 122.0 -16%
UK 16.7 16.0 -4% 22.6 -29% 45.9 32.8 -28%
Germany 8.5 11.3 32% 11.4 -1% 20.7 19.8 -4%
Japan 9.6 7.4 -22% 6.4 16% 19.3 17.0 -12%
France 3.9 6.4 65% 3.8 69% 8.9 10.3 16%
China 3.1 6.0 96% 7.9 -24% 10.5 9.1 -13%
Australia 3.4 4.4 32% 4.6 -3% 7.1 7.8 10%
Singapore 0.7 4.4 549% 1.8 144% 3.8 5.1 35%
Canada 2.6 4.0 55% 3.2 27% 5.8 6.6 15%
South Korea 2.7 3.1 16% 3.2 -2% 3.9 5.8 48%
Netherlands 1.6 2.8 79% 2.7 5% 3.7 4.3 19%
Italy 2.2 2.7 21% 1.7 60% 4.0 4.9 24%
Sweden 2.8 2.5 -8% 2.9 -11% 4.7 5.3 13%
Ireland 0.7 2.5 242% 0.7 282% 1.8 3.2 82%
Poland 0.6 1.8 210% 0.4 339% 0.9 2.4 154%
Spain 2.1 1.7 -19% 2.2 -21% 4.8 3.9 -20%
Norway 2.4 1.7 -31% 2.7 -36% 4.5 4.1 -8%
Hong Kong 3.6 1.6 -56% 3.8 -59% 4.8 5.1 6%
Austria 0.3 1.5 433% 0.1 933% 0.2 1.7 859%
Switzerland 0.6 1.1 74% 0.6 100% 1.9 1.8 -8%
Belgium 0.9 1.1 26% 0.8 31% 1.7 2.0 15%
Global Market Perspective, Third Quarter 2016
COPYRIGHT © JONES LANG LASALLE IP, INC. 2016. All Rights Reserved 11
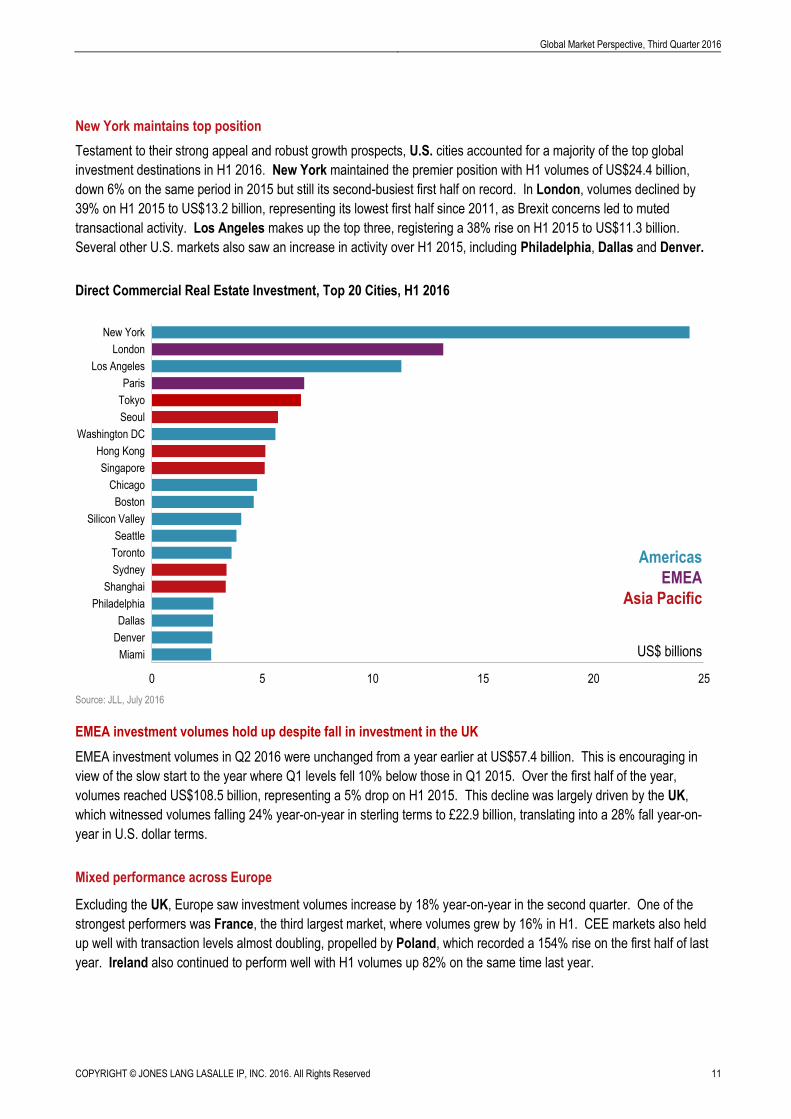
New York maintains top position
Testament to their strong appeal and robust growth prospects, U.S. cities accounted for a majority of the top global
investment destinations in H1 2016. New York maintained the premier position with H1 volumes of US$24.4 billion,
down 6% on the same period in 2015 but still its second-busiest first half on record. In London, volumes declined by
39% on H1 2015 to US$13.2 billion, representing its lowest first half since 2011, as Brexit concerns led to muted
transactional activity. Los Angeles makes up the top three, registering a 38% rise on H1 2015 to US$11.3 billion.
Several other U.S. markets also saw an increase in activity over H1 2015, including Philadelphia, Dallas and Denver.
Direct Commercial Real Estate Investment, Top 20 Cities, H1 2016
Source: JLL, July 2016
EMEA investment volumes hold up despite fall in investment in the UK
EMEA investment volumes in Q2 2016 were unchanged from a year earlier at US$57.4 billion. This is encouraging in
view of the slow start to the year where Q1 levels fell 10% below those in Q1 2015. Over the first half of the year,
volumes reached US$108.5 billion, representing a 5% drop on H1 2015. This decline was largely driven by the UK,
which witnessed volumes falling 24% year-on-year in sterling terms to £22.9 billion, translating into a 28% fall year-on-
year in U.S. dollar terms.
Mixed performance across Europe
Excluding the UK, Europe saw investment volumes increase by 18% year-on-year in the second quarter. One of the
strongest performers was France, the third largest market, where volumes grew by 16% in H1. CEE markets also held
up well with transaction levels almost doubling, propelled by Poland, which recorded a 154% rise on the first half of last
year. Ireland also continued to perform well with H1 volumes up 82% on the same time last year.
0 5 10 15 20 25
Miami
Denver
Dallas
Philadelphia
Shanghai
Sydney
Toronto
Seattle
Silicon Valley
Boston
Chicago
Singapore
Hong Kong
Washington DC
Seoul
Tokyo
Paris
Los Angeles
London
New York
Americas
EMEA
Asia Pacific
US$ billions
COPYRIGHT © JONES LANG LASALLE IP, INC. 2016. All Rights Reserved 12
Global Market Perspective, Third Quarter 2016
Meanwhile, Germany was down 4% year-on-year over H1 compared to a highly vigorous 2015. Activity in the Nordics
and Benelux was flat in H1; by contrast, the Netherlands maintained its strong investment activity (+19% year-on-year).
Finally, volumes in Southern Europe remained largely unchanged from H1 2015 (+2% year-on-year) with a decline in
Spain (-20% year-on-year) balanced by uplifts in Italy and Portugal.
Cross-border capital flows fall on lower overall transaction volumes in the Asia Pacific region
Investment volumes across Asia Pacific’s commercial real estate markets continued the year on a slightly subdued
note with Q2 2016 coming in at US$28.4 billion, down 8% on the same quarter a year ago. Singapore led the
quarter with the US$2.45 billion Asia Square Tower 1 transaction, while laggards included China and Japan. Intra-
regional purchaser capital flow grew by 7% year-on-year to US$3.1 billion in Q2, while inter-regional purchaser capital
flow fell by 21% year-on-year to US$4.4 billion, due largely to the decline in overall transaction volumes as investors
hold off in light of economic uncertainty.
Liquidity in the market is slowing, mainly due to an uncertain global economic outlook and record high pricing in some
markets. Any Brexit impacts on Asia Pacific economies should be fairly limited and short-lived, given that the region
as a whole has limited direct international trading links with the UK. Flight to safe-haven asset classes has pushed
global government bond yields lower following the Brexit vote and is propelling grade-A yield spreads in some
markets towards record highs despite low cap rates.
Several years of strong investment activity dries up supply in Australia and Japan
Transaction volumes in Australia reached US$4.4 billion in Q2, down 3% year-on-year, mainly due to a limited
number of products coming onto the market following several years of record transaction levels. Even so, robust
demand continues to emanate from global investors attracted to Australia due to its good-quality assets and yield
spread. A lack of large-scale single-asset deals also weighed on transaction volumes in Japan, which recorded
US$17 billion worth of transactional activity in H1 2016, down 12% year-on-year. The number of J-REIT acquisitions
is on a downward trend due to a decrease in the expected rate of returns. However, demand in Japan is projected to
remain steady from both domestic and international investors, supported by a low interest rate environment and
above-average yield spread over the 10-year government bond benchmark.
Investors continue to seek core stabilised assets in China
China recorded US$6.0 billion of transaction volumes in Q2, down 24% year-on-year but up 96% on Q1. The
lacklustre result was partly due to a lack of willing sellers, with many office assets having been sold last year. Asset
availability is still low and core stabilised assets are trading within a tight yield level. Institutional investors will
continue to seek core stabilised assets in major cities, which are hard to come by given a strong rental growth
forecast and following a record year of investment in 2015.
Hong Kong and South Korea register declines
Investment activity in Hong Kong fell by 59% year-on-year to US$1.6 billion in Q2. This comes off the back of two
strong quarters which saw a number of high-profile trades, and more prime assets are likely to become available as
some owners capitalise on current high pricing levels to consider diversifying overseas. South Korea also witnessed
transaction volumes fall, with US$3.1 billion of activity in the second quarter, down 2% from the same quarter a year ago.
Nonetheless, more deals should become available for the second half of the year as there are still several large assets
on the market.
Global Market Perspective, Third Quarter 2016
COPYRIGHT © JONES LANG LASALLE IP, INC. 2016. All Rights Reserved 13
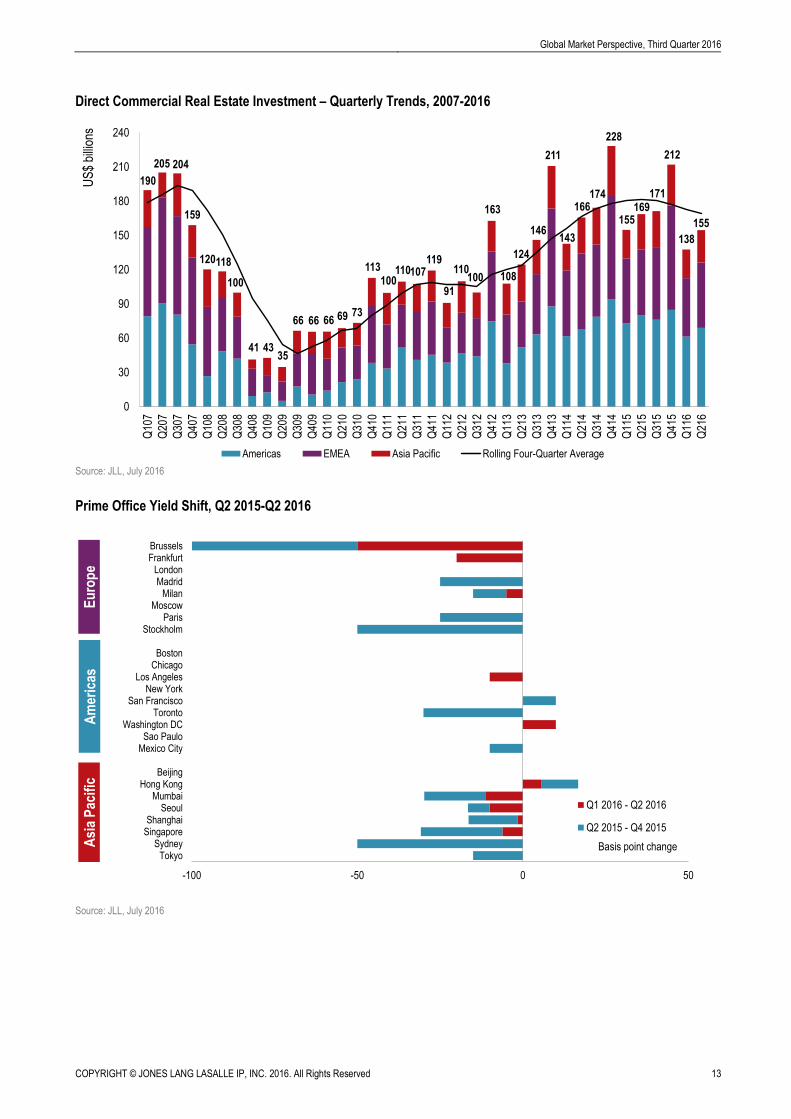
Direct Commercial Real Estate Investment – Quarterly Trends, 2007-2016
Source: JLL, July 2016
Prime Office Yield Shift, Q2 2015-Q2 2016
Source: JLL, July 2016
0
30
60
90
120
150
180
210
240Q
107
Q20
7
Q30
7
Q40
7
Q10
8
Q20
8
Q30
8
Q40
8
Q10
9
Q20
9
Q30
9
Q40
9
Q11
0
Q21
0
Q31
0
Q41
0
Q11
1
Q21
1
Q31
1
Q41
1
Q11
2
Q21
2
Q31
2
Q41
2
Q11
3
Q21
3
Q31
3
Q41
3
Q11
4
Q21
4
Q31
4
Q41
4
Q11
5
Q21
5
Q31
5
Q41
5
Q11
6
Q21
6
Americas EMEA Asia Pacific Rolling Four-Quarter Average
US
$ bi
llion
s
205
107110100
113
7369666666
100
118120
159
204
190
119
91
110100
163
41 4335
108
124
146
211
143
166174
228
155169
171
212
138
155
-100 -50 0 50
TokyoSydney
SingaporeShanghai
SeoulMumbai
Hong KongBeijing
Mexico CitySao Paulo
Washington DCToronto
San FranciscoNew York
Los AngelesChicagoBoston
StockholmParis
MoscowMilan
MadridLondon
FrankfurtBrussels
Q1 2016 - Q2 2016
Q2 2015 - Q4 2015
Basis point change
Am
eric
asE
uro
pe
Asi
a P
acif
ic
COPYRIGHT © JONES LANG LASALLE IP, INC. 2016. All Rights Reserved 14
Global Market Perspective, Third Quarter 2016
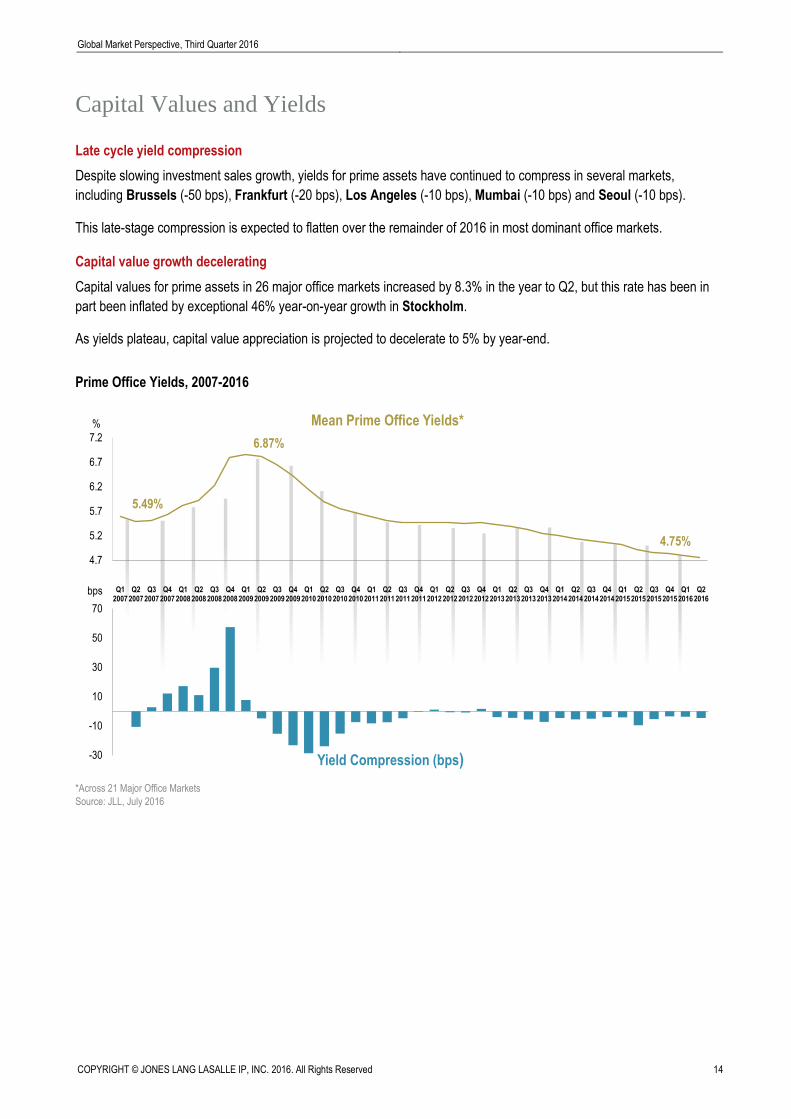
Capital Values and Yields
Late cycle yield compression
Despite slowing investment sales growth, yields for prime assets have continued to compress in several markets,
including Brussels (-50 bps), Frankfurt (-20 bps), Los Angeles (-10 bps), Mumbai (-10 bps) and Seoul (-10 bps).
This late-stage compression is expected to flatten over the remainder of 2016 in most dominant office markets.
Capital value growth decelerating
Capital values for prime assets in 26 major office markets increased by 8.3% in the year to Q2, but this rate has been in
part been inflated by exceptional 46% year-on-year growth in Stockholm.
As yields plateau, capital value appreciation is projected to decelerate to 5% by year-end.
Prime Office Yields, 2007-2016
*Across 21 Major Office Markets
Source: JLL, July 2016
-30
-10
10
30
50
70
Q12007
Q22007
Q32007
Q42007
Q12008
Q22008
Q32008
Q42008
Q12009
Q22009
Q32009
Q42009
Q12010
Q22010
Q32010
Q42010
Q12011
Q22011
Q32011
Q42011
Q12012
Q22012
Q32012
Q42012
Q12013
Q22013
Q32013
Q42013
Q12014
Q22014
Q32014
Q42014
Q12015
Q22015
Q32015
Q42015
Q12016
Q22016
Yield Compression (bps)
4.7
5.2
5.7
6.2
6.7
7.2
Mean Prime Office Yields*
5.49%
4.75%
%
bps
6.87%
Global Market Perspective, Third Quarter 2016
COPYRIGHT © JONES LANG LASALLE IP, INC. 2016. All Rights Reserved 15
Corporate Occupiers
Occupier activity cautious on political concerns
‘Caution’ appears to be the key word among corporate occupiers at the moment in leading global markets including New
York, London, Singapore and Beijing. While corporate performance is healthy in most industries, all firms remain
under pressure to maximise the efficiency of their real estate portfolios. The financial services sector continues to be
focused on consolidation and rationalisation of its footprint, while the energy sector is still experiencing pressure from low
oil prices, resulting in portfolio reviews and cost-reduction initiatives.
Corporate decision-making on hold in selected markets
In Asia Pacific, the slowdown in China continues to impact corporate decision-making. Although vacancy is still low in
cities like Beijing, leasing volumes are down significantly in the first half of 2016. International companies in Asia are
maintaining their attention on cost efficiency and portfolio optimisation. Notable exceptions to the general decline in H1
have been seen in Tokyo, Hong Kong and Manila, which are all experiencing increased tenant demand and leasing
volumes.
Impact from Brexit is uneven
Considering the significant uncertainty associated with the British exit from the European Union, corporate occupier
activity has actually been quite strong. Leasing volumes across Europe are only down 3% in Q2 from 2015 and they
remain 6% higher than the 10-year average. Many occupiers report that they are conducting ‘business as usual’ until
the details of the UK’s exit agreement are better understood. Across EMEA, retail sales are improving and the logistics
sector continues to increase its influence across the market.
While continental Europe appears rather steady, the near-term demand for space in the UK has declined significantly. In
London, leasing activity was down 56% year-over-year in Q2, and take-up has fallen 28% below the 10-year average.
Still, according to JLL estimates approximately 75% of all previously planned leases are expected to move forward and
even financial services companies appear to be continuing their commitments to the City. Generally in London,
corporate real estate leads are in a mode of ‘digest and analyse’ and major strategic decisions will likely be placed on
hold until the facts are known regarding the long-term environment in which their companies will be operating.
Occupier sentiment positive in the United States
Q2 leasing activity in the United States rebounded from the slowdown of Q1 2016, exceeding the eight-year average in
the process. Occupier sentiment remained very positive in the quarter as the employment market is robust and wages
are slowly rising. However, the political climate in the U.S. is likely to put a pause on some major corporate decisions
through the remainder of 2016.
Construction rising in the United States
In the United States, supply is now increasing at its most rapid pace since 2006, and this may soon shift the market, at
a national level, from landlord-favourable to more neutral conditions. Across the U.S. there are over 9 million square
metres of new office developments under construction, of which 80% will deliver in 2017. Unless current leasing activity
increases, this new supply will result in rising vacancy rates in several primary markets. Vacancy is already increasing in
New York, Dallas and Houston; by 2017, it will likely start rising in Chicago, San Francisco and Washington DC.
COPYRIGHT © JONES LANG LASALLE IP, INC. 2016. All Rights Reserved 16
Global Market Perspective, Third Quarter 2016
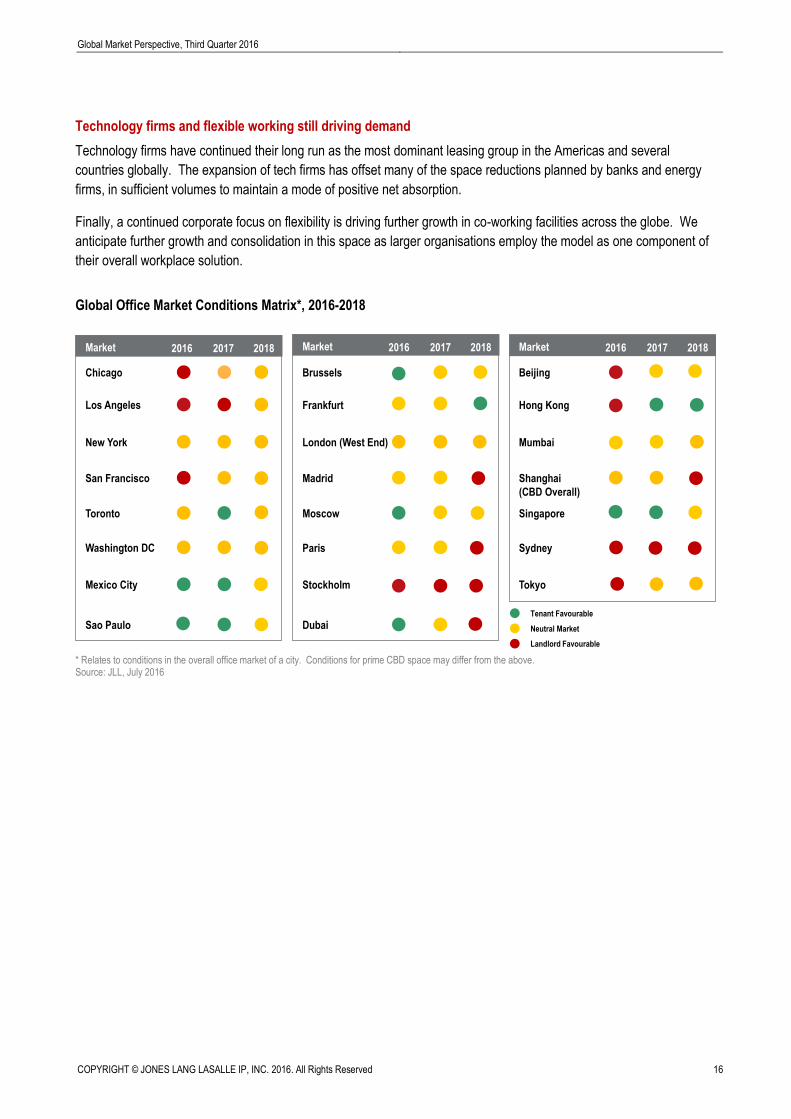
Technology firms and flexible working still driving demand
Technology firms have continued their long run as the most dominant leasing group in the Americas and several
countries globally. The expansion of tech firms has offset many of the space reductions planned by banks and energy
firms, in sufficient volumes to maintain a mode of positive net absorption.
Finally, a continued corporate focus on flexibility is driving further growth in co-working facilities across the globe. We
anticipate further growth and consolidation in this space as larger organisations employ the model as one component of
their overall workplace solution.
Global Office Market Conditions Matrix*, 2016-2018
* Relates to conditions in the overall office market of a city. Conditions for prime CBD space may differ from the above. Source: JLL, July 2016
MARKET
Brussels Beijing
Frankfurt Hong Kong
London (West End) Mumbai
Madrid Shanghai
(CBD Overall)
Moscow Singapore
Paris Sydney
Stockholm
Dubai
Market 2016 2017 2018 Market 2016 2017 2018
Tokyo
Neutral Market
Landlord Favourable
Tenant Favourable
Market
Chicago
Los Angeles
New York
San Francisco
Toronto
Washington DC
Mexico City
Sao Paulo
2016 2017 2018
Global Market Perspective, Third Quarter 2016
COPYRIGHT © JONES LANG LASALLE IP, INC. 2016. All Rights Reserved 17
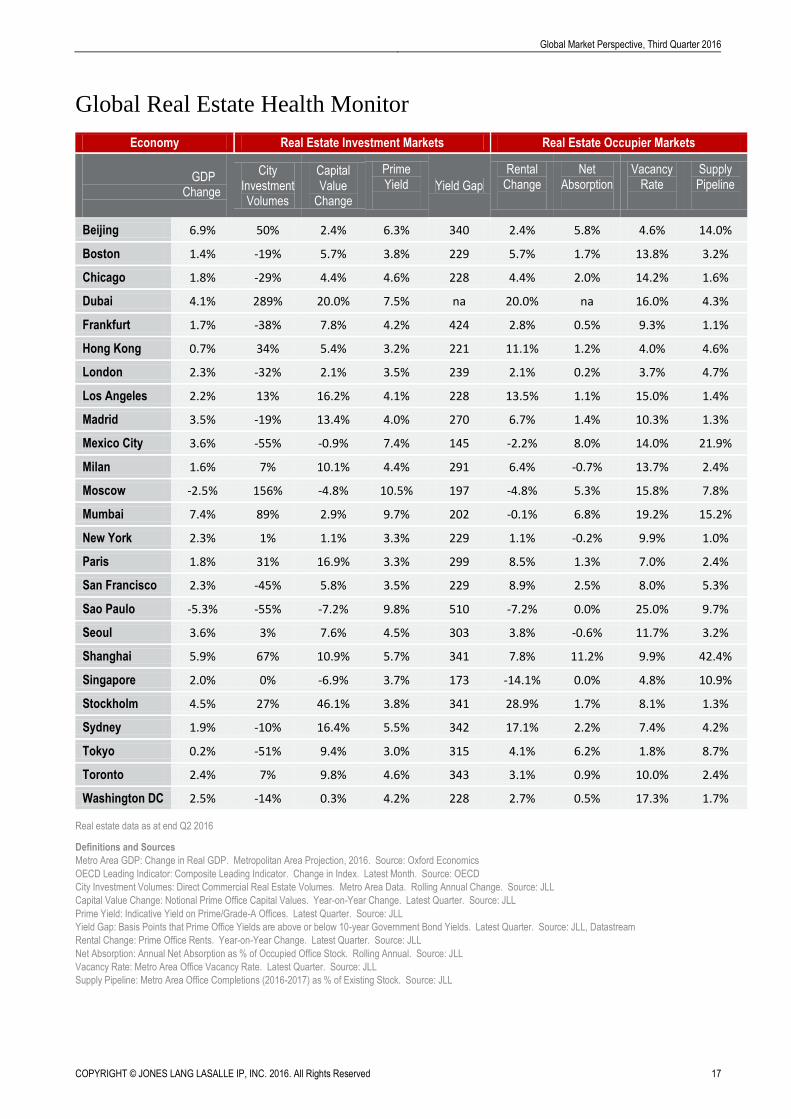
Global Real Estate Health Monitor
Economy Real Estate Investment Markets Real Estate Occupier Markets
GDP Change
City Investment Volumes
Capital Value
Change
Prime Yield
Yield Gap
Rental Change
Net Absorption
Vacancy Rate
Supply Pipeline
Beijing 6.9% 50% 2.4% 6.3% 340 2.4% 5.8% 4.6% 14.0%
Boston 1.4% -19% 5.7% 3.8% 229 5.7% 1.7% 13.8% 3.2%
Chicago 1.8% -29% 4.4% 4.6% 228 4.4% 2.0% 14.2% 1.6%
Dubai 4.1% 289% 20.0% 7.5% na 20.0% na 16.0% 4.3%
Frankfurt 1.7% -38% 7.8% 4.2% 424 2.8% 0.5% 9.3% 1.1%
Hong Kong 0.7% 34% 5.4% 3.2% 221 11.1% 1.2% 4.0% 4.6%
London 2.3% -32% 2.1% 3.5% 239 2.1% 0.2% 3.7% 4.7%
Los Angeles 2.2% 13% 16.2% 4.1% 228 13.5% 1.1% 15.0% 1.4%
Madrid 3.5% -19% 13.4% 4.0% 270 6.7% 1.4% 10.3% 1.3%
Mexico City 3.6% -55% -0.9% 7.4% 145 -2.2% 8.0% 14.0% 21.9%
Milan 1.6% 7% 10.1% 4.4% 291 6.4% -0.7% 13.7% 2.4%
Moscow -2.5% 156% -4.8% 10.5% 197 -4.8% 5.3% 15.8% 7.8%
Mumbai 7.4% 89% 2.9% 9.7% 202 -0.1% 6.8% 19.2% 15.2%
New York 2.3% 1% 1.1% 3.3% 229 1.1% -0.2% 9.9% 1.0%
Paris 1.8% 31% 16.9% 3.3% 299 8.5% 1.3% 7.0% 2.4%
San Francisco 2.3% -45% 5.8% 3.5% 229 8.9% 2.5% 8.0% 5.3%
Sao Paulo -5.3% -55% -7.2% 9.8% 510 -7.2% 0.0% 25.0% 9.7%
Seoul 3.6% 3% 7.6% 4.5% 303 3.8% -0.6% 11.7% 3.2%
Shanghai 5.9% 67% 10.9% 5.7% 341 7.8% 11.2% 9.9% 42.4%
Singapore 2.0% 0% -6.9% 3.7% 173 -14.1% 0.0% 4.8% 10.9%
Stockholm 4.5% 27% 46.1% 3.8% 341 28.9% 1.7% 8.1% 1.3%
Sydney 1.9% -10% 16.4% 5.5% 342 17.1% 2.2% 7.4% 4.2%
Tokyo 0.2% -51% 9.4% 3.0% 315 4.1% 6.2% 1.8% 8.7%
Toronto 2.4% 7% 9.8% 4.6% 343 3.1% 0.9% 10.0% 2.4%
Washington DC 2.5% -14% 0.3% 4.2% 228 2.7% 0.5% 17.3% 1.7%
Real estate data as at end Q2 2016
Definitions and Sources
Metro Area GDP: Change in Real GDP. Metropolitan Area Projection, 2016. Source: Oxford Economics
OECD Leading Indicator: Composite Leading Indicator. Change in Index. Latest Month. Source: OECD
City Investment Volumes: Direct Commercial Real Estate Volumes. Metro Area Data. Rolling Annual Change. Source: JLL
Capital Value Change: Notional Prime Office Capital Values. Year-on-Year Change. Latest Quarter. Source: JLL
Prime Yield: Indicative Yield on Prime/Grade-A Offices. Latest Quarter. Source: JLL
Yield Gap: Basis Points that Prime Office Yields are above or below 10-year Government Bond Yields. Latest Quarter. Source: JLL, Datastream
Rental Change: Prime Office Rents. Year-on-Year Change. Latest Quarter. Source: JLL
Net Absorption: Annual Net Absorption as % of Occupied Office Stock. Rolling Annual. Source: JLL
Vacancy Rate: Metro Area Office Vacancy Rate. Latest Quarter. Source: JLL
Supply Pipeline: Metro Area Office Completions (2016-2017) as % of Existing Stock. Source: JLL
COPYRIGHT © JONES LANG LASALLE IP, INC. 2016. All Rights Reserved 18
Global Market Perspective, Third Quarter 2016
Office Markets
Office Demand Dynamics
Office Demand
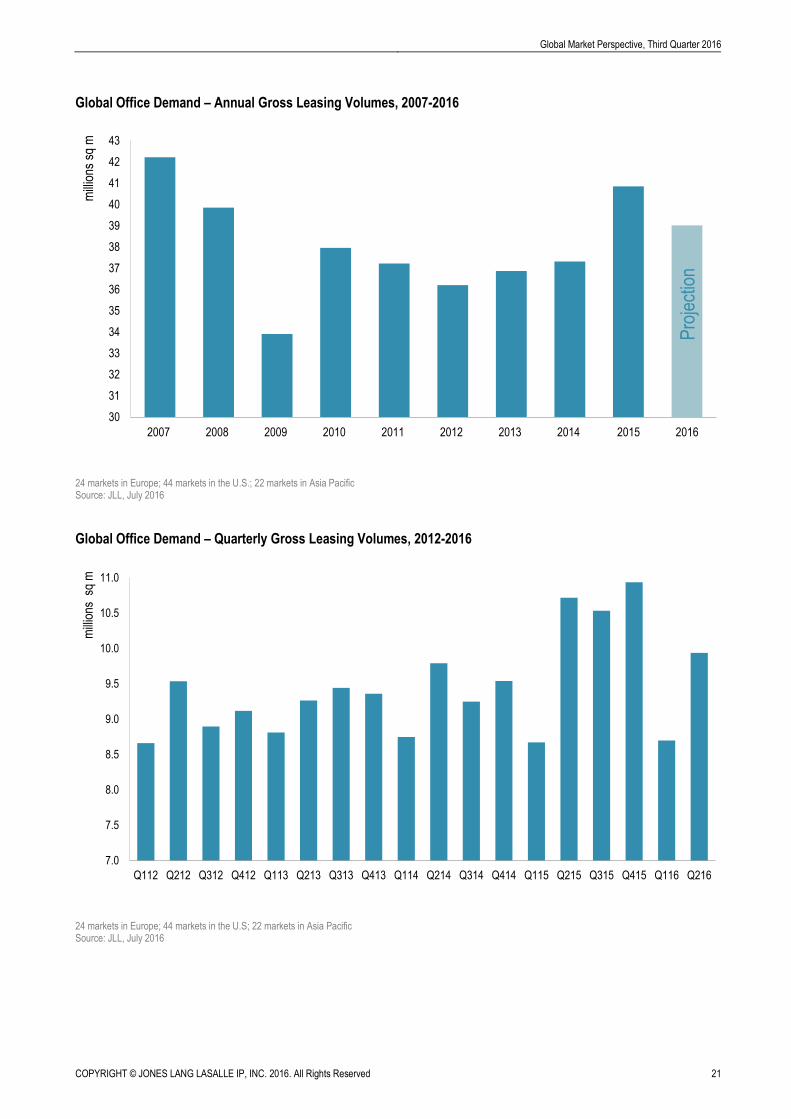
Leasing markets sending out mixed messages
The global office leasing markets are sending out mixed messages. While many markets have remained remarkably
robust in the face of mounting political and economic uncertainties, and in some cases are still expanding, others are
struggling to maintain forward momentum.
Corporate occupiers are certainly striking a more cautious tone; they are ‘taking stock’ and a few are delaying decisions.
Yet leasing activity is holding up well in the United States, across much of continental Europe and in Japan. On
aggregate, global leasing volumes in H1 2016 were down only 4% compared to the same period in 2015, and second
quarter volumes were up a healthy 14% on Q1.
Among the major markets, it is only in the UK and China where we have witnessed more substantive evidence of falling
leasing volumes. EU referendum anxieties resulted in office take-up in London in H1 coming in one-third lower than a
year ago. In China, the delayed impact of stock market volatility and concerns about the pace of economic growth have
seen volumes in Shanghai and Beijing down by 40%-50% year-on-year in H1, although this decline is from the
exceptional levels of 2015.
2016 global leasing volumes slated to be 5% lower than 2015
Weaker business sentiment, economic uncertainty and continued political risks are nonetheless forecast to dampen
leasing volume growth for the remainder of 2016. Our latest projection for the full-year 2016 indicates that global leasing
volumes will be about 5% lower than the peak of 40.9 million square metres in 2015. This is not a poor result, however –
at around 39 million square metres in 2016, volumes are still expected to be higher than at any time between 2008 and
2014.
Europe is likely to see volumes in 2016 down by 5%-10% on 2015 levels, largely due to a weaker UK market. At this
stage, we anticipate that markets in Americas and Asia Pacific will be generally well insulated from the immediate Brexit
fallout. In Asia Pacific, our forecast of leasing volume growth in 2016 has been downgraded to 0%-5%, reflecting the
delayed impact of stock market volatility and concerns over China’s slowdown. In the United States, volumes are
projected to be about 5% lower than 2015 in line with slowing jobs’ growth.
‘Business as usual’ in the United States
In the United States, it has been ‘business as usual’ in the office leasing markets. Quarterly leasing activity rebounded
by 18% during Q2, quelling concerns that the first quarter was the start of a broader slowdown in the office market.
38% of total leasing volumes was in the country’s primary markets - New York, Washington DC, Boston,
Chicago and Los Angeles - where major leases were signed by UBS (New York’s Plaza District), McDonald’s
(Chicago CBD’s Fulton Market), Demandware (Boston’s Northwest suburbs), FAA (Los Angeles’ South Bay)
and Ernst & Young (Washington DC’s East End).
Fears of a slowdown in the U.S. technology sector – one of the drivers of growth this cycle – have abated.
There is strong demand in popular tech markets, including Boston and Seattle, and Sunbelt markets such as
Dallas and Phoenix.
Global Market Perspective, Third Quarter 2016
COPYRIGHT © JONES LANG LASALLE IP, INC. 2016. All Rights Reserved 19
Overall, financial services, along with scientific/technical companies, remained the top sectors propelling
leasing activity in Q2, although the most notable instances of contraction activity were among financial services
tenants.
Continental European leasing markets are remarkably resilient
Q2 2016 office leasing volumes in Europe were down 3% year-on-year, although annual comparisons were always going
to be unflattering due to the exceptionally robust Q2 2015 (highest since 2007). Indeed, the 2.9 million square metres of
office space transacted in Q2 was well ahead of the 10-year average, and H1 2016 volumes came in 5% higher than H1
2015.
Excluding the UK, European take-up grew by 10% year-on-year in H1, a strong sign of the upbeat sentiment on the
continent. While leasing activity in London has clearly been affected in the run-up to and following the EU referendum,
the general attitude elsewhere in European leasing markets is one of ‘business as usual’ with levels of activity similar to
recent quarters.
In Germany the combined H1 take-up for the five largest markets was up 12% in H1 2016 year-on-year.
Berlin, Munich and Frankfurt were the outperformers. While we do not anticipate any significant acceleration
of growth in the German leasing market, current take-up levels are very strong and well ahead of the long-term
average.
In Paris the recovery in occupier activity continued apace in the first half of 2016, with take-up rising by 20%
year-on-year. Aside from a healthy number of large leasing transactions, the notable increase in small to
medium-size transactions in particular points to a more broad-based improvement in corporate
confidence/sentiment.
London office demand has cooled. In the lead-up to the referendum, leasing volumes fell by one-third in H1
compared to a year ago. Following the vote to leave the European Union, occupiers are taking stock; however,
encouragingly, existing requirements are largely continuing as planned with very few deals being withdrawn.
Nevertheless, occupier decisions are taking longer and take-up is likely to remain subdued in H2 as Brexit
uncertainties persist.
There remains speculation that some London occupiers will investigate options elsewhere in Europe, but
corporate occupiers are likely to wait until there is clarity on the new UK settlement with the EU.
In Southern Europe the momentum of the market recovery in H1 2016 has continued in Milan (+29% year-on-
year), but has tailed off in Madrid and Barcelona (-7%).
Our current forecast of 11.1 million square metres for European leasing volumes for full-year 2016 represents a 5%-10%
decrease on 2015. However, on the back of the strong activity in the first half of the year, there is some upside potential
to the full-year 2016 take-up forecast if the current acceleration of occupier activity is maintained.
COPYRIGHT © JONES LANG LASALLE IP, INC. 2016. All Rights Reserved 20
Global Market Perspective, Third Quarter 2016
Asia Pacific forecasts downgraded
In Asia Pacific, concerns over the pace of economic growth in its two largest economies – China and Japan – combined
with Brexit anxieties, are weighing on corporate occupier sentiment. Gross leasing volumes during H1 2016 were down
by 4% year-on-year, largely due to a weakening of demand in China and India’s Tier 1 cities.
Shanghai and Beijing saw volumes down 40%-50% in H1 compared to a year ago, although this is partly due
to lower supply.
India’s leasing volumes declined by 20% year-on-year in H1, to some extent due to a lack of available space in
Bangalore (H1 volumes were down 36% on last year) but also because of a slowdown in demand from e-
commerce firms.
On the flip side, a number of markets have recorded solid growth in leasing. Tokyo achieved the highest
volumes in the region bolstered by large ticket pre-commitments (H1 volumes were up 93% year-on-year).
Hong Kong volumes have also expanded strongly (+41% year-on-year in H1), supported by PRC financials
and cost-saving relocations.
Manila continues to be a favoured location for BPO with H1 volumes up 42% year-on-year.
Singapore leasing volumes have improved, with a number of pre-commitments and take-up in newer buildings.
In Australia, overall leasing volumes fell by 5% in H1, but this masks a large variation between cities. Sydney
has continued its good run of growth (H1 volumes up 35% year-on-year), with activity boosted by traditional
occupier groups such as finance, insurance and professional service firms. By contrast, demand is particularly
subdued in Perth and Adelaide (due to ongoing weaknesses in the local economies).
Given the year-to-date result for leasing volumes and the increased economic uncertainties both in the region and
globally, the full-year 2016 forecast has been revised down to 0%-5% growth (from 10%-15% in April 2016).
Global Market Perspective, Third Quarter 2016
COPYRIGHT © JONES LANG LASALLE IP, INC. 2016. All Rights Reserved 21
Global Office Demand – Annual Gross Leasing Volumes, 2007-2016
24 markets in Europe; 44 markets in the U.S.; 22 markets in Asia Pacific Source: JLL, July 2016
Global Office Demand – Quarterly Gross Leasing Volumes, 2012-2016
24 markets in Europe; 44 markets in the U.S; 22 markets in Asia Pacific Source: JLL, July 2016
30
31
32
33
34
35
36
37
38
39
40
41
42
43
2007 2008 2009 2010 2011 2012 2013 2014 2015 2016
mill
ions
sq
m
Pro
ject
ion
7.0
7.5
8.0
8.5
9.0
9.5
10.0
10.5
11.0
Q112 Q212 Q312 Q412 Q113 Q213 Q313 Q413 Q114 Q214 Q314 Q414 Q115 Q215 Q315 Q415 Q116 Q216
mill
ions
sq
m
COPYRIGHT © JONES LANG LASALLE IP, INC. 2016. All Rights Reserved 22
Global Market Perspective, Third Quarter 2016
Office Supply Trends
Office supply continues to tighten
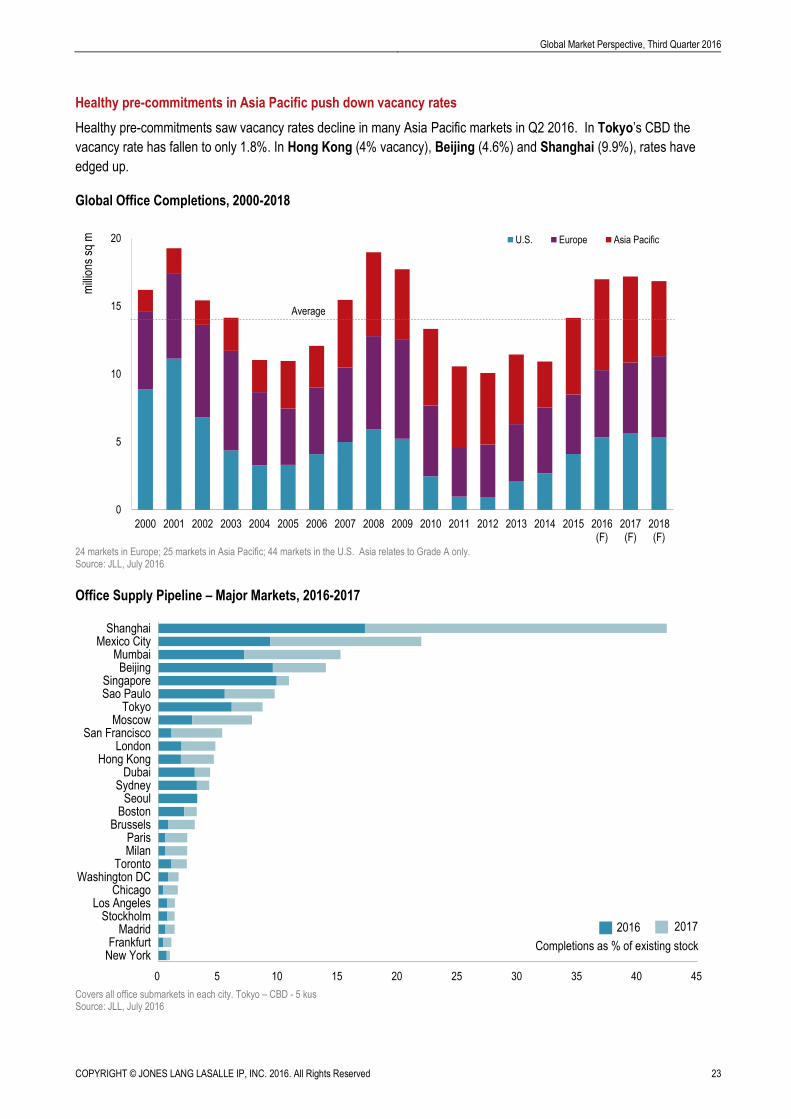
Office supply continues to tighten across the globe. The global office vacancy rate fell by 10 bps in Q2 to 12.1% and is
now at its lowest level since Q4 2008. Vacancy rates are trending down in the United States and Europe at 14.6% and
8.6% respectively, and further modest falls are anticipated during the second half of the year. The regional vacancy rate
in Asia Pacific has hovered in the range of 10.7%-10.9% range since 2014, but is expected to rise above 11% by the
end of the year.
A shallow development cycle
Construction levels are still rising. 2017 is likely to be the peak of the current development cycle, with more schemes
being pushed into 2017 and 2018 as some developers postpone ground-breaking. The current development cycle is
proving to be shallower than previous cycles.
Concerns of overbuilding in the United States are low
In the United States, office construction is at its highest point in the current cycle at 9.4 million square metres. It is
unlikely, however, that the development pipeline will become much larger and, with a pre-lease rate of 51% and with
two-thirds of construction concentrated in just 10 U.S. cities, fears of overbuilding continue to be low. Risks of
oversupply remain muted outside of Houston and sublease vacancy has yet to show signs of increasing.
U.S. vacancy nearing its cyclical low
Supply constraints continue to plague the U.S. market, with overall net absorption still exceeding new completions.
Space is particularly hard to come by in ‘New World Cities’ such as San Francisco, Portland and Seattle, and aspiring
ones like Nashville and Salt Lake City.
At 14.6%, the total U.S. vacancy rate is nearing its cyclical low. However, in secondary cities where new supply remains
limited but tenant demand is high, vacancy is likely to constrict below pre-recession levels, most notably in Columbus,
Oakland-East Bay, Portland and Raleigh-Durham.
Europe supply tightens
Office vacancy in Europe was stable at 8.6% in Q2 2016, the lowest level since Q1 2009. Even with the majority of the
2016 development pipeline yet to be completed, we expect most office markets to tighten further in 2016 due to robust
demand dynamics.
In Germany, just 350,000 square metres of new office space was completed in H1 2016 (in the five largest markets) and
with 75% of the 635,000 square metres due for completion in H2 already committed, further falls in the German vacancy
rate are probable. In Berlin, in particular, vigorous demand for office space continues to erode the development
pipeline.
The outcome of the EU referendum has amplified concerns around the substantial development pipeline in London.
The vacancy rate increased by 30 bps in Q2 but, at 3.7%, London is by far the tightest market in Europe. While the 1.1
million square metres of office space due to be completed in 2016-2017 will push up vacancy rates, no supply shock is
anticipated. In fact, the current uncertainty may deter developers from commencing speculative schemes in H2.
Elsewhere in Western Europe, development remains relatively limited and, with restricted financing for speculative
development, especially in late cyclical markets, we do not expect a structural uplift in European vacancy.
Global Market Perspective, Third Quarter 2016
COPYRIGHT © JONES LANG LASALLE IP, INC. 2016. All Rights Reserved 23
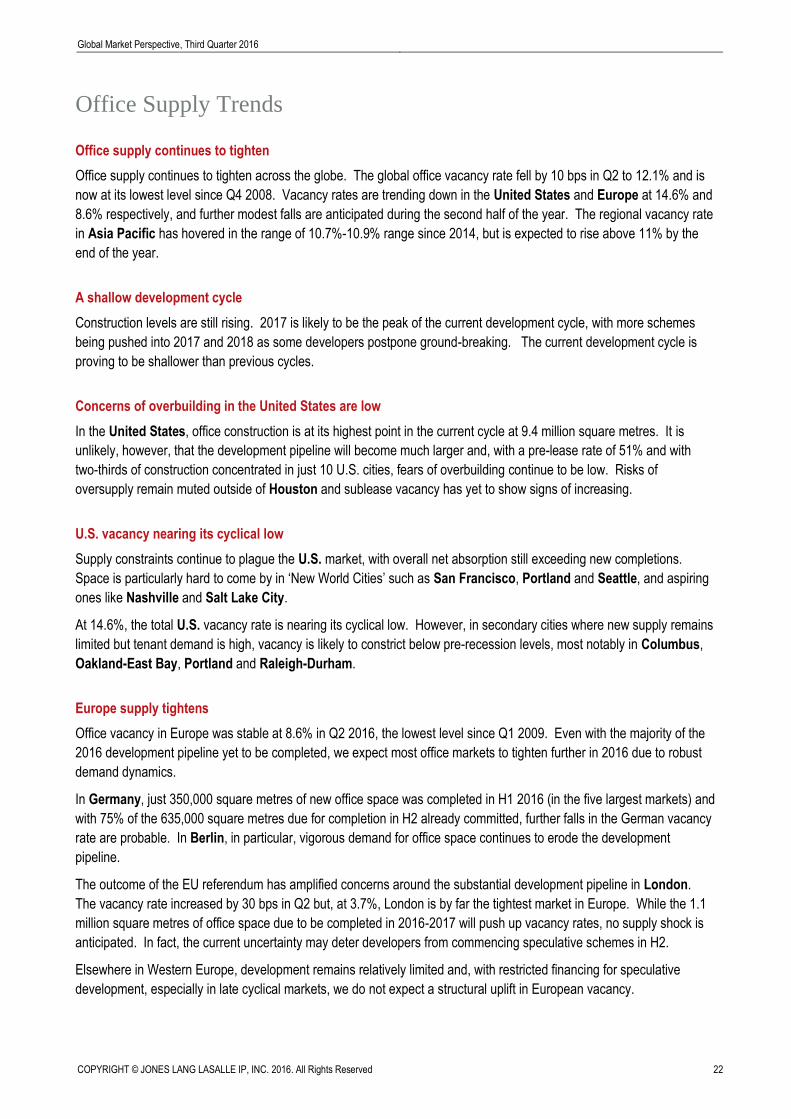
Healthy pre-commitments in Asia Pacific push down vacancy rates
Healthy pre-commitments saw vacancy rates decline in many Asia Pacific markets in Q2 2016. In Tokyo’s CBD the
vacancy rate has fallen to only 1.8%. In Hong Kong (4% vacancy), Beijing (4.6%) and Shanghai (9.9%), rates have
edged up.
Global Office Completions, 2000-2018
24 markets in Europe; 25 markets in Asia Pacific; 44 markets in the U.S. Asia relates to Grade A only. Source: JLL, July 2016
Office Supply Pipeline – Major Markets, 2016-2017
Covers all office submarkets in each city. Tokyo – CBD - 5 kus Source: JLL, July 2016
0
5
10
15
20
2000 2001 2002 2003 2004 2005 2006 2007 2008 2009 2010 2011 2012 2013 2014 2015 2016(F)
2017(F)
2018(F)
U.S. Europe Asia Pacific
mill
ions
sq
m
Average
0 5 10 15 20 25 30 35 40 45
New YorkFrankfurt
MadridStockholm
Los AngelesChicago
Washington DCToronto
MilanParis
BrusselsBoston
SeoulSydney
DubaiHong Kong
LondonSan Francisco
MoscowTokyo
Sao PauloSingapore
BeijingMumbai
Mexico CityShanghai
Completions as % of existing stock
2016 2017
COPYRIGHT © JONES LANG LASALLE IP, INC. 2016. All Rights Reserved 24
Global Market Perspective, Third Quarter 2016
Office Vacancy Rates in Major Markets, Q2 2016
Regional vacancy rates based on 49 markets in the Americas, 24 markets in Europe and 24 markets in Asia Pacific. Covers all office submarkets in each city. All grades except Asia and Latin America (Grade A only). Tokyo relates to CBD – 5 kus. Source: JLL, July 2016
Global and Regional Office Vacancy Rates, 2009-2016
44 markets in the Americas, 24 markets in Europe, 25 markets in Asia Pacific. Grade A space vacancy only for Asian markets. Source: JLL, July 2016
0%
5%
10%
15%
20%
25%
30%
San
Fra
nci
sco
New
Yo
rk
To
ron
to
Bo
sto
n
Mex
ico
Cit
y
Ch
icag
o
Lo
s A
ng
eles
Was
hin
gto
n D
C
Sao
Pau
lo
Lo
nd
on
Par
is
Sto
ckh
olm
Bru
ssel
s
Fra
nkf
urt
Mad
rid
Mila
n
Mo
sco
w
To
kyo
Ho
ng
Ko
ng
Bei
jing
Sin
gap
ore
Syd
ney
Sh
ang
hai
Seo
ul
Mu
mb
ai
Europe 8.6% Asia Pacific 10.9%Americas 14.6%
Quarterly movement
Increased
Decreased
Stable
Global 12.1%
8
10
12
14
16
18
Q4
2009
Q1
2010
Q2
2010
Q3
2010
Q4
2010
Q1
2011
Q2
2011
Q3
2011
Q4
2011
Q1
2012
Q2
2012
Q3
2012
Q4
2012
Q1
2013
Q2
2013
Q3
2013
Q4
2013
Q1
2014
Q2
2014
Q3
2014
Q4
2014
Q1
2015
Q2
2015
Q3
2015
Q4
2015
Q1
2016
Q2
2016
Vac
ancy
Rat
e (%
)
Americas
Asia Pacific
Europe
GLOBAL
17.9%
14.6%14.4%
12.1%11.9%
10.9%
11.9%
10.3%
8.6%
Global Market Perspective, Third Quarter 2016
COPYRIGHT © JONES LANG LASALLE IP, INC. 2016. All Rights Reserved 25
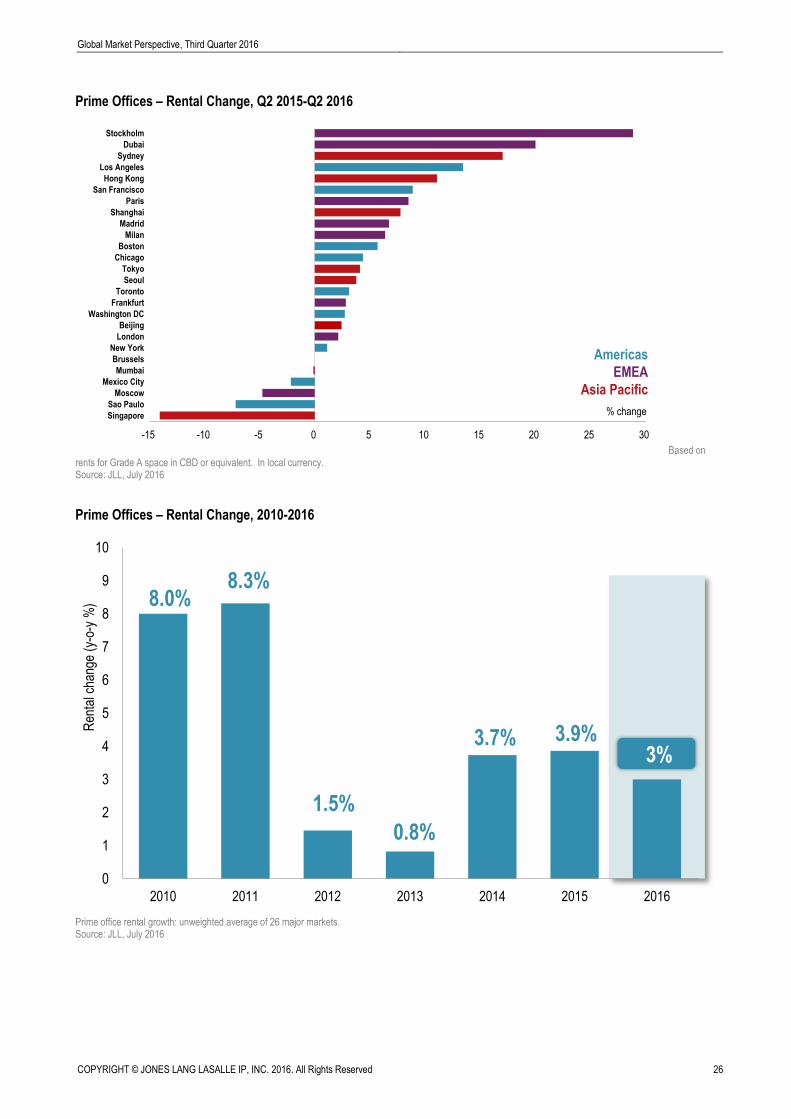
Office Rental Trends
Continued upward momentum in prime office rents
Supply constraints continue to boost rents for prime office space in most of the dominant office markets. 19 out of 26
major office markets have recorded rental growth over the past 12 months, growing by an average of 5.1%. A few have
seen double-digit annual rates, notably Stockholm (+29% year-on-year), Dubai-DIFC (+20%), Sydney (+17%), Los
Angeles (+13.5%) and Hong Kong (+11%).
There are signs that aggregate rental growth is beginning to soften in 2016, particularly as London is forecast to move
into negative territory during the second half of the year. Rental growth is expected to slow to around 3% for the full-year
across 26 major cities.
Some U.S. markets see decelerating rental growth
Asking rents in the United States rose by just 1% during Q2 2016, as ‘hot’ occupier markets like Austin, Denver,
Silicon Valley and San Francisco decelerate from rapid but unsustainable rental growth seen earlier in the cycle.
Rental growth is projected to moderate over the next 12-18 months, especially in primary markets, although landlords
are expected to maintain the upper hand in lease negotiations through 2017. Growth for the remainder of the cycle will
be most pronounced in favoured secondary markets and where new supply comes online. For example, Oakland-East
Bay, Nashville and Miami have recorded double-digit rental growth since the beginning of the year.
Rental growth accelerates in Europe
The European Office Index for rents grew by 1.8% quarter-on-quarter in Q2 2016, the strongest increase in five years. A
key driver behind the significant jump in the European aggregate was the quarterly uptick in rents recorded in
Stockholm (+9.4%), Berlin (+6.3%) and Paris (+3.4%).
Stockholm is the star performer with rents climbing by 28.9% over the past year.
Steady rental growth has been registered in Paris (+8.5% year-on-year), Madrid (+6.7%) and Milan (+6.4%).
The German cities have been led by Berlin (+10.9%).
In London, headline rents have so far remained unchanged. Rent-free periods may soften as occupiers look to
negotiate more flexible terms with greater lease flexibility. Rental growth is predicted to move into negative
territory during the second half of the year, but low vacancy coupled with an increasingly diverse occupier base
should prevent a substantial fall in rents.
Rental growth moderates across Asia Pacific
In aggregate, Asia Pacific rents increased by 0.6% quarter-on-quarter in Q2 2016, matching growth in the first quarter:
Ongoing tech demand and lack of space led to Bangalore (+4.8%) achieving the region’s strongest quarterly
rental growth. On an annual basis, Sydney outperformed the rest of Asia Pacific with growth of 17.1%.
In China, the clampdown on peer-to-peer lending and cost-saving strategies saw rental growth slow in
Shanghai and rents fall marginally in Beijing.
Anticipation of a large upcoming supply contributed to an only marginal uplift in Tokyo, despite strong leasing
and very low vacancy.
In Singapore, on the back of large supply and ongoing banking consolidation, rents declined by 3.3% during
the quarter, contributing to a 14.1% year-on-year decline.
COPYRIGHT © JONES LANG LASALLE IP, INC. 2016. All Rights Reserved 26
Global Market Perspective, Third Quarter 2016
Prime Offices – Rental Change, Q2 2015-Q2 2016
Based on rents for Grade A space in CBD or equivalent. In local currency. Source: JLL, July 2016
Prime Offices – Rental Change, 2010-2016
Prime office rental growth: unweighted average of 26 major markets. Source: JLL, July 2016
-15 -10 -5 0 5 10 15 20 25 30
Singapore
Sao Paulo
Moscow
Mexico City
Mumbai
Brussels
New York
London
Beijing
Washington DC
Frankfurt
Toronto
Seoul
Tokyo
Chicago
Boston
Milan
Madrid
Shanghai
Paris
San Francisco
Hong Kong
Los Angeles
Sydney
Dubai
Stockholm
% change
Americas
EMEA
Asia Pacific
0
1
2
3
4
5
6
7
8
9
10
2010 2011 2012 2013 2014 2015 2016
8.3%8.0%
1.5%
0.8%
Ren
tal c
hang
e (y
-o-y
%)
3%3.7% 3.9%
Global Market Perspective, Third Quarter 2016
COPYRIGHT © JONES LANG LASALLE IP, INC. 2016. All Rights Reserved 27
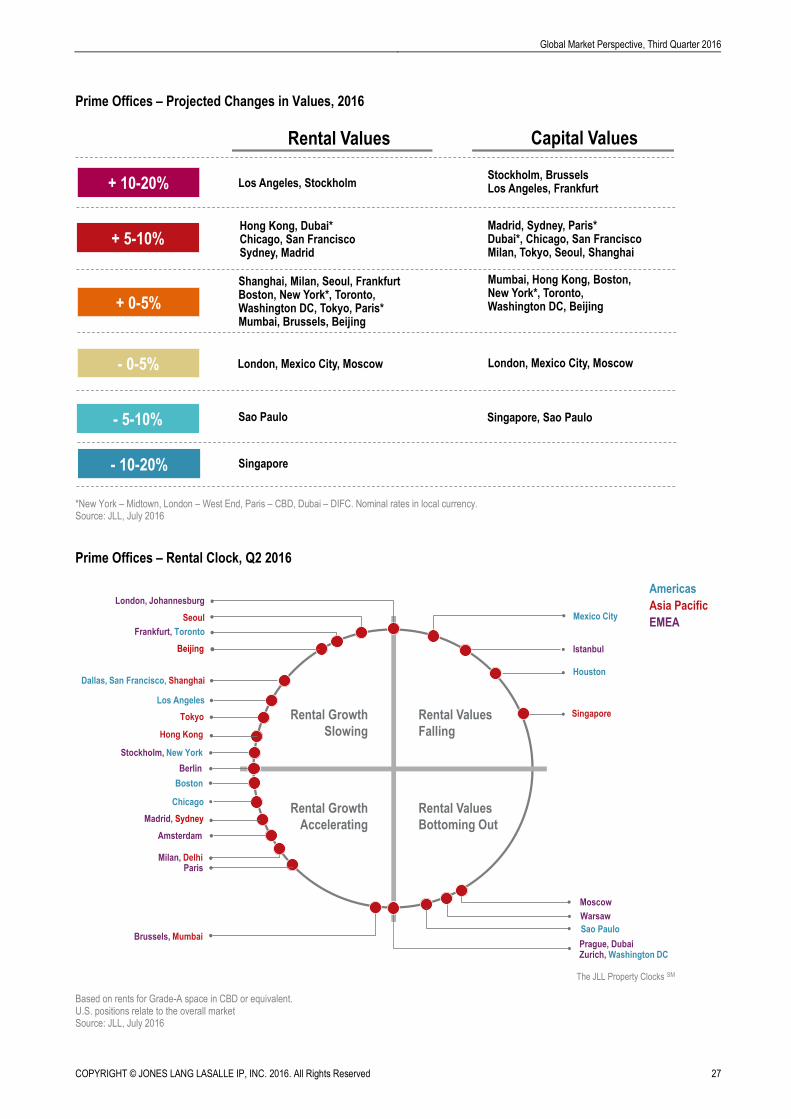
Prime Offices – Projected Changes in Values, 2016
*New York – Midtown, London – West End, Paris – CBD, Dubai – DIFC. Nominal rates in local currency. Source: JLL, July 2016
Prime Offices – Rental Clock, Q2 2016
Based on rents for Grade-A space in CBD or equivalent. U.S. positions relate to the overall market Source: JLL, July 2016
+ 10-20%
+ 5-10%
+ 0-5%
- 0-5%
- 5-10%
Hong Kong, Dubai* Chicago, San Francisco Sydney, Madrid
Capital ValuesRental Values
Shanghai, Milan, Seoul, FrankfurtBoston, New York*, Toronto,Washington DC, Tokyo, Paris*Mumbai, Brussels, Beijing
Stockholm, BrusselsLos Angeles, Frankfurt
Madrid, Sydney, Paris* Dubai*, Chicago, San FranciscoMilan, Tokyo, Seoul, Shanghai
Mumbai, Hong Kong, Boston, New York*, Toronto, Washington DC, Beijing
London, Mexico City, Moscow
- 10-20%
Sao Paulo Singapore, Sao Paulo
London, Mexico City, Moscow
Singapore
Los Angeles, Stockholm
Rental Values
Bottoming Out
Rental Growth
Slowing
Rental Values
Falling
Rental Growth
Accelerating
The JLL Property Clocks SM
Americas
Asia Pacific
EMEA
Berlin
Prague, DubaiZurich, Washington DC
Moscow
Milan, DelhiParis
Frankfurt, Toronto
Seoul
HoustonDallas, San Francisco, Shanghai
Warsaw
London, Johannesburg
Singapore
Brussels, Mumbai
Amsterdam
Los Angeles
Hong Kong
Boston
Madrid, Sydney
Beijing
Mexico City
Stockholm, New York
Istanbul
Sao Paulo
Chicago
Tokyo
COPYRIGHT © JONES LANG LASALLE IP, INC. 2016. All Rights Reserved 28
Global Market Perspective, Third Quarter 2016
Retail Markets
Solid rental growth in premier U.S. markets
The United States retail market continued its steady growth trend in Q2 2016, with nearly 50 million square feet
absorbed, more than twice the amount absorbed in the previous quarter. A combination of modest absorption and
relatively low construction levels has pushed vacancy down slightly from 5.5% in Q1 to 5.3% this quarter. In major
markets, where vacancy rates are slightly lower at 5.0%, average weighted quoted rents grew by 2.4% over Q2 – a pace
greater than the overall national retail market. Major global gateway and tourist markets continue to lead the nation in
low vacancy rates; standout markets include San Francisco (2.0% vacancy), Miami (3.1%) and Boston (3.4 %.)
Prime space in high demand across Europe despite uncertainty
International retailer demand remains concentrated in Europe’s top-tier cities as they continue to demonstrate resilience.
We expect prime areas across Europe to strengthen further and new retail pockets to keep emerging in larger cities.
Prime rents in Paris, which continues as Europe’s most expensive city, now stand at €22,000 per square metre, 20%
above last year’s value. During Q2, strong rental growth was witnessed in a number of German cities: Hamburg SC
(+10% year-on-year), Berlin HS (+9.4%), Cologne SC (+7.1%) and in London HS (+5.9%). Looking forward, we
forecast prime rents in London to continue to rise despite the uncertainty following the EU referendum, while more
secondary locations in the UK may suffer. In addition, Dublin, Stockholm as well as the German cities of Hamburg,
Dusseldorf, Berlin and Munich are expected to experience the strongest growth in the next 18 months.
F&B major contributor to demand in Asia
Demand drivers remained largely in line with recent quarters in China’s major markets in Q2 2016, with F&B the main
driver while children’s brands were active in select malls. Landlords of high street shops in Hong Kong continued to cut
rents to lease space, while mall landlords are being proactive about adjusting tenant mixes with an increased focus on
F&B. Generally healthy demand was witnessed in Tokyo’s prime areas, but some retailers have been guarded about
new stores amid slower sales growth. In Singapore the ongoing labour crunch and cautious spending intentions of
consumers impacted retailer demand in the second quarter. Meanwhile, international retailers continued to be a key
driver of leasing activity in Australia.
Average rental growth in Q2 was similar to the previous quarter, but further falls were recorded in the Singapore and
Hong Kong high streets. Overall, prime malls in Hong Kong saw relatively stable rents, but high-quality centres have
performed better thanks to adjustments in leasing strategies. Supply pressures have impacted rental growth in
Shanghai.
Global Market Perspective, Third Quarter 2016
COPYRIGHT © JONES LANG LASALLE IP, INC. 2016. All Rights Reserved 29
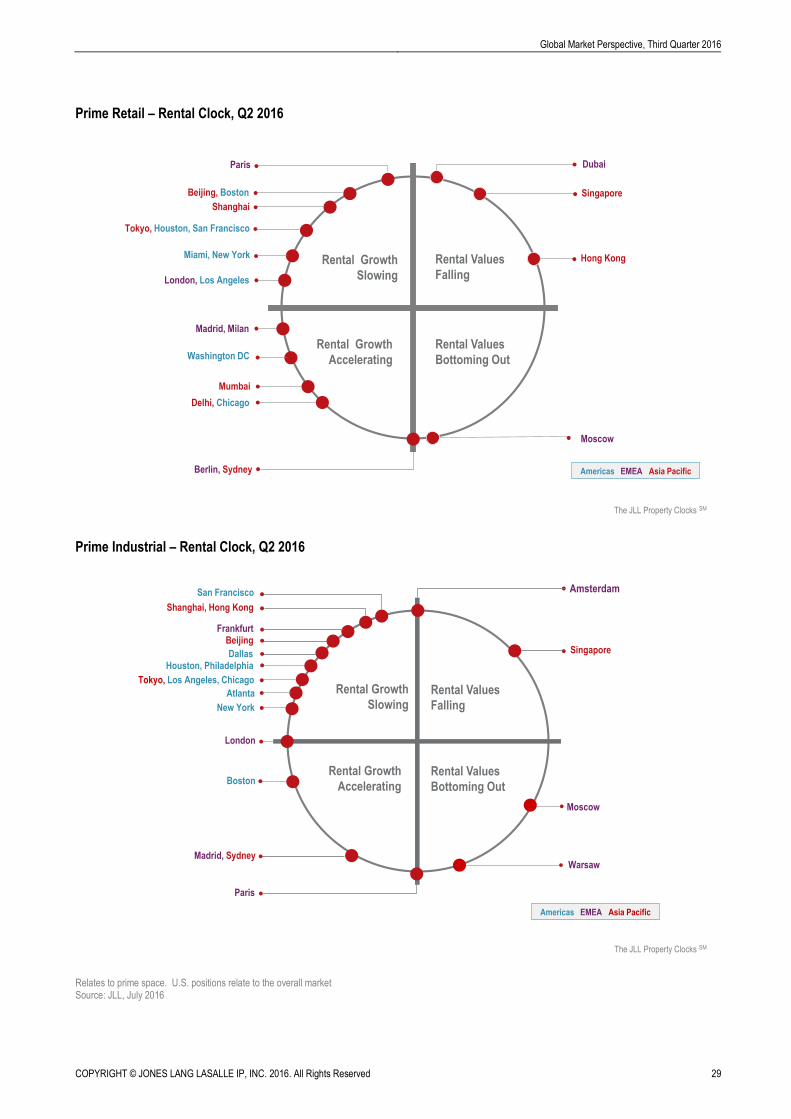
Prime Retail – Rental Clock, Q2 2016
Prime Industrial – Rental Clock, Q2 2016
Relates to prime space. U.S. positions relate to the overall market Source: JLL, July 2016
Rental Growth
Slowing
Rental Values
Falling
Rental Growth
Accelerating
Rental Values
Bottoming Out
Americas EMEA Asia Pacific
Delhi, Chicago
Mumbai
Singapore
Madrid, Milan
Dubai
Beijing, Boston
Berlin, Sydney
Moscow
Tokyo, Houston, San Francisco
London, Los Angeles
The JLL Property Clocks SM
Paris
Shanghai
Washington DC
Miami, New York Hong Kong
Rental Growth
SlowingRental Values
Falling
Rental Values
Bottoming Out
Warsaw
Americas EMEA Asia Pacific
Rental Growth
Accelerating
Paris
Boston
Frankfurt
London
Amsterdam
Tokyo, Los Angeles, Chicago
Shanghai, Hong Kong
Madrid, Sydney
Moscow
The JLL Property Clocks SM
SingaporeDallas
San Francisco
New York
Atlanta
Houston, Philadelphia
Beijing
COPYRIGHT © JONES LANG LASALLE IP, INC. 2016. All Rights Reserved 30
Global Market Perspective, Third Quarter 2016
Industrial Warehousing Markets
U.S. industrial market in stellar health
The pipeline of new industrial construction in the United States expanded by 7.3% on the previous quarter, with
speculative completions also increasing in Q2 2016, up by 13.4% quarter-over-quarter – but 36% of this new space was
pre-leased before delivery (up from prior quarters). Despite the rise in new speculative completions, robust net
absorption levels and higher pre-leasing rates have helped keep the U.S. vacancy rate stable, with the overall vacancy
rate falling by 20 bps to 6.0% in Q2. As tenants look to remain in close proximity to the city cores, redevelopments and
conversions of older industrial product are also expected to increase.
U.S. industrial outlook optimistic
Moving forward, we will be watching to see if development maintains its current pace. Through the remainder of the
year, if tenant demand remains fairly stable across most markets, landlords will continue to enjoy a steady pipeline of
leasing activity. Falling vacancy and an increase in new supply will keep pushing rents upwards as we move into the
second half of 2016.
Demand continues to outstrip supply in European logistics markets
European logistics markets witnessed another quarter of above-average occupier activity in Q2 2016, partly driven by
companies shifting their networks towards new omni-channel distribution models. JLL maintains a positive outlook for
total 2016 take-up, although the UK’s vote in favour of Brexit has heightened uncertainty in one of Europe’s largest
occupier markets for logistics. However, the need for corporates to restructure supply chain networks in order to remain
competitive persists and should make occupier demand for logistics space relatively resilient.
Development activity continued to be fairly stable over the quarter with new warehousing space under construction still
significantly above the five-year average. Nevertheless, available supply continues to edge down as new construction
remains heavily driven by Build-to-Suit (BTS) developments. We expect the European average vacancy rate to drop to a
cyclical low of around 6% by the end of the year, with vacant space covering just 10-months of occupier demand based
on 2015 take-up. Combined with rising land scarcity (in particular for larger units), growing resistance to grant planning
permission for large-scale warehouses and higher land prices for units close to cities, the risk of a looming supply
shortage is more pronounced.
We maintain our projections of a further hardening in rental conditions over the course of the year as most markets are
now firmly landlord-favourable. However, the overall rental growth potential will remain limited, partly due to competitive
rents available in the BTS market.
Third-party logistics and e-commerce firms support demand in Asia Pacific
Logistics demand in Q2 2106 continued to be supported by third-party logistics providers and e-commerce firms in Asia
Pacific. Existing tenants in Hong Kong became more conservative during lease renewals amid weakness in external
trade. Stronger-than-expected demand from third-party logistics companies and e-retailers was witnessed in Tokyo,
while pre-commitments for logistics space were moderately healthy in Singapore, although overall trade and export
figures remained weak. Occupier take-up in Q2 was fairly subdued overall in Australia, particularly outside of the
Sydney and Melbourne markets.
Rents were muted across the Asia Pacific region in the second quarter, with rental growth slowing in Shanghai and
Tokyo as new completions commanded lower-than-average rents. Rents remained largely flat in Hong Kong with the
ongoing weakness in external trade capping growth. In Australia, rental growth was generally passive owing to
competition for pre-lease deals in most markets and elevated vacancy in select submarkets.
Global Market Perspective, Third Quarter 2016
COPYRIGHT © JONES LANG LASALLE IP, INC. 2016. All Rights Reserved 31
Hotel Markets
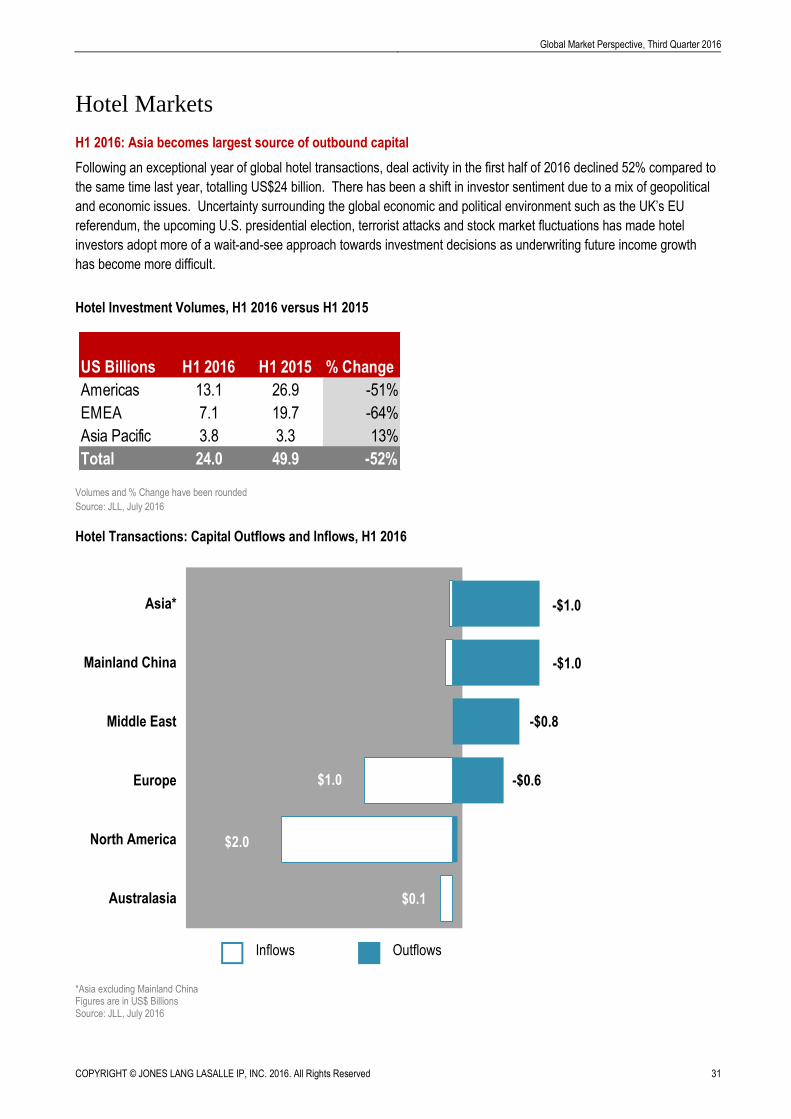
H1 2016: Asia becomes largest source of outbound capital
Following an exceptional year of global hotel transactions, deal activity in the first half of 2016 declined 52% compared to
the same time last year, totalling US$24 billion. There has been a shift in investor sentiment due to a mix of geopolitical
and economic issues. Uncertainty surrounding the global economic and political environment such as the UK’s EU
referendum, the upcoming U.S. presidential election, terrorist attacks and stock market fluctuations has made hotel
investors adopt more of a wait-and-see approach towards investment decisions as underwriting future income growth
has become more difficult.
Hotel Investment Volumes, H1 2016 versus H1 2015
Volumes and % Change have been rounded
Source: JLL, July 2016
Hotel Transactions: Capital Outflows and Inflows, H1 2016
*Asia excluding Mainland China Figures are in US$ Billions Source: JLL, July 2016
US Billions H1 2016 H1 2015 % Change
Americas 13.1 26.9 -51%
EMEA 7.1 19.7 -64%
Asia Pacific 3.8 3.3 13%
Total 24.0 49.9 -52%
-$0.6
-$0.8
-$1.0
-$1.0
$0.1
$2.0
$1.0
Australasia
North America
Europe
Middle East
Mainland China
Asia*
Inflows Outflows

COPYRIGHT © JONES LANG LASALLE IP, INC. 2016. All Rights Reserved 32
Global Market Perspective, Third Quarter 2016
Chinese outbound hotel investment overtakes Middle East
The first six months of 2016 saw US$1 billion of Chinese capital flowing into global hotel real estate, overtaking the
Middle East in terms of outbound hotel investment. Despite slowing economic growth in China, there is still appetite for
offshore hotel investments from China. In fact, the recent stock market fluctuation has highlighted the benefits of income
diversification through overseas investments. In addition, the Chinese government has deployed policies which have
encouraged investment abroad. This marks a sign of the country’s long-term strategy to secure income through
investing globally, notwithstanding that the pace of outbound investment has slowed over the past nine months.
As Chinese buyers become more knowledgeable about the lodging sector, their focus has widened from individual hotel
assets to broader hospitality-related products. This is evident through a number of high-profile transactions such as the
announced sale of Carlson Hotels to HNA, the acquisition of Kew Green Hotels by HK CTS, Fosun’s increased stake in
British travel company Thomas Cook, and Anbang’s planned purchase of Strategic Hotels & Resorts.
Besides Chinese insurance companies that have already targeted the hotel market, private high-net-worth investors,
developers and industrialists are increasingly showing their interest. Examples include Shanghai Yudu Group, a
construction and property development company, which has purchased the Marriott Los Angeles Airport and Nanshan
Group, a privately-owned Chinese conglomerate, which has bought the Pullman Sydney Airport for US$61 million.
Pension funds and sovereign wealth funds are increasing exposure to real estate
Institutional investors, such as pension funds, have received a heightened amount of capital from domestic savings
contributed by an ageing population. As a result, they are increasing their exposure to direct hotel investment as their
allocation towards real estate increases. Recently priced transactions include the sale of the Interhotel portfolio in
Germany to Foncière des Murs. In addition, the LondonHouse Chicago has been acquired by Union Investment from
Oxford Capital Group. Open-ended funds require lease structures and are therefore insulated to an extent from the
trading fluctuations of individual assets. These funds have frequently invested heavily during contracyclical market
movements.
Impact of Brexit on the UK market
Despite the referendum vote for the UK to leave the EU, market fundamentals in the UK should remain largely
unchanged in the short term. The recent weakening of the pound may induce inbound travel to the UK. Immediately
after the referendum, China’s leading online travel agency, Ctrip, saw the number of searches for UK holidays triple.
Kayak also reported a 54% uplift in searches for flights from the U.S. to the UK.
In terms of investment into the hotel sector, there may be a repricing of hotel assets, as a result of both reduced trading
expectations and, despite potentially lower base rates, increased lending costs. Opportunistic investors are taking
advantage of the weaker pound. Chinese investor Fosun recently increased its stake in Thomas Cook after the share
price fell by more than 20%.
Moreover, a group of Hong Kong-based investors acquired the Travelodge Royal Scot Hotel in Kings Cross London on
the day of the referendum, confirming ongoing appetite from Asian investors. At the same time, we have seen an
increase in enquiries from other opportunistic Asian investors. The UK hospitality market is widely sought-after and while
there may be a pricing correction of hotel assets, investors will continue to look for opportunities.
Global Market Perspective, Third Quarter 2016
COPYRIGHT © JONES LANG LASALLE IP, INC. 2016. All Rights Reserved 33
New York, the most liquid city in the world
In the first half of 2016, investment activity in the Americas totalled US$13.1 billion, down 51% from same time last year.
There has been a significant decline in portfolio transactions, with volumes down 76%, while single-asset sales have
fallen by 34% to stand at US$10.4 billion.
Private equity investors remain the largest buyer group, accounting for 37% of investments. For the first time in five
years, REITs have become net sellers, placing a considerable number of assets on the market for sale. While REITs’
purchase activity is down, the hotel and lodging REITs Index has rallied approximately 32% since its recent low in mid-
January 2016.
New York continues to be the most liquid city in the world, with transactions reaching US$2.3 billion as of June 2016.
The ‘Big Apple’ is one of the most attractive business and tourism centres in the United States, with a record 58.3
million visitors in 2015. The market has received an equal amount of interest from both domestic and international
buyers, a trend we anticipate to continue for the rest of 2016. Key transactions in 2016 to date include the portfolio sale
of seven hotels from Hersha Hospitality to China-based investment management platform Cindat Capital Management
for US$574.1 million, and the US$320 million sale of the Virgin Hotel New York from Lam Group to property developer
Morgan Management.
Other cities which have seen an uptick in hotel investment sales include Washington DC and Chicago. We expect the
U.S. to continue to attract a significant amount of inbound capital.
Japan remains in the spotlight in Asia Pacific
Six months into 2016, hotel investment sales in Asia Pacific have reached US$3.8 billion with the region experiencing a
13% uplift in transactions compared to other regions. Japan remains the star performer, accounting for over half of
transaction volumes. The country reported US$2.2 billion worth of transactions in H1 2016, an impressive 83% uplift
from the prior year. The US$604.7 million sale of the Grand Pacific Le Daiba Tokyo from Keikyu Corporation to Hulic
Co., Ltd has marked the largest transaction within Asia Pacific in 2016 to date.
In terms of buyer profiles, Japan has traditionally been dominated by domestic buyers; J-REITs accounted for nearly half
of sales activities in H1 2016. However, the country is also catching the eye of mainland Chinese investors due to the
recent influx of Chinese tourists, reflected in the Greenland Group’s move in early 2016 to acquire Candeo Hotels in
Chiba in the Greater Tokyo area.
After a record year of transactions in 2015, volumes across Australia softened by 35% in H1 2016, in part because of
the amount of high-quality stock that has been traded recently; in addition there is a lack of hotels available for sale. The
Australian hotel market continues to receive significant interest from mainland Chinese investors, to some extent due to
the China-Australia Free Trade agreement which allows a larger investment threshold for Chinese to invest in Australia.
A recent example is the sale of Pullman Sydney Airport to Nanshan Group. Private equity funds were among the most
prominent buyers in the country in the first half of 2016, followed by corporates.
China has also witnessed an increased level of investment activity, up 118% to US$244.2 million. The recent
uncertainties in the domestic economy are leading to more owners evaluating the sale of their assets and transaction
volumes are expected to rise in the future.
COPYRIGHT © JONES LANG LASALLE IP, INC. 2016. All Rights Reserved 34
Global Market Perspective, Third Quarter 2016
UK still in top spot in EMEA
Transaction volumes in EMEA totalled US$7.1 billion for the first half of 2016, which is 64% below last year’s level. The
fall is mostly due to a decline in investment activities in the UK, down 75% year-on-year to US$2.6 billion. However, the
UK remains the leading destination for hotel investment within EMEA, accounting for over one-third of all deals, followed
by Germany and Spain.
In H1 2016 the proportion of single-asset transactions in the UK increased from 16% last year to 46%, mainly due to
large portfolio sales in 2015. The largest single-asset deal in 2016 to date has been the 50% stake of the
InterContinental London - The O2 from Queensgate Investments to the Arora Group for US$144.9 million.
During the first half of 2016, developers and property companies accounted for around 40% (assets valued at US$1
billion) of buying activities. A key deal was the sale of 47 Holiday Inn Express hotels to London & Regional Properties
from Lone Star for US$840.7 million. Institutional investors are also on the rise, with volumes up four times to US$293.2
million, making them the second largest group of buyers. On the other hand, private equity firms have significantly
reduced their investment, down 83% to US$396.6 million. This is in line with the trend seen in the United States.
Germany is also attracting considerable investor interest with Frankfurt, Hamburg and Berlin being the top three cities.
The biggest agreed transaction in Q2 was the sale of Interhotel Portfolio, which consists of nine hotels, by Starwood
Capital to Foncière des Murs.
Global Market Perspective, Third Quarter 2016
COPYRIGHT © JONES LANG LASALLE IP, INC. 2016. All Rights Reserved 35
Residential Markets
U.S. rental apartments stay on course despite major development cycle
Vacancy increased in the U.S. multifamily market by 10 bps from year-end 2015 to 4.5% at the end of Q2 2016, spurred
by a softening in select Southeastern markets. Charlotte has seen an 80 bps softening, while Miami and Orlando have
decreased 70 bps. However, these markets’ current vacancy rates are at 5.2%, 5.0% and 5.7% respectively, and still
indicate vibrant rental markets at or below long-run averages when examined in conjunction with absorption and rental
growth figures. The greatest increases in vacancy across markets are a result of the pace of construction deliveries, and
investors are attributing higher-risk premiums to secondary markets seeing accelerated construction activity.
U.S. annual rental growth has gained 50 bps year-on-year and is currently at 4.5% (end Q2), although this rate has
fallen 50 bps from the current cycle peak of 5.0% set at year-end 2015. Western region markets continue to lead the
way with respect to rental growth, as the four fastest-growing markets – Portland, Seattle-Bellevue, San Francisco
and Sacramento – have each increased between 9.0% and 7.4%. The Western region also features 8 markets in the
top 10 for rental growth, with Denver, Oakland-East Bay, Phoenix and Silicon Valley each witnessing annual rental
growth between 6.3% and 5.8%.
UK sales activity modestly weaker but house price growth continues
Activity in the UK housing market was modestly weaker in the lead-up to the EU referendum, although house prices
continued to grow at over 8% year-on-year in May nationally and 14% in London. Prime markets are still experiencing
the effects of two previous stamp duty changes.
Institutional investors continue to drive sharp yields for residential property, in the order of around 4.75% gross in
London and 5.5% on average in regional cities. Some estimates now put the number of Build-to-Rent/ Private Rented
Community units planned or under construction at over 30,000 nationally. Early indications are that most investors see
the sector as either unaffected or a potential beneficiary of the Brexit vote.
Marked fall in investment volumes in Germany
There was a marked fall in the volume of transactions for residential property in Germany in H1 2016. A total of €4.4
billion of residential properties and portfolios containing 42,000 apartments changed hands, more than 50% below the
five-year average, making the first half of 2016 one of the weakest on record. The decrease is mainly due to the lack of
large-scale transactions, with the five largest deals in the first six months generating €690 million – in comparison, the
top three deals alone in H1 2015 generated more than €11 billion.
Demand remains strong for new apartments, with the completion of almost 25,000 apartments the highest number since
2006, according to the Federal Statistics Office. There has already been a notable rise in the number of forward deals to
institutional investors in recent years and this sector now accounts for almost a quarter of all transactions. There
continues to be a growing number of micro-apartment building and private student apartment transactions as investors
search for attractive returns, with more than €300 million invested in this residential sub-sector in H1 2016.
COPYRIGHT © JONES LANG LASALLE IP, INC. 2016. All Rights Reserved 36
Global Market Perspective, Third Quarter 2016
Price growth continues in Netherlands
There continues to be upward price pressure in both the sales and rental markets across the Netherlands, notably in
larger cities such as Amsterdam and Utrecht. Changing regulations for the rental market, that predominantly impact
smaller units, is driving investor demand for this sector. Cheap mortgages and high rents have fuelled demand for
residential purchases and this is expected to be maintained with no signs of an interest rate rise. Investment volumes in
Q2 have been stable with large developments and forward funding deals representing a significant share of activity.
Record sales activity in Sweden
Sweden registered a record turnover during the first six months of 2016, with residential sales volumes of approximately
US$2.5 billion. The largest transaction in Q2 was the sale by Akelius of its entire western Swedish portfolio (4,300
apartments) to Willhem for circa US$600 million. Municipalities have continued to be active, selling around US$300
million worth of assets, while the market for newly-built rental apartments is also strong.
Accelerating capital value growth in Spain’s major cities
Spanish residential property prices continued to increase on a national basis in Q2 2016, with accelerated growth in
capital values in the major cities of Madrid and Barcelona. There is a demand/supply imbalance in both cities, which is
particularly marked in Madrid, where a number of significant projects have been delayed or postponed due to local
politics. This imbalance will continue to drive residential prices in both cities.
Residential investment transactions in the market are still dominated by non-institutional investors. With these investors
finding limited opportunities in the €5 million - €25 million range in the principal CBD areas of the two primary Spanish
cities, investors are starting to consider acquisitions in secondary cities such as Valencia and Bilbao.
Robust demand in Portugal
The residential market is very active in Portugal, with demand from both domestic and overseas purchasers. Low
interest rates have supported demand, with record housing debt raised by banks over the first four months of 2016.
Foreign purchasers accounted for 15% of houses sold in Lisbon during H1 2016, driven by the Golden Visa programme.
Sales volumes continue to decline in Dubai
There has been a continued decline in the volume of residential sales in Dubai as investors become more cautious. The
Dubai Land Department shows a 27% fall in the volume of activity over H1 2016 (compared to the same period in 2015).
The increased maturity of the market is reflected in far more modest falls in average sale prices, which dropped by 5%
for apartments and 6% for villas year-on-year in Q2. The residential sales market may currently be experiencing its
cyclical trough, having softened by 15% since the peak in mid-2014. Rental levels have held up more strongly than sale
prices, but nonetheless they have also experienced a decline, with average rents falling by 4% over the past year.
Some improvement in Hong Kong and Singapore sales activity
Policy restrictions remain in place in various markets across Asia. Tightening measures introduced by the Shanghai
government at end-Q1 have dampened sales volumes following the earlier surge in activity. In Hong Kong, the focus
remains on the primary sales market with developers offering discounts and attractive financing incentives. Sales
volumes rose in Singapore’s prime districts in Q2 as some developers cut prices and offered deferred payment
schemes to entice buyers.
A seasonal pick-up in leasing activity was witnessed in some markets in the second quarter due to the start/end of the
school year but demand has generally remained subdued with limited rental growth in most markets across Asia.
.
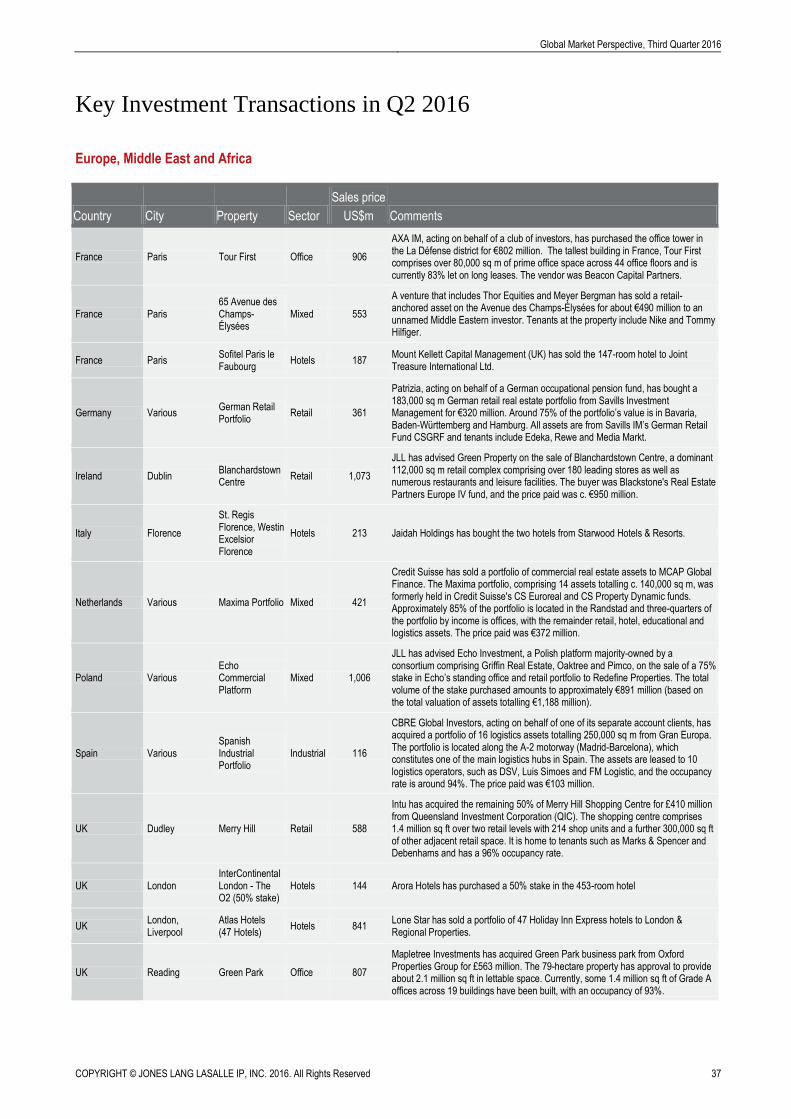
Global Market Perspective, Third Quarter 2016
COPYRIGHT © JONES LANG LASALLE IP, INC. 2016. All Rights Reserved 37
Key Investment Transactions in Q2 2016
Europe, Middle East and Africa
Country City Property Sector
Sales price
US$m Comments
France Paris Tour First Office 906
AXA IM, acting on behalf of a club of investors, has purchased the office tower in the La Défense district for €802 million. The tallest building in France, Tour First comprises over 80,000 sq m of prime office space across 44 office floors and is currently 83% let on long leases. The vendor was Beacon Capital Partners.
France Paris 65 Avenue des Champs- Élysées
Mixed 553
A venture that includes Thor Equities and Meyer Bergman has sold a retail-anchored asset on the Avenue des Champs-Élysées for about €490 million to an unnamed Middle Eastern investor. Tenants at the property include Nike and Tommy Hilfiger.
France Paris Sofitel Paris le Faubourg
Hotels 187 Mount Kellett Capital Management (UK) has sold the 147-room hotel to Joint Treasure International Ltd.
Germany Various German Retail Portfolio
Retail 361
Patrizia, acting on behalf of a German occupational pension fund, has bought a 183,000 sq m German retail real estate portfolio from Savills Investment Management for €320 million. Around 75% of the portfolio’s value is in Bavaria, Baden-Württemberg and Hamburg. All assets are from Savills IM’s German Retail Fund CSGRF and tenants include Edeka, Rewe and Media Markt.
Ireland Dublin Blanchardstown Centre
Retail 1,073
JLL has advised Green Property on the sale of Blanchardstown Centre, a dominant 112,000 sq m retail complex comprising over 180 leading stores as well as numerous restaurants and leisure facilities. The buyer was Blackstone's Real Estate Partners Europe IV fund, and the price paid was c. €950 million.
Italy Florence
St. Regis Florence, Westin Excelsior Florence
Hotels 213 Jaidah Holdings has bought the two hotels from Starwood Hotels & Resorts.
Netherlands Various Maxima Portfolio Mixed 421
Credit Suisse has sold a portfolio of commercial real estate assets to MCAP Global Finance. The Maxima portfolio, comprising 14 assets totalling c. 140,000 sq m, was formerly held in Credit Suisse's CS Euroreal and CS Property Dynamic funds. Approximately 85% of the portfolio is located in the Randstad and three-quarters of the portfolio by income is offices, with the remainder retail, hotel, educational and logistics assets. The price paid was €372 million.
Poland Various Echo Commercial Platform
Mixed 1,006
JLL has advised Echo Investment, a Polish platform majority-owned by a consortium comprising Griffin Real Estate, Oaktree and Pimco, on the sale of a 75% stake in Echo’s standing office and retail portfolio to Redefine Properties. The total volume of the stake purchased amounts to approximately €891 million (based on the total valuation of assets totalling €1,188 million).
Spain Various Spanish Industrial Portfolio
Industrial 116
CBRE Global Investors, acting on behalf of one of its separate account clients, has acquired a portfolio of 16 logistics assets totalling 250,000 sq m from Gran Europa. The portfolio is located along the A-2 motorway (Madrid-Barcelona), which constitutes one of the main logistics hubs in Spain. The assets are leased to 10 logistics operators, such as DSV, Luis Simoes and FM Logistic, and the occupancy rate is around 94%. The price paid was €103 million.
UK Dudley Merry Hill Retail 588
Intu has acquired the remaining 50% of Merry Hill Shopping Centre for £410 million from Queensland Investment Corporation (QIC). The shopping centre comprises 1.4 million sq ft over two retail levels with 214 shop units and a further 300,000 sq ft of other adjacent retail space. It is home to tenants such as Marks & Spencer and Debenhams and has a 96% occupancy rate.
UK London InterContinental London - The O2 (50% stake)
Hotels 144 Arora Hotels has purchased a 50% stake in the 453-room hotel
UK London, Liverpool
Atlas Hotels (47 Hotels)
Hotels 841 Lone Star has sold a portfolio of 47 Holiday Inn Express hotels to London & Regional Properties.
UK Reading Green Park Office 807
Mapletree Investments has acquired Green Park business park from Oxford Properties Group for £563 million. The 79-hectare property has approval to provide about 2.1 million sq ft in lettable space. Currently, some 1.4 million sq ft of Grade A offices across 19 buildings have been built, with an occupancy of 93%.
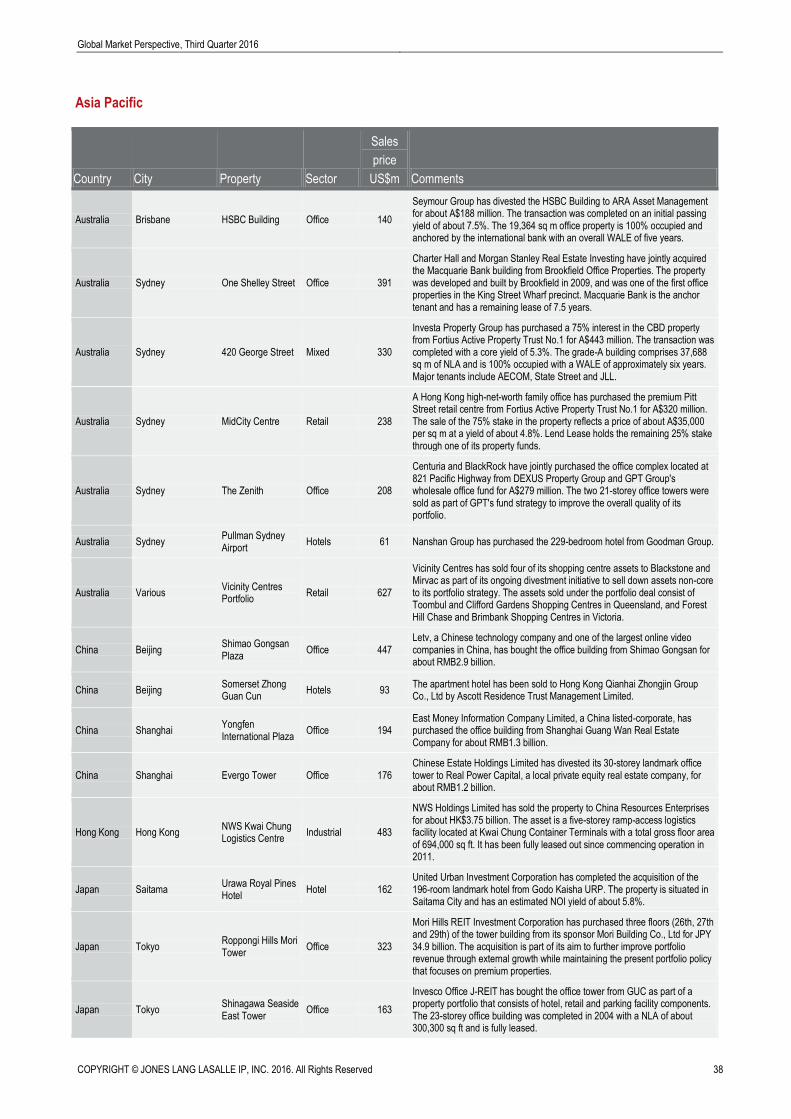
COPYRIGHT © JONES LANG LASALLE IP, INC. 2016. All Rights Reserved 38
Global Market Perspective, Third Quarter 2016
Asia Pacific
Country City Property Sector
Sales
price
US$m Comments
Australia Brisbane HSBC Building Office 140
Seymour Group has divested the HSBC Building to ARA Asset Management for about A$188 million. The transaction was completed on an initial passing yield of about 7.5%. The 19,364 sq m office property is 100% occupied and anchored by the international bank with an overall WALE of five years.
Australia Sydney One Shelley Street Office 391
Charter Hall and Morgan Stanley Real Estate Investing have jointly acquired the Macquarie Bank building from Brookfield Office Properties. The property was developed and built by Brookfield in 2009, and was one of the first office properties in the King Street Wharf precinct. Macquarie Bank is the anchor tenant and has a remaining lease of 7.5 years.
Australia Sydney 420 George Street Mixed 330
Investa Property Group has purchased a 75% interest in the CBD property from Fortius Active Property Trust No.1 for A$443 million. The transaction was completed with a core yield of 5.3%. The grade-A building comprises 37,688 sq m of NLA and is 100% occupied with a WALE of approximately six years. Major tenants include AECOM, State Street and JLL.
Australia Sydney MidCity Centre Retail 238
A Hong Kong high-net-worth family office has purchased the premium Pitt Street retail centre from Fortius Active Property Trust No.1 for A$320 million. The sale of the 75% stake in the property reflects a price of about A$35,000 per sq m at a yield of about 4.8%. Lend Lease holds the remaining 25% stake through one of its property funds.
Australia Sydney The Zenith Office 208
Centuria and BlackRock have jointly purchased the office complex located at 821 Pacific Highway from DEXUS Property Group and GPT Group's wholesale office fund for A$279 million. The two 21-storey office towers were sold as part of GPT's fund strategy to improve the overall quality of its portfolio.
Australia Sydney Pullman Sydney Airport
Hotels 61 Nanshan Group has purchased the 229-bedroom hotel from Goodman Group.
Australia Various Vicinity Centres Portfolio
Retail 627
Vicinity Centres has sold four of its shopping centre assets to Blackstone and Mirvac as part of its ongoing divestment initiative to sell down assets non-core to its portfolio strategy. The assets sold under the portfolio deal consist of Toombul and Clifford Gardens Shopping Centres in Queensland, and Forest Hill Chase and Brimbank Shopping Centres in Victoria.
China Beijing Shimao Gongsan Plaza
Office 447 Letv, a Chinese technology company and one of the largest online video companies in China, has bought the office building from Shimao Gongsan for about RMB2.9 billion.
China Beijing Somerset Zhong Guan Cun
Hotels 93 The apartment hotel has been sold to Hong Kong Qianhai Zhongjin Group Co., Ltd by Ascott Residence Trust Management Limited.
China Shanghai Yongfen International Plaza
Office 194 East Money Information Company Limited, a China listed-corporate, has purchased the office building from Shanghai Guang Wan Real Estate Company for about RMB1.3 billion.
China Shanghai Evergo Tower Office 176 Chinese Estate Holdings Limited has divested its 30-storey landmark office tower to Real Power Capital, a local private equity real estate company, for about RMB1.2 billion.
Hong Kong Hong Kong NWS Kwai Chung Logistics Centre
Industrial 483
NWS Holdings Limited has sold the property to China Resources Enterprises for about HK$3.75 billion. The asset is a five-storey ramp-access logistics facility located at Kwai Chung Container Terminals with a total gross floor area of 694,000 sq ft. It has been fully leased out since commencing operation in 2011.
Japan Saitama Urawa Royal Pines Hotel
Hotel 162 United Urban Investment Corporation has completed the acquisition of the 196-room landmark hotel from Godo Kaisha URP. The property is situated in Saitama City and has an estimated NOI yield of about 5.8%.
Japan Tokyo Roppongi Hills Mori Tower
Office 323
Mori Hills REIT Investment Corporation has purchased three floors (26th, 27th and 29th) of the tower building from its sponsor Mori Building Co., Ltd for JPY 34.9 billion. The acquisition is part of its aim to further improve portfolio revenue through external growth while maintaining the present portfolio policy that focuses on premium properties.
Japan Tokyo Shinagawa Seaside East Tower
Office 163
Invesco Office J-REIT has bought the office tower from GUC as part of a property portfolio that consists of hotel, retail and parking facility components. The 23-storey office building was completed in 2004 with a NLA of about 300,300 sq ft and is fully leased.
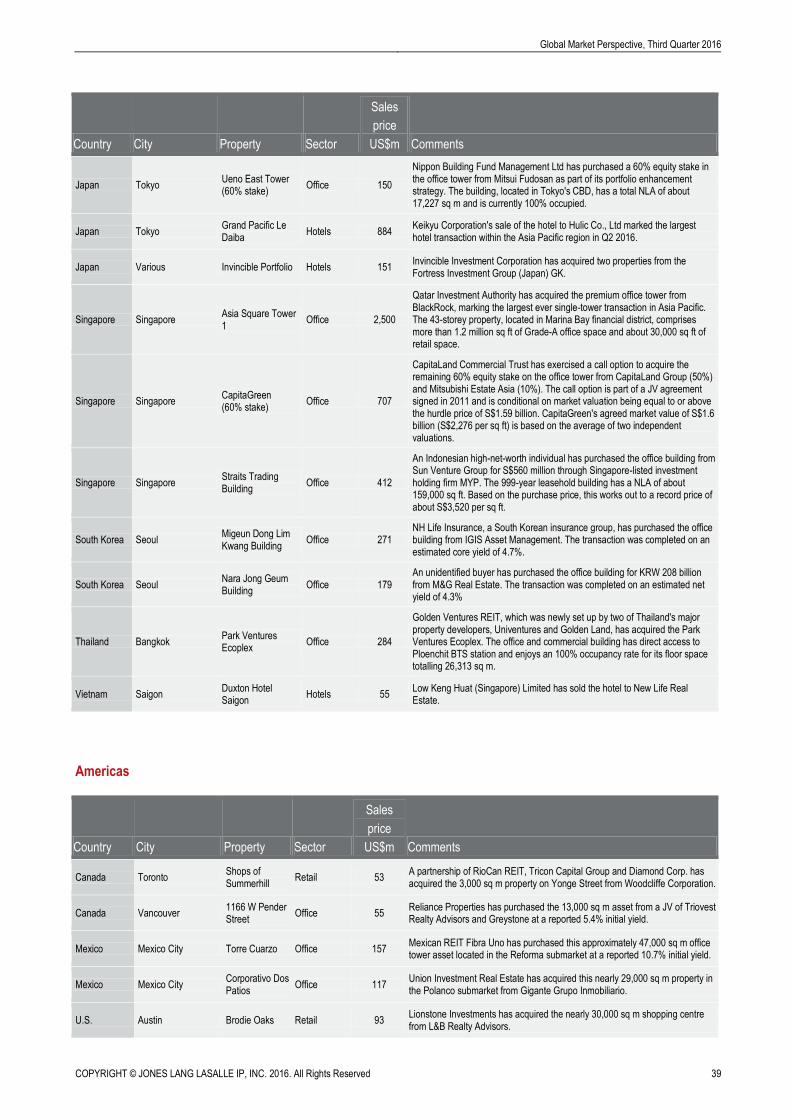
Global Market Perspective, Third Quarter 2016
COPYRIGHT © JONES LANG LASALLE IP, INC. 2016. All Rights Reserved 39
Country City Property Sector
Sales
price
US$m Comments
Japan Tokyo Ueno East Tower (60% stake)
Office 150
Nippon Building Fund Management Ltd has purchased a 60% equity stake in the office tower from Mitsui Fudosan as part of its portfolio enhancement strategy. The building, located in Tokyo's CBD, has a total NLA of about 17,227 sq m and is currently 100% occupied.
Japan Tokyo Grand Pacific Le Daiba
Hotels 884 Keikyu Corporation's sale of the hotel to Hulic Co., Ltd marked the largest hotel transaction within the Asia Pacific region in Q2 2016.
Japan Various Invincible Portfolio Hotels 151 Invincible Investment Corporation has acquired two properties from the Fortress Investment Group (Japan) GK.
Singapore Singapore Asia Square Tower 1
Office 2,500
Qatar Investment Authority has acquired the premium office tower from BlackRock, marking the largest ever single-tower transaction in Asia Pacific. The 43-storey property, located in Marina Bay financial district, comprises more than 1.2 million sq ft of Grade-A office space and about 30,000 sq ft of retail space.
Singapore Singapore CapitaGreen (60% stake)
Office 707
CapitaLand Commercial Trust has exercised a call option to acquire the remaining 60% equity stake on the office tower from CapitaLand Group (50%) and Mitsubishi Estate Asia (10%). The call option is part of a JV agreement signed in 2011 and is conditional on market valuation being equal to or above the hurdle price of S$1.59 billion. CapitaGreen's agreed market value of S$1.6 billion (S$2,276 per sq ft) is based on the average of two independent valuations.
Singapore Singapore Straits Trading Building
Office 412
An Indonesian high-net-worth individual has purchased the office building from Sun Venture Group for S$560 million through Singapore-listed investment holding firm MYP. The 999-year leasehold building has a NLA of about 159,000 sq ft. Based on the purchase price, this works out to a record price of about S$3,520 per sq ft.
South Korea Seoul Migeun Dong Lim Kwang Building
Office 271 NH Life Insurance, a South Korean insurance group, has purchased the office building from IGIS Asset Management. The transaction was completed on an estimated core yield of 4.7%.
South Korea Seoul Nara Jong Geum Building
Office 179 An unidentified buyer has purchased the office building for KRW 208 billion from M&G Real Estate. The transaction was completed on an estimated net yield of 4.3%
Thailand Bangkok Park Ventures Ecoplex
Office 284
Golden Ventures REIT, which was newly set up by two of Thailand's major property developers, Univentures and Golden Land, has acquired the Park Ventures Ecoplex. The office and commercial building has direct access to Ploenchit BTS station and enjoys an 100% occupancy rate for its floor space totalling 26,313 sq m.
Vietnam Saigon Duxton Hotel Saigon
Hotels 55 Low Keng Huat (Singapore) Limited has sold the hotel to New Life Real Estate.
Americas
Country City Property Sector
Sales
price
US$m Comments
Canada Toronto Shops of Summerhill
Retail 53 A partnership of RioCan REIT, Tricon Capital Group and Diamond Corp. has acquired the 3,000 sq m property on Yonge Street from Woodcliffe Corporation.
Canada Vancouver 1166 W Pender Street
Office 55 Reliance Properties has purchased the 13,000 sq m asset from a JV of Triovest Realty Advisors and Greystone at a reported 5.4% initial yield.
Mexico Mexico City Torre Cuarzo Office 157 Mexican REIT Fibra Uno has purchased this approximately 47,000 sq m office tower asset located in the Reforma submarket at a reported 10.7% initial yield.
Mexico Mexico City Corporativo Dos Patios
Office 117 Union Investment Real Estate has acquired this nearly 29,000 sq m property in the Polanco submarket from Gigante Grupo Inmobiliario.
U.S. Austin Brodie Oaks Retail 93 Lionstone Investments has acquired the nearly 30,000 sq m shopping centre from L&B Realty Advisors.
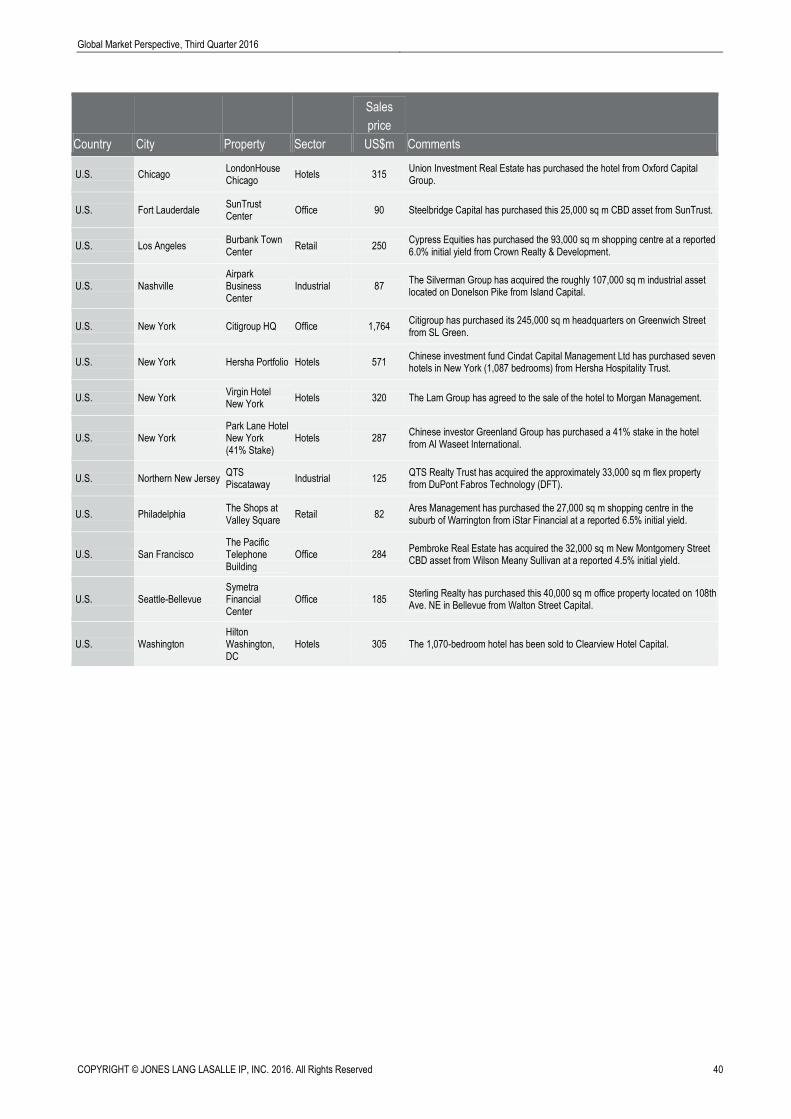
COPYRIGHT © JONES LANG LASALLE IP, INC. 2016. All Rights Reserved 40
Global Market Perspective, Third Quarter 2016
Country City Property Sector
Sales
price
US$m Comments
U.S. Chicago LondonHouse Chicago
Hotels 315 Union Investment Real Estate has purchased the hotel from Oxford Capital Group.
U.S. Fort Lauderdale SunTrust Center
Office 90 Steelbridge Capital has purchased this 25,000 sq m CBD asset from SunTrust.
U.S. Los Angeles Burbank Town Center
Retail 250 Cypress Equities has purchased the 93,000 sq m shopping centre at a reported 6.0% initial yield from Crown Realty & Development.
U.S. Nashville Airpark Business Center
Industrial 87 The Silverman Group has acquired the roughly 107,000 sq m industrial asset located on Donelson Pike from Island Capital.
U.S. New York Citigroup HQ Office 1,764 Citigroup has purchased its 245,000 sq m headquarters on Greenwich Street from SL Green.
U.S. New York Hersha Portfolio Hotels 571 Chinese investment fund Cindat Capital Management Ltd has purchased seven hotels in New York (1,087 bedrooms) from Hersha Hospitality Trust.
U.S. New York Virgin Hotel New York
Hotels 320 The Lam Group has agreed to the sale of the hotel to Morgan Management.
U.S. New York Park Lane Hotel New York (41% Stake)
Hotels 287 Chinese investor Greenland Group has purchased a 41% stake in the hotel from Al Waseet International.
U.S. Northern New Jersey QTS Piscataway
Industrial 125 QTS Realty Trust has acquired the approximately 33,000 sq m flex property from DuPont Fabros Technology (DFT).
U.S. Philadelphia The Shops at Valley Square
Retail 82 Ares Management has purchased the 27,000 sq m shopping centre in the suburb of Warrington from iStar Financial at a reported 6.5% initial yield.
U.S. San Francisco The Pacific Telephone Building
Office 284 Pembroke Real Estate has acquired the 32,000 sq m New Montgomery Street CBD asset from Wilson Meany Sullivan at a reported 4.5% initial yield.
U.S. Seattle-Bellevue Symetra Financial Center
Office 185 Sterling Realty has purchased this 40,000 sq m office property located on 108th Ave. NE in Bellevue from Walton Street Capital.
U.S. Washington Hilton Washington, DC
Hotels 305 The 1,070-bedroom hotel has been sold to Clearview Hotel Capital.
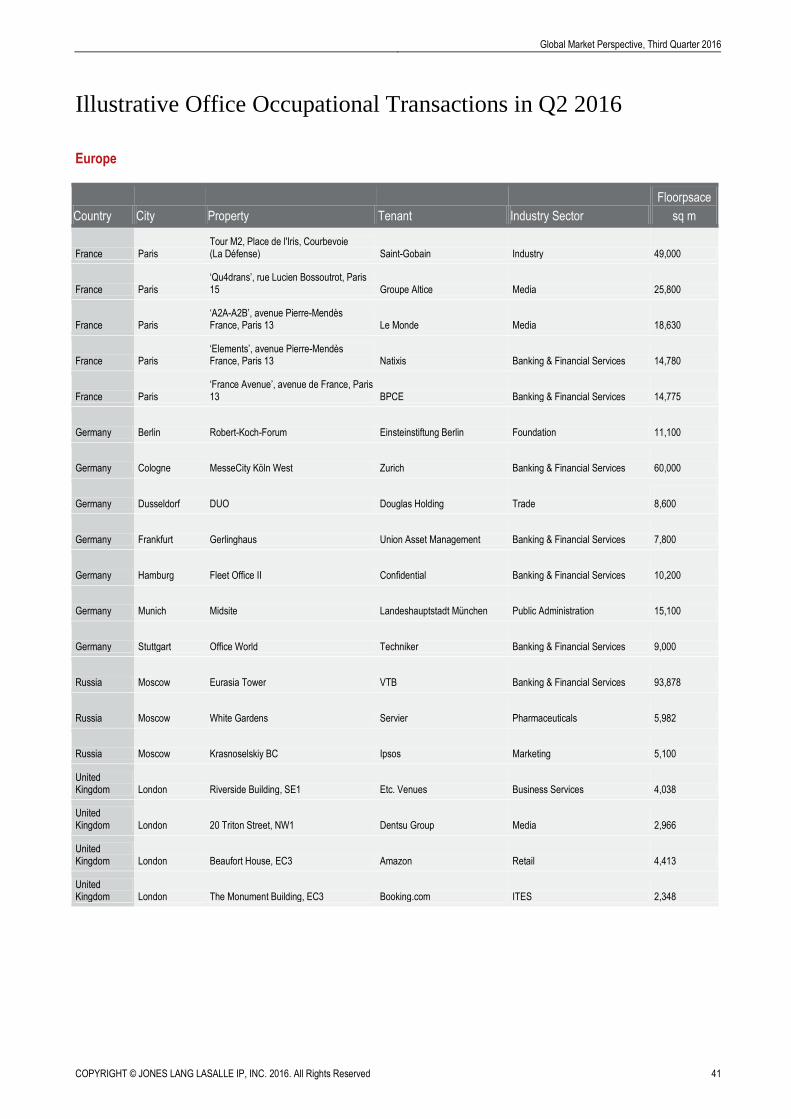
Global Market Perspective, Third Quarter 2016
COPYRIGHT © JONES LANG LASALLE IP, INC. 2016. All Rights Reserved 41
Illustrative Office Occupational Transactions in Q2 2016
Europe
Country City Property Tenant Industry Sector
Floorpsace
sq m
France Paris Tour M2, Place de l'Iris, Courbevoie (La Défense) Saint-Gobain Industry 49,000
France Paris ‘Qu4drans’, rue Lucien Bossoutrot, Paris 15 Groupe Altice Media 25,800
France Paris ‘A2A-A2B’, avenue Pierre-Mendès France, Paris 13 Le Monde Media 18,630
France Paris ‘Elements’, avenue Pierre-Mendès France, Paris 13 Natixis Banking & Financial Services 14,780
France Paris ‘France Avenue’, avenue de France, Paris 13 BPCE Banking & Financial Services 14,775
Germany Berlin Robert-Koch-Forum Einsteinstiftung Berlin Foundation 11,100
Germany Cologne MesseCity Köln West Zurich Banking & Financial Services 60,000
Germany Dusseldorf DUO Douglas Holding Trade 8,600
Germany Frankfurt Gerlinghaus Union Asset Management Banking & Financial Services 7,800
Germany Hamburg Fleet Office II Confidential Banking & Financial Services 10,200
Germany Munich Midsite Landeshauptstadt München Public Administration 15,100
Germany Stuttgart Office World Techniker Banking & Financial Services 9,000
Russia Moscow Eurasia Tower VTB Banking & Financial Services 93,878
Russia Moscow White Gardens Servier Pharmaceuticals 5,982
Russia Moscow Krasnoselskiy BC Ipsos Marketing 5,100
United Kingdom London Riverside Building, SE1 Etc. Venues Business Services 4,038
United Kingdom London 20 Triton Street, NW1 Dentsu Group Media 2,966
United Kingdom London Beaufort House, EC3 Amazon Retail 4,413
United Kingdom London The Monument Building, EC3 Booking.com ITES 2,348
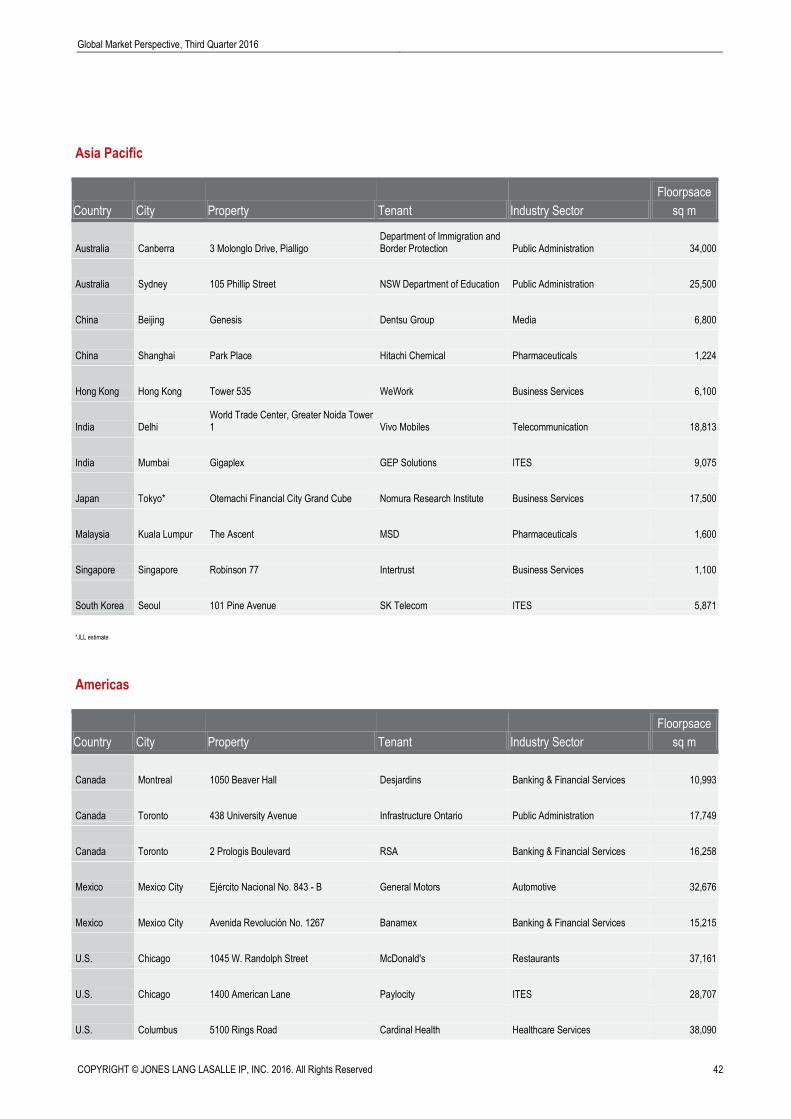
COPYRIGHT © JONES LANG LASALLE IP, INC. 2016. All Rights Reserved 42
Global Market Perspective, Third Quarter 2016
Asia Pacific
Country City Property Tenant Industry Sector
Floorpsace
sq m
Australia Canberra 3 Molonglo Drive, Pialligo Department of Immigration and Border Protection Public Administration 34,000
Australia Sydney 105 Phillip Street NSW Department of Education Public Administration 25,500
China Beijing Genesis Dentsu Group Media 6,800
China Shanghai Park Place Hitachi Chemical Pharmaceuticals 1,224
Hong Kong Hong Kong Tower 535 WeWork Business Services 6,100
India Delhi World Trade Center, Greater Noida Tower 1 Vivo Mobiles Telecommunication 18,813
India Mumbai Gigaplex GEP Solutions ITES 9,075
Japan Tokyo* Otemachi Financial City Grand Cube Nomura Research Institute Business Services 17,500
Malaysia Kuala Lumpur The Ascent MSD Pharmaceuticals 1,600
Singapore Singapore Robinson 77 Intertrust Business Services 1,100
South Korea Seoul 101 Pine Avenue SK Telecom ITES 5,871
*JLL estimate
Americas
Country City Property Tenant Industry Sector
Floorpsace
sq m
Canada Montreal 1050 Beaver Hall Desjardins Banking & Financial Services 10,993
Canada Toronto 438 University Avenue Infrastructure Ontario Public Administration 17,749
Canada Toronto 2 Prologis Boulevard RSA Banking & Financial Services 16,258
Mexico Mexico City Ejército Nacional No. 843 - B General Motors Automotive 32,676
Mexico Mexico City Avenida Revolución No. 1267 Banamex Banking & Financial Services 15,215
U.S. Chicago 1045 W. Randolph Street McDonald's Restaurants 37,161
U.S. Chicago 1400 American Lane Paylocity ITES 28,707
U.S. Columbus 5100 Rings Road Cardinal Health Healthcare Services 38,090
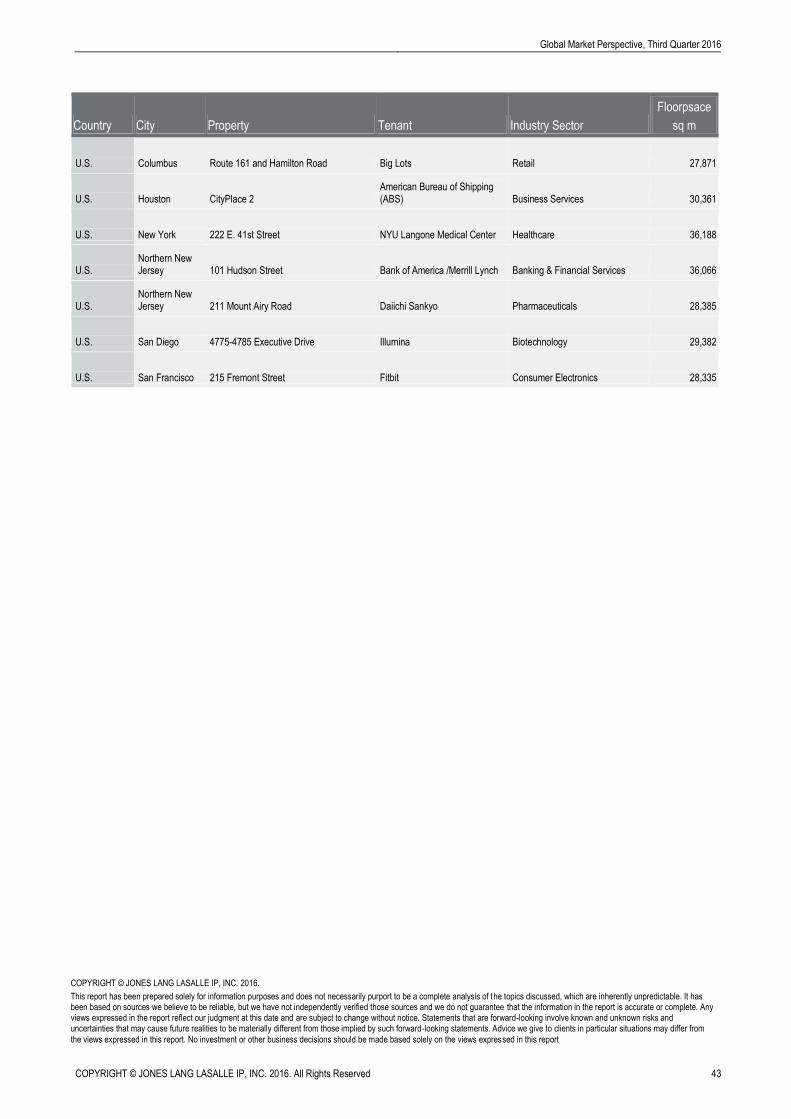
Global Market Perspective, Third Quarter 2016
COPYRIGHT © JONES LANG LASALLE IP, INC. 2016. All Rights Reserved 43
Country City Property Tenant Industry Sector
Floorpsace
sq m
U.S. Columbus Route 161 and Hamilton Road Big Lots Retail 27,871
U.S. Houston CityPlace 2 American Bureau of Shipping (ABS) Business Services 30,361
U.S. New York 222 E. 41st Street NYU Langone Medical Center Healthcare 36,188
U.S. Northern New Jersey 101 Hudson Street Bank of America /Merrill Lynch Banking & Financial Services 36,066
U.S. Northern New Jersey 211 Mount Airy Road Daiichi Sankyo Pharmaceuticals 28,385
U.S. San Diego 4775-4785 Executive Drive Illumina Biotechnology 29,382
U.S. San Francisco 215 Fremont Street Fitbit Consumer Electronics 28,335
COPYRIGHT © JONES LANG LASALLE IP, INC. 2016.
This report has been prepared solely for information purposes and does not necessarily purport to be a complete analysis of the topics discussed, which are inherently unpredictable. It has been based on sources we believe to be reliable, but we have not independently verified those sources and we do not guarantee that the information in the report is accurate or complete. Any views expressed in the report reflect our judgment at this date and are subject to change without notice. Statements that are forward-looking involve known and unknown risks and uncertainties that may cause future realities to be materially different from those implied by such forward-looking statements. Advice we give to clients in particular situations may differ from
the views expressed in this report. No investment or other business decisions should be made based solely on the views expressed in this report