Embed Size (px)
DESCRIPTION
Sample PDf file of Real Data\’s SourceCD which gives market conditions, trends and statistics for metro areas in the Southeast
Citation preview
Sample SourceCD05
September
ApartmentIndex
Submarket Real Data
3© Sept-02 Real Data www.aptindex.com
Employment / Economic Announcements
• Johnson & Wales University, planning a new campus indowntown Charlotte, will open in Fall 2004 and employ astaff of 250 by 2007.
• PCI Wedeco, a Germany-based industrial technology pro-ducer, has begun moving its U.S. headquarters and manufac-turing operations to Charlotte, bringing 200 jobs.
• Time Warner Cable plans to consolidate several nationwideoperations in a development in Charlotte which will employas many as 740 people, about half of them new to Charlotte.
• Charlotte-based pharmaceutical consulting firm The LashGroup, plans to add 100 employees over the 18 months.
• Rooms to Go furniture distribution/outlet center will employ150 at its recently completed facility in Charlotte.
• Tyco Electronics in Rock Hill recently re-hired nearly 100workers laid off six months ago.
• Scandura Inc., an industrial fabric maker is phasing out 130jobs from its Charlotte plant.
• Bank of America Corp. plans to lay off 70 call-center work-ings in Charlotte.
• Consolidated Freightways, a trucking company, will be fil-ing for Chapter 11 bankruptcy and cutting 400 jobs in Char-lotte.
Economic Overview
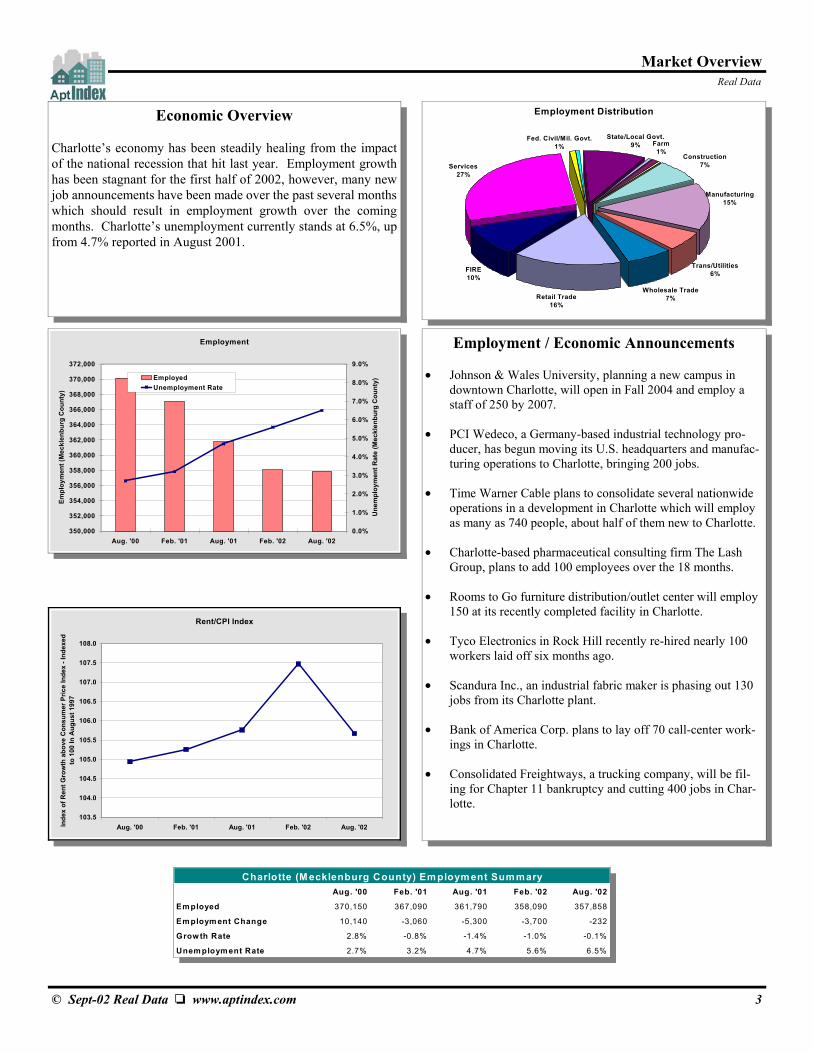
Charlotte’s economy has been steadily healing from the impactof the national recession that hit last year. Employment growthhas been stagnant for the first half of 2002, however, many newjob announcements have been made over the past several monthswhich should result in employment growth over the comingmonths. Charlotte’s unemployment currently stands at 6.5%, upfrom 4.7% reported in August 2001.
Market Overview
Employment Distribution
Farm1%
Construction7%
Retail Trade16%
FIRE10%
Services27%
State/Local Govt.9%
Wholesale Trade7%
Manufacturing15%
Fed. Civil/Mil. Govt.1%
Trans/Utilities6%
Rent/CPI Index
103.5
104.0
104.5
105.0
105.5
106.0
106.5
107.0
107.5
108.0
Aug. '00 Feb. '01 Aug. '01 Feb. '02 Aug. '02Inde
x of
Ren
t Gro
wth
abo
ve C
onsu
mer
Pric
e In
dex
- Ind
exed
to
100
In A
ugus
t 199
7
Employment
350,000
352,000
354,000
356,000
358,000
360,000
362,000
364,000
366,000
368,000
370,000
372,000
Aug. '00 Feb. '01 Aug. '01 Feb. '02 Aug. '02
Empl
oym
ent (
Mec
klen
burg
Cou
nty)
0.0%
1.0%
2.0%
3.0%
4.0%
5.0%
6.0%
7.0%
8.0%
9.0%U
nem
ploy
men
t Rat
e (M
eckl
enbu
rg C
ount
y)EmployedUnemployment Rate
Aug. '00 Feb. '01 Aug. '01 Feb. '02 Aug. '02
Employed 370,150 367,090 361,790 358,090 357,858
Employm ent Change 10,140 -3,060 -5,300 -3,700 -232
Growth Rate 2.8% -0.8% -1.4% -1.0% -0.1%
Unem ployment Rate 2.7% 3.2% 4.7% 5.6% 6.5%
Charlotte (M ecklenburg County) Employment Summary
Submarket Real Data
4© Sept-02 Real Data www.aptindex.com
Market Summary
The vacancy rate in the Charlotte Apartment market has fallenover the past six months. The current vacancy rate stands at11.2%, down from 12.9% reported six months ago, which wasa record high for the market. There were 3,069 units ab-sorbed over the past six months, while 1,519 units werecompleted. Because the number of units completed was lessthan half of the number of units absorbed, the vacancy ratedecreased.
The average quoted rental rate is $708. One Bedroom rentsaverage $625 per month. Two bedrooms rents are $730 andthree bedroom rents are $894. Pre-existing inventory rentsincreased by only $0.48 in the last six months, in addition,significant concessions, including up to 2 months free rent,remain common. As of August, 63% of communities wereoffering some sort of rental concessions, up 11% from thistime last year.
Development activity, although still high, has been reducedsomewhat in the last year. Units under construction are lessthat what they were six months ago and one year ago.
Based on the number of units currently under constructionand estimated future absorption numbers, the vacancy rate inthe Charlotte market is likely to remain in the 9-11% range inthe coming year.
Note: The overall statistics reflect totals for Mecklenburg, Cabar-rus, Gaston, Union and York Counties. Previous publication totalswere for Mecklenburg County only. All historical statistics withinthis report reflect the totals for all the counties combined.
Market Index
Charlotte Apartment Indicators
In the previousyear
Forecast for thenext year
Employment Growth o r
Occupancy Rate o pq
Rent Change* pq pq
Net Absorption pq pq
Units Completed o o
Concessions r pq
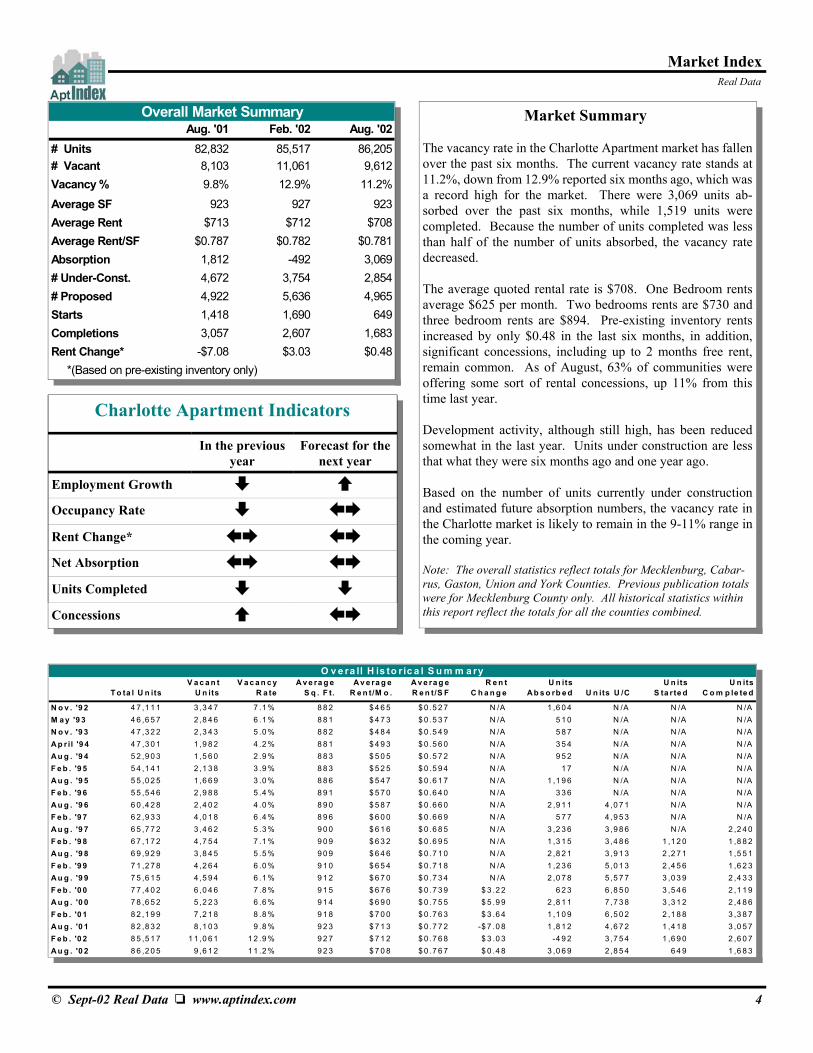
Aug. '01 Feb. '02 Aug. '02# Units 82,832 85,517 86,205# Vacant 8,103 11,061 9,612Vacancy % 9.8% 12.9% 11.2%Average SF 923 927 923Average Rent $713 $712 $708Average Rent/SF $0.787 $0.782 $0.781Absorption 1,812 -492 3,069# Under-Const. 4,672 3,754 2,854# Proposed 4,922 5,636 4,965Starts 1,418 1,690 649Completions 3,057 2,607 1,683Rent Change* -$7.08 $3.03 $0.48 *(Based on pre-existing inventory only)
Overall Market Summary
T o ta l U n itsV a c a n t
U n itsV a c a n c y
R a teA v e ra g e
S q . F t.A v e ra g e
R e n t/M o .A v e ra g e R e n t/S F
R e n t C h a n g e
U n its A b s o rb e d U n its U /C
U n its S ta r te d
U n its C o m p le te d
N o v . '9 2 4 7 ,1 1 1 3 ,3 4 7 7 .1 % 8 8 2 $ 4 6 5 $ 0 .5 2 7 N /A 1 ,6 0 4 N /A N /A N /AM a y '9 3 4 6 ,6 5 7 2 ,8 4 6 6 .1 % 8 8 1 $ 4 7 3 $ 0 .5 3 7 N /A 5 1 0 N /A N /A N /AN o v . '9 3 4 7 ,3 2 2 2 ,3 4 3 5 .0 % 8 8 2 $ 4 8 4 $ 0 .5 4 9 N /A 5 8 7 N /A N /A N /AA p ril '9 4 4 7 ,3 0 1 1 ,9 8 2 4 .2 % 8 8 1 $ 4 9 3 $ 0 .5 6 0 N /A 3 5 4 N /A N /A N /AA u g . '9 4 5 2 ,9 0 3 1 ,5 6 0 2 .9 % 8 8 3 $ 5 0 5 $ 0 .5 7 2 N /A 9 5 2 N /A N /A N /AF e b . '9 5 5 4 ,1 4 1 2 ,1 3 8 3 .9 % 8 8 3 $ 5 2 5 $ 0 .5 9 4 N /A 1 7 N /A N /A N /AA u g . '9 5 5 5 ,0 2 5 1 ,6 6 9 3 .0 % 8 8 6 $ 5 4 7 $ 0 .6 1 7 N /A 1 ,1 9 6 N /A N /A N /AF e b . '9 6 5 5 ,5 4 6 2 ,9 8 8 5 .4 % 8 9 1 $ 5 7 0 $ 0 .6 4 0 N /A 3 3 6 N /A N /A N /AA u g . '9 6 6 0 ,4 2 8 2 ,4 0 2 4 .0 % 8 9 0 $ 5 8 7 $ 0 .6 6 0 N /A 2 ,9 1 1 4 ,0 7 1 N /A N /AF e b . '9 7 6 2 ,9 3 3 4 ,0 1 8 6 .4 % 8 9 6 $ 6 0 0 $ 0 .6 6 9 N /A 5 7 7 4 ,9 5 3 N /A N /AA u g . '9 7 6 5 ,7 7 2 3 ,4 6 2 5 .3 % 9 0 0 $ 6 1 6 $ 0 .6 8 5 N /A 3 ,2 3 6 3 ,9 8 6 N /A 2 ,2 4 0F e b . '9 8 6 7 ,1 7 2 4 ,7 5 4 7 .1 % 9 0 9 $ 6 3 2 $ 0 .6 9 5 N /A 1 ,3 1 5 3 ,4 8 6 1 ,1 2 0 1 ,8 8 2A u g . '9 8 6 9 ,9 2 9 3 ,8 4 5 5 .5 % 9 0 9 $ 6 4 6 $ 0 .7 1 0 N /A 2 ,8 2 1 3 ,9 1 3 2 ,2 7 1 1 ,5 5 1F e b . '9 9 7 1 ,2 7 8 4 ,2 6 4 6 .0 % 9 1 0 $ 6 5 4 $ 0 .7 1 8 N /A 1 ,2 3 6 5 ,0 1 3 2 ,4 5 6 1 ,6 2 3A u g . '9 9 7 5 ,6 1 5 4 ,5 9 4 6 .1 % 9 1 2 $ 6 7 0 $ 0 .7 3 4 N /A 2 ,0 7 8 5 ,5 7 7 3 ,0 3 9 2 ,4 3 3F e b . '0 0 7 7 ,4 0 2 6 ,0 4 6 7 .8 % 9 1 5 $ 6 7 6 $ 0 .7 3 9 $ 3 .2 2 6 2 3 6 ,8 5 0 3 ,5 4 6 2 ,1 1 9A u g . '0 0 7 8 ,6 5 2 5 ,2 2 3 6 .6 % 9 1 4 $ 6 9 0 $ 0 .7 5 5 $ 5 .9 9 2 ,8 1 1 7 ,7 3 8 3 ,3 1 2 2 ,4 8 6F e b . '0 1 8 2 ,1 9 9 7 ,2 1 8 8 .8 % 9 1 8 $ 7 0 0 $ 0 .7 6 3 $ 3 .6 4 1 ,1 0 9 6 ,5 0 2 2 ,1 8 8 3 ,3 8 7A u g . '0 1 8 2 ,8 3 2 8 ,1 0 3 9 .8 % 9 2 3 $ 7 1 3 $ 0 .7 7 2 -$ 7 .0 8 1 ,8 1 2 4 ,6 7 2 1 ,4 1 8 3 ,0 5 7F e b . '0 2 8 5 ,5 1 7 1 1 ,0 6 1 1 2 .9 % 9 2 7 $ 7 1 2 $ 0 .7 6 8 $ 3 .0 3 -4 9 2 3 ,7 5 4 1 ,6 9 0 2 ,6 0 7A u g . '0 2 8 6 ,2 0 5 9 ,6 1 2 1 1 .2 % 9 2 3 $ 7 0 8 $ 0 .7 6 7 $ 0 .4 8 3 ,0 6 9 2 ,8 5 4 6 4 9 1 ,6 8 3
O v e ra ll H is to r ic a l S u m m a ry
Submarket Real Data
8© Sept-02 Real Data www.aptindex.com
Communities 6-15 Years in Age Summary
Communities in Charlotte that are 6 to 15 years in ageinclude 20,039 units. Although by no means out-dated,these communities tend to attract residents who are moreprice sensitive, but still want a relatively modern commu-nity with many of today’s standard amenities.
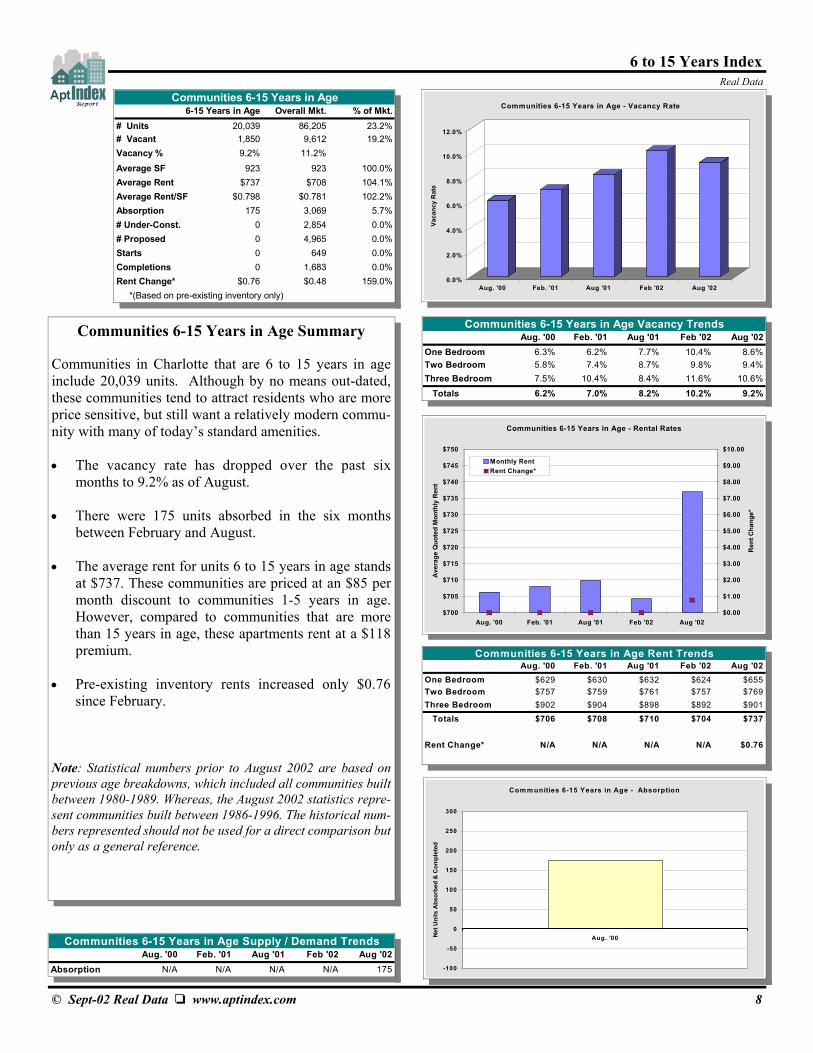
• The vacancy rate has dropped over the past sixmonths to 9.2% as of August.
• There were 175 units absorbed in the six monthsbetween February and August.
• The average rent for units 6 to 15 years in age standsat $737. These communities are priced at an $85 permonth discount to communities 1-5 years in age.However, compared to communities that are morethan 15 years in age, these apartments rent at a $118premium.
• Pre-existing inventory rents increased only $0.76since February.
Note: Statistical numbers prior to August 2002 are based onprevious age breakdowns, which included all communities builtbetween 1980-1989. Whereas, the August 2002 statistics repre-sent communities built between 1986-1996. The historical num-bers represented should not be used for a direct comparison butonly as a general reference.
6 to 15 Years Index
0.0%
2.0%
4.0%
6.0%
8.0%
10.0%
12.0%
Vaca
ncy
Rat
e
Aug. '00 Feb. '01 Aug '01 Feb '02 Aug '02
Communities 6-15 Years in Age - Vacancy Rate
Com m unities 6-15 Years in Age - Absorption
-100
-50
0
50
100
150
200
250
300
Aug. '00Net
Uni
ts A
bsor
bed
& C
ompl
eted
Aug. '00 Feb. '01 Aug '01 Feb '02 Aug '02One Bedroom $629 $630 $632 $624 $655Two Bedroom $757 $759 $761 $757 $769Three Bedroom $902 $904 $898 $892 $901 Totals $706 $708 $710 $704 $737
Rent Change* N/A N/A N/A N/A $0.76
Communities 6-15 Years in Age Rent Trends
Aug. '00 Feb. '01 Aug '01 Feb '02 Aug '02One Bedroom 6.3% 6.2% 7.7% 10.4% 8.6%Two Bedroom 5.8% 7.4% 8.7% 9.8% 9.4%Three Bedroom 7.5% 10.4% 8.4% 11.6% 10.6% Totals 6.2% 7.0% 8.2% 10.2% 9.2%
Communities 6-15 Years in Age Vacancy Trends
Aug. '00 Feb. '01 Aug '01 Feb '02 Aug '02Absorption N/A N/A N/A N/A 175
Communities 6-15 Years in Age Supply / Demand Trends
6-15 Years in Age Overall Mkt. % of Mkt.# Units 20,039 86,205 23.2%# Vacant 1,850 9,612 19.2%Vacancy % 9.2% 11.2%Average SF 923 923 100.0%Average Rent $737 $708 104.1%Average Rent/SF $0.798 $0.781 102.2%Absorption 175 3,069 5.7%# Under-Const. 0 2,854 0.0%# Proposed 0 4,965 0.0%Starts 0 649 0.0%Completions 0 1,683 0.0%Rent Change* $0.76 $0.48 159.0% *(Based on pre-existing inventory only)
Communities 6-15 Years in Age
Communities 6-15 Years in Age - Rental Rates
$700
$705
$710
$715
$720
$725
$730
$735
$740
$745
$750
Aug. '00 Feb. '01 Aug '01 Feb '02 Aug '02
Ave
rage
Quo
ted
Mon
thly
Ren
t
$0.00
$1.00
$2.00
$3.00
$4.00
$5.00
$6.00
$7.00
$8.00
$9.00
$10.00
Ren
t Cha
nge*
Monthly RentRent Change*

SubmarketReal Data
10© Sept-02 Real Data www.aptindex.com
Development
0 100 200 300 400 500 600 700
Units Under Construction
1
Apartments Under Construction
DowntownSoutheast-3Southeast-1NorthSouthwest-1Northeast-2East-2Northeast-1Southwest-2Southeast-2NorthwestNortheast-3East-3East-1GastonYorkUnionIredellCabarrus
0 200 400 600 800 1,000 1,200
Units Proposed
1
Apartments Proposed
Northeast-2NorthwestSoutheast-1YorkDowntownNorthUnionGastonSouthwest-2Southeast-3Northeast-1IredellSoutheast-2East-3East-1Southwest-1East-2Northeast-3Cabarrus
SubmarketReal Data
11© Sept-02 Real Data www.aptindex.com
Development
Communities Under Construction
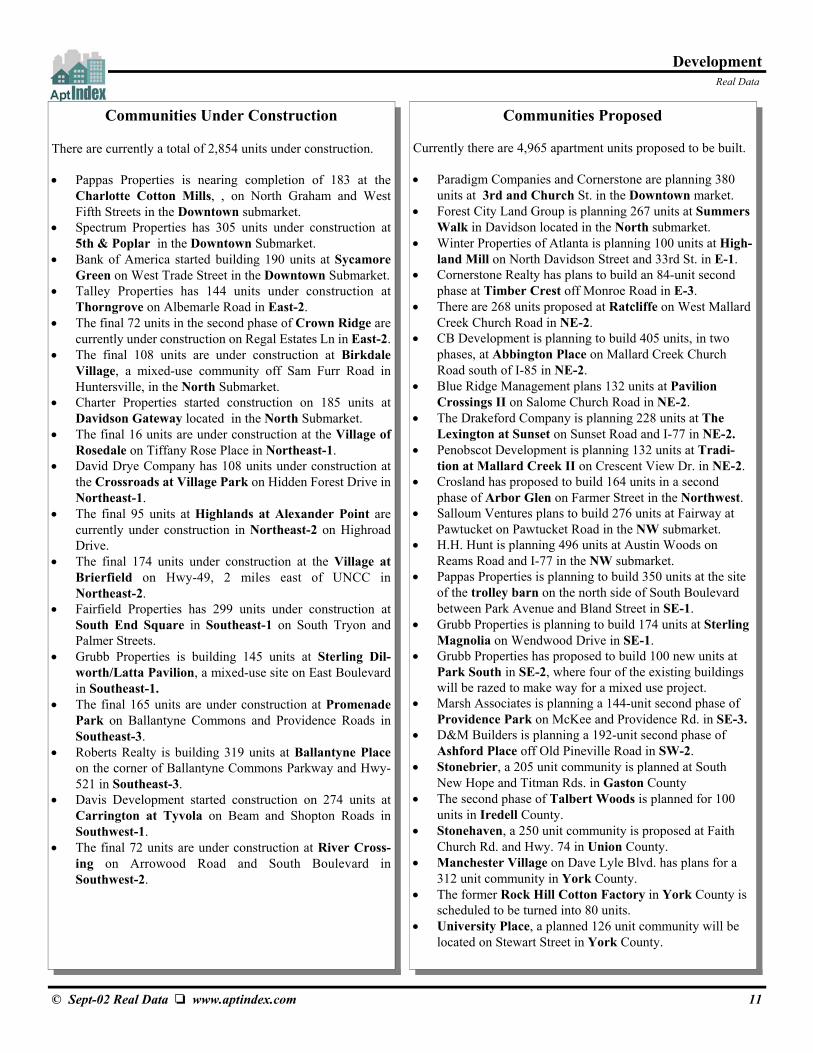
There are currently a total of 2,854 units under construction.
• Pappas Properties is nearing completion of 183 at theCharlotte Cotton Mills, , on North Graham and WestFifth Streets in the Downtown submarket.
• Spectrum Properties has 305 units under construction at5th & Poplar in the Downtown Submarket.
• Bank of America started building 190 units at SycamoreGreen on West Trade Street in the Downtown Submarket.
• Talley Properties has 144 units under construction atThorngrove on Albemarle Road in East-2.
• The final 72 units in the second phase of Crown Ridge arecurrently under construction on Regal Estates Ln in East-2.
• The final 108 units are under construction at BirkdaleVillage, a mixed-use community off Sam Furr Road inHuntersville, in the North Submarket.
• Charter Properties started construction on 185 units atDavidson Gateway located in the North Submarket.
• The final 16 units are under construction at the Village ofRosedale on Tiffany Rose Place in Northeast-1.
• David Drye Company has 108 units under construction atthe Crossroads at Village Park on Hidden Forest Drive inNortheast-1.
• The final 95 units at Highlands at Alexander Point arecurrently under construction in Northeast-2 on HighroadDrive.
• The final 174 units under construction at the Village atBrierfield on Hwy-49, 2 miles east of UNCC inNortheast-2.
• Fairfield Properties has 299 units under construction atSouth End Square in Southeast-1 on South Tryon andPalmer Streets.
• Grubb Properties is building 145 units at Sterling Dil-worth/Latta Pavilion, a mixed-use site on East Boulevardin Southeast-1.
• The final 165 units are under construction at PromenadePark on Ballantyne Commons and Providence Roads inSoutheast-3.
• Roberts Realty is building 319 units at Ballantyne Placeon the corner of Ballantyne Commons Parkway and Hwy-521 in Southeast-3.
• Davis Development started construction on 274 units atCarrington at Tyvola on Beam and Shopton Roads inSouthwest-1.
• The final 72 units are under construction at River Cross-ing on Arrowood Road and South Boulevard inSouthwest-2.
Communities Proposed
Currently there are 4,965 apartment units proposed to be built.
• Paradigm Companies and Cornerstone are planning 380units at 3rd and Church St. in the Downtown market.
• Forest City Land Group is planning 267 units at SummersWalk in Davidson located in the North submarket.
• Winter Properties of Atlanta is planning 100 units at High-land Mill on North Davidson Street and 33rd St. in E-1.
• Cornerstone Realty has plans to build an 84-unit secondphase at Timber Crest off Monroe Road in E-3.
• There are 268 units proposed at Ratcliffe on West MallardCreek Church Road in NE-2.
• CB Development is planning to build 405 units, in twophases, at Abbington Place on Mallard Creek ChurchRoad south of I-85 in NE-2.
• Blue Ridge Management plans 132 units at PavilionCrossings II on Salome Church Road in NE-2.
• The Drakeford Company is planning 228 units at TheLexington at Sunset on Sunset Road and I-77 in NE-2.
• Penobscot Development is planning 132 units at Tradi-tion at Mallard Creek II on Crescent View Dr. in NE-2.
• Crosland has proposed to build 164 units in a secondphase of Arbor Glen on Farmer Street in the Northwest.
• Salloum Ventures plans to build 276 units at Fairway atPawtucket on Pawtucket Road in the NW submarket.
• H.H. Hunt is planning 496 units at Austin Woods onReams Road and I-77 in the NW submarket.
• Pappas Properties is planning to build 350 units at the siteof the trolley barn on the north side of South Boulevardbetween Park Avenue and Bland Street in SE-1.
• Grubb Properties is planning to build 174 units at SterlingMagnolia on Wendwood Drive in SE-1.
• Grubb Properties has proposed to build 100 new units atPark South in SE-2, where four of the existing buildingswill be razed to make way for a mixed use project.
• Marsh Associates is planning a 144-unit second phase ofProvidence Park on McKee and Providence Rd. in SE-3.
• D&M Builders is planning a 192-unit second phase ofAshford Place off Old Pineville Road in SW-2.
• Stonebrier, a 205 unit community is planned at SouthNew Hope and Titman Rds. in Gaston County
• The second phase of Talbert Woods is planned for 100units in Iredell County.
• Stonehaven, a 250 unit community is proposed at FaithChurch Rd. and Hwy. 74 in Union County.
• Manchester Village on Dave Lyle Blvd. has plans for a312 unit community in York County.
• The former Rock Hill Cotton Factory in York County isscheduled to be turned into 80 units.
• University Place, a planned 126 unit community will belocated on Stewart Street in York County.
SubmarketReal Data
12© Sep-02 Real Data www.aptindex.com
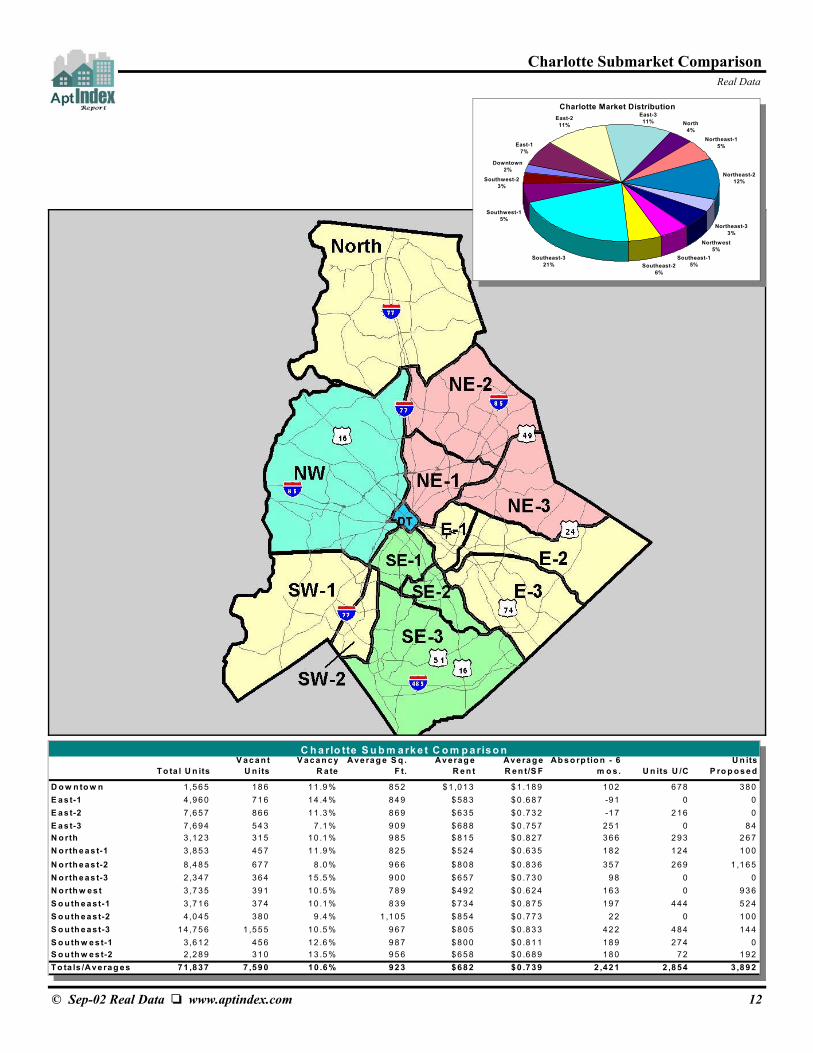
Charlotte Submarket Comparison
T o ta l U n itsV a c a n t
U n itsV a c a n c y
R a teAve ra g e S q .
F t.Av erag e
R e n tAv e ra g e R e n t/S F
Ab s o rp tio n - 6 m o s . U n its U /C
U n its P ro p o s e d
D o w n to w n 1 ,5 6 5 18 6 11 .9 % 8 5 2 $ 1 ,01 3 $ 1 .1 8 9 10 2 6 78 3 8 0E a st-1 4 ,9 6 0 71 6 14 .4 % 8 4 9 $ 58 3 $ 0 .6 8 7 -9 1 0 0E a st-2 7 ,6 5 7 86 6 11 .3 % 8 6 9 $ 63 5 $ 0 .7 3 2 -1 7 2 16 0E a st-3 7 ,6 9 4 54 3 7 .1 % 9 0 9 $ 68 8 $ 0 .7 5 7 25 1 0 8 4N o rth 3 ,1 2 3 31 5 10 .1 % 9 8 5 $ 81 5 $ 0 .8 2 7 36 6 2 93 2 6 7N o rth e a s t-1 3 ,8 5 3 45 7 11 .9 % 8 2 5 $ 52 4 $ 0 .6 3 5 18 2 1 24 1 0 0N o rth e a s t-2 8 ,4 8 5 67 7 8 .0 % 9 6 6 $ 80 8 $ 0 .8 3 6 35 7 2 69 1 ,1 6 5N o rth e a s t-3 2 ,3 4 7 36 4 15 .5 % 9 0 0 $ 65 7 $ 0 .7 3 0 9 8 0 0N o rth w es t 3 ,7 3 5 39 1 10 .5 % 7 8 9 $ 49 2 $ 0 .6 2 4 16 3 0 9 3 6S o u th e a st-1 3 ,7 1 6 37 4 10 .1 % 8 3 9 $ 73 4 $ 0 .8 7 5 19 7 4 44 5 2 4S o u th e a st-2 4 ,0 4 5 38 0 9 .4 % 1 ,1 0 5 $ 85 4 $ 0 .7 7 3 2 2 0 1 0 0S o u th e a st-3 1 4 ,7 5 6 1 ,55 5 10 .5 % 9 6 7 $ 80 5 $ 0 .8 3 3 42 2 4 84 1 4 4S o u th w e s t-1 3 ,6 1 2 45 6 12 .6 % 9 8 7 $ 80 0 $ 0 .8 1 1 18 9 2 74 0S o u th w e s t-2 2 ,2 8 9 31 0 13 .5 % 9 5 6 $ 65 8 $ 0 .6 8 9 18 0 72 1 9 2T o ta ls /Ave ra g es 7 1 ,8 3 7 7 ,59 0 10 .6 % 9 2 3 $ 68 2 $ 0 .7 3 9 2 ,42 1 2 ,8 54 3 ,8 9 2
C h a rlo tte S u b m a rke t C o m p ariso n
Charlotte Market Distribution
Downtown2%
East-17%
East-211% North
4%Northeast-1
5%
Northeast-212%
Northeast-33%
Northwest5%
Southeast-15%Southeast-2
6%
Southeast-321%
Southwest-15%
Southwest-23%
East-311%
SubmarketReal Data
15© Sep-02 Real Data www.aptindex.com
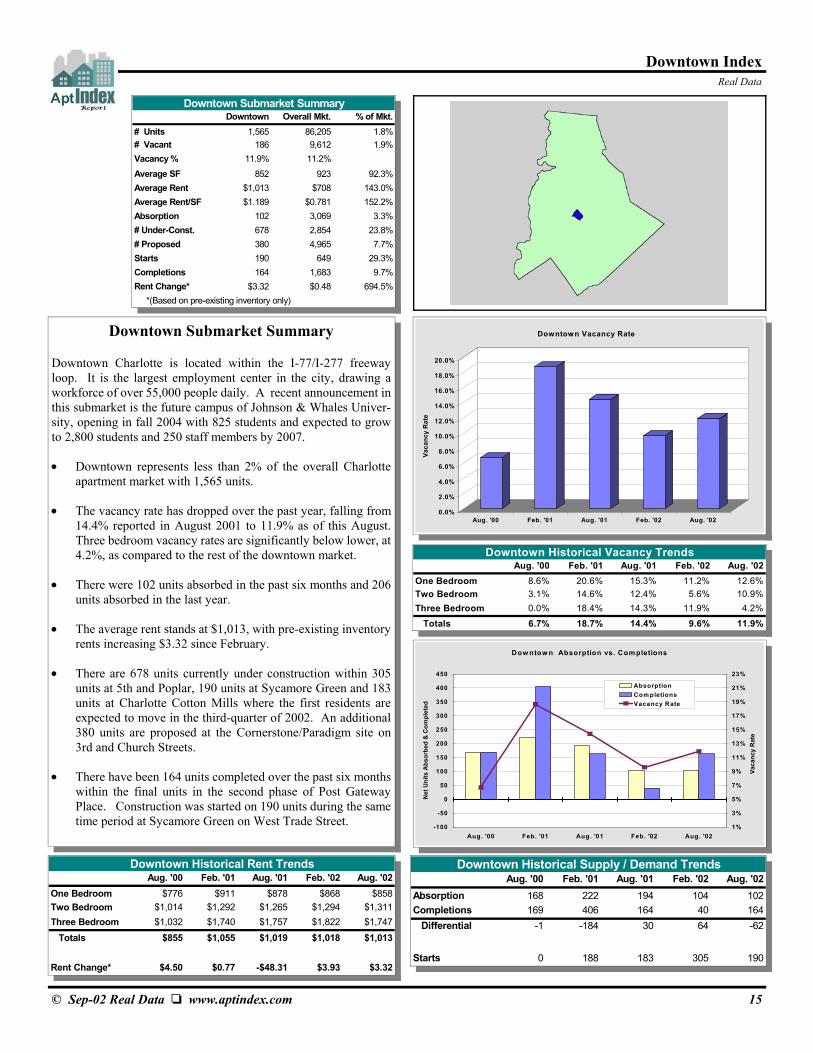
Downtown Submarket Summary
Downtown Charlotte is located within the I-77/I-277 freewayloop. It is the largest employment center in the city, drawing aworkforce of over 55,000 people daily. A recent announcement inthis submarket is the future campus of Johnson & Whales Univer-sity, opening in fall 2004 with 825 students and expected to growto 2,800 students and 250 staff members by 2007.
• Downtown represents less than 2% of the overall Charlotteapartment market with 1,565 units.
• The vacancy rate has dropped over the past year, falling from14.4% reported in August 2001 to 11.9% as of this August.Three bedroom vacancy rates are significantly below lower, at4.2%, as compared to the rest of the downtown market.
• There were 102 units absorbed in the past six months and 206units absorbed in the last year.
• The average rent stands at $1,013, with pre-existing inventoryrents increasing $3.32 since February.
• There are 678 units currently under construction within 305units at 5th and Poplar, 190 units at Sycamore Green and 183units at Charlotte Cotton Mills where the first residents areexpected to move in the third-quarter of 2002. An additional380 units are proposed at the Cornerstone/Paradigm site on3rd and Church Streets.
• There have been 164 units completed over the past six monthswithin the final units in the second phase of Post GatewayPlace. Construction was started on 190 units during the sametime period at Sycamore Green on West Trade Street.
Downtown Index
0.0%
2.0%
4.0%
6.0%
8.0%
10.0%
12.0%
14.0%
16.0%
18.0%
20.0%
Vaca
ncy
Rat
e
Aug. '00 Feb. '01 Aug. '01 Feb. '02 Aug. '02
Downtown Vacancy Rate
Dow ntow n Absorption vs. Completions
-100
-50
0
50
100
150
200
250
300
350
400
450
Aug. '00 Feb. '01 Aug. '01 Feb. '02 Aug. '02
Net
Uni
ts A
bsor
bed
& C
ompl
eted
1%
3%
5%
7%
9%
11%
13%
15%
17%
19%
21%
23%
Vaca
ncy
Rat
e
AbsorptionCom pletionsVacancy Rate
Aug. '00 Feb. '01 Aug. '01 Feb. '02 Aug. '02One Bedroom $776 $911 $878 $868 $858Two Bedroom $1,014 $1,292 $1,265 $1,294 $1,311Three Bedroom $1,032 $1,740 $1,757 $1,822 $1,747 Totals $855 $1,055 $1,019 $1,018 $1,013
Rent Change* $4.50 $0.77 -$48.31 $3.93 $3.32
Downtown Historical Rent Trends
Aug. '00 Feb. '01 Aug. '01 Feb. '02 Aug. '02One Bedroom 8.6% 20.6% 15.3% 11.2% 12.6%Two Bedroom 3.1% 14.6% 12.4% 5.6% 10.9%Three Bedroom 0.0% 18.4% 14.3% 11.9% 4.2% Totals 6.7% 18.7% 14.4% 9.6% 11.9%
Downtown Historical Vacancy Trends
Aug. '00 Feb. '01 Aug. '01 Feb. '02 Aug. '02Absorption 168 222 194 104 102Completions 169 406 164 40 164 Differential -1 -184 30 64 -62
Starts 0 188 183 305 190
Downtown Historical Supply / Demand Trends
Downtown Overall Mkt. % of Mkt.# Units 1,565 86,205 1.8%# Vacant 186 9,612 1.9%Vacancy % 11.9% 11.2%Average SF 852 923 92.3%Average Rent $1,013 $708 143.0%Average Rent/SF $1.189 $0.781 152.2%Absorption 102 3,069 3.3%# Under-Const. 678 2,854 23.8%# Proposed 380 4,965 7.7%Starts 190 649 29.3%Completions 164 1,683 9.7%Rent Change* $3.32 $0.48 694.5% *(Based on pre-existing inventory only)
Downtown Submarket Summary
SubmarketReal Data
© Sep-02 Real Data www.aptindex.com
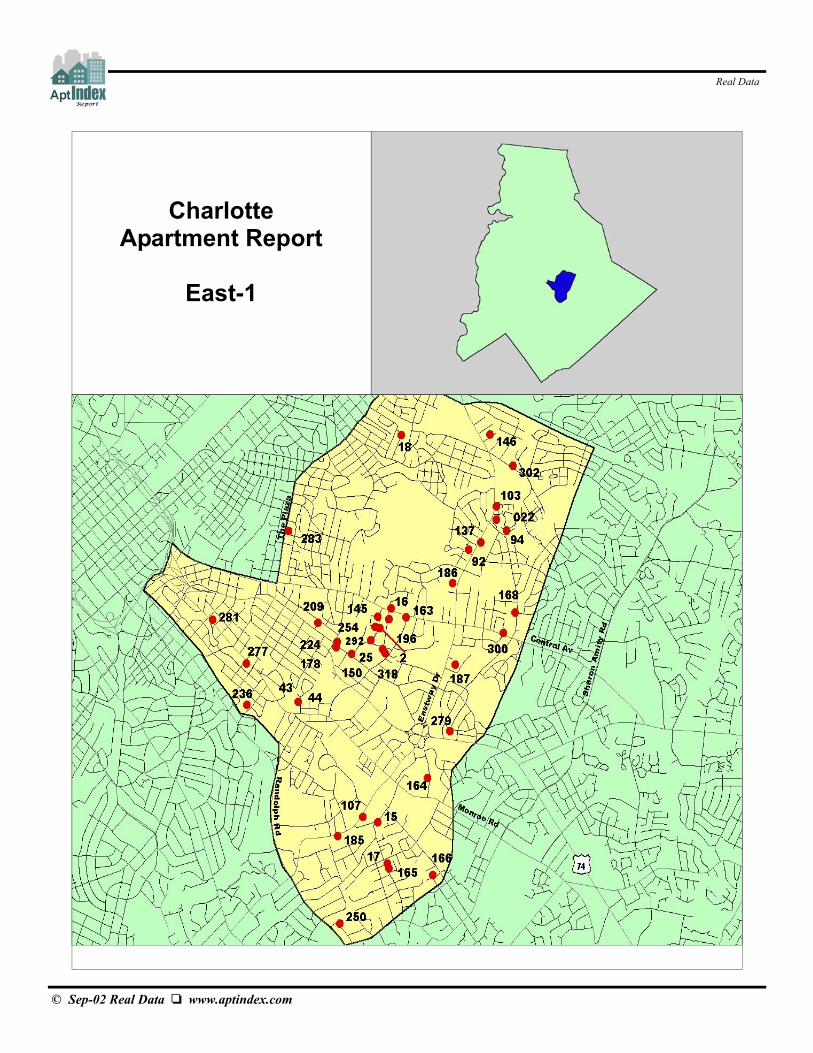
CharlotteApartment Report
East-1

Sample NORTHEAST - 2Management
3800 DRY BROOK ROAD
CHARLOTTE, NC 28269
Year Built: 1996
PENNOBSCOTT MGNT
545 CEDAR LANE
TEANECK, NJ 07666
2018360099
(704) 599-6400
Community Features
Swimming PoolTennis Courts
Rec./Exer. RoomFireplace
Clubhouse
W/D ConnectW/D Units
Laundry Facility
Recycling
Storage
MicrowaveCeiling Fan
Garage
Burglar AlarmsControlled Access
Security GuardCourtesy Officer
Water Heat Elec. CableTV .
Utilities Included
Application Fee: $40
Pets / Fees Security Deposit / Fees
Dep. Refundable: $100
Dep. NON-Refund $100
Dep. Refundable: $250
Dep. NON-Refund: $0
Turnover Rate :
Fax: (704) 599-6401
Playground/Court
Current Rent Concessions
Carport
$0
$0
$0
$40$90
$0
Floorplan features- fee
$0$0$0
$35$0Upper Floor
View
Business Center
Patio/Balcony $09' Ceilings $0
UP TO 2 MONTHS FREE RENT
Area: NORTHEAST - 2
Current Occupancy / Rents as of Historical Occupancy / Rents
Ownership
PENNOBSCOTT LLC 545 CEDAR LANE TEANECK 07666-
(201) 836-0099 Fax:NJ
Purchase Date: 06/30/01Purchase Price:
Tax Parcel: 02739299
In Lease Up: No
Acreage: 18.286Units / Acre: 12
# Floors: 2-3 FLOORS
Units U/C: 0
Map
332
Bldg. Status: COMPLETED
BROOKSTONE
Units Proposed: 0
Construction Information
Current Deposts / Fees / Concessions
Pets Allowed: Yes
Price/Unit:
Tel:
Tel:
Fax:
Tel:Units Complete: 226
Pet Rent / month:
Yes -
08/15/02
PENNOBSCOTT MANAGEMENT ONE REMINGTON LANE SCHAUMBURG 60195-
(847) 884-0867 Fax:IL
Tel:
Current market statistics not available for this community
Type: CONVENTIONAL
Map #: 332
Sq. Ft.Bdrms Bath Type Rent Range Units Vac. Rent/sf Vac.%
789GRDN 5$690$690 -1 1 60 8.3%$0.875
990DEN 1$790$790 -1 1 36 2.8%$0.798
1,162GRDN 9$860$860 -2 2 102 8.8%$0.740
1,370GRDN 4$1,050$1,050 -3 2 28 14.3%$0.7661,061Totals/Averages $0.788 226 19 8.4%
One Two ThreeRents by Bedrooms
$740 $860 $1,050$740 $860 $1,050$791 $920 $1,115$781 $920 $1,100$780 $920 $1,100$771 $903 $1,080$760 $875 $1,075$781 $893 $1,075$781 $893 $1,030$755 $875 $1,020$750 $865 $1,020$730 $865 $1,000$730 $865 $1,000
Units Vac # Vac %SurveyDate
226 19 8.4%08/15/02226 1 0.4%02/15/02226 3 1.3%08/15/01226 16 7.1%02/15/01226 10 4.4%08/15/00226 16 7.1%02/15/00226 19 8.4%08/15/99226 33 14.6%02/15/99226 5 2.2%08/15/98226 13 5.8%02/15/98226 12 5.3%08/15/97226 3 1.3%02/15/97226 44 19.5%08/15/96
Copyright 2002 - Real Data -

Sample Market Statistics by Unit Mix
Total Units Vacant UnitsUnit Mix % of Market Avg.S.F.Vacancy Rate SOUTHEAST-1 Avg.Rent
1 2,756 15741% 5.7% 744$6752 3,422 19950% 5.8% 1,078$8233 621 579% 9.2% 1,472$1,044
6,799 413100% 6.1%
Total Units Vacant UnitsUnit Mix % of Market Avg.S.F.Vacancy Rate SOUTHEAST-2 Avg.Rent
1 2,866 11238% 3.9% 757$5992 3,812 21150% 5.5% 1,075$7263 803 5411% 6.7% 1,356$9004 82 91% 11.0% 1,970$1,047
7,563 386100% 5.1%
Total Units Vacant UnitsUnit Mix % of Market Avg.S.F.Vacancy Rate SOUTHEAST-3 Avg.Rent
1 1,545 9835% 6.3% 818$6962 2,188 17149% 7.8% 1,126$8393 702 6416% 9.1% 1,373$1,1014 18 20% 11.1% 2,081$1,795
4,453 335100% 7.5%
Total Units Vacant UnitsUnit Mix % of Market Avg.S.F.Vacancy Rate SOUTHWEST-1 Avg.Rent
1 1,737 5038% 2.9% 774$6482 2,297 9051% 3.9% 1,079$7513 498 2511% 5.0% 1,269$8904 4 00% 0.0% 1,280$676
4,536 165100% 3.6%
Total Units Vacant UnitsUnit Mix % of Market Avg.S.F.Vacancy Rate SOUTHWEST-2 Avg.Rent
1 2,319 13741% 5.9% 721$5112 2,736 20448% 7.5% 987$6193 663 4212% 6.3% 1,242$725
5,718 383100% 6.7%
Total Units Vacant UnitsUnit Mix % of Market Avg.S.F.Vacancy Rate UNION COUNTY- Avg.Rent
1 505 3033% 5.9% 560$5012 835 5454% 6.5% 902$6183 198 1013% 5.1% 1,161$738
1,538 94100% 6.1%
Total Units Vacant UnitsUnit Mix % of Market Avg.S.F.Vacancy Rate YORK COUNTY- Avg.Rent
1 1,401 10626% 7.6% 713$5592 3,059 28656% 9.3% 1,012$6313 893 6016% 6.7% 1,282$7694 92 202% 21.7% 1,144$1,580
5,445 472100% 8.7%
Stats by Unit Mix - 3© 2005 Real Data (704)369-2345

Sample Market Statistics by Type
Total Units Vacant UnitsType Classified % of Market Avg.S.F.Vacancy Rate NORTHEAST-1 Avg.Rent
STUDENT 3,119 56694% 18.1% 847$509TAX CREDIT 195 116% 5.6% 1,041$545
3,314 577100% 17.4%
Total Units Vacant UnitsType Classified % of Market Avg.S.F.Vacancy Rate NORTHEAST-2 Avg.Rent
CONVENTIONAL 4,606 28095% 6.1% 986$748TAX CREDIT 235 1255% 53.2% 1,232$835
4,841 405100% 8.4%
Total Units Vacant UnitsType Classified % of Market Avg.S.F.Vacancy Rate NORTHEAST-3 Avg.Rent
CONVENTIONAL 4,886 32689% 6.7% 960$731STUDENT 588 11011% 18.7% 1,294$1,509
5,474 436100% 8.0%
Total Units Vacant UnitsType Classified % of Market Avg.S.F.Vacancy Rate NORTHWEST-1 Avg.Rent
CONVENTIONAL 2,657 36078% 13.5% 796$462TAX CREDIT 739 21122% 28.6% 749$452
3,396 571100% 16.8%
Total Units Vacant UnitsType Classified % of Market Avg.S.F.Vacancy Rate NORTHWEST-2 Avg.Rent
CONVENTIONAL 71 4100% 5.6% 894$48371 4100% 5.6%
Total Units Vacant UnitsType Classified % of Market Avg.S.F.Vacancy Rate SOUTHEAST-1 Avg.Rent
CONVENTIONAL 7,180 57899% 8.1% 966$795STUDENT 50 31% 6.0% 985$436
7,230 581100% 8.0%
Total Units Vacant UnitsType Classified % of Market Avg.S.F.Vacancy Rate SOUTHEAST-2 Avg.Rent
CONVENTIONAL 7,785 53999% 6.9% 993$705TAX CREDIT 55 01% 0.0% 974$399
7,840 539100% 6.9%
Total Units Vacant UnitsType Classified % of Market Avg.S.F.Vacancy Rate SOUTHEAST-3 Avg.Rent
CONVENTIONAL 4,105 62295% 15.2% 1,067$820TAX CREDIT 200 105% 5.0% 963$665
4,305 632100% 14.7%
Index by Type Classification - 2© 2005 Real Data (704)369-2345
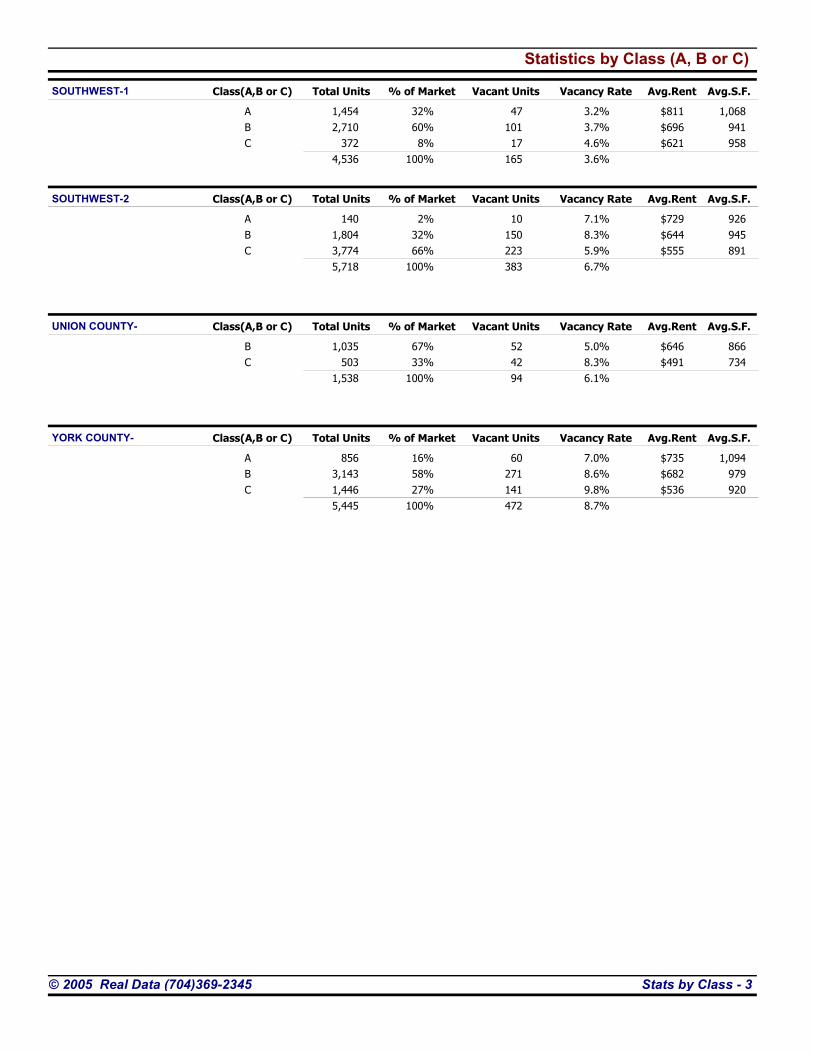
Statistics by Class (A, B or C)
Total Units Vacant UnitsClass(A,B or C) % of Market Avg.S.F.Vacancy Rate SOUTHWEST-1 Avg.Rent
A 1,454 4732% 3.2% 1,068$811B 2,710 10160% 3.7% 941$696C 372 178% 4.6% 958$621
4,536 165100% 3.6%
Total Units Vacant UnitsClass(A,B or C) % of Market Avg.S.F.Vacancy Rate SOUTHWEST-2 Avg.Rent
A 140 102% 7.1% 926$729B 1,804 15032% 8.3% 945$644C 3,774 22366% 5.9% 891$555
5,718 383100% 6.7%
Total Units Vacant UnitsClass(A,B or C) % of Market Avg.S.F.Vacancy Rate UNION COUNTY- Avg.Rent
B 1,035 5267% 5.0% 866$646C 503 4233% 8.3% 734$491
1,538 94100% 6.1%
Total Units Vacant UnitsClass(A,B or C) % of Market Avg.S.F.Vacancy Rate YORK COUNTY- Avg.Rent
A 856 6016% 7.0% 1,094$735B 3,143 27158% 8.6% 979$682C 1,446 14127% 9.8% 920$536
5,445 472100% 8.7%
Stats by Class - 3© 2005 Real Data (704)369-2345
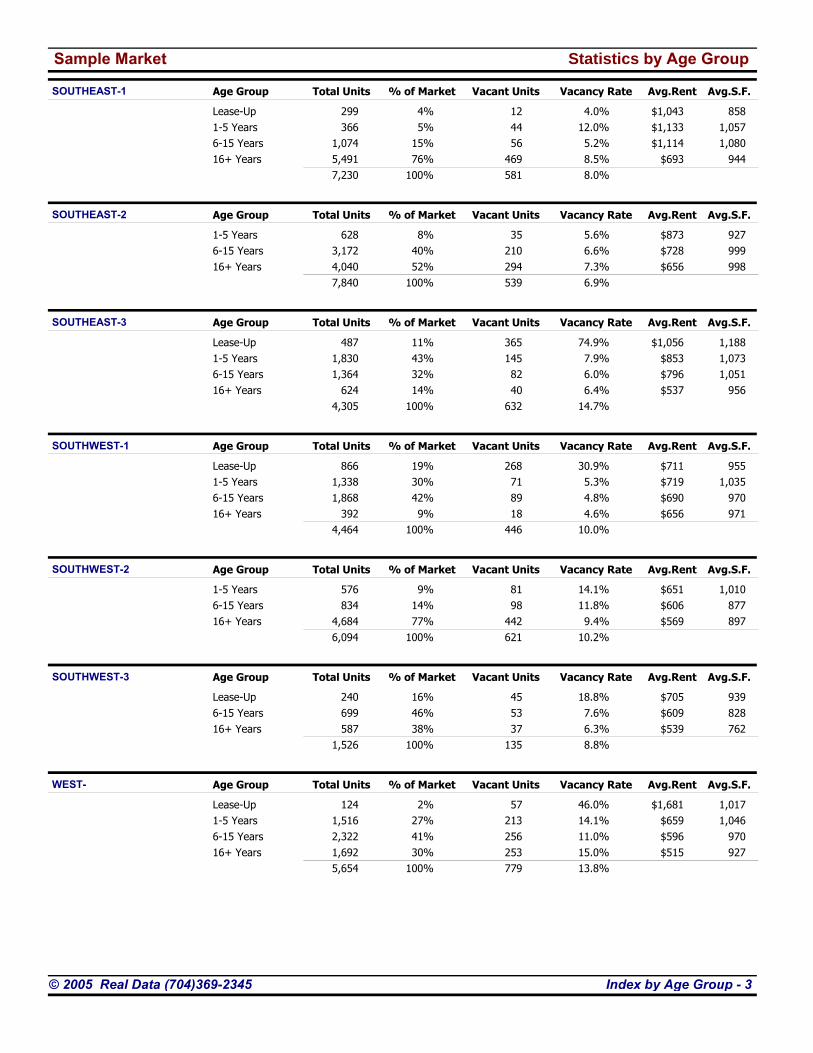
Sample Market Statistics by Age Group
Total Units Vacant UnitsAge Group % of Market Avg.S.F.Vacancy Rate SOUTHEAST-1 Avg.Rent
Lease-Up 299 124% 4.0% 858$1,0431-5 Years 366 445% 12.0% 1,057$1,1336-15 Years 1,074 5615% 5.2% 1,080$1,11416+ Years 5,491 46976% 8.5% 944$693
7,230 581100% 8.0%
Total Units Vacant UnitsAge Group % of Market Avg.S.F.Vacancy Rate SOUTHEAST-2 Avg.Rent
1-5 Years 628 358% 5.6% 927$8736-15 Years 3,172 21040% 6.6% 999$72816+ Years 4,040 29452% 7.3% 998$656
7,840 539100% 6.9%
Total Units Vacant UnitsAge Group % of Market Avg.S.F.Vacancy Rate SOUTHEAST-3 Avg.Rent
Lease-Up 487 36511% 74.9% 1,188$1,0561-5 Years 1,830 14543% 7.9% 1,073$8536-15 Years 1,364 8232% 6.0% 1,051$79616+ Years 624 4014% 6.4% 956$537
4,305 632100% 14.7%
Total Units Vacant UnitsAge Group % of Market Avg.S.F.Vacancy Rate SOUTHWEST-1 Avg.Rent
Lease-Up 866 26819% 30.9% 955$7111-5 Years 1,338 7130% 5.3% 1,035$7196-15 Years 1,868 8942% 4.8% 970$69016+ Years 392 189% 4.6% 971$656
4,464 446100% 10.0%
Total Units Vacant UnitsAge Group % of Market Avg.S.F.Vacancy Rate SOUTHWEST-2 Avg.Rent
1-5 Years 576 819% 14.1% 1,010$6516-15 Years 834 9814% 11.8% 877$60616+ Years 4,684 44277% 9.4% 897$569
6,094 621100% 10.2%
Total Units Vacant UnitsAge Group % of Market Avg.S.F.Vacancy Rate SOUTHWEST-3 Avg.Rent
Lease-Up 240 4516% 18.8% 939$7056-15 Years 699 5346% 7.6% 828$60916+ Years 587 3738% 6.3% 762$539
1,526 135100% 8.8%
Total Units Vacant UnitsAge Group % of Market Avg.S.F.Vacancy Rate WEST- Avg.Rent
Lease-Up 124 572% 46.0% 1,017$1,6811-5 Years 1,516 21327% 14.1% 1,046$6596-15 Years 2,322 25641% 11.0% 970$59616+ Years 1,692 25330% 15.0% 927$515
5,654 779100% 13.8%
Index by Age Group - 3© 2005 Real Data (704)369-2345
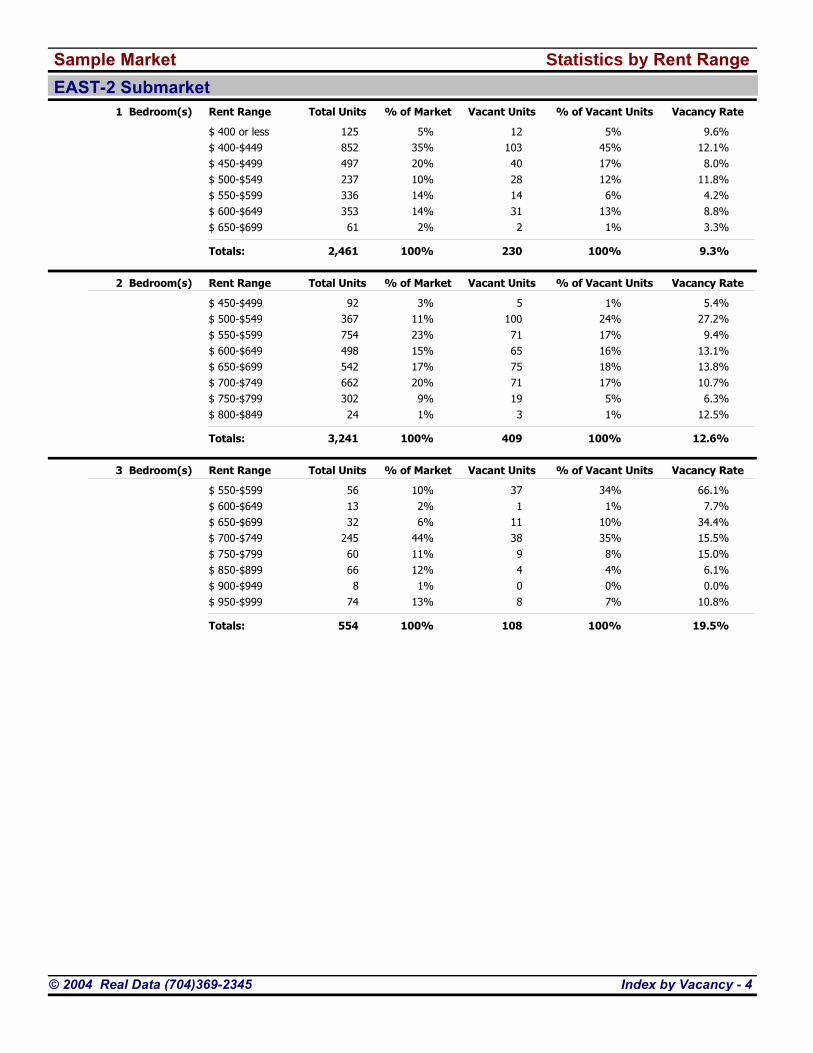
Sample Market Statistics by Rent Range EAST-2 Submarket
Bedroom(s)1 Total Units Vacant UnitsRent Range % of Market % of Vacant Units Vacancy Rate
$ 400 or less 125 125% 5% 9.6%$ 400-$449 852 10335% 45% 12.1%$ 450-$499 497 4020% 17% 8.0%$ 500-$549 237 2810% 12% 11.8%$ 550-$599 336 1414% 6% 4.2%$ 600-$649 353 3114% 13% 8.8%$ 650-$699 61 22% 1% 3.3%
2,461 230Totals: 100% 100% 9.3%
Bedroom(s)2 Total Units Vacant UnitsRent Range % of Market % of Vacant Units Vacancy Rate
$ 450-$499 92 53% 1% 5.4%$ 500-$549 367 10011% 24% 27.2%$ 550-$599 754 7123% 17% 9.4%$ 600-$649 498 6515% 16% 13.1%$ 650-$699 542 7517% 18% 13.8%$ 700-$749 662 7120% 17% 10.7%$ 750-$799 302 199% 5% 6.3%$ 800-$849 24 31% 1% 12.5%
3,241 409Totals: 100% 100% 12.6%
Bedroom(s)3 Total Units Vacant UnitsRent Range % of Market % of Vacant Units Vacancy Rate
$ 550-$599 56 3710% 34% 66.1%$ 600-$649 13 12% 1% 7.7%$ 650-$699 32 116% 10% 34.4%$ 700-$749 245 3844% 35% 15.5%$ 750-$799 60 911% 8% 15.0%$ 850-$899 66 412% 4% 6.1%$ 900-$949 8 01% 0% 0.0%$ 950-$999 74 813% 7% 10.8%
554 108Totals: 100% 100% 19.5%
Index by Vacancy - 4© 2004 Real Data (704)369-2345
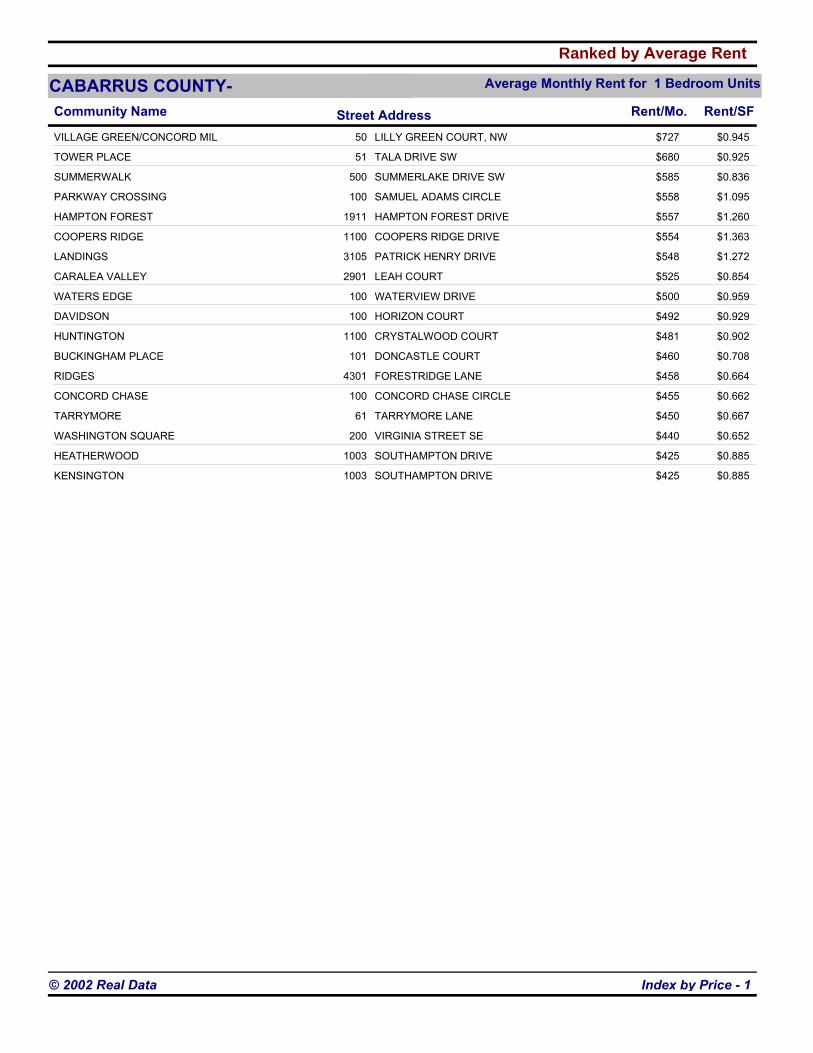
Ranked by Average Rent
CABARRUS COUNTY- Average Monthly Rent for 1 Bedroom Units
Community Name Street Address Rent/Mo. Rent/SF
VILLAGE GREEN/CONCORD MIL $72750 LILLY GREEN COURT, NW $0.945
TOWER PLACE $68051 TALA DRIVE SW $0.925
SUMMERWALK $585500 SUMMERLAKE DRIVE SW $0.836
PARKWAY CROSSING $558100 SAMUEL ADAMS CIRCLE $1.095
HAMPTON FOREST $5571911 HAMPTON FOREST DRIVE $1.260
COOPERS RIDGE $5541100 COOPERS RIDGE DRIVE $1.363
LANDINGS $5483105 PATRICK HENRY DRIVE $1.272
CARALEA VALLEY $5252901 LEAH COURT $0.854
WATERS EDGE $500100 WATERVIEW DRIVE $0.959
DAVIDSON $492100 HORIZON COURT $0.929
HUNTINGTON $4811100 CRYSTALWOOD COURT $0.902
BUCKINGHAM PLACE $460101 DONCASTLE COURT $0.708
RIDGES $4584301 FORESTRIDGE LANE $0.664
CONCORD CHASE $455100 CONCORD CHASE CIRCLE $0.662
TARRYMORE $45061 TARRYMORE LANE $0.667
WASHINGTON SQUARE $440200 VIRGINIA STREET SE $0.652
HEATHERWOOD $4251003 SOUTHAMPTON DRIVE $0.885
KENSINGTON $4251003 SOUTHAMPTON DRIVE $0.885
Index by Price - 1© 2002 Real Data
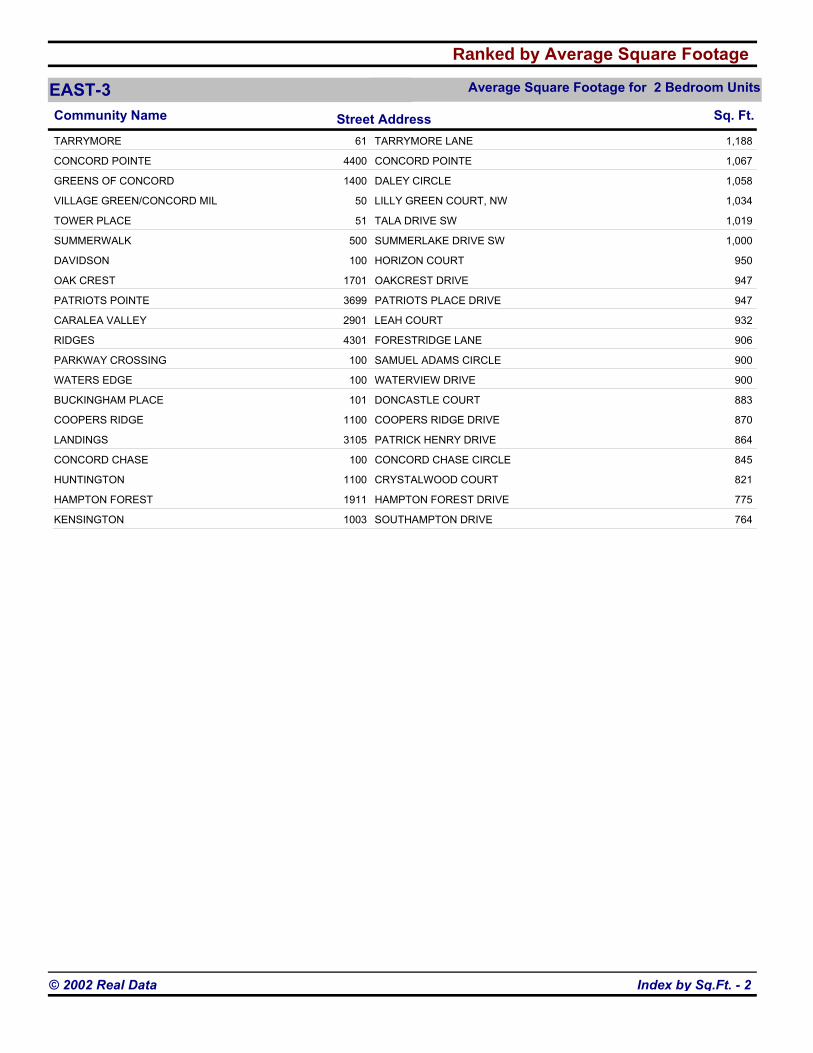
Ranked by Average Square Footage
EAST-3 Average Square Footage for 2 Bedroom Units
Community Name Street Address Sq. Ft.
TARRYMORE 61 TARRYMORE LANE 1,188
CONCORD POINTE 4400 CONCORD POINTE 1,067
GREENS OF CONCORD 1400 DALEY CIRCLE 1,058
VILLAGE GREEN/CONCORD MIL 50 LILLY GREEN COURT, NW 1,034
TOWER PLACE 51 TALA DRIVE SW 1,019
SUMMERWALK 500 SUMMERLAKE DRIVE SW 1,000
DAVIDSON 100 HORIZON COURT 950
OAK CREST 1701 OAKCREST DRIVE 947
PATRIOTS POINTE 3699 PATRIOTS PLACE DRIVE 947
CARALEA VALLEY 2901 LEAH COURT 932
RIDGES 4301 FORESTRIDGE LANE 906
PARKWAY CROSSING 100 SAMUEL ADAMS CIRCLE 900
WATERS EDGE 100 WATERVIEW DRIVE 900
BUCKINGHAM PLACE 101 DONCASTLE COURT 883
COOPERS RIDGE 1100 COOPERS RIDGE DRIVE 870
LANDINGS 3105 PATRICK HENRY DRIVE 864
CONCORD CHASE 100 CONCORD CHASE CIRCLE 845
HUNTINGTON 1100 CRYSTALWOOD COURT 821
HAMPTON FOREST 1911 HAMPTON FOREST DRIVE 775
KENSINGTON 1003 SOUTHAMPTON DRIVE 764
Index by Sq.Ft. - 2© 2002 Real Data
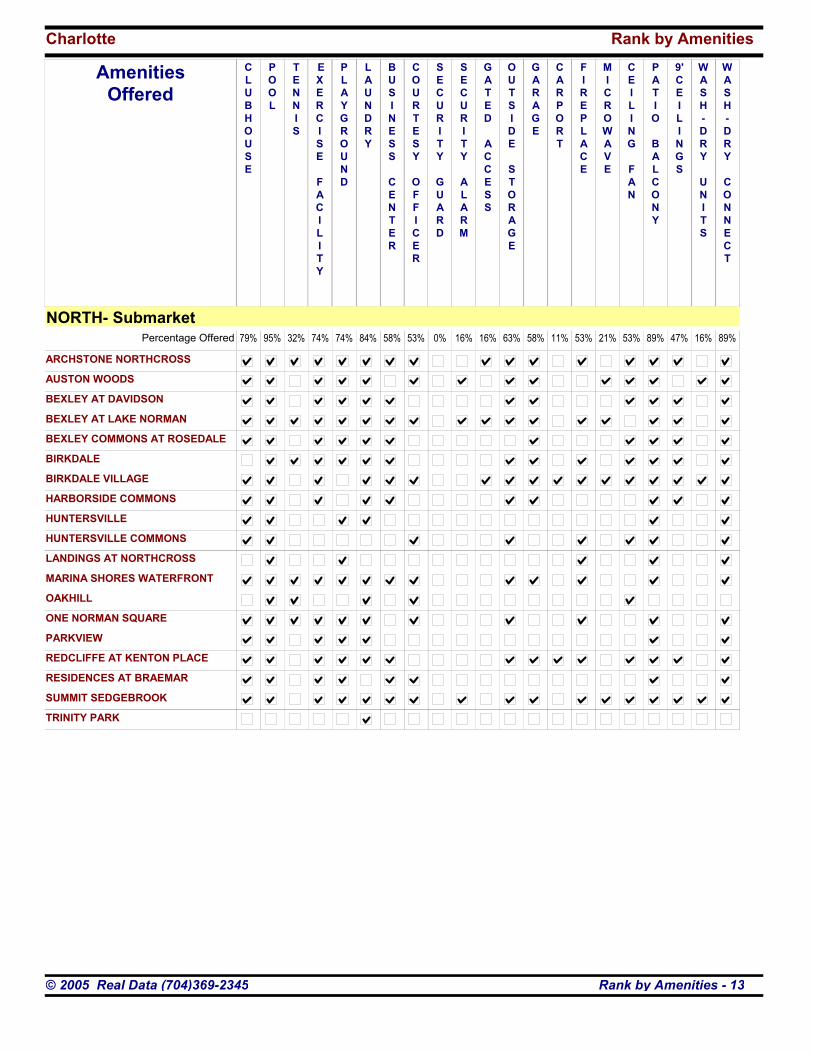
Charlotte Rank by Amenities GATED ACCESS
SECURITY
ALARM
SECURITY
GUARD
COURTESY OFFICER
FIREPLACE
POOL
TENNIS
EXERCISE
FACILITY
CLUBHOUSE
WASH-DRY CONNECT
WASH-DRY
UNITS
LAUNDRY
MICROWAVE
CEILING
FAN
GARAGE
BUSINESS
CENTER
PATIO
BALCONY
9'CEILINGS
PLAYGROUND
OUTSIDE STORAGE
CARPORT
Amenities Offered
NORTH- Submarket95% 32% 74% 74% 84% 58% 53% 0% 16% 16% 63% 58% 11% 53% 21% 53% 89% 47% 16% 89%79%Percentage Offered
ARCHSTONE NORTHCROSS
AUSTON WOODS
BEXLEY AT DAVIDSON
BEXLEY AT LAKE NORMAN
BEXLEY COMMONS AT ROSEDALE
BIRKDALE
BIRKDALE VILLAGE
HARBORSIDE COMMONS
HUNTERSVILLE
HUNTERSVILLE COMMONS
LANDINGS AT NORTHCROSS
MARINA SHORES WATERFRONT
OAKHILL
ONE NORMAN SQUARE
PARKVIEW
REDCLIFFE AT KENTON PLACE
RESIDENCES AT BRAEMAR
SUMMIT SEDGEBROOK
TRINITY PARK
Rank by Amenities - 13© 2005 Real Data (704)369-2345
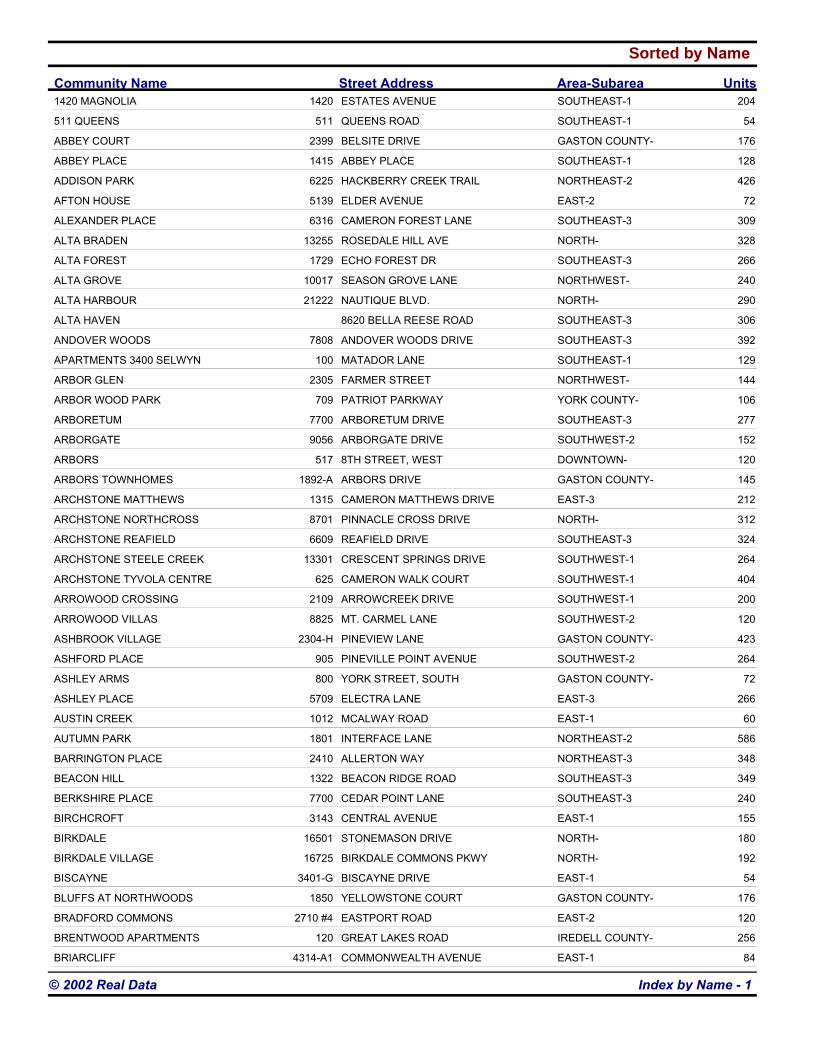
Sorted by Name
Community Name Street Address Area-Subarea Units1420 MAGNOLIA 2041420 ESTATES AVENUE SOUTHEAST-1
511 QUEENS 54511 QUEENS ROAD SOUTHEAST-1
ABBEY COURT 1762399 BELSITE DRIVE GASTON COUNTY-
ABBEY PLACE 1281415 ABBEY PLACE SOUTHEAST-1
ADDISON PARK 4266225 HACKBERRY CREEK TRAIL NORTHEAST-2
AFTON HOUSE 725139 ELDER AVENUE EAST-2
ALEXANDER PLACE 3096316 CAMERON FOREST LANE SOUTHEAST-3
ALTA BRADEN 32813255 ROSEDALE HILL AVE NORTH-
ALTA FOREST 2661729 ECHO FOREST DR SOUTHEAST-3
ALTA GROVE 24010017 SEASON GROVE LANE NORTHWEST-
ALTA HARBOUR 29021222 NAUTIQUE BLVD. NORTH-
ALTA HAVEN 3068620 BELLA REESE ROAD SOUTHEAST-3
ANDOVER WOODS 3927808 ANDOVER WOODS DRIVE SOUTHEAST-3
APARTMENTS 3400 SELWYN 129100 MATADOR LANE SOUTHEAST-1
ARBOR GLEN 1442305 FARMER STREET NORTHWEST-
ARBOR WOOD PARK 106709 PATRIOT PARKWAY YORK COUNTY-
ARBORETUM 2777700 ARBORETUM DRIVE SOUTHEAST-3
ARBORGATE 1529056 ARBORGATE DRIVE SOUTHWEST-2
ARBORS 120517 8TH STREET, WEST DOWNTOWN-
ARBORS TOWNHOMES 1451892-A ARBORS DRIVE GASTON COUNTY-
ARCHSTONE MATTHEWS 2121315 CAMERON MATTHEWS DRIVE EAST-3
ARCHSTONE NORTHCROSS 3128701 PINNACLE CROSS DRIVE NORTH-
ARCHSTONE REAFIELD 3246609 REAFIELD DRIVE SOUTHEAST-3
ARCHSTONE STEELE CREEK 26413301 CRESCENT SPRINGS DRIVE SOUTHWEST-1
ARCHSTONE TYVOLA CENTRE 404625 CAMERON WALK COURT SOUTHWEST-1
ARROWOOD CROSSING 2002109 ARROWCREEK DRIVE SOUTHWEST-1
ARROWOOD VILLAS 1208825 MT. CARMEL LANE SOUTHWEST-2
ASHBROOK VILLAGE 4232304-H PINEVIEW LANE GASTON COUNTY-
ASHFORD PLACE 264905 PINEVILLE POINT AVENUE SOUTHWEST-2
ASHLEY ARMS 72800 YORK STREET, SOUTH GASTON COUNTY-
ASHLEY PLACE 2665709 ELECTRA LANE EAST-3
AUSTIN CREEK 601012 MCALWAY ROAD EAST-1
AUTUMN PARK 5861801 INTERFACE LANE NORTHEAST-2
BARRINGTON PLACE 3482410 ALLERTON WAY NORTHEAST-3
BEACON HILL 3491322 BEACON RIDGE ROAD SOUTHEAST-3
BERKSHIRE PLACE 2407700 CEDAR POINT LANE SOUTHEAST-3
BIRCHCROFT 1553143 CENTRAL AVENUE EAST-1
BIRKDALE 18016501 STONEMASON DRIVE NORTH-
BIRKDALE VILLAGE 19216725 BIRKDALE COMMONS PKWY NORTH-
BISCAYNE 543401-G BISCAYNE DRIVE EAST-1
BLUFFS AT NORTHWOODS 1761850 YELLOWSTONE COURT GASTON COUNTY-
BRADFORD COMMONS 1202710 #4 EASTPORT ROAD EAST-2
BRENTWOOD APARTMENTS 256120 GREAT LAKES ROAD IREDELL COUNTY-
BRIARCLIFF 844314-A1 COMMONWEALTH AVENUE EAST-1
Index by Name - 1© 2002 Real Data

Sorted by Year Built Complex Name Street Address Area-Subarea Yr. BuiltCONCORD CHASE 2002100 CONCORD CHASE CIRCLE CABARRUS COUNTY-
RIVER CROSSING 20028030 SYCAMORE CREEK DRIVE SOUTHWEST-2
VILLAGE OF BRIERFIELD 200211609 WINDY CREEK DRIVE NORTHEAST-2
ARBOR GLEN 20022305 FARMER STREET NORTHWEST-
UNIVERSITY WALK 20021205 UNIVERSITY WALK CIRCLE NORTHEAST-2
BIRKDALE VILLAGE 200216725 BIRKDALE COMMONS PKWY NORTH-
LINKS AT CITISIDE 20025005 COMMUNITY CIRCLE DRIVE NORTHEAST-3
PROMENADE PARK 200211115 SHADOW GROVE CIRCLE SOUTHEAST-3
VILLAGE OF ROSEDALE 20023925 TIFFANY ROSE PLACE NORTHEAST-1
VILLAGE GREEN/CONCORD MIL 200150 LILLY GREEN COURT, NW CABARRUS COUNTY-
STONE RIDGE 20018940 CAMDEN CREEK LANE SOUTHWEST-1
LODGE 200111215 CLUB CREEK LANE SOUTHEAST-3
ASHFORD PLACE 2001905 PINEVILLE POINT AVENUE SOUTHWEST-2
LODGE AT OLD CONCORD 20011301 IVY MEADOW DRIVE NORTHEAST-2
ENCLAVE @ SOUTH TRYON 20017601 HOLLISWOOD COURT SOUTHWEST-1
TALBERT WOODS 2001170 RUSTWOOD DRIVE IREDELL COUNTY-
LAWYERS RIDGE 20015310 MCALPINE GLEN DRIVE EAST-2
BRITTANY PLACE 2001190 MAIN STREET, WEST YORK COUNTY-
REDCLIFFE AT KENTON PLACE 20018101 DUNMORE DRIVE NORTH-
VILLAGES OF BROOKSTONE 20011800 MARETT BOULEVARD YORK COUNTY-
LEGACY PARK 20018810 LEGACY PARK DRIVE NORTHEAST-2
VININGS AT MATTHEWS 200112825 VININGS CREEK DRIVE SOUTHEAST-3
ARROWOOD VILLAS 20018825 MT. CARMEL LANE SOUTHWEST-2
TOWER PLACE 200151 TALA DRIVE SW CABARRUS COUNTY-
SHARON POINTE 20015620 SHARON POINTE ROAD NORTHEAST-3
CHESWYCK GREEN 200114125 WYNHOLLOW DOWNS LANE SOUTHEAST-3
EASTOVER RIDGE II 20013300 EASTOVER RIDGE DRIVE SOUTHEAST-1
ALTA HAVEN 20018620 BELLA REESE ROAD SOUTHEAST-3
LANDINGS AT STEELE CREEK 20014250 BRANCH BEND LANE SOUTHWEST-1
HIGHLANDS@ ALEXANDER PT. 2001310 HIGHROAD DRIVE NORTHEAST-2
FOREST OAKS AT WOODLAND 20001878 GINGERCAKE CIRCLE YORK COUNTY-
ARCHSTONE TYVOLA CENTRE 2000625 CAMERON WALK COURT SOUTHWEST-1
DOMINION AT CROWN POINT 2 20007815 CALIBRE CROSSING DRIVE EAST-3
MARQUIS AT CARMEL COMMONS 20006818 NORTHBURY LANE SOUTHEAST-3
ALTA GROVE 200010017 SEASON GROVE LANE NORTHWEST-
ALTA BRADEN 200013255 ROSEDALE HILL AVE NORTH-
CARRIAGE CLUB 2000175 CARRIAGE CLUB DRIVE IREDELL COUNTY-
LODGE AT SPRINGS FARM 20003300 OPENFIELD LANE SOUTHEAST-3
LANDINGS 20002248 HUDSON LANDINGS DRIVE GASTON COUNTY-
PAVILION CROSSINGS 20001801 WILLOW HAVEN DRIVE NORTHEAST-2
POST UPTOWN PLACE 2000305 NORTH GRAHAM STREET DOWNTOWN-
CROWN RIDGE 20006000 REGAL ESTATES LANE EAST-2
THORNBERRY 20009920 BRICKLEBERRY LANE NORTHEAST-2
PLANTATION AT BALLANTYNE 200014325 PLANTATION PARK BLVD. SOUTHEAST-3
Index by Yr. Built - 1© 2002 Real Data
Sale DatePrice/Unit
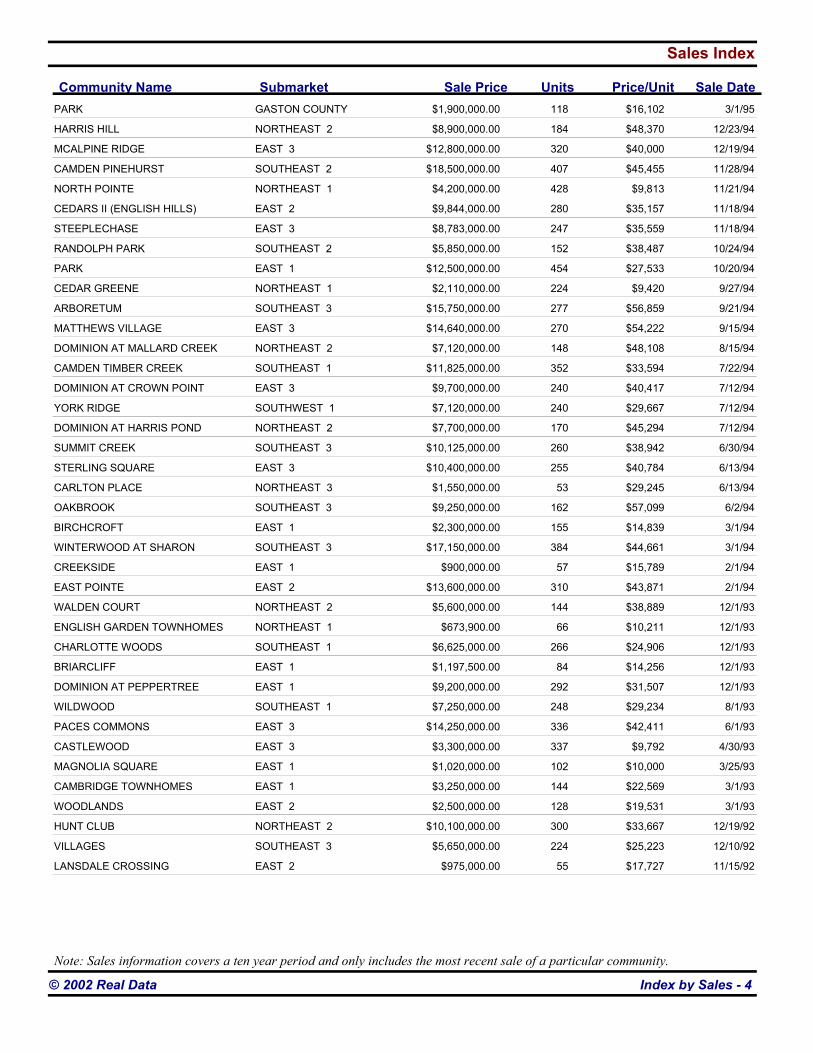
Sales Index
Sale PriceCommunity Name Submarket UnitsPARK 118GASTON COUNTY $1,900,000.00 3/1/95$16,102
HARRIS HILL 184NORTHEAST 2 $8,900,000.00 12/23/94$48,370
MCALPINE RIDGE 320EAST 3 $12,800,000.00 12/19/94$40,000
CAMDEN PINEHURST 407SOUTHEAST 2 $18,500,000.00 11/28/94$45,455
NORTH POINTE 428NORTHEAST 1 $4,200,000.00 11/21/94$9,813
CEDARS II (ENGLISH HILLS) 280EAST 2 $9,844,000.00 11/18/94$35,157
STEEPLECHASE 247EAST 3 $8,783,000.00 11/18/94$35,559
RANDOLPH PARK 152SOUTHEAST 2 $5,850,000.00 10/24/94$38,487
PARK 454EAST 1 $12,500,000.00 10/20/94$27,533
CEDAR GREENE 224NORTHEAST 1 $2,110,000.00 9/27/94$9,420
ARBORETUM 277SOUTHEAST 3 $15,750,000.00 9/21/94$56,859
MATTHEWS VILLAGE 270EAST 3 $14,640,000.00 9/15/94$54,222
DOMINION AT MALLARD CREEK 148NORTHEAST 2 $7,120,000.00 8/15/94$48,108
CAMDEN TIMBER CREEK 352SOUTHEAST 1 $11,825,000.00 7/22/94$33,594
DOMINION AT CROWN POINT 240EAST 3 $9,700,000.00 7/12/94$40,417
YORK RIDGE 240SOUTHWEST 1 $7,120,000.00 7/12/94$29,667
DOMINION AT HARRIS POND 170NORTHEAST 2 $7,700,000.00 7/12/94$45,294
SUMMIT CREEK 260SOUTHEAST 3 $10,125,000.00 6/30/94$38,942
STERLING SQUARE 255EAST 3 $10,400,000.00 6/13/94$40,784
CARLTON PLACE 53NORTHEAST 3 $1,550,000.00 6/13/94$29,245
OAKBROOK 162SOUTHEAST 3 $9,250,000.00 6/2/94$57,099
BIRCHCROFT 155EAST 1 $2,300,000.00 3/1/94$14,839
WINTERWOOD AT SHARON 384SOUTHEAST 3 $17,150,000.00 3/1/94$44,661
CREEKSIDE 57EAST 1 $900,000.00 2/1/94$15,789
EAST POINTE 310EAST 2 $13,600,000.00 2/1/94$43,871
WALDEN COURT 144NORTHEAST 2 $5,600,000.00 12/1/93$38,889
ENGLISH GARDEN TOWNHOMES 66NORTHEAST 1 $673,900.00 12/1/93$10,211
CHARLOTTE WOODS 266SOUTHEAST 1 $6,625,000.00 12/1/93$24,906
BRIARCLIFF 84EAST 1 $1,197,500.00 12/1/93$14,256
DOMINION AT PEPPERTREE 292EAST 1 $9,200,000.00 12/1/93$31,507
WILDWOOD 248SOUTHEAST 1 $7,250,000.00 8/1/93$29,234
PACES COMMONS 336EAST 3 $14,250,000.00 6/1/93$42,411
CASTLEWOOD 337EAST 3 $3,300,000.00 4/30/93$9,792
MAGNOLIA SQUARE 102EAST 1 $1,020,000.00 3/25/93$10,000
CAMBRIDGE TOWNHOMES 144EAST 1 $3,250,000.00 3/1/93$22,569
WOODLANDS 128EAST 2 $2,500,000.00 3/1/93$19,531
HUNT CLUB 300NORTHEAST 2 $10,100,000.00 12/19/92$33,667
VILLAGES 224SOUTHEAST 3 $5,650,000.00 12/10/92$25,223
LANSDALE CROSSING 55EAST 2 $975,000.00 11/15/92$17,727
Index by Sales - 4© 2002 Real Data
Note: Sales information covers a ten year period and only includes the most recent sale of a particular community.

Development Index - Under-Construction
Development Contact
DOWNTOWN-
Community Name Street Address Units5TH & POPLAR 305WEST FIFTH STREET SPECTRUM PROPERTIES (704) 358-1000
CHARLOTTE COTTON MILLS 183WEST FIFTH STREET CRESCENT RESOURCES (704) 373-3578
SYCAMORE GREEN 190WEST TRADE STREET BANK OF AMERICA (704) 388-4325
Development Contact
EAST-2
Community Name Street Address UnitsCROWN RIDGE 72REGAL ESTATES LANE MCCLAIN BARR & ASSOC (704) 531-1101
THORNGROVE 144AMITY SPRINGS DRIVE TALLEY PROPERTIES (704) 332-2206
Development Contact
NORTH-
Community Name Street Address UnitsBIRKDALE VILLAGE 108BIRKDALE COMMONS PKWY CROSLAND (704) 529-6098
DAVIDSON GATEWAY APTS 185CHARTER PROPERTIES (704) 377-4172
Development Contact
NORTHEAST-1
Community Name Street Address UnitsCROSSROADS @ VILLAGE PARK 108HIDDEN FOREST DRIVE DAVID DRYE (704) 786-6181
VILLAGE OF ROSEDALE 16TIFFANY ROSE PLACE S.L. NUSBAUM REALTY (757) 627-8611
Development Contact
NORTHEAST-2
Community Name Street Address UnitsHIGHLANDS@ ALEXANDER PT. 95HIGHROAD DRIVE DAVIS DEVELOPMENT (770) 474-4345
VILLAGE OF BRIERFIELD 174WINDY CREEK DRIVE DAVID DRYE (704) 786-6181
Development Contact
SOUTHEAST-1
Community Name Street Address UnitsSOUTH END SQUARE 299S. TRYON & PALMER STREETS FAIRFIELD PROPERTIES (704) 541-2133
STERLING DILWORTH/LATTA P 145EAST BLVD GRUBB PROPERTIES (704) 372-5616
Development Contact
SOUTHEAST-3
Community Name Street Address UnitsBALLANTYNE PLACE 319JOHNSTON ROAD ROBERTS REALTY (770) 394-6000
PROMENADE PARK 165SHADOW GROVE CIRCLE HANOVER REALTY (713) 267-2100
Development Contact
SOUTHWEST-1
Community Name Street Address UnitsCARRINGTON @TYVOLA 274BEAM ROAD DAVIS DEVELOPMENT (770) 474-4345
Development Contact
SOUTHWEST-2
Community Name Street Address Units
Index Development© 2002 Real Data
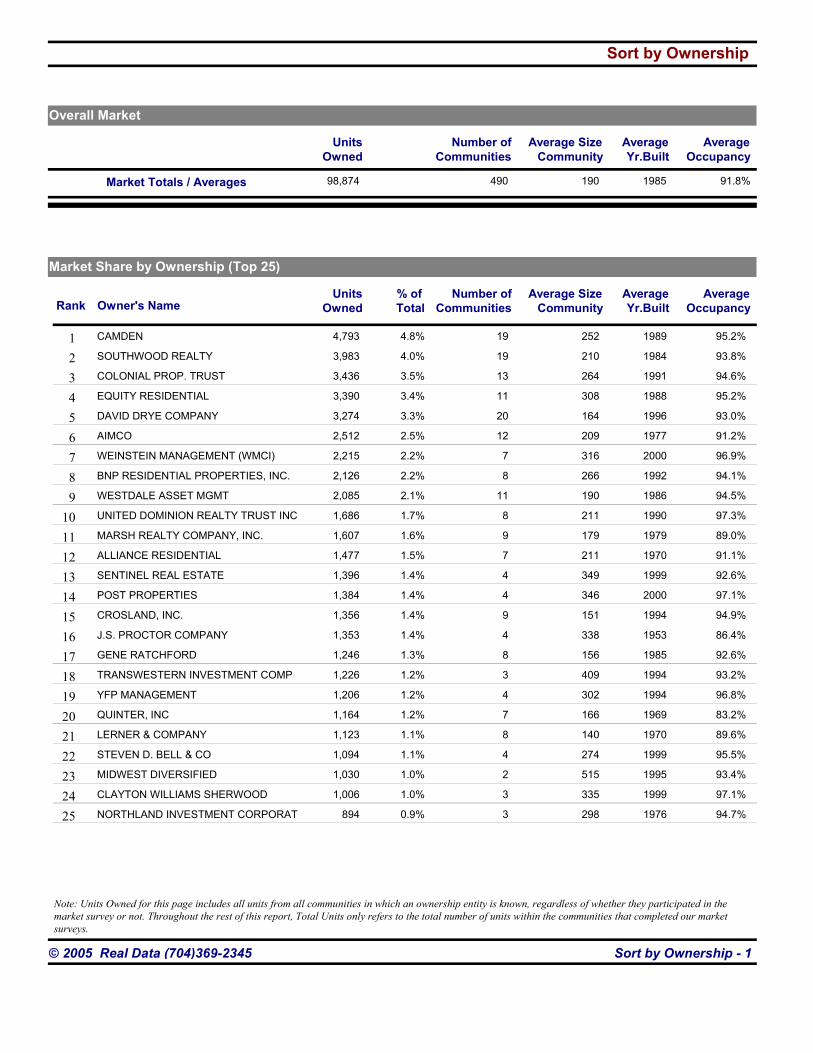
98,874
Sort by Ownership
UnitsOwned
AverageYr.Built
AverageOccupancy
Average SizeCommunity
190 1985 21 91.8%Market Totals / Averages
Owner's NameUnits
OwnedAverageYr.Built
AverageOccupancy
Average SizeCommunityRank
% of Total
Market Share by Ownership (Top 25)
Overall Market
0
Number ofCommunities
490
Number ofCommunities
CAMDEN 4,793 1989 95.2%252 +021 4.8% 0319
SOUTHWOOD REALTY 3,983 1984 93.8%210 642 4.0% 0319
COLONIAL PROP. TRUST 3,436 1991 94.6%264 +023 3.5% 0313
EQUITY RESIDENTIAL 3,390 1988 95.2%308 +024 3.4% 0311
DAVID DRYE COMPANY 3,274 1996 93.0%164 +025 3.3% 0320
AIMCO 2,512 1977 91.2%209 906 2.5% 0312
WEINSTEIN MANAGEMENT (WMCI) 2,215 2000 96.9%316 687 2.2% 037
BNP RESIDENTIAL PROPERTIES, INC. 2,126 1992 94.1%266 +028 2.2% 038
WESTDALE ASSET MGMT 2,085 1986 94.5%190 +029 2.1% 0311
UNITED DOMINION REALTY TRUST INC 1,686 1990 97.3%211 4510 1.7% 038
MARSH REALTY COMPANY, INC. 1,607 1979 89.0%179 +0211 1.6% 039
ALLIANCE RESIDENTIAL 1,477 1970 91.1%211 +0212 1.5% 037
SENTINEL REAL ESTATE 1,396 1999 92.6%349 +0213 1.4% 034
POST PROPERTIES 1,384 2000 97.1%346 4014 1.4% 034
CROSLAND, INC. 1,356 1994 94.9%151 6915 1.4% 039
J.S. PROCTOR COMPANY 1,353 1953 86.4%338 +0216 1.4% 034
GENE RATCHFORD 1,246 1985 92.6%156 6717 1.3% 028
TRANSWESTERN INVESTMENT COMP 1,226 1994 93.2%409 8318 1.2% 033
YFP MANAGEMENT 1,206 1994 96.8%302 3919 1.2% 034
QUINTER, INC 1,164 1969 83.2%166 +0220 1.2% 037
LERNER & COMPANY 1,123 1970 89.6%140 +0221 1.1% 038
STEVEN D. BELL & CO 1,094 1999 95.5%274 4922 1.1% 034
MIDWEST DIVERSIFIED 1,030 1995 93.4%515 6823 1.0% 032
CLAYTON WILLIAMS SHERWOOD 1,006 1999 97.1%335 2924 1.0% 033
NORTHLAND INVESTMENT CORPORAT 894 1976 94.7%298 4725 0.9% 023
Sort by Ownership - 1© 2005 Real Data (704)369-2345
Note: Units Owned for this page includes all units from all communities in which an ownership entity is known, regardless of whether they participated in the market survey or not. Throughout the rest of this report, Total Units only refers to the total number of units within the communities that completed our market surveys.

Ownership Index
754ALLIANCE MANAGEMENT (754 units)
PO BOX 13563GREENSBORO NC 27415-(336) 275-8586
Apartment Community Units
COLONIAL PLACE 136PARK FAIRFAX 138STONE HAVEN POINTE 264TEAL POINT 216
1477ALLIANCE RESIDENTIAL (1477 units)
221 NORTH LASALLE STREET
CHICAGO IL 60601-(312) 332-8000
Apartment Community Units
SUITE 37
GRAND OAKS 243GREENBRYRE 174HANOVER LANDING 192MAPLE RUN I 103MAPLE RUN II 207SAILBOAT BAY 358WINDSOR HARBOR 200
98ALLSTATE MANAGEMENT CORP. (98 units)
4300 HADDONFIELD ROAD
PENNSAUKEN NJ 08109-(856) 662-1176
Apartment Community Units
#314
LAUREL WALK 98
380AMERICA FIRST COMPANIES (380 units)
1004 FARNAM STREET
OMAHA NE 68102-(402) 444-1630
Apartment Community Units
SUITE 400
CAMERON AT HICKORY GROVE 202DELTA CROSSING 178
51AMIR FARAHANY (51 units)
3452 SHARON ROADCHARLOTTE NC 28211-(704) 365-0823
Apartment Community Units
CHATHAM II 51
311AMS MANAGEMENT (311 units)SUN VALLEY FUND XI100 CRESCENT COURT
DALLAS TX 75201-
Apartment Community Units
SUITE 100
SUN VALLEY 311
85ARC REALTY (85 units)
Apartment Community Units
STONEWALL JACKSON HOMES 85
1516ARCHSTONE (1516 units)
6 PIEDMONT CENTER
ATLANTA GA 30305-(404) 237-9292
Apartment Community Units
SUITE 600
ARCHSTONE MATTHEWS 212ARCHSTONE NORTHCROSS 312ARCHSTONE REAFIELD 324ARCHSTONE STEELE CREEK 264ARCHSTONE TYVOLA CENTRE 404
224ARRUTH ASSOCIATES, INC. (224 units)CHARLOTTE NC CORP.5718 WESTHEIMER
HOUSTON TX 77057(713) 784-1994
Apartment Community Units
SUITE 2100
VILLAGES 224
Index by Ownership - 2© 2002 Real Data
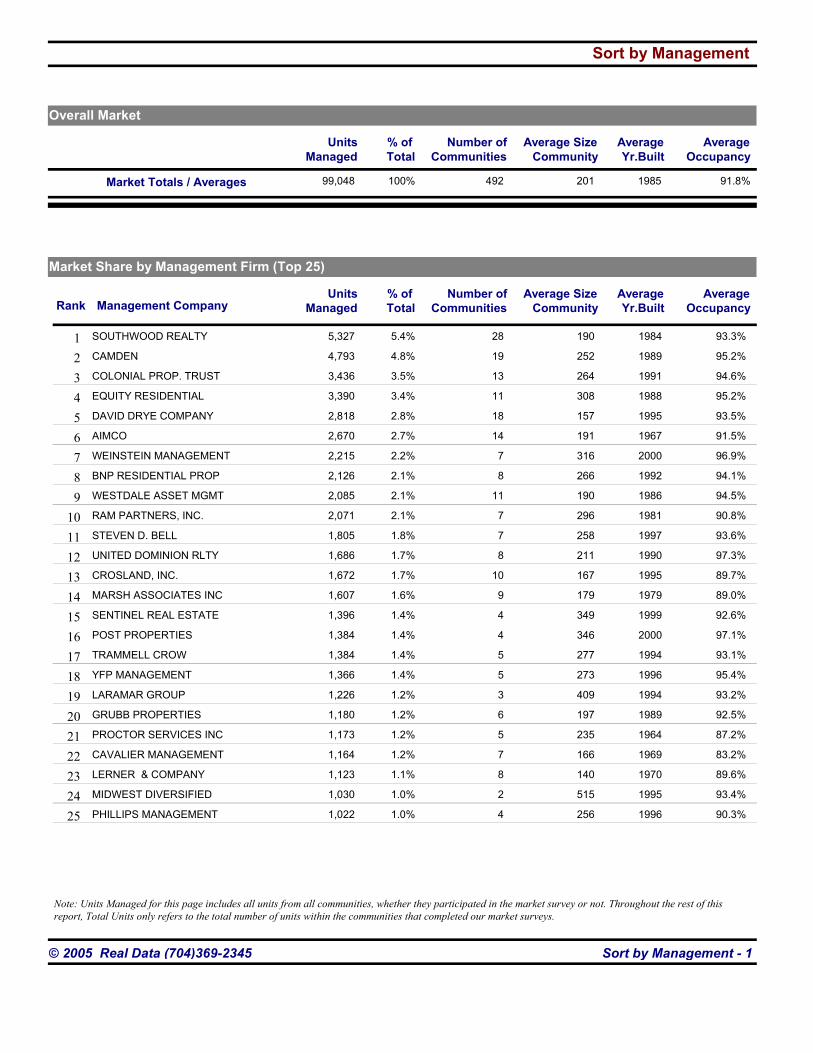
99,048
Sort by Management
UnitsManaged
AverageYr.Built
AverageOccupancy
Average SizeCommunity
% of Total
100% 201 1985 41 91.8%Market Totals / Averages
Management CompanyUnits
ManagedAverageYr.Built
AverageOccupancy
Average SizeCommunityRank
% of Total
Market Share by Management Firm (Top 25)
Overall Market
724
Number ofCommunities
492
Number ofCommunities
SOUTHWOOD REALTY 5,327 1984 93.3%190 021 5.4% 0328
CAMDEN 4,793 1989 95.2%252 022 4.8% 0319
COLONIAL PROP. TRUST 3,436 1991 94.6%264 023 3.5% 0313
EQUITY RESIDENTIAL 3,390 1988 95.2%308 024 3.4% 0311
DAVID DRYE COMPANY 2,818 1995 93.5%157 025 2.8% 0318
AIMCO 2,670 1967 91.5%191 016 2.7% 0314
WEINSTEIN MANAGEMENT 2,215 2000 96.9%316 017 2.2% 037
BNP RESIDENTIAL PROP 2,126 1992 94.1%266 028 2.1% 038
WESTDALE ASSET MGMT 2,085 1986 94.5%190 029 2.1% 0311
RAM PARTNERS, INC. 2,071 1981 90.8%296 0210 2.1% 037
STEVEN D. BELL 1,805 1997 93.6%258 0211 1.8% 037
UNITED DOMINION RLTY 1,686 1990 97.3%211 0112 1.7% 038
CROSLAND, INC. 1,672 1995 89.7%167 0213 1.7% 0310
MARSH ASSOCIATES INC 1,607 1979 89.0%179 0214 1.6% 039
SENTINEL REAL ESTATE 1,396 1999 92.6%349 0215 1.4% 034
POST PROPERTIES 1,384 2000 97.1%346 0116 1.4% 034
TRAMMELL CROW 1,384 1994 93.1%277 0217 1.4% 035
YFP MANAGEMENT 1,366 1996 95.4%273 0118 1.4% 035
LARAMAR GROUP 1,226 1994 93.2%409 0119 1.2% 033
GRUBB PROPERTIES 1,180 1989 92.5%197 0120 1.2% 036
PROCTOR SERVICES INC 1,173 1964 87.2%235 0221 1.2% 035
CAVALIER MANAGEMENT 1,164 1969 83.2%166 0222 1.2% 037
LERNER & COMPANY 1,123 1970 89.6%140 0223 1.1% 038
MIDWEST DIVERSIFIED 1,030 1995 93.4%515 0124 1.0% 032
PHILLIPS MANAGEMENT 1,022 1996 90.3%256 0225 1.0% 034
Sort by Management - 1© 2005 Real Data (704)369-2345
Note: Units Managed for this page includes all units from all communities, whether they participated in the market survey or not. Throughout the rest of this report, Total Units only refers to the total number of units within the communities that completed our market surveys.

Management Index
54511 QUEENS (54 units)LEASING OFFICE511 QUEENS ROADCHARLOTTE NC 28207(704) 336-6700
Apartment Community Units
511 QUEENS 54
88A & J PROPERTIES (88 units)2600 RIVERSIDE LANEMONROE NC 28110(704) 283-5563
Apartment Community Units
RIVERSIDE VILLAGE I 88
218A.G. SPANOS CORP. (218 units)2221 EDGE LAKE DRIVESUITE 185CHARLOTTE NC 28217(704) 424-5523
Apartment Community Units
CHESWYCK GREEN 218
226ADRIAN INVESTMENT (226 units)P.O. BOX 220214CHARLOTTE NC 28222(704) 536-8651
Apartment Community Units
AFTON HOUSE 72CHATEAU 56EASTLAND VILLAGE 98
2512AIMCO (2512 units)55 BEATTIE PLACEPO BOX 1089GREENVILLE SC 29602(864) 239-1154
Apartment Community Units
CARRIAGE HOUSE 102GLEN HOLLOW 336LAKESIDE 216MISTY WOODS 228OAKS AT EDGEMONT 176PINETREE 220PLUM CREEK 276QUAIL WOODS 188
REDDMAN'S PIER 162RUNAWAY BAY 280WINDGATE PLACE 196WOODFIELD GARDENS 132
50ALBRIGHT & COMPANY (50 units)C/O GARDNER RIDGE3999 GARDNER RIDGE DRIVEGASTONIA NC 28056(704) 824-8460
Apartment Community Units
GARDNER RIDGE 50
151ALEXANDER PROPERTIES (151 units)
2300 PEACHFORD ROADATLANTA GA 30338(770) 455-4567
Apartment Community Units
SANDLEWOOD 151
754ALLIANCE MANAGEMENT (754 units)1400 WEST NORTHWOOD STREGREENSBORO NC 27408(336) 275-8586
Apartment Community Units
COLONIAL PLACE 136PARK FAIRFAX 138STONE HAVEN POINTE 264TEAL POINT 216
1303ALLIANCE RESIDENTIAL (1303 units)2400 AUGUSTA DRIVESUITE 450HOUSTON TX 77057(713) 977-1120
Apartment Community Units
GRAND OAKS 243HANOVER LANDING 192MAPLE RUN I 103MAPLE RUN II 207SAILBOAT BAY 358WINDSOR HARBOR 200
Index by Management - 1© 2002 Real Data