Embed Size (px)
Citation preview
Goddard Earth Sciences Data and Information Services Center (GES DISC)
http://disc.gsfc.nasa.gov
NASA Goddard Space Flight Center
Code 610.2
Greenbelt, MD 20771 USA
README Document for OMHCHOd
Last Revised August 20, 2019
National Aeronautics and Space Administration Goddard Earth Science Data Information and Services Center (GES DISC)
Prepared By:
Gonzalo Gonzalez Abad Kang Sun
Name
60 Garden Street, Cambridge
Center for Astrophysics | Harvard & Smithsonian
Name
106 Cooke Hall, Buffalo
RENEW Institute, University of Buffalo
10 October, 2019
Date
Reviewed By:
James E. Johnson 10 October, 2019
Reviewer Name
GES DISC
GSFC Code 610.2
Date
Goddard Space Flight Center
Greenbelt, Maryland

Revision History
Revision Date Changes Author
10 October, 2019 Initial version Gonzalo Gonzalez Abad
Table of Contents
Contents
1
1.0 Introduction 6
1.1 OMI Instrument Description 6
1.1.1 OMHCHOd dataset 7
1.2 Algorithm Background 7
1.3 Data Disclaimer 8
1.3.1 Acknowledgments 8
1.3.2 Contact Information 8
1.3.3 Citing the data 8
2.0 Data Organization 9
2.1 File Naming Convention 9
2.2 File Format and Structure 9
2.3 Key Science Data Fields 10
3.0 Data Contents 10
3.1 Dimensions 10
3.2 Global metadata 10
3.3 Data Fields 12
3.3.1 latitude 12
3.3.2 longitude 13
3.3.3 column_amount in key_science_data group 13
3.3.4 column_uncertainty in key_science_data group 13
3.3.5 data_quality_flag in qa_statistics group 13
3.3.6 num_samples in qa_statistics group 14
3.3.7 albedo in support_data group 14
3.3.8 amf in support_data group 14
3.3.9 cloud_fraction in support_data group 15
3.3.10 cloud_pressure in support_data group 15
3.3.11 sample_weight in support_data group 15
3.3.12 terrain_height in support_data group 16
4.0 Options for Reading the Data 16
4.1 Command Line Utilities 16
4.1.1 ncdump 16
4.1.2 h5dump 16
4.2 Tools/Programming 17
5.0 Data Services 17
6.0 Acknowledgments 18
References 18
Appendix A. Python reader and temporal co-add script 19
1.0 Introduction This document provides information for using version 1.0 of the OMI OMHCHOd product derived from the OMI Level-2 OMHCHO product. The OMHCHOd product consists of global, daily averaged, quality controlled OMHCHO formaldehyde columns on a 0.1° × 0.1° North-South / East-West regular grid. The columns are accompanied by support data consisting of quality diagnostics, uncertainties, and sample weights to facilitate further aggregation of the column field. The OMHCHOd product Readme aims to provide easy to use formaldehyde information derived from the OMI instrument.
Abbreviation/acronym Meaning
API Application Programing Interface
CDL Common Data Language
CF Climate and Forecast
DOI Digital Object Identifier
ECS EOSDIS Core System
EOS Earth Observing System
EOSDIS EOS Data and Information System
HDF5 Hierarchical Data Format Version 5
L-1B Level-1B (calibrated radiances or irradiances)
L-2 Level-2 (retrieved geophysical values)
L-3 Level-3 (global, gridded, averaged, quality controlled geophysical values)
NetCDF Network Common Data Form
OMI Ozone Monitoring Instrument
PI Principal Investigator
SZA Solar Zenith Angle
UTC Universal Time Coordinate
Table 1. List of acronyms and abbreviations
1.1 OMI Instrument Description
The Ozone Monitoring Instrument was launched in 2004 on-board NASA’s Aura satellite. OMI was designed to provide daily global measurements of ozone and its precursors at spatial resolutions ranging from ~13 km × 24 km at the center of the swath to ~28 km × 160 km at the most outer swath-angle. Since the on-set of the row anomaly in June 2007 spatial coverage was reduced. The OMHCHOd gridding algorithm filters out pixels affected by the row anomaly. A detailed description of the instrument and its performance is provided by Levelt et al., (2018).
1.1.1 OMHCHOd dataset The OMHCHOd product consists of averaged daily, global and quality controlled formaldehyde vertical columns as observed by the OMI instrument and associated data to facilitate their interpretation. The data set provides easy access to OMI formaldehyde measurements. All level 2 OMHCHO observations for a given day are first explored to filter out pixels with bad formaldehyde retrievals, high cloud fractions (>0.3), high SZA (>70°), and pixels affected by OMI’s row anomaly. At each target 0.1° × 0.1° grid box the OMHCHOd algorithm then calculates weighted mean values for vertical column amounts, column uncertainties, AMFs, cloud fraction, cloud pressure, terrain height, and albedos using OMHCHO L2 product as inputs. OMHCHOd files also provide diagnostic information designed to facilitate the calculation of ad-hoc spatial and temporal resolutions by co-adding OMHCHOd pixels from its native daily temporal and 0.1° × 0.1° spatial resolutions to the desired targets. Details about using the sample_weight information to co-add OMHCHOd pixels are provided in section 3.3.11.
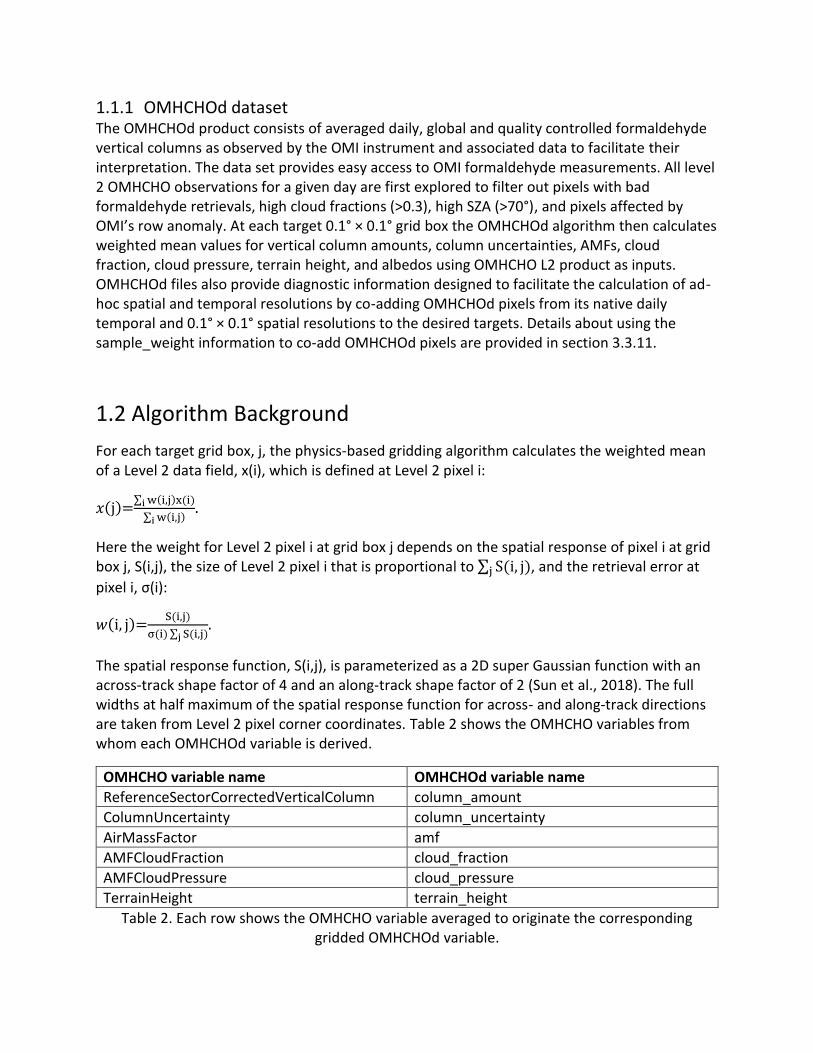
1.2 Algorithm Background
For each target grid box, j, the physics-based gridding algorithm calculates the weighted mean of a Level 2 data field, x(i), which is defined at Level 2 pixel i:
𝑥(j)=∑ w(i,j)x(i)i
∑ w(i,j)i.
Here the weight for Level 2 pixel i at grid box j depends on the spatial response of pixel i at grid box j, S(i,j), the size of Level 2 pixel i that is proportional to ∑ S(i, j)j , and the retrieval error at
pixel i, σ(i):
𝑤(i, j)=S(i,j)
σ(i) ∑ S(i,j)j.
The spatial response function, S(i,j), is parameterized as a 2D super Gaussian function with an across-track shape factor of 4 and an along-track shape factor of 2 (Sun et al., 2018). The full widths at half maximum of the spatial response function for across- and along-track directions are taken from Level 2 pixel corner coordinates. Table 2 shows the OMHCHO variables from whom each OMHCHOd variable is derived.
OMHCHO variable name OMHCHOd variable name
ReferenceSectorCorrectedVerticalColumn column_amount
ColumnUncertainty column_uncertainty
AirMassFactor amf
AMFCloudFraction cloud_fraction
AMFCloudPressure cloud_pressure
TerrainHeight terrain_height
Table 2. Each row shows the OMHCHO variable averaged to originate the corresponding gridded OMHCHOd variable.
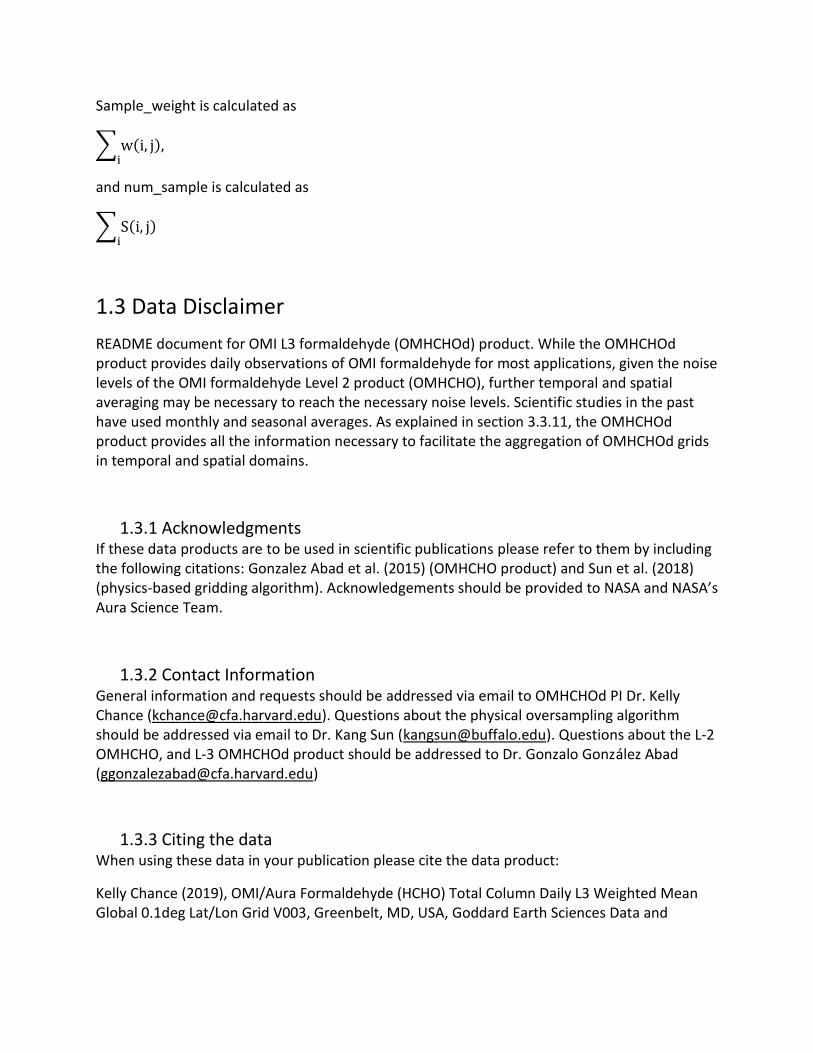
Sample_weight is calculated as
∑w(i, j),i
and num_sample is calculated as
∑S(i, j)i
1.3 Data Disclaimer
README document for OMI L3 formaldehyde (OMHCHOd) product. While the OMHCHOd product provides daily observations of OMI formaldehyde for most applications, given the noise levels of the OMI formaldehyde Level 2 product (OMHCHO), further temporal and spatial averaging may be necessary to reach the necessary noise levels. Scientific studies in the past have used monthly and seasonal averages. As explained in section 3.3.11, the OMHCHOd product provides all the information necessary to facilitate the aggregation of OMHCHOd grids in temporal and spatial domains.
1.3.1 Acknowledgments If these data products are to be used in scientific publications please refer to them by including the following citations: Gonzalez Abad et al. (2015) (OMHCHO product) and Sun et al. (2018) (physics-based gridding algorithm). Acknowledgements should be provided to NASA and NASA’s Aura Science Team.
1.3.2 Contact Information General information and requests should be addressed via email to OMHCHOd PI Dr. Kelly Chance ([email protected]). Questions about the physical oversampling algorithm should be addressed via email to Dr. Kang Sun ([email protected]). Questions about the L-2 OMHCHO, and L-3 OMHCHOd product should be addressed to Dr. Gonzalo González Abad ([email protected])
1.3.3 Citing the data When using these data in your publication please cite the data product:
Kelly Chance (2019), OMI/Aura Formaldehyde (HCHO) Total Column Daily L3 Weighted Mean Global 0.1deg Lat/Lon Grid V003, Greenbelt, MD, USA, Goddard Earth Sciences Data and
Information Services Center (GES DISC), Accessed:[Data Access Date], 10.5067/Aura/OMI/DATA3010
References to OMHCHO Level 2 algorithm (González Abad et al., 2015) and the physical oversampling algorithm (Sun et al., 2018) should also be included in your publication.
2.0 Data Organization Each OMHCHOd product file contains data from a single day. There is only one file per day (if data is available) providing global, averaged, gridded and quality controlled formaldehyde data obtained from the OMHCHO product.
2.1 File Naming Convention
OMHCHOd files are named following this schema <Sensor>-<Platform>_<DataType>-<DataID>_<ObservationDate>_v<ECSCollection>-<ProductionDateTime>.<Suffix> where <Sensor>: OMI <Platform>: Aura <DataType>: L3 <DataID>: OMHCHOd <ObservationDate>: %Ym%m%d [%Y = year (4 digit string), %m = month (2 digit string) and %d = day (2 digit string)] <ECSCollection>: 003 is the ECS Collection number (3 digit string) <ProductionDateTime>: UTC %Ym%m%dt%H%M%S [%Y=year (4 digit string), %m = month (2 digit string), %d = day (2 digit string), %H = hour (2 digit string), %M = minute (2 digit string), and %S = second (2 digit string)] <Suffix>: .nc file format extension for netCDF. Filename example: OMI-Aura_L3-OMHCHOd_2004m1012_v003-2019m0725t194423.nc
2.2 File Format and Structure
OMHCHOd files use the netCDF (version 4) format. NetCDF was developed and is maintained by Unidata. In particular NetCDF version 4 is capable of using HDF5, developed and maintained by The HDF Group. The general structure of OMHCHOd files is shown in figure 1.
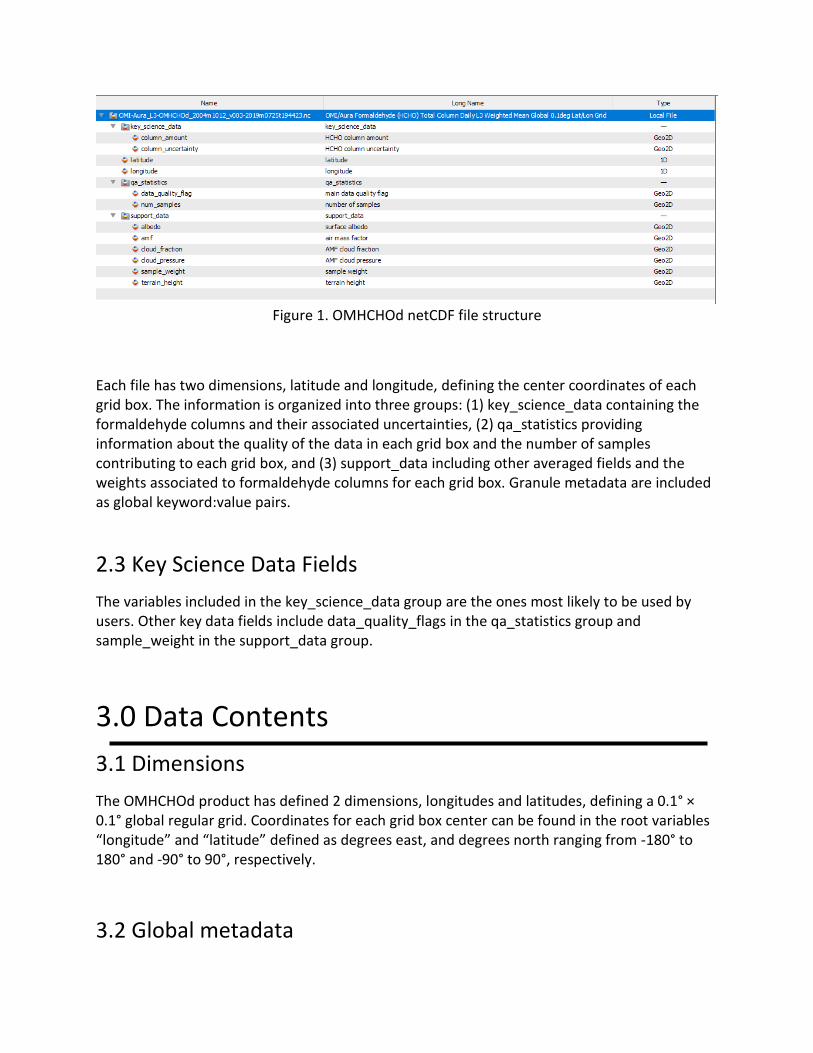
Figure 1. OMHCHOd netCDF file structure
Each file has two dimensions, latitude and longitude, defining the center coordinates of each grid box. The information is organized into three groups: (1) key_science_data containing the formaldehyde columns and their associated uncertainties, (2) qa_statistics providing information about the quality of the data in each grid box and the number of samples contributing to each grid box, and (3) support_data including other averaged fields and the weights associated to formaldehyde columns for each grid box. Granule metadata are included as global keyword:value pairs.
2.3 Key Science Data Fields
The variables included in the key_science_data group are the ones most likely to be used by users. Other key data fields include data_quality_flags in the qa_statistics group and sample_weight in the support_data group.
3.0 Data Contents
3.1 Dimensions
The OMHCHOd product has defined 2 dimensions, longitudes and latitudes, defining a 0.1° × 0.1° global regular grid. Coordinates for each grid box center can be found in the root variables “longitude” and “latitude” defined as degrees east, and degrees north ranging from -180° to 180° and -90° to 90°, respectively.
3.2 Global metadata
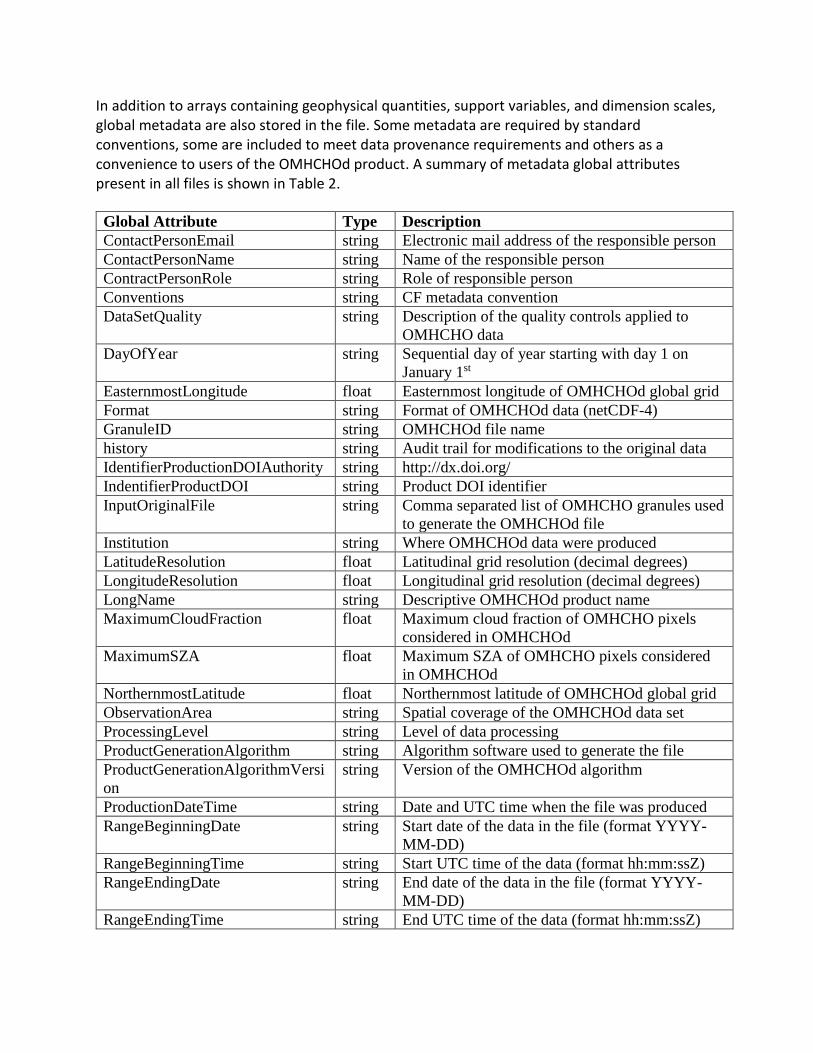
In addition to arrays containing geophysical quantities, support variables, and dimension scales, global metadata are also stored in the file. Some metadata are required by standard conventions, some are included to meet data provenance requirements and others as a convenience to users of the OMHCHOd product. A summary of metadata global attributes present in all files is shown in Table 2.
Global Attribute Type Description
ContactPersonEmail string Electronic mail address of the responsible person
ContactPersonName string Name of the responsible person
ContractPersonRole string Role of responsible person
Conventions string CF metadata convention
DataSetQuality string Description of the quality controls applied to
OMHCHO data
DayOfYear string Sequential day of year starting with day 1 on
January 1st
EasternmostLongitude float Easternmost longitude of OMHCHOd global grid
Format string Format of OMHCHOd data (netCDF-4)
GranuleID string OMHCHOd file name
history string Audit trail for modifications to the original data
IdentifierProductionDOIAuthority string http://dx.doi.org/
IndentifierProductDOI string Product DOI identifier
InputOriginalFile string Comma separated list of OMHCHO granules used
to generate the OMHCHOd file
Institution string Where OMHCHOd data were produced
LatitudeResolution float Latitudinal grid resolution (decimal degrees)
LongitudeResolution float Longitudinal grid resolution (decimal degrees)
LongName string Descriptive OMHCHOd product name
MaximumCloudFraction float Maximum cloud fraction of OMHCHO pixels
considered in OMHCHOd
MaximumSZA float Maximum SZA of OMHCHO pixels considered
in OMHCHOd
NorthernmostLatitude float Northernmost latitude of OMHCHOd global grid
ObservationArea string Spatial coverage of the OMHCHOd data set
ProcessingLevel string Level of data processing
ProductGenerationAlgorithm string Algorithm software used to generate the file
ProductGenerationAlgorithmVersi
on
string Version of the OMHCHOd algorithm
ProductionDateTime string Date and UTC time when the file was produced
RangeBeginningDate string Start date of the data in the file (format YYYY-
MM-DD)
RangeBeginningTime string Start UTC time of the data (format hh:mm:ssZ)
RangeEndingDate string End date of the data in the file (format YYYY-
MM-DD)
RangeEndingTime string End UTC time of the data (format hh:mm:ssZ)
references string Published references that describe the data and
methods used to produce the data
ShortName string Abbreviated name of the product (OMHCHOd)
Source string Instrument origin of the OMHCHOd product
SouthernmostLatitude float Southernmost latitude of OMHCHOd global grid
Title string A succinct description of OMHCHOd
VersionID string ECS collection identifier
WesternmostLongitude float Westernmost longitude of OMHCHOd global grid
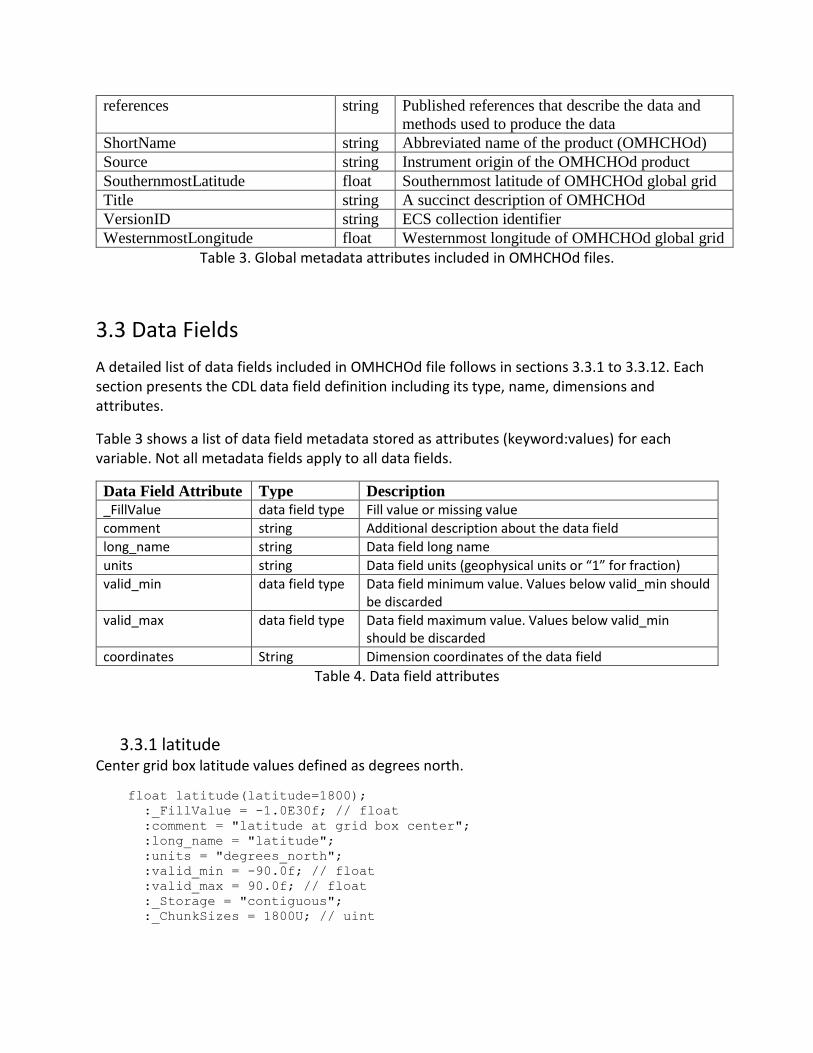
Table 3. Global metadata attributes included in OMHCHOd files.
3.3 Data Fields
A detailed list of data fields included in OMHCHOd file follows in sections 3.3.1 to 3.3.12. Each section presents the CDL data field definition including its type, name, dimensions and attributes.
Table 3 shows a list of data field metadata stored as attributes (keyword:values) for each variable. Not all metadata fields apply to all data fields.
Data Field Attribute Type Description
_FillValue data field type Fill value or missing value
comment string Additional description about the data field
long_name string Data field long name
units string Data field units (geophysical units or “1” for fraction)
valid_min data field type Data field minimum value. Values below valid_min should be discarded
valid_max data field type Data field maximum value. Values below valid_min should be discarded
coordinates String Dimension coordinates of the data field
Table 4. Data field attributes
3.3.1 latitude Center grid box latitude values defined as degrees north.
float latitude(latitude=1800);
:_FillValue = -1.0E30f; // float
:comment = "latitude at grid box center";
:long_name = "latitude";
:units = "degrees_north";
:valid_min = -90.0f; // float
:valid_max = 90.0f; // float
:_Storage = "contiguous";
:_ChunkSizes = 1800U; // uint
3.3.2 longitude Center grid box longitude values defined as degrees east.
float longitude(longitude=3600);
:_FillValue = -1.0E30f; // float
:comment = "longitude at grid box center";
:long_name = "longitude";
:units = "degrees_east";
:valid_min = -180.0f; // float
:valid_max = 180.0f; // float
:_Storage = "contiguous";
:_ChunkSizes = 3600U; // uint
3.3.3 column_amount in key_science_data group Mean formaldehyde column amount derived from the OMHCHO ReferenceSectorCorrectedVerticalColumn data field. OMHCHO README file and González Abad et al., (2015) provide further information about the OMHCHO product.
float column_amount(latitude=1800, longitude=3600);
:comment = "mean formaldehyde column amount; units of molecules/cm^2";
:units = "molecules/cm^2";
:coordinates = "longitude latitude";
:_Storage = "contiguous";
:_FillValue = -1.0E30f; // float
:long_name = "HCHO column amount";
:_ChunkSizes = 600U, 1200U; // uint
3.3.4 column_uncertainty in key_science_data group Mean formaldehyde column amount uncertainty. See section 1.2 for calculation details.
float column_uncertainty(latitude=1800, longitude=3600);
:_FillValue = -1.0E30f; // float
:comment = "mean column amount uncertainty; units of molecules/cm^2";
:long_name = "HCHO column uncertainty";
:units = "molecules/cm^2";
:coordinates = "longitude latitude";
:_Storage = "contiguous";
:_ChunkSizes = 600U, 1200U; // uint
3.3.5 data_quality_flag in qa_statistics group Quality flag providing a guide to users about the availability of the OMHCHOd product. The quality flag is computed based on the number of samples, considering the area overlap, available for each grid box. The flag values range from 0 for good to 2 for not calculated or failed calculation. A value equal to 1 indicates a small number of samples (num_sample > 1e-6 and < 0.1). It is suggested to use grid cells with flag values 0 for daily Level 3 data. Grid cells with flag values of 1 may be included when aggregating daily Level 3 data spatially or temporally, as shown in section 3.3.11.
byte data_quality_flag(latitude=1800, longitude=3600);
:_FillValue = 2B; // byte
:comment = "main data quality flag. 0 (good, number of samples >
0.1)1 (good, number of samples < 0.1) 2 (bad / not computed)";
:long_name = "main data quality flag";
:flal_values = 0B, 1B, 2B; // byte
:flag_meanings = "good_number_of_samples_greater_than_0.1
good_number_of_samples_less_than_0.1 bad_or_not_computed";
:valid_min = 0B; // byte
:valid_max = 2B; // byte
:coordinates = "longitude latitude";
:_Storage = "contiguous";
:_ChunkSizes = 900U, 1800U; // uint
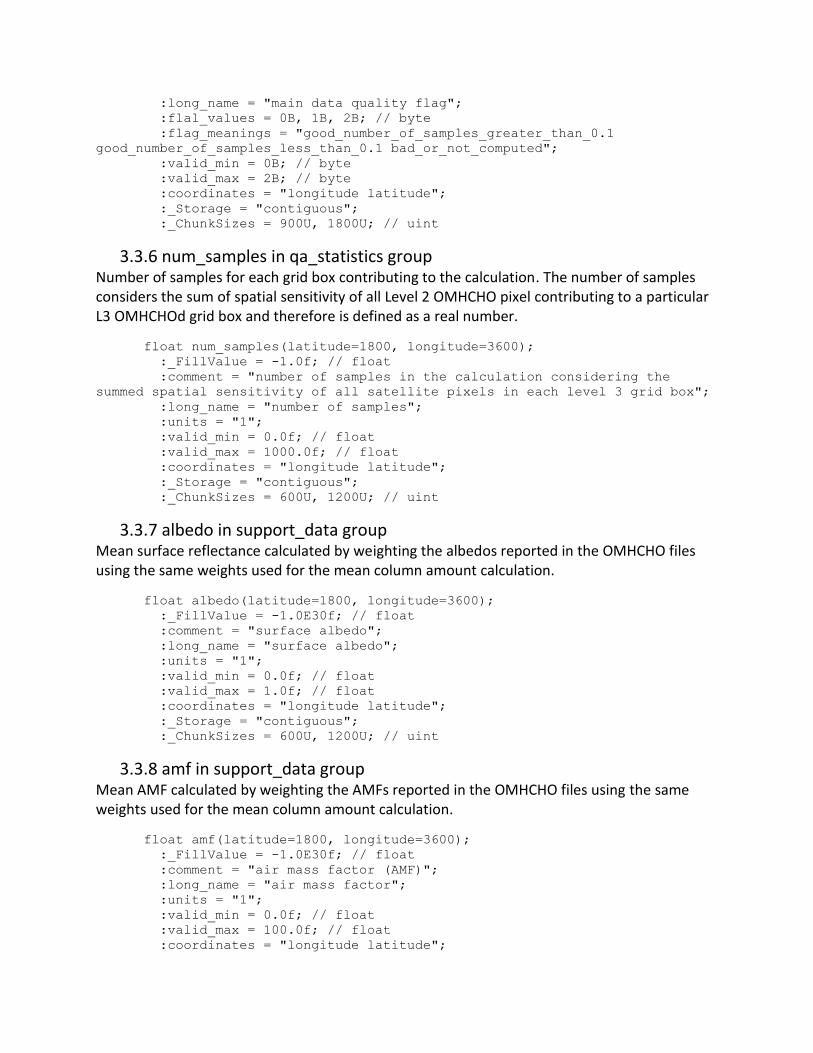
3.3.6 num_samples in qa_statistics group Number of samples for each grid box contributing to the calculation. The number of samples considers the sum of spatial sensitivity of all Level 2 OMHCHO pixel contributing to a particular L3 OMHCHOd grid box and therefore is defined as a real number.
float num_samples(latitude=1800, longitude=3600);
:_FillValue = -1.0f; // float
:comment = "number of samples in the calculation considering the
summed spatial sensitivity of all satellite pixels in each level 3 grid box";
:long_name = "number of samples";
:units = "1";
:valid_min = 0.0f; // float
:valid_max = 1000.0f; // float
:coordinates = "longitude latitude";
:_Storage = "contiguous";
:_ChunkSizes = 600U, 1200U; // uint
3.3.7 albedo in support_data group Mean surface reflectance calculated by weighting the albedos reported in the OMHCHO files using the same weights used for the mean column amount calculation.
float albedo(latitude=1800, longitude=3600);
:_FillValue = -1.0E30f; // float
:comment = "surface albedo";
:long_name = "surface albedo";
:units = "1";
:valid_min = 0.0f; // float
:valid_max = 1.0f; // float
:coordinates = "longitude latitude";
:_Storage = "contiguous";
:_ChunkSizes = 600U, 1200U; // uint
3.3.8 amf in support_data group Mean AMF calculated by weighting the AMFs reported in the OMHCHO files using the same weights used for the mean column amount calculation.
float amf(latitude=1800, longitude=3600);
:_FillValue = -1.0E30f; // float
:comment = "air mass factor (AMF)";
:long_name = "air mass factor";
:units = "1";
:valid_min = 0.0f; // float
:valid_max = 100.0f; // float
:coordinates = "longitude latitude";
:_Storage = "contiguous";
:_ChunkSizes = 600U, 1200U; // uint
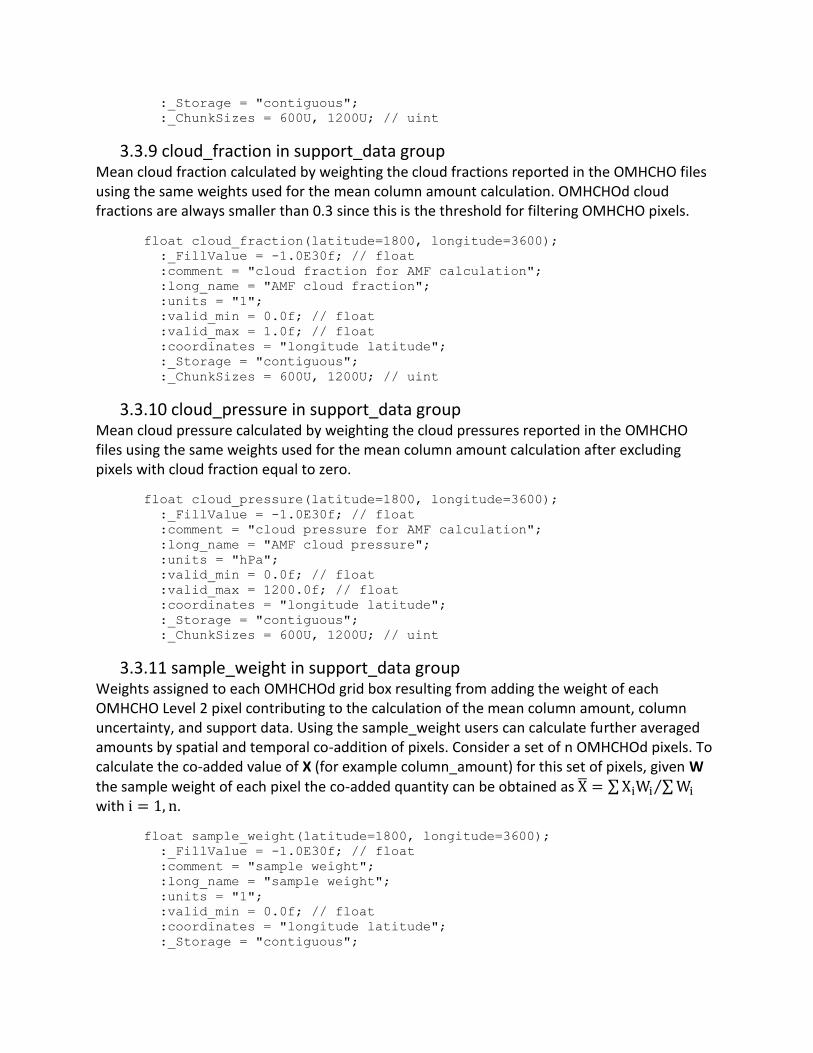
3.3.9 cloud_fraction in support_data group Mean cloud fraction calculated by weighting the cloud fractions reported in the OMHCHO files using the same weights used for the mean column amount calculation. OMHCHOd cloud fractions are always smaller than 0.3 since this is the threshold for filtering OMHCHO pixels.
float cloud_fraction(latitude=1800, longitude=3600);
:_FillValue = -1.0E30f; // float
:comment = "cloud fraction for AMF calculation";
:long_name = "AMF cloud fraction";
:units = "1";
:valid_min = 0.0f; // float
:valid_max = 1.0f; // float
:coordinates = "longitude latitude";
:_Storage = "contiguous";
:_ChunkSizes = 600U, 1200U; // uint
3.3.10 cloud_pressure in support_data group Mean cloud pressure calculated by weighting the cloud pressures reported in the OMHCHO files using the same weights used for the mean column amount calculation after excluding pixels with cloud fraction equal to zero.
float cloud_pressure(latitude=1800, longitude=3600);
:_FillValue = -1.0E30f; // float
:comment = "cloud pressure for AMF calculation";
:long_name = "AMF cloud pressure";
:units = "hPa";
:valid_min = 0.0f; // float
:valid_max = 1200.0f; // float
:coordinates = "longitude latitude";
:_Storage = "contiguous";
:_ChunkSizes = 600U, 1200U; // uint
3.3.11 sample_weight in support_data group Weights assigned to each OMHCHOd grid box resulting from adding the weight of each OMHCHO Level 2 pixel contributing to the calculation of the mean column amount, column uncertainty, and support data. Using the sample_weight users can calculate further averaged amounts by spatial and temporal co-addition of pixels. Consider a set of n OMHCHOd pixels. To calculate the co-added value of X (for example column_amount) for this set of pixels, given W
the sample weight of each pixel the co-added quantity can be obtained as X̅ = ∑XiWi ∑Wi⁄ with i = 1, n.
float sample_weight(latitude=1800, longitude=3600);
:_FillValue = -1.0E30f; // float
:comment = "sample weight";
:long_name = "sample weight";
:units = "1";
:valid_min = 0.0f; // float
:coordinates = "longitude latitude";
:_Storage = "contiguous";
:_ChunkSizes = 600U, 1200U; // uint
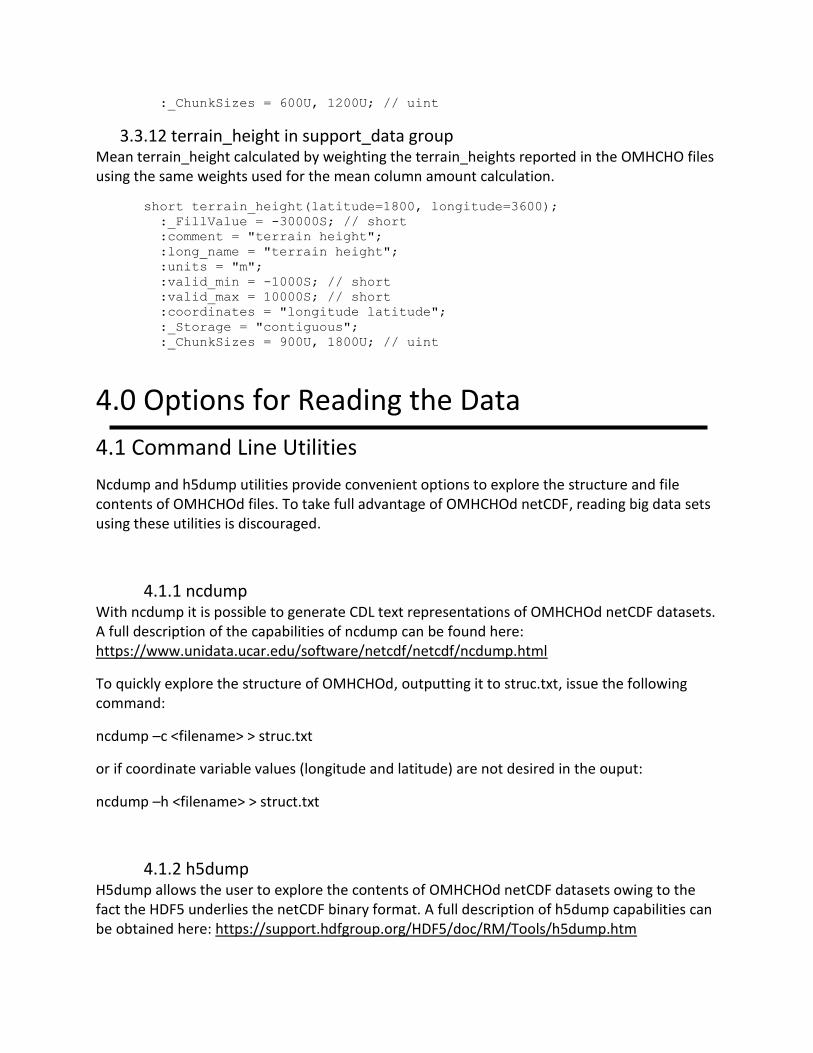
3.3.12 terrain_height in support_data group Mean terrain_height calculated by weighting the terrain_heights reported in the OMHCHO files using the same weights used for the mean column amount calculation.
short terrain_height(latitude=1800, longitude=3600);
:_FillValue = -30000S; // short
:comment = "terrain height";
:long_name = "terrain height";
:units = "m";
:valid_min = -1000S; // short
:valid_max = 10000S; // short
:coordinates = "longitude latitude";
:_Storage = "contiguous";
:_ChunkSizes = 900U, 1800U; // uint
4.0 Options for Reading the Data
4.1 Command Line Utilities
Ncdump and h5dump utilities provide convenient options to explore the structure and file contents of OMHCHOd files. To take full advantage of OMHCHOd netCDF, reading big data sets using these utilities is discouraged.
4.1.1 ncdump With ncdump it is possible to generate CDL text representations of OMHCHOd netCDF datasets. A full description of the capabilities of ncdump can be found here: https://www.unidata.ucar.edu/software/netcdf/netcdf/ncdump.html
To quickly explore the structure of OMHCHOd, outputting it to struc.txt, issue the following command:
ncdump –c <filename> > struc.txt
or if coordinate variable values (longitude and latitude) are not desired in the ouput:
ncdump –h <filename> > struct.txt
4.1.2 h5dump H5dump allows the user to explore the contents of OMHCHOd netCDF datasets owing to the fact the HDF5 underlies the netCDF binary format. A full description of h5dump capabilities can be obtained here: https://support.hdfgroup.org/HDF5/doc/RM/Tools/h5dump.htm
To explore the structure of OMHCHOd, these two commands will help:
h5dump –H <filename>
or a very simplified version
h5dump –n <filename>
4.2 Tools/Programming
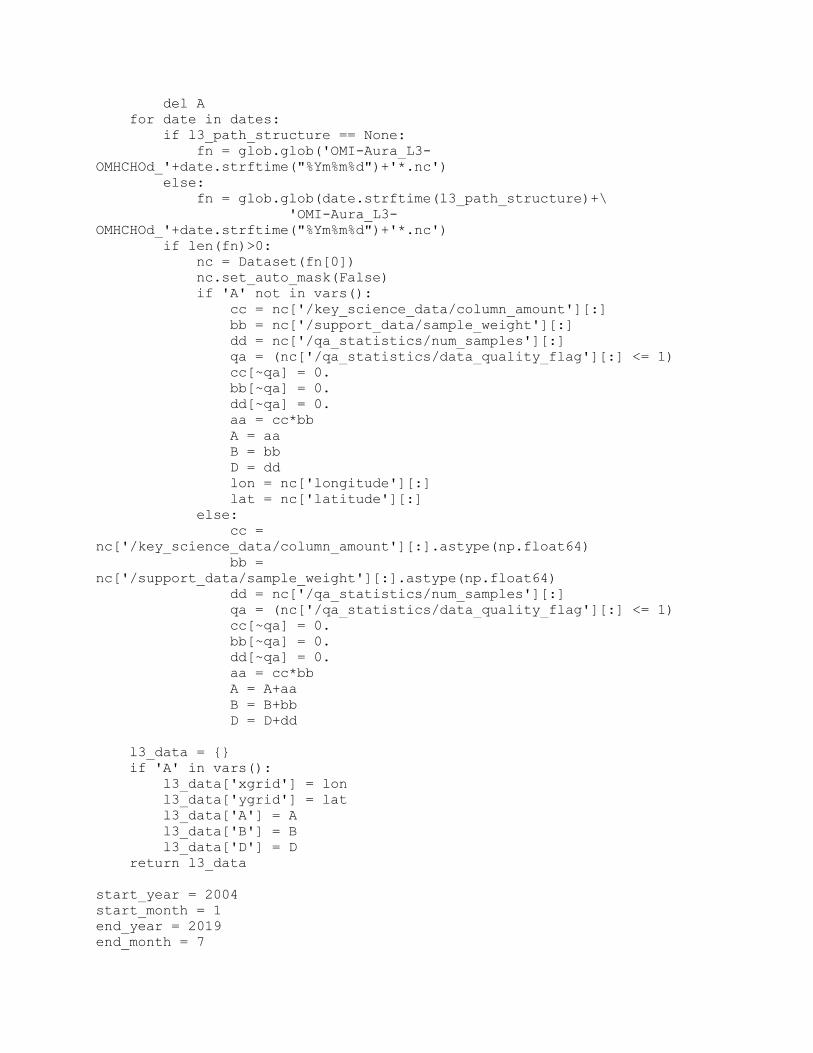
HDFView HDFView is a Java-based graphical user interface created by the HDF Group, which can be used to browse OMHCHOd files. The utility allows users to view all objects in an HDF file hierarchy, which is represented as a tree structure. HDFView documentation and downloads are available at https://www.hdfgroup.org/downloads/hdfview/ Panoply OMHCHOd data sets are geo-referenced and can be visualized using Panoply, a Java based graphical user interface capable of plotting arrays from netCDF files. Further information and download options are available at https://www.giss.nasa.gov/tools/panoply/ netCDF programing interfaces are available for major high-level languages including IDL, Matlab, R, and Python. Appendix A reproduces a basic Python script to read column amount from multiple OMHCHOd files and co-add them on the temporal domain.
5.0 Data Services OMHCHOd products are archived and distributed by the Goddard Earth Science Data & Information Services Center (GES-DISC). The files can be directly downloaded from the GES-DISC or search using NASA’s EarthData web services which provides capabilities for spatial and temporal subsetting. GES-DISC provides a list of tools that can read netCDF-4 files. To download GES-DISC data you must (1) register in Earthdata Login and (2) be authorized for NASA GES-DISC Data Access. Registering and downloading data with Earthdata can be achieved here: https://disc.gsfc.nasa.gov/data-access
The GES DISC Giovanni service (https://giovanni.gsfc.nasa.gov/giovanni/) allows users to view and explore the OMHCHOd product before downloading the data files.
If you need assistance or wish to report a problem: Email: [email protected] Voice: 301-614-5224 Fax: 301-614-5268 Address: Goddard Earth Sciences Data and Information Services Center NASA Goddard Space Flight Center Code 610.2 Greenbelt, MD 20771 USA
6.0 Acknowledgments This project is funded by NASA’s Aura Science Team. We will like to thank the personnel at OMI-SIPS for their efforts implementing the operational OMHCHOd algorithm (Phil Durbin in particular) and GES-DISC personnel (James Johnson in particular) for facilitating the public release of the OMHCHOd dataset.
References González Abad, G., Liu, X., Chance, K., Wang, H., Kurosu, T. P., and Suleiman, R.: Updated Smithsonian Astrophysical Observatory Ozone Monitoring Instrument (SAO OMI) formaldehyde retrieval, Atmos. Meas. Tech., 8, 19-32, https://doi.org/10.5194/amt-8-19-2015, 2015.
Levelt, P. F., Joiner, J., Tamminen, J., Veefkind, J. P., Bhartia, P. K., Stein Zweers, D. C., Duncan, B. N., Streets, D. G., Eskes, H., van der A, R., McLinden, C., Fioletov, V., Carn, S., de Laat, J., DeLand, M., Marchenko, S., McPeters, R., Ziemke, J., Fu, D., Liu, X., Pickering, K., Apituley, A., González Abad, G., Arola, A., Boersma, F., Chan Miller, C., Chance, K., de Graaf, M., Hakkarainen, J., Hassinen, S., Ialongo, I., Kleipool, Q., Krotkov, N., Li, C., Lamsal, L., Newman, P., Nowlan, C., Suleiman, R., Tilstra, L. G., Torres, O., Wang, H., and Wargan, K.: The Ozone Monitoring Instrument: overview of 14 years in space, Atmos. Chem. Phys., 18, 5699-5745, https://doi.org/10.5194/acp-18-5699-2018, 2018.
Sun, K., Zhu, L., Cady-Pereira, K., Chan Miller, C., Chance, K., Clarisse, L., Coheur, P.-F., González Abad, G., Huang, G., Liu, X., Van Damme, M., Yang, K., and Zondlo, M.: A physics-based approach to oversample multi-satellite, multispecies observations to a common grid, Atmos. Meas. Tech., 11, 6679-6701, https://doi.org/10.5194/amt-11-6679-2018, 2018.
The OMHCHO README file is at https://aura.gesdisc.eosdis.nasa.gov/data/Aura_OMI_Level2/OMHCHO.003/doc/README.OMHCHO.pdf

Appendix A. Python reader and temporal co-add script
# -*- coding: utf-8 -*-
"""
Created on Thu Aug 1 15:07:52 2019
This example script is provided as is with no warranty of any kind,
either expressed or implied. You are solely responsible for
determining the appropriateness of using or redistributing the
software and assume any risks associated.
@author: Kang Sun
"""
from netCDF4 import Dataset
import sys, os, glob
import datetime
import numpy as np
from calendar import monthrange
if sys.platform == 'win32':
omhchod_dir = r'C:\<Input_Files_Path>'
l3_path_structure = None
else:
omhchod_dir = '<Input_Files_Path>'
l3_path_structure = '%Y/%m/'
def
F_aggregate_OMHCHOd(start_date,end_date,omhchod_dir,l3_path_structure=None
):
"""
aggregate operational omhcho daily level 3 over some time interval
start_date:
python datetime object for the start date
end_date:
python datetime object for the end date, inclusive
omhchod_dir:
root directory where omhchod are saved
l3_path_dir:
None by default, indicating individual files are directly under
path
'%Y/' if files are like omhchod_dir/2019/*.nc
'%Y/%m/%d/' if files are like omhchod_dir/2019/05/01/*.nc
created on 2019/08/03
"""
days = (end_date-start_date).days+1
dates = [start_date+datetime.timedelta(days=d) for d in range(days)]
os.chdir(omhchod_dir)
if 'A' in vars():
del A
for date in dates:
if l3_path_structure == None:
fn = glob.glob('OMI-Aura_L3-
OMHCHOd_'+date.strftime("%Ym%m%d")+'*.nc')
else:
fn = glob.glob(date.strftime(l3_path_structure)+\
'OMI-Aura_L3-
OMHCHOd_'+date.strftime("%Ym%m%d")+'*.nc')
if len(fn)>0:
nc = Dataset(fn[0])
nc.set_auto_mask(False)
if 'A' not in vars():
cc = nc['/key_science_data/column_amount'][:]
bb = nc['/support_data/sample_weight'][:]
dd = nc['/qa_statistics/num_samples'][:]
qa = (nc['/qa_statistics/data_quality_flag'][:] <= 1)
cc[~qa] = 0.
bb[~qa] = 0.
dd[~qa] = 0.
aa = cc*bb
A = aa
B = bb
D = dd
lon = nc['longitude'][:]
lat = nc['latitude'][:]
else:
cc =
nc['/key_science_data/column_amount'][:].astype(np.float64)
bb =
nc['/support_data/sample_weight'][:].astype(np.float64)
dd = nc['/qa_statistics/num_samples'][:]
qa = (nc['/qa_statistics/data_quality_flag'][:] <= 1)
cc[~qa] = 0.
bb[~qa] = 0.
dd[~qa] = 0.
aa = cc*bb
A = A+aa
B = B+bb
D = D+dd
l3_data = {}
if 'A' in vars():
l3_data['xgrid'] = lon
l3_data['ygrid'] = lat
l3_data['A'] = A
l3_data['B'] = B
l3_data['D'] = D
return l3_data
start_year = 2004
start_month = 1
end_year = 2019
end_month = 7
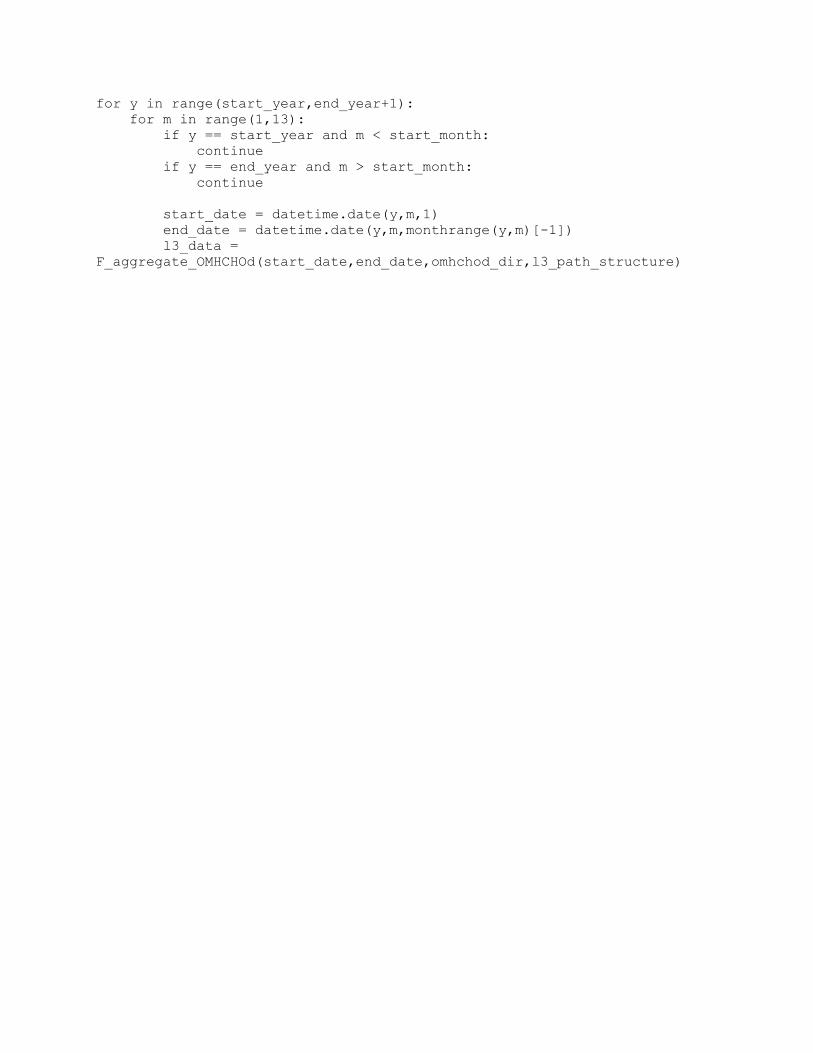
for y in range(start_year,end_year+1):
for m in range(1,13):
if y == start_year and m < start_month:
continue
if y == end_year and m > start_month:
continue
start_date = datetime.date(y,m,1)
end_date = datetime.date(y,m,monthrange(y,m)[-1])
l3_data =
F_aggregate_OMHCHOd(start_date,end_date,omhchod_dir,l3_path_structure)


![WELCOME [cooperms.fcps.edu] · 2019. 12. 21. · German level 1A – 1 semester Japanese Immersion ... French level 1B – 1 year, 1 HS language credit German level 1B –1 year,](https://img.pdfslide.us/doc/110x75/60072764c5810119db3a1923/welcome-2019-12-21-german-level-1a-a-1-semester-japanese-immersion-.jpg)