Embed Size (px)
Citation preview
AIRS (Atmospheric Infrared Sounder)
Level 1B data
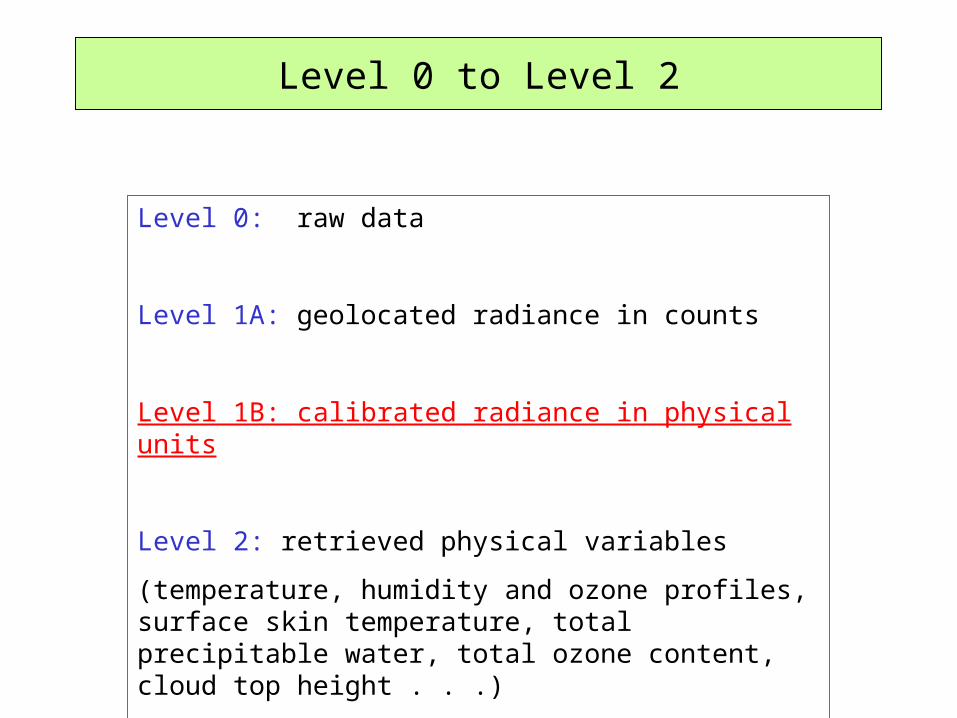
Level 0 to Level 2
Level 0: raw data
Level 1A: geolocated radiance in counts
Level 1B: calibrated radiance in physical units
Level 2: retrieved physical variables
(temperature, humidity and ozone profiles, surface skin temperature, total precipitable water, total ozone content, cloud top height . . .)
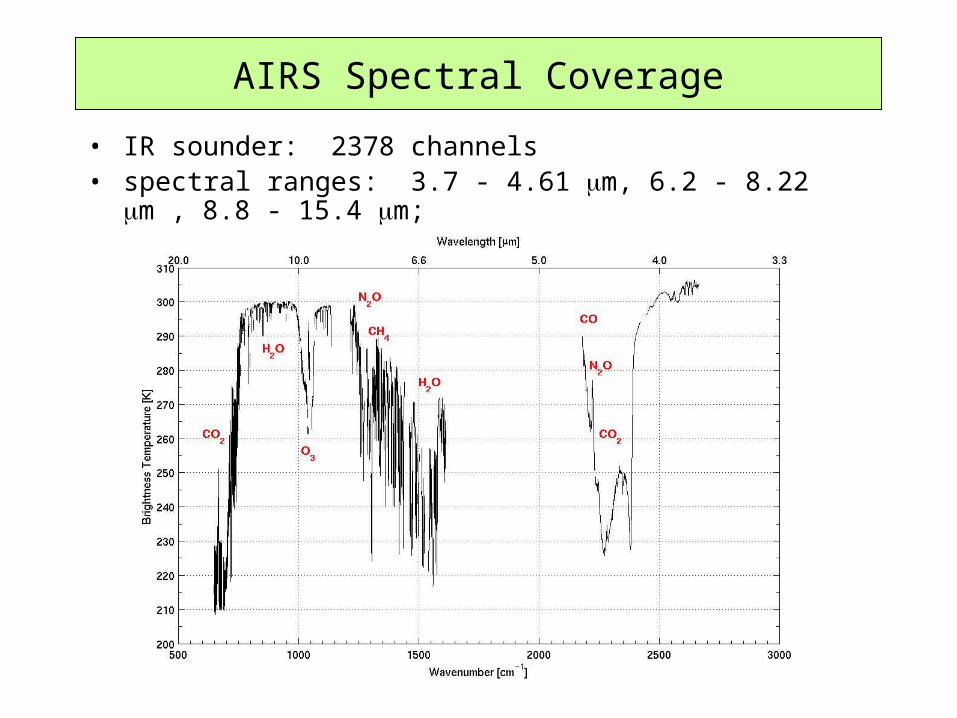
AIRS Spectral Coverage
• IR sounder: 2378 channels• spectral ranges: 3.7 - 4.61 m, 6.2 - 8.22 m , 8.8 -
15.4 m;
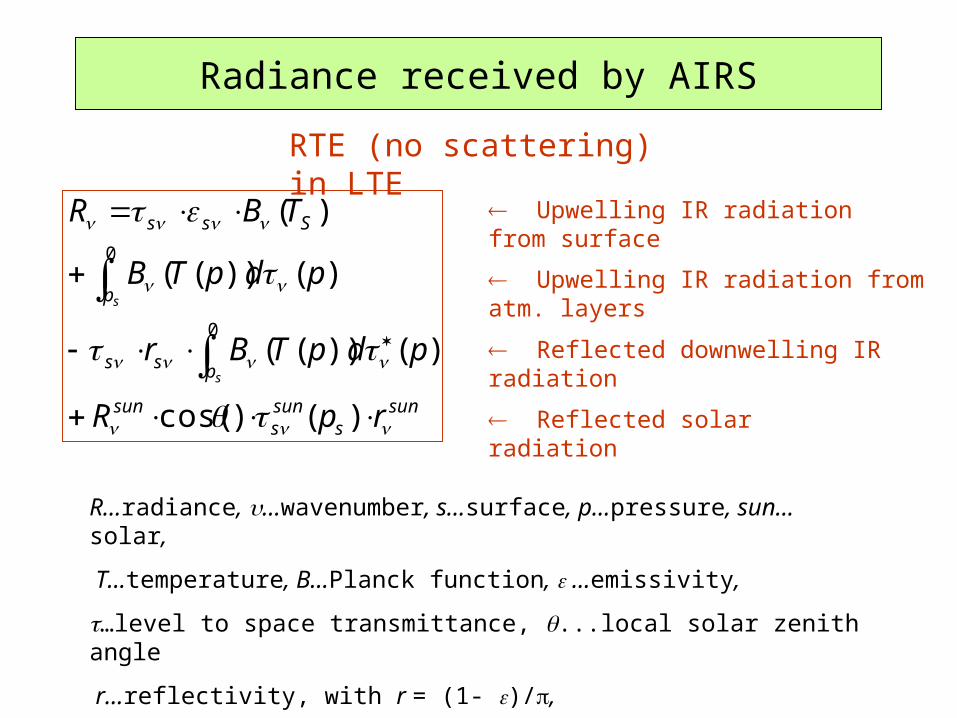
Radiance received by AIRS
RTE (no scattering) in LTE
suns
suns
sun
pss
p
Sss
rpR
pdpTBr
pdpTB
TBR
s
s
)()cos(
)())((
)())((
)(
0
0
Upwelling IR radiation from surface
Upwelling IR radiation from atm. layers
Reflected downwelling IR radiation
Reflected solar radiation
R…radiance, …wavenumber, s…surface, p…pressure, sun…solar,
T…temperature, B…Planck function, …emissivity,
…level to space transmittance, ...local solar zenith angle
r…reflectivity, with r = (1- )/,
*…level to surface (downwelling) transmittance [*= 2(ps)/ (p)]
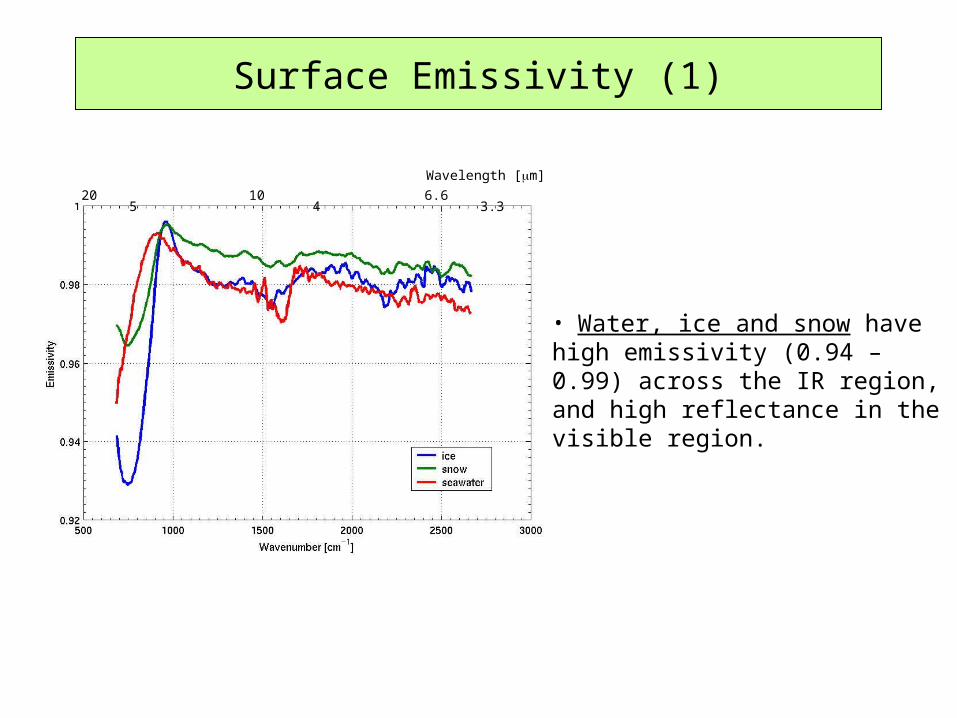
Surface Emissivity (1)
• Water, ice and snow have high emissivity (0.94 – 0.99) across the IR region, and high reflectance in the visible region.
Wavelength [m]
20 10 6.6 5 4 3.3
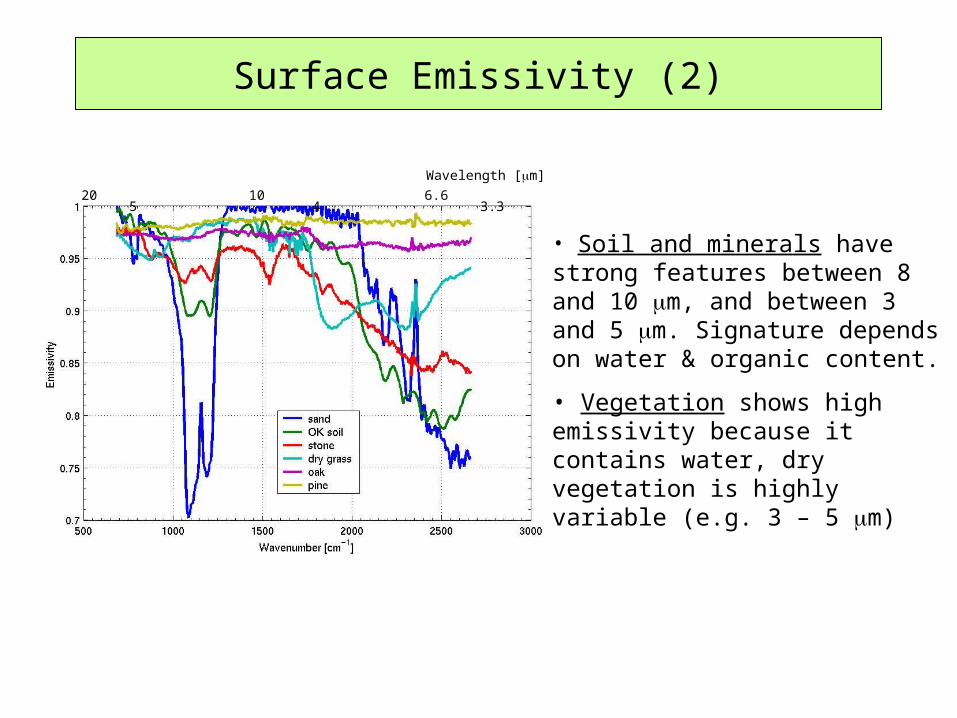
Surface Emissivity (2)
• Soil and minerals have strong features between 8 and 10 m, and between 3 and 5 m. Signature depends on water & organic content.
• Vegetation shows high emissivity because it contains water, dry vegetation is highly variable (e.g. 3 – 5 m)
Wavelength [m]
20 10 6.6 5 4 3.3
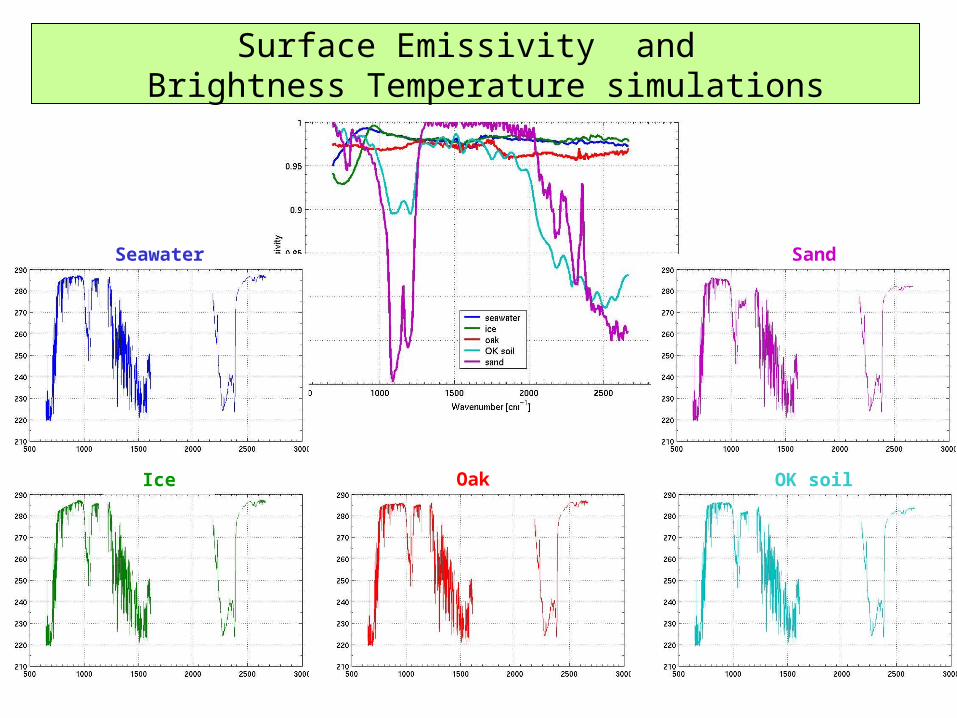
Surface Emissivity and Brightness Temperature simulations
Seawater Sand
Ice OK soilOak
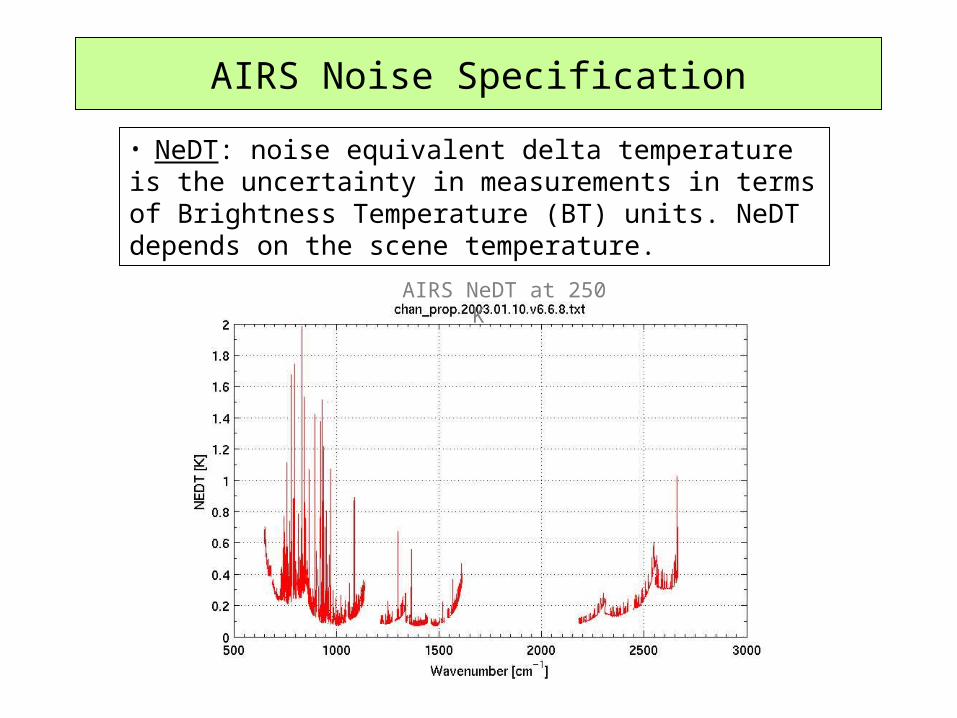
AIRS Noise Specification
• NeDT: noise equivalent delta temperature is the uncertainty in measurements in terms of Brightness Temperature (BT) units. NeDT depends on the scene temperature.
AIRS NeDT at 250 K
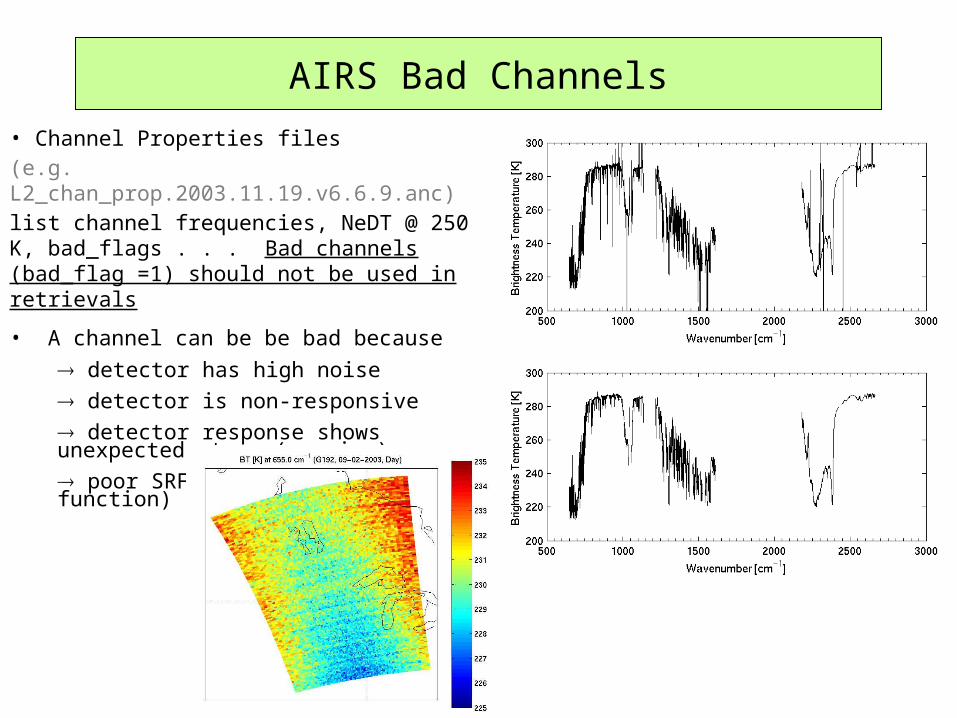
AIRS Bad Channels
• Channel Properties files (e.g. L2_chan_prop.2003.11.19.v6.6.9.anc)list channel frequencies, NeDT @ 250 K, bad_flags . . . Bad channels (bad_flag =1) should not be used in retrievals
• A channel can be be bad because
detector has high noise
detector is non-responsive
detector response shows unexpected steps (popping)
poor SRF (spectral response function) determination
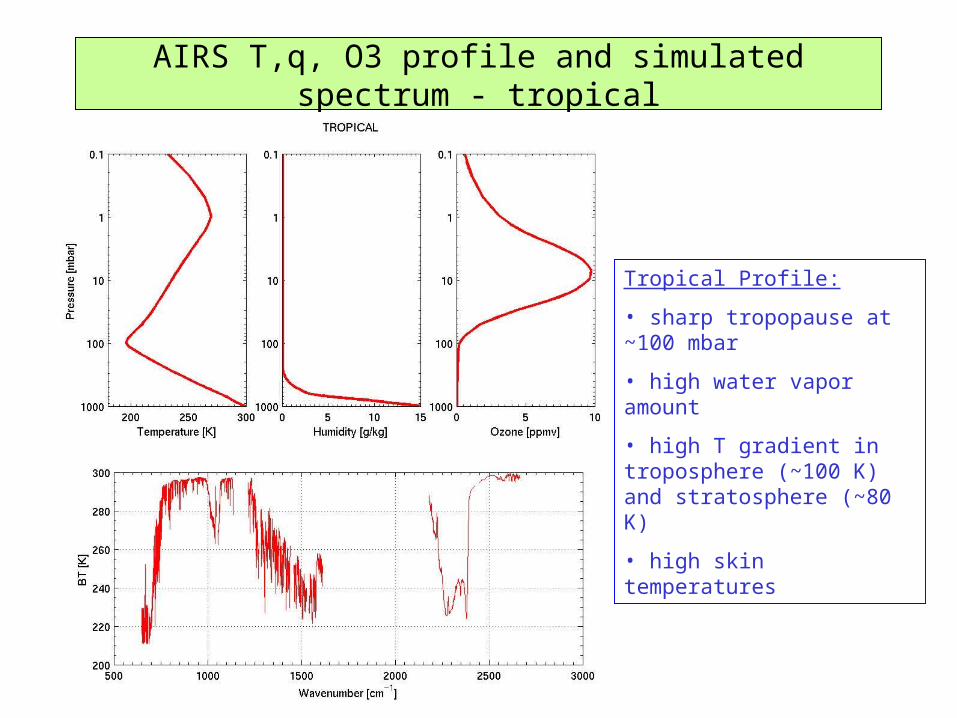
AIRS T,q, O3 profile and simulated spectrum - tropical
Tropical Profile:
• sharp tropopause at ~100 mbar
• high water vapor amount
• high T gradient in troposphere (~100 K) and stratosphere (~80 K)
• high skin temperatures
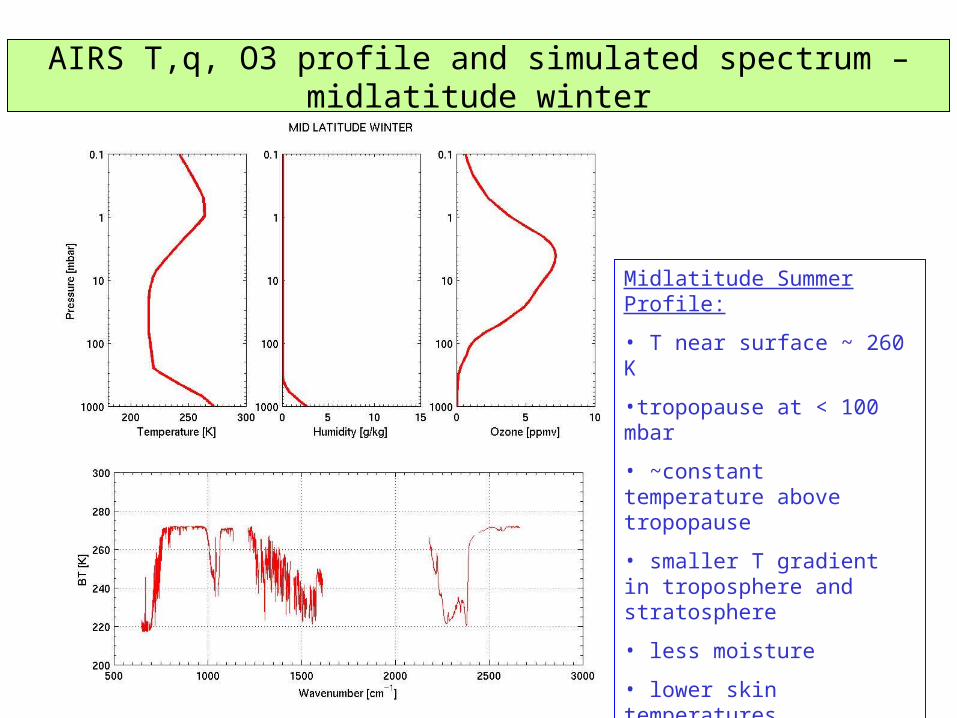
AIRS T,q, O3 profile and simulated spectrum – midlatitude winter
Midlatitude Summer Profile:
• T near surface ~ 260 K
•tropopause at < 100 mbar
• ~constant temperature above tropopause
• smaller T gradient in troposphere and stratosphere
• less moisture
• lower skin temperatures
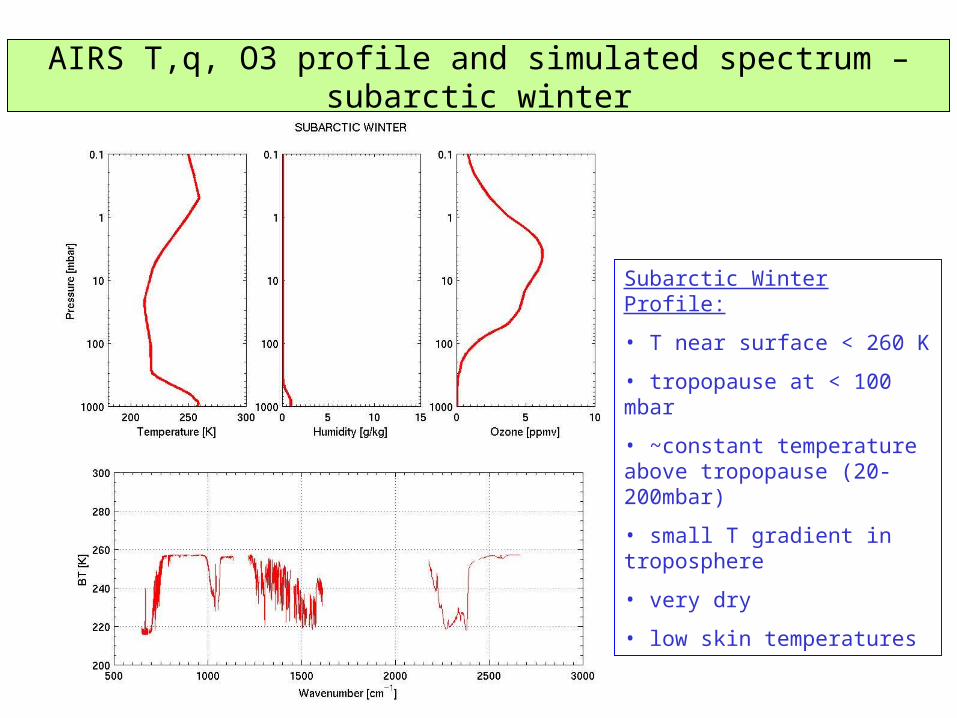
AIRS T,q, O3 profile and simulated spectrum – subarctic winter
Subarctic Winter Profile:
• T near surface < 260 K
• tropopause at < 100 mbar
• ~constant temperature above tropopause (20-200mbar)
• small T gradient in troposphere
• very dry
• low skin temperatures
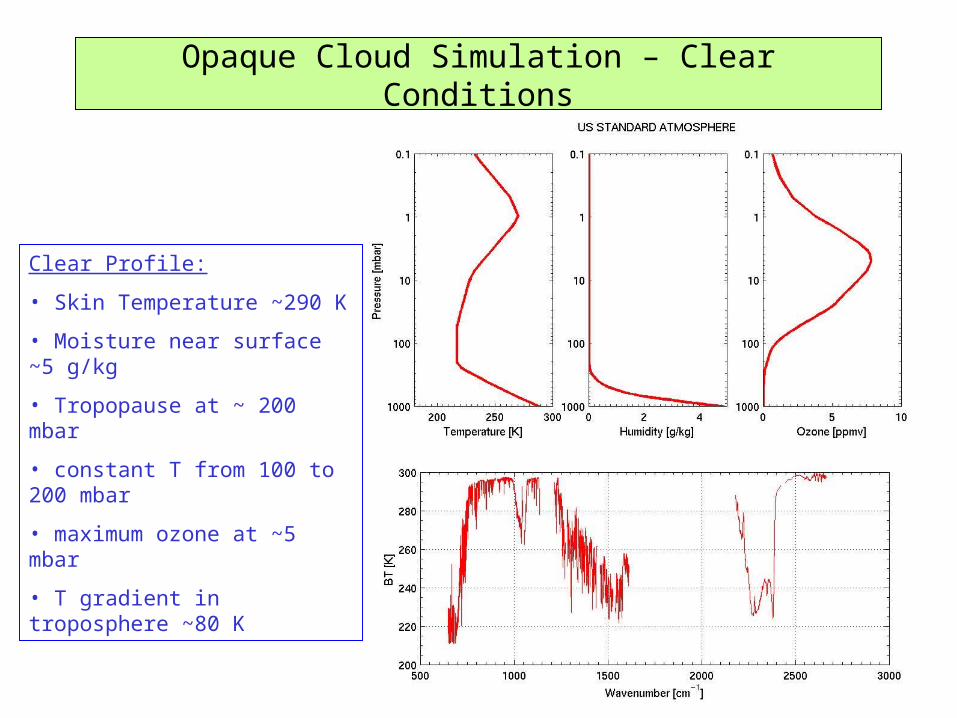
Opaque Cloud Simulation – Clear Conditions
Clear Profile:
• Skin Temperature ~290 K
• Moisture near surface ~5 g/kg
• Tropopause at ~ 200 mbar
• constant T from 100 to 200 mbar
• maximum ozone at ~5 mbar
• T gradient in troposphere ~80 K
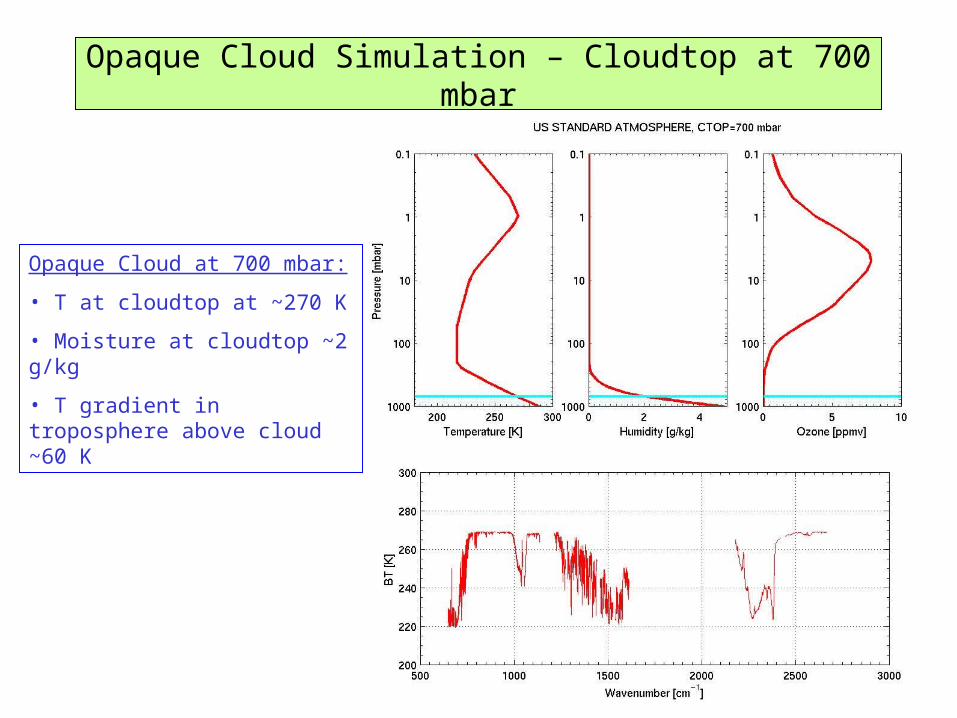
Opaque Cloud Simulation – Cloudtop at 700 mbar
Opaque Cloud at 700 mbar:
• T at cloudtop at ~270 K
• Moisture at cloudtop ~2 g/kg
• T gradient in troposphere above cloud ~60 K
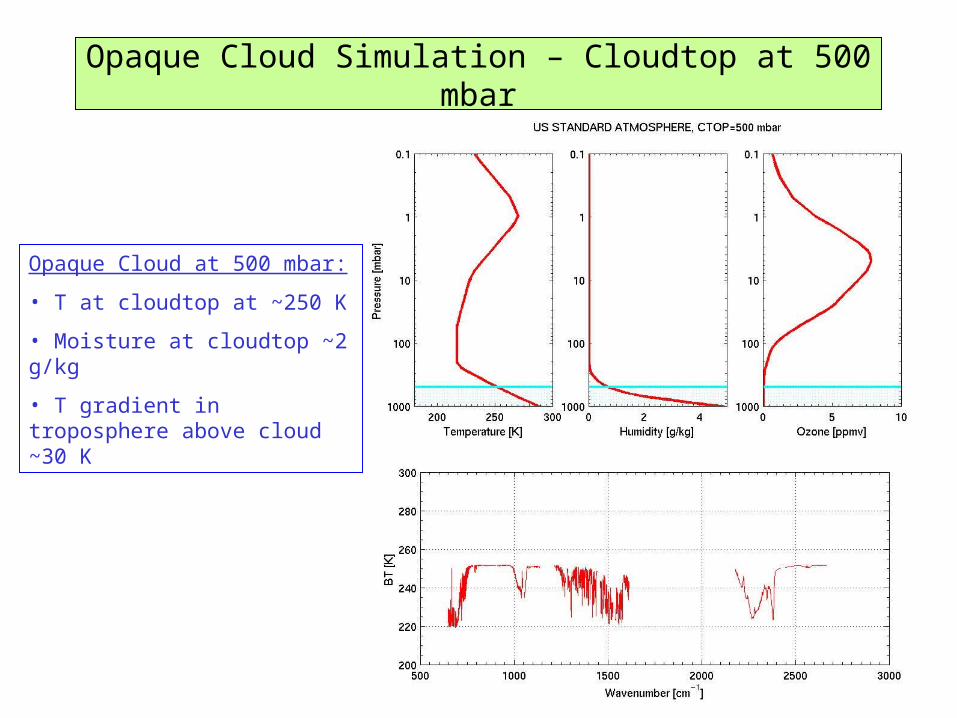
Opaque Cloud Simulation – Cloudtop at 500 mbar
Opaque Cloud at 500 mbar:
• T at cloudtop at ~250 K
• Moisture at cloudtop ~2 g/kg
• T gradient in troposphere above cloud ~30 K
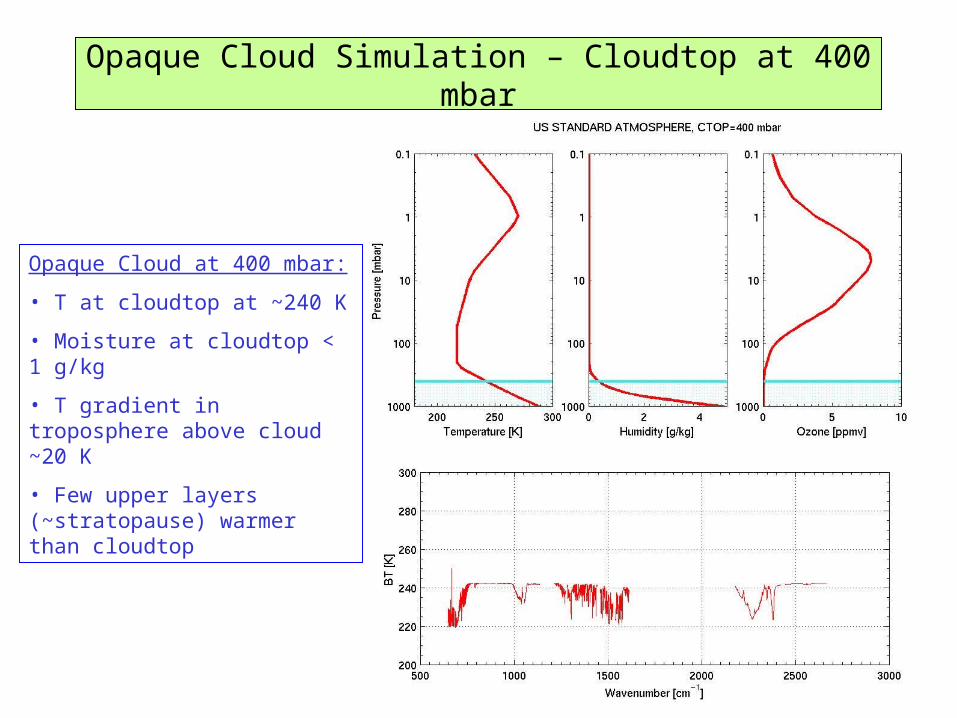
Opaque Cloud Simulation – Cloudtop at 400 mbar
Opaque Cloud at 400 mbar:
• T at cloudtop at ~240 K
• Moisture at cloudtop < 1 g/kg
• T gradient in troposphere above cloud ~20 K
• Few upper layers (~stratopause) warmer than cloudtop
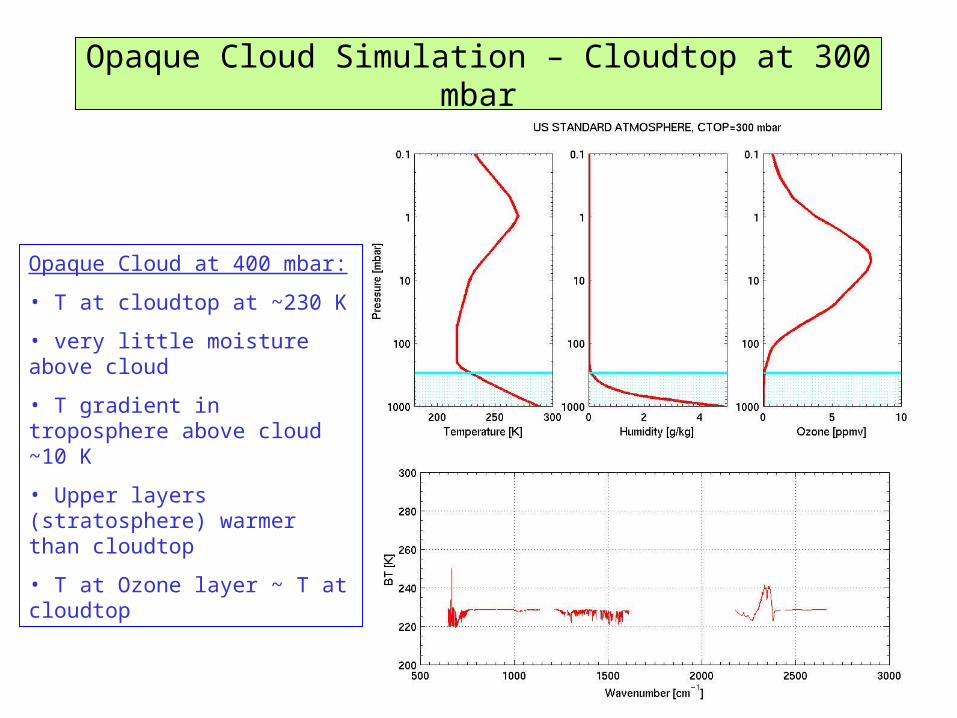
Opaque Cloud Simulation – Cloudtop at 300 mbar
Opaque Cloud at 400 mbar:
• T at cloudtop at ~230 K
• very little moisture above cloud
• T gradient in troposphere above cloud ~10 K
• Upper layers (stratosphere) warmer than cloudtop
• T at Ozone layer ~ T at cloudtop
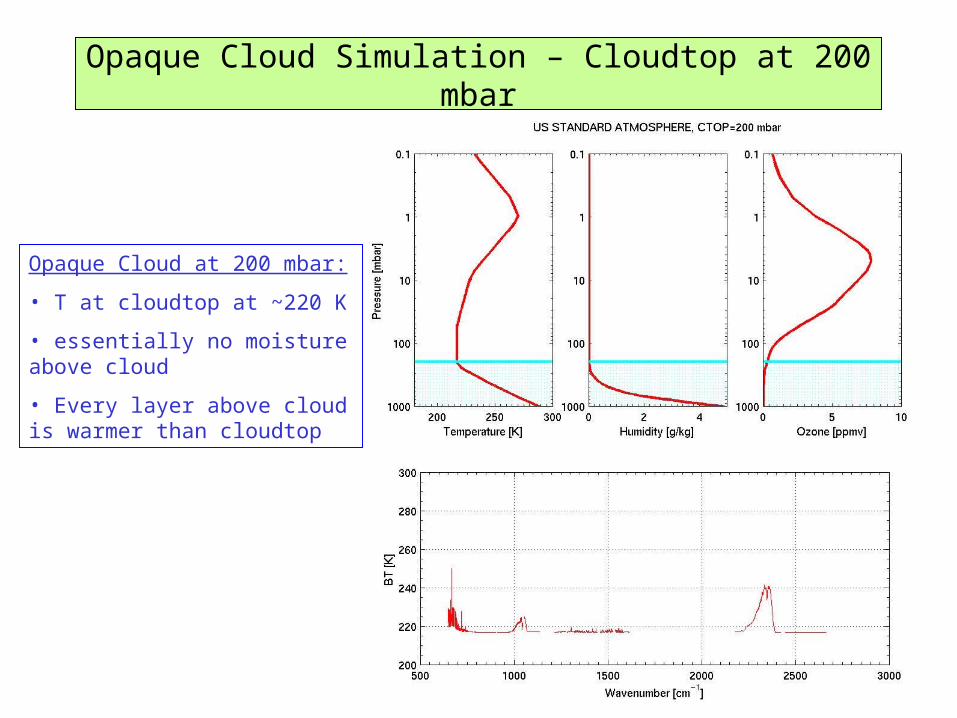
Opaque Cloud Simulation – Cloudtop at 200 mbar
Opaque Cloud at 200 mbar:
• T at cloudtop at ~220 K
• essentially no moisture above cloud
• Every layer above cloud is warmer than cloudtop
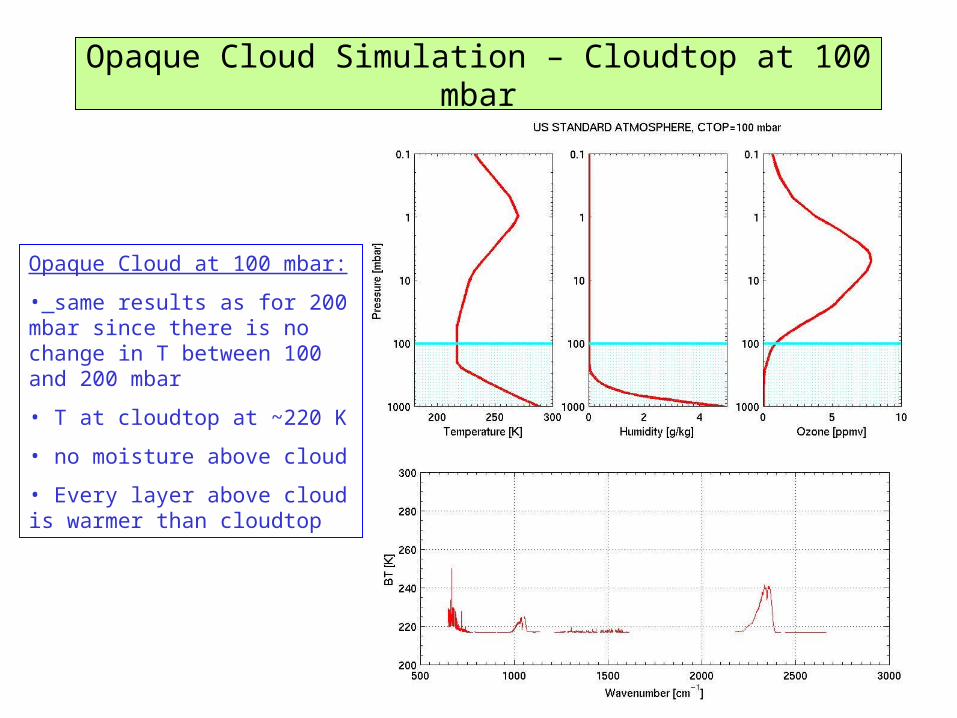
Opaque Cloud Simulation – Cloudtop at 100 mbar
Opaque Cloud at 100 mbar:
• same results as for 200 mbar since there is no change in T between 100 and 200 mbar
• T at cloudtop at ~220 K
• no moisture above cloud
• Every layer above cloud is warmer than cloudtop
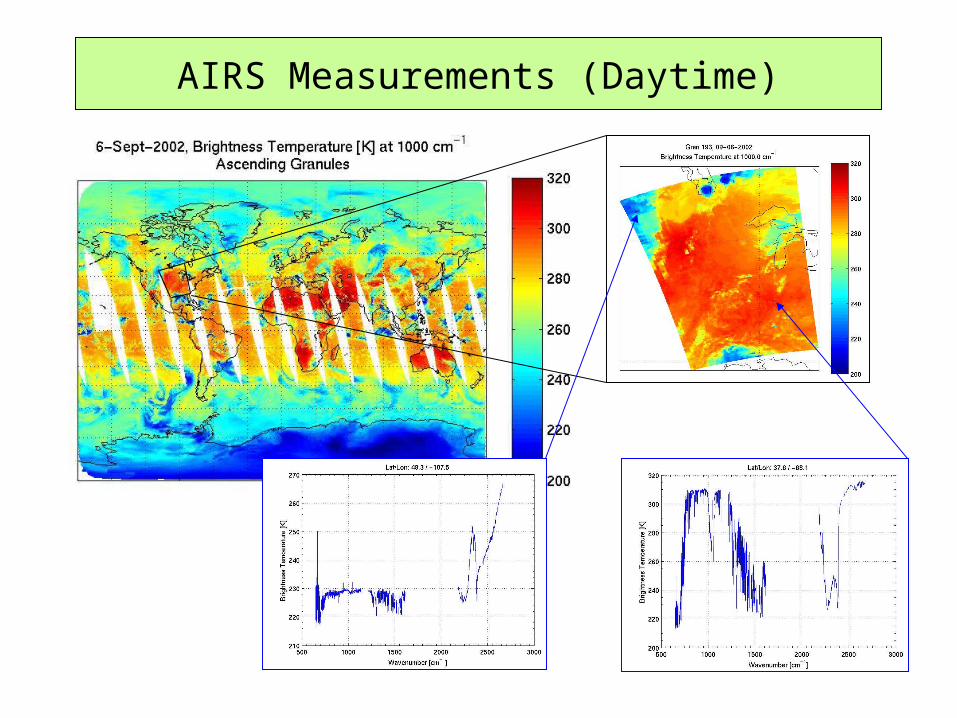
AIRS Measurements (Daytime)
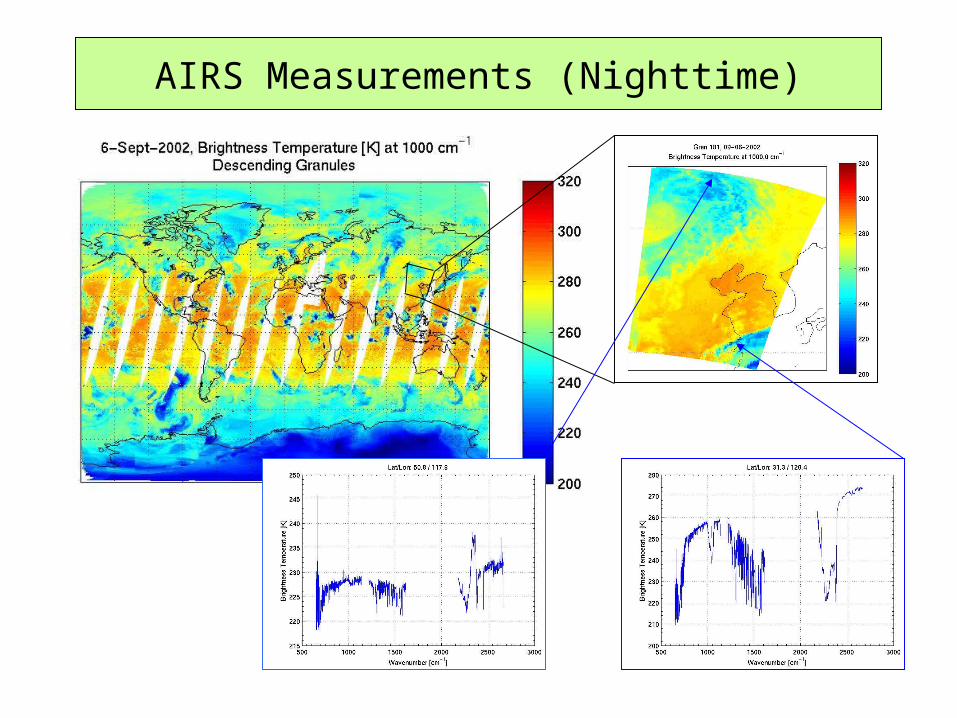
AIRS Measurements (Nighttime)
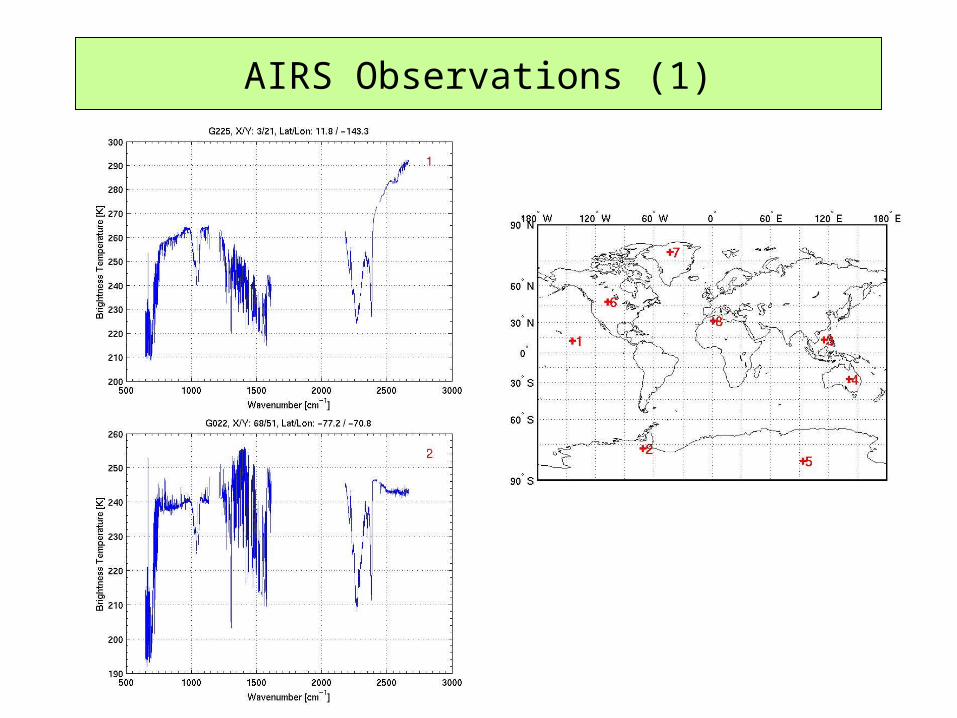
AIRS Observations (1)
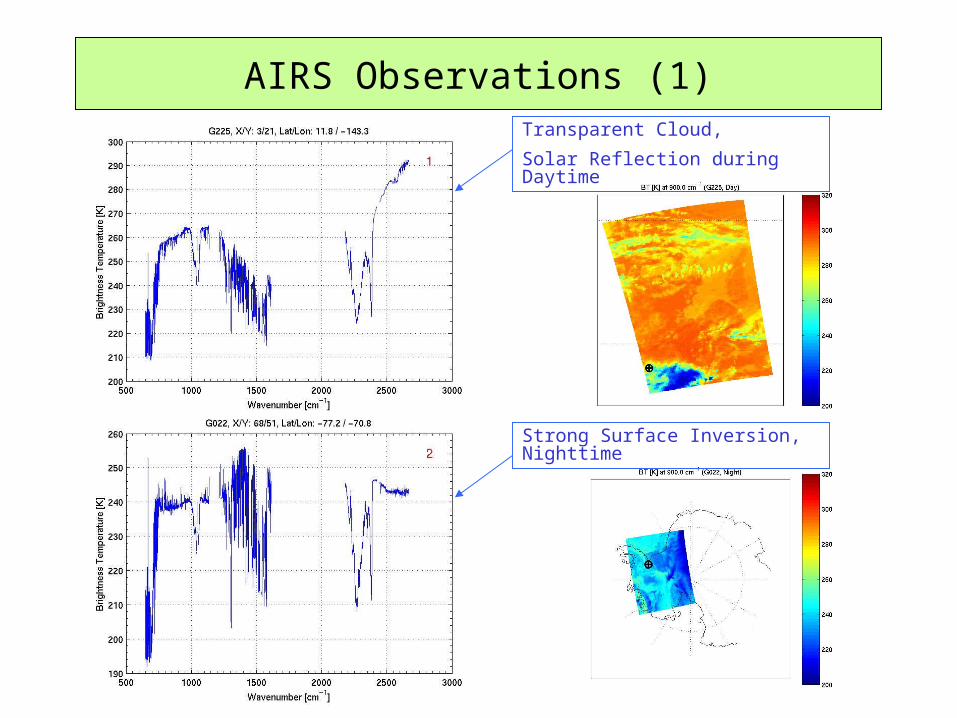
AIRS Observations (1)Transparent Cloud,
Solar Reflection during Daytime
Strong Surface Inversion, Nighttime
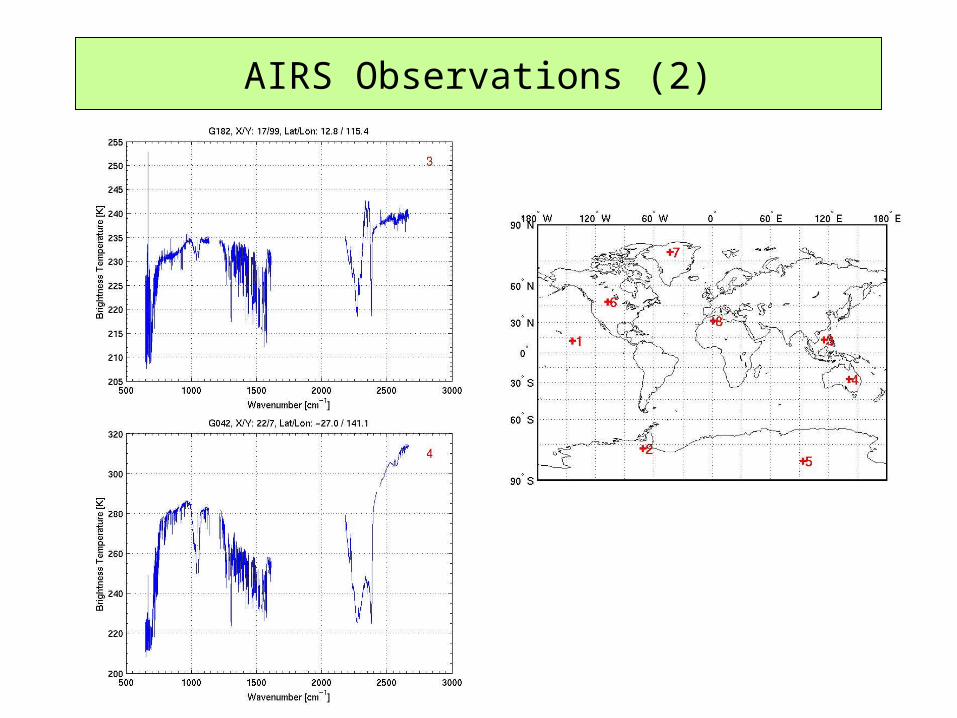
AIRS Observations (2)
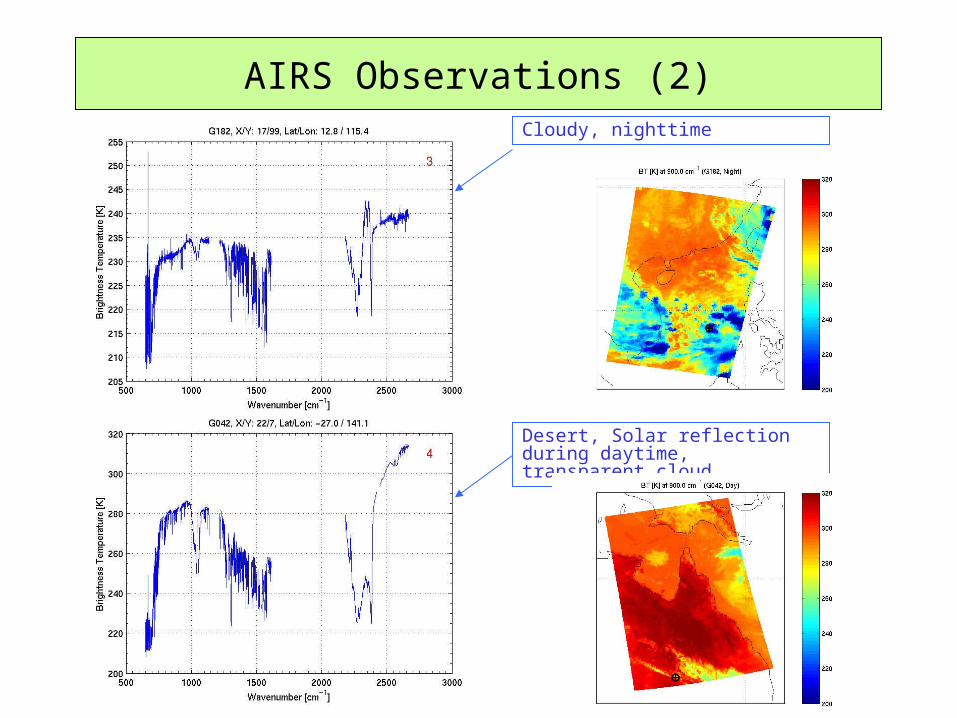
AIRS Observations (2)Cloudy, nighttime
Desert, Solar reflection during daytime, transparent cloud
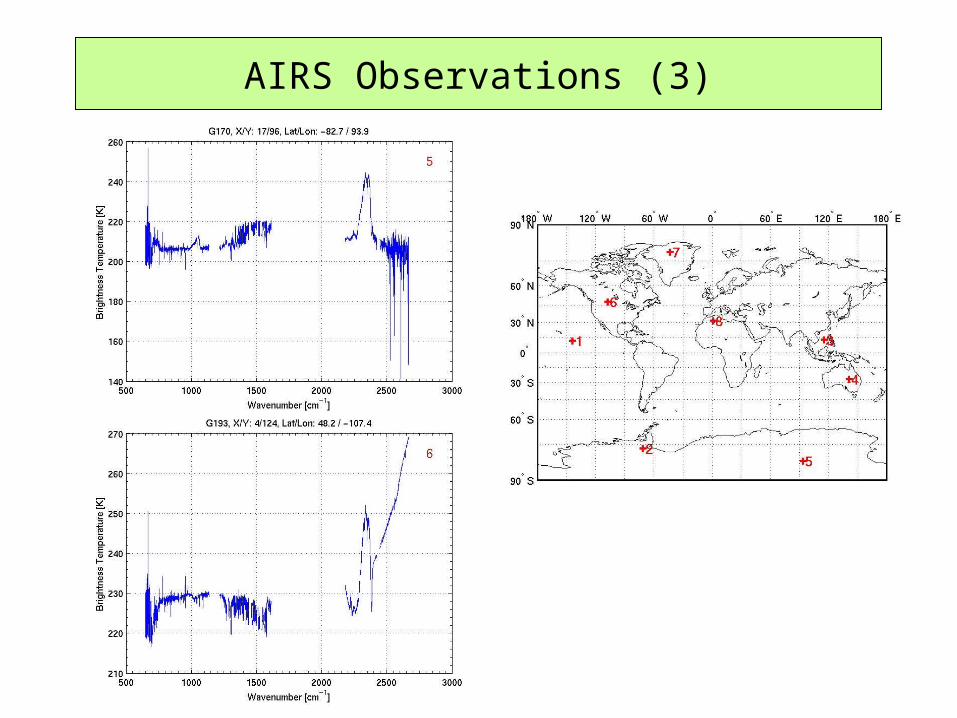
AIRS Observations (3)
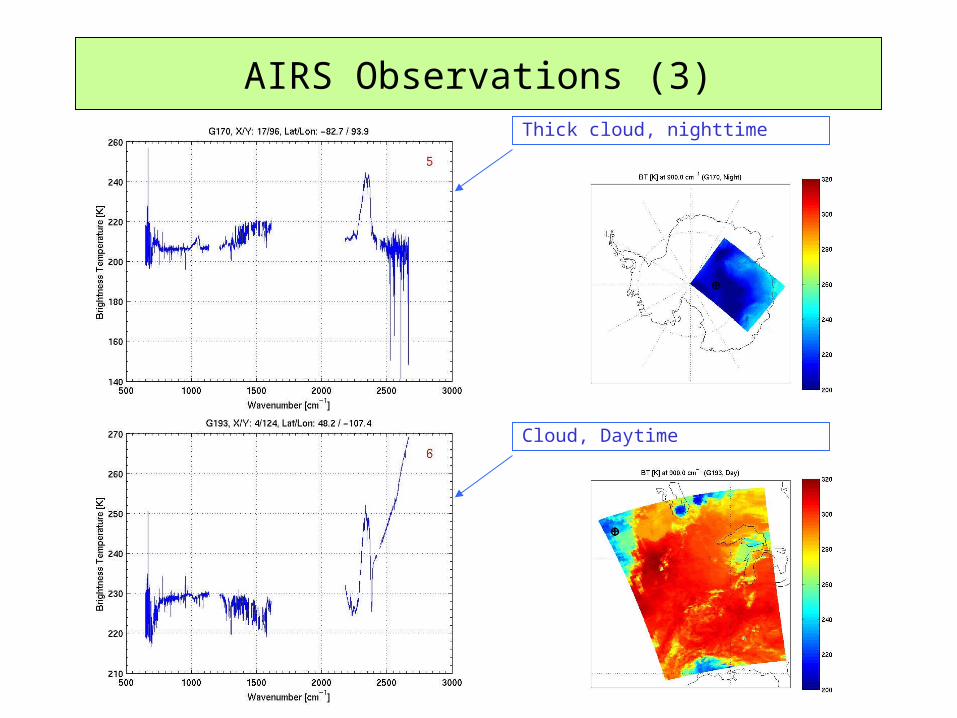
AIRS Observations (3)Thick cloud, nighttime
Cloud, Daytime
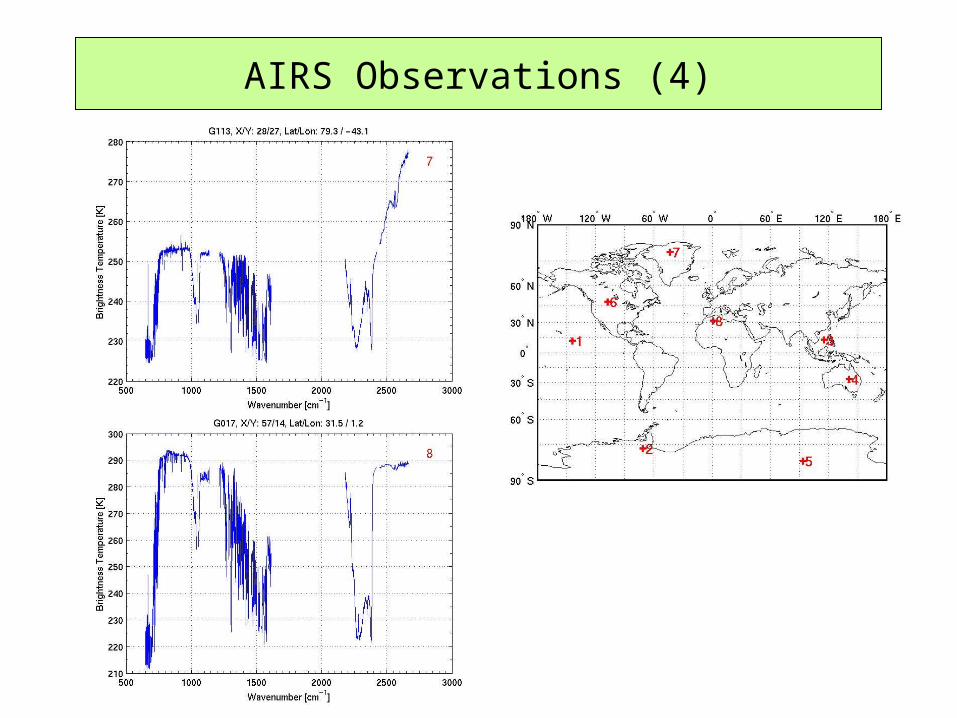
AIRS Observations (4)
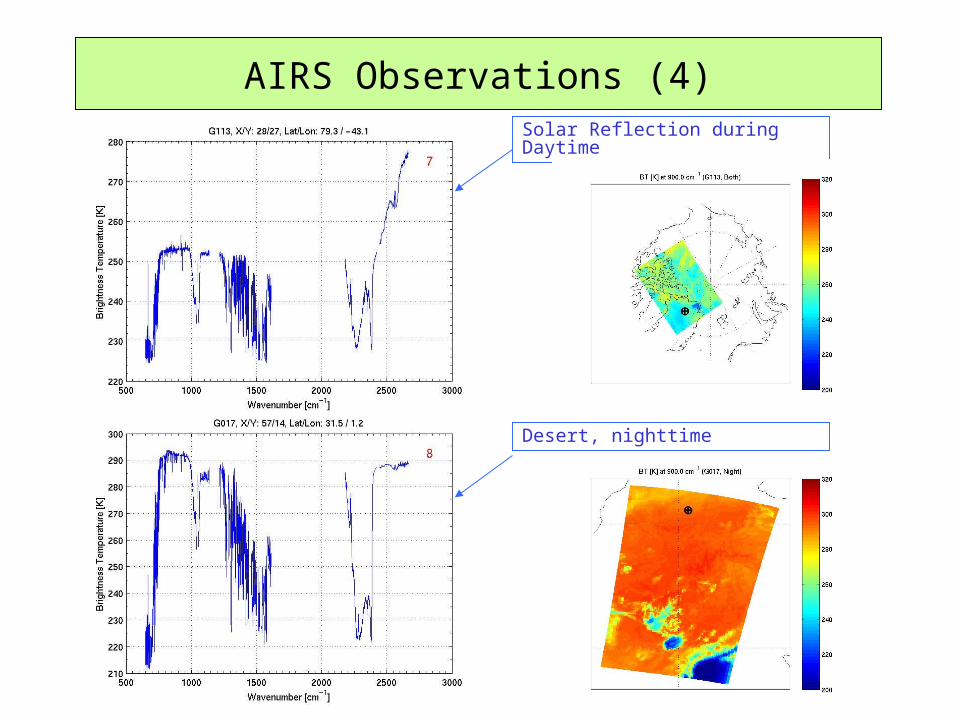
AIRS Observations (4)
Desert, nighttime
Solar Reflection during Daytime
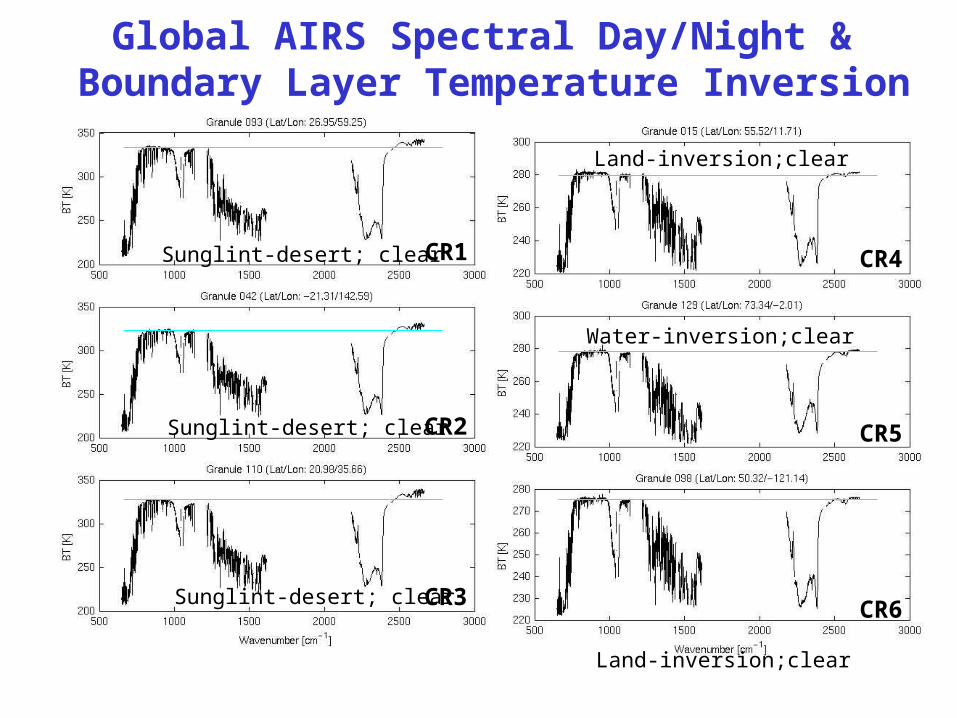
Global AIRS Spectral Day/Night & Boundary Layer Temperature Inversion
Sunglint-desert; clear
Sunglint-desert; clear
Sunglint-desert; clear
Land-inversion;clear
Water-inversion;clear
Land-inversion;clear
CR1
CR2
CR3
CR4
CR5
CR6
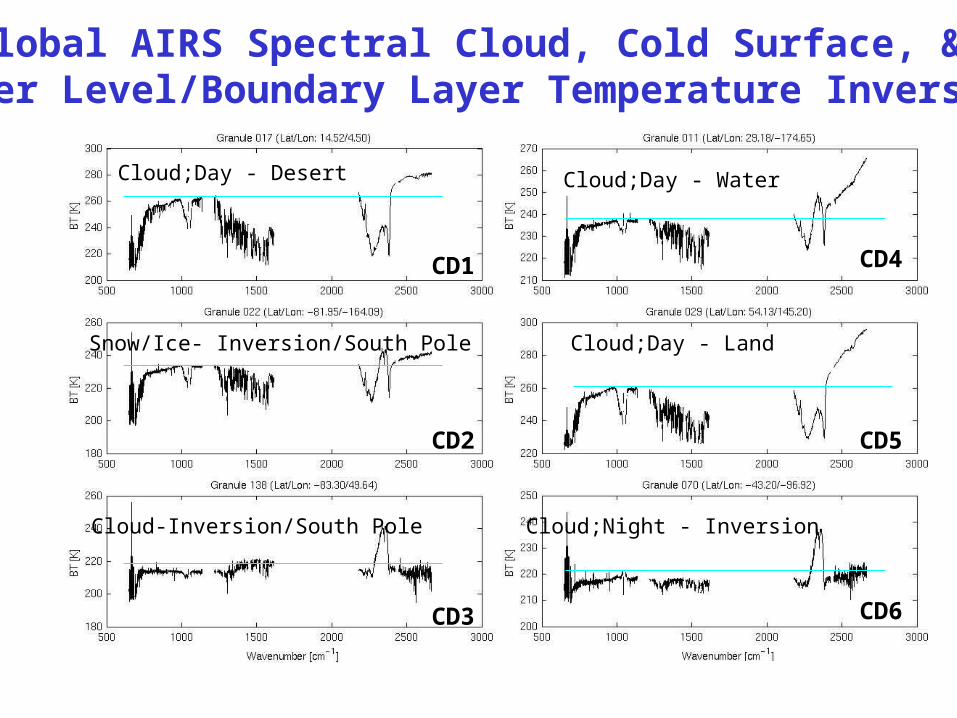
Global AIRS Spectral Cloud, Cold Surface, & Upper Level/Boundary Layer Temperature Inversion
Snow/Ice- Inversion/South Pole
Cloud-Inversion/South Pole
Cloud;Day - Water
Cloud;Day - Land
Cloud;Night - Inversion
Cloud;Day - Desert
CD4
CD5
CD6
CD2
CD1
CD3
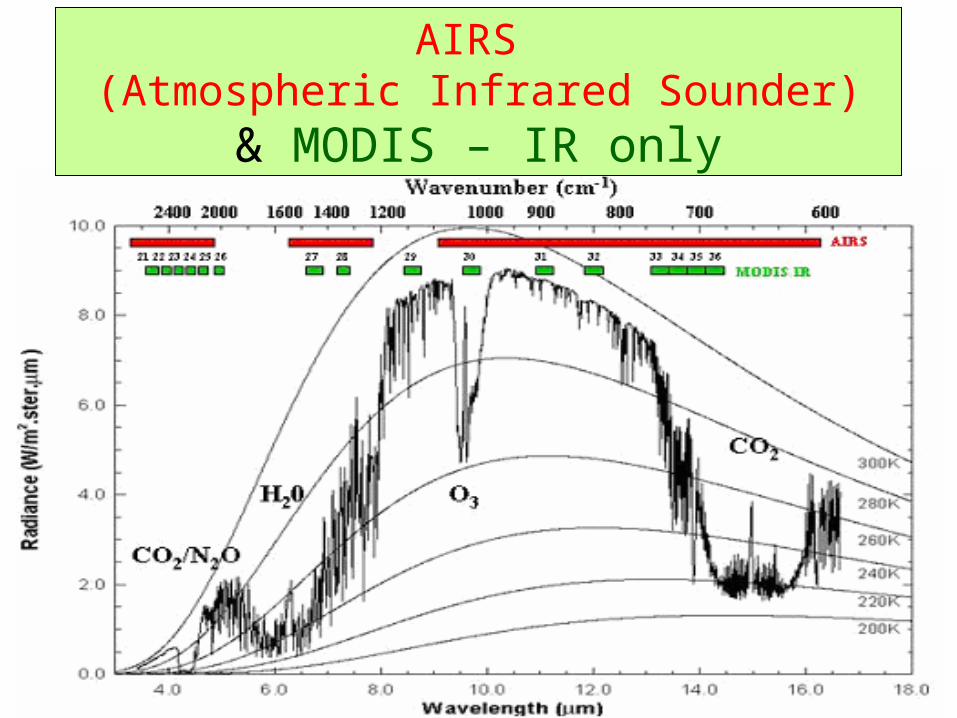
AIRS (Atmospheric Infrared Sounder)
& MODIS – IR only
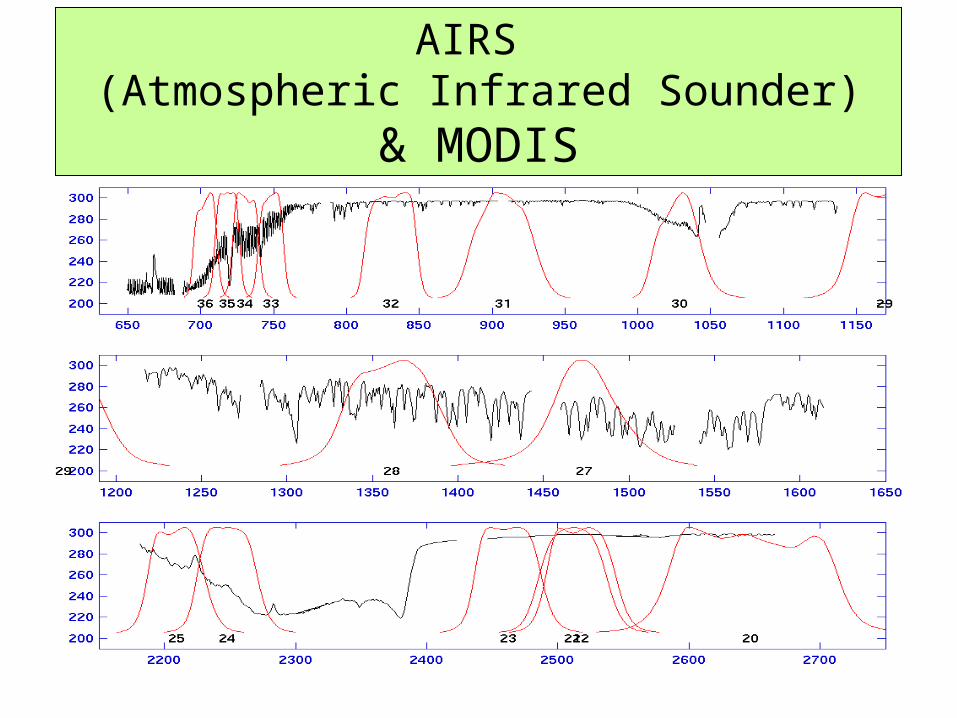
AIRS (Atmospheric Infrared Sounder)
& MODIS
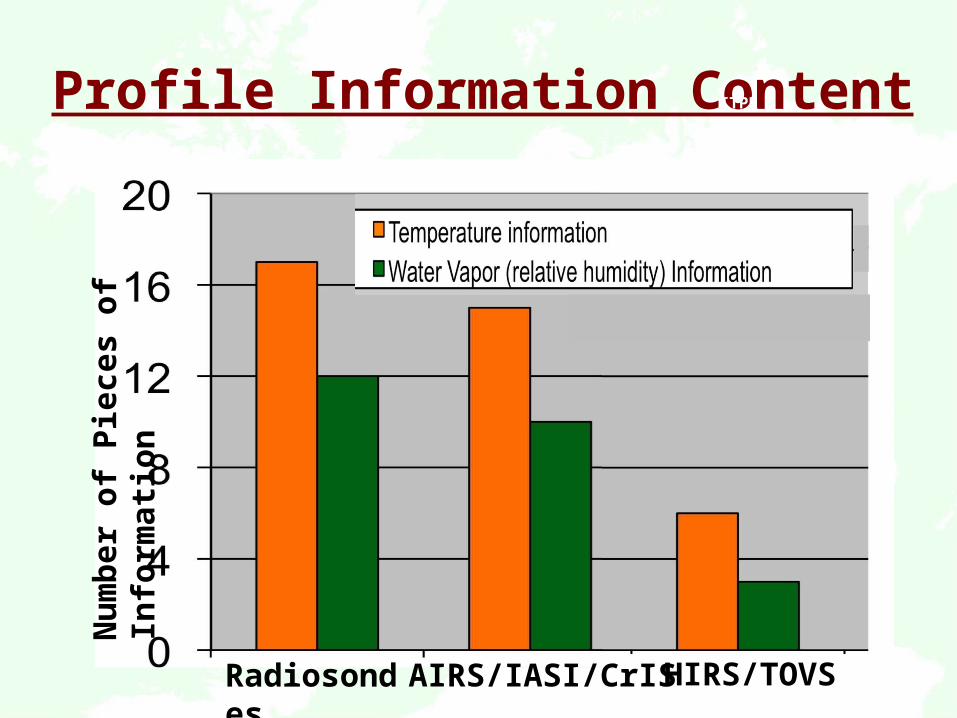
Profile Information ContentITPRN
umbe
r of P
iece
s of
Info
rmati
on
Radiosondes AIRS/IASI/CrIS HIRS/TOVS