Embed Size (px)
Citation preview
See discussions, stats, and author profiles for this publication at: https://www.researchgate.net/publication/332530335
A Generalizability Theory Study on the Assessment of Task-Based
Reading Performance
Article · December 2015
DOI: 10.20622/jltajournal.18.0_92
CITATIONS
0READS
2
8 authors, including:
Akira Hamada
Meikai University
16 PUBLICATIONS 9 CITATIONS
SEE PROFILE
Masaya Hosoda
Tokyo City University
6 PUBLICATIONS 2 CITATIONS
SEE PROFILE
All content following this page was uploaded by Akira Hamada on 19 April 2019.
The user has requested enhancement of the downloaded file.

A Generalizability Theory Study on the Assessment of Task-Based Reading Performance
Yuji USHIRO
University of Tsukuba Akira HAMADA
Graduate School, University of Tsukuba/ The Japan Society for the Promotion of Science
Yusuke HASEGAWA Joetsu University of Education
Eleanor DOWSE Graduate School, University of Tsukuba
Natsumi TANAKA Graduate School, University of Tsukuba/
The Japan Society for the Promotion of Science Kentaro SUZUKI Kyoei University
Masaya HOSODA and Yoshinobu MORI Graduate School, University of Tsukuba/
The Japan Society for the Promotion of Science
Abstract The present study describes the first step in the development and validation of a
task-based reading performance test. We designed 6 information transfer task test items in which test-takers were required to transfer what they comprehended from passages (e.g., reading a travel schedule and communicating it to circle members via email). To validate extrapolations on the construct validity of our task-based reading performance test, this study examined the reliability of the test scores by performing a generalizability theory study and a qualitative analysis of rating approaches. In particular, we considered 3 factors (task characteristics, number of raters, and type of rating scale) that affect the reliability of observed scores to obtain an appropriate rating scale and procedure. Over 3 weeks of English classes, 122 Japanese university students completed the 6 different reading tasks. Their reading task outcomes were scored by 6 raters using either a task-dependent or task-independent rating scale. A generalizability study suggested that the 2 types of rating scale could be used alternatively, but qualitative analysis revealed that the 2 rating procedures differed in scoring of local errors associated with detailed information, appropriate reorganization of passage contents, and appropriateness of sociolinguistic elements. Moreover, a decision study demonstrated that the reliability of the observed scores was strongly affected by the number of tasks. To obtain a strictly high-reliability coefficient (.80), 7 tasks by 3
- 92 -
raters are desirable using the task-independent rating scale, while 9 tasks by 3 raters are necessary using the task-dependent rating scale. This study suggested the applicability of task-based reading performance tests and points to be noted for the test implementation from the viewpoints of test material development, scoring procedures, and possible washback effects on teaching and learning of English as a foreign language. Keywords: reading, test development, task-based performance assessment, reliability, generalizability theory 1. Introduction
Language tests in general measure specific construct domains, such as vocabulary, grammar, or reading sub-skills. Although these construct-based language tests can measure various aspects of learners’ linguistic abilities, they have been criticized for being unable to predict learners’ future language performance in real-life tasks (Colpin & Gysen, 2006; McNamara, 1996; Robinson & Ross, 1996; see also Bachman, 2002). For example, Skehan (1998) explained that this type of test sometimes discounts the cognitive processes involved in integrating and adapting learners’ linguistic knowledge and skills to complete a real-life task, and that construct-based tests sometimes lack communicative goals and real-world relationships with other people. When language teachers are aiming to cultivate students’ language ability in communicative situations, it is important to design and administer instruments suited to evaluating the effects of their instructions on the students’ communicative achievements. In contrast to construct-based tests, task-based (performance) tests use language data produced by learners in real-life tasks in assessing their language use ability (McNamara, 1996). Various types of language performance tests have been used to evaluate listening, speaking, and writing abilities by providing a specific situation in which to communicate with other people (e.g., Brown, Hudson, Norris, & Bonk, 2002; Colpin & Gysen, 2006; Ellis, 2003; Hudson, 2005). However, traditional reading tests sometimes discount communicative purposes, resulting in a less authentic test format that focuses on grammar, word usage, and translation. In such cases, reading tests may cause a negative washback effect on the teaching procedures of reading in a classroom, such as spending more time on word, grammar, and translation exercises and less time on integrating the linguistic knowledge in communication (Shizuka, 2002; Ushiro, 2012). Accordingly, the present study takes language testing a step further by developing and validating a task-based reading performance test based on past studies, which are reviewed below.
- 93 -
2. Task-Based Reading Performance Tests A change in language teaching methods (e.g., task-based language teaching) and the advent of English for specific purposes have motivated researchers to examine whether a test can predict the future performance of second language (L2) learners in real life (e.g., Brown et al., 2002; Ellis, 2003; Messick, 1996; Robinson & Ross, 1996; Skehan, 1998). Task-based tests have high face validity because the tasks used in the assessment correspond to tasks outside the test (Colpin & Gysen, 2006). Furthermore, Robinson and Ross (1996) claimed that task-based tests have high construct validity in assessing the procedural knowledge required to complete the tasks because they require test-takers to use various cognitive processes involved in authentic language use. In designing a task-based language performance test, one of the critical issues is the definition and design of a task (Bachman, 2002). Although the literature on task-based language teaching has not yet reached a consensus on what constitutes a task, the characteristics of tasks, as proposed by Ellis (2003, pp. 9–10) and Skehan (1998, p. 268), are applicable to task-based reading performance tests as follows: A task-based reading test involves a primary focus on meaning in communicative
situations. A task-based reading test involves real-world processes of language use. A task-based reading test requires learners to employ cognitive processes such as
selecting, classifying, ordering, reasoning, and evaluating information in order to carry out the task.
A task-based reading test has a clearly defined communicative outcome. By applying the task definitions, some past studies have developed task-based reading performance tests in which test-takers read a text according to task demands and provide a particular (e.g., written) performance based on their text comprehension (Brown et al., 2002; Robinson & Ross, 1996). For example, Robinson and Ross (1996) developed the Library Skills Reading Test for use in placing L2 students into an academic reading program at a university English language institute. Using this new test, they examined direct assessment of test-takers’ procedural knowledge in finding a specified book while reading a pamphlet of library guides, and searching for an article by comprehending an instruction book for the Education Resources Information Center database. A discriminant analysis demonstrated that accuracy in distinguishing the test-takers’ performances between success and failure was higher when submitting combined scores from individual construct-based tests and the multiple-choice format of the Library Skills Reading Test (77%), compared to using only the scores from the construct-based tests (68%). This suggests that construct-based tests, which measure specific language abilities individually, are insufficient in the assessment of authentic
- 94 -
language performance, and that task-based language tests are necessary to predict students’ future performance in specific language-use domains. However, it is difficult to reproduce a specific communicative situation perfectly when implementing task-based tests (e.g., Robinson & Ross, 1996). Tests need to reach a certain level of practicality and implementability in a range of circumstances (Bachman & Palmer, 1996). Accordingly, past research has adopted the format of semi-direct testing by giving test-takers a particular communicative setting such as a role play (Brown et al., 2002; see also Colpin & Gysen, 2006). For example, Brown et al. (2002) developed the Assessment of Language Performance test, which provided an authentic-like situation where the task required test-takers to communicate with other people. The Assessment of Language Performance test followed Skehan’s (1998) task definitions and adopted an information transfer task (Alderson, 2000), in which test-takers need to transfer text information that they have understood in some way to complete the task demands (e.g., sending an email about hotel bookings to a friend after reading a hotel pamphlet). The task characteristics of information transfer can be analyzed as follows: (a) test-takers’ attention is directed to meaning because it requires them to comprehend a text; (b) test-takers are required to transform and convey text ideas as found in real-life language use; (c) test-takers need to select, classify, order, reason, and evaluate text information in the process of transfer; and (d) the communicative outcome is information conveyed to other people. Therefore, the present study used the format of an information transfer task to assess test-takers’ reading performance. 3. Test Validation Generally in language testing, it is necessary to consider how we can infer the test-takers’ language abilities based on their test scores or performances (e.g., Bachman, 1990; Bachman & Palmer, 1996; Messick, 1996). In particular, Messick (1989, 1996) established the importance of ensuring what kinds of constructs a particular test is able to measure (i.e., construct validity). Most approaches to supporting the construct validity of a test are based on statistical analyses using observed test scores (van Steensel, Oostdam, & van Gelderen, 2013; see also Messick, 1996). However, in the course of a validation study, it is necessary to consider the reliability of test scores evaluated by raters because the data set includes a varying degree of measurement errors that may vitiate the extrapolations obtained from any statistical analyses. This reliability is one of the aspects of test validity (Messick, 1996). After designing task-based reading test formats, which are intrinsically of high construct validity, via appropriate steps of test development (Robinson & Ross, 1996), the next issue can be to ensure the reliability of measurements. Although test score variation should ideally only occur as an artifact of test-takers’ differing abilities and task demands, in reality scores are often affected by
- 95 -
other factors including test procedures, personal attributes other than language abilities, and other random factors (Bachman, 1990). One approach towards elucidating the sources has been generalizability theory, which can be used to find the relative effects of the different factors potentially introducing measurement error in observed test scores (Shavelson & Webb, 1991). Given the traits of task-based performance tests, possible sources of test score variation are (a) test-takers’ ability, (b) rater differences, and (c) task difficulty (Bachman, 2002; Brown et al., 2002; Ellis, 2003). A generalizability theory study has two stages: (a) a generalizability study (G-study), in which we obtain estimates of the relative sizes of the different variance components, and (b) a decision study (D-study), in which a simulation determines what test conditions are appropriate to satisfy a particular criterion of reliability coefficients (G coefficient; Bachman, 1990). For example, in the task-based performance test, the object of measurement is a participant’s ability, and the possible sources of measurement of error will be rater × task difficulty. In this case, the G-study deals with a two-facet fully crossed design, and explores the different portions of the different variance components in the test score. The main purpose of the following D-study is to specify how many raters and tasks are necessary for high reliability and to use this information to improve the assessment (e.g., Bachman, 1990; Shavelson & Webb, 1991). Regarding the scoring of task performance, Brown et al. (2002) developed two types of Likert-type rating criteria: task-dependent (T-D) and independent (T-I) rating scales. According to Hudson (2005), the T-D rating scale reflects the real-world criterion elements necessary to complete that task; therefore, it has separate rating scales designed specifically for each task. Whereas the T-D rating scale can describe test-takers’ language use ability, the T-I rating scale is designed to reflect “raters’ [common] evaluation as to how the examinee performed across all of the tasks during the course of the test was developed” (Hudson, 2005, p. 220). However, it is possible that the use of different rating scales for different tasks vitiates the reliability and generalizability of test results (Ellis, 2003). The first goal of this study, therefore, is to test the reliability of observed test scores from the developed task-based reading test as the first step of a validation study. The second goal is to reveal the characteristics of tasks, raters, and rating scales that affect the test reliability, and propose proper rating scales for the assessment of reading performance. The research questions (RQs) are summarized as follows: RQ1: How do the T-D and T-I rating scales differ in terms of estimating test-takers’
reading performances and inter-rater rating consistency? RQ2: How do Participant, Task, and Rater factors affect the observed test scores in the
T-D and T-I rating scales? RQ3: How many tasks and raters are necessary to make scoring reliable in the T-D and
- 96 -
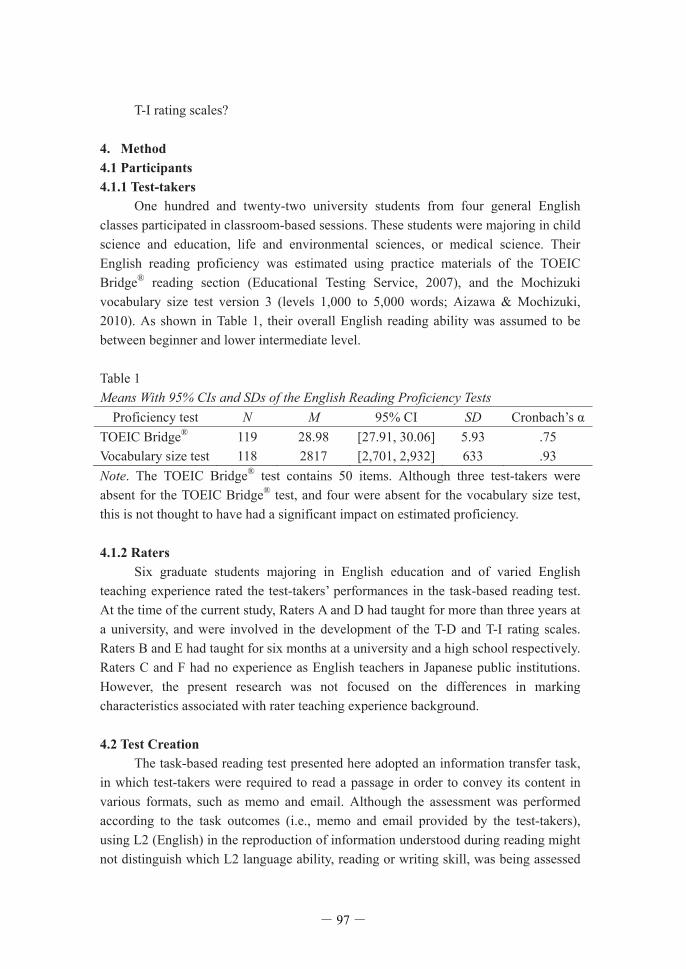
T-I rating scales? 4. Method 4.1 Participants 4.1.1 Test-takers One hundred and twenty-two university students from four general English classes participated in classroom-based sessions. These students were majoring in child science and education, life and environmental sciences, or medical science. Their English reading proficiency was estimated using practice materials of the TOEIC Bridge® reading section (Educational Testing Service, 2007), and the Mochizuki vocabulary size test version 3 (levels 1,000 to 5,000 words; Aizawa & Mochizuki, 2010). As shown in Table 1, their overall English reading ability was assumed to be between beginner and lower intermediate level. Table 1 Means With 95% CIs and SDs of the English Reading Proficiency Tests
Proficiency test N M 95% CI SD TOEIC Bridge® 119 28.98 [27.91, 30.06] 5.93 .75 Vocabulary size test 118 2817 [2,701, 2,932] 633 .93 Note. The TOEIC Bridge® test contains 50 items. Although three test-takers were absent for the TOEIC Bridge® test, and four were absent for the vocabulary size test, this is not thought to have had a significant impact on estimated proficiency. 4.1.2 Raters Six graduate students majoring in English education and of varied English teaching experience rated the test-takers’ performances in the task-based reading test. At the time of the current study, Raters A and D had taught for more than three years at a university, and were involved in the development of the T-D and T-I rating scales. Raters B and E had taught for six months at a university and a high school respectively. Raters C and F had no experience as English teachers in Japanese public institutions. However, the present research was not focused on the differences in marking characteristics associated with rater teaching experience background. 4.2 Test Creation The task-based reading test presented here adopted an information transfer task, in which test-takers were required to read a passage in order to convey its content in various formats, such as memo and email. Although the assessment was performed according to the task outcomes (i.e., memo and email provided by the test-takers), using L2 (English) in the reproduction of information understood during reading might not distinguish which L2 language ability, reading or writing skill, was being assessed
- 97 -
(Jenkins, Johnson, & Hileman, 2004; Koda, 2005; Trites & McGroarty, 2005). Due to the relatively low L2 proficiency of the test-takers in this study, they were asked to write the memos and emails in their first language (L1: Japanese). The information transfer tasks were created based on the task-based test creation procedures proposed by Robinson and Ross (1996, p. 471). Candidate texts for use in the task-based reading test were selected from the IELTS, TOEIC®, TOEIC Bridge®, and Eiken official materials. Of the 151 texts assembled, six items were sourced from the academic reading module and 11 from the general reading module of the IELTS, 46 items were chosen from the TOEIC® test, 16 items from the TOEIC Bridge® test, and 72 items from the Eiken Grades 1 to 4 tests. 4.2.1 Step 1: Analyzing task contents The authors identified and defined the target language use domain required in the assembled reading tests via task and needs analyses. We excluded reading materials based on the following three criteria: (a) A task-based reading goal would be difficult to convey, (b) The reading purpose might not reflect language use in the real world, and (c) The reading materials and task contents might not suit the beginner-level Japanese learners of English as a foreign language (EFL) in this study. Seven of the authors discussed if each of the materials satisfied these criteria and excluded the materials for which no agreement was reached. Thus, all the materials written in English for academic purposes were removed. After the first step, 45 reading material items remained, the text genres of which were memo, email, bulletin board, and leaflet, all taken from either TOEIC® or TOEIC Bridge® tests. 4.2.2 Step 2: Drafting directions The draft of task instructions was developed across 45 reading materials based on the “Real-Life format” used in the listening section (part 3) of the Eiken Grade 1 test. As shown in Appendix A, we set task situations (i.e., what is the present situation of test-takers) and task goals (i.e., what test-takers have to do to complete each task) in Japanese. Thus, the task instructions included the following three elements: (a) present situation and condition of test-takers, (b) task goals, and (c) specific directions for the information transfer task (e.g., “Please write an email to convey the contents including information that seems necessary in proper quantities”). In the course of the second step, we selected six test items from 45 text and instruction pairs through discussion because they were the most preferable in reflecting real-life language experiences. 4.2.3 Step 3: Simplifying test scripts The six reading materials were simplified for the beginner-level L2 learners. Based on the JACET list of 8000 basic words (the Japan Association of College English Teachers [JACET], 2003), low frequency words (3,000-word level and over)
- 98 -
were substituted for easier synonyms. We confirmed whether the six tasks were performed as intended by conducting a pilot study with two Japanese undergraduates (neither of whom participated in the main sessions). When both participants reported difficulty completing the tasks due to unclear task directions, we modified the instructions and reading materials as necessary. Finally, the reading materials were proofread by a native speaker of English to ensure they still reflected natural English use in real-world equivalents of these tasks.
Of the six tasks developed, Tasks 1, 3, and 5 were from TOEIC Bridge® (TOEIC-Bridge®-based tasks) and Tasks 2, 4, and 6 were from TOEIC® (TOEIC®-based tasks). The task situations and goals were as follows: In everyday situations, test-takers read a passage such as a notice or email to communicate it to friends in a memo or email format (Tasks 1 and 2).
In work and business settings, test-takers read a passage such as a bulletin board or email to convey it to their colleagues in a memo or email format (Tasks 3 and 4).
In everyday situations, test-takers use passage information to make invitations or requests to their friends in an email format (Tasks 5 and 6).
Table 2 summarizes the characteristics of the reading materials and tasks. In order to make the tasks as authentic as possible, the answer sheets were made to resemble real memos and emails (see Appendix B). The test-takers were asked to use the information in the reading passages to fill out the answer sheets using the format provided. Table 2 Text Length, Readability Indices, and Characteristics of Each Task Task Words FKGL FRE Text type Output format
Task 1 94 6.9 72.7 Attention to building closure Memo to friends Task 2 200 7.5 62.3 Travel schedule Email to friends Task 3 73 6.5 76.9 Notice of parking area closure Email to a colleague Task 4 145 9.9 62.3 Email about work shifts Memo to colleagues Task 5 71 8.9 56.0 Invitation to dinner party Email to a friend Task 6 177 7.8 69.5 Attention to art show Email to a friend Note. FKGL = Flesch-Kincaid Grade Level, FRE = Flesch Reading Ease (calculated in Microsoft Word 2013). 4.3 Procedure
Six tasks were divided into three 90-minute sessions (in four classes), with two tasks conducted in each session. The tasks were conducted as part of regular lesson activities; the use of data was thoroughly explained and informed consent was obtained from the test-takers. They were not told that the tasks were a kind of test.
- 99 -
In each session, answer sheet booklets were first distributed, then question content was confirmed as a group, and the aim of the task was explained (e.g., While you read the notice, you need to create an email in Japanese to tell your friend its content). They were allowed to refer to the texts while performing the tasks. After finishing each task, the students evaluated their task performance and passage understanding, first in pairs and then with an experimenter. In order to familiarize the test-takers with the general task contents and procedure, they engaged in a similar practice task in the class before the first session. The time required for all students to complete each task averaged 15 minutes for TOEIC-Bridge®-based tasks and 25 minutes for TOEIC®-based tasks. Task presentation order was counterbalanced across the four classes to avoid practice effects on the performance data. 4.4 Scoring We developed T-D and T-I rating scales for the assessment of the test-takers’ reading performances (see Appendices C and D). The rating scales included five performance levels (1: Inadequate, 2: Semi-Adequate, 3: Able, 4: Semi-Adept, and 5: Adept), based on Brown et al. (2002), Ellis (2003), and Hudson (2005). Because Brown et al. (2002) designed a prototype framework for performance assessment using real-world tasks, we followed their method to develop rating scales for reading performances. Specifically, Raters A and D, who were familiar with the six tasks (they mainly developed these tasks), produced drafts of what insufficient, minimally sufficient, and proficient task performances would look like. They then evaluated the test-takers’ performances using the drafts before the other raters started their ratings. Finally, they jointly revised the drafts based on agreed upon scoring rubrics for each task. The T-D rating scale was designed to satisfy the following criteria (Brown et al., 2002; Hudson, 2005): (a) Task accomplishment is a focus for the performance assessment and (b) authentic elements required to accomplish each task, and (c) corresponding levels of task success are pre-determined. Thus, each scale rubric in the T-D (and T-I) rating scale was designed to reflect the levels of task accomplishment. For example, Scales 1 and 2 indicate that test-takers were unable to achieve the communication goals required by the tasks, whereas Scales 3 to 5 indicate that they were able to do so. In addition, the levels of task accomplishment were evaluated by authentic elements (Hudson, 2005). Similar procedures were conducted to develop the T-I rating scale. We considered that (a) the T-I rating scale reflects raters’ evaluation as to how the test-takers performed across all of the tasks during the course of the test; and (b) the T-I descriptor refers the rater to the test-takers’ performance across the tasks and thus to a more global concept of language ability in context (Hudson, 2005). In other words, the T-I rating scale included common descriptors of levels of task success across the
- 100 -
six tasks. The six raters, referred to as Raters A to F, individually scored the test-takers’ reading performance across the six tasks. Although the raters became familiar with the tasks and score rubrics prior to scoring, they were not involved in any rater training such as practice rating or norming exercises. Raters A, B, and C used the T-D rating scale and Raters D, E, and F used the T-I rating scale for the performance assessment; that is, each task performance was scored by three raters using either the T-D or T-I rating scale. Raters reported that the scoring of reading performances required from 1 to 5 minutes per test-taker in each task. 4.5 Data Analysis Regarding RQ1, the differences in estimating test-takers’ reading performance were examined by an analysis of variance (ANOVA) and F test. The ANOVA focused on whether or not the mean observed test scores were invariant between the rating scales. Similarly, the F test determined whether the variability of the rated scores was homogeneous (Shimizu, 2009). Although this study only interpreted results with p values of less than .05, some statistical estimations used effect sizes due to a relatively large sample size (for review, see Mizumoto & Takeuchi, 2008). In terms of inter-rater reliability, first, this study reported Cronbach’ in each task between the two rating scales because three raters scored the test-takers’ reading performances per task. Then, to reveal how individual inconsistencies affected inter-rater reliability, th coefficients were calculated by eliminating each rater per task. The results were qualitatively discussed in terms of the rating approach differences based on discussion among the six raters. RQs 2 and 3 corresponded to the results of the G- and D-studies, respectively. In the G-study, the present study set two facets of Task and Rater, and the object of measurement was Participant (i.e., fully crossed design with two facets; Shavelson & Webb, 1991; Shimizu, 2009). To reveal the rating differences between the two rating scales, we examined the estimated variances of each component by comparing them and interpreted the outcomes based on Table 3. In the D-study, the change in G coefficients was simulated using the estimated variances when the numbers of tasks and raters differed. The formula for evaluating G coefficients was for the fully crossed design with two facets provided by Shavelson and Webb (1991) as follows: G =
2p/ 2
p 2pt/nt + 2
pr/nr + 2ptr/ntnr).
- 101 -
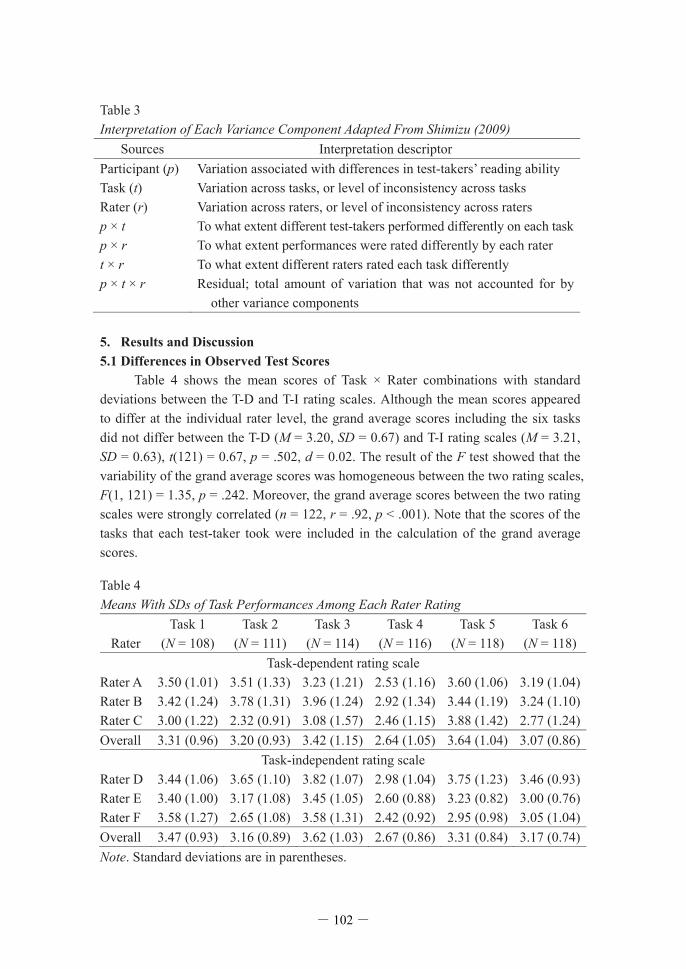
Table 3 Interpretation of Each Variance Component Adapted From Shimizu (2009)
Sources Interpretation descriptor Participant (p) Variation associated with differences in test-takers’ reading ability Task (t) Variation across tasks, or level of inconsistency across tasks Rater (r) Variation across raters, or level of inconsistency across raters p × t To what extent different test-takers performed differently on each task p × r To what extent performances were rated differently by each rater t × r To what extent different raters rated each task differently p × t × r Residual; total amount of variation that was not accounted for by
other variance components 5. Results and Discussion 5.1 Differences in Observed Test Scores Table 4 shows the mean scores of Task × Rater combinations with standard deviations between the T-D and T-I rating scales. Although the mean scores appeared to differ at the individual rater level, the grand average scores including the six tasks did not differ between the T-D (M = 3.20, SD = 0.67) and T-I rating scales (M = 3.21, SD = 0.63), t(121) = 0.67, p = .502, d = 0.02. The result of the F test showed that the variability of the grand average scores was homogeneous between the two rating scales, F(1, 121) = 1.35, p = .242. Moreover, the grand average scores between the two rating scales were strongly correlated (n = 122, r = .92, p < .001). Note that the scores of the tasks that each test-taker took were included in the calculation of the grand average scores. Table 4 Means With SDs of Task Performances Among Each Rater Rating
Rater Task 1
(N = 108) Task 2
(N = 111) Task 3
(N = 114) Task 4
(N = 116) Task 5
(N = 118) Task 6
(N = 118) Task-dependent rating scale
Rater A 3.50 (1.01) 3.51 (1.33) 3.23 (1.21) 2.53 (1.16) 3.60 (1.06) 3.19 (1.04) Rater B 3.42 (1.24) 3.78 (1.31) 3.96 (1.24) 2.92 (1.34) 3.44 (1.19) 3.24 (1.10) Rater C 3.00 (1.22) 2.32 (0.91) 3.08 (1.57) 2.46 (1.15) 3.88 (1.42) 2.77 (1.24) Overall 3.31 (0.96) 3.20 (0.93) 3.42 (1.15) 2.64 (1.05) 3.64 (1.04) 3.07 (0.86)
Task-independent rating scale Rater D 3.44 (1.06) 3.65 (1.10) 3.82 (1.07) 2.98 (1.04) 3.75 (1.23) 3.46 (0.93) Rater E 3.40 (1.00) 3.17 (1.08) 3.45 (1.05) 2.60 (0.88) 3.23 (0.82) 3.00 (0.76) Rater F 3.58 (1.27) 2.65 (1.08) 3.58 (1.31) 2.42 (0.92) 2.95 (0.98) 3.05 (1.04) Overall 3.47 (0.93) 3.16 (0.89) 3.62 (1.03) 2.67 (0.86) 3.31 (0.84) 3.17 (0.74) Note. Standard deviations are in parentheses.
- 102 -

Table 5 Mean Differences, Correlations, and Homogeneity of Variances of the Test Scores Between the T-D and T-I Rating Scales Mean difference Correlation F test
Task N p d r p df F p Task 1 108 .008 0.17 .77 < .001 1, 107 1.38 .374 Task 2 111 .406 0.04 .78 < .001 1, 110 1.37 .317 Task 3 114 .001 0.18 .85 < .001 1, 113 1.36 .134 Task 4 116 .518 0.03 .87 < .001 1, 115 1.36 .017 Task 5 118 < .001 0.35 .78 < .001 1, 117 1.36 .009 Task 6 118 .100 0.13 .65 < .001 1, 117 1.36 .057 Overall 122 .502 0.02 .92 < .001 1, 121 1.35 .242 The results of the 2 (Scale) × 6 (Task) ANOVA showed a significant interaction, F(5, 495) = 7.36, p p
2 = .07. Post hoc analysis results are presented in Table 5. Although statistical score differences were found in Tasks 1, 3, and 5, the effect sizes were null to small (range d = 0.17–0.35). Because a low p value is associated with a large sample size (Mizumoto & Takeuchi, 2008), the current findings suggest that there were essentially negligible differences in the mean scores for each task between the two types of rating scale in the same way as in the grand average scores. The correlations of each task score between the rating scales were strong except for Task 6. Finally, although the score variability of Tasks 4 and 5 was not homogeneous (the T-D rating scale produced more variances in those scores), the differences in the score variability between the rating scales might be relatively small. These findings suggest that both the T-D and T-I rating scales can be used alternatively (a partial answer to RQ1). However, it is possible that the practicality of each of the rating approaches could have affected the reliability of the observed scores quantitatively and qualitatively. This point will be discussed further in the next section. 5.2 Inter-Rater Reliability Table 6 presents the inter-rater reliability (Cronbach’ ) difference according to Task × Scale. Whereas the ll tasks cleared .70 in the T-I rating scale, they fell below the criterion in Tasks 2 and 6 when using the T-D rating scale. At this point, the disparity may be attributable to (a) the differences in the two rating scales and (b) the rating approaches taken by each rater. Accordingly, we examined the change in detracted from the inter-rater reliability (see Table 6 again).
- 103 -
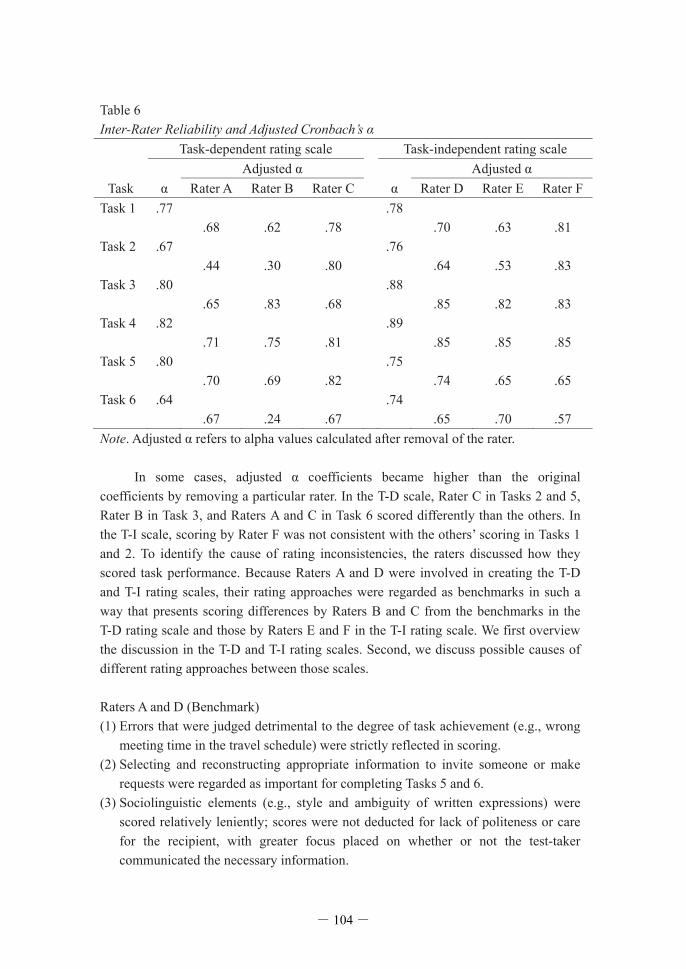
Table 6 Inter-Rater Reliability and Adjusted Cronbach’ Task-dependent rating scale Task-independent rating scale Adjusted Adjusted
Task Rater A Rater B Rater C Rater D Rater E Rater F Task 1 .77 .78 .68 .62 .78 .70 .63 .81 Task 2 .67 .76 .44 .30 .80 .64 .53 .83 Task 3 .80 .88 .65 .83 .68 .85 .82 .83 Task 4 .82 .89 .71 .75 .81 .85 .85 .85 Task 5 .80 .75 .70 .69 .82 .74 .65 .65 Task 6 .64 .74 .67 .24 .67 .65 .70 .57 Note. Adjusted In some cases, adjusted coefficients became higher than the original coefficients by removing a particular rater. In the T-D scale, Rater C in Tasks 2 and 5, Rater B in Task 3, and Raters A and C in Task 6 scored differently than the others. In the T-I scale, scoring by Rater F was not consistent with the others’ scoring in Tasks 1 and 2. To identify the cause of rating inconsistencies, the raters discussed how they scored task performance. Because Raters A and D were involved in creating the T-D and T-I rating scales, their rating approaches were regarded as benchmarks in such a way that presents scoring differences by Raters B and C from the benchmarks in the T-D rating scale and those by Raters E and F in the T-I rating scale. We first overview the discussion in the T-D and T-I rating scales. Second, we discuss possible causes of different rating approaches between those scales. Raters A and D (Benchmark) (1) Errors that were judged detrimental to the degree of task achievement (e.g., wrong
meeting time in the travel schedule) were strictly reflected in scoring. (2) Selecting and reconstructing appropriate information to invite someone or make
requests were regarded as important for completing Tasks 5 and 6. (3) Sociolinguistic elements (e.g., style and ambiguity of written expressions) were
scored relatively leniently; scores were not deducted for lack of politeness or care for the recipient, with greater focus placed on whether or not the test-taker communicated the necessary information.
- 104 -
Rater B. Unlike Benchmark (1), Rater B rated task performance including time- or place-related errors at the Able level even though it would cause some miscommunication with recipients.
For task performances that failed to meet the Able criteria, a performance meeting half or more of those criteria was scored as Semi-adequate, and one meeting less than half of the criteria as inadequate.
In contrast to Benchmark (2), the inclusion of additional information that would possibly help communicate passage information to recipients was scored more positively, rather than the selection and reconstruction of relevant information.
Rater C. For detailed information, Rater C evaluated more strictly than Benchmark (1) depending on the task features, which might cause some rating inconsistencies in Task 2. The purpose of Task 2 was to convey a 3-day travel schedule according to a great deal of detailed information. As Rater C considered that task performance should include all the detailed information with complete accuracy, any lacks or errors in that information were judged as lower achievement.
In contrast to Benchmark (2), in Task 5, Rater C did not consider selection or reconstruction of information. Rather, he tended to assign the Adept level when any additional information that allowed the test-taker to achieve the tasks more efficiently was produced, which was similar to Rater B.
Rater E. In contrast to Benchmark (1), Rater E tended to score detailed information leniently. Even when part of the information was absent or incorrect, the performance was evaluated as Able or higher as long as most of the necessary information for the task goal had been reproduced.
Following Benchmark (2), he hardly considered sociolinguistic aspects and gave the Adept rating when the test-taker successfully restructured relevant information in the form of tables or figures.
Rater F. Regarding Benchmark (1), Rater F showed particularly strict scoring for detailed information. That is, he required test-takers to provide necessary and sufficient details in a precise manner to achieve the Able level. For example,
- 105 -
in Tasks 1 and 2, answers with only a local error were rated at Inadequate or Semi-adequate levels.
Regarding Benchmarks (2) and (3), Rater F used these to distinguish whether or not the task performance exceeded the Able level. Specifically, he gave a Semi-adept rating to sociolinguistically appropriate answers, in addition to including necessary and sufficiently detailed information. Moreover, he scored as Adept level those answers where the test-taker managed to select and rearrange relevant information in a concise manner.
According to the above raters’ reports, some raters scored differently from the
benchmarks in the following three points: (a) to what extent detailed information was scored either strictly or leniently according to the Able descriptor, (b) how much test-takers’ selection and reconstruction of passage information was reflected in scoring, and (c) whether or not the manner of conveying passage information and sociolinguistic elements was considered. These are related to RQ1 regarding the possible differences in rating approaches between the rating scales. Regarding information accuracy at the Able level, the raters using both T-D and T-I rating scales exhibited either stricter or more lenient scoring than Benchmark (1), in accordance with the task features. Specifically, although the raters were given specific scoring criteria in the T-D rating scale, they tended to set their own evaluation criteria for more detailed scoring. Thus, different raters placed high value on different criteria at the Able and Adept levels. This may have led to the inter-rater inconsistency in the T-D rating scale.
Scoring for the selection and reconstruction of information and sociolinguistic aspects also differed between the T-D and T-I rating scales. These perspectives were more likely to matter for the T-I rating scale than the T-D rating scale. A possible explanation for this is that the specific scoring criteria of the T-D rating scale oriented raters to what information was produced rather than how it was transferred. In contrast, the raters using the T-I rating scale were more likely to pay attention to formal aspects of the answers in addition to their content because the T-I scale does not give specific scoring criteria. These different rating approaches, possibly caused by the types of rating scales, were not assumed in Brown et al. (2002) and Hudson (2005); therefore, discussion of disagreement resolution and rater training are necessary to obtain a strict rating consensus (e.g., Ellis, 2003). 5.3 G-Study: Estimating Variance Components Although the examination of inter-rater reliability suggested that some rating inconsistencies were elicited by the differences in rating approaches, the source of measurement error is not confined to rater characteristics. To answer RQ2, the results of the G-study focused on the rater and task characteristics with a comparison between
- 106 -
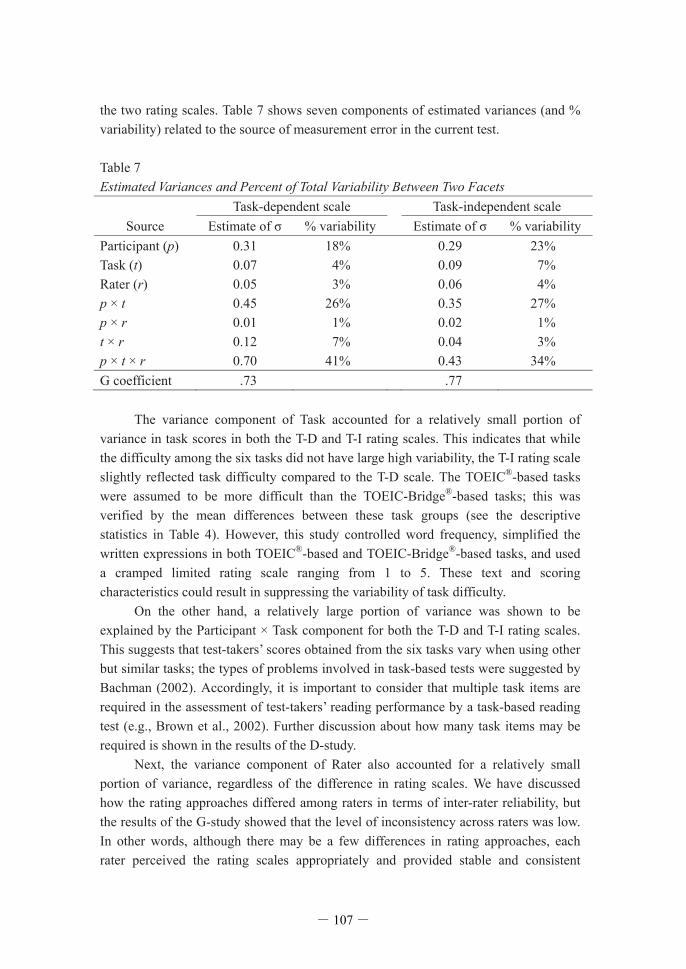
the two rating scales. Table 7 shows seven components of estimated variances (and % variability) related to the source of measurement error in the current test. Table 7 Estimated Variances and Percent of Total Variability Between Two Facets Task-dependent scale Task-independent scale
Source Estimate of % variability Estimate of % variability Participant (p) 0.31 18% 0.29 23% Task (t) 0.07 4% 0.09 7% Rater (r) 0.05 3% 0.06 4% p × t 0.45 26% 0.35 27% p × r 0.01 1% 0.02 1% t × r 0.12 7% 0.04 3% p × t × r 0.70 41% 0.43 34% G coefficient .73 .77 The variance component of Task accounted for a relatively small portion of variance in task scores in both the T-D and T-I rating scales. This indicates that while the difficulty among the six tasks did not have large high variability, the T-I rating scale slightly reflected task difficulty compared to the T-D scale. The TOEIC®-based tasks were assumed to be more difficult than the TOEIC-Bridge®-based tasks; this was verified by the mean differences between these task groups (see the descriptive statistics in Table 4). However, this study controlled word frequency, simplified the written expressions in both TOEIC®-based and TOEIC-Bridge®-based tasks, and used a cramped limited rating scale ranging from 1 to 5. These text and scoring characteristics could result in suppressing the variability of task difficulty.
On the other hand, a relatively large portion of variance was shown to be explained by the Participant × Task component for both the T-D and T-I rating scales. This suggests that test-takers’ scores obtained from the six tasks vary when using other but similar tasks; the types of problems involved in task-based tests were suggested by Bachman (2002). Accordingly, it is important to consider that multiple task items are required in the assessment of test-takers’ reading performance by a task-based reading test (e.g., Brown et al., 2002). Further discussion about how many task items may be required is shown in the results of the D-study. Next, the variance component of Rater also accounted for a relatively small portion of variance, regardless of the difference in rating scales. We have discussed how the rating approaches differed among raters in terms of inter-rater reliability, but the results of the G-study showed that the level of inconsistency across raters was low. In other words, although there may be a few differences in rating approaches, each rater perceived the rating scales appropriately and provided stable and consistent
- 107 -
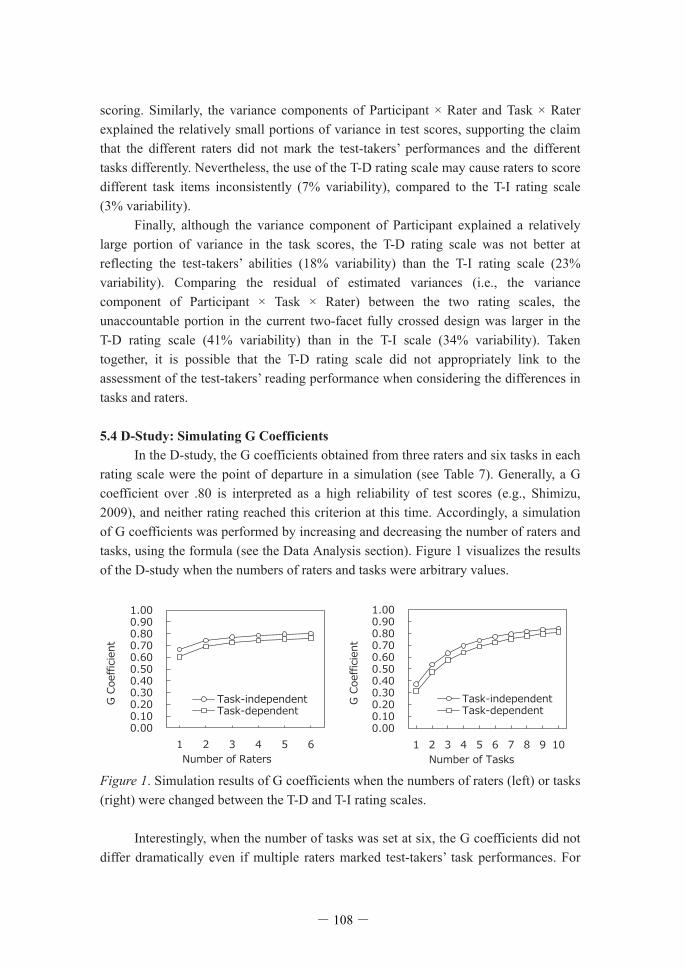
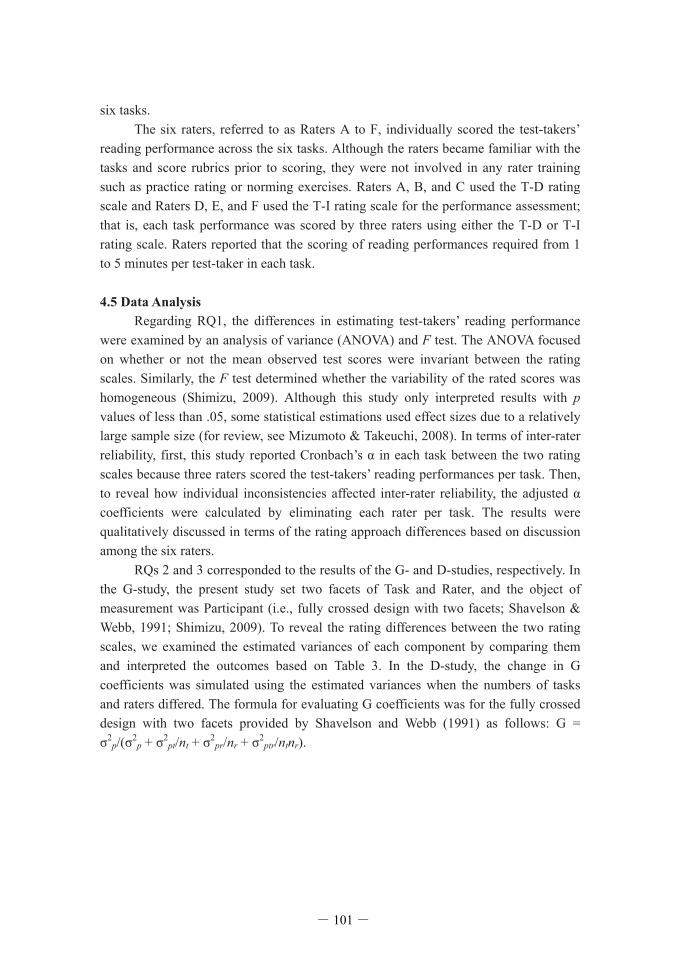
scoring. Similarly, the variance components of Participant × Rater and Task × Rater explained the relatively small portions of variance in test scores, supporting the claim that the different raters did not mark the test-takers’ performances and the different tasks differently. Nevertheless, the use of the T-D rating scale may cause raters to score different task items inconsistently (7% variability), compared to the T-I rating scale (3% variability). Finally, although the variance component of Participant explained a relatively large portion of variance in the task scores, the T-D rating scale was not better at reflecting the test-takers’ abilities (18% variability) than the T-I rating scale (23% variability). Comparing the residual of estimated variances (i.e., the variance component of Participant × Task × Rater) between the two rating scales, the unaccountable portion in the current two-facet fully crossed design was larger in the T-D rating scale (41% variability) than in the T-I scale (34% variability). Taken together, it is possible that the T-D rating scale did not appropriately link to the assessment of the test-takers’ reading performance when considering the differences in tasks and raters. 5.4 D-Study: Simulating G Coefficients In the D-study, the G coefficients obtained from three raters and six tasks in each rating scale were the point of departure in a simulation (see Table 7). Generally, a G coefficient over .80 is interpreted as a high reliability of test scores (e.g., Shimizu, 2009), and neither rating reached this criterion at this time. Accordingly, a simulation of G coefficients was performed by increasing and decreasing the number of raters and tasks, using the formula (see the Data Analysis section). Figure 1 visualizes the results of the D-study when the numbers of raters and tasks were arbitrary values.
Figure 1. Simulation results of G coefficients when the numbers of raters (left) or tasks (right) were changed between the T-D and T-I rating scales. Interestingly, when the number of tasks was set at six, the G coefficients did not differ dramatically even if multiple raters marked test-takers’ task performances. For
- 108 -
example, the G coefficients of .60 in the T-D rating scale, and .67 in the T-I rating scale, were obtained in the case that a single rater would score. The D-study also showed that six raters were required to clear the G coefficient of .80 when using the T-I rating scale. However, the necessary number of raters in the T-D rating scale was 25. In contrast, the number of tasks greatly affected the G coefficients. When three raters were in the assessment, seven tasks were necessary to reach the G coefficient of .80 in the T-I rating scale, while nine tasks were necessary in the T-D rating scale. Moreover, when the number of tasks decreased to two or three, the G coefficient was below .60. These findings indicate that the designing of tasks appropriate for assessing language use ability is a critical problem, especially when implementing language performance tests (Bachman, 2002; Brown et al., 2002; Ellis, 2003; McNamara, 1996; van Steensel et al., 2013). In this study, there was no great difference in G coefficients between the two rating scales; however, given that it may not be workable for educators to prepare the T-D rating scale every time they implement a task-based reading performance test, the use of the T-I rating scale may be better suited to assessing test-takers’ performances. 6. Conclusions As the first step in developing and validating task-based reading tests, this study examined the reliability of performance assessment using generalizability theory. Both the T-D and T-I rating scales can be used alternatively with a certain degree of reliable assessment; however, the assessment of task-based performance can be influenced by factors such as treatments of local errors associated with detailed passage information, reorganization of passage contents, and sociolinguistic elements in task outcomes, which impaired the inter-rater consistency (RQ1). The results of the G-study showed that the T-I rating scale seemed preferable to the T-D rating scale in terms of reflection of the test-takers’ reading abilities (RQ2). The D-study demonstrated that to achieve highly reliable scoring, assessment of seven tasks by three raters is desirable with the T-I rating scale, while nine tasks are necessary with the T-D rating scale (RQ3).
There are three limitations of this study. First, the effects of rater training on test score reliability should be examined to determine if raters could make a clear distinction between the T-D and T-I rating scales. Second, although the present tasks required test-takers to read L2 texts and convey their contents in their L1 for practical reasons (e.g., Koda, 2005), this cannot fully capture real-life language use (Shizuka, 2002). Considering task authenticity, future research should examine not only L2-to-L1 but also L2-to-L2 task performance. Finally, it is necessary to collect evidence for construct validity related to the current test by extrapolations based on the observed scores (e.g., Messick, 1996). Validation studies should also examine whether test procedures reflect real-life reading activities by collecting on-line data while reading (van Steensel et al., 2013).
The present findings have some pedagogical implications for implementing
- 109 -
task-based reading performance tests. First, the present study revealed the numbers of tasks and raters necessary to obtain reliable test scores. At the same time, this study found some specific points to consider in scoring. For example, making and discussing a list of “sample responses” corresponding to each performance level (e.g., Able and Adept levels) as rater training will reduce scoring discrepancies. This is especially important when employing the T-D rating scale because larger rating-approach differences may arise. When using the T-I rating scale, it is important to determine the extent to which sociolinguistic elements and formal aspects of performances are considered in order to ensure inter-rater rating consistency.
Although one might be concerned that task-based reading performance tests are difficult for beginner-level learners because the tests involve higher-level cognitive processes, the present study showed that the tests are applicable to beginning to lower intermediate learners. It is highly possible that the university students in this study had mature cognitive abilities compared to ordinary junior and senior high school students. However, continuous practice of task-based language activities in regular classes is necessary using appropriate reading materials through the simplification of vocabulary levels and written expressions. If task-based reading assessment is set in the course design, it is expected to bring positive washback effects to learners and teachers themselves (e.g., Colpin & Gysen, 2006; Robinson & Ross, 1996), and enhance the teaching and learning procedures of a foreign language. Teachers and students will have a clear picture of what should be possible through the course. This will contribute to the development of language skills that may be of authentic use in real-life situations. Acknowledgements
This research was conducted by the Tsukuba Reading Research Group and was partly supported by Grant-in-Aid for Challenging Exploratory Research (No. 25580122) from the Japan Society for the Promotion of Science. We would like to thank Yukino Kimura and Shingo Nahatame for their cooperation. References Aizawa, K., & Mochizuki, M. (2010). Eigo goishidou no jissen idea shu: Katsudourei
kara test sakusei made [Practical handbook for English vocabulary teaching]. Tokyo, Japan: Taishukan Shoten.
Alderson, J. C. (2000). Technology in testing: The present and the future. System, 28, 593–603. doi:10.1016/S0346-251X(00)00040-3
Bachman, L. F. (1990). Fundamental considerations in language testing. Oxford University Press.
Bachman, L. F. (2002). Some reflections on task-based language performance assessment. Language Testing, 19, 453–476. doi:10.1191/0265532202lt240oa
- 110 -
Bachman, L. F., & Palmer, A. S. (1996). Language testing in practice: Designing and developing useful language tests. Oxford University Press.
Brown, J. D., Hudson, T., Norris, J., & Bonk, W. J. (2002). An investigation of second language task-based performance assessments. University of Hawai‘i Press.
Colpin, M., & Gysen, S. (2006). Developing and introducing task-based language tests. In K. van den Branden (Ed.), Task-based language education: From theory to practice (pp. 151–174). Cambridge University Press.
Educational Testing Service. (2007). TOEIC Bridge® official guide & question collection. Tokyo, Japan: Institute for International Business Communication.
Ellis, R. (2003). Task-based language learning and teaching. Oxford University Press. Hudson, T. (2005). Trends in assessment scales and criterion-referenced language
assessment. Annual Review of Applied Linguistics, 25, 205–227. doi:10.1017/S0267190505000115
JACET. (2003). JACET list of 8000 basic words. Tokyo, Japan: Author. Jenkins, J. R., Johnson, E., & Hileman, J. (2004). When is reading also writing:
Sources of individual differences on the new reading performance assessments. Scientific Studies of Reading, 8, 125–151. doi:10.1207/s1532799xssr0802_2
Koda, K. (2005). Insights into second language reading: A cross-linguistic approach. Cambridge University Press.
McNamara, T. (1996). Measuring second language performance. London, England: Longman.
Messick, S. (1989). Meaning and values in test validation: The science and ethics of assessment. Educational Researcher, 18, 5–11. doi:10.3102/0013189X018002005
Messick, S. (1996). Validity and washback in language testing. Language Testing, 13, 241–256. doi:10.1177/026553229601300302
Mizumoto, A., & Takeuchi, O. (2008). Basics and considerations for reporting effect sizes in research papers. Studies in English Language Teaching, 31, 57–66. Retrieved from http://www.mizumot.com/files/EffectSize_KELES31.pdf
Robinson, P., & Ross, S. (1996). The development of task-based assessment in English for academic purposes programs. Applied Linguistics, 17, 455–476. doi:10.1093/ applin/17.4.455
Shavelson, R. J., & Webb, N. M. (1991). Generalizability theory: A primer. Thousand Oaks, CA: Sage.
Shimizu, M. (2009). An examination of reliability of an oral reading test for EFL learners using generalizability theory. ARELE: annual review of English language education in Japan, 20, 181–190. Retrieved from http://ci.nii.ac.jp/naid/ 110008512381
Shizuka, T. (2002). Eigo test sakusei no tatsujin manual [Expert manual of English test creation]. Tokyo, Japan: Taishukan Shoten.
Skehan, P. (1998). A cognitive approach to language learning. Oxford University
- 111 -

Press. Trites, L., & McGroarty, M. (2005). Reading to learn and reading to integrate: New
tasks for reading comprehension tests? Language Testing, 22, 174–210. doi:10.1191/0265532205lt299oa
Ushiro, Y. (Ed.). (2012). Eigo reading test no kangaekata to tsukurikata [The philosophy and practice of English reading tests]. Tokyo, Japan: Kenkyusha.
van Steensel, R., Oostdam, R., & van Gelderen, A. (2013). Assessing reading comprehension in adolescent low achievers: Subskills identification and task specificity. Language Testing, 30, 3–21. doi:10.1177/0265532212440950
Appendices Appendix A: A Sample Test (Task 3) of a Task-Based Reading Test Used in This Study
NOTICE
Dear Teaching Staff: Starting on Monday or Tuesday, December 1 or 2, the teacher parking area will be closed for repair. Please park on the street in front of the main office or in the guest parking area at the side of the school. This work will be finished on Thursday, and you can use the teacher parking area again from Friday. Thank you for your understanding. James Crown School Buildings Manager
- 112 -

Appendix B: A Sample Answer Sheet (Task 3)
You <[email protected]> Iwata Minoru <[email protected]> 2014 11 28
Appendix C: A Sample of Task-Dependent Rating Scale (Task 3)
- 113 -
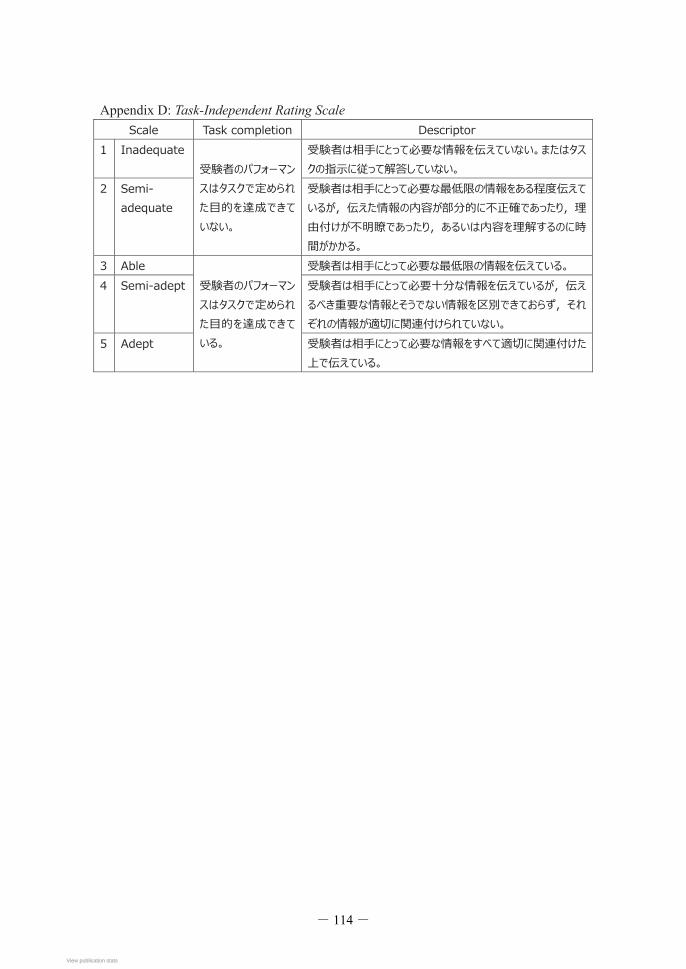
Appendix D: Task-Independent Rating Scale
- 114 -
View publication statsView publication stats