Embed Size (px)
Citation preview
Application of Generalizability Theory to Concept-Map Assessment Research
CSE Report 640
Yue Yin and Richard J. ShavelsonStanford University
November 2004
Center for the Study of Evaluation (CSE)National Center for Research on Evaluation,
Standards, and Student Testing (CRESST)Graduate School of Education & Information Studies
University of California, Los AngelesLos Angeles, CA 90095-1522
(310) 206-1532
2
Project 2.2: Classroom and Teachers� Assessment. Strand 2: Curriculum Embedded AssessmentsRichard Shavelson, Project Director, StanfordUniversity.
Copyright © 2004 The Regents of the University of California
The work reported herein was supported under the Educational Research and DevelopmentCenters Program, PR/Award Number R305B960002, as administered by the Institute ofEducation Sciences (IES), U.S. Department of Education.
The findings and opinions expressed in this report do not reflect the positions or policies of theNational Center for Education Research, the Institute of Education Sciences, or the U.S.Department of Education.
3
APPLICATION OF GENERALIZABILITY THEORY TO CONCEPT-MAP
ASSESSMENT RESEARCH
Abstract
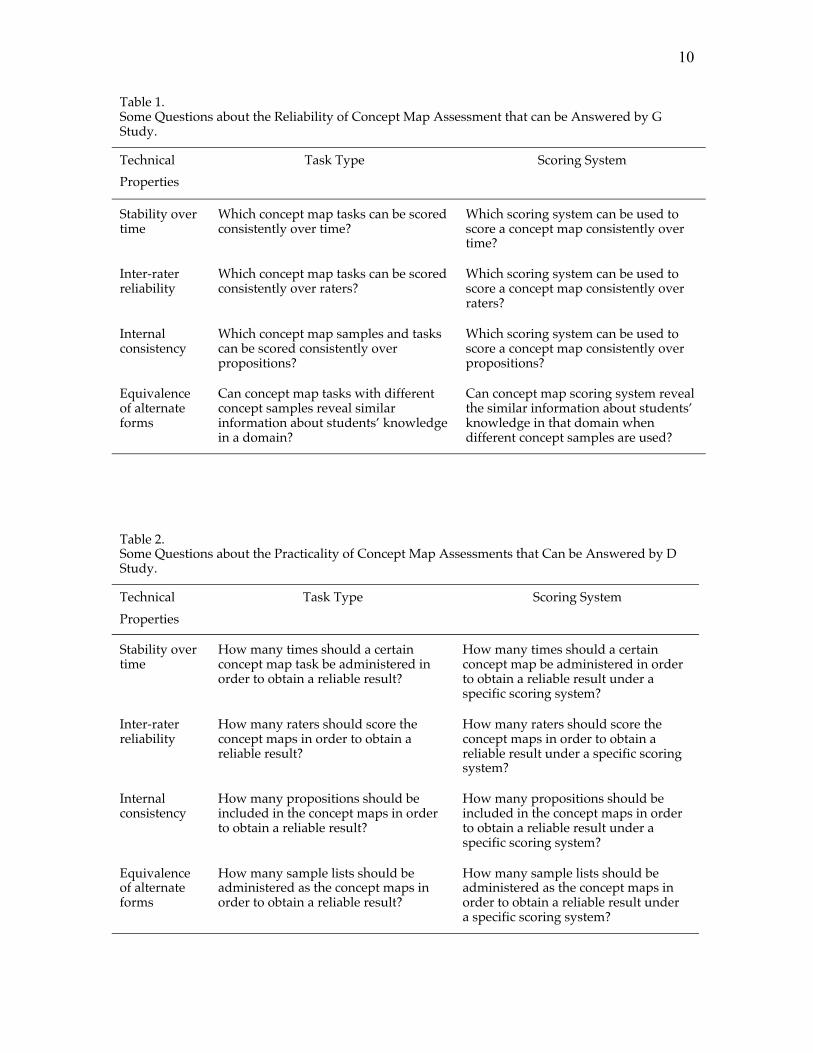
In the first part of this paper we discuss the feasibility of using Generalizability (G)
Theory (see Footnote 1) to examine the dependability of concept map assessmentsand to design a concept map assessment for a particular practical application. In the
second part, we apply G theory to compare the technical qualities of two frequentlyused mapping techniques: construct-a-map with created linking phrases (C) and
construct-a-map with selected linking phrases (S). We explore some measurementfacets that influence concept-map scores and estimate how to optimize different
concept mapping techniques by varying the conditions for different facets. We foundthat C and S were not technically equivalent. The G coefficients for S were larger than
those for C. Furthermore, a D study showed that fewer items (propositions) wouldbe needed for S than C to reach desired level of G coefficients if only one occasion
could be afforded. Therefore, S might be a better candidate than C in the large-scalesummative assessment, while C would be preferred as a formative assessment in
classroom.
Assessment of learning is typically narrowly defined as multiple-choice andshort-answer tests; achievement is typically what multiple-choice tests measure.There is more to achievement than this, and a definition of achievement mightwell consider the structure of a student�s knowledge, not just the quantity. Tothis end, concept maps provide one possible approach. Once this approach istaken, often the technical quality of the concept-map assessment is assumed; it isnot clear just how to evaluate reliability, for example. In this paper, we present aGeneralizability Theory framework (Cronbach, Gleser, Nanda, & Rajaratnam,1972) for examining the dependability of concept-map assessments anddemonstrate its application.
Concept Maps
A concept map is a network that includes nodes (terms or concepts), linking
lines (usually with a uni-directional arrow from one concept to another), andlinking phrases which describe the relationship between nodes. Linking lines withlinking phrases are called labeled lines. Two nodes connected with a labeled lineare called a proposition. Moreover, concept arrangement and linking line
4
orientation determine the structure of the map (e.g., hierarchical or non-hierarchical).
Concept maps were originally proposed to be used as an instructional tool(e.g., Novak & Gowin, 1984) and later as an assessment as well (Ruiz-Primo &Shavelson, 1996). Concept maps hold promise in tapping students� declarativeknowledge structures which traditional assessments are not good at. This featureof concept maps attracted assessment researchers� attention. Ruiz-Primo andShavelson (1996) characterized the variation among concept-map assessments ina framework with three dimensions: a task that invites students to provideevidence for their knowledge structure in a content domain, a response form thatstudents use to do the task, and a scoring system that the raters can use to evaluatestudents� responses (Appendix 1). To get a comprehensive review of thevariations, readers can refer to the paper written by Ruiz-Primo and Shavelson(1996).
Even though thousands of concept-map assessment permutations arepossible, not all alternatives are suited for assessment (Ruiz-Primo & Shavelson,1996). Ruiz-Primo and Shavelson pointed out that reliability and validityinformation about different mapping techniques should be supplied beforeconcept maps are used for assessment. Our study is one such effort. In particular,in the first part of this paper, we discuss the feasibility of using G theory toevaluate the dependability of concept map scores. In the second part of thispaper, we illustrate how G theory can be applied in this kind of research bycomparing two frequently used concept-mapping tasks: construct-a-map bycreating linking phrases (C) and construct-a-map by selecting linking phrases (S).
Part 1. Application of G theory to Concept-Map Assessment
Issues and Problems Related to the Technical Properties of Concept-mapAssessments
Concept maps vary greatly from one another both for instruction andassessment. When the concept maps are used as an assessment, it becomescritical to narrow down options by finding reliable, valid, and efficient mappingtechniques. Ruiz-Primo et al. (Ruiz-Primo, Shavelson, & Schultz, March 1997, p.7) suggested four criteria for eliminating alternatives: �(a) appropriateness of the
5
cognitive demands required by the task; (b) appropriateness of a structuralrepresentation in a content domain; (c) appropriateness of the scoring systemused to evaluate the accuracy of the representation; and (d) practicality of thetechnique�. Even though criterion (c) only talked about the scoring system, we(Yin, Vanides, Ruiz-Primo, Ayala, & Shavelson, In Press) found that the accuracyof the scores is not only related to the scoring systems, but also related to the taskformat. For example, using the same scoring form, some task formats might bescored more reliably and accurately than others (Yin et al., In Press).
This paper, then, mainly focuses on criteria (b) and (c), which have typicallybeen gauged by traditional statistical analyses and classical test theory. Forexample, mainly using those methods, researchers examined scores for inter-rater reliability/agreement (Herl, O'Neil, Chung, & Schacter, 1999; Lay-Dopyera& Beyerbach, 1983; Lomask, Baron, Greig, & Harrison, March 1992; McClure,Sonak, & Suen, 1999; Nakhleh & Krajcik, 1991); stability (Lay-Dopyera &Beyerbach, 1983); convergent validity�the correlation between concept mapscore and other assessment score in the same content domain (Anderson &Huang, 1989; Baker, Niemi, Novak, & Herl, July 1991; Markham, Mintzes, &Jones, 1994; Novak, Gowin, & Johansen, 1983; Rice, Ryan, & Samson, 1998;Schreiber & Abegg, 1991); predictive validity (Acton, Johnson, & Golldsmith,1994); equivalence of different scoring methods (McClure et al., 1999; Rice et al.,1998); and equivalence of different concept-map tasks(Ruiz-Primo, Shavelson, Li,& Schultz, 2001; Yin et al., In Press).
Those studies have supplied important information about the technicalproperties of different concept map tasks, response formats, and scoring systems,which can undoubtedly help to eliminate improper alternatives. However,because the variations among concept map assessments are so great that classicaltest theory cannot handle those variations simultaneously and efficiently.
Examining Concept-Map Assessments� Technical Properties with G Theory
If we view a concept map assessment score as a sample from a universe ofconditions with all kinds of variations�for example, tasks, response formats,and scoring systems�we can examine concept map assessments in theframework of G theory.
Strength of G theory. Compared with classical test theory, G theory can (a)integrate conceptually and simultaneously evaluate test-retest reliability,
11
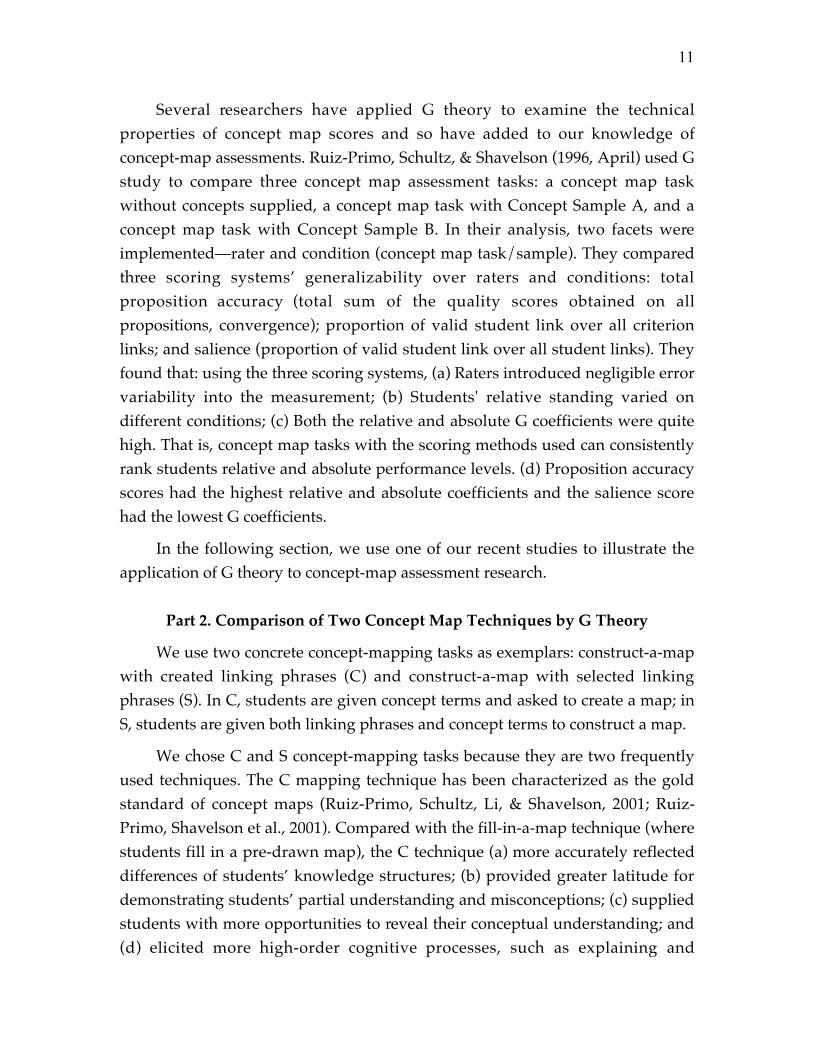
Several researchers have applied G theory to examine the technicalproperties of concept map scores and so have added to our knowledge ofconcept-map assessments. Ruiz-Primo, Schultz, & Shavelson (1996, April) used Gstudy to compare three concept map assessment tasks: a concept map taskwithout concepts supplied, a concept map task with Concept Sample A, and aconcept map task with Concept Sample B. In their analysis, two facets wereimplemented�rater and condition (concept map task/sample). They comparedthree scoring systems� generalizability over raters and conditions: totalproposition accuracy (total sum of the quality scores obtained on allpropositions, convergence); proportion of valid student link over all criterionlinks; and salience (proportion of valid student link over all student links). Theyfound that: using the three scoring systems, (a) Raters introduced negligible errorvariability into the measurement; (b) Students' relative standing varied ondifferent conditions; (c) Both the relative and absolute G coefficients were quitehigh. That is, concept map tasks with the scoring methods used can consistentlyrank students relative and absolute performance levels. (d) Proposition accuracyscores had the highest relative and absolute coefficients and the salience scorehad the lowest G coefficients.
In the following section, we use one of our recent studies to illustrate theapplication of G theory to concept-map assessment research.
Part 2. Comparison of Two Concept Map Techniques by G Theory
We use two concrete concept-mapping tasks as exemplars: construct-a-mapwith created linking phrases (C) and construct-a-map with selected linkingphrases (S). In C, students are given concept terms and asked to create a map; inS, students are given both linking phrases and concept terms to construct a map.
We chose C and S concept-mapping tasks because they are two frequentlyused techniques. The C mapping technique has been characterized as the goldstandard of concept maps (Ruiz-Primo, Schultz, Li, & Shavelson, 2001; Ruiz-Primo, Shavelson et al., 2001). Compared with the fill-in-a-map technique (wherestudents fill in a pre-drawn map), the C technique (a) more accurately reflecteddifferences of students� knowledge structures; (b) provided greater latitude fordemonstrating students� partial understanding and misconceptions; (c) suppliedstudents with more opportunities to reveal their conceptual understanding; and(d) elicited more high-order cognitive processes, such as explaining and
12
planning. However, due to the range and diversity of students� self-createdlinking phrases, the C technique is burdened with scoring difficulties.
A possible solution to these scoring difficulties is to ask students toconstruct a map selecting from predetermined linking phrases (i.e., the �S�condition). Researchers found that the advantage of this technique was that thescoring of these maps could be automated with computers (Klein, Chung,Osmundson, Herl, & O'Neil, 2001). Because the number of propositions wasbounded, computers could easily compare students� maps with a criterion orexpert map(s), typically created by science educators, teachers, and/or scientists.Klein et al. (2001) suggested that the computer made scoring straightforward andeffective. This advantage is particularly appealing when we consider the use ofconcept maps as a potential large-scale assessment tool.
Given the openness of the C mapping technique and the constraints of theS, we raised the following questions: Do the two techniques vary in technicalcharacteristics? For example, do they vary in stability and internal consistency?What can be done if certain reliability levels are needed? For differenttechniques, does the way in which they are optimized vary? How can qualityand efficiency be balanced in the concept map assessment design? We addressthese questions in the framework of G theory. We explore factors influencingconcept-map scores� generalizability in G study and estimate how to optimizedifferent concept mapping techniques by varying the conditions for differentmeasurement facets in D study.
Method
Participants
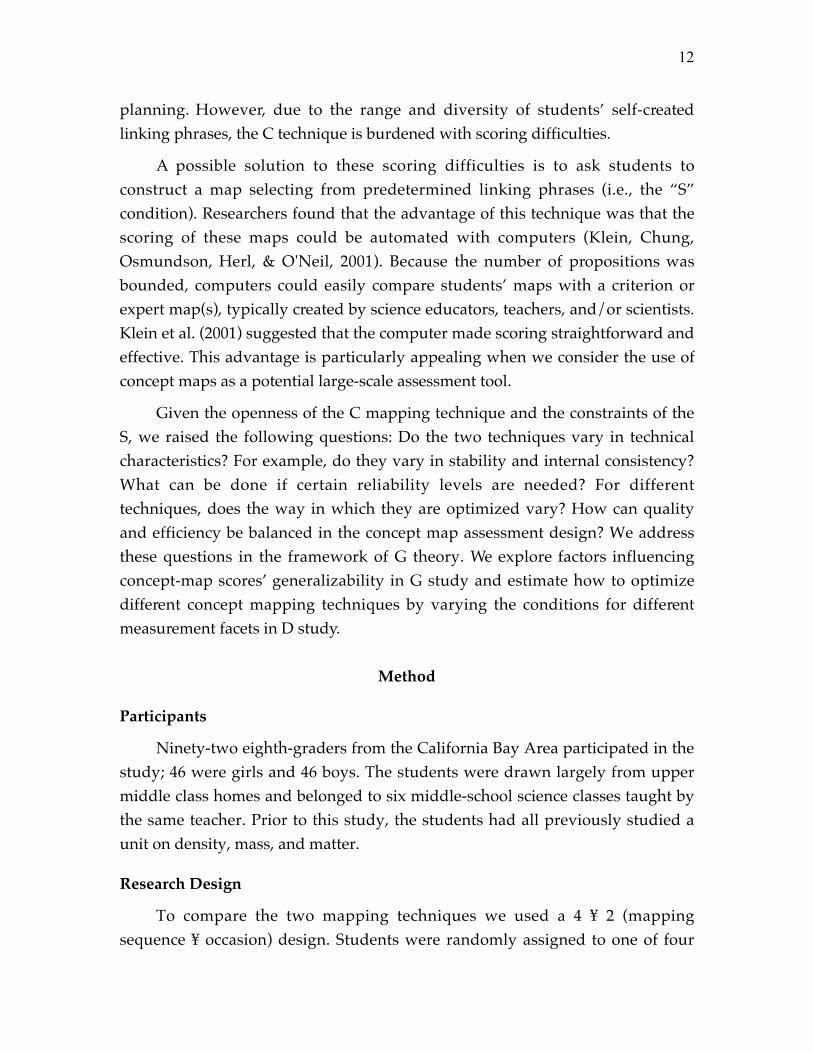
Ninety-two eighth-graders from the California Bay Area participated in thestudy; 46 were girls and 46 boys. The students were drawn largely from uppermiddle class homes and belonged to six middle-school science classes taught bythe same teacher. Prior to this study, the students had all previously studied aunit on density, mass, and matter.
Research Design
To compare the two mapping techniques we used a 4 ¥ 2 (mappingsequence ¥ occasion) design. Students were randomly assigned to one of four
13
mapping sequences across the two occasions: (a) CS�construct-a-map withcreated linking phrases then selected linking phrases (n = 22); (b) SC�construct-a-map with selected linking phrases then with created linking phrases (n = 23);(c) CC�construct-a-map with created linking phrases then construct-a-mapagain with created linking phrases (n = 26); or (d) SS�construct-a-map withselected linking phrases and then with selected linking phrases again (n = 21).The elapsed time between occasions was 7 weeks, with no instructionalintervention related to the content assessed�in this case mass, volume, density,and buoyancy�during that time.
Mapping Techniques
In both the C and the S conditions, we gave students nine concepts relatedto buoyancy and instructed them to connect pairs of concepts with a one-wayarrow to indicate a directional relationship. Students then labeled the arrowswith a linking phrase that described the relationship, creating a proposition,which could be read as a sentence (e.g., WATER has a property of DENSITY).
The selection of key concepts was a cooperative effort of an assessmentdesign team working with curriculum designers, content experts, and a masterteacher. The target curriculum was a unit on buoyancy from the FoundationalApproaches to Science Teaching (FAST) curriculum developed at the CurriculumResearch and Development Group at the University of Hawaii (Pottenger &Young, 1996). By using an iterative selection process involving ranking andvoting by the team members, we selected nine concept terms�WATER,VOLUME, CUBIC CENTIMETER, WOOD, DENSITY, MASS, BUOYANCY,GRAM, and MATTER.
In the C condition, students wrote linking phrases of their own choosing. Inthe S condition, we provided students with a list of linking phrases that they hadto use (or re-use) to describe the relationships between concepts. This list wasbased on a criterion map created by the assessment design team. This provided astarting point for identifying potential linking phrases, some of which were latermodified to be age-appropriate. Finally, we supplied the following linkingphrases in the S condition: �is a measure of��, �has a property of��, �dependson��, �is a form of��, �is mass divided by��, and �divided by volumeequals��
14
Scoring System
In our study, any two of the nine concepts supplied can be connected withtwo possible unidirectional arrows. For example, the relationship from �density�to �matter� can be stated as �density is the property of matter� or vice versa,�matter has the property of density�. The relationships described by the twopropositions are quite similar; two-way arrows are not allowed. Therefore, weconsidered the direction of the relationship when evaluating the adequacy of theproposition but treated both �Matter � Density� and �Matter ⇓ Density� scores as
the same proposition for �Density - Matter�.
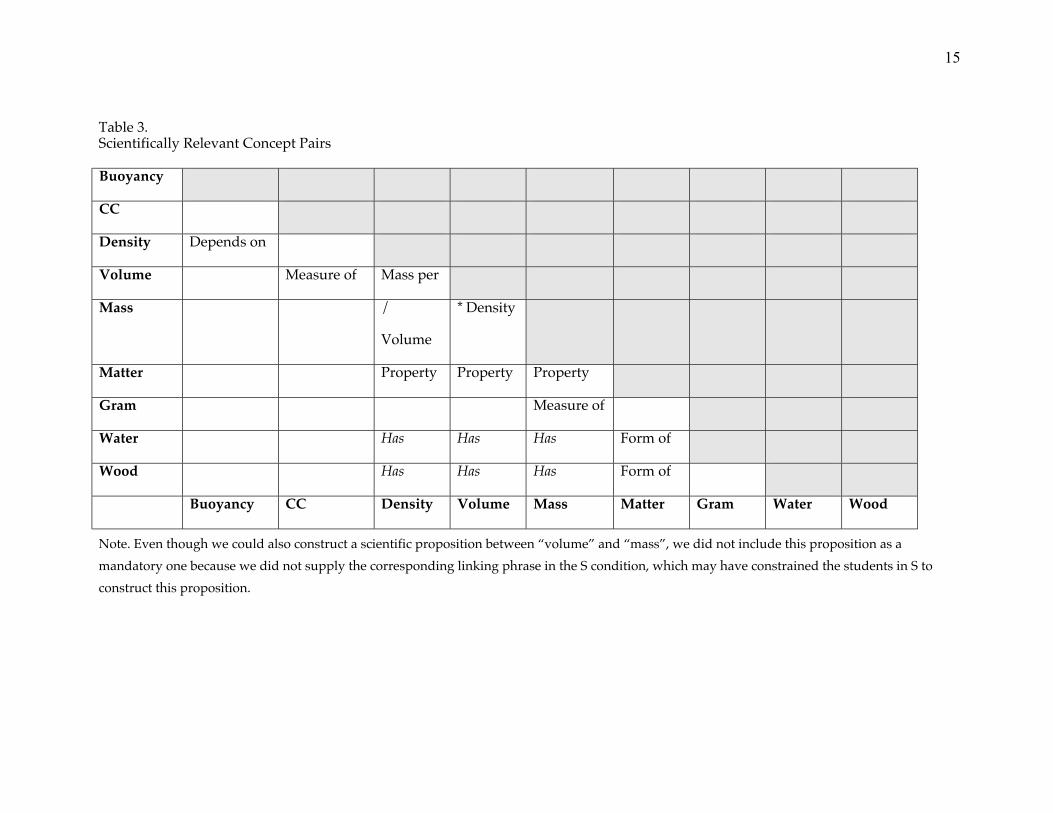
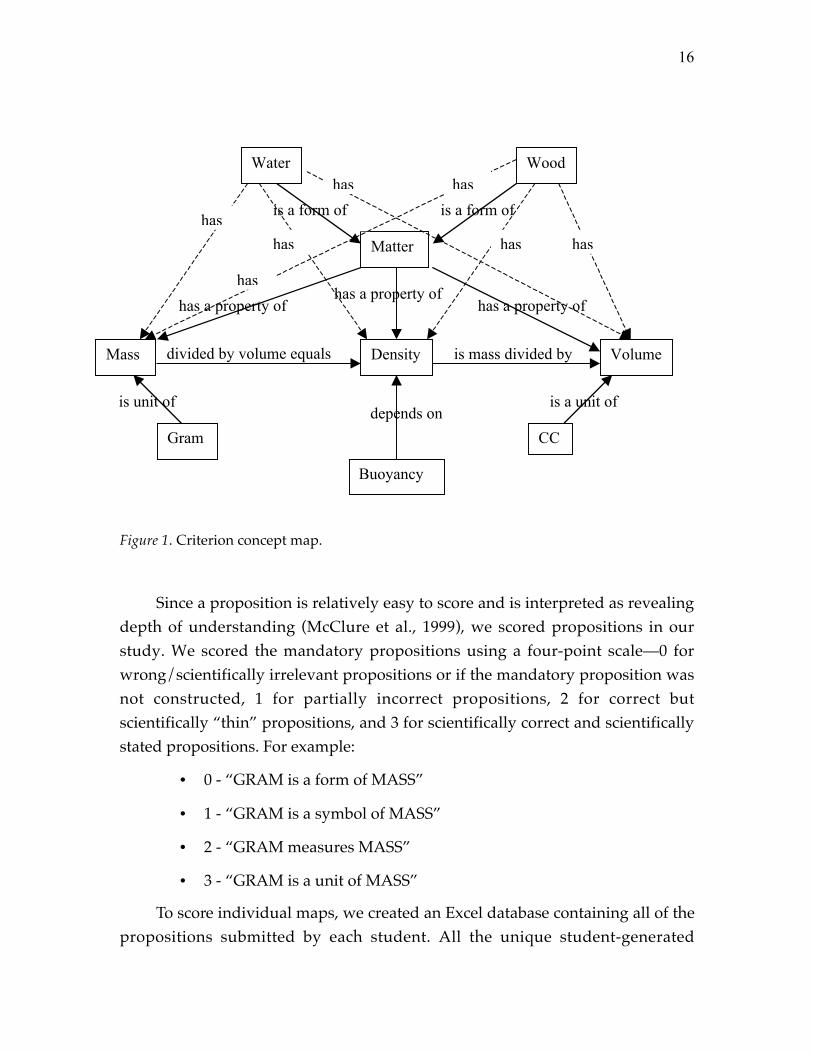
Mathematically, all combinations of the nine terms produce 36 (=9*8/2)concept pairs. However, not all the concept pairs are scientifically relevant. Forexample, �volume� has no scientifically relevant relationship with �gram�. Basedon experts� and students� maps, we constructed a criterion concept map (Figure1) and identified sixteen concept pairs with scientific relationships. We labeledthose concept pairs with their corresponding relationships as �mandatory�propositions (Table 3). They are the propositions in the criterion map (Figure 1).Solid lines in the criterion map are propositions constructed by experts. Dashlines are propositions that originally were not in the expert map but usedfrequently by students. We only scored the sixteen propositions and viewedthem as a sample from the subject-matter universe.
15
Table 3.Scientifically Relevant Concept Pairs
Buoyancy
CC
Density Depends on
Volume Measure of Mass per
Mass /
Volume
* Density
Matter Property Property Property
Gram Measure of
Water Has Has Has Form of
Wood Has Has Has Form of
Buoyancy CC Density Volume Mass Matter Gram Water Wood
Note. Even though we could also construct a scientific proposition between �volume� and �mass�, we did not include this proposition as a
mandatory one because we did not supply the corresponding linking phrase in the S condition, which may have constrained the students in S to
construct this proposition.
16
Figure 1. Criterion concept map.
Since a proposition is relatively easy to score and is interpreted as revealingdepth of understanding (McClure et al., 1999), we scored propositions in ourstudy. We scored the mandatory propositions using a four-point scale�0 forwrong/scientifically irrelevant propositions or if the mandatory proposition wasnot constructed, 1 for partially incorrect propositions, 2 for correct butscientifically �thin� propositions, and 3 for scientifically correct and scientificallystated propositions. For example:
• 0 - �GRAM is a form of MASS�
• 1 - �GRAM is a symbol of MASS�
• 2 - �GRAM measures MASS�
• 3 - �GRAM is a unit of MASS�
To score individual maps, we created an Excel database containing all of thepropositions submitted by each student. All the unique student-generated
Water
Mass Volume
Buoyancy
CCGram
Wood
Matter
Density
is unit of
has a property of
depends on
is a form of
is mass divided bydivided by volume equals
is a form of
has a property ofhas a property of
is a unit of
has
has
has
has has
hashas
17
propositions extracted from the database comprised a �master list� ofpropositions. Three raters, two graduate students, and one science educationprofessor, reached agreement on the scores for all the unique propositions andbuilt up our master scoring list. Having transferred each student�s concept mappropositions into the Excel database, we used the master scoring-list to scoreeach proposition.
Facets
We view a concept-map�s proposition scores as a sample representative of astudent�s declarative knowledge structure drawn from a universe defined by acombination of all possible propositions, test formats (e.g., C and S), andoccasions (1 and 2). Since students� map scores were the consensus score of tworaters, scoring was automated with the aid of the Excel program and rater is notregarded as a facet in our design. Persons are the object of measurement andpropositions, occasions and formats are the facets of the measurement.
Proposition, then, is a facet of the concept-map assessment. We think of aproposition in a concept map as analogous to an item in a multiple-choice test.Propositions sampled in our study could be considered exchangeable with anyother possible proposition in the topic, therefore, we treated proposition as arandom facet. In order to differentiate P (proposition) from P (person), we use I(item) to represent proposition in the following discussion.
We examined two concept-mapping techniques that varied in format, C andS, in four sequences: 1) from C to S; 2) from S to C; 3) from C to C; 4) from S to S.Accordingly, besides proposition, the second facet in sequences 1 and 2 of ourstudy is format and the second facet in sequences 3 and 4 is occasion. Format inour study is a fixed facet because the two task types were purposively selectedand we cannot generalize the conclusion drawn about the two task types to othertask types. However, according to Shavelson and Webb, we could first �run ananalysis of variance treating all sources of variance as random� before furtheranalysis (Shavelson & Webb, 1991, p. 67). Therefore, we ran a fully randomanalysis in CS and SC before further steps were taken. In CC and SS we treatedoccasion as a random facet, which is exchangeable with any other occasiondrawn from the universe.
18
Results and Discussion
G study
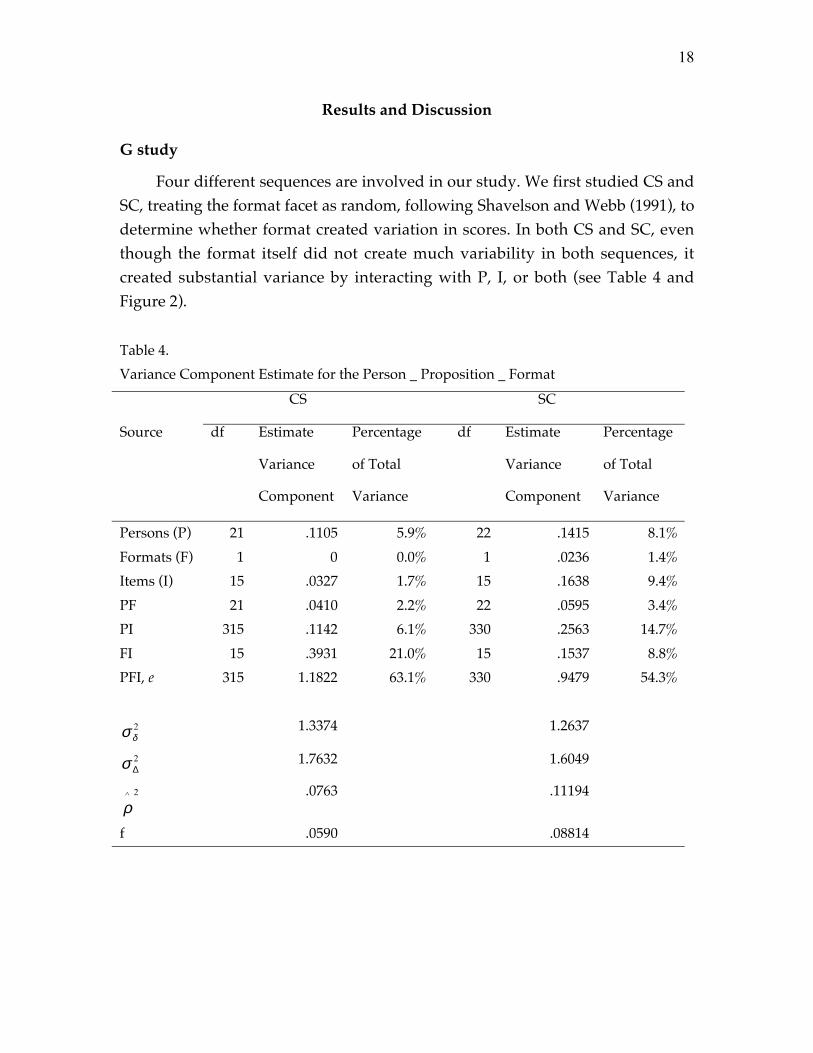
Four different sequences are involved in our study. We first studied CS andSC, treating the format facet as random, following Shavelson and Webb (1991), todetermine whether format created variation in scores. In both CS and SC, eventhough the format itself did not create much variability in both sequences, itcreated substantial variance by interacting with P, I, or both (see Table 4 andFigure 2).
Table 4.
Variance Component Estimate for the Person _ Proposition _ Format
CS SC
Source df Estimate
Variance
Component
Percentage
of Total
Variance
df Estimate
Variance
Component
Percentage
of Total
Variance
Persons (P) 21 .1105 5.9% 22 .1415 8.1%
Formats (F) 1 0 0.0% 1 .0236 1.4%
Items (I) 15 .0327 1.7% 15 .1638 9.4%
PF 21 .0410 2.2% 22 .0595 3.4%
PI 315 .1142 6.1% 330 .2563 14.7%
FI 15 .3931 21.0% 15 .1537 8.8%
PFI, e 315 1.1822 63.1% 330 .9479 54.3%
2δσ 1.3374 1.2637
2∆σ 1.7632 1.6049
2^
ρ.0763 .11194
f .0590 .08814
19
0.0%
10.0%
20.0%
30.0%
40.0%
50.0%
60.0%
70.0%
P F I PF PI FI PFI,e
Source
Perc
en
t o
f T
ota
l V
ari
ab
ilit
y
CS
SC
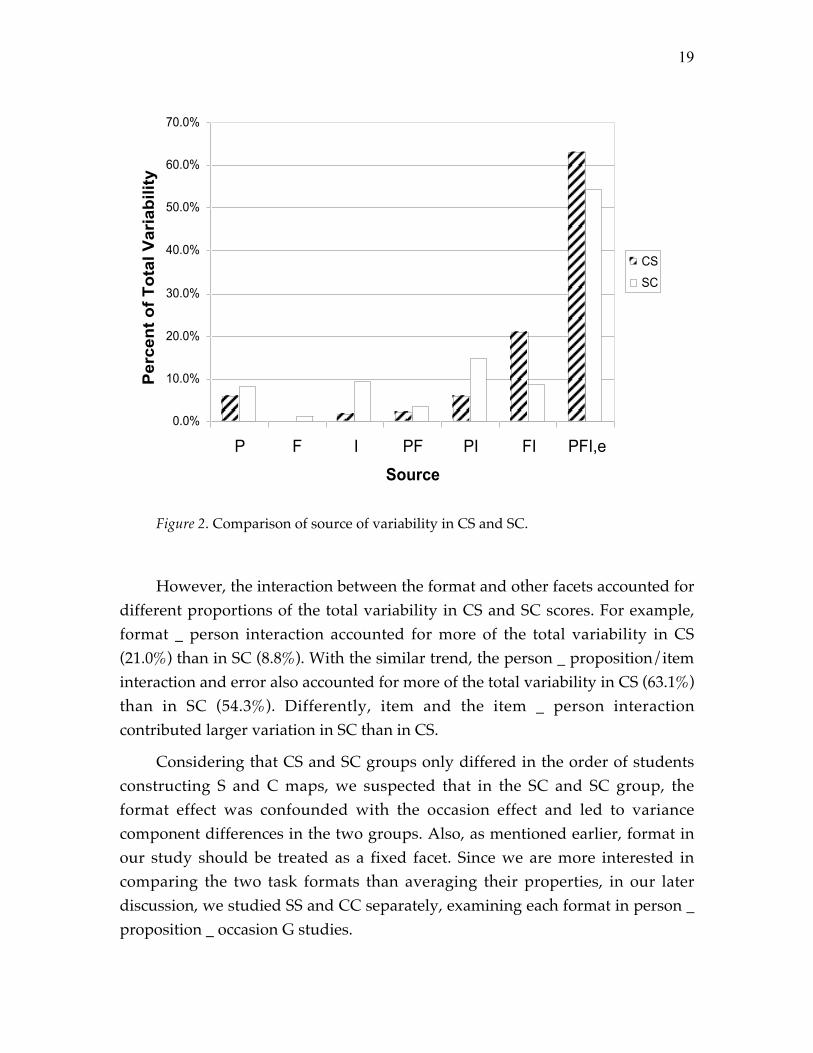
Figure 2. Comparison of source of variability in CS and SC.
However, the interaction between the format and other facets accounted fordifferent proportions of the total variability in CS and SC scores. For example,format _ person interaction accounted for more of the total variability in CS(21.0%) than in SC (8.8%). With the similar trend, the person _ proposition/iteminteraction and error also accounted for more of the total variability in CS (63.1%)than in SC (54.3%). Differently, item and the item _ person interactioncontributed larger variation in SC than in CS.
Considering that CS and SC groups only differed in the order of studentsconstructing S and C maps, we suspected that in the SC and SC group, theformat effect was confounded with the occasion effect and led to variancecomponent differences in the two groups. Also, as mentioned earlier, format inour study should be treated as a fixed facet. Since we are more interested incomparing the two task formats than averaging their properties, in our laterdiscussion, we studied SS and CC separately, examining each format in person _proposition _ occasion G studies.
20
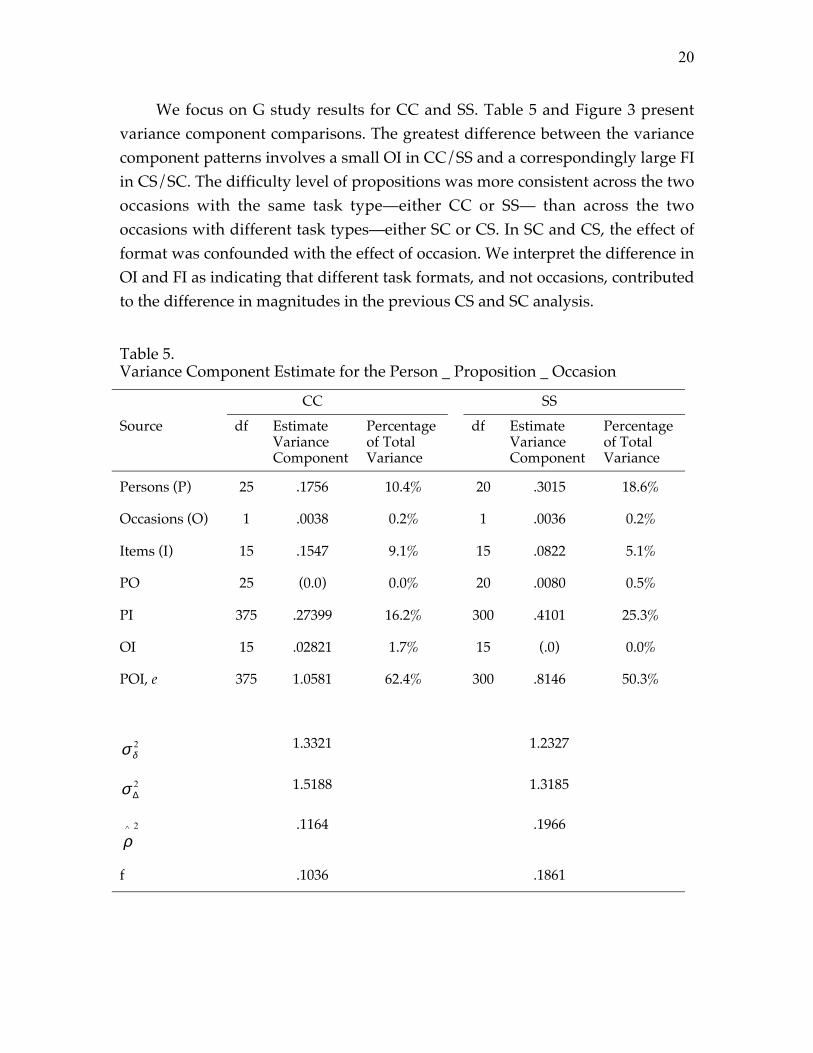
We focus on G study results for CC and SS. Table 5 and Figure 3 presentvariance component comparisons. The greatest difference between the variancecomponent patterns involves a small OI in CC/SS and a correspondingly large FIin CS/SC. The difficulty level of propositions was more consistent across the twooccasions with the same task type�either CC or SS� than across the twooccasions with different task types�either SC or CS. In SC and CS, the effect offormat was confounded with the effect of occasion. We interpret the difference inOI and FI as indicating that different task formats, and not occasions, contributedto the difference in magnitudes in the previous CS and SC analysis.
Table 5.Variance Component Estimate for the Person _ Proposition _ Occasion
CC SS
Source df EstimateVarianceComponent
Percentageof TotalVariance
df EstimateVarianceComponent
Percentageof TotalVariance
Persons (P) 25 .1756 10.4% 20 .3015 18.6%
Occasions (O) 1 .0038 0.2% 1 .0036 0.2%
Items (I) 15 .1547 9.1% 15 .0822 5.1%
PO 25 (0.0) 0.0% 20 .0080 0.5%
PI 375 .27399 16.2% 300 .4101 25.3%
OI 15 .02821 1.7% 15 (.0) 0.0%
POI, e 375 1.0581 62.4% 300 .8146 50.3%
2δσ 1.3321 1.2327
2∆σ 1.5188 1.3185
2^
ρ.1164 .1966
f .1036 .1861
21
0%
10%
20%
30%
40%
50%
60%
70%
P O I PO PI OI POI,e
Source
Per
cen
t o
f T
ota
l Var
iab
ility
CC
SS
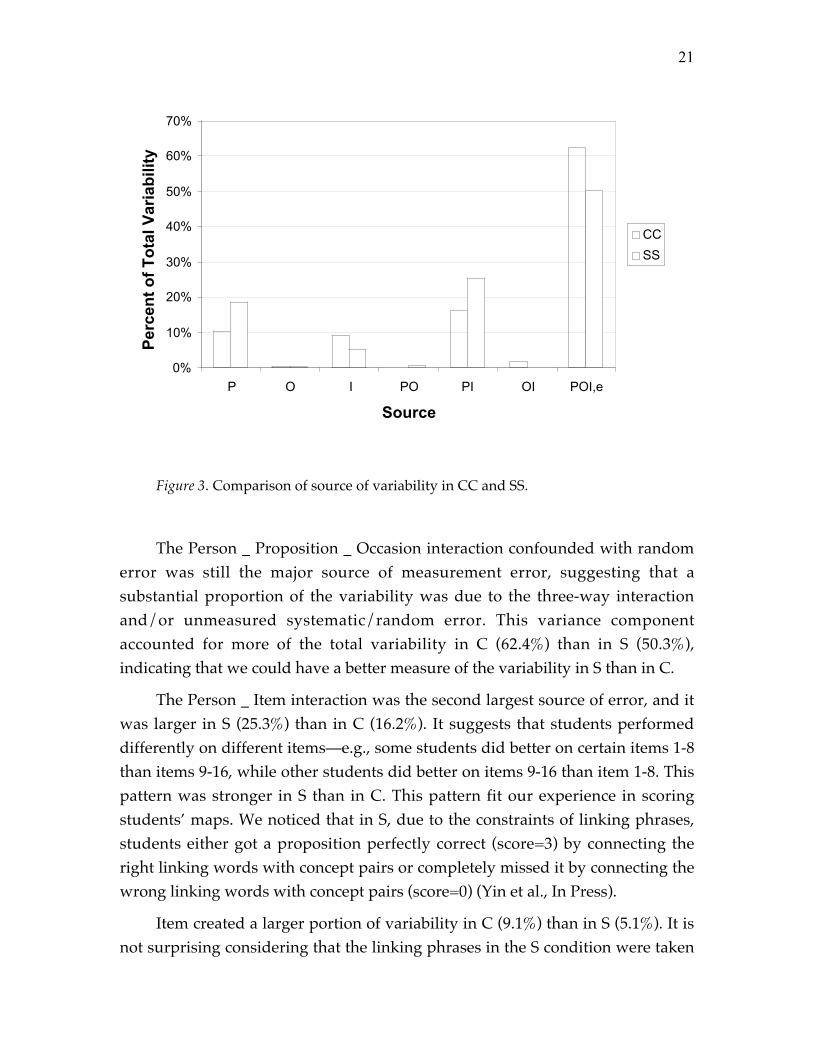
Figure 3. Comparison of source of variability in CC and SS.
The Person _ Proposition _ Occasion interaction confounded with randomerror was still the major source of measurement error, suggesting that asubstantial proportion of the variability was due to the three-way interactionand/or unmeasured systematic/random error. This variance componentaccounted for more of the total variability in C (62.4%) than in S (50.3%),indicating that we could have a better measure of the variability in S than in C.
The Person _ Item interaction was the second largest source of error, and itwas larger in S (25.3%) than in C (16.2%). It suggests that students performeddifferently on different items�e.g., some students did better on certain items 1-8than items 9-16, while other students did better on items 9-16 than item 1-8. Thispattern was stronger in S than in C. This pattern fit our experience in scoringstudents� maps. We noticed that in S, due to the constraints of linking phrases,students either got a proposition perfectly correct (score=3) by connecting theright linking words with concept pairs or completely missed it by connecting thewrong linking words with concept pairs (score=0) (Yin et al., In Press).
Item created a larger portion of variability in C (9.1%) than in S (5.1%). It isnot surprising considering that the linking phrases in the S condition were taken
22
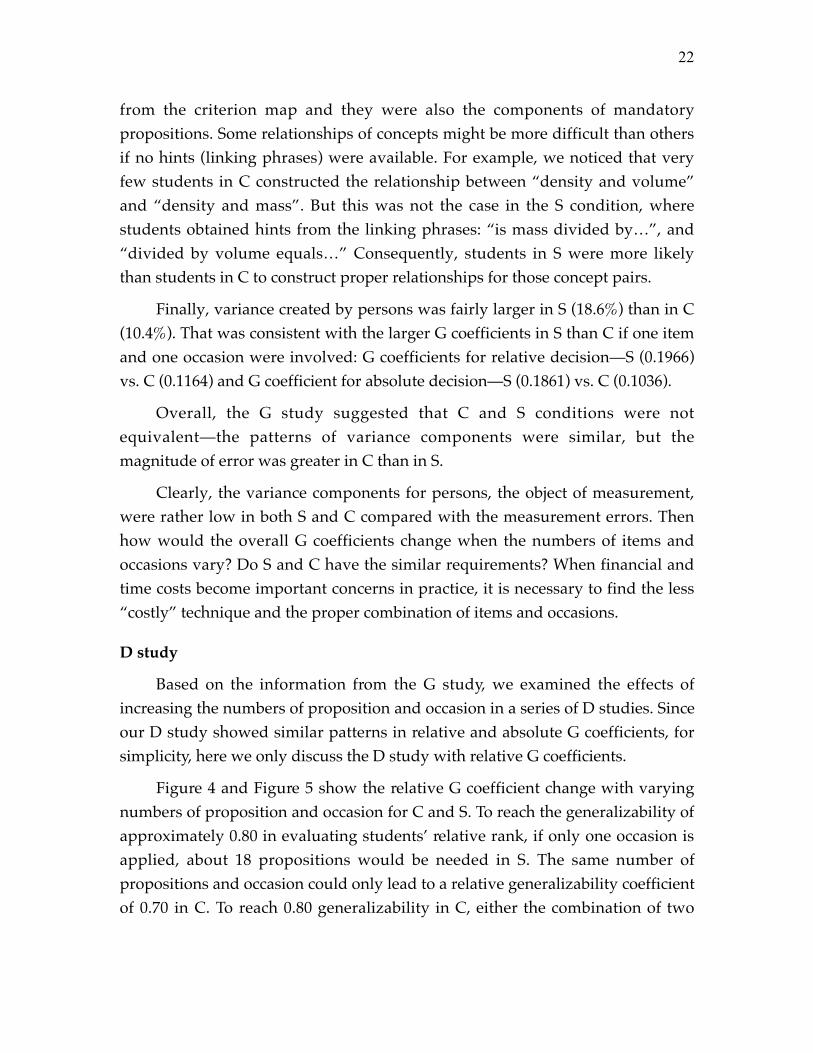
from the criterion map and they were also the components of mandatorypropositions. Some relationships of concepts might be more difficult than othersif no hints (linking phrases) were available. For example, we noticed that veryfew students in C constructed the relationship between �density and volume�and �density and mass�. But this was not the case in the S condition, wherestudents obtained hints from the linking phrases: �is mass divided by��, and�divided by volume equals�� Consequently, students in S were more likelythan students in C to construct proper relationships for those concept pairs.
Finally, variance created by persons was fairly larger in S (18.6%) than in C(10.4%). That was consistent with the larger G coefficients in S than C if one itemand one occasion were involved: G coefficients for relative decision�S (0.1966)vs. C (0.1164) and G coefficient for absolute decision�S (0.1861) vs. C (0.1036).
Overall, the G study suggested that C and S conditions were notequivalent�the patterns of variance components were similar, but themagnitude of error was greater in C than in S.
Clearly, the variance components for persons, the object of measurement,were rather low in both S and C compared with the measurement errors. Thenhow would the overall G coefficients change when the numbers of items andoccasions vary? Do S and C have the similar requirements? When financial andtime costs become important concerns in practice, it is necessary to find the less�costly� technique and the proper combination of items and occasions.
D study
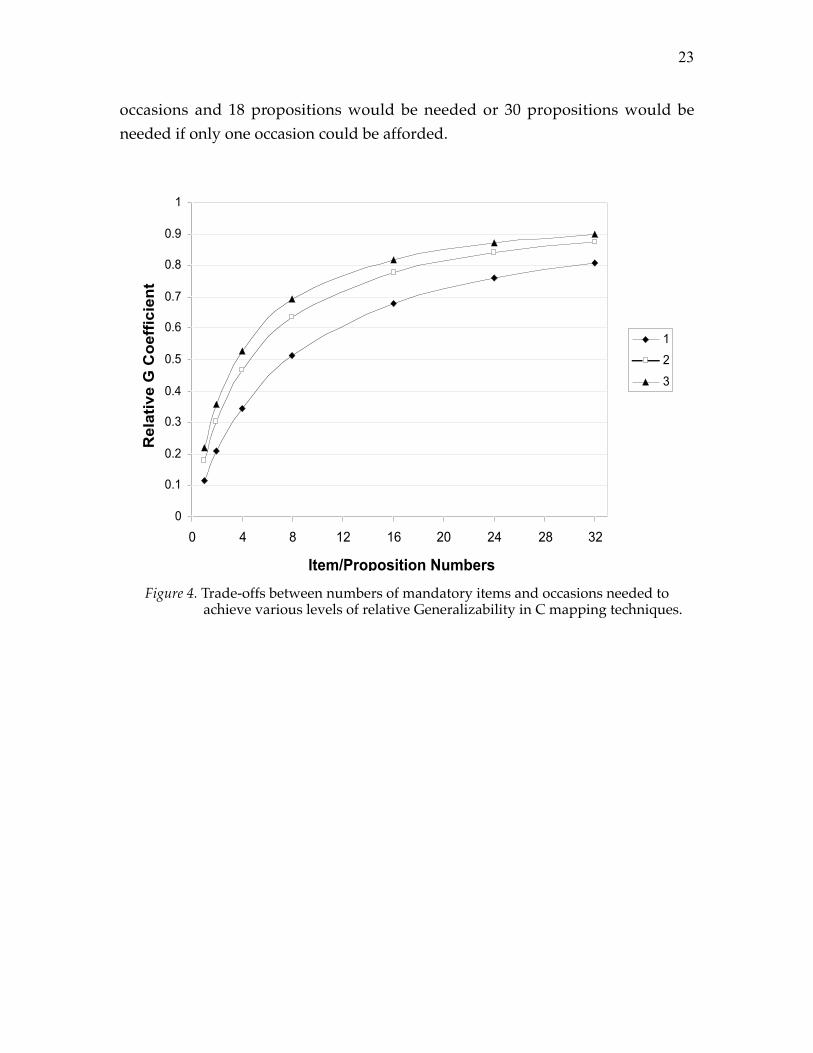
Based on the information from the G study, we examined the effects ofincreasing the numbers of proposition and occasion in a series of D studies. Sinceour D study showed similar patterns in relative and absolute G coefficients, forsimplicity, here we only discuss the D study with relative G coefficients.
Figure 4 and Figure 5 show the relative G coefficient change with varyingnumbers of proposition and occasion for C and S. To reach the generalizability ofapproximately 0.80 in evaluating students� relative rank, if only one occasion isapplied, about 18 propositions would be needed in S. The same number ofpropositions and occasion could only lead to a relative generalizability coefficientof 0.70 in C. To reach 0.80 generalizability in C, either the combination of two
23
occasions and 18 propositions would be needed or 30 propositions would beneeded if only one occasion could be afforded.
0
0.1
0.2
0.3
0.4
0.5
0.6
0.7
0.8
0.9
1
0 4 8 12 16 20 24 28 32
Item/Proposition Numbers
Re
lati
ve
G C
oe
ffic
ien
t
1
2
3
Figure 4. Trade-offs between numbers of mandatory items and occasions needed toachieve various levels of relative Generalizability in C mapping techniques.
24
0
0.1
0.2
0.3
0.4
0.5
0.6
0.7
0.8
0.9
1
0 4 8 12 16 20 24 28 32
Rela
tive G
Co
eff
icie
nt
1
2
3
Figure 5. Trade-offs between numbers of mandatory items and occasionsneeded to achieve various levels of relative Generalizability in Smapping techniques.
Based on the data obtained from our study, S has higher reliability than Cunder the same condition. Moreover, our scoring experience showed thatagreement was much more difficult to reach in C scoring than S scoring becauseof the openness of C maps. That is, if we included raters as another facet, it mightbe a greater source of variation in C than in S; consequently, G coefficients for Cmight have been much lower than those for S. In addition, as mentioned earlier, Smaps can be computer scored, which theoretically could eliminate the errormade and the cost brought in by raters. Therefore, based on our reliabilityanalysis, our tentative conclusion is that S might be a more dependable andefficient assessment than C.
25
Conclusion
Due to G theory�s power, convenience, and flexibility, we believe it ispreferable to classical test theory in examining measurement error and reliabilityfor concept maps. In this paper, we demonstrate the application of G theory toconcept maps with the hope of widening the theory�s use in concept mapresearch.
We discussed the possible roles G theory may play in a concept map study.We summarized facets of a concept-map measurement that might enter into aconcept map G study: concepts, propositions, tasks, response formats, occasions,raters, and scoring systems. With these facets, we could examine manyproperties of concept map assessments, for example, test-retest stability, inter-rater reliability, internal consistency, and equivalence of different concept maptasks/scoring systems. With information obtained from the G study, we couldanswer many questions related to the application of concept maps in large-scaleassessment. For example, how many propositions are needed to obtain adependable score for a student? How many raters are needed to score a conceptmap reliably? What scoring system has better technical properties? Answers tothese (and other) questions can contribute to narrowing the large number ofoptions involved in concept map assessments used in practice.
In addition to the theoretical application of G theory to concept maps, weexamined two concept-mapping techniques: construct-a-map with createdlinking phrases (C) and construct-a-map with selected linking phrases (S). Wefound that C and S were not equivalent in their measurement errors andreliability. The variance component analysis showed: (1) Person _ Proposition _Occasion interaction confounded with error accounted for a larger proportion ofvariability in C than in S; (2) Person _ Item interaction accounted for a largerproportion of variability in S than in C; (3) the G coefficients for S for one itemand one occasion were larger than those for C.
A D study showed that fewer items would be needed for S than C to reachthe desired level of G coefficients. Otherwise, more occasions have to be appliedfor C technique in order to get dependable scores. Based on the current study, Sis more efficient and reliable mapping technique than C. S might especially be abetter candidate than C in the summative assessment. In contrast, our previousresearch also showed that C better reflected students� partial knowledge and
26
misunderstandings (Ruiz-Primo, Schultz et al., 2001; Ruiz-Primo, Shavelson etal., 2001; Yin et al., In Press). Accordingly, C might be an effective tool forformative assessment in a classroom setting, where fully understanding a student�scurrent thinking is more important than scores (Black & Wiliam, 1998).
This study was just a little demonstration of how G theory could contributeto the study of concept-map assessment. As mentioned earlier, many moreunknowns in this field could be investigated with G theory. With more technicalinformation about concept map assessments, assessment researchers could betterutilize concept mapping, this promising assessment tool, to help understandwhat students know and finally improve students� learning.
27
Reference
Acton, W., H., Johnson, P. J., & Golldsmith, T. E. (1994). Structural knowledgeassessment: Comparison of referent structures. Journal of EducationalPsychology, 86, 303-311.
Anderson, T. H., & Huang, S. C. C. (1989). On using concept maps to assess thecomprehension effects of reading expository text (No. 483). Urbana-Champaign:Center for the Studying of Reading, University of Illinois at Urbana-Champaign.
Astin, L. B., & Shore, B. M. (1995). Using concept mapping for assessment inphysics. Physics Education, 30, 41-45.
Baker, E. L., Niemi, D., Novak, J. D., & Herl, H. (1991, July). Hypertext as a strategyfor teaching and assessing knowledge representation. Paper presented at theNATO Advanced Research Workshop on Instructional Design Models forComputer-Based Learning Environments, The Netherlands.
Black, P., & Wiliam, D. (1998). Inside the Black Box: Raising standards throughclassroom assessment. Phi Delta Kappan, 80(2), 139-148.
Cronbach, L. J., Gleser, G. C., Nanda, H., & Rajaratnam, N. (1972). Thedependability of behavioral measurements: Theory of generalizability of scores andprofiles. New York: John Wiley.
Cronbach, L. J., Linn, R. L., Brennan, R. L., & Haertel, E. H. (1997).Generalizability analysis for performance assessments of studentachievement or school effectiveness. Educational and PsychologicalMeasurement, 57(3), 373-399.
Herl, H. E., O'Neil, H. F., Chung, G. K. W. K., & Schacter, J. (1999). Reliability andvalidity of a computer-based knowledge mapping system to measurecontent understanding. Computer in Human Behavior, 15, 315-333.
Kinchin, I. M. (2000). Using concept maps to reveal understanding: A two-tieranalysis. School Science Review, 81(296), 41-46.
Klein, D. C. D., Chung, G. K. W. K., Osmundson, E., Herl, H. E., & O'Neil, H. F.(2001). Examing the validity of knowledge mapping as a measure of elementarystudents' scientific understanding. Los Angeles: National Center for Researchon Evaluation, Standards, and Student Testing (CRESST).
Lay-Dopyera, M., & Beyerbach, B. (1983). Concept mapping for individualassessment. Syracuse, NY: School of Education, Syracuse University.
28
Lomask, M., Baron, J. B., Greig, J., & Harrison, C. (1992, March). ConnMap:Connecticut's use of concept mapping to asssess the structure of students'knowledge of science. Paper presented at the National Association of Researchin Science Teaching, Cambridge, MA.
Markham, K. M., Mintzes, J. J., & Jones, M. G. (1994). The concept map as aresearch and evaluation tool: Further evidence of validity. Journal of Researchin Science Teaching, 31(91-101).
McClure, J. R., Sonak, B., & Suen, H. K. (1999). Concept map assessment ofclassroom learning: Reliability, validity, and logistical practicality. Journal ofResearch in Science Teaching, 36(4), 475-492.
Nakhleh, M. B., & Krajcik, J. S. (1991). The effect of level of information as presentedby different technology on students' understanding of acid, base, and pH concepts.Paper presented at the annual meeting of the National Association for theResearch in Science Teaching, Lake Geneva, WI.
Novak, J. D., & Gowin, D. B. (1984). Learning how to learn. New York: CambridgeUniversity Press.
Novak, J. D., Gowin, D. B., & Johansen, G. T. (1983). The use of concept mappingand knowledge vee mapping with junior high school science students.Science Education, 67(625-645).
Pottenger, F. M., & Young, D. B. (1996). The Local Environment, FoundationalApproaches in Science Teaching (Second Edition). Honolulu, Hawaii.
Rice, D. C., Ryan, J. M., & Samson, S. M. (1998). Using concept maps to assessstudent learning in the science classroom: Must different methods compete?Journal of Research in Science Teaching, 35(10), 1103-1127.
Ruiz-Primo, M. A., Shavelson, R. J., Li, M., & Schultz, S. E. (2001). On the validityof cognitive interpretations of scores from alternative concept-mappingtechniques. Educational Assessment, 7(2), 99-141.
Ruiz-Primo, M. A., Schultz, S. E., Li, M., & Shavelson, R. J. (2001). Comparison ofthe reliability and validity of scores from two concept-mapping techniques.Journal of Research in Science Teaching, 38(2), 260-278.
Ruiz-Primo, M. A., Schultz, E. S., & Shavelson, J. R. (1996, April). Concept map-based assessments in science: An exploratory study. Paper presented at theAmerican Educational Research Association, New York, NY.
Ruiz-Primo, M. A., & Shavelson, R. J. (1996). Problem and issues in the use ofconcept maps in science assessment. Journal of Research in Science Teaching,33(6), 569-600.
29
Ruiz-Primo, M. A., Shavelson, R. J., & Schultz, S. E. (1997, March). On the validityof concept map based assessment interpretations: An experiment testing theassumption of hierarchical concept-maps in science. Paper presented at theAmerican Educational Research Association, Chicago, IL.
Schreiber, D. A., & Abegg, G. L. (1991). Scoring student-generated concept maps inintroductory college chemistry. Paper presented at the annual meeting of theNational Association for the Research in Science Teaching, Lake Geneva,WI.
Shavelson, R. J., Baxter, G. P., & Gao, X. (1993). Sampling variability ofperformance assessment. Journal of Educational Measurement, 30(3), 215-232.
Shavelson, R. J., Ruiz-Primo, M. A., & Wiley, G. C. (1999). Note on sources ofsampling variability in science performance assessments. Journal ofEducational Measurement, 36, 61-71.
Shavelson, R. J., Ruiz-Primo, M. A., & Wiley, E. (In Press) Windows into theMind. International Journal of Higher Education.
Shavelson, R. J. & Webb, N. M. (1991). Generalizability theory: A primer. NewburyPark, CA: Sage.
Yin, Y., Vanides, J., Ruiz-Primo, M. A., Ayala, C. C., & Shavelson, J. R. (In Press).A comparison of two concept-mapping techniques: Implications for scoring,interpretation, and use. Journal of Research in Science Teaching.
30
Footnote
1. Since this AERA session is �Issues in Population Generalization�, weassumed the audiences have understood Generalizability Theory;therefore, we did not define or explain most terms related to Gtheory but simply use them as an analysis tool.
31
Appendix 1 Concept Map Components and Variations Identified
Note. From �Problems and Issues in the Use of Concept Maps in Science Assessment� by M.A.
Ruiz-Primo and R.J. Shavelson, 1996, Journal of Research in Science Teaching, 33, p. 586. Copyright
1996 by the National Association for Research in Science Teaching. Reprinted with permission.