Embed Size (px)
Citation preview
Re-thinking Urban Vacancies: Strategic Re-use Of Vacant Land
To Establish More Sustainable Land Patterns
by
Monique R. Gatner
A thesis
presented to
The University of Guelph
In partial fulfilment of requirements
for the degree of
Master of Landscape Architecture
Guelph, Ontario, Canada
© Monique R. Gatner, May, 2012
ABSTRACT
RE-THINKING URBAN VACANCIES: STRATEGIC RE-USE OF VACANT LAND
TO ESTABLISH MORE SUSTAINABLE LAND PATTERNS Monique R. Gatner Advisor: University of Guelph, 2012 Professor Robert Corry Eighty percent of the Canadian population lives in urban centres, where typical land use
patterns negatively impact urban ecosystems and decrease quality of life. Current
municipal Community Improvement Plans target urban vacancies for intensification
efforts, which can increase fragmentation and degradation of the urban ecosystem. This
project examines the urban environment: its vacancies, ecological patterns and human
impacts. A strategy was derived from ecological principles aiming to design more
sustainable urban landscape patterns. Applied to the Two Rivers neighbourhood in
Guelph, Ontario, the strategy identified 19.5 hectares of land capable of contributing to
more sustainable ecological patterns of which 12.41 hectares were brownfields. Results
revealed 4.3% more high-quality land cover, in 53% more patches, 45 m closer together,
but with increasing edge contrast. An area-wide strategic integration of vacant lands may
provide previously unconsidered opportunities to improve urban ecological patterns and
create a more sustainable urban environment.
iii Acknowledgements
I would like to thank to my advisor, Prof. Rob Corry. Your guidance, patience and the
generosity with which you share your time were deeply appreciated. To my committee
member, Prof. Karen Landman, and Prof. Sean Kelly, chair of my defence, thank you
both for your time and positive feedback.
To the staff in the Data Resource Centre, and Adam Bonnycastle and Marie Puddister in
Geography Department at the University of Guelph, thank you for your enthusiasm and
willingness to share your technical expertise.
To my mother, my family and friends – I am deeply grateful for the love, support and
words of encouragement that saw me through this degree and all its challenges.
iv Table of Contents ABSTRACT....................................................................................................................... ii
Acknowledgements .......................................................................................................... iii
List of Figures.................................................................................................................. vii
List of Tables .....................................................................................................................ix
Chapter 1. Introduction..................................................................................................1
Chapter 2. Literature Review ........................................................................................4
2.1. Urbanisation......................................................................................................................4
2.1.1. Urban sprawl ...............................................................................................................4
2.1.2. Intensification..............................................................................................................6
2.2. Urban Vacancy ...............................................................................................................10
2.3. Impacts of Urbanisation.................................................................................................12
2.3.1. Habitat .......................................................................................................................12
2.3.2. Water .........................................................................................................................14
2.3.3. Human Well-being ....................................................................................................16
2.4. Opportunities within Urban Vacancies ........................................................................17
2.5. Patterns Suitable For Strategic Re-Integration Vacant Land ...................................20
2.5.1. Sustainability and Resilience ....................................................................................20
2.5.2. Landscape Pattern and Process .................................................................................21
Chapter 3. Methodology...............................................................................................28
3.1. Step 1 - GIS Data Sets ....................................................................................................30
3.2. Step 2 – Vacant Lot Groundtruthing............................................................................32
3.3. Step 3: Identifying vacant lots that fulfil Strategy 1.1-3.2 criteria ............................33
3.3.1. Connectivity ..............................................................................................................33
3.3.2. Large Patches ............................................................................................................35
3.3.3. Heterogeneous Matrix ...............................................................................................36
3.4. Step 4: Land Use/Land Cover (LULC) Mapping to Evaluate Contrast ...................37
3.4.1. Step 4.1 Aggregating Land Use Classifications........................................................37
3.4.2. Step 4.2: Aggregating Land Cover Classifications ...................................................38
3.5. Step 5: Aggregating and Prioritizing LULC Classifications ......................................39
3.6. Step 6: LULC Contrast Evaluation (Strategy 4.1) ......................................................40
v 3.7. Step 7: Identifying Brownfields and Community Opportunities (Strategy 5.1).......42
3.7.1. Brownfields ...............................................................................................................42
3.7.2. Enhancing Community Vitality ................................................................................42
3.8. Step 8: Analysis of Pre- and Post-strategy LULC Maps.............................................43
3.8.1. Landscape Composition Metrics...............................................................................43
3.8.2. Landscape Configuration Metrics .............................................................................44
Chapter 4. Results .........................................................................................................46
4.1. Neighbourhood Land Use and Land Cover (LULC) Characterisation ....................46
4.1.1. Vacant Lots ...............................................................................................................48
4.2. Strategy Patterns 1.1-3.2 ................................................................................................49
4.2.1. Connectivity (Patterns 1.1-1.7) .................................................................................49
4.2.2. Patch Size (Patterns 2.1-2.3) .....................................................................................49
4.2.3. Heterogeneous Matrix (Patterns 3.1-3.2) ..................................................................50
4.2.4. Contrast .....................................................................................................................50
4.2.5. Brownfields ...............................................................................................................50
4.2.1. Neighbourhood Vitality ............................................................................................50
4.3. Landscape Metrics..........................................................................................................54
4.3.1. Landscape Composition Metric Results....................................................................54
4.3.2. Landscape Configuration Metric Results..................................................................55
4.3.3. Summary landscape metric analysis .........................................................................56
Chapter 5. Discussion ...................................................................................................58
5.1. Area-wide Approach ......................................................................................................58
5.2. Founding Principles........................................................................................................59
5.3. Application and Effects ..................................................................................................59
5.3.1. Connectivity ..............................................................................................................60
5.3.2. Patch size...................................................................................................................61
5.3.3. Heterogeneous Matrix ...............................................................................................62
5.4. Limitations ......................................................................................................................63
5.4.1. Landscape metrics .....................................................................................................64
5.4.2. Scale ..........................................................................................................................64
5.4.3. Community Vitality Criteria .....................................................................................65
5.5. Future Work ...................................................................................................................66
5.5.1. Landscape Metrics ....................................................................................................66

vi 5.5.2. Ecosystem Service Models .......................................................................................66
5.5.3. Neighbourhood vitality .............................................................................................67
5.6. Conclusion .......................................................................................................................67
Appendix – A: Strategy ...................................................................................................75
Appendix – B: Maps ........................................................................................................79
vii List of Figures
Figure 2-1: Growth Plan for the Greater Golden Horseshoe Area, 2006 .........................................................9 Figure 2-2: Abandoned structure at 70 Wyndham Road, Guelph, ON (Photo: M.Gatner) ...........................10 Figure 2-3: Former Northern Rubber Company, 120 Huron Street, Guelph, ON (Photo: M.Gatner)............11 Figure 2-4: Example of land use from remotely sensed data..........................................................................21 Figure 2-5: Forman's (1995) aggregate with outliers principle modified to urban environment....................22 Figure 2-6: Forman's four indispensable patterns for land planning modified to urban environment ...........22 Figure 2-7: River corridor anatomy (Illustration: M. Gatner) ........................................................................23 Figure 2-8: Illustrated applications of land use patterns supporting movement (Illustration: M. Gatner) .....24 Figure 2-9: Neighbourhood spatial adjacencies and interactions adapted from Hersperger (2006)
(Illustrated: M. Gatner) ...................................................................................................................................25 Figure 3-1: Overview of methodology for strategically selecting vacant lands to enhance ecological
function ...........................................................................................................................................................38 Figure 3-2: Site Location of Two Rivers Neighbourhood, Guelph, Ontario ..................................................30 Figure 3-3: Pattern 1.1 Vacant land adjacent to a wide/large riparian corridor..............................................33 Figure 3-4: Pattern 1.2 Vacant land adjacent to a narrow riparian corridor ...................................................34 Figure 3-5: Pattern 1.3 Vacant land within a floodplain.................................................................................34 Figure 3-6: Pattern 1.4 Vacant land adjacent to a floodplain..........................................................................34 Figure 3-7: Pattern 1.5 Vacant land adjacent to a terrestrial corridor.............................................................34 Figure 3-8: Pattern 1.6 Vacant land to eliminate a gap in the corridor...........................................................35 Figure 3-9: Pattern 1.7 Vacant land becomes a ‘stepping-stone’ in a fragmented corridor ...........................35 Figure 3-10: Pattern 2.1 Vacant land adjacent to vacant or green spaces.......................................................35 Figure 3-11: Pattern 2.2 Vacant land compact in shape with a substantial core.............................................35 Figure 3-12: Pattern 2.3 Vacant land parallel to corridor or large patch ........................................................36 Figure 3-13: Pattern 3.1 Vacant land is a small patch that could act as a stepping-stone in a void ...............36 Figure 3-14: Pattern 3.2 Vacant land capable of generating a ‘tiny patch’ boundary ....................................36 Figure 3-15: Comparison of map resolutions A) land cover and B) Natural Heritage Map and C) satellite
imagery ...........................................................................................................................................................38 Figure 4-1: Land Use Classifications of Vacant Land....................................................................................48 Figure 4-2: Gap in accessible existing green space within a 5-minute walk ..................................................51
Appendix – A: Strategy A- 1: Strategy for connectivity .......................................................................................................................76 A- 2: Strategy for large patches ......................................................................................................................77 A- 3: Strategy for heterogeneous matrix.........................................................................................................78
viii Appendix – B: Maps B - 1: Land cover and Natural Heritage elements...........................................................................................80 B - 2: Guelph Natural Heritage Strategy, Ecological Land Classifications....................................................90 B - 3: Land use aggregated classifications......................................................................................................82 B - 4: Land use and land cover aggregated classifications .............................................................................83 B - 5: Municipally-owned and groundtruthed vacancies ................................................................................84 B - 6: Vacant lots and existing land patterns ..................................................................................................85 B - 7: Strategic vacant lots to improve connectivity, Patterns 1.1-1.7............................................................86 B - 8: Strategic vacant lots to improve heterogeneity of matrix, Patterns 2.1-3.2.........................................87 B - 9: Low contrast vacancies, Pattern 4.1,.....................................................................................................88 B - 10: Low contrast vacancies and City of Guelph brownfields, Patterns 4.1 and 5. 1 ................................89 B - 11: Walkability to existing green spaces, 5 minute walk (400m).............................................................90 B - 12: Accessbility to fresh food ...................................................................................................................91 B - 13: Neighbourhood vitality potential, Pattern 6.1.....................................................................................92 B - 14: Final strategic vacant lots, Patterns 5.1 and 6.1..................................................................................93 B - 15: Ecological value ranking, pre-strategy ...............................................................................................94 B - 16: Ecological value ranking, post-strategy..............................................................................................95
ix List of Tables
Table 2-1: Number of Canadian urban centres experiencing negative growth, 2001-2006 .............................7 Table 3-1: Original Land Use Descriptions from DMTI Spatial Inc. .............................................................37 Table 3-2: Consolidation of Southern Ontario Land Cover Information System categories and Guelph
Ecoland (Natural Heritage) Categories ...........................................................................................................39 Table 3-3: LULC Classification Contrast Ranking, 1-Highest ecological value, 6 -Lowest ecological value
.........................................................................................................................................................................40 Table 3-4: Contrast rankings of LULC categories..........................................................................................50 Table 4-1: Existing Land Use Classifications and Areas................................................................................47 Table 4-2: Results of Connectivity Pattern Application in the Two Rivers Neighbourhood .........................49 Table 4-3: Low-contrast vacant lands selected for Pattern 6.1 ......................................................................52 Table 4-4: Total Area Identified by Strategic Patterns ...................................................................................53 Table 4-5: Summary of landscape metrics performed on pre- and post-strategy maps..................................54 Table 4-6: Mean Patch Shape Index and Euclidean Nearest-Neighbour Distance Metrics............................55 Table 4-7: Summary of Total Edge Contrast Index Values of Pre- and Post-strategy Application ...............56 Table 4-8: Summary Trends of Landscape Metric Indices.............................................................................57
1
Chapter 1. Introduction
Urbanized areas cover roughly 3% of the earth’s land surface, yet half the world’s
population (50.5%) lives within an urban centre; it is a growing trend that impacts
biodiversity, ecosystem functioning and services with effects extending beyond urban
boundaries (United Nations, 2011; Wu, Jenerette, Buyantuyev, & Redman, 2011).
Humans are attracted to nature, prefer to live near it and can benefit from its nearby
presence, yet methods of urban development degrade and diminish urban natural areas.
The degradation of the natural processes in cities has social, economic and ecological
implications. Research in urban ecology and health studies has revealed that patterns of
urban development used for decades are unsustainable within the watersheds cities
depend on (ASCE, 1998, as cited in; Environment Canada, 2008). These patterns are also
recognized as contributing to an increase in obesity, respiratory ailments, vehicular
mortality, increased stress and loss of social capital, as defined by the “social, political
and economic networks and interactions inspiring trust and reciprocity among citizens”
(Ontario College of Family Physicians, 2005, Vol. 1 p.5, Vol. 4 p.7). Walkable,
pedestrian-friendly neighbourhoods improve social capital and the Ontario College of
Family Physicians (2005) promotes easily accessible green spaces for recreation and
sense of community, recognizing the positive social and health benefits for
neighbourhood citizens.
Forman (1995) built an ecological framework of patterns for a ‘whole landscape’, and
outlined that nurturing a sustainable environment requires a plan to support ecological
integrity followed by human needs. The current state of urban ecological patterns and
processes is a reflection of applied planning that did not follow these principles, or
priorities.
“We seek a design language whose inspiration derives from making the most of available opportunities; one that re-establishes the concept of multi-functional, productive and working landscapes that integrate ecology, people and economy” (Hough, 2004, p. 31).
2
This work investigates the question: Can seizing opportunities to re-integrate vacant lands
into more sustainable, ecological land patterns at the neighbourhood scale effect positive
changes with respect to these ecological patterns? The objectives are to:
• Gain a more in-depth understanding of urbanization, urban ecology, landscape
ecology planning, and planning policies;
• Create a set of ecological principles for landscape assessment in the form of a
strategic decision-making tool;
• Apply the strategy to an urban neighbourhood re-integrating vacant lands into
improved ecological patterns, to improve their ecological processes; and
• Evaluate the outcome to determine if the strategy was successful, i.e., increased
patch size, re-establishment of a corridor, or more heterogeneity in the matrix.
This area-wide approach is experimental. Pilot studies done in the United States for
neighbourhood revitalization in the midst of high rates of vacancies focus primarily on
economic redevelopment and less so on reconstituting sustainable urban ecology
(Environmental Protection Agency, 2012). In Ontario, the Places to Grow Act is
attempting to curb the negative patterns of urbanisation, such as sprawl, with
intensification (Ministry of Infrastructure, 2012b); however, this increases built form in
urban centres and fills open space with more built form. With land costs representing a
significant proportion of all development costs, reducing lot size and intensifying urban
development is seen as a means to entice developers and provide more affordable
housing. The Canadian Mortgage and Housing Corporation (CMHC) indicates the
savings resulting from increased density through lot size and design can range from 5% to
25% (CMHC, 2012). These factors influencing intensification may lead to further
fragmentation of the landscape, replacing vegetated land cover with more impervious
land cover types.
Ecological design processes consider landscape position, multi-dimensional landscape
attributes such as presence of water, proximity to existing patches or corridors and
context of the surrounding built environment. Choice selection and re-purposing some of
3
these gaps and abandoned places to vegetated spaces that support ecological patterns is a
test of revitalizing concepts for urban neighbourhoods.
The literature review will provide a foundation for landscape ecology planning, important
ecological patterns and processes, and the impacts of urbanisation on them. This
foundation will inform the re-integration strategy by which vacant lands are chosen to
help reconstitute ecological patterns and support neighbourhood vitality. The new spatial
patterns produced by the strategy will be evaluated for improvement to the ecological
patterns. A discussion of the strategy, its impact and future considerations will conclude
the work.
4
Chapter 2. Literature Review
This chapter will provide a brief review of the process of urbanisation, the advent of
urban vacancies and decay, and their effects on people and urban ecology including its
patterns and processes.
2.1. Urbanisation Urbanisation is a complex process by which a country's organized communities become
larger, more specialized and more interdependent (Artibise & Stelter, 2011). In the
Canadian context:
• Eighty percent of the Canadian population lives in an urban centre (defined by a
minimum population concentration of 1,000 people and a population density of at
least 400 per square kilometre) (HRSDC Canada, 2011)
• Urban growth was 5.4% between the years 2001-2006 (an average 1.1% per
annum) while the rural population increased at 2.7% (Statistics Canada, 2008)
• Urban growth is predicted to continue at this rate until 2025 arriving at a projected
32,065,000 people living in Canadian urban centres, approximately 83% of the
national population (United Nations, 2011).
The recent census and projections imply future urban growth will be disproportionate to
rural population growth. The population shift from rural to urban centres fuels urban
development and results in increased stress on local and regional resources and urban
infrastructure.
Cities accommodate population growth by two urbanisation processes: urban boundary
growth (sprawl) and urban intensification.
2.1.1. Urban sprawl
Urban sprawl is defined as growth that is: low density, uncoordinated, and with spatially
segregated land uses (e.g., homogenous single family residential development; shopping
centres, retail and services; freestanding industrial areas) (Gayda et al., 2005). Current
5
policies to ensure the curb of urban sprawl are settlement area boundaries such as those
outlined in the Greater Golden Horseshoe Plan which allows expansion only under certain
criteria, following a municipal review (Ministry of Infrastructure, 2012b).
Pauleit and Breuste (2011) noted changes in the land use as a result of sprawl in European
Union cities (i.e., Brussels, Bristol, Helsinki, Milan, Rennes and Stuttgart), which seem to
be reflected in the Canadian context. Their observations include that:
• Commercial and industrial areas have extended at a faster rate than residential
areas, which results in large lot brownfields on the fringe of the city.
• Green urban areas have grown on the fringe but declined in the urban core areas.
Parks are planned for suburban developments, but due to the value of land in the
urban core, vacant lots are re-used for housing development.
Both urban and suburban sprawl must be managed effectively for a city to be considered
sustainable. Suburban growth, synonymous in many cases with greenfield use, is
favourable due to the failure of the market to fully account for the costs associated with
suburban development. While there may be land vacant within the urban core, subsidies
to spur economic growth ease the initial cost of suburban development. Low density,
spatially segregated development is not sustainable due to negative effects such as:
• Consumption of land, loss of high quality agricultural land and open space
• Destruction of biotopes and fragmentation of ecosystems
• Higher costs of new neighbourhood infrastructures
• Land use patterns which are unfavourable to the development of collective and
other sustainable transport modes; hence, increased use of the private car
• Increased trip lengths
• Increase in fuel consumption
• Increase in air pollution
• Contribution to the decay of downtown areas, known as the ‘hollowing out’ effect
(Gayda et al., 2005)
6
The metropolitan area of Toronto is an example where individuals left the urban core, and
industries migrated out of the city to peripheral greenfield areas since the mid-1970s
leaving the urban centre with innumerable under-utilized or vacant industrial sites
(Gertler, 1995). Land further from the urban core is less costly and appealing to large
factory-type businesses that necessitate a large horizontal footprint. When greenfields on
the periphery are developed, the result is an outmigration of jobs, people and loss of open
land at the periphery. Employment is growing faster in locations farther away from the
core metropolitan cities as a result of the shift of manufacturing as well as retail trade
activities from the core to the suburbs (Heisz & LaRochelle-Côté, 2005). In the years
between 1996-2001, the percentage of jobs in Montreal within a 5 km radius of the core
decreased from 13.8% to 10.2%, resulting in 8,600 jobs leaving the core; in Toronto, an
additional 208,300 workers commuted to locations more than 20km away from the city
centre (Heisz & LaRochelle-Côté, 2005). The continued shift to the suburbs caused an
increase in suburban traffic, but public transit ridership remained steady over the same
time period. The Ontario College of Family Physicians recently linked the patterns
associated with urban sprawl (i.e., increased car usage, decreased exercise) to respiratory
conditions such as asthma, cardiovascular disease, lung cancer, negative effects on
pregnancy and birth defects (Ontario College of Family Physicians, 2005). The
outmigration to suburban areas also resulted in increased vacancies in the core, creating a
sense of decay in the inner city.
2.1.2. Intensification
Intensification is the process of re-using vacant urban or under-used land, reducing lot
size and/or redeveloping to increase density in a city centre. The goals are to:
• Decrease agricultural land encroachment,
• Reduce the cost of public infrastructure
• Reduce urban sprawl and
• Revitalize existing urban areas (Bunce, 2004)
Shrinking cities or cities experiencing a ‘hollowing out’ of the urban centre while the
footprint of the city remains the same are the focus of intensification efforts. These cities
7
or sections of them have experienced a long-term trend of population loss as well as the
decline or loss of a significant industry (LaCroix, 2010). According to Canadian census
data gathered in 2001 and 2006, 48% of Canadian urban centres are shrinking (Statistics
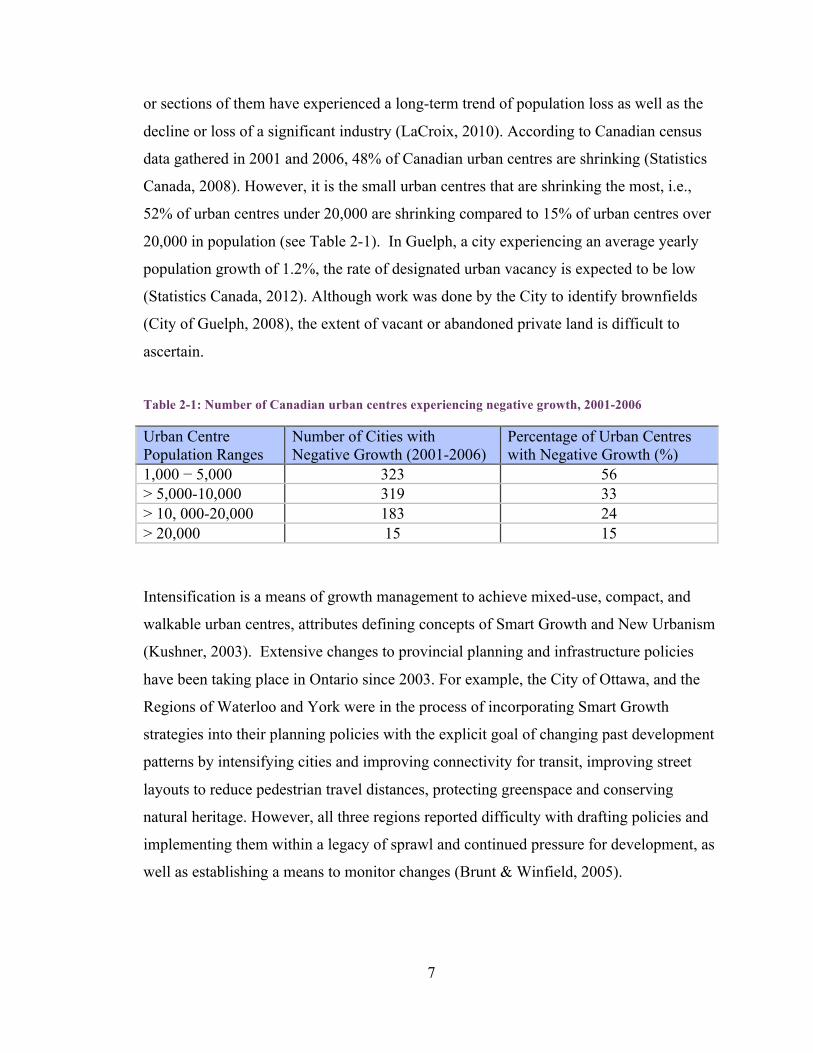
Canada, 2008). However, it is the small urban centres that are shrinking the most, i.e.,
52% of urban centres under 20,000 are shrinking compared to 15% of urban centres over
20,000 in population (see Table 2-1). In Guelph, a city experiencing an average yearly
population growth of 1.2%, the rate of designated urban vacancy is expected to be low
(Statistics Canada, 2012). Although work was done by the City to identify brownfields
(City of Guelph, 2008), the extent of vacant or abandoned private land is difficult to
ascertain.
Table 2-1: Number of Canadian urban centres experiencing negative growth, 2001-2006
Urban Centre Population Ranges
Number of Cities with Negative Growth (2001-2006)
Percentage of Urban Centres with Negative Growth (%)
1,000 − 5,000 323 56 > 5,000-10,000 319 33 > 10, 000-20,000 183 24 > 20,000 15 15 Intensification is a means of growth management to achieve mixed-use, compact, and
walkable urban centres, attributes defining concepts of Smart Growth and New Urbanism
(Kushner, 2003). Extensive changes to provincial planning and infrastructure policies
have been taking place in Ontario since 2003. For example, the City of Ottawa, and the
Regions of Waterloo and York were in the process of incorporating Smart Growth
strategies into their planning policies with the explicit goal of changing past development
patterns by intensifying cities and improving connectivity for transit, improving street
layouts to reduce pedestrian travel distances, protecting greenspace and conserving
natural heritage. However, all three regions reported difficulty with drafting policies and
implementing them within a legacy of sprawl and continued pressure for development, as
well as establishing a means to monitor changes (Brunt & Winfield, 2005).
8
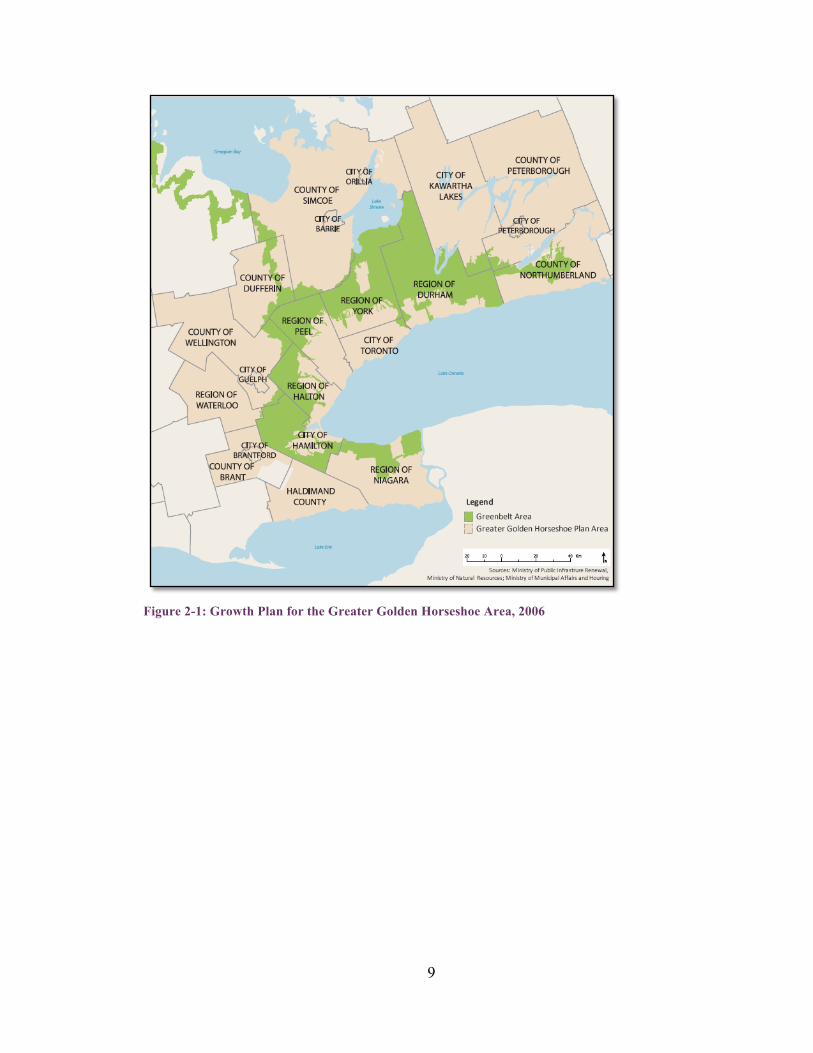
On June 13, 2005, the Places to Grow Act, embodying Smart Growth principles, was
enacted in Ontario to effectively manage growth. The Act mandates the Ministry of
Infrastructure to prepare regional growth plans to establish density targets and planning
priorities for compact, sustainable urban communities province-wide. The first Growth
Plan, released in November 2005, was created for the Greater Golden Horseshoe (GGH)
area, which includes the city of Guelph (Figure 2-1) (Ministry of Infrastructure, 2012b).
The plan establishes specific density targets and planning priorities for managing growth
in the region including through intensification of GGH cities. Efforts are being made
toward more sustainable growth patterns but planning policy change is slow.
As of February 2012, all 19 upper- and single-tier municipalities in the GGH area have
adopted amendments to conform to the Growth Plan; however, only six municipalities,
Guelph included, had their plans completely in effect. The remainder are still going
through the approval process (Ministry of Infrastructure, 2012a).
9
Figure 2-1: Growth Plan for the Greater Golden Horseshoe Area, 2006
10
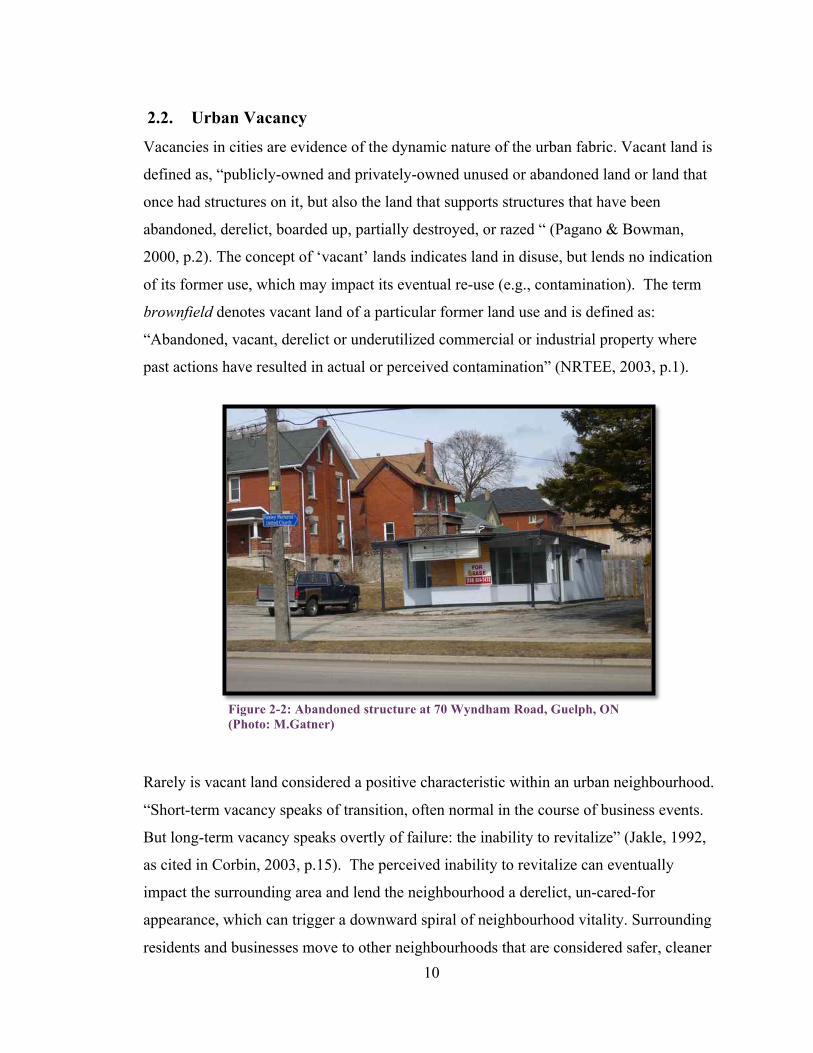
2.2. Urban Vacancy
Vacancies in cities are evidence of the dynamic nature of the urban fabric. Vacant land is
defined as, “publicly-owned and privately-owned unused or abandoned land or land that
once had structures on it, but also the land that supports structures that have been
abandoned, derelict, boarded up, partially destroyed, or razed “ (Pagano & Bowman,
2000, p.2). The concept of ‘vacant’ lands indicates land in disuse, but lends no indication
of its former use, which may impact its eventual re-use (e.g., contamination). The term
brownfield denotes vacant land of a particular former land use and is defined as:
“Abandoned, vacant, derelict or underutilized commercial or industrial property where
past actions have resulted in actual or perceived contamination” (NRTEE, 2003, p.1).
Figure 2-2: Abandoned structure at 70 Wyndham Road, Guelph, ON (Photo: M.Gatner)
Rarely is vacant land considered a positive characteristic within an urban neighbourhood.
“Short-term vacancy speaks of transition, often normal in the course of business events.
But long-term vacancy speaks overtly of failure: the inability to revitalize” (Jakle, 1992,
as cited in Corbin, 2003, p.15). The perceived inability to revitalize can eventually
impact the surrounding area and lend the neighbourhood a derelict, un-cared-for
appearance, which can trigger a downward spiral of neighbourhood vitality. Surrounding
residents and businesses move to other neighbourhoods that are considered safer, cleaner
11
and more economically sound, causing out-migration and further reduction in municipal
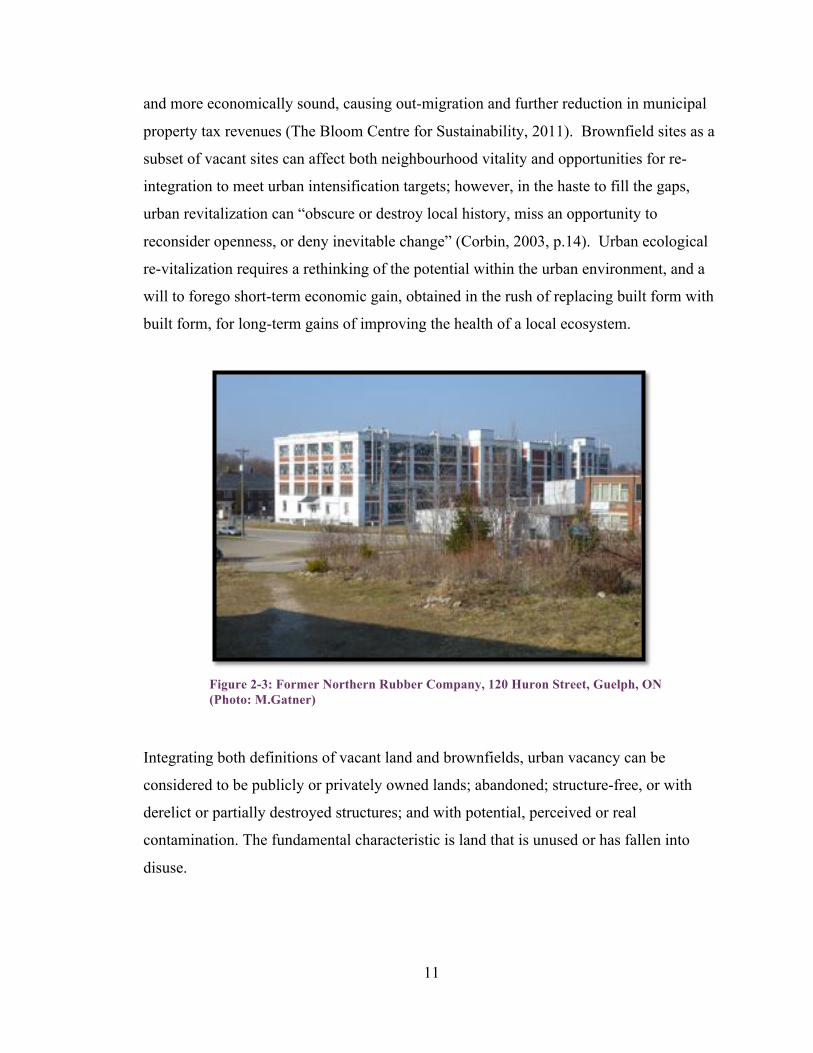
property tax revenues (The Bloom Centre for Sustainability, 2011). Brownfield sites as a
subset of vacant sites can affect both neighbourhood vitality and opportunities for re-
integration to meet urban intensification targets; however, in the haste to fill the gaps,
urban revitalization can “obscure or destroy local history, miss an opportunity to
reconsider openness, or deny inevitable change” (Corbin, 2003, p.14). Urban ecological
re-vitalization requires a rethinking of the potential within the urban environment, and a
will to forego short-term economic gain, obtained in the rush of replacing built form with
built form, for long-term gains of improving the health of a local ecosystem.
Figure 2-3: Former Northern Rubber Company, 120 Huron Street, Guelph, ON (Photo: M.Gatner)
Integrating both definitions of vacant land and brownfields, urban vacancy can be
considered to be publicly or privately owned lands; abandoned; structure-free, or with
derelict or partially destroyed structures; and with potential, perceived or real
contamination. The fundamental characteristic is land that is unused or has fallen into
disuse.
12
2.3. Impacts of Urbanisation Urbanization is a “complex process in which a country's organized communities become
larger, more specialized and more interdependent” (Artibise & Stelter, 2011). The process
by which urban centres develop has great impacts on the immediate and surrounding
environment. The change in land pattern and function of the urban land causes many
changes in urban ecosystem as a result of urbanisation. Although urbanized areas cover
only about 3% of the earth’s land surface, they impact biodiversity, ecosystem
functioning and services effects which extend beyond urban boundaries (Wu, Jenerette,
Buyantuyev, & Redman, 2011).
The field of urban ecology has evolved from its roots in landscape ecology and planning,
which are part of an interdisciplinary field with biological, physical and social science
components (Ahern, 1997). It is a way of directing or managing change in the landscape
to bring human action in tune with natural processes (Thompson & Steiner, 1997) and, as
such, it naturally encompasses the concept of sustainability that the Brundtland
Commission report defined as, “development that meets the needs of the present without
compromising the ability of future generations to meet their own needs” (United Nations:
Report of the World Commission on Environment and Development, 1987, p.1). The rise
in interest and research in urban ecology is a response to the steady increase in
urbanization. It is an increase of interest and understanding of the connections between
people’s health and well-being and their interaction with the natural world and the
realization that the ecology in urban areas is different than other systems (Gaston, 2010).
The following subsections describe some of the impacts of urbanization on habitat, water
and human well-being.
2.3.1. Habitat
Habitat is defined as the “place or environment where a plant or animal naturally or
normally lives and grows” (Merriam-Webster Dictionary, 2012). Urbanisation affects
nearly all ecological patterns and processes by fragmenting ecosystems (Forman, 1995).
It is considered one of the greatest threats to biodiversity and occurs via loss of original
13
habitat (attrition), reduction in patch size (shrinkage) and increasing isolation of patches
(Botequilha Leitão & Ahern, 2002).
Urban vegetation exists in patches of habitat (including vacant lots) and, due to
fragmentation, these patches are isolated within an urban matrix (Dunn & Heneghan,
2011). This vegetation likely grows under biological, chemical and physical stress. In
some cases, it is only spontaneous growth in extreme habitats (i.e., vacant lots with
mostly impervious surfaces) but still diverse and layered. Its presence, however, provides
the urban environment with noise abatement, canopy cover, sequestration of atmospheric
pollutants, and habitat for biodiversity (Dunn & Heneghan, 2011).
High-density residential and commercial built environments that dominate the urban
landscape cause some of the following habitat impacts:
• Fragmentation of urban habitat patches
• Occurrence of many transient habitats
• Habitats with extreme environmental conditions (i.e., devoid of vegetation)
• Invasion by non-native species of flora and fauna
• Climate conditions that buffers the environment from extremes
• Direct or indirect disturbances resulting from human activity Arrested and
managed succession (mowing), and
• Varied or particularly rich food supply
(Forman & Godron, 1986; Hough, 2004; Young, Jarvis, Hooper, & Trueman,
2008; Pauleit & Breuste, 2011)
14
(C) (D)
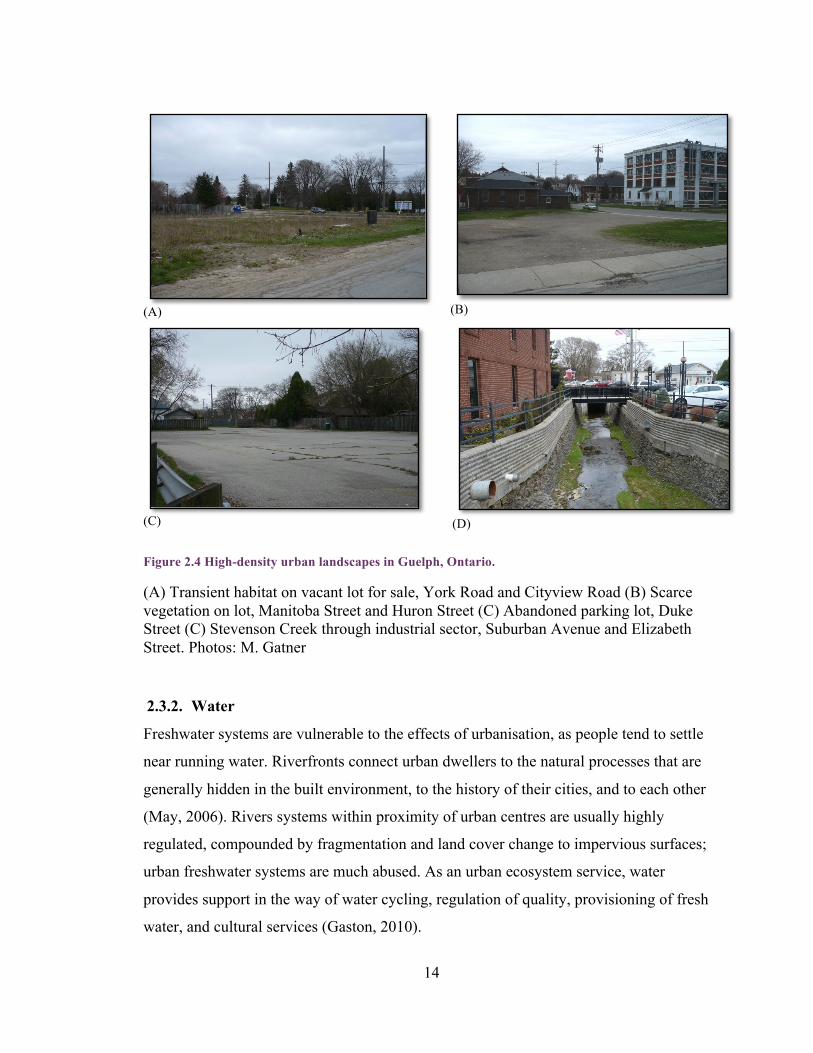
Figure 2.4 High-density urban landscapes in Guelph, Ontario.
(A) Transient habitat on vacant lot for sale, York Road and Cityview Road (B) Scarce vegetation on lot, Manitoba Street and Huron Street (C) Abandoned parking lot, Duke Street (C) Stevenson Creek through industrial sector, Suburban Avenue and Elizabeth Street. Photos: M. Gatner
2.3.2. Water
Freshwater systems are vulnerable to the effects of urbanisation, as people tend to settle
near running water. Riverfronts connect urban dwellers to the natural processes that are
generally hidden in the built environment, to the history of their cities, and to each other
(May, 2006). Rivers systems within proximity of urban centres are usually highly
regulated, compounded by fragmentation and land cover change to impervious surfaces;
urban freshwater systems are much abused. As an urban ecosystem service, water
provides support in the way of water cycling, regulation of quality, provisioning of fresh
water, and cultural services (Gaston, 2010).
(A) (B)
15
Impervious surfaces are major contributors to the environmental impacts of urbanization
(Arnold Jr. & Gibbons, 1996). Soil absorbs water, acting as conduit for groundwater
recharge thus filtering stormwater runoff, but when it is sealed this ecosystem service is
no longer available (Marshall & Shortle, 2005). Contaminants are washed off impervious
surfaces of the urban landscape by stormwater runoff, and are carried either directly or
indirectly into waterways or groundwater; this is called non-point source pollution
(Arnold Jr. & Gibbons, 1996). Impervious surfaces are major contributors to a collection
of symptoms grouped under the term “urban stream syndrome”, causing effects on
streams that include:
• Flashier hydrograph – more frequent and larger flow events with increased
magnitude of high flow and decreased time to peak flow, causing more flooding
and erosion (Walsh et al., 2005).
• Elevated concentration of contaminants and nutrients (Walsh et al., 2005)
• Deforestation along riparian corridors leads to an increase in stream temperature
thus changing the biota of the stream, and resulting in a overall loss of
aquatic/riparian fauna and habitat (Schueler, 1995).
In the effort to restore function, the focus is on restoring pattern. Hydrologic restoration
efforts focus on hydrologic connectivity, which is defined as “water-mediated transfer of
matter, energy and/or organisms within or between elements of the hydrologic cycle”
(Pringle, 2003, p.2685).
Hydrologic connectivity is considered essential to the ecological integrity of the
landscape, and reduction or enhancement of this property by humans can have major
negative environmental effects (Pringle, 2003). Anthropogenic effects on urban
hydrology are causing the destruction of watershed integrity, which exacerbates growing
water quality and quantity issues. Twenty-six percent of Canadian municipalities
experienced water shortages between 1994-1999; chief among the reasons included
seasonal shortages due to drought, infrastructure problems, and increased consumption
(Environment Canada, 2001). From 2007-2009, 206 Canadian municipalities
16
(representing 33% of the total responding population of 20.4 million, approximately
affecting 7 million individuals) indicated they experienced a water quality problem
(Environment Canada, 2011).
The Canadian situation is summed up in the following: “It is now recognized that current
practices of urban development are not environmentally sustainable with respect to
receiving water quality and ecosystem integrity, when assessed on watershed and long-
term bases” (Environment Canada, 2008)
2.3.3. Human Well-being
‘Biophilia’, meaning the “love of life or living systems” (Fromm, 1964, as cited in;
Simaika & Samways, 2010) refers to the psychological tendency in humans to be
attracted to nature. Contact with nature has a positive effect on an individual’s
psychological and physical health; it is reported to reduce stress, improve attention, aid
mental restoration, and result in increased longevity (Grinde & Patil, 2009).
A theory proposed by Kahn (2002) suggests the long-term effect of degradation of nature
in cities results in the slow erosion of a sense of urban nature and what is considered
“normal”. Environmental generational amnesia phenomenon is defined as follows:
“People take the natural environment they encounter during childhood as the norm against which they measure environmental degradation later in their lives. With each ensuing generation, the amount of environmental degradation increases, but each generation in its youth takes that degraded condition as the non-degraded condition – as the normal experience” (Kahn, 2002, p.106).
The loss of natural areas in urban centres result in the progressive loss of our connection
with nature, one that is being proven vital to our well-being. There is a social response to
the fragmentation of our habitat. Naturalness, or vegetative presence, is a principal
component of neighbourhood attachment and is a factor affecting use of space and
informal social contact among neighbours (Hur, Nasar, & Chun, 2010). Small patches of
semi-natural areas in the urban landscape are known to increase landscape preference and
17
residential value (Halton Region, 2011; Heerwagen & Orians, 1993), and contribute to
the well-being of local residents (Di Giulio, Holderegger, & Tobias, 2009).
The resurgence of the traditional neighbourhood unit in New Urbanist principles, is a
response to the negative effects of urbanisation, sprawl in particular. These principles
form a planning concept outlining a pedestrian-centred, mixed-use neighbourhood with
size limits permitting the majority of its residents live within a five- minute walk (400
m.) to the town centre, and its basic services (Congress for the New Urbanism, 2001;
Sustainable Community Research Group, 2012). The New Urbanist movement supports
the restoration of urban neighbourhoods to provide a higher quality of life, while
respecting the natural environment (Congress for the New Urbanism, 2001). The Places
to Grow Act echoes some of these compact, walkable principles as a means to curb the
negative effects sprawl on the environment and its citizens.
2.4. Opportunities within Urban Vacancies In Ontario, vacant properties are assessed at significantly lower tax rates than occupied
ones (Ministry of Municipal Affairs and Housing, 2004). Thus brownfield properties
reduce the local tax assessment base and represent lost revenue potential for
municipalities. Many cities within Canada have developed brownfield plans to focus
development efforts on these vacancies, providing economic incentives and grants for
developers in an attempt to reduce barriers to redevelopment (City of Guelph, 2008; City
of Ottawa, 2007; City of Toronto, 2008). The redevelopment of urban vacancies is seen
as seizing economic opportunities and secondarily as tied to sustainability of a city, by
offsetting urban sprawl.
An example of a larger Canadian city, Guelph has addressed brownfields in the urban
policy framework of the “City of Guelph Brownfield Redevelopment Community
Improvement Plan”, which has as objectives to stimulate private sector investment for
brownfield site development by reducing financial and procedural burdens from
environmental assessments, potentially costly remediation and taxation concerns, and
18
facilitate the redevelopment/re-use of municipally-owned brownfield sites (City of
Guelph, 2008).
In Canada, many numbers regarding brownfield extent and urban vacancies are estimates.
The number of brownfields is estimated at 30,000; in the United States, estimates are in
excess of 450,000 brownfield sites; in Europe some of the highest estimated numbers are
in Germany with 362,000 sites and in France with 200,000 sites (De Sousa, 2003; EPA,
2011; Oliver, Ferber, Grimski, Millar, & Nathanail, 2005). There is no national database
in Canada listing brownfields and information on vacant land is difficult to obtain. In
Ontario, change of land use will trigger a legal requirement under Ontario Regulation
153/04 to register a Record of Site condition in the Environmental Site Registry;
however, this is only if the land use changes from a ‘less sensitive’ to a ‘more sensitive’
usage, i.e., from industrial to residential usage (Ministry of Environment, 2011).
Therefore during the development of the Guelph’s Brownfield Strategy, the city had to
take an accounting of all their brownfields. Of the 175 brownfield sites within city
boundaries, the City felt that the cost of clean up for 60 to 80% of these is likely
prohibitive unless incentives are in place (City of Guelph, 2008). In a further 10-20% the
cost of traditional remediation would likely prohibit private sector investment regardless
of incentives (City of Guelph, 2008), likely resulting in long-term, idle land in the urban
core.
Other Canadian cities such as Ottawa and Toronto have similar concerns for the re-use of
brownfields. De Sousa (2003) investigated an alternative direction of vacant land
redevelopment and revealed the benefits and barriers to the greening of brownfields. He
suggests redevelopment of brownfields into parks or open space could:
• Improve the social well-being of city residents in a variety of ways (e.g., in crime
reduction, business enhancement and improved well being, i.e., stress reduction)
• Improve environmental quality (e.g., air, water, microclimates), restore natural
habitats, enhance recreational opportunities, and enhance urban appearance
• Reduce costs related to urban sprawl and infrastructure provision; attract
investment, raise property values and invigorate local economies; boost tourism;
19
preserve farmland; prevent flood damage; and safeguard environmental quality
generally.
Given such consideration, vacant lands in urban centres could provide opportunities for
both economic and ecological gain. In the United States a survey of 244 cities revealed
only 4% to 5% of all brownfield projects resulted in green space and recreation
redevelopment, in England 37% of brownfields were converted between 1988-1992, and
in Scotland 21% between 1993 and 2002 (De Sousa, 2004).
In the United States, as a result of the brownfield crisis, the Environmental Protection
Agency (EPA) is supporting alternative approaches to brownfield redevelopment. The
“Brownfields Area-Wide Planning Pilot Program” is a partnership started in 2010 with
the EPA and Sustainable Communities (Department of Housing and Development) and
the Office of Transportation offering grants of $175,000 to 23 communities affected by
brownfields. The programme “recognizes that revitalization of the area surrounding the
brownfield site(s) is just as critical to the successful reuse of the property as assessment,
cleanup, and redevelopment of an individual site” (Environmental Protection Agency,
2012). Many of the areas in question comprise one or more neighbourhoods but the
common denominator is usually a post-industrial neighbourhood with low-valued housing
and high incidence of brownfields. The main purpose of the fund is economic renewal via
removal of hazardous brownfields and creation of affordable housing; however, in some
cases, the context of the area has seen recipients use the funding to reconstitute ecological
patterns. One such example is the Blue Greenway in San Francisco, a 13-mile corridor
along the city’s Southeastern waterfront and the historical industrial heart of the city. The
funding supported the generation of an area-wide revitalization plan and community
involvement in the process. The plan included creek restoration, creation of open green
space, a trail system and increased public access to water.
The importance of mitigating and potentially reversing some of the effects of urbanisation
in support of ecosystem functions, coupled with the amenity value of green space and its
effect on human well-being, support this novel approach to vacant land re-use. Re-
integration of these abandoned lands can be as a result of ad-hoc steps (i.e. individual site
20
redevelopment) or as a planned approach to reviewing all vacant lands within a given area
in a holistic manner.
2.5. Patterns Suitable For Strategic Re-Integration Vacant Land
2.5.1. Sustainability and Resilience
A key component of sustainability is adaptability, “the pliable capacity permitting a
system to become modified in response to a disturbance” (Forman, 1995, p.502) or to
changing internal and external processes (Pickett, Cadenasso, & Grove, 2004). This
ability to adapt is also known as resilience and within an urban system it depends on the
city’s ability to maintain ecological and human functions simultaneously (Alberti et al.,
2003); to “adapt to the economic, social, and physical stresses it will face as it
confronts the challenges of increasing energy scarcity, climate change, and population
change” (Applegath, 2012). Building resiliency and sustainability are intertwined goals
with similar planning guidelines (e.g., neighbourhoods conserving and enhancing natural
areas, conserving areas of environmental significance and place making within cities by
creating vibrant pedestrian-friendly neighbourhoods where amenities are accessible
within walking distance (Applegath, 2012). It would seem the fundamental key to a
resilient, sustainable city is a well-functioning ecosystem that has a capacity to absorb
stresses. To maintain ecological function, a system must possess ecological integrity,
which means to have near-natural conditions of productivity (e.g., plant productivity),
biodiversity (e.g., number of native species), soil quality (amount of erosion) and
hydrologic regimes (Forman, 1995). However, Perlman & Milder (2005) take a more
moderate approach of ‘ecological health’ given the context of urban centres, suggesting
that where development occurs the guiding principle is avoidance of permanent negative
impacts on a site or degrading the healthy periphery. Unfortunately, cities are converting
natural ecosystems and remove large portions of the productivity of its ecosystems, which
threatens ecosystem functions and ecological services well beyond the city boundaries.
Instead cities should work toward the goal of providing the benefits of dense living
centres without compromising ecology services or ecosystem health (Su, Fath, & Yang,
2010).
21
2.5.2. Landscape Pattern and Process
The main goal of studying landscape pattern is to understand its relationship with
ecological properties and processes (Wu & Hobbs, 2002). The works mentioned in this
section guide land use planning founded on ecological knowledge to sustain ecological
function in the environment.
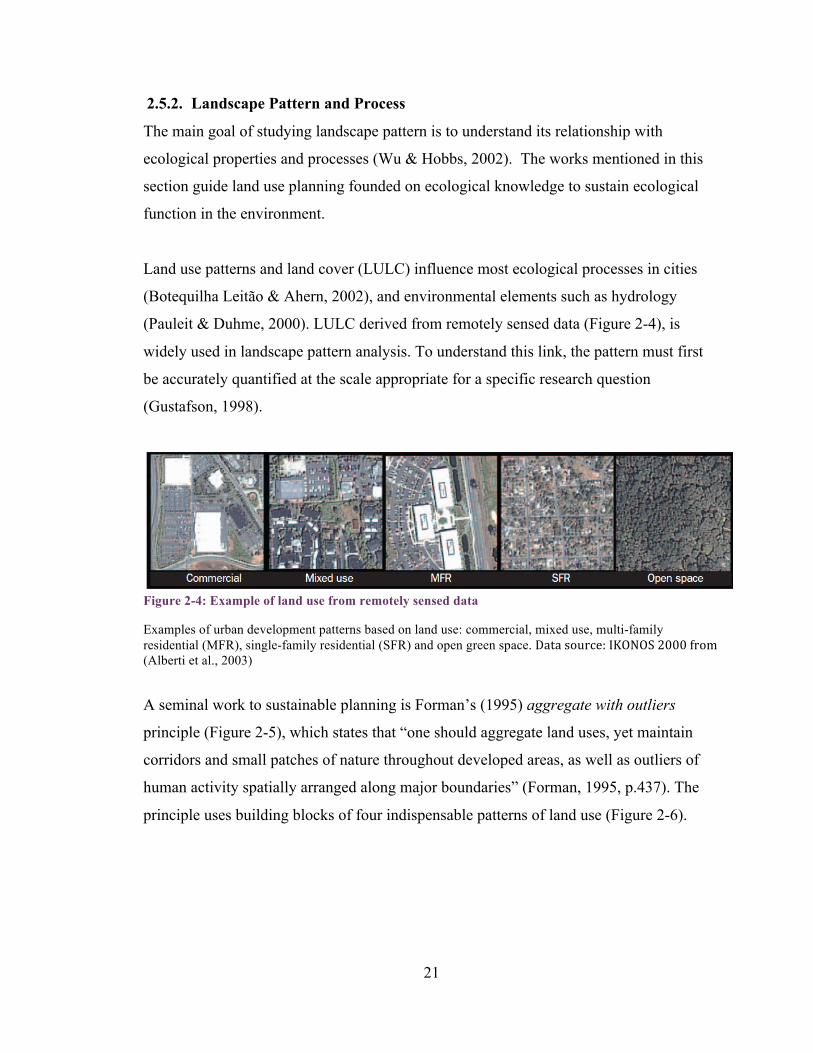
Land use patterns and land cover (LULC) influence most ecological processes in cities
(Botequilha Leitão & Ahern, 2002), and environmental elements such as hydrology
(Pauleit & Duhme, 2000). LULC derived from remotely sensed data (Figure 2-4), is
widely used in landscape pattern analysis. To understand this link, the pattern must first
be accurately quantified at the scale appropriate for a specific research question
(Gustafson, 1998).
Figure 2-4: Example of land use from remotely sensed data
Examples of urban development patterns based on land use: commercial, mixed use, multi-family residential (MFR), single-family residential (SFR) and open green space. Data source: IKONOS 2000 from (Alberti et al., 2003)
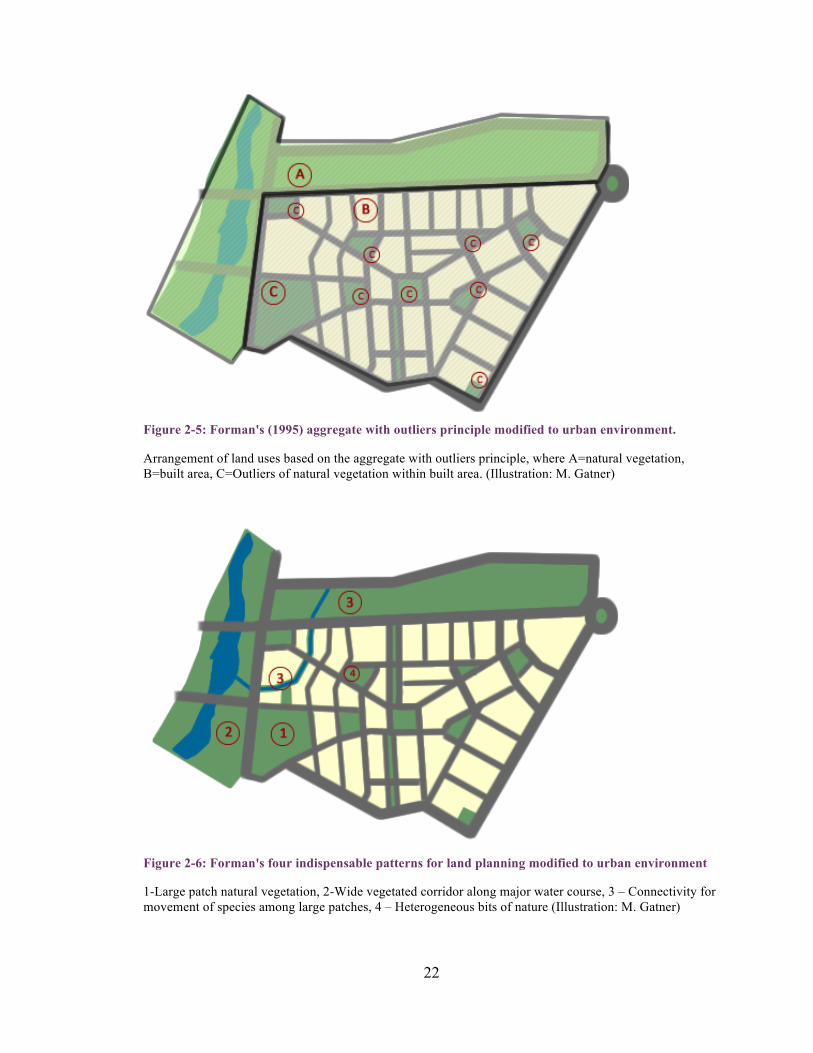
A seminal work to sustainable planning is Forman’s (1995) aggregate with outliers
principle (Figure 2-5), which states that “one should aggregate land uses, yet maintain
corridors and small patches of nature throughout developed areas, as well as outliers of
human activity spatially arranged along major boundaries” (Forman, 1995, p.437). The
principle uses building blocks of four indispensable patterns of land use (Figure 2-6).
22
Figure 2-5: Forman's (1995) aggregate with outliers principle modified to urban environment.
Arrangement of land uses based on the aggregate with outliers principle, where A=natural vegetation, B=built area, C=Outliers of natural vegetation within built area. (Illustration: M. Gatner)
Figure 2-6: Forman's four indispensable patterns for land planning modified to urban environment
1-Large patch natural vegetation, 2-Wide vegetated corridor along major water course, 3 – Connectivity for movement of species among large patches, 4 – Heterogeneous bits of nature (Illustration: M. Gatner)
23
Four indispensable patterns considered priority components to any sustainable land plan:
1. A few large patches of natural vegetation
These larges patches can provide:
a. Water quality protection, due to large area of pervious land cover. Water
will infiltrate, be filtered and help recharge the water table.
b. Core habitat to sustain populations of patch interior species, enriching
biodiversity (Forman, 1995).
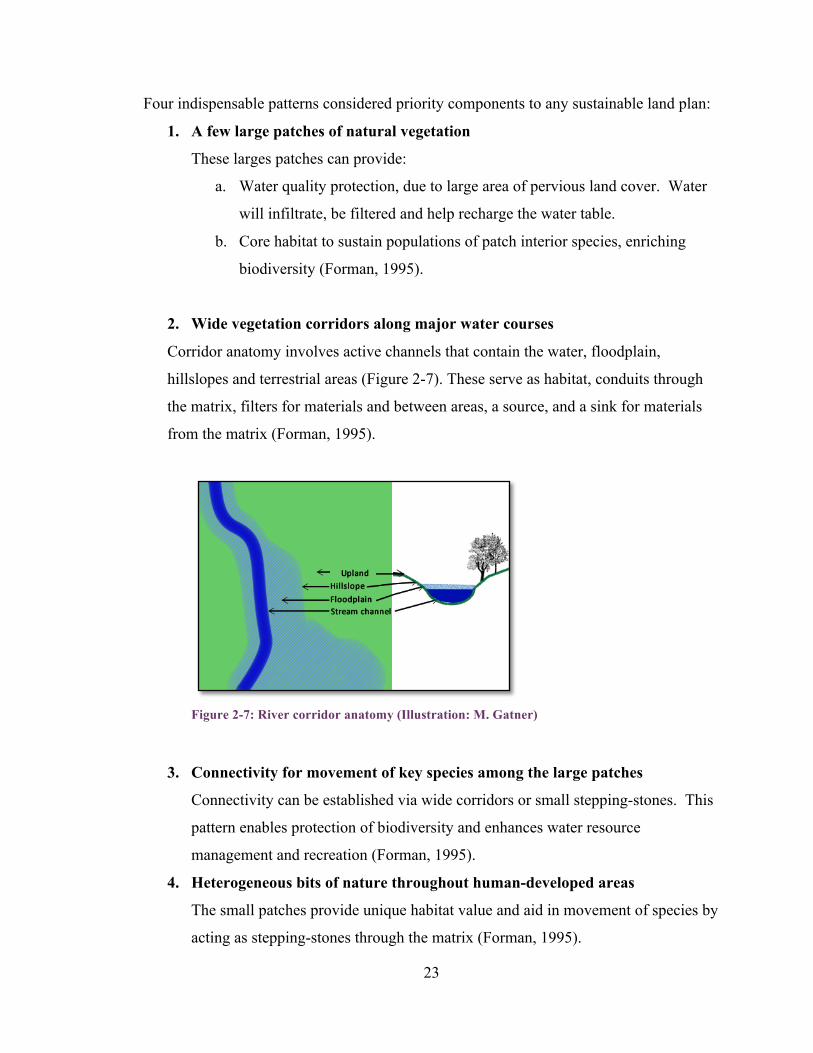
2. Wide vegetation corridors along major water courses
Corridor anatomy involves active channels that contain the water, floodplain,
hillslopes and terrestrial areas (Figure 2-7). These serve as habitat, conduits through
the matrix, filters for materials and between areas, a source, and a sink for materials
from the matrix (Forman, 1995).
Figure 2-7: River corridor anatomy (Illustration: M. Gatner)
3. Connectivity for movement of key species among the large patches
Connectivity can be established via wide corridors or small stepping-stones. This
pattern enables protection of biodiversity and enhances water resource
management and recreation (Forman, 1995).
4. Heterogeneous bits of nature throughout human-developed areas
The small patches provide unique habitat value and aid in movement of species by
acting as stepping-stones through the matrix (Forman, 1995).
24
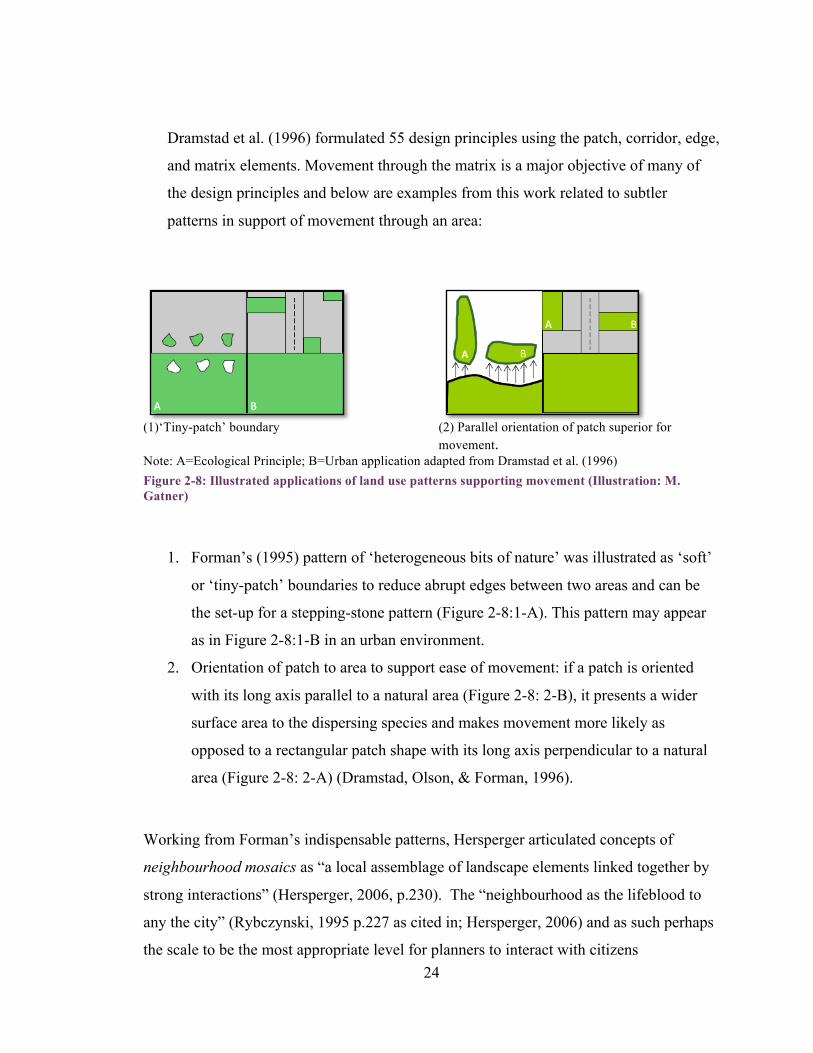
Dramstad et al. (1996) formulated 55 design principles using the patch, corridor, edge,
and matrix elements. Movement through the matrix is a major objective of many of
the design principles and below are examples from this work related to subtler
patterns in support of movement through an area:
(1)‘Tiny-patch’ boundary
(2) Parallel orientation of patch superior for movement.
Note: A=Ecological Principle; B=Urban application adapted from Dramstad et al. (1996) Figure 2-8: Illustrated applications of land use patterns supporting movement (Illustration: M. Gatner)
1. Forman’s (1995) pattern of ‘heterogeneous bits of nature’ was illustrated as ‘soft’
or ‘tiny-patch’ boundaries to reduce abrupt edges between two areas and can be
the set-up for a stepping-stone pattern (Figure 2-8:1-A). This pattern may appear
as in Figure 2-8:1-B in an urban environment.
2. Orientation of patch to area to support ease of movement: if a patch is oriented
with its long axis parallel to a natural area (Figure 2-8: 2-B), it presents a wider
surface area to the dispersing species and makes movement more likely as
opposed to a rectangular patch shape with its long axis perpendicular to a natural
area (Figure 2-8: 2-A) (Dramstad, Olson, & Forman, 1996).
Working from Forman’s indispensable patterns, Hersperger articulated concepts of
neighbourhood mosaics as “a local assemblage of landscape elements linked together by
strong interactions” (Hersperger, 2006, p.230). The “neighbourhood as the lifeblood to
any the city” (Rybczynski, 1995 p.227 as cited in; Hersperger, 2006) and as such perhaps
the scale to be the most appropriate level for planners to interact with citizens
25
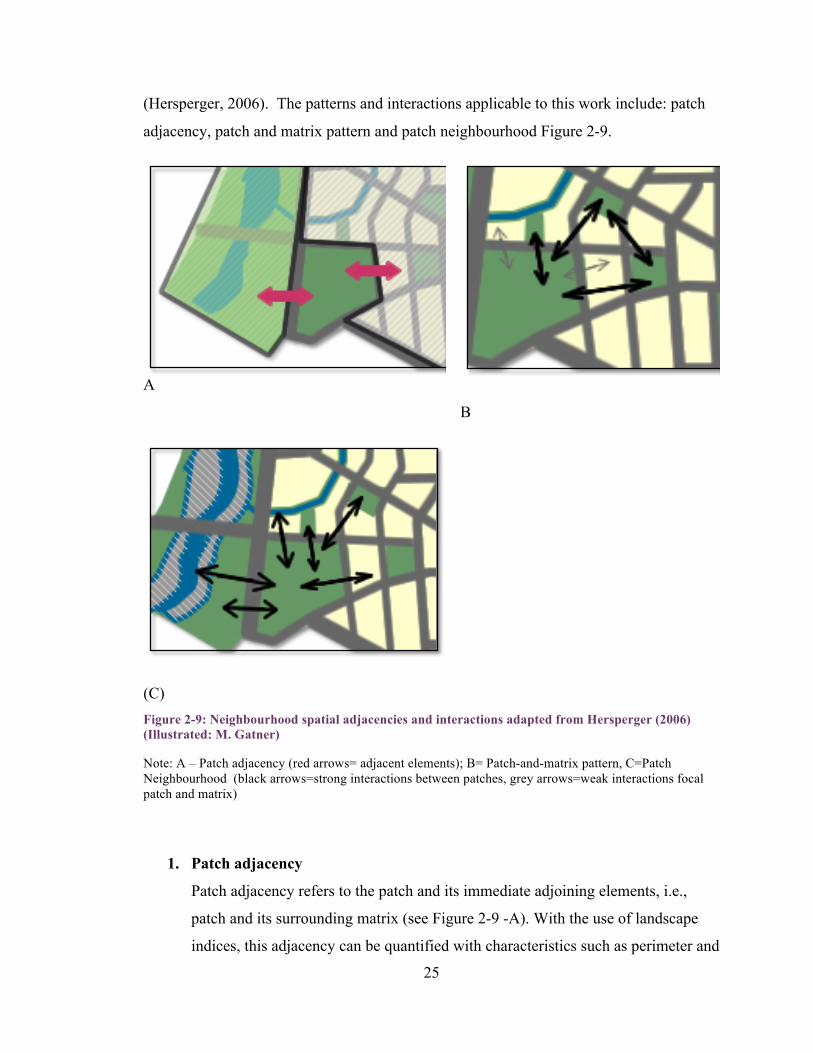
(Hersperger, 2006). The patterns and interactions applicable to this work include: patch
adjacency, patch and matrix pattern and patch neighbourhood Figure 2-9.
A
B
(C)
Figure 2-9: Neighbourhood spatial adjacencies and interactions adapted from Hersperger (2006) (Illustrated: M. Gatner)
Note: A – Patch adjacency (red arrows= adjacent elements); B= Patch-and-matrix pattern, C=Patch Neighbourhood (black arrows=strong interactions between patches, grey arrows=weak interactions focal patch and matrix)
1. Patch adjacency
Patch adjacency refers to the patch and its immediate adjoining elements, i.e.,
patch and its surrounding matrix (see Figure 2-9 -A). With the use of landscape
indices, this adjacency can be quantified with characteristics such as perimeter and
26
area to describe shape and compactness and the percent of shared border with
each element. Shape of the patch will affect movement (Forman, 1995); if the
shape permits movement and the neighbouring elements are desirable, i.e., green
space, the adjacency effect is positive. Conversely, negative adjacency effects
result from permeability and negative neighbouring elements, i.e., locally
unwanted land use (LULU) such as industry producing odour and noise
(Hersperger, 2006), or derelict lots. Adjacencies in this context can also be
expressed as ‘contrast’ between neighbouring patches. High contrast would be a
patch of open green space beside an industrial lot; this configuration would cause
a negative adjacency effect and likely an abrupt edge, almost barrier, to movement
between the patches.
2. Patch-and-matrix pattern
This is a pattern created by a focal patch of a certain type, i.e., large patch of open
green space within a matrix and the strong patch-to-patch interactions with nearby
patches of the same type and the weak interactions with the surrounding matrix
(see Figure 2-9 – B), i.e., a network of parks within an urban neighbourhood
(Hersperger, 2006). The pattern of green patches could provide a network of
habitat resources depending on range of species or dispersal method (Freemark,
Dunning, Hejl, & Probst, 1995 as cited in; Hersperger, 2006). As a corridor-and-
matrix pattern is a special case of the pattern, it can present interesting
opportunities for research on how humans and other species move within the
matrix, i.e., paths and railways between communities/patches of interest. This is a
derivative theory from Forman’s (1995) third indispensable pattern of
connectivity of patches for movement between large patches; however, in this
case the pattern is applied on a smaller scale and not explicitly to movement
between large patches but interactions among similar patch types throughout the
matrix are stronger than with the ‘hostile’ matrix (Hersperger, 2006).
27
3. Patch neighbourhood
The patch neighbourhood is the focal patch and all surrounding neighbouring
elements with strong interactions regardless of patch type (Hersperger, 2006).
This pattern helps define neighbourhood quality for multi-habitat species with
special attention to connectivity between elements.
Good spatial configurations can reduce spatial conflicts and enhance the quality of socio-
economic and ecological systems; therefore, “landscape ecological planning needs
approaches for addressing adjacencies and interactions in spatial arrangements”
(Hersperger, 2006, p.228).
These patterns and principles will be the foundation upon which a strategy is formulated
for re-use of vacant lands. It is an experimental approach to reconstituting ecological
patterns within an established urban neighbourhood.
28
Chapter 3. Methodology
This project developed a GIS-based, spatial analysis decision-making strategy for urban
land use. The land use and land cover (LULC) changes as a result of designed
manipulation will be described and assessed. The relationship between altering land use
and landscape pattern will be assessed to describe how neighbourhood scale LULC
alterations might contribute to improvement in landscape function.
The process involved the overlay of GIS maps, providing spatial and physical
characterization of the neighbourhood. A step-wise approach (Appendices A-1, A-2 and
A-3) was taken to first applying the strategy Patterns 1.1-3.2 to the GIS overlays,
considered the ‘first pass’ of the strategy. The ‘second pass’ (Pattern 4.1) further refined
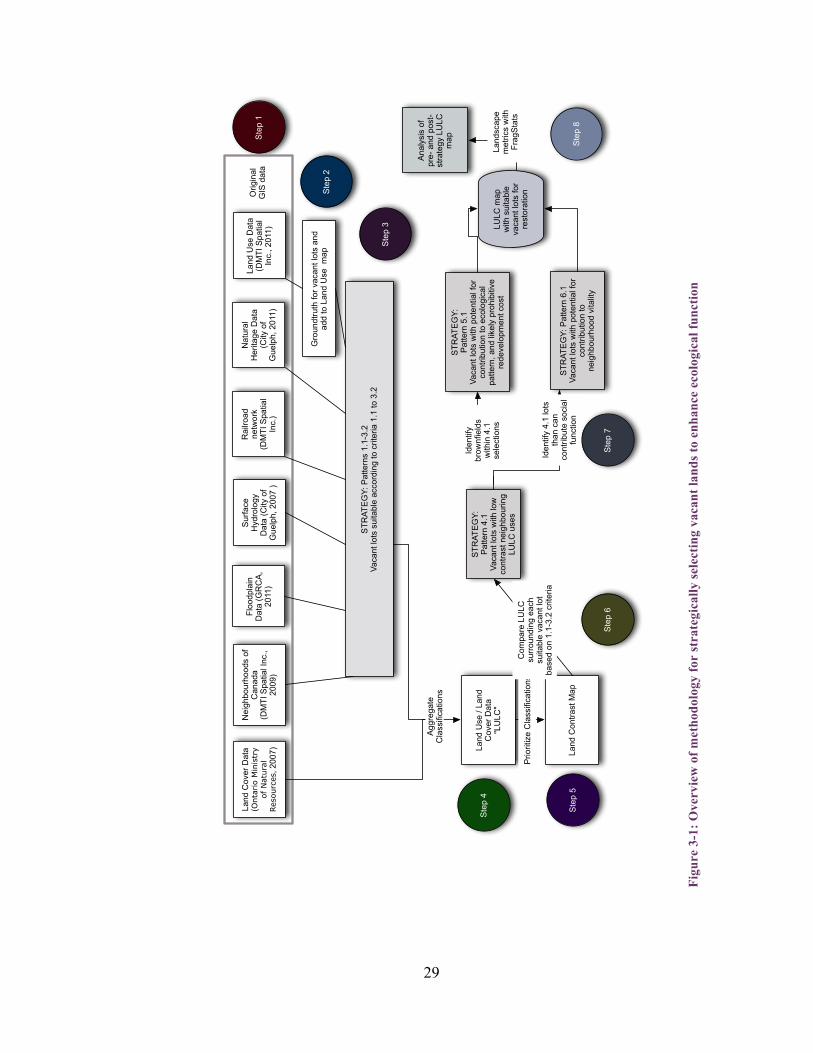
the results by introducing the criteria of low contrast of combined LULC of the chosen
vacant lot and its surroundings. The ‘third pass’ selected among Pattern 4.1 vacancies,
lots that are brownfields or could contribute toward community vitality by means of
providing a closer open space amenity. These lots represented the final selection of urban
vacancies. These steps are described in detail in Section 3.3. A final map representing the
outcome of the strategy was analysed against the existing neighbourhood LULC with the
landscape analysis software, Fragstats 3.3 (McGarigal, Cushman, Neel, & Ene, 2002) to
quantify how suggested spatial configurations from the strategy affect landscape patterns.
The sections that follow in this chapter reference the step listed in Figure 3.1.
29
Figu
re 3
-1: O
verv
iew
of m
etho
dolo
gy fo
r st
rate
gica
lly se
lect
ing
vaca
nt la
nds t
o en
hanc
e ec
olog
ical
func
tion
Land
Use
Dat
a (D
MTI
Spa
tial
Inc.
, 201
1)
Land
Cov
er D
ata
(Onta
rio M
inis
try
of N
atura
l Res
ourc
es, 2
007) La
nd U
se /
Land
C
over
Dat
a "L
ULC
"
Aggr
egat
e C
lass
ifica
tions
Land
Con
trast
Map
Prio
ritiz
e C
lass
ifica
tions
Gro
undt
ruth
for v
acan
t lot
s an
d ad
d to
Lan
d U
se m
ap
STR
ATEG
Y: P
atte
rns
1.1-
3.2
Vaca
nt lo
ts s
uita
ble
acco
rdin
g to
crit
eria
1.1
to 3
.2
Floo
dpla
in
Dat
a (G
RC
A,
2011
)
Surfa
ce
Hyd
rolo
gy
Dat
a (C
ity o
f G
uelp
h, 2
007
)
Nat
ural
H
erita
ge D
ata
(City
of
Gue
lph,
201
1)
Rai
lroad
ne
twor
k(D
MTI
Spa
tial
Inc.
)
STR
ATEG
Y:
Patte
rn 4
.1Va
cant
lots
with
low
co
ntra
st n
eigh
bour
ing
LULC
use
s C
ompa
re L
ULC
su
rroun
ding
eac
h su
itabl
e va
cant
lot
base
d on
1.1
-3.2
crit
eria
LULC
map
w
ith s
uita
ble
vaca
nt lo
ts fo
r re
stor
atio
n
Nei
ghbo
urho
ods
of
Can
ada
(DM
TI S
patia
l Inc
., 20
09)
Orig
inal
G
IS d
ata
Step
1
Step
2
Step
3
Step
4
Step
5
Step
6
STR
ATEG
Y:
Patte
rn 5
.1
Vaca
nt lo
ts w
ith p
oten
tial f
or
cont
ribut
ion
to e
colo
gica
l pa
ttern
, and
like
ly p
rohi
bitiv
e re
deve
lopm
ent c
ost
Step
7
Iden
tify
brow
nfie
lds
with
in 4
.1
sele
ctio
ns
STR
ATEG
Y: P
atte
rn 6
.1
Vaca
nt lo
ts w
ith p
oten
tial f
or
cont
ribut
ion
to
neig
hbou
rhoo
d vi
talit
y
Iden
tify
4.1
lots
th
an c
an
cont
ribut
e so
cial
fu
nctio
n
Anal
ysis
of
pre-
and
pos
t-st
rate
gy L
ULC
m
ap
Land
scap
e m
etric
s w
ith
Frag
Stat
s
Step
8
30
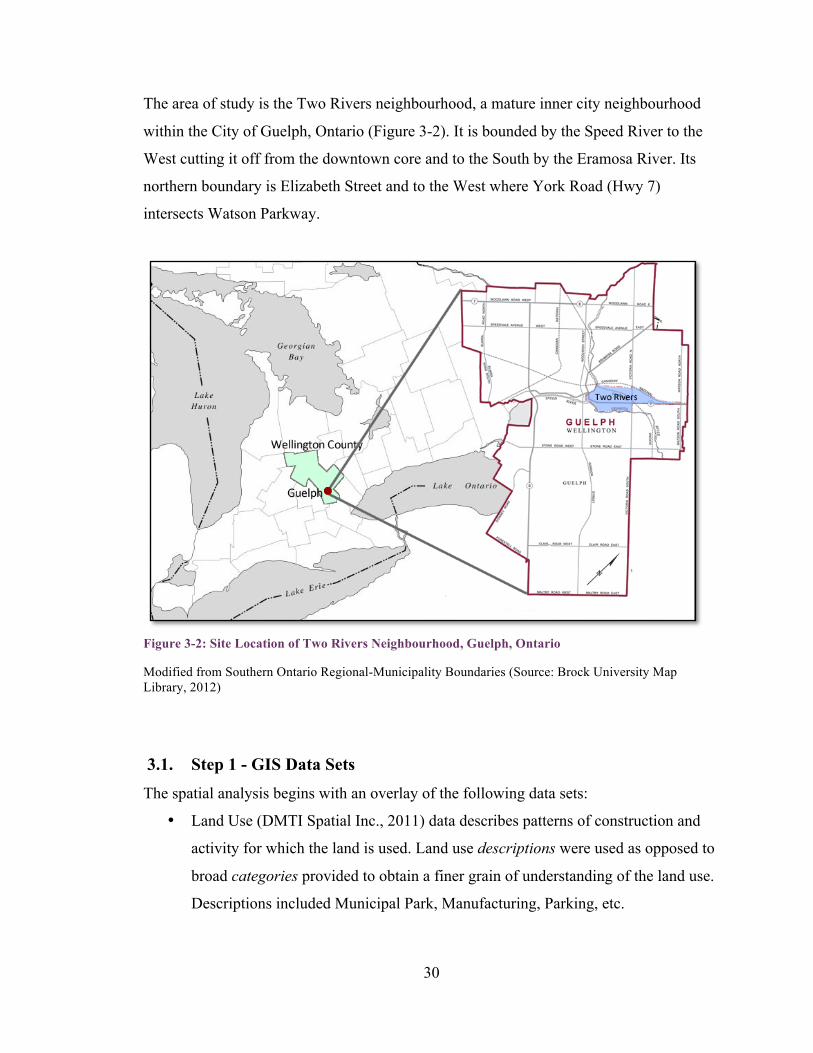
The area of study is the Two Rivers neighbourhood, a mature inner city neighbourhood
within the City of Guelph, Ontario (Figure 3-2). It is bounded by the Speed River to the
West cutting it off from the downtown core and to the South by the Eramosa River. Its
northern boundary is Elizabeth Street and to the West where York Road (Hwy 7)
intersects Watson Parkway.
Figure 3-2: Site Location of Two Rivers Neighbourhood, Guelph, Ontario
Modified from Southern Ontario Regional-Municipality Boundaries (Source: Brock University Map Library, 2012)
3.1. Step 1 - GIS Data Sets The spatial analysis begins with an overlay of the following data sets:
• Land Use (DMTI Spatial Inc., 2011) data describes patterns of construction and
activity for which the land is used. Land use descriptions were used as opposed to
broad categories provided to obtain a finer grain of understanding of the land use.
Descriptions included Municipal Park, Manufacturing, Parking, etc.
31
• Southern Ontario Land Cover Information System (SOLRIS) (Ontario Ministry of
Natural Resources, 2008) is a landscape level inventory of natural, rural and urban
lands
• Neighbourhood Boundaries of Canada (DMTI Spatial Inc, 2009b): municipally-
sourced data regarding neighbourhood boundaries.
• Floodplain (Grand River Conservation Authority, 2011) data describe the
regulatory 100-year floodplain. It was developed to contain floodplain information
determined through engineered floodplain mapping studies, observed occurrences
of flooding, or estimated based on mapping, aerial photography, and field
observations.
• Surface Hydrology (DMTI Spatial Inc, 2009a): provides spatial characteristics
regarding rivers, and lakes.
• CanMap Rail (DMTI Spatial Inc., 2009) data provide details regarding railways,
transit, sidetrack and abandoned railways across Canada.
• Guelph’s Natural Heritage (City of Guelph: Planning, Engineering and
Environmental Services, 2010; Shute, 2010) is the integration of the Natural
Heritage Ecoland classifications, part of Guelph’s Natural Heritage Strategy, and
data regarding buried and surface creeks overlaid on the land use and land cover
maps (LULC). This helped characterise the natural ecological patterns in the
neighbourhood.
• Guelph Street Networks (City of Guelph, 2007) provided context for
neighbourhood maps.
The base maps were overlaid and clipped to the neighbourhood boundaries. The resulting
overlay maps are found in Appendix B-1, B-2, and B-3, and provide a characterization of
the neighbourhood with existing land use, land cover, transportation corridors and
existing natural patterns. Although land use maps were recently updated, they did not
include residential vacancies, or privately held abandoned buildings or lots, only those
that are municipally owned. As mentioned in Section 2, the definition of vacancy for the
purposes of this project includes both privately and publicly held land. Due to this
shortcoming, an additional method of obtaining the data was pursued.
32
3.2. Step 2 – Vacant Lot Groundtruthing The Two Rivers neighbourhood was visited twice to verify land use classifications. Both
visits occurred during regular business hours, one morning trip and one afternoon trip.
Vacant buildings and lots were noted on a GIS derived land use map (DMTI Spatial Inc.,
2011) then later entered into GIS by reclassifying polygons in the land use map (Step 2,
Figure 3-1).
Criteria for considering a lot vacant were empty properties with:
1 No indication of active use, i.e., empty parking lot, with the appearance of
spontaneous vegetation:
a. Appearance of spontaneous vegetation and signage indicating property is
privately owned but managed by third party
b. Appearance of spontaneous vegetation and signage indicating property is for
sale
2 Lot possesses a commercial building showing signs of abandonment:
a. Building shows signs of lengthy dereliction:
i. Lack of maintenance of building appearance, i.e., boarded up or
cracked windows; tattered or broken window coverings, broken lights,
etc.
ii. Contents show signs of abuse, i.e., broken or overturned furniture
visible from curb
b. Notice posted on door of current legal action causing close of business
c. No one on premises during regular business hours (listed on door) and
building showing signs of any of criteria listed in 2)
d. Building is empty with ‘For Lease’ sign posted
e. Business no longer possesses a listed telephone number
f. Business possesses a listed phone number or email, but attempts to contact
business goes unanswered or voicemail does not correspond to business and
premises is showing one or more 2) criteria
33
3.3. Step 3: Identifying vacant lots that fulfil Strategy 1.1-3.2 criteria
A decision-making strategy derived primarily from Forman’s (1995) indispensable
patterns for sustainable land use (Figure 2-6) acted as selection guide for the vacant lands
(Appendices A-1, A-2, A-3). This strategy enabled prioritization of land parcels chosen to
contribute toward improving the ecological function of the neighbourhood. The goal of
the strategy is to identify and prioritize opportunities that could increase connectivity and
patch size, or that could break up the homogeneity of the urban matrix. At the conclusion
of the process, the selected vacant lands would be reclassified into a more natural land
cover representing a strategic selection of vacant properties developed and managed to
enhance ecological function.
3.3.1. Connectivity
Identifying key vacant lands to create or increase connectivity is the first pattern in the
strategy as connectivity throughout the matrix either by river or stream systems, or
terrestrial corridors is one of the indispensible land patterns (Forman, 1995). Hydrologic
connectivity is the first pattern of connectivity in the strategy; it is essential to the
ecological integrity of the landscape (Pringle, 2003), followed closely by connectivity of
terrestrial non-stream corridors. The strategy is a series of formed questions to prioritize
land parcel properties for conversion from vacant to re-vegetated land cover.
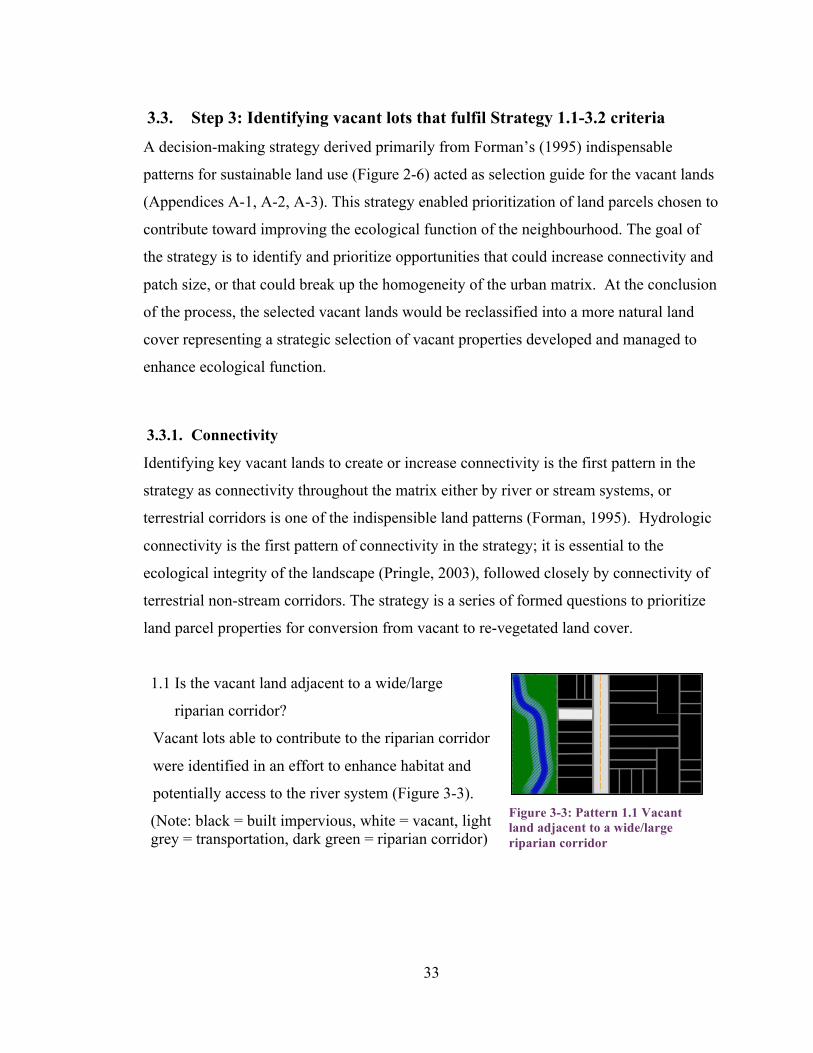
1.1 Is the vacant land adjacent to a wide/large
riparian corridor?
Vacant lots able to contribute to the riparian corridor
were identified in an effort to enhance habitat and
potentially access to the river system (Figure 3-3).
(Note: black = built impervious, white = vacant, light grey = transportation, dark green = riparian corridor)
Figure 3-3: Pattern 1.1 Vacant land adjacent to a wide/large riparian corridor
34
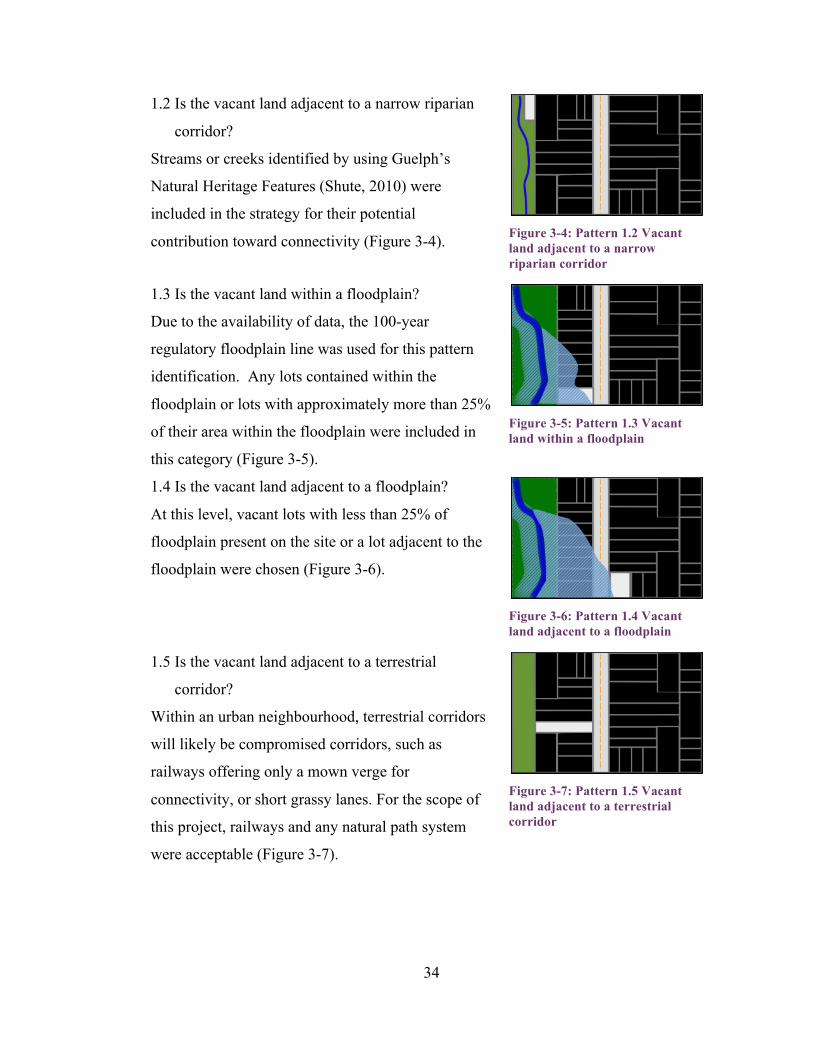
1.2 Is the vacant land adjacent to a narrow riparian
corridor?
Streams or creeks identified by using Guelph’s
Natural Heritage Features (Shute, 2010) were
included in the strategy for their potential
contribution toward connectivity (Figure 3-4).
Figure 3-4: Pattern 1.2 Vacant land adjacent to a narrow riparian corridor
1.3 Is the vacant land within a floodplain?
Due to the availability of data, the 100-year
regulatory floodplain line was used for this pattern
identification. Any lots contained within the
floodplain or lots with approximately more than 25%
of their area within the floodplain were included in
this category (Figure 3-5).
Figure 3-5: Pattern 1.3 Vacant land within a floodplain
1.4 Is the vacant land adjacent to a floodplain?
• At this level, vacant lots with less than 25% of
floodplain present on the site or a lot adjacent to the
floodplain were chosen (Figure 3-6).
Figure 3-6: Pattern 1.4 Vacant land adjacent to a floodplain
1.5 Is the vacant land adjacent to a terrestrial
corridor?
Within an urban neighbourhood, terrestrial corridors
will likely be compromised corridors, such as
railways offering only a mown verge for
connectivity, or short grassy lanes. For the scope of
this project, railways and any natural path system
were acceptable (Figure 3-7).
Figure 3-7: Pattern 1.5 Vacant land adjacent to a terrestrial corridor
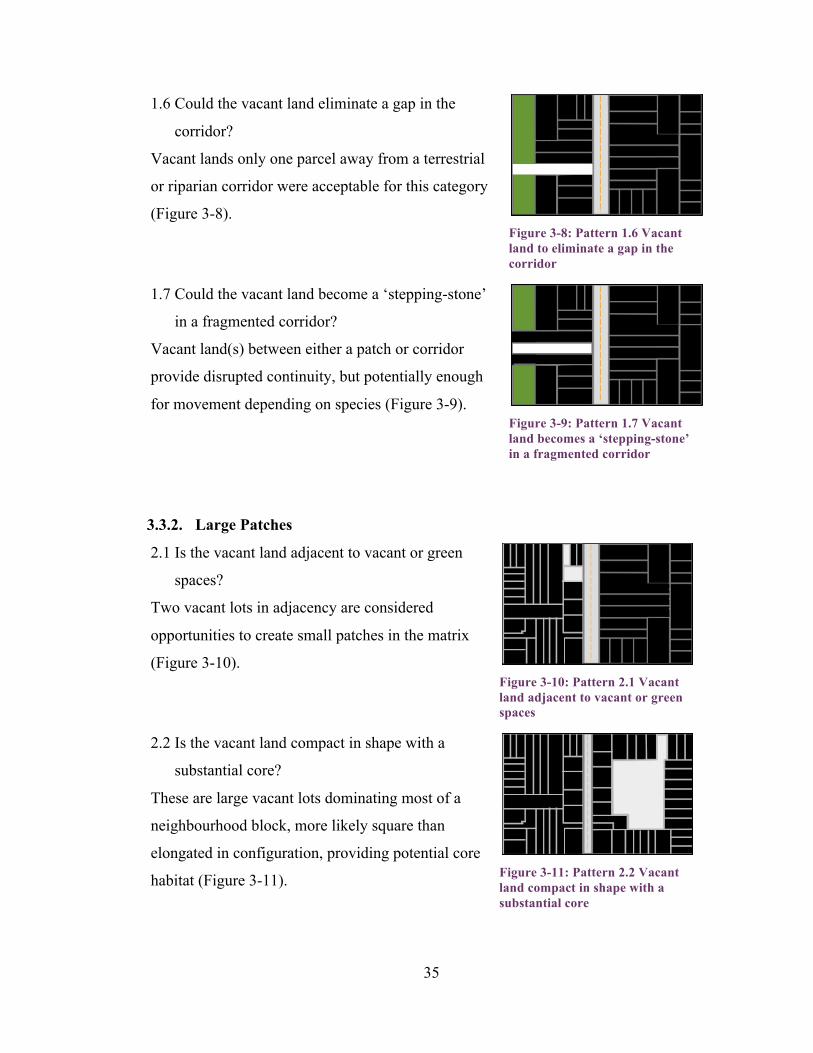
35
1.6 Could the vacant land eliminate a gap in the
corridor?
Vacant lands only one parcel away from a terrestrial
or riparian corridor were acceptable for this category
(Figure 3-8).
Figure 3-8: Pattern 1.6 Vacant land to eliminate a gap in the corridor
1.7 Could the vacant land become a ‘stepping-stone’
in a fragmented corridor?
• Vacant land(s) between either a patch or corridor
provide disrupted continuity, but potentially enough
for movement depending on species (Figure 3-9). Figure 3-9: Pattern 1.7 Vacant land becomes a ‘stepping-stone’ in a fragmented corridor
3.3.2. Large Patches
2.1 Is the vacant land adjacent to vacant or green
spaces?
Two vacant lots in adjacency are considered
opportunities to create small patches in the matrix
(Figure 3-10). Figure 3-10: Pattern 2.1 Vacant land adjacent to vacant or green spaces
2.2 Is the vacant land compact in shape with a
substantial core?
These are large vacant lots dominating most of a
neighbourhood block, more likely square than
elongated in configuration, providing potential core
habitat (Figure 3-11).
Figure 3-11: Pattern 2.2 Vacant land compact in shape with a substantial core
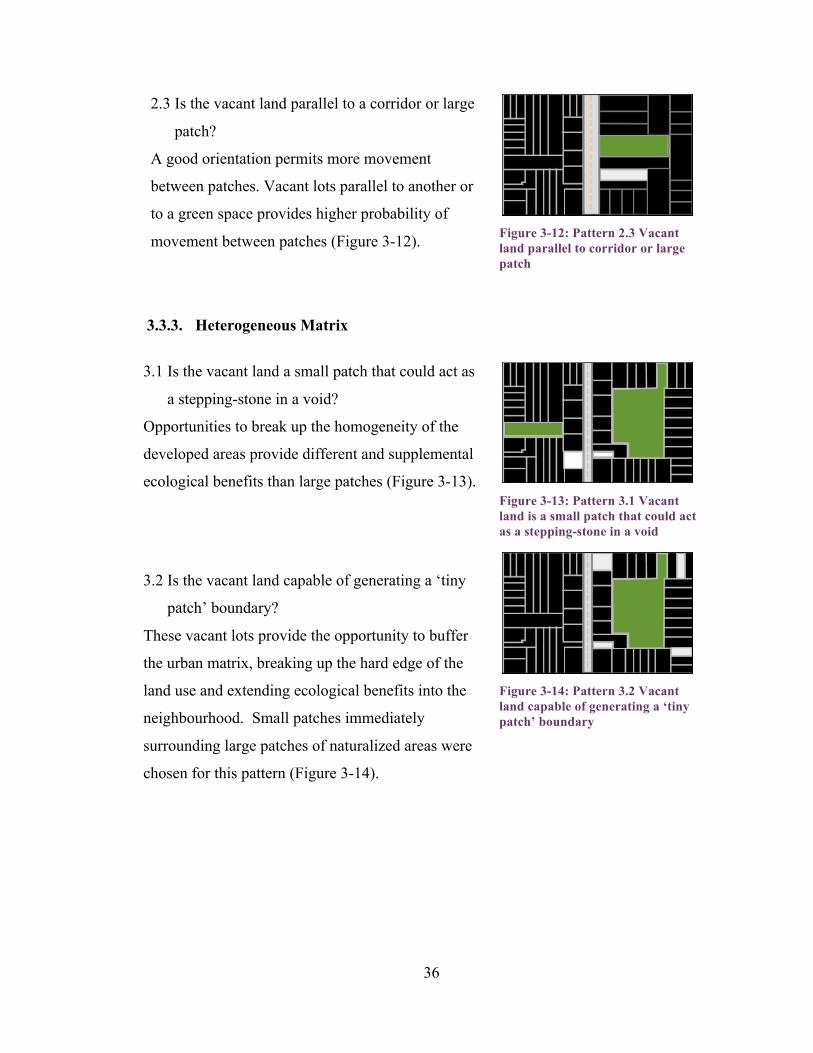
36
2.3 Is the vacant land parallel to a corridor or large
patch?
A good orientation permits more movement
between patches. Vacant lots parallel to another or
to a green space provides higher probability of
movement between patches (Figure 3-12).
Figure 3-12: Pattern 2.3 Vacant land parallel to corridor or large patch
3.3.3. Heterogeneous Matrix
3.1 Is the vacant land a small patch that could act as
a stepping-stone in a void?
Opportunities to break up the homogeneity of the
developed areas provide different and supplemental
ecological benefits than large patches (Figure 3-13). Figure 3-13: Pattern 3.1 Vacant land is a small patch that could act as a stepping-stone in a void
3.2 Is the vacant land capable of generating a ‘tiny
patch’ boundary?
These vacant lots provide the opportunity to buffer
the urban matrix, breaking up the hard edge of the
land use and extending ecological benefits into the
neighbourhood. Small patches immediately
surrounding large patches of naturalized areas were
chosen for this pattern (Figure 3-14).
Figure 3-14: Pattern 3.2 Vacant land capable of generating a ‘tiny patch’ boundary
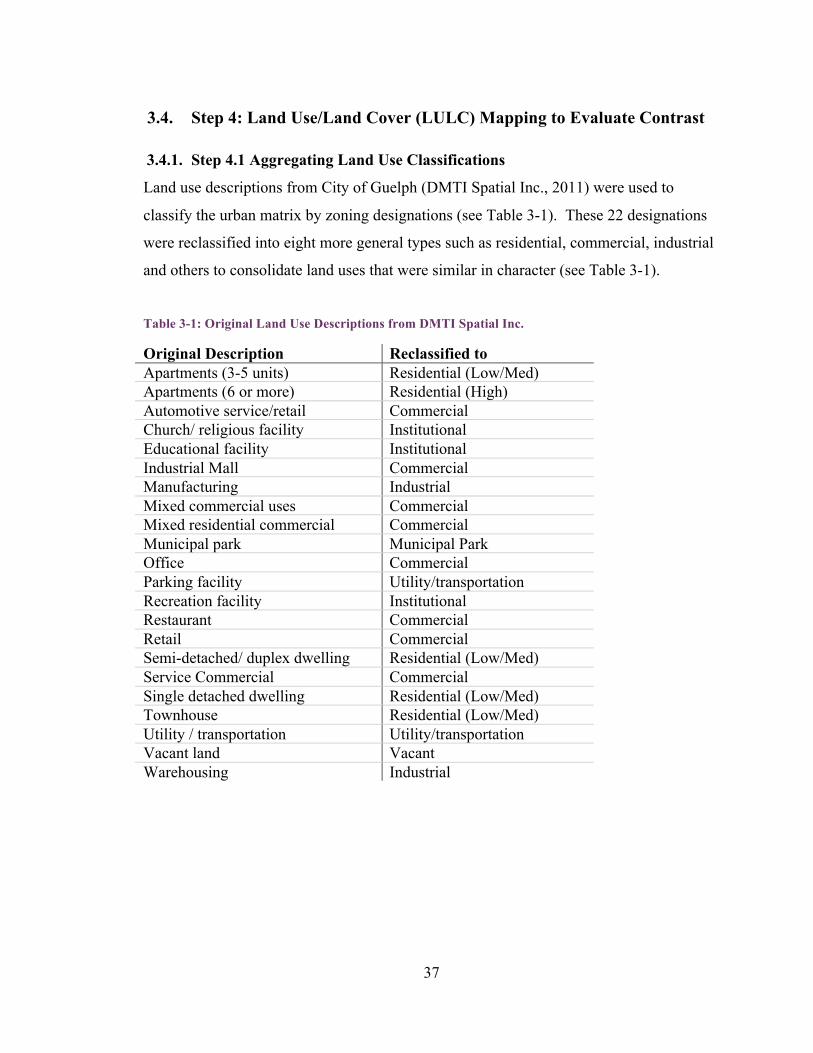
37
3.4. Step 4: Land Use/Land Cover (LULC) Mapping to Evaluate Contrast
3.4.1. Step 4.1 Aggregating Land Use Classifications
Land use descriptions from City of Guelph (DMTI Spatial Inc., 2011) were used to
classify the urban matrix by zoning designations (see Table 3-1). These 22 designations
were reclassified into eight more general types such as residential, commercial, industrial
and others to consolidate land uses that were similar in character (see Table 3-1).
Table 3-1: Original Land Use Descriptions from DMTI Spatial Inc.
Original Description Reclassified to Apartments (3-5 units) Residential (Low/Med) Apartments (6 or more) Residential (High) Automotive service/retail Commercial Church/ religious facility Institutional Educational facility Institutional Industrial Mall Commercial Manufacturing Industrial Mixed commercial uses Commercial Mixed residential commercial Commercial Municipal park Municipal Park Office Commercial Parking facility Utility/transportation Recreation facility Institutional Restaurant Commercial Retail Commercial Semi-detached/ duplex dwelling Residential (Low/Med) Service Commercial Commercial Single detached dwelling Residential (Low/Med) Townhouse Residential (Low/Med) Utility / transportation Utility/transportation Vacant land Vacant Warehousing Industrial
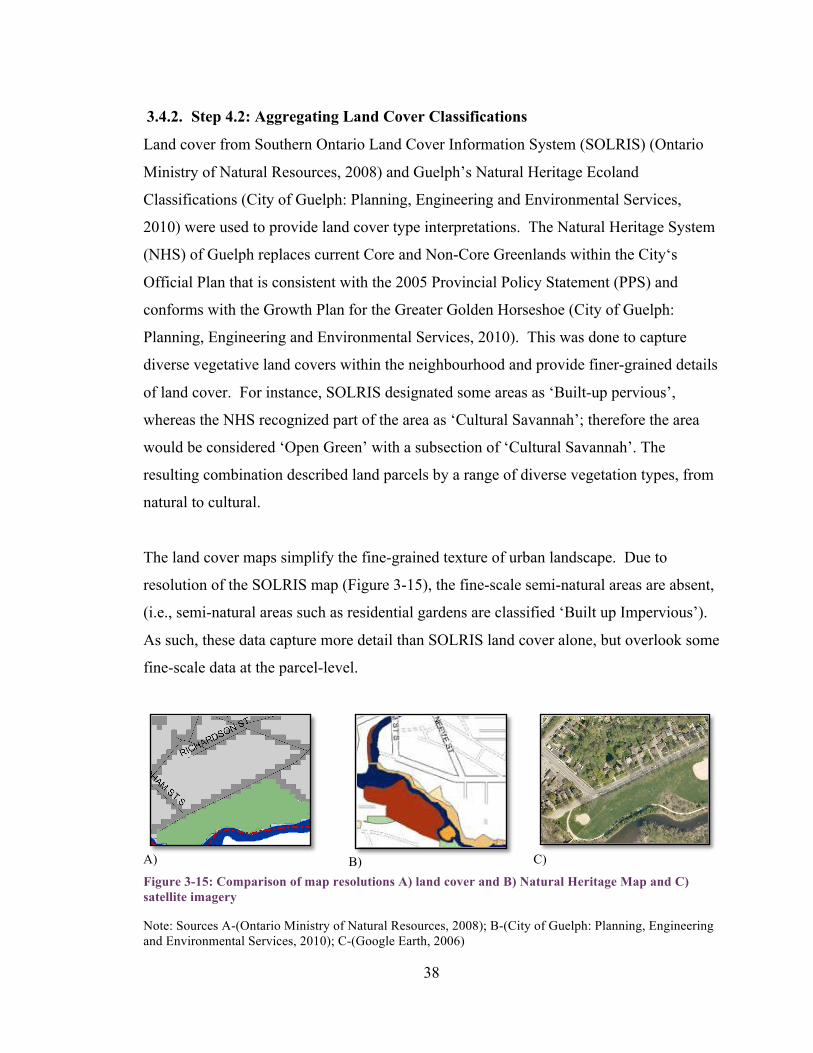
38
3.4.2. Step 4.2: Aggregating Land Cover Classifications
Land cover from Southern Ontario Land Cover Information System (SOLRIS) (Ontario
Ministry of Natural Resources, 2008) and Guelph’s Natural Heritage Ecoland
Classifications (City of Guelph: Planning, Engineering and Environmental Services,
2010) were used to provide land cover type interpretations. The Natural Heritage System
(NHS) of Guelph replaces current Core and Non-Core Greenlands within the City‘s
Official Plan that is consistent with the 2005 Provincial Policy Statement (PPS) and
conforms with the Growth Plan for the Greater Golden Horseshoe (City of Guelph:
Planning, Engineering and Environmental Services, 2010). This was done to capture
diverse vegetative land covers within the neighbourhood and provide finer-grained details
of land cover. For instance, SOLRIS designated some areas as ‘Built-up pervious’,
whereas the NHS recognized part of the area as ‘Cultural Savannah’; therefore the area
would be considered ‘Open Green’ with a subsection of ‘Cultural Savannah’. The
resulting combination described land parcels by a range of diverse vegetation types, from
natural to cultural.
The land cover maps simplify the fine-grained texture of urban landscape. Due to
resolution of the SOLRIS map (Figure 3-15), the fine-scale semi-natural areas are absent,
(i.e., semi-natural areas such as residential gardens are classified ‘Built up Impervious’).
As such, these data capture more detail than SOLRIS land cover alone, but overlook some
fine-scale data at the parcel-level.
A) B) C)
Figure 3-15: Comparison of map resolutions A) land cover and B) Natural Heritage Map and C) satellite imagery
Note: Sources A-(Ontario Ministry of Natural Resources, 2008); B-(City of Guelph: Planning, Engineering and Environmental Services, 2010); C-(Google Earth, 2006)
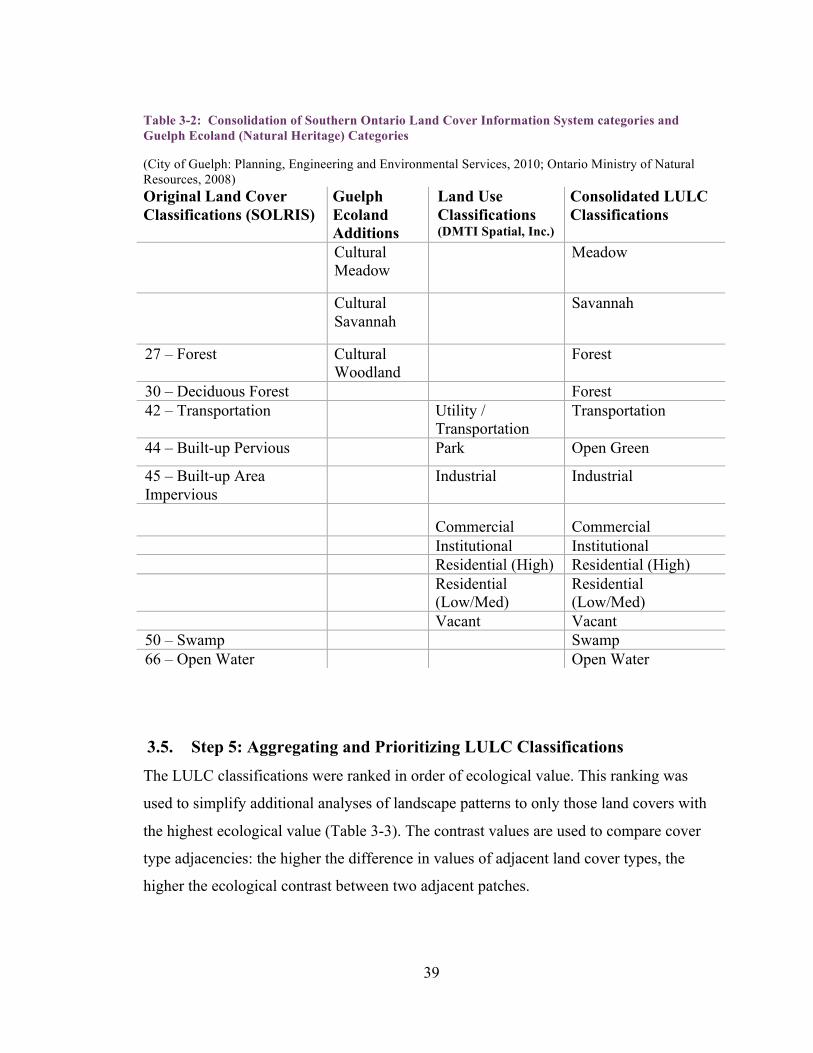
39
Table 3-2: Consolidation of Southern Ontario Land Cover Information System categories and Guelph Ecoland (Natural Heritage) Categories
(City of Guelph: Planning, Engineering and Environmental Services, 2010; Ontario Ministry of Natural Resources, 2008) Original Land Cover Classifications (SOLRIS)
Guelph Ecoland Additions
Land Use Classifications (DMTI Spatial, Inc.)
Consolidated LULC Classifications
Cultural Meadow
Meadow
Cultural Savannah
Savannah
27 – Forest Cultural Woodland
Forest
30 – Deciduous Forest Forest 42 – Transportation Utility /
Transportation Transportation
44 – Built-up Pervious Park Open Green
45 – Built-up Area Impervious
Industrial Industrial
Commercial Commercial
Institutional Institutional Residential (High) Residential (High) Residential
(Low/Med) Residential (Low/Med)
Vacant Vacant 50 – Swamp Swamp 66 – Open Water Open Water
3.5. Step 5: Aggregating and Prioritizing LULC Classifications The LULC classifications were ranked in order of ecological value. This ranking was
used to simplify additional analyses of landscape patterns to only those land covers with
the highest ecological value (Table 3-3). The contrast values are used to compare cover
type adjacencies: the higher the difference in values of adjacent land cover types, the
higher the ecological contrast between two adjacent patches.
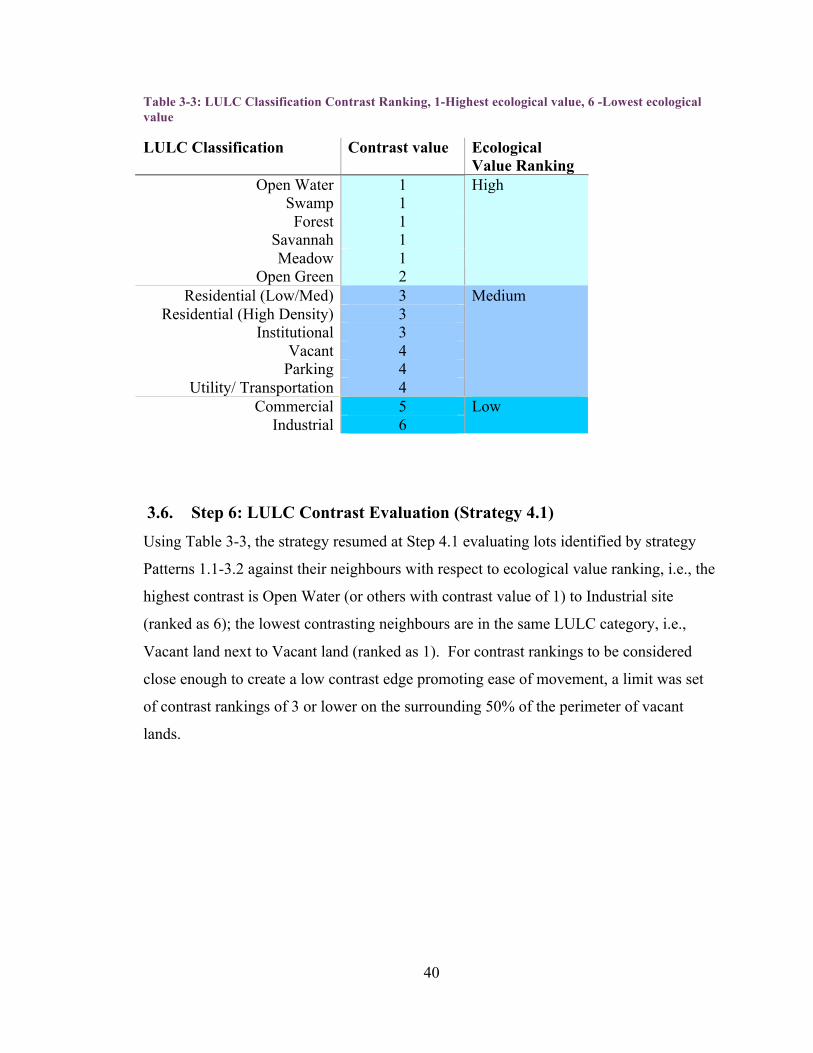
40
Table 3-3: LULC Classification Contrast Ranking, 1-Highest ecological value, 6 -Lowest ecological value
LULC Classification Contrast value Ecological Value Ranking
Open Water 1 Swamp 1 Forest 1
Savannah 1 Meadow 1
Open Green 2
High
Residential (Low/Med) 3 Residential (High Density) 3
Institutional 3 Vacant 4
Parking 4 Utility/ Transportation 4
Medium
Commercial 5 Industrial 6
Low
3.6. Step 6: LULC Contrast Evaluation (Strategy 4.1) Using Table 3-3, the strategy resumed at Step 4.1 evaluating lots identified by strategy
Patterns 1.1-3.2 against their neighbours with respect to ecological value ranking, i.e., the
highest contrast is Open Water (or others with contrast value of 1) to Industrial site
(ranked as 6); the lowest contrasting neighbours are in the same LULC category, i.e.,
Vacant land next to Vacant land (ranked as 1). For contrast rankings to be considered
close enough to create a low contrast edge promoting ease of movement, a limit was set
of contrast rankings of 3 or lower on the surrounding 50% of the perimeter of vacant
lands.
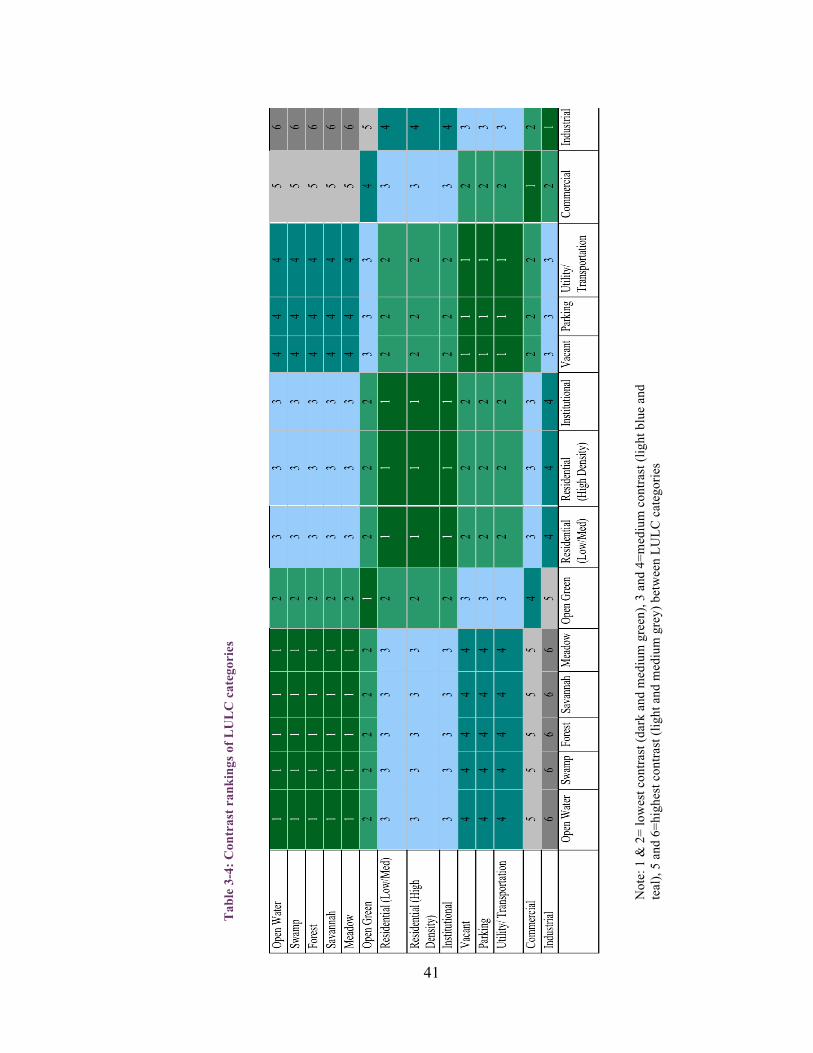
41
Not
e: 1
& 2
= lo
wes
t con
trast
(dar
k an
d m
ediu
m g
reen
), 3
and
4=m
ediu
m c
ontra
st (l
ight
blu
e an
d te
al),
5 an
d 6=
high
est c
ontra
st (l
ight
and
med
ium
gre
y) b
etw
een
LULC
cat
egor
ies
Tab
le 3
-4: C
ontr
ast r
anki
ngs o
f LU
LC
cat
egor
ies
42
3.7. Step 7: Identifying Brownfields and Community Opportunities
(Strategy 5.1)
3.7.1. Brownfields
As mentioned earlier in Guelph’s Brownfield Redevelopment Plan, it is estimated that 60-
80% of brownfields likely have clean-up costs that are prohibitive to private sector
redevelopment and in a further 10-20% the clean-up costs would be so high using
traditional remediation methods that redevelopment by the private sector would likely not
occur (City of Guelph, 2008). These lots possess potential ecological value by spatial
configuration but bear prohibitive costs of redevelopment, thus targeting these sites at this
stage of the strategy is an alternative to years of dereliction. The scope of this project
does not encompass providing a prescriptive design or remediation process for these lots,
only to improve the condition on the lot (recognizing that some of the properties might be
compromised by contamination).
The map of 4.1 low contrast vacant lots was overlaid with the City of Guelph’s map of
known brownfields in the Two Rivers neighbourhood. In the case of a positive overlap,
the vacant brownfield contributed to Pattern 5.1.
3.7.2. Enhancing Community Vitality
This stage identified opportunities to improve the vitality of the neighbourhood. New
Urbanist principles proscribe an average radius of development to be within a 5-minute
walk (approximately 400 metres). This element of the strategy works to ensure amenities
that can improve neighbourhood vitality would be contained within the neighbourhood
and accessible within a 5-minute walk. Once again, the 4.1 strategic lots are examined
against the following criteria, which go beyond ecological value:
a. Food accessibility: Locations selling fresh produce within or in proximity to the
Two Rivers Neighbourhood are identified on a land use map with all 4.1 lots
present. A 400 m. radius around grocery locations was created and areas of the
neighbourhood outside this reach were considered food deserts and any vacant
lands within or near food desert were chosen for urban agricultural opportunities.
43
b. Walkability to natural areas: Above the improvement of ecological patterns within
the neighbourhood, the strategy provided for the accessibility to naturalized areas.
A 5-minute pedestrian walking radius (400 m) around existing parks was applied
and low contrast vacant lots chosen to fill any voids.
c. Place identity: The unique natural or historic aspects of a neighbourhood’s
character should be nurtured. Vacant lots that could present design opportunities
to enhance the neighbourhood’s character were chosen, (i.e., neighbourhood entry
points or character buildings within brownfields remains).
This concludes the prioritization of vacant lands for the strategy. To prepare data
maps for analysis, a set of pre-and post-strategy maps were created by re-classifying
LULC into a three-tier ecological value ranking of high, medium or low. The pre-
strategy map (see Table 3-3) represented existing ecological value of the
neighbourhood. Adding the selected vacant lots and re-classifying them as “high”
ecological value created the post-strategy map.
3.8. Step 8: Analysis of Pre- and Post-strategy LULC Maps Landscape spatial analysis on the pre- and post-strategy neighbourhood was performed
using the spatial analysis software FragStats (McGarigal, Cushman, Neel, & Ene, 2002).
The landscape pattern indices are “measures for quantifying the composition and
configuration of ecosystems across a study area” (Corry & Nassauer, 2005, p. 266); they
are readily available tools that can be applied at different scales of study. The following
landscape metrics were obtained:
3.8.1. Landscape Composition Metrics
3.8.1.1. Area
This metric calculates the total area of land cover for each type. It will provide the
amount of change in the “high” ecological value land cover when comparing the pre- and
post-strategy landscapes.
44
3.8.1.2. Patch Number (PN)
Patch number measures the total number of patches of a land cover type. This metric will
reflect changes as a result of Patterns 1.1-3.2. An increase in the number of “high” quality
patches of land cover type would indicate a more heterogeneous landscape.
3.8.1.3. Percentage land (PLAND)
Percentage of land calculates how much of the landscape is comprised of a particular
patch type. It is expected that the amount of “high” quality patches with respect to the
other land cover types in the matrix should increase as a result of applying the strategy.
3.8.2. Landscape Configuration Metrics
3.8.2.1. Mean Patch Shape Index (Shape MN)
The mean patch shape index metric considers all patches of a particular type
simultaneously and indicates the tendency of change in patch shape across the landscape
(McGarigal, Cushman, Neel, & Ene, 2002). Values range from 1 to infinity, where low
values indicate compact shape (e.g., perfectly square patch has a value of 1) and higher
values indicate more irregular shapes (e.g., very long skinny patches may have values of
3 or more) (Giddings et al., 2009). This value will reflect any changes as a result of
accruing “high” ecological land types, (i.e., patches adjacent to one another will create a
single large patch thus changing its shape values). Consequently not only the patterns
2.1-2.3 intended to increase patch size, but changes from all patterns will be reflected in
this metric.
3.8.2.2. Mean Euclidean Mean Nearest Neighbour Distance (ENN_MN)
The ENN_MN measures the change in the distance between patches of the same type.
The unit of measure is in metres. The strategy aims to increase the heterogeneity in the
urban matrix with dispersed patches of natural areas. The ENN_MN “high” ecological
ranking is expected to decrease to indicate more closely spaced patches and an increase in
stepping-stone connectivity among best-quality patches.
45
3.8.2.3. Total Edge Contrast Index (TECI)
The edge contrast index provides a percent magnitude of edge contrast between adjacent
patch types; weights must range between 0% (no contrast) and 100% (maximum
contrast), (McGarigal, Cushman, Neel, & Ene, 2002). A low edge contrast index is
advantageous for movement through the matrix; however, this is dependent on species
type (McGarigal, Cushman, Neel, & Ene, 2002). It is expected that the edge contrast
index may decrease as a result of the application of the strategy. As mentioned in Section
2 from Hersperger’s (2006) theories of patch adjacency, patches with similar or desirable
neighbouring elements (low-ranked contrast) will exhibit positive adjacency effects
supporting movement between these neighbouring patches.
The methods applied yielded new neighbourhood maps for evaluating outcomes. This
section described the strategic approach to mapping and re-classifying land cover types,
and the methods for spatial analysis. The following section will detail the results of these
methods.
46
Chapter 4. Results
4.1. Neighbourhood Land Use and Land Cover (LULC) Characterisation The spatial analysis within the neighbourhood began with a characterisation of current
land use. The Two Rivers neighbourhood encompasses 232 ha, southeast of downtown
Guelph. Its land use classification revealed almost as much manufacturing use (24.5%) as
presence of single-detached dwellings (24.4%) (Table 4-1). Eight percent of land in the
neighbourhood is vacant and the large green corridor along the Eramosa River provides
considerable green space accounting for the 23.5 ha (11.4%) of municipal park space
(Appendices B-1 and B-3).
The total area of assigned land use sums to 205.4 ha (Table 4-1). This sum does not
include road surfaces or water. The area of the neighbourhood bounded by an outline
polygon is 232.1 ha. This includes all defined land uses as well as road surfaces and
water, accounting for a higher area. Both data sets originated from DTMI Spatial Inc.;
however, land use data defined parcels with assigned land use classifications and the total
neighbourhood area set a boundary encompassing total surface area. As well, there were
duplicate entries found in the land use database and artefacts from clipping land use to the
neighbourhood boundary. Two duplicate entries in the tables were found and removed;
however, a rigorous review of the database for duplicates was not performed. When land
use was clipped to the neighbourhood boundary line, there were issues with the records
representing polygons along the interface of the neighbourhood boundary, mostly along
the Eramosa River. One example of such an issue was found with two remnant patches
appearing to be < 0.5 ha when viewing the land use map were in the location of the
Eramosa River. They are the remaining patches after the clipping procedure of a larger
“recreational” land use totalling 83.1 ha. Their corresponding database record still had an
associated area of 83.1 ha. It was assumed these patches represented the River, to which
the City of Guelph had associated a “recreational” land use. As water is accounted for in
the land cover and hydrology maps, and this record did not have an accurate area value, it
was removed from the land use table. The area total based on land use is less reliable than
the area of the neighbourhood bounded by an outline polygon.
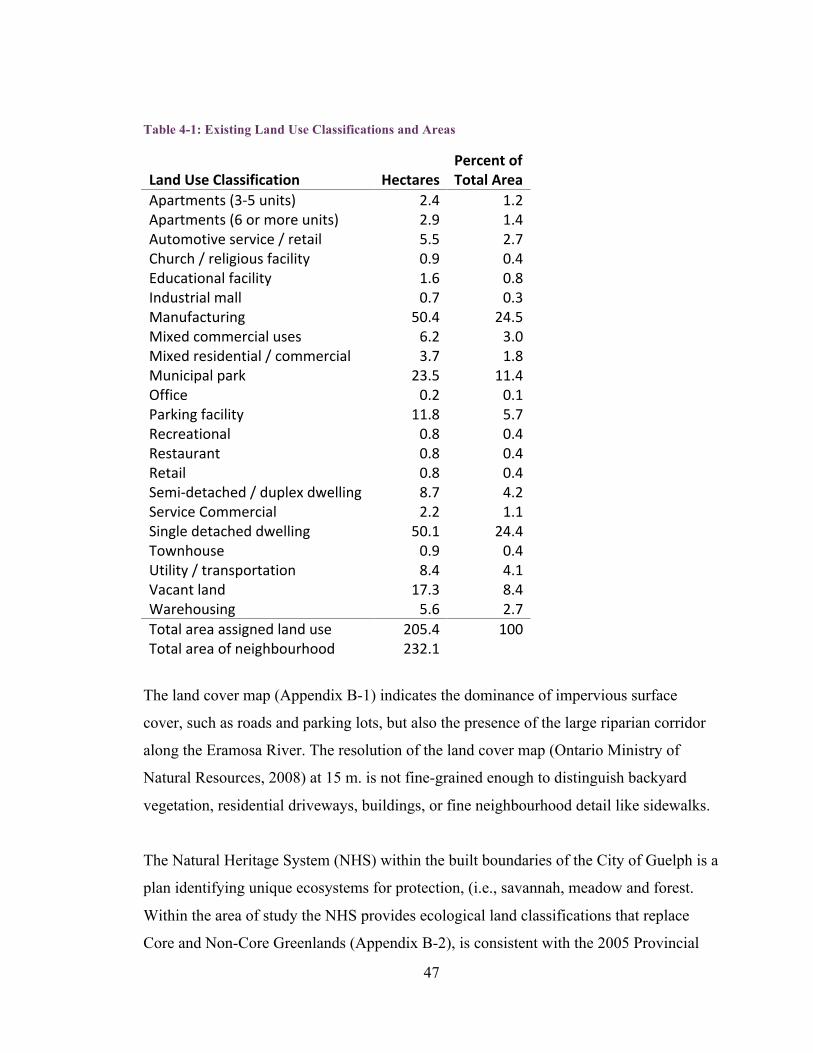
47
Table 4-1: Existing Land Use Classifications and Areas
The land cover map (Appendix B-1) indicates the dominance of impervious surface
cover, such as roads and parking lots, but also the presence of the large riparian corridor
along the Eramosa River. The resolution of the land cover map (Ontario Ministry of
Natural Resources, 2008) at 15 m. is not fine-grained enough to distinguish backyard
vegetation, residential driveways, buildings, or fine neighbourhood detail like sidewalks.
The Natural Heritage System (NHS) within the built boundaries of the City of Guelph is a
plan identifying unique ecosystems for protection, (i.e., savannah, meadow and forest.
Within the area of study the NHS provides ecological land classifications that replace
Core and Non-Core Greenlands (Appendix B-2), is consistent with the 2005 Provincial
Land Use Classification Hectares Percent of Total Area
Apartments (3-‐5 units) 2.4 1.2 Apartments (6 or more units) 2.9 1.4 Automotive service / retail 5.5 2.7 Church / religious facility 0.9 0.4 Educational facility 1.6 0.8 Industrial mall 0.7 0.3 Manufacturing 50.4 24.5 Mixed commercial uses 6.2 3.0 Mixed residential / commercial 3.7 1.8 Municipal park 23.5 11.4 Office 0.2 0.1 Parking facility 11.8 5.7 Recreational 0.8 0.4 Restaurant 0.8 0.4 Retail 0.8 0.4 Semi-‐detached / duplex dwelling 8.7 4.2 Service Commercial 2.2 1.1 Single detached dwelling 50.1 24.4 Townhouse 0.9 0.4 Utility / transportation 8.4 4.1 Vacant land 17.3 8.4 Warehousing 5.6 2.7 Total area assigned land use 205.4 100 Total area of neighbourhood 232.1
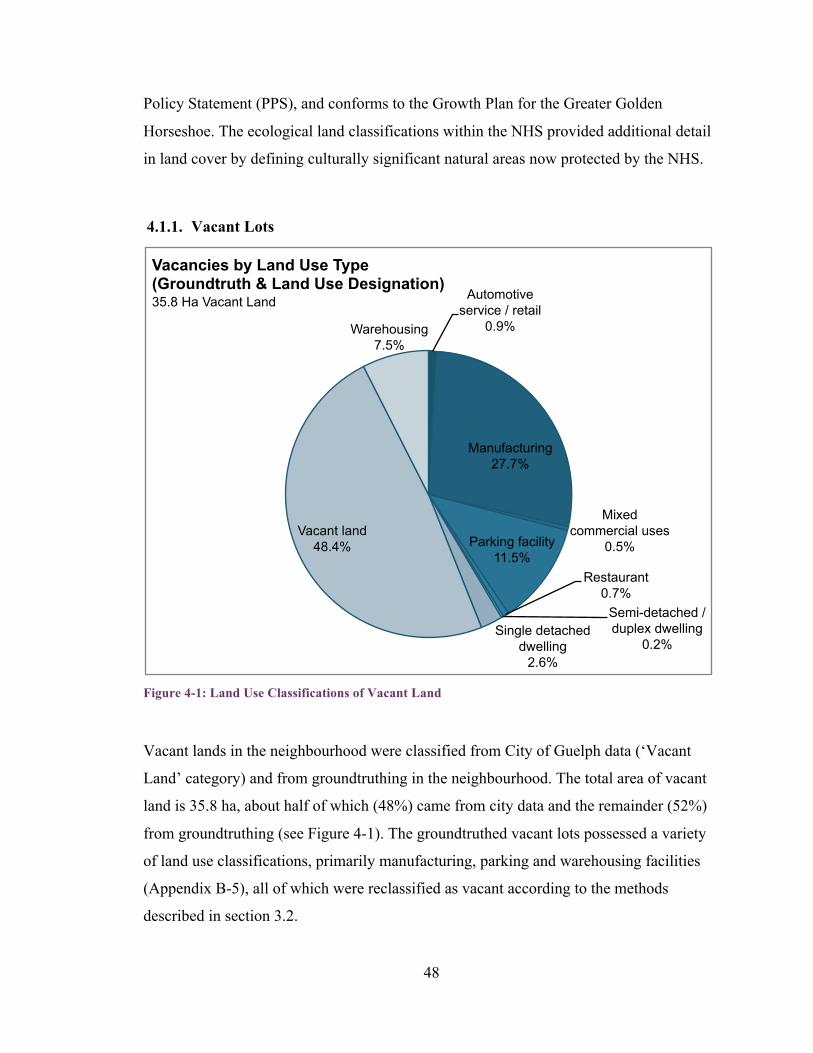
48
Policy Statement (PPS), and conforms to the Growth Plan for the Greater Golden
Horseshoe. The ecological land classifications within the NHS provided additional detail
in land cover by defining culturally significant natural areas now protected by the NHS.
4.1.1. Vacant Lots
Figure 4-1: Land Use Classifications of Vacant Land
Vacant lands in the neighbourhood were classified from City of Guelph data (‘Vacant
Land’ category) and from groundtruthing in the neighbourhood. The total area of vacant
land is 35.8 ha, about half of which (48%) came from city data and the remainder (52%)
from groundtruthing (see Figure 4-1). The groundtruthed vacant lots possessed a variety
of land use classifications, primarily manufacturing, parking and warehousing facilities
(Appendix B-5), all of which were reclassified as vacant according to the methods
described in section 3.2.
Automotive service / retail
0.9%
Manufacturing 27.7%
Mixed commercial uses
0.5% Parking facility 11.5%
Restaurant 0.7%
Semi-detached / duplex dwelling
0.2% Single detached
dwelling 2.6%
Vacant land 48.4%
Warehousing 7.5%
Vacancies by Land Use Type (Groundtruth & Land Use Designation) 35.8 Ha Vacant Land
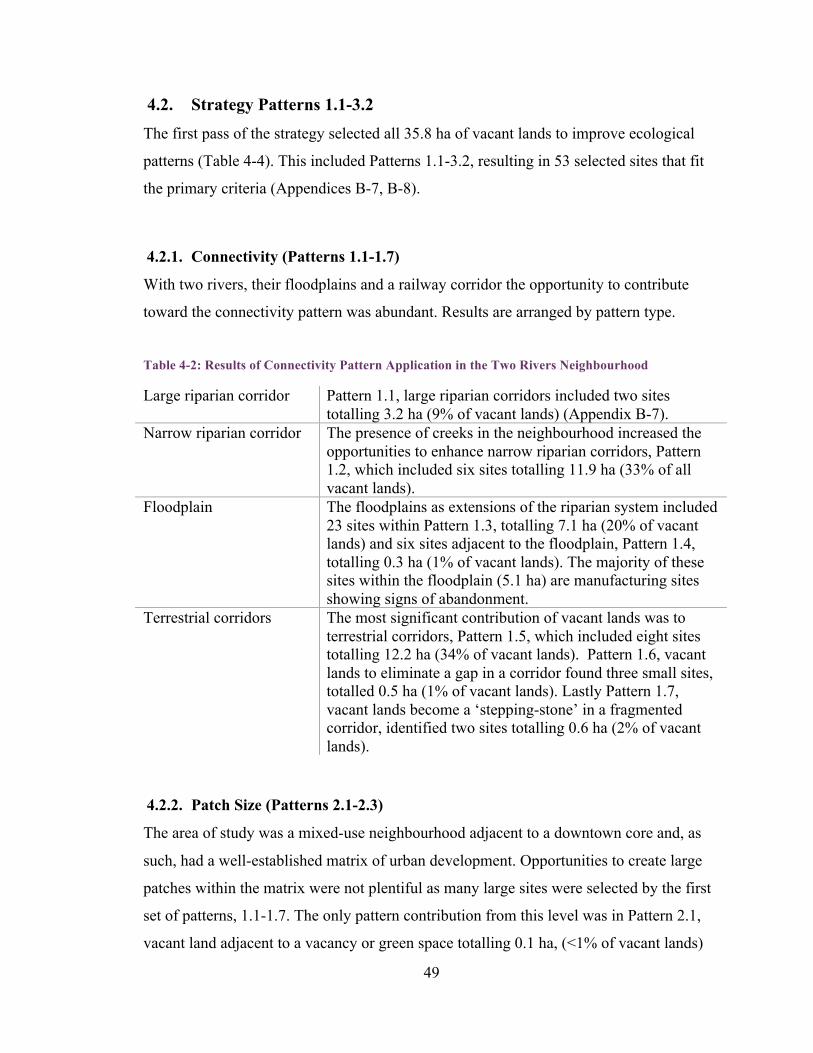
49
4.2. Strategy Patterns 1.1-3.2 The first pass of the strategy selected all 35.8 ha of vacant lands to improve ecological
patterns (Table 4-4). This included Patterns 1.1-3.2, resulting in 53 selected sites that fit
the primary criteria (Appendices B-7, B-8).
4.2.1. Connectivity (Patterns 1.1-1.7)
With two rivers, their floodplains and a railway corridor the opportunity to contribute
toward the connectivity pattern was abundant. Results are arranged by pattern type.
Table 4-2: Results of Connectivity Pattern Application in the Two Rivers Neighbourhood
Large riparian corridor Pattern 1.1, large riparian corridors included two sites totalling 3.2 ha (9% of vacant lands) (Appendix B-7).
Narrow riparian corridor The presence of creeks in the neighbourhood increased the opportunities to enhance narrow riparian corridors, Pattern 1.2, which included six sites totalling 11.9 ha (33% of all vacant lands).
Floodplain The floodplains as extensions of the riparian system included 23 sites within Pattern 1.3, totalling 7.1 ha (20% of vacant lands) and six sites adjacent to the floodplain, Pattern 1.4, totalling 0.3 ha (1% of vacant lands). The majority of these sites within the floodplain (5.1 ha) are manufacturing sites showing signs of abandonment.
Terrestrial corridors The most significant contribution of vacant lands was to terrestrial corridors, Pattern 1.5, which included eight sites totalling 12.2 ha (34% of vacant lands). Pattern 1.6, vacant lands to eliminate a gap in a corridor found three small sites, totalled 0.5 ha (1% of vacant lands). Lastly Pattern 1.7, vacant lands become a ‘stepping-stone’ in a fragmented corridor, identified two sites totalling 0.6 ha (2% of vacant lands).
4.2.2. Patch Size (Patterns 2.1-2.3)
The area of study was a mixed-use neighbourhood adjacent to a downtown core and, as
such, had a well-established matrix of urban development. Opportunities to create large
patches within the matrix were not plentiful as many large sites were selected by the first
set of patterns, 1.1-1.7. The only pattern contribution from this level was in Pattern 2.1,
vacant land adjacent to a vacancy or green space totalling 0.1 ha, (<1% of vacant lands)
50
(Appendix B-8). Patterns 2.2, vacant land compact in shape with a substantial core, and
Pattern 2.3, vacant land parallel to a corridor or large patch, were not found among the
vacancies in the neighbourhood.
4.2.3. Heterogeneous Matrix (Patterns 3.1-3.2)
Searching for small parcels to break up the homogeneous matrix of urban development
resulted in only one site under Pattern 3.2, a vacant land capable of generating a ‘tiny
patch’ boundary which totalled less than 0.1 ha (<1% of the vacant lands) (Appendix B-
8).
4.2.4. Contrast
For the purpose of spatial analysis, land use and land cover maps were merged and their
aggregated classifications (see Table 3-2, Table 3-3, Appendix B-4) formed the basis of
contrast evaluation for Pattern 4.1 of the strategy (Appendix B-9). Selecting vacant lands
with an ecological pattern (Patterns 1.1-3.2) that exhibited low contrast on 50% of its
perimeter (Pattern 4.1) added 18.4 ha of low contrast, “high” ecological valued, vacant
land (Appendix B-9).
4.2.5. Brownfields
Pattern 5.1 was the overlapping of low contrast lots with the City of Guelph Brownfield
Redevelopment Plan map, this resulted in the identification of eight brownfield sites
totalling 12.2 ha (City of Guelph, 2008) (Appendix B-10).
4.2.1. Neighbourhood Vitality
A. Walkability
Maps evaluating pre- and post-strategy walkability to accessible green spaces within the
neighbourhood are displayed in Figures 6.14 and 6.16. A radius of 400 metres around
each green space indicates the majority of existing, accessible green spaces are within a
5-minute walk within the neighbourhood, with the exception of the top north-west corner
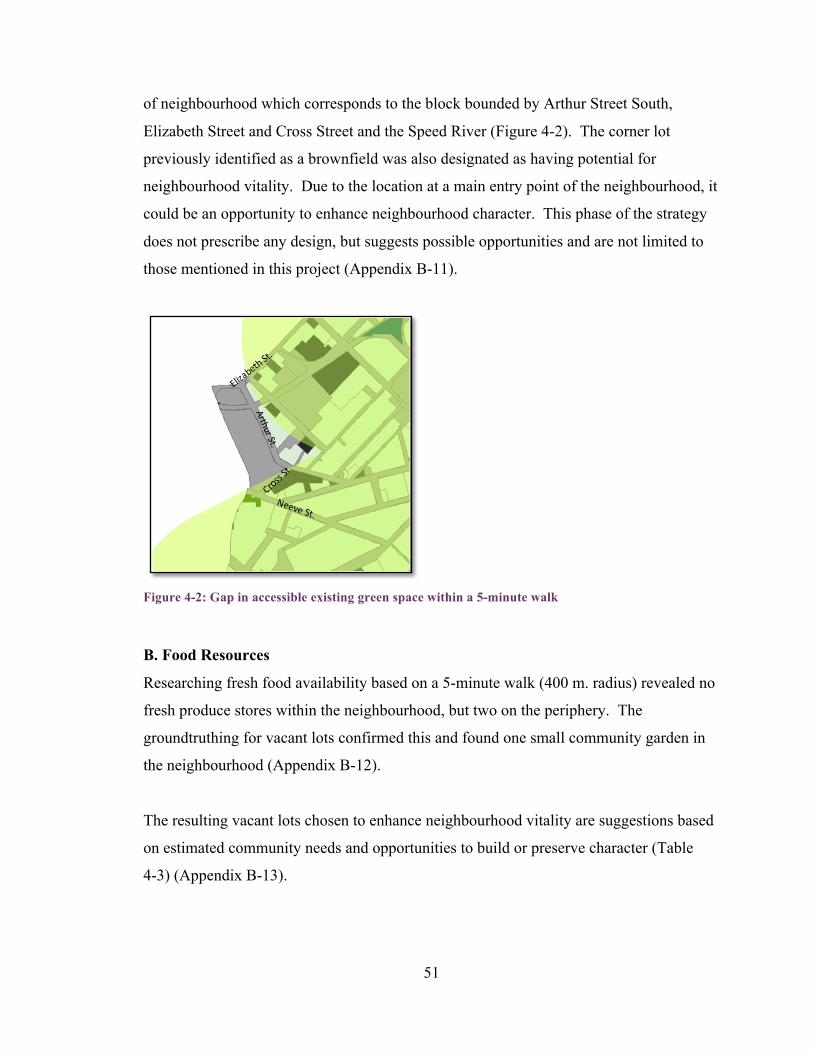
51
of neighbourhood which corresponds to the block bounded by Arthur Street South,
Elizabeth Street and Cross Street and the Speed River (Figure 4-2). The corner lot
previously identified as a brownfield was also designated as having potential for
neighbourhood vitality. Due to the location at a main entry point of the neighbourhood, it
could be an opportunity to enhance neighbourhood character. This phase of the strategy
does not prescribe any design, but suggests possible opportunities and are not limited to
those mentioned in this project (Appendix B-11).
Figure 4-2: Gap in accessible existing green space within a 5-minute walk
B. Food Resources
Researching fresh food availability based on a 5-minute walk (400 m. radius) revealed no
fresh produce stores within the neighbourhood, but two on the periphery. The
groundtruthing for vacant lots confirmed this and found one small community garden in
the neighbourhood (Appendix B-12).
The resulting vacant lots chosen to enhance neighbourhood vitality are suggestions based
on estimated community needs and opportunities to build or preserve character (Table
4-3) (Appendix B-13).
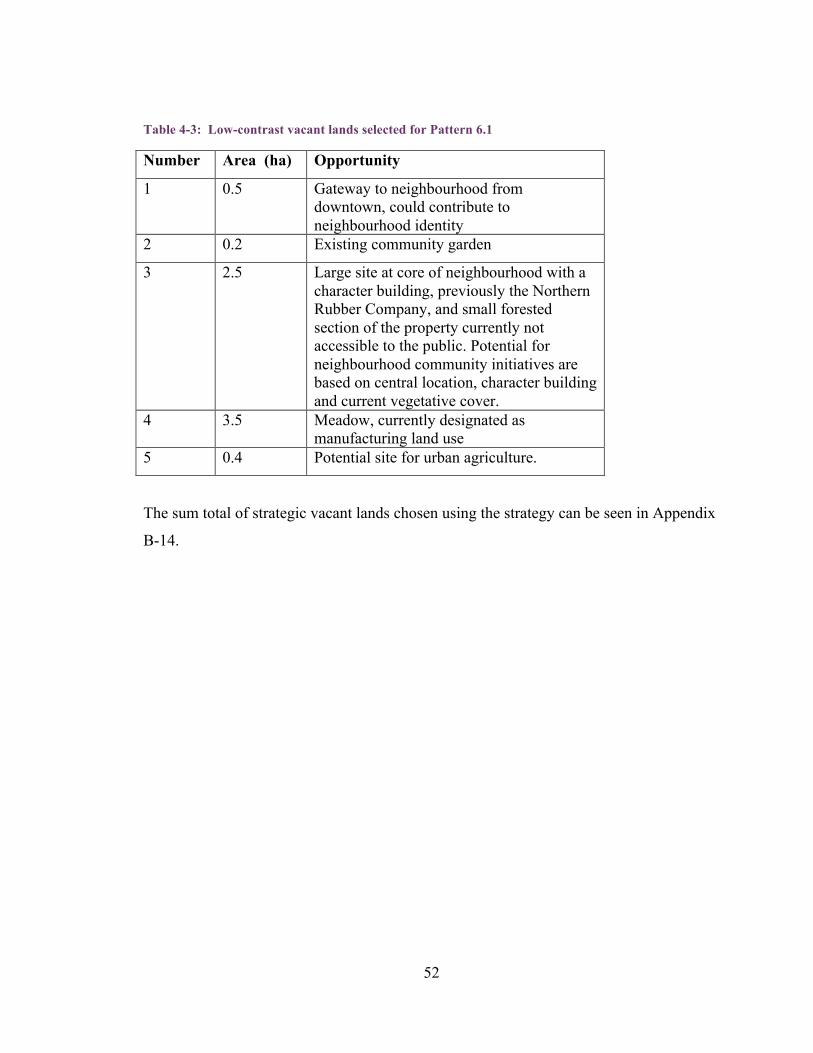
52
Table 4-3: Low-contrast vacant lands selected for Pattern 6.1
Number Area (ha) Opportunity
1 0.5 Gateway to neighbourhood from downtown, could contribute to neighbourhood identity
2 0.2 Existing community garden
3 2.5 Large site at core of neighbourhood with a character building, previously the Northern Rubber Company, and small forested section of the property currently not accessible to the public. Potential for neighbourhood community initiatives are based on central location, character building and current vegetative cover.
4 3.5 Meadow, currently designated as manufacturing land use
5 0.4 Potential site for urban agriculture.
The sum total of strategic vacant lands chosen using the strategy can be seen in Appendix
B-14.
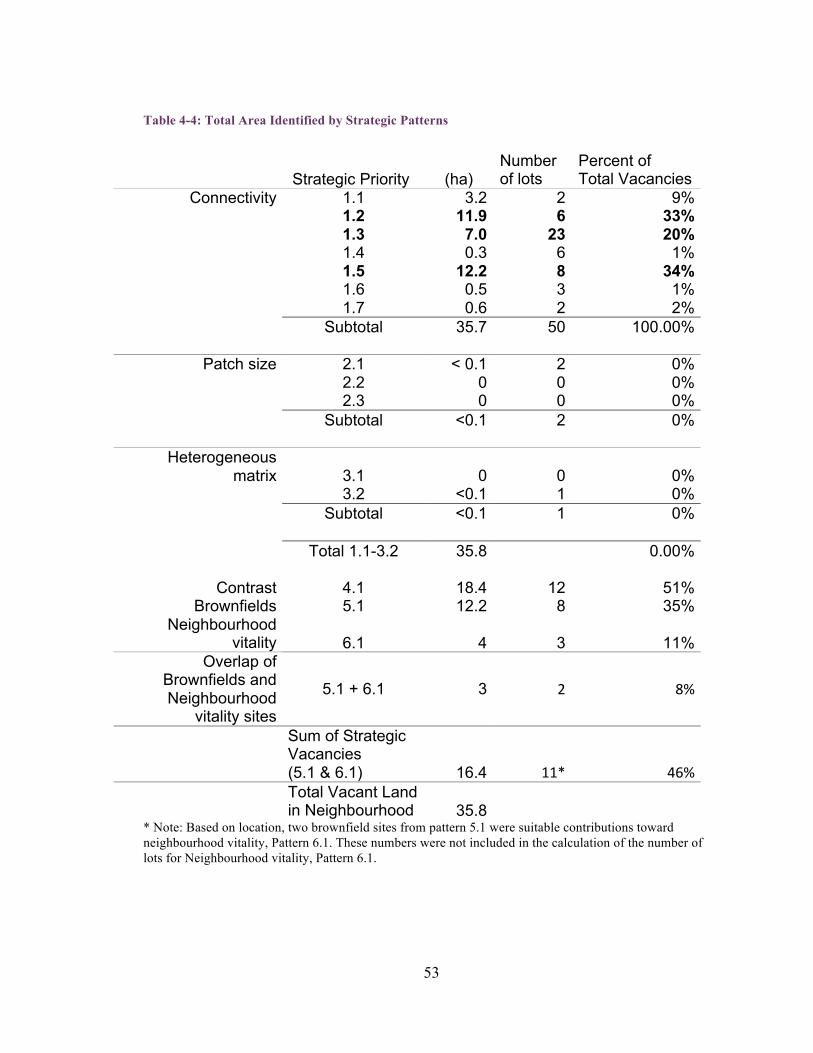
53
Table 4-4: Total Area Identified by Strategic Patterns
* Note: Based on location, two brownfield sites from pattern 5.1 were suitable contributions toward neighbourhood vitality, Pattern 6.1. These numbers were not included in the calculation of the number of lots for Neighbourhood vitality, Pattern 6.1.
Strategic Priority (ha) Number of lots
Percent of Total Vacancies
Connectivity 1.1 3.2 2 9% 1.2 11.9 6 33% 1.3 7.0 23 20% 1.4 0.3 6 1% 1.5 12.2 8 34% 1.6 0.5 3 1% 1.7 0.6 2 2% Subtotal 35.7 50 100.00%
Patch size 2.1 < 0.1 2 0% 2.2 0 0 0% 2.3 0 0 0% Subtotal <0.1 2 0%
Heterogeneous matrix 3.1 0 0 0%
3.2 <0.1 1 0% Subtotal <0.1 1 0% Total 1.1-3.2 35.8 0.00%
Contrast 4.1 18.4 12 51% Brownfields 5.1 12.2 8 35%
Neighbourhood vitality 6.1 4 3 11%
Overlap of Brownfields and Neighbourhood
vitality sites
5.1 + 6.1 3 2 8%
Sum of Strategic Vacancies (5.1 & 6.1) 16.4 11* 46%
Total Vacant Land in Neighbourhood 35.8
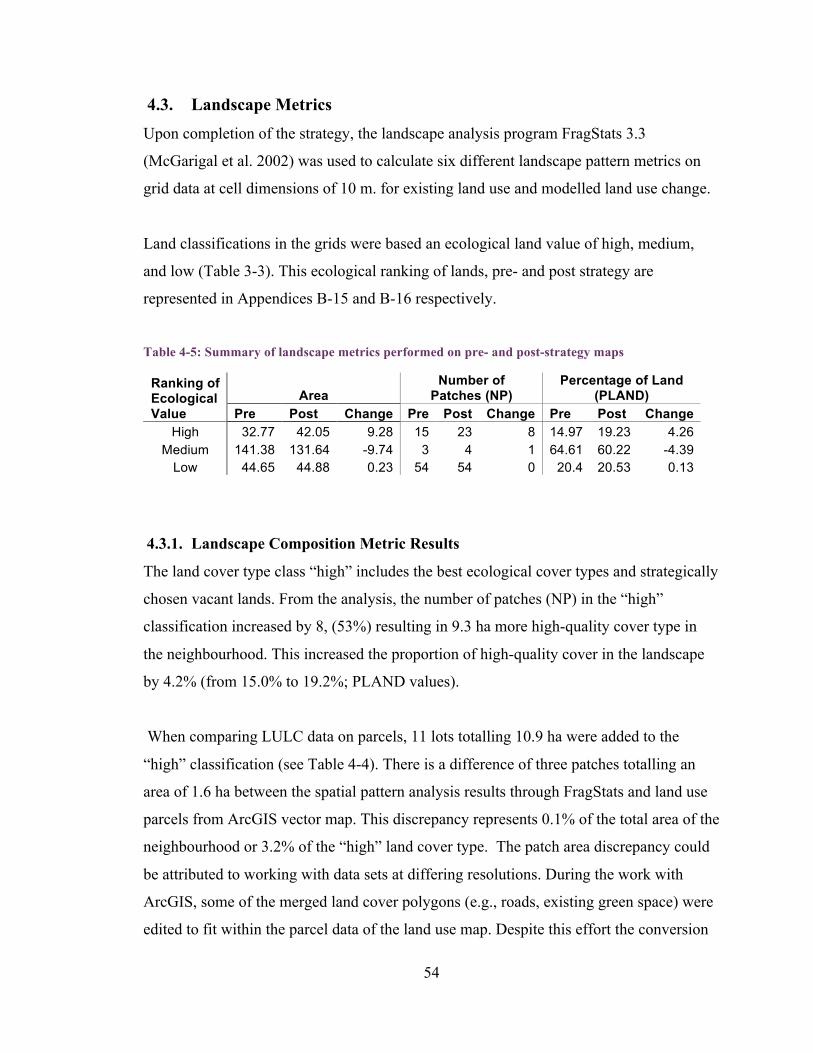
54
4.3. Landscape Metrics Upon completion of the strategy, the landscape analysis program FragStats 3.3
(McGarigal et al. 2002) was used to calculate six different landscape pattern metrics on
grid data at cell dimensions of 10 m. for existing land use and modelled land use change.
Land classifications in the grids were based an ecological land value of high, medium,
and low (Table 3-3). This ecological ranking of lands, pre- and post strategy are
represented in Appendices B-15 and B-16 respectively.
Table 4-5: Summary of landscape metrics performed on pre- and post-strategy maps
Area Number of
Patches (NP) Percentage of Land
(PLAND) Ranking of Ecological Value Pre Post Change Pre Post Change Pre Post Change
High 32.77 42.05 9.28 15 23 8 14.97 19.23 4.26 Medium 141.38 131.64 -9.74 3 4 1 64.61 60.22 -4.39
Low 44.65 44.88 0.23 54 54 0 20.4 20.53 0.13
4.3.1. Landscape Composition Metric Results
The land cover type class “high” includes the best ecological cover types and strategically
chosen vacant lands. From the analysis, the number of patches (NP) in the “high”
classification increased by 8, (53%) resulting in 9.3 ha more high-quality cover type in
the neighbourhood. This increased the proportion of high-quality cover in the landscape
by 4.2% (from 15.0% to 19.2%; PLAND values).
When comparing LULC data on parcels, 11 lots totalling 10.9 ha were added to the
“high” classification (see Table 4-4). There is a difference of three patches totalling an
area of 1.6 ha between the spatial pattern analysis results through FragStats and land use
parcels from ArcGIS vector map. This discrepancy represents 0.1% of the total area of the
neighbourhood or 3.2% of the “high” land cover type. The patch area discrepancy could
be attributed to working with data sets at differing resolutions. During the work with
ArcGIS, some of the merged land cover polygons (e.g., roads, existing green space) were
edited to fit within the parcel data of the land use map. Despite this effort the conversion
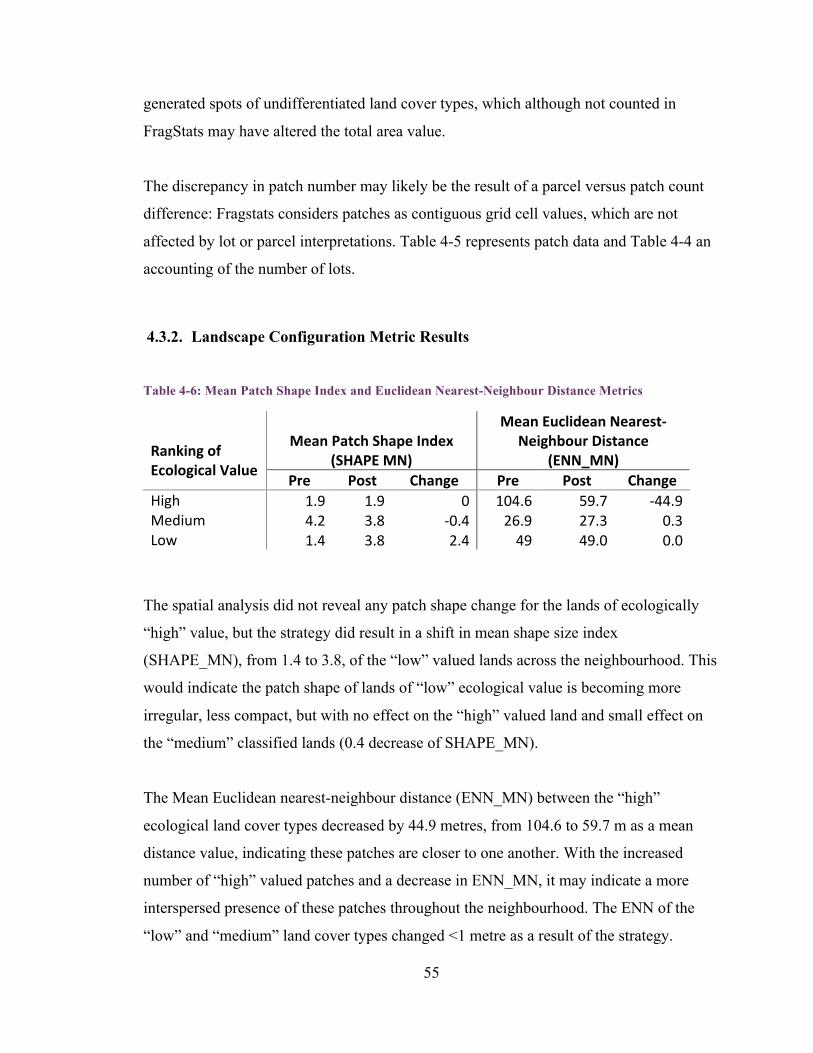
55
generated spots of undifferentiated land cover types, which although not counted in
FragStats may have altered the total area value.
The discrepancy in patch number may likely be the result of a parcel versus patch count
difference: Fragstats considers patches as contiguous grid cell values, which are not
affected by lot or parcel interpretations. Table 4-5 represents patch data and Table 4-4 an
accounting of the number of lots.
4.3.2. Landscape Configuration Metric Results
Table 4-6: Mean Patch Shape Index and Euclidean Nearest-Neighbour Distance Metrics
Mean Patch Shape Index (SHAPE MN)
Mean Euclidean Nearest-‐Neighbour Distance
(ENN_MN) Ranking of Ecological Value
Pre Post Change Pre Post Change High 1.9 1.9 0 104.6 59.7 -‐44.9 Medium 4.2 3.8 -‐0.4 26.9 27.3 0.3 Low 1.4 3.8 2.4 49 49.0 0.0
The spatial analysis did not reveal any patch shape change for the lands of ecologically
“high” value, but the strategy did result in a shift in mean shape size index
(SHAPE_MN), from 1.4 to 3.8, of the “low” valued lands across the neighbourhood. This
would indicate the patch shape of lands of “low” ecological value is becoming more
irregular, less compact, but with no effect on the “high” valued land and small effect on
the “medium” classified lands (0.4 decrease of SHAPE_MN).
The Mean Euclidean nearest-neighbour distance (ENN_MN) between the “high”
ecological land cover types decreased by 44.9 metres, from 104.6 to 59.7 m as a mean
distance value, indicating these patches are closer to one another. With the increased
number of “high” valued patches and a decrease in ENN_MN, it may indicate a more
interspersed presence of these patches throughout the neighbourhood. The ENN of the
“low” and “medium” land cover types changed <1 metre as a result of the strategy.
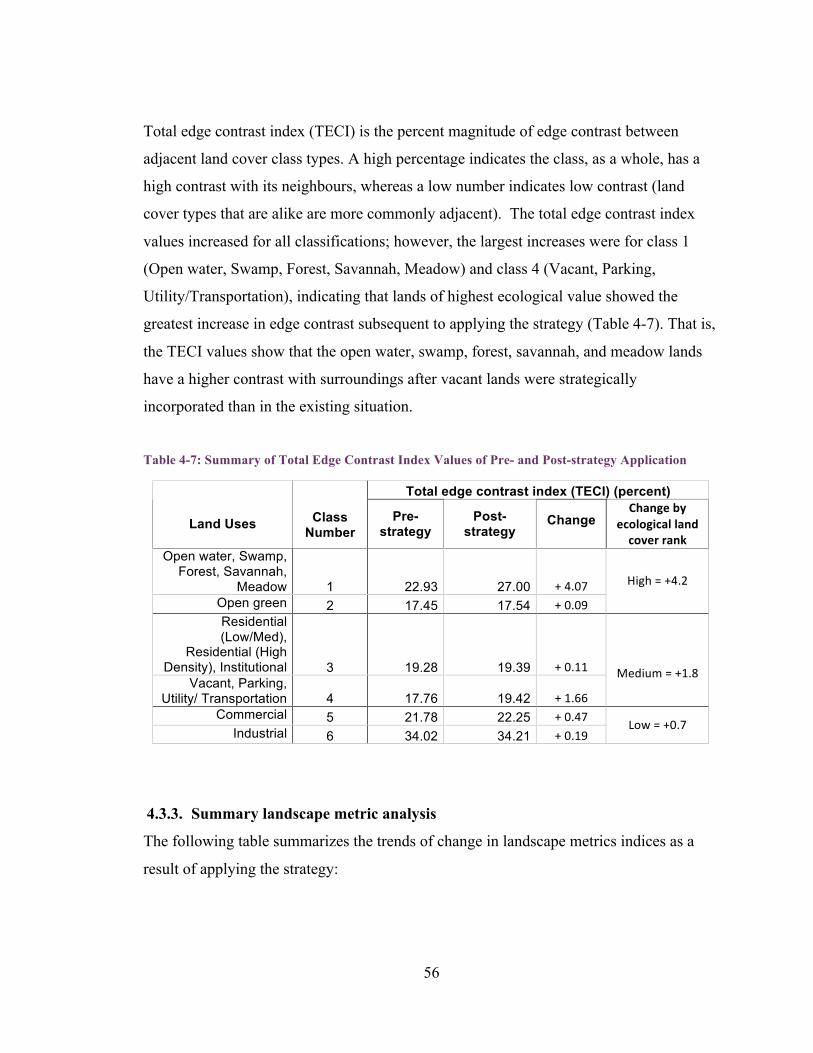
56
Total edge contrast index (TECI) is the percent magnitude of edge contrast between
adjacent land cover class types. A high percentage indicates the class, as a whole, has a
high contrast with its neighbours, whereas a low number indicates low contrast (land
cover types that are alike are more commonly adjacent). The total edge contrast index
values increased for all classifications; however, the largest increases were for class 1
(Open water, Swamp, Forest, Savannah, Meadow) and class 4 (Vacant, Parking,
Utility/Transportation), indicating that lands of highest ecological value showed the
greatest increase in edge contrast subsequent to applying the strategy (Table 4-7). That is,
the TECI values show that the open water, swamp, forest, savannah, and meadow lands
have a higher contrast with surroundings after vacant lands were strategically
incorporated than in the existing situation.
Table 4-7: Summary of Total Edge Contrast Index Values of Pre- and Post-strategy Application
Total edge contrast index (TECI) (percent)
Land Uses Class Number
Pre- strategy
Post-strategy
Change Change by
ecological land cover rank
Open water, Swamp, Forest, Savannah,
Meadow 1 22.93 27.00 + 4.07 Open green 2 17.45 17.54 + 0.09
High = +4.2
Residential (Low/Med),
Residential (High Density), Institutional 3 19.28 19.39 + 0.11
Vacant, Parking, Utility/ Transportation 4 17.76 19.42 + 1.66
Medium = +1.8
Commercial 5 21.78 22.25 + 0.47 Industrial 6 34.02 34.21 + 0.19
Low = +0.7
4.3.3. Summary landscape metric analysis
The following table summarizes the trends of change in landscape metrics indices as a
result of applying the strategy:
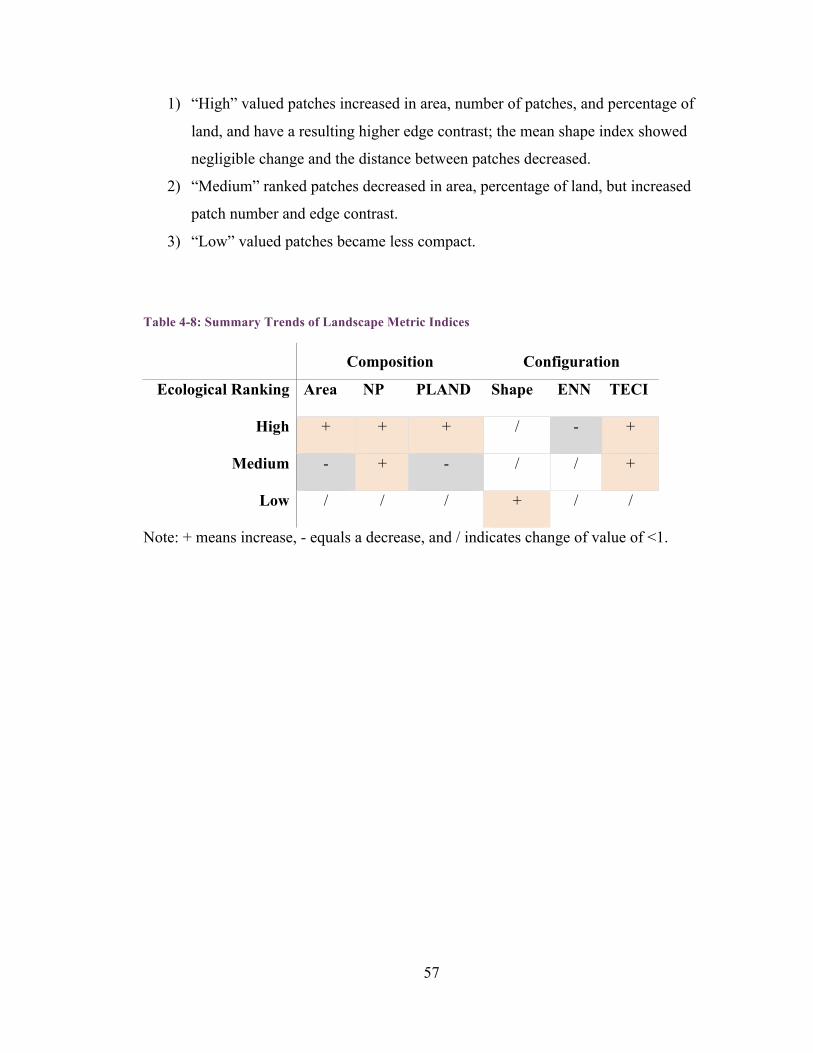
57
1) “High” valued patches increased in area, number of patches, and percentage of
land, and have a resulting higher edge contrast; the mean shape index showed
negligible change and the distance between patches decreased.
2) “Medium” ranked patches decreased in area, percentage of land, but increased
patch number and edge contrast.
3) “Low” valued patches became less compact.
Table 4-8: Summary Trends of Landscape Metric Indices
Composition Configuration
Ecological Ranking Area NP PLAND Shape ENN TECI
High + + + / - +
Medium - + - / / +
Low / / / + / /
Note: + means increase, - equals a decrease, and / indicates change of value of <1.
58
Chapter 5. Discussion
This chapter considers the development and application of the strategy to selecting vacant
lots for building a more ecologically-functional city, and explores the results of the
landscape pattern assessment relative to the strategy. It discusses the implications of
applying a strategic approach based on “indispensable patterns” from landscape ecology
literature. Based on the three key pattern attributes of connectedness, large patches of
diverse cover, and a heterogeneous matrix, the discussion describes how the pattern
attributes were applied and an interpretation of their measured outcomes. The chapter
concludes with limitations of this study offers and suggestions for future research.
5.1. Area-wide Approach This project was a test of altering spatial land use and land cover patterns within a highly
fragmented environment. It took an opportunistic approach with respect to choosing
vacant lands as the key ingredient of the approach, but a planned approach with respect to
the prioritized ecological patterns. The neighbourhood extent, as used in this work, is a
highly fragmented, social construct but provided strong bounding criteria for “area-wide”.
The approach enabled the use of multiple criteria to select from many lots exhibiting
ecological patterns and to identify some opportunities to enhance neighbourhood vitality.
The process considered adjacencies and interactions of the sites selected for enabling a
network of more ecologically valued land use, the result of which can not be duplicated
when considering an ad-hoc, site approach. This approach could be combined with
planning for areas of intensification; choosing lands more suitable for higher-density
development and reserving or reconstituting others that would help sustain the growth by
creating a more resilient, ecologically-healthy neighbourhood. The approach could also
be an alternate method for municipalities to address brownfields re-use. Cities investing
in brownfield lots that would otherwise remain idle, to receive higher ecological valued
land and the ecosystem services it brings.
59
5.2. Founding Principles The strategy developed for this project draws from ecological principles of land use and
spatial analysis methods synthesized from works of Forman (1995), Dramstad et al.
(1996), Hersperger (2006), and Ahern (1997). Their works support this strategic form of
urban ecological analysis and planning.
The strategy’s patterns were chosen from among Forman’s (1995) four indispensable
patterns to create a sustainable land plan. Three major themes were connectivity, large
vegetated patches and a heterogeneous matrix (small patches). The connectivity pattern
prioritized water corridors, then vegetative corridors. This was done in deference to the
importance of water as a resource and the cascade of negative effects a degraded water
source can create. “Large vegetated patches” was the second priority of the strategy
based on the positive impact it could provide for habitat; however, this choice presented
application challenges within the context of an urban neighbourhood, which will be
discussed further in section 5.3. The third theme, the ”heterogeneous matrix” created
small bits of habitat where possible, the advantage of which, in an urban neighbourhood,
is to break up the matrix of development and provide natural areas in closer proximity to
residences. The patterns were ordered by relative impact the intact ecological pattern
could have on the environment, from a larger impact to less so.
5.3. Application and Effects The strategy defined patterns to build from the vacant lot ‘building blocks’. The outcome
of spatial analysis provides feedback whether the method by which the lots were chosen
resulted in an improvement in the ecological pattern of interest. In the application of the
strategy in the Two Rivers neighbourhood, connectivity patterns were abundant in the
matrix. These patterns claimed most of the vacant lots, 50 of the total 53 (Table 4-4). The
predominance of this pattern may be site-specific (i.e., post-industrial neighbourhood). It
did present challenges for identifying the remaining patterns in the matrix.
60
5.3.1. Connectivity
The majority of vacant lands absorbed by the strategy were as a result of the connectivity
patterns (1.1-1.7). After these were applied to the neighbourhood, patterns to re-establish
large patches (patterns 2.1-2.3) acquired only two small lots, totalling <0.1 ha and
patterns to improve a heterogeneous matrix (Patterns 3.1 and 3.2) contributed one very
small lot. Thus any changes to patch size and heterogeneity are primarily the result of
enhancing connectivity. Elements of corridors, either natural (i.e., rivers) or engineered
(i.e., railways) were strong in the existing spatial pattern of the neighbourhood.
Within the patterns of connectivity, the major strategic additions were a result of
adjacency to terrestrial corridors (1.5-1.7), 34% of vacant lots; then narrow riparian
corridor adjacency, Pattern 1.2 selected 33% of vacancies; and being within or adjacent to
a floodplain (Patterns 1.3 and 1.4), 21% of vacant lots.
The patterns to improve narrow riparian corridors identified mostly large manufacturing
lots with the presence of a creek, either surface or buried water. The floodplain, in
ecological terms, represents a low-lying habitat zone potentially exposed to the periodic
presence of water. Re-integrating these patterns could be valuable opportunities to
contribute to healthier urban hydrology. Municipal zoning places less desirable land uses
(i.e., industry and manufacturing) in the less desirable lands (i.e. low-lying areas or with
presence of surface hydrology making development difficult). Building connectivity
using patches within the floodplain transforms the ecologically “low” ranked land cover
use (i.e., industry and manufacturing) to higher ecologically-valued land use. This effort
would see true potential if eventually riparian corridors were returned to a more natural
state; applying Patterns 1.1 -1.4 would support this effort. It would help create softer
edges to the riparian system, protecting habitat, and supporting movement and flow of
materials (Forman, 1995).
Within the selected area of study, the terrestrial corridor was interpreted as the system of
railway lines through the neighbourhood. Along certain sections of route, the mown verge
of the rail corridor is used as a pedestrian path and its presence is a reminder of the
61
industrial heritage that includes textile mills and a rubber factory (Crowley, 2010). It is
likely that the addition of patches adjacent to the “terrestrial” corridor, contributed more
to heterogeneous matrix than to a pattern of connectivity. It may have the added benefit of
buffering more of the railway activity from residential land use; however, the transformed
land may experience a certain negative adjacency due this activity.
Improvement in connectivity can be inferred by the decrease in the Mean Euclidean
nearest-neighbour distance (ENN_MN) an index suitable for a highly fragmented matrix,
one that measures connectivity allowing for gaps. The decreased ENN_MN indicates
patches are closer, potentially improving movement between them via a network of
stepping-stones or “circuitry” within the neighbourhood (Dramstad, Olson, & Forman,
1996).
The majority of vacant lots being absorbed by patterns of connectivity may reflect the
predominance of this pattern in urban post-industrial neighbourhoods, indicating the
degree development has both created and intruded upon the corridors within the
neighbourhood. Whether engineered or natural, the corridors within an urban matrix
should be nurtured as a means to support movement through a highly fragmented
environment.
5.3.2. Patch size
Patch size and shape are important in landscape pattern assessment (Dramstad, Olson, &
Forman, 1996; Forman, 1995). The strategy specifically attempted to increase patch size
of diverse land covers with strategic Patterns 2.1-2.3 (Appendices A-1 and B-8). The site
is highly fragmented by roads and other urban infrastructure, as well as urban land uses
and cover types of poor habitat quality. Patch size is limited by the grain size of the urban
matrix to norms for city blocks and urban lots, with larger vacant lots commonly zoned
for industry, institutional, or commercial purposes. The shape of urban vacancies is
regular and geometric – mainly rectangular, elongated, or triangular. The formal language
of the urban matrix limits the range of expected outcomes in changing patch sizes or
shapes.
62
After the connectivity patterns were applied, there were few remaining vacant lots that
could create a large patch or increase an existing patch size substantially. Patterns 2.1-2.3
for identifying opportunities to build large patches identified only two small lots
(Appendix B-8). These two lots were less than 0.1 ha in area and do not appear to
contribute sufficiently to building larger patches in a dense urban matrix.
Three of the metrics used in the analysis describe the outcome of the strategy with respect
to patterns for large patches: area, mean shape index (SHAPE_MN) and percentage of
land (PLAND). Area of “high” valued land increased by 9.3 hectares and the percentage
of land increased by 4.3%; however, there was no change in SHAPE_MN, indicating the
addition of these patches was not sufficient to achieve a more compact shape of these
lands.
The shape index increased for “low” ecologically ranked patches, from 1.4 to 3.8 (Table
4-6), indicating that compact shape of the “low” ranked lands was distorted, from an
insertion of green space, which may have resulted in the increase in total edge contrast
index (TECI) for the “high” valued lands. The principle of shape compaction to improve
core habitat (Dramstad, Olson, & Forman, 1996) inserted in the strategy in Patterns 2.1-
2.3, was not met. Although the brownfields contributed large areas within the context of
an urban neighbourhood, their addition did not result in a patch shape change (Table 4-4).
These patterns may not be achievable within a rectilinear infrastructure of an urban
matrix, and with the use of only existing vacant lots.
5.3.3. Heterogeneous Matrix
The third pattern in the strategy looked for opportunities to ‘soften the matrix’ with small
patches of green. As mentioned previously, only one small lot was found to contribute to
this pattern (Appendix B-8). Any changes in this pattern would be as a result of
previously established patterns, largely the strategic patterns for connectivity. For “high”
value lands, ENN_MN decreased by 45 m. (Table 4-6) and TECI increased by 4.2%
(Table 4-7), which is interpreted as green patches closer and transforming areas that
previously had at least 50% of “medium” valued lands on the perimeter (Pattern 4.1, low
63
contrast, Table 3-3). The result is an encroachment of green spaces in areas with
classified land uses predominantly residential (low to high density) or institutional
supporting an increase in natural areas. The increase could support greater biodiversity,
resilience and unique amenities contributing to a more desirable neighbourhood (Ling &
Dale, 2011).
From the abundance of low contrast lots (Appendix B-9), only those identified as
brownfields or thought to have potential to increase community vitality based on the lots
location and needs loosely indentified by Pattern 6.1 were chosen. These final criteria
(Patterns 5.1 and 6.1) were derived in a manner to reduce the overall number of strategic
lots and present a more feasible planning outcome. The patterns and their order in the
strategy could be altered based on different ecological or community needs. For instance,
if small patches to create a more heterogeneous matrix were a priority and brownfields
were not considered, likely the result would be a dramatic increase in the number of
“high” valued patches in the matrix, a lowering of the ENN_MN and potentially further
increasing TECI. Within the context of the urban neighbourhood it would be seen as a
dispersal of “high” ecological valued lands. The insertion of “high” value patches into a
mostly residential matrix may create positive adjacency effects (e.g., noise buffering,
cooling effects of urban forested areas, providing recreational opportunities, more
experiences with nature promoting well-being and increasing location preference and
residential value) (Di Giulio, Holderegger, & Tobias, 2009; Halton Region, 2011;
Hersperger, 2006; Kahn, 2002).
5.4. Limitations The approach to this work was unusual in its scale (i.e., neighbourhood) and use of vacant
lands, both publicly and privately owned. The following express some of the limitations
to the approach.
64
5.4.1. Landscape metrics
In this project several indices were used on ecologically ranked neighbourhood patches,
pre- and post-strategy, to assess if any ecological changes might result from the change in
landscape indices. However, these indices are not explicitly linked to ecological processes
(Corry & Nassauer, 2005) and change in particular indices, i.e., decrease in patch distance
as measured by Euclidean nearest-neighbour distance, does not mean definitively that
patches will act as stepping-stones and result in a movement of species in the
environment.
5.4.2. Scale
Using a neighbourhood scale for urban spatial analysis meant using data that were not
resolved for finer-scale environments such as urban neighbourhood (i.e., Southern
Ontario Land Resource Information System) (Ontario Ministry of Natural Resources,
2008). There are no data readily available on land cover at a sub- or small parcel level
other than what can be derived from using satellite imagery. SOLRIS as currently
available gives the impression of a largely binary land cover for urban environment,
either built-up impervious or built-up pervious in cities. This is as a result of data
resolution and its classification, i.e., green spaces and other pervious features are included
within built-up impervious if the portion of pervious surfaces (e.g., grass, vegetation and
bare ground) is less than 80% per 0.5 ha (Ontario Ministry of Natural Resources, 2008).
This classification procedure leads to the exclusion of many small patches of green at the
neighbourhood scale and inaccurate accounting of this land cover in the urban landscape.
If future application of the strategy has as a measured objective to increase the pervious
surface area in a neighbourhood, (i.e., for improved stormwater management) then small
parcel data would be required information.
In quantifying vacant lands within the neighbourhood, only municipally-owned vacant
lands were available on land use maps (DMTI Spatial Inc., 2011). The strategy involved
groundtruthing for all vacant lots, regardless of ownership. It was an attempt to provide a
more accurate accounting of neighbourhood vacancy; the presence of these lots
contributes to an appearance of dereliction regardless of ownership. However, data on
65
privately owned vacant lots are difficult to obtain. As groundtruthing found vacancies it
also found recent development. Groundtruthing is time consuming and the criteria listed
in Section 3.2 are subject to interpretation and may result in error.
Brownfield contamination information is also data not readily available, but it could
contribute to the strategy. Knowledge of contaminant type and the extent of
contamination must be obtained before considering proposed uses such as urban
agriculture.
The re-classification of the land use and land cover (LULC), and the task of aggregating
these was a matter of interpretation and theory. Methods described in Section 3.4 merged
many LULC classifications from four data sources together and reduced them to six
LULC classifications (Table 3-3). Ecological ranking of these classifications was based
on how close the land represented in the classification was to a natural state. This data
manipulation is based on a synthesis of theory outlined in Section 2, but the application is
still subjective.
5.4.3. Community Vitality Criteria
New urbanist principles were applied within the strategy. They provide guidelines for
urban development in which services, (i.e., health services, food, commerce, and open
green space) are readily accessible within a neighbourhood. Walkability and location of
food resources are easily measured and readily available data; however, a more
exhaustive list based on community input would be valuable additions to the strategy. In
similar work done by Schadler et al. (2011), the team derived sustainability goals for the
redevelopment of brownfields; borrowing from their work, additional goals for vitality
could provide a more comprehensive list of opportunities for this aspect of the work.
Ultimately, the area-wide approach would entail community engagement with planners to
establish a list of community needs to inform the community vitality patterns, Pattern 6.1,
see Section 5.8.
66
5.5. Future Work
5.5.1. Landscape Metrics
The increase of TECI for “high” valued lands suggested further work necessary to assess
the impact on the overall success of re-integrating vacant lands into more ecological
patterns. It was an unexpected outcome and should not be considered as the sole indicator
for strategy success. It may be a by-product of the land transformation. How this index
works in concert with others within a land transformation such as this one requires further
investigation.
Another metric in which the interpretation might mislead is the SHAPE_MN index. It is
not tuned to the fine scale of an urban neighbourhood. It is relatively insensitive to
differences in patch morphology (McGarigal, Cushman, Neel, & Ene, 2002). More finer-
scaled SHAPE indices may provide greater insight into patch shape changes as a result of
the strategy application.
5.5.2. Ecosystem Service Models
The incentive to remediate vacant lots to address a dysfunctional ecosystem network will
require the municipal will and community participation to do so along with financial
initiatives. Municipal policy incentives exist and the economic potential of redevelopment
for some lots is evident; however, the economic benefits derived from their conversion to
more ecologically functional land cover are much less evident. The land in the urban core
of many major cities is highly valued and the municipality would derive no income from
additional green spaces, but likely incur maintenance costs. Ecosystem services are
defined as “the provision of direct and indirect benefits to people from
ecosystems”(Chan, Satterfield, & Goldstein, 2012, p. 8), direct benefits such as reducing
energy demands of air cooling and infrastructure cost in terms of stormwater
management, but also indirect cultural returns that cannot be quantified monetarily
(Bolund & Hunhammar, 1999). Ecosystem service models are in the early stages of
development with research yet to agree upon constituent elements and metrics of a
‘healthy’ ecosystem (Su, Fath, & Yang, 2010). However, when attempting to convince
67
municipalities of the benefit of increasing green space, ecosystem service calculations
may be a compelling part of the evaluation process in the future.
5.5.3. Neighbourhood vitality
As mentioned earlier, walkability and location of food resources are easily measured and
readily available data. However, a more exhaustive list based on user input would be
valuable additions to the strategy. Work done by Schadler et al. (2011) derived
sustainability goals for the redevelopment of brownfields; borrowing from their work,
additional goals for vitality could include:
1) Reduction of individual car use, i.e., do the sites have good access to public
transportation? At the neighbourhood scale for this methodology, the criteria
could be defined as: does the location of the site promote pedestrian
movement through the neighbourhood?
2) Primary school walking distance: selecting sites closer to schools to provide
additional recreational amenities for children. This criteria could be expanded
to include any institution likely present in a neighbourhood (i.e., hospital or
church).
5.6. Conclusion As cities strive to balance growth and the maintenance of infrastructure, looking to
different models of urban development may be required to ensure desirable, more
sustainable cities. Land-management strategies that reduce the anthropogenic effects of
urbanisation, should “combine ecological values including biodiversity and more
sustainable land use along with social values of restoration” (Di Giulio, Holderegger, &
Tobias, 2009, p.2960).
Including ecological patterns considered “indispensable” (Forman, 1995) with the use of
vacant lands is a planning concept for a more sustainable way forward for urban
neighbourhoods. The strategy as proposed in this work attempts to apply these ecological
68
patterns, in a prioritized order, using readily available material, (i.e., vacant lots) to
improve a compromised urban ecosystem. Results indicate that connectivity patterns
played a strategic role in the outcome and it is easier to make an urban matrix
heterogeneous at any point, but opportunities for creating large patches are few.
The strategy could be used to test choices of sites, as well as establish priorities among
them to aid phasing of land transformations. Alternatively, the strategy could be applied
beyond the scope of vacant lots, to identify degraded ecological patterns and key patches,
to be prioritized as useful for future ecological improvement. Testing the constituent
patterns and priorities is needed to clarify their relationship to the results.
69
References
Ahern, J. (1997). Spatial concepts, planning strategies, and future scenarios: A framework
method for integrating landscape ecology and landscape planning. Landscape ecological analysis: Issues and applications (pp. 175-201). New York: Springer.
Alberti, M., Marzluff, J. M., Shulenberger, E., Bradley, G., Ryan, C., & Zumbrunnen, C. (2003). Integrating humans into ecology: Opportunities and challenges for studying urban ecosystems. Bioscience, 53(12), 1169-1179.
Applegath, C. (2012). ResilientCity.org. Retrieved 04/20, 2012, from http://www.resilientcity.org/index.cfm?pagepath=Resilience&id=11449
Arnold Jr., C. L., & Gibbons, J. C. (1996). Impervious surface coverage: The emergence of a key environmental indicator. Journal of the American Planning Association, 62(2), 243.
Artibise, A. F. J., & Stelter, G. A. (2011). The Canadian encyclopedia: Urbanization. Retrieved 12/11http://www.thecanadianencyclopedia.com/index.cfm?PgNm=TCE&Params=A1ARTA0008280
ASCE. (1998). Sustainability criteria for water resource systems. Reston, Virginia: American Society of Civil Engineers (ASCE), Water Resources Planning and Management Division and UNESCO International Hydrological Programme IV Project M-4.3 Task Committee on Sustainability Criteria.
Bolund, P., & Hunhammar, S. (1999). Ecosystem services in urban areas. Ecological Economics, 29(2), 293-301.
Botequilha Leitão, A., & Ahern, J. (2002). Applying landscape ecological concepts and metrics in sustainable landscape planning. Landscape and Urban Planning, 59(2), 65-93.
Brock University Map Library. (2012). Modified from: Southern Ontario-regional municipality boundaries. St. Catharines, Ontario: Brock University.
Brunt, C., & Winfield, M. (2005). Local Implementation of Smart Growth Policies in Ontario: Three case studies. Drayton Valley: Pembina Institute; Pembina Institute.
Bunce, S. (2004). The emergence of ‘smart growth’ intensification in Toronto: Environment and economy in the new official plan. Local Environment, 9(2), 177-191.
Chan, K. M. A., Satterfield, T., & Goldstein, J. (2012). Rethinking ecosystem services to better address and navigate cultural values. Ecological Economics, 74, 8.
City of Guelph. (2007). Guelph Street Network (single line). Guelph; ON; Canada: City of Guelph. (2008). City Of Guelph Brownfield Redevelopment Community
Improvement Plan. Guelph: City of Guelph. City of Guelph: Planning, Engineering and Environmental Services. (2010). Envision
Guelph: Official Plan Amendment no. 42 natural heritage system amendment No. 10-71). Guelph: City of Guelph.
City of Ottawa. (2007). Brownfields Redevelopment Program. Retrieved 01/31http://www.ottawa.ca/residents/planning/brownfields/index_en.html
City of Toronto. (2008). The Toronto community improvement plan for brownfield remediation and development of prescribed employment uses. Toronto: City of Toronto.
CMHC. (2012). Increasing density through lot size and design. Retrieved 03/20, 2012, from http://www.cmhc-schl.gc.ca/en/inpr/afhoce/tore/afhoid/cohode/indethloside/index.cfm
Congress for the New Urbanism. (2001). Ped sheds tech sheet. Congress for the New Urbanism.
70
Corbin, C. I. (2003). Vacancy and the landscape: Cultural context and design response. Landscape Journal, 22(1), 12-24.
Corry, R. C., & Nassauer, J. I. (2005). Limitations of using landscape pattern indices to evaluate the ecological consequences of alternative plans and designs. Landscape and Urban Planning, 72(4), 265-280.
Crowley, T. (2010). Ward One Guelph: A walking tour from the Eramosa river to the bluffs. Guelph, On.: Guelph Arts Council.
De Sousa, C. A. (2004). The greening of brownfields in American cities. Journal of Environmental Planning and Management, 47(4), 579-600.
De Sousa, C. A. (2003). Turning brownfields into green space in the city of Toronto. Landscape and Urban Planning, 63, 181–198.
Di Giulio, M., Holderegger, R., & Tobias, S. (2009). Review effects of habitat and landscape fragmentation on humans and biodiversity in densely populated landscapes. Journal of Environmental Management, 90, 2959–2968.
DMTI Spatial Inc. (2009a). Hydrography (HYL). Markham, Ontario DMTI Spatial Inc. (2009b). Neighbourhood boundaries (NBH) - Canada. Markham,
Ontario DMTI Spatial Inc. (2009). CanMap rail (RL). Markham, Ontario DMTI Spatial Inc. (2011). Land use. Markham, Ontario Dramstad, W. E., Olson, J. D., & Forman, R. T. T. (1996). Landscape ecology principles
in landscape architecture and land-use planning. Cambridge, Mass.: Washington, DC : Washington, D.C.: Harvard University Graduate School of Design ; Island Press ; American Society of Landscape Architects.
Dunn, C. P., & Heneghan, L. (2011). Composition and diversity of urban vegetation. In J. Niemelä (Ed.), Urban ecology (1st ed. ed., pp. 103). Oxford: Oxford University Press.
Environment Canada. (2001). Urban water indicators: Municipal water use and wastewater treatment No. SOE Bulletin No. 2001-1
Environment Canada. (2008). Municipal wastewater status in Canada Environment Canada. (2011). 2011 Municipal Water Use Report – municipal water use
2009 statistics No. En11-2/2009E-PDF. Ottawa: Minister of the Environment. Environmental Protection Agency. (2012). Brownfields area-wide planning pilot
Program. Retrieved 04/21, 2012, from http://www.epa.gov/brownfields/areawide_grants.htm
EPA. (2011). Basic Information: Brownfields and land revitalization: US environmental protection agency. Retrieved 11/06, 2011, from http://epa.gov/brownfields/basic_info.htm
Forman, R. T. T., & Godron, M. (1986). Landscape ecology. New York: John Wiley & Sons.
Forman, R. T. T. (1995). Land Mosaics: The ecology of landscapes and regions. Cambridge; UK: Cambridge University Press.
Freemark, K. E., Dunning, J. B., Hejl, S. J., & Probst, J. R. (1995). A landscape ecology perspective for research, conservation, and management. In T. E. Martin, & D. M. Finch (Eds.), Ecology and management of neotropical migratory birds (pp. 381). New York: Oxford University Press.
Fromm, E. (1964). The heart of man, its genius for good and evil. New York; New York, Harper Row: Harper & Row.
Gaston, K. J. (2010). Urban Ecology. Cambridge: Cambridge Univ Press. Gayda, S., Haag, G., Besussi, E., Lautso, K., Noël, C., Martino, A., et al. (2005). The
Scatter Project - sprawling cities and transport: From evaluation to recommendations. No. EVK4-CT-2001-00063)STRATEC S.A.
71
Gertler, M. (1995). Adapting to New Realities: Industrial land outlook for metropolitan Toronto, Durham, York, Halton, Peel, Hamilton-Wentworth and Waterloo. Toronto: Berridge Lewinberg Greenberg Dark Gabor Ltd.
Giddings, E. M. P., Bell, A. H., Beaulieu, K. M., Cuffney, T. F., Coles, J. F., Brown, L. R., et al. (2009). Selected physical, chemical, and biological data used to study urbanizing streams in nine metropolitan areas of the United States, 1999–2004 No. Data Series 423). U.S. Geological Survey.
Google Earth. (2006). Images of Guelph (43º32'29.02"N, 80º14'24.80"W elevation 312 m) Google Inc.
Grand River Conservation Authority. (2011). Regulatory Floodplain GRCA. Grinde, B., & Patil, G. G. (2009). Biophilia: Does visual contact with nature impact on
health and well-being? International Journal of Environmental Research and Public Health, 6(9), 2332-2343.
Gustafson, E. J. (1998). Quantifying landscape spatial pattern: What is the state of the art? Ecosystems, 1, 143–156.
Halton Region. (2011). 2010 Urban Development – walking distance indicator report. Halton Region.
Heerwagen, J. H., & Orians, G. H. (1993). Humans, Habitats and Aesthetics. In S. R. Kellert, & E. O. Wilson (Eds.), The biophilia hypothesis. Washington, DC: Island Press.
Heisz, A., & LaRochelle-Côté, S. (2005). In by Andrew Heisz and Sébastien LaRochelle-Côté. (Ed.), Work and commuting in census metropolitan areas, 1996-2001 Ottawa, Ont. : Statistics Canada, 2005.
Hersperger, A. M. (2006). Spatial adjacencies and interactions: Neighborhood mosaics for landscape ecological planning. Landscape and Urban Planning, 77(3), 227-239.
Hough, M. (2004). Cities and natural process (2nd ed.). London: Routledge. HRSDC Canada. (2011). Geographic distribution / canadians in context / indicators of
well-being in canada Hur, M., Nasar, J. L., & Chun, B. (2010). Neighborhood satisfaction, physical and
perceived naturalness and openness. Journal of Environmental Psychology, 30(1), 52-59.
Jakle, J. A. (1992). In Wilson D. (Ed.), Derelict Landscapes: The wasting of America’s built environment. Savage, Md.: Rowman & Littlefield.
Kahn, P. H. (2002). Children's affiliations with nature: Structure, development, and the problem of enviromental generational amnesia. Children and nature (pp. 92-115). Massachusetts: MIT Press.
Kushner, J. A. (2003). Smart growth, new urbanism and diversity: Progressive planning movements in America and their impact on poor and minority ethnic populations. UCLA Journal of Environmental Law & Policy, 21(1), 45.
LaCroix, C. J. (2010). Urban agriculture and other green uses: Remaking the shrinking city. The Urban Lawyer, 42(2), 225.
Ling, C., & Dale, A. (2011). Nature, place and the creative class: Three Canadian case studies. Landscape and Urban Planning, 99(3), 239-247.
Marshall, E., & Shortle, J. (2005). Urban development impacts on ecosystems. In S. Goetz, J. Shortle & J. Bergstrom (Eds.), Land use problems and conflicts: Causes, consequences and solutions (pp. 61). New York: Rutledge Publishing.
May, R. (2006). ‘‘Connectivity’’ in urban rivers: Conflict and convergence between ecology and design. Technology in Society, 28, 477–488.
McGarigal, K., Cushman, S. A., Neel, M. C., & Ene, E. (2002). FRAGSTATS(3.x): Spatial pattern analysis program for categorical and continuous maps. Amherst: University of Massachusetts.
Merriam-Webster Dictionary. (2012). Habitat. Retrieved 03/20, 2012, from http://www.merriam-webster.com/dictionary/habitat
72
Ministry of Environment. (2011). Brownfields - Legislation Overview - Ministry of Environment. Retrieved 03/12, 2012, from http://www.ene.gov.on.ca/environment/en/subject/brownfields/STDPROD_075724.html
Ministry of Infrastructure. (2012a). Conformity status of upper- and single-tier municipalities in the greater golden horseshoe. Retrieved 03/11, 2012, from https://www.placestogrow.ca/index.php?option=com_content&task=view&id=271&Itemid=84
Ministry of Infrastructure. (2012b). Growth Plan for the Greater Golden Horseshoe, 2006. Retrieved 03/11, 2012, from https://www.placestogrow.ca/index.php?option=com_content&task=view&id=9&Itemid=14&lang=eng
Ministry of Municipal Affairs and Housing. (2004). Brownfield Showcase II. Toronto: NRTEE. (2003). Cleaning up the past, building the future: A national brownfield
redevelopment strategy for Canada. Ottawa: Renouf Publishing Co. Ltd.; National Roundtable on the Environment and the Economy.
Oliver, L., Ferber, U., Grimski, D., Millar, K., & Nathanail, P. (2005). The scale and nature of European brownfields. Proceedings of Cabernet 2005-the International Conference on Managing Urban Land, pp. 274-281.
Ontario College of Family Physicians. (2005). The health impacts of urban sprawl information series, volumes 1-5. Toronto: Ontario College of Family Physicians.
Ontario Ministry of Natural Resources. (2008). Solris, version 1. [Southern Ontario Land Cover Information System] (Digital Map File ed.)
Pagano, M. A., & Bowman, A. O. (2000). Vacant land in cities: An urban resource. Center on Urban & Metropolitan Policy, p. 1-9.
Pauleit, S., & Duhme, F. (2000). Assessing the environmental performance of land cover types for urban planning. Landcape and Urban Planning, 52(1), 1-20.
Pauleit, S., & Breuste, J. H. (2011). Land-use and surface-cover as urban ecological indicators. In J. Neimelä (Ed.), Urban Ecology: Patterns, processes and applications (pp. 19-70). Oxford: Oxford University Press.
Perlman, D. L., & Milder, J. C. (2005). Practical Ecology for Planners, Developers and Citizens. Washington; DC; USA: Island Press.
Pickett, S. T. A., Cadenasso, M. L., & Grove, J. M. (2004). Resilient cities: Meaning, models, and metaphor for integrating the ecological, socio-economic, and planning realms. Landscape and Urban Planning, 69(4), 369-384.
Pringle, C. (2003). What is hydrologic connectivity and why is it ecologically important? Hydrological Processes, 17(13), 2685-2689.
Rybczynski, W. (1995). City Life: Urban expectations in a new world. New York: Scribner.
Schädler, S., Morio, M., Bartke, S., Rohr-Zänker, R., & Finkel, M. (2011). Designing sustainable and economically attractive brownfield revitalization options using an integrated assessment model. Journal of Environmental Management, 92(3), 827-837.
Schueler, T. (1995). Environmental land planning series: Site planning for urban stream protection. Silver Spring, MA: Metropolitan Washington Council of Governments and the Center for Watershed Protection.
Shute, J. (2010). Natural heritage features of Guelph and surround. Guelph: Shute, Jeremy.
Simaika, J. P., & Samways, M. J. (2010). Biophilia as a universal ethic for conserving biodiversity. Conservation Biology, 24(3), 903-906.
Statistics Canada. (2008). Population and dwelling counts, for urban areas, 2006 and 2001 censuses
Statistics Canada. (2012). Population and dwelling counts, for Canada and census subdivisions (municipalities) with 5,000-plus population, 2011 and 2006 censuses.
73
Retrieved 3/11, 2012, from http://www12.statcan.gc.ca/census-recensement/2011/dp-pd/hlt-fst/pd-pl/Table-Tableau.cfm?LANG=Eng&T=307&S=11&O=A&RPP=699
Su, M., Fath, B. D., & Yang, Z. (2010). Urban ecosystem heatlh assessment: A review. Science of the Total Environment, 408, 2425-2434.
Sustainable Community Research Group. (2012). Parameters of new urbanism: Neighbourhood structure. Retrieved 04/20, 2012, from http://www.eng.mcmaster.ca/civil/sustain/designparam/dparameters1.htm
The Bloom Centre for Sustainability. (2011). Brownfields Redevelopment Toolbox. Retrieved 02/20http://www.aboutremediation.com/toolbox/background.asp#Building
Thompson, G. F., & Steiner, F. R. (Eds.). (1997). Ecological design and planning. New York: John Wiley & Sons.
United Nations. (2011). World population prospects, the 2010 revision wall chart United Nations: Report of the World Commission on Environment and Development.
(1987). Our common future, chapter 2: Towards sustainable development Walsh, C. J., Roy, A. H., Feminella, J. W., Cottingham, P. D., Groffman, P. M., &
Morgan, R. P. (2005). The urban stream syndrome: Current knowledge and the search for a cure. Journal of the North American Benthological Society, 24(3), 706-723.
Wu, J., Jenerette, G. D., Buyantuyev, A., & Redman, C. L. (2011). Quantifying spatiotemporal patterns of urbanization: The case of the two fastest growing metropolitan regions in the United States. Ecological Complexity, 8(1), 1-8.
Wu, J., & Hobbs, R. (2002). Key issues and research priorities in landscape ecology: An idiosyncratic synthesis. Landscape Ecology, 17(4), 355-365.
Young, C., Jarvis, P., Hooper, I., & Trueman, I. (2008). Urban Landscape Ecology. Landscape ecology research trends (pp. 45-69). New York: Nova Science Publishers, Inc.
74
Data Resources
City of Guelph: Planning, Engineering and Environmental Services. (2010). Envision
Guelph: Official Plan Amendment no. 42 natural heritage system amendment No. 10-71). Guelph: City of Guelph.
City of Guelph. (2007). Guelph street network (single line). Guelph; ON; Canada (Digital Map File ed.)
DMTI Spatial Inc. (2011). Land use. Markham, Ontario. (Digital Map File ed.) DMTI Spatial Inc. (2009). CanMap rail (RL). Markham, Ontario. (Digital Map File ed.) DMTI Spatial Inc. (2009a). Hydrography (HYL). Markham, Ontario. (Digital Map File
ed.) DMTI Spatial Inc. (2009b). Neighbourhood boundaries (NBH) - Canada. Markham,
Ontario. (Digital Map File ed.) Grand River Conservation Authority. (2011). Regulatory Floodplain. GRCA. Ontario Ministry of Natural Resources. (2008). Solris, version 1. [Southern Ontario Land
Cover Information System] (Digital Map File ed.) Shute, J. (2010). Natural Heritage Features of Guelph and Surround. Guelph: Shute,
Jeremy.

75
Appendix – A: Strategy
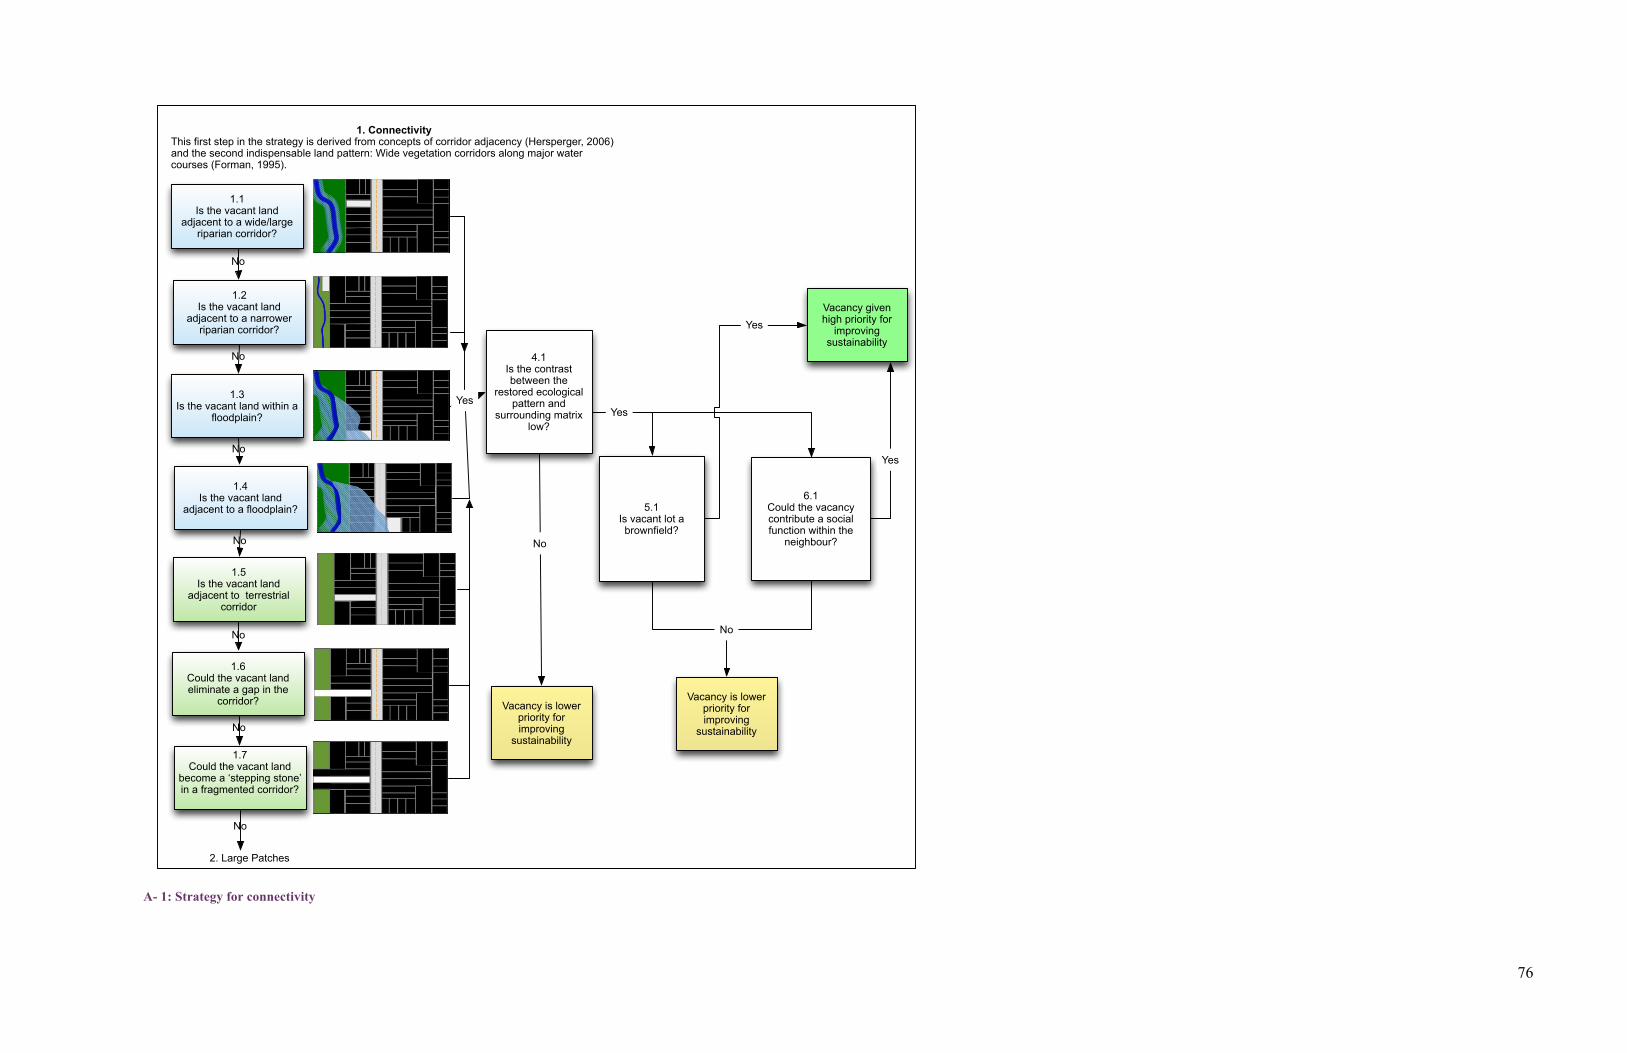
76
A- 1: Strategy for connectivity
1.5Is the vacant land
adjacent to terrestrial corridor
1. Connectivity This first step in the strategy is derived from concepts of corridor adjacency (Hersperger, 2006) and the second indispensable land pattern: Wide vegetation corridors along major water courses (Forman, 1995).
No
No
No
No
No
Yes
4.1 Is the contrast between the
restored ecological pattern and
surrounding matrix low?
Vacancy given high priority for
improving sustainability
No
1.3Is the vacant land within a
floodplain?
1.1 Is the vacant land
adjacent to a wide/large riparian corridor?
1.6Could the vacant land eliminate a gap in the
corridor?
1.4Is the vacant land
adjacent to a floodplain?
1.2Is the vacant land
adjacent to a narrower riparian corridor?
1.7Could the vacant land
become a ‘stepping stone’ in a fragmented corridor?
6.1 Could the vacancy contribute a social function within the
neighbour?
Vacancy is lower priority for improving
sustainability
No
5.1 Is vacant lot a brownfield?
Yes
No
Vacancy is lower priority for improving
sustainability
No
2. Large Patches
Yes
Yes
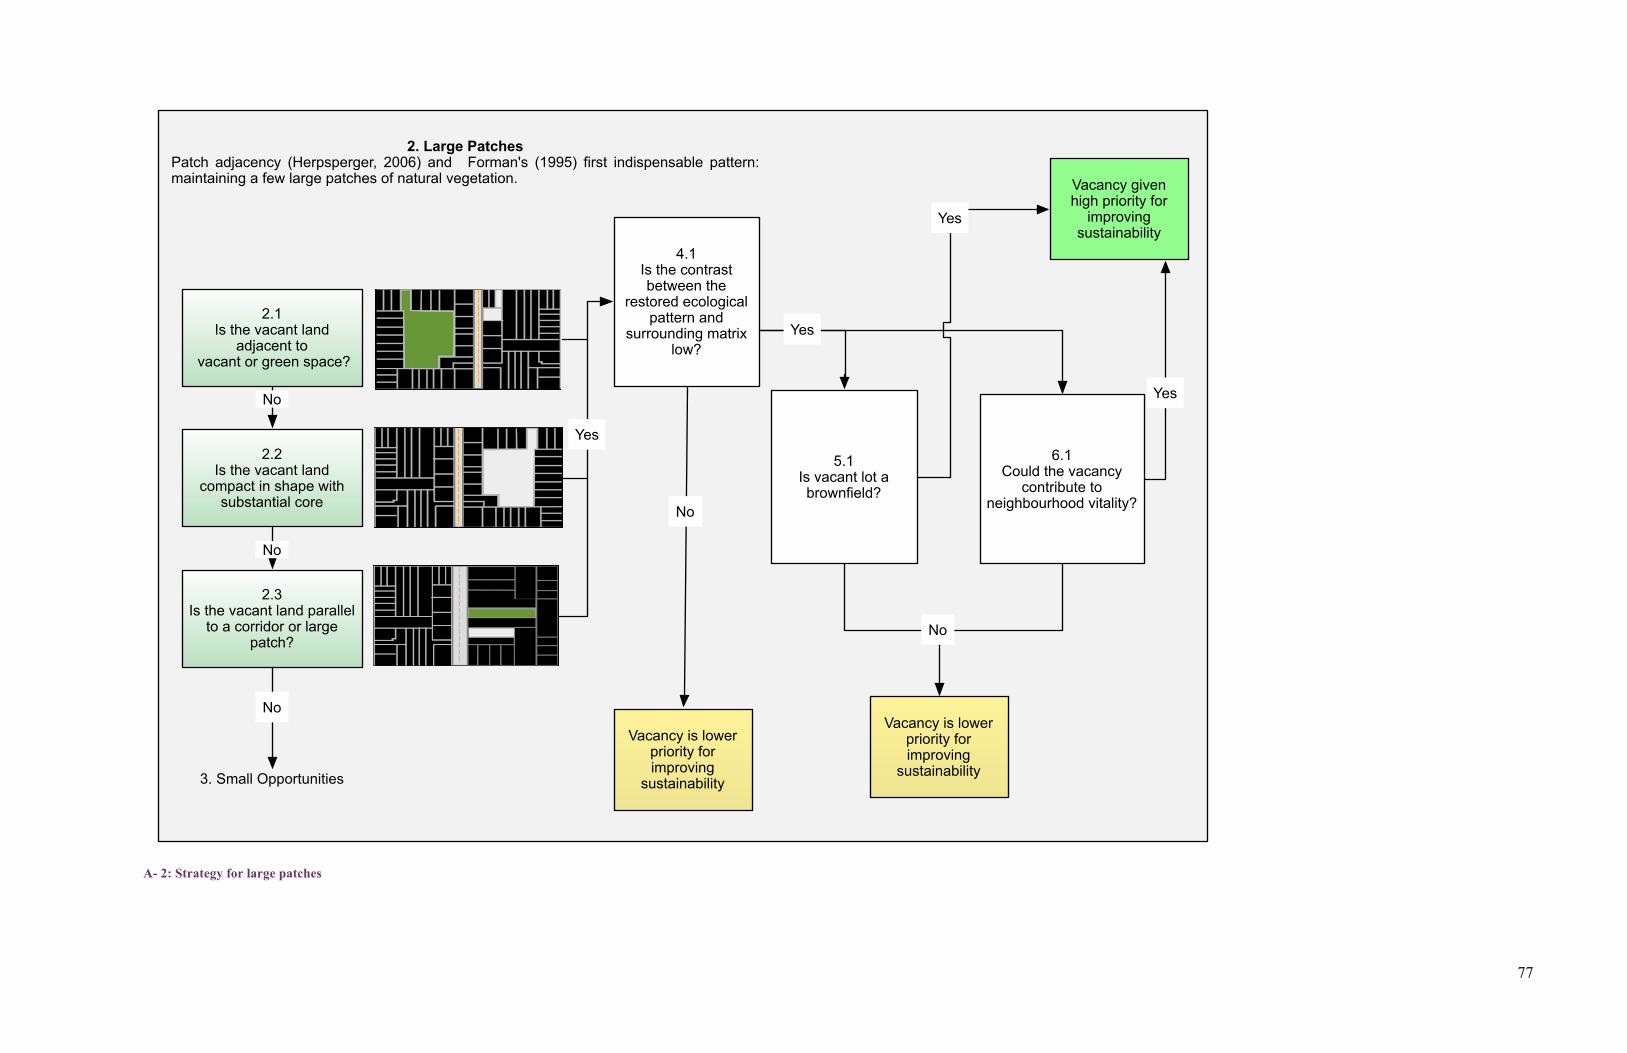
77
A- 2: Strategy for large patches
2.1Is the vacant land
adjacent to vacant or green space?
2.2Is the vacant land
compact in shape with substantial core
2.3Is the vacant land parallel
to a corridor or large patch?
No
No
2. Large Patches Patch adjacency (Herpsperger, 2006) and Forman's (1995) first indispensable pattern: maintaining a few large patches of natural vegetation.
No
3. Small Opportunities
4.1 Is the contrast between the
restored ecological pattern and
surrounding matrix low?
Vacancy given high priority for
improving sustainability
6.1 Could the vacancy
contribute to neighbourhood vitality?
Vacancy is lower priority for improving
sustainability
5.1 Is vacant lot a brownfield?
Yes
No
Vacancy is lower priority for improving
sustainability
No
Yes
Yes
Yes
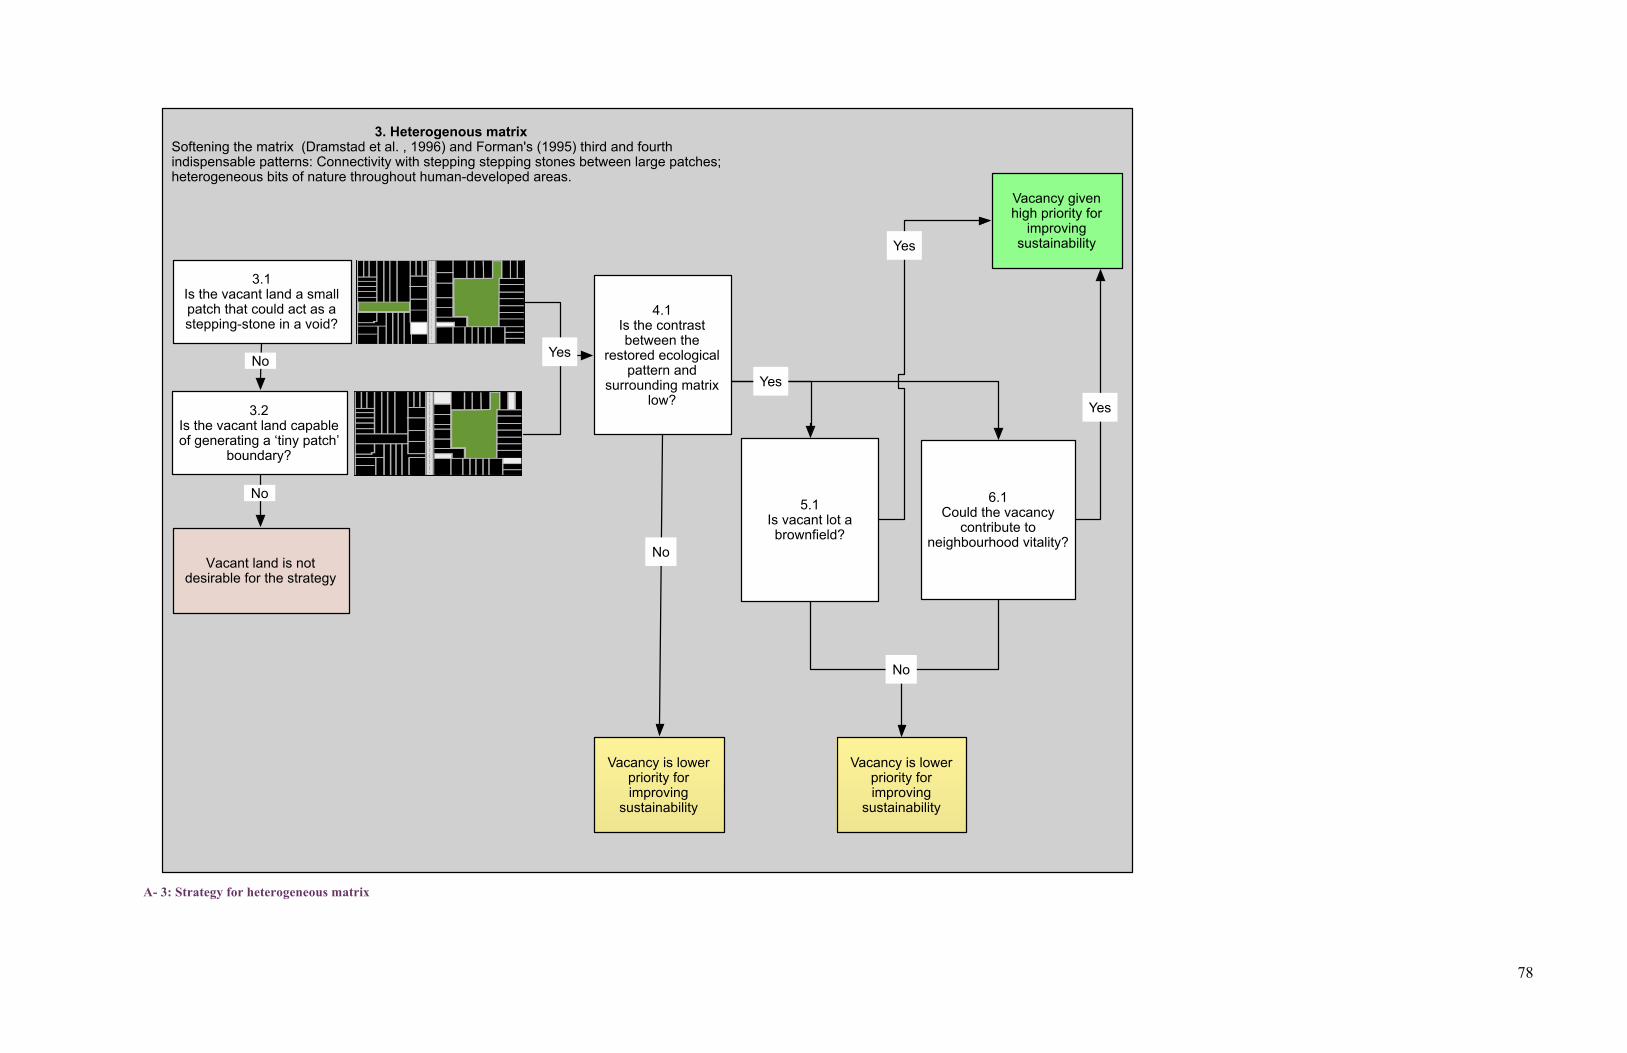
78
A- 3: Strategy for heterogeneous matrix
3.1Is the vacant land a small patch that could act as a stepping-stone in a void?
3.2Is the vacant land capable of generating a ‘tiny patch’
boundary?
3. Heterogenous matrix Softening the matrix (Dramstad et al. , 1996) and Forman's (1995) third and fourth indispensable patterns: Connectivity with stepping stepping stones between large patches; heterogeneous bits of nature throughout human-developed areas.
No
No
Vacant land is not desirable for the strategy
4.1 Is the contrast between the
restored ecological pattern and
surrounding matrix low?
Vacancy given high priority for
improving sustainability
6.1 Could the vacancy
contribute to neighbourhood vitality?
Vacancy is lower priority for improving
sustainability
5.1 Is vacant lot a brownfield?
Yes
No
Vacancy is lower priority for improving
sustainability
No
Yes
Yes
Yes

79
Appendix – B: Maps
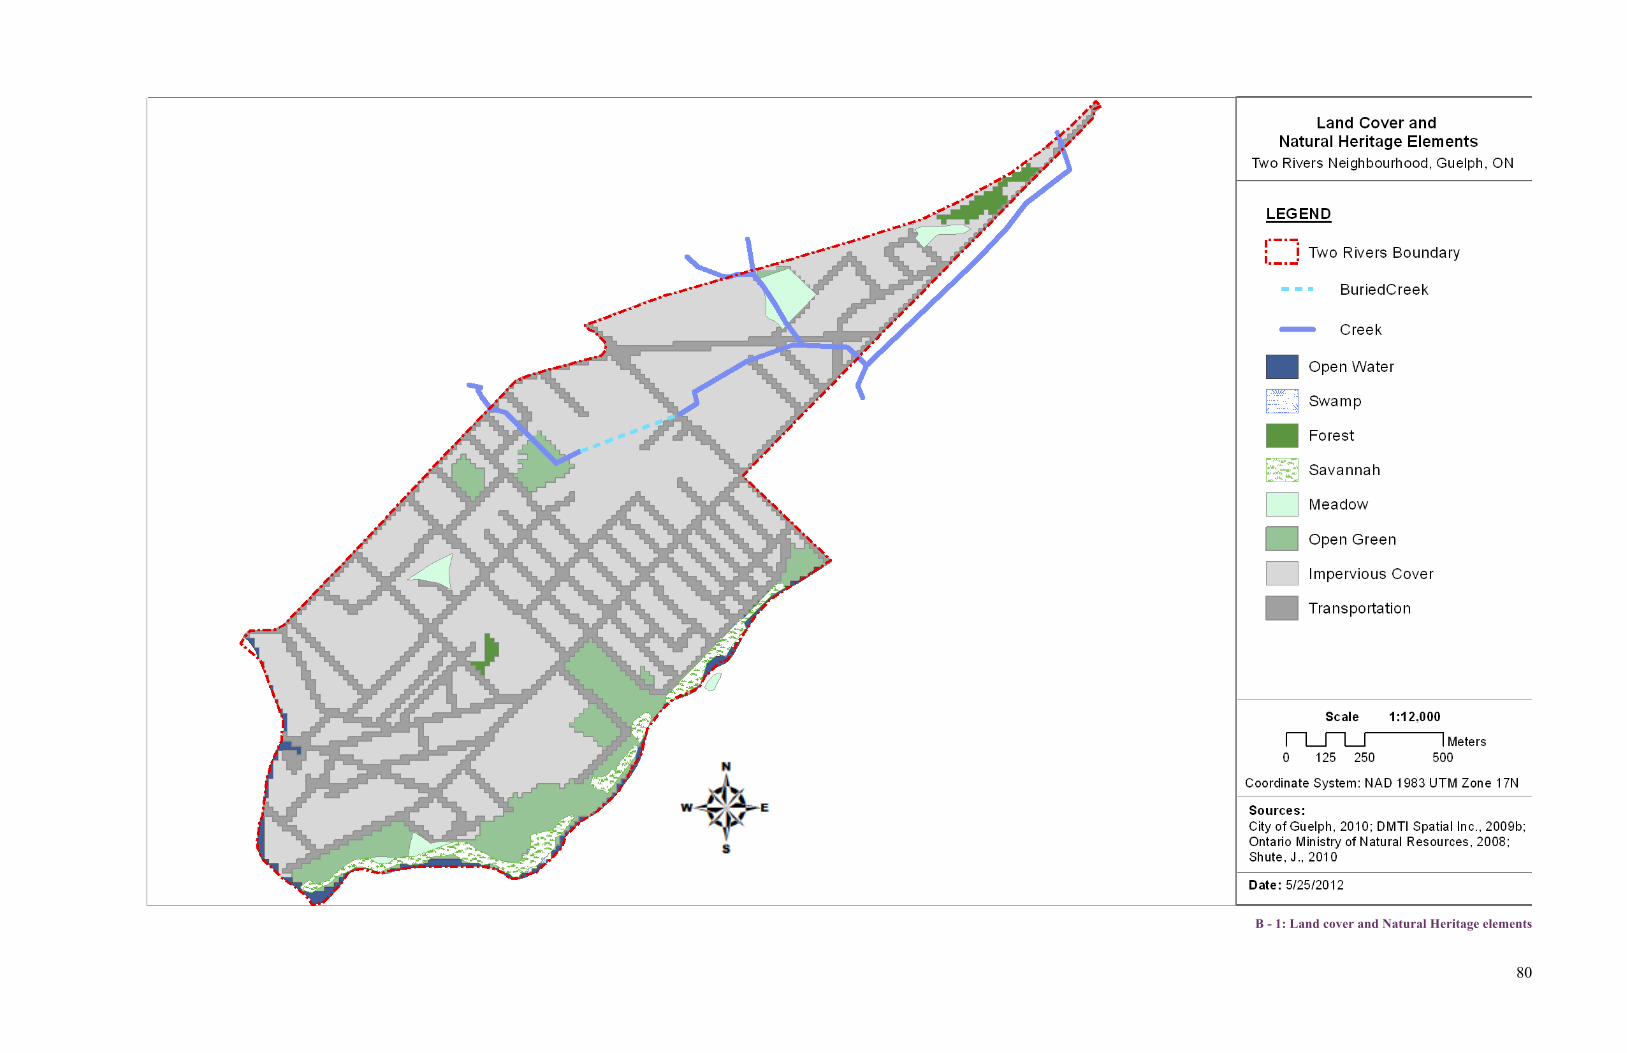
80
B - 1: Land cover and Natural Heritage elements
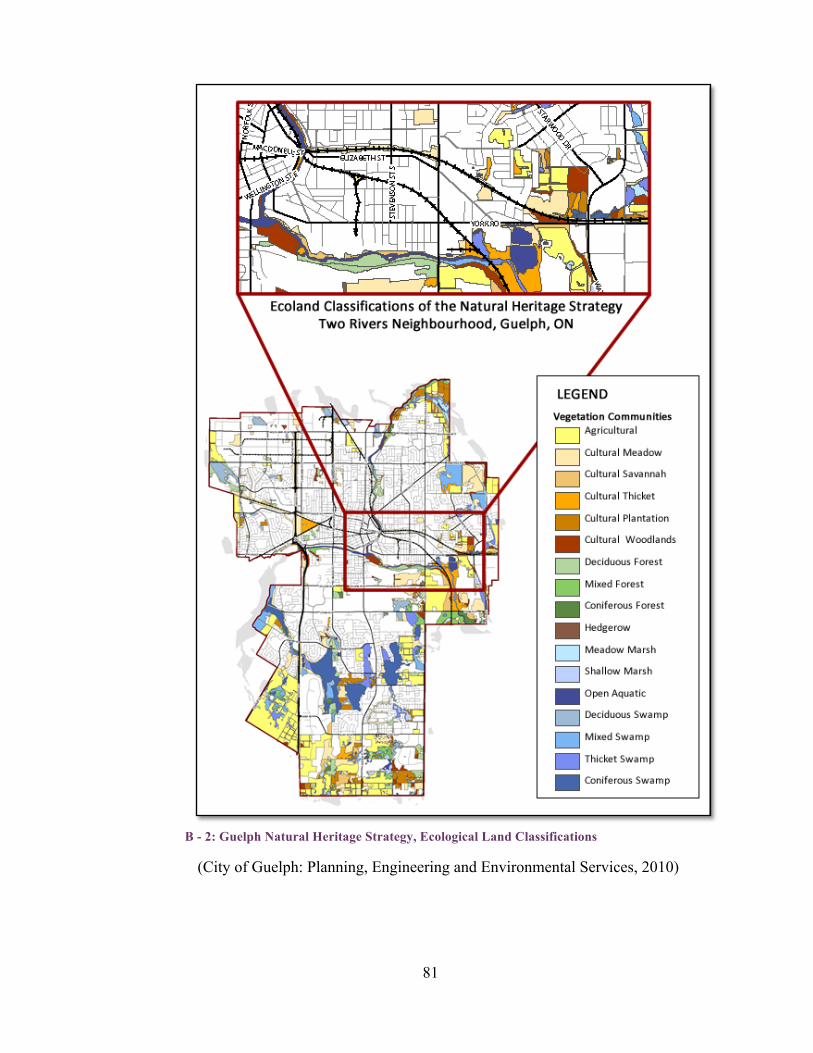
81
(City of Guelph: Planning, Engineering and Environmental Services, 2010)
B - 2: Guelph Natural Heritage Strategy, Ecological Land Classifications
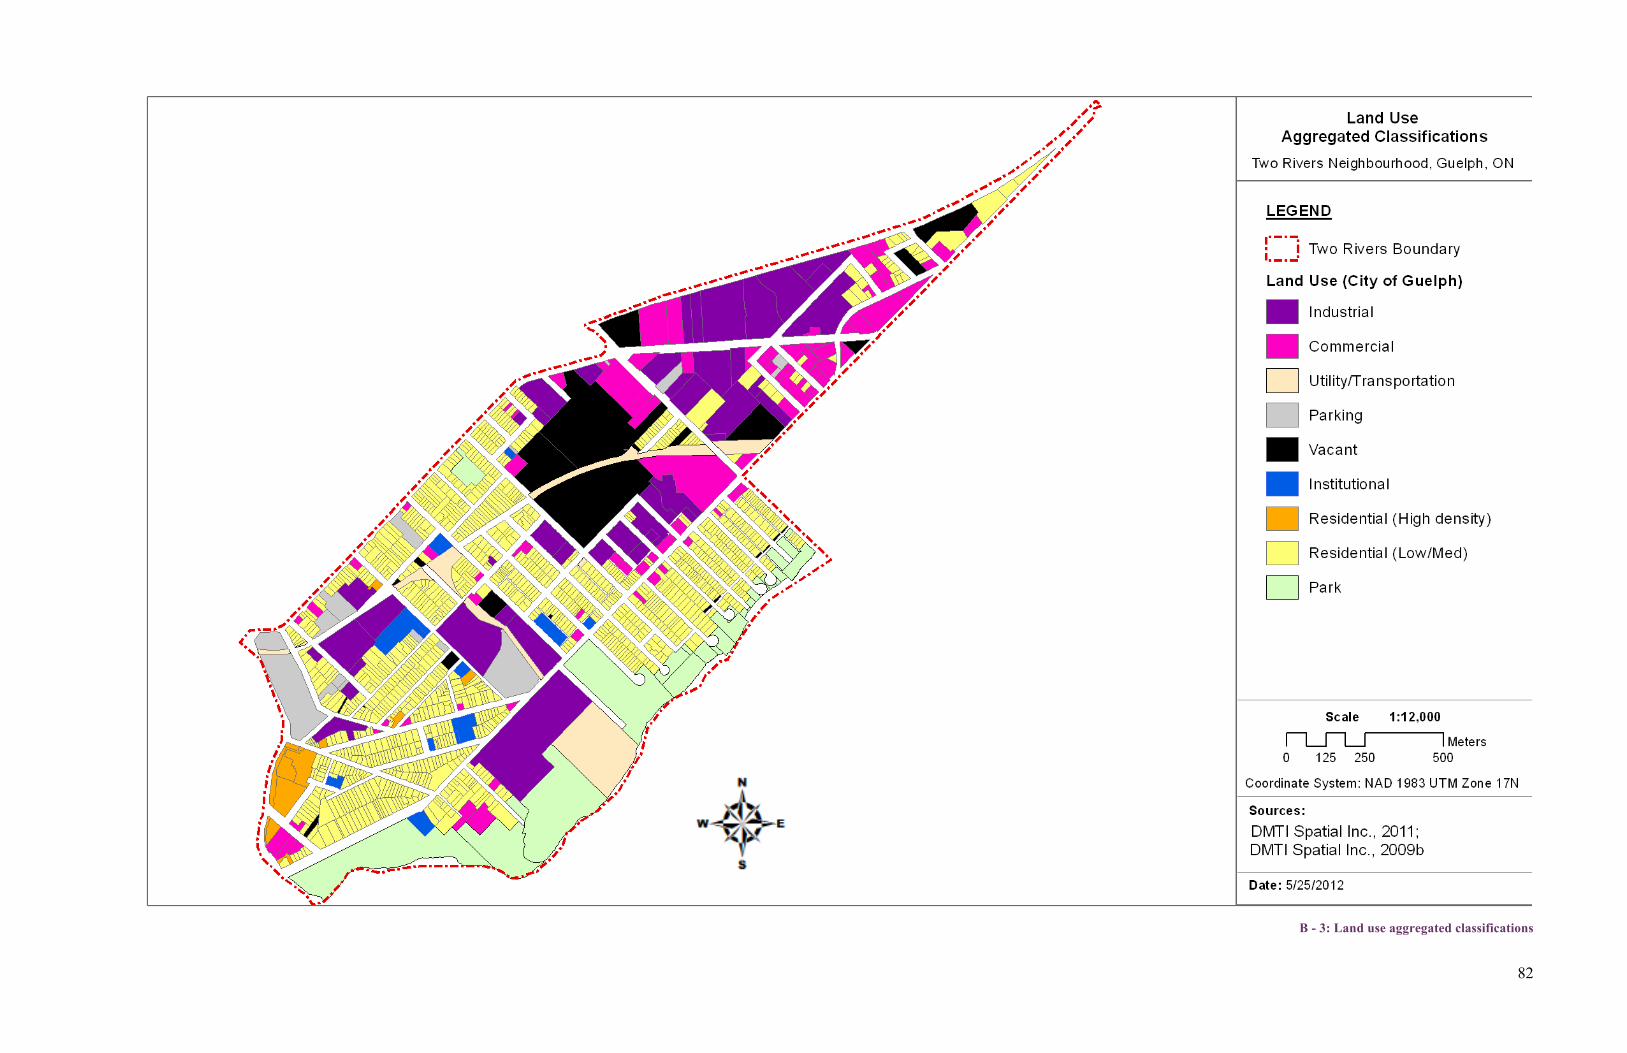
82
B - 3: Land use aggregated classifications
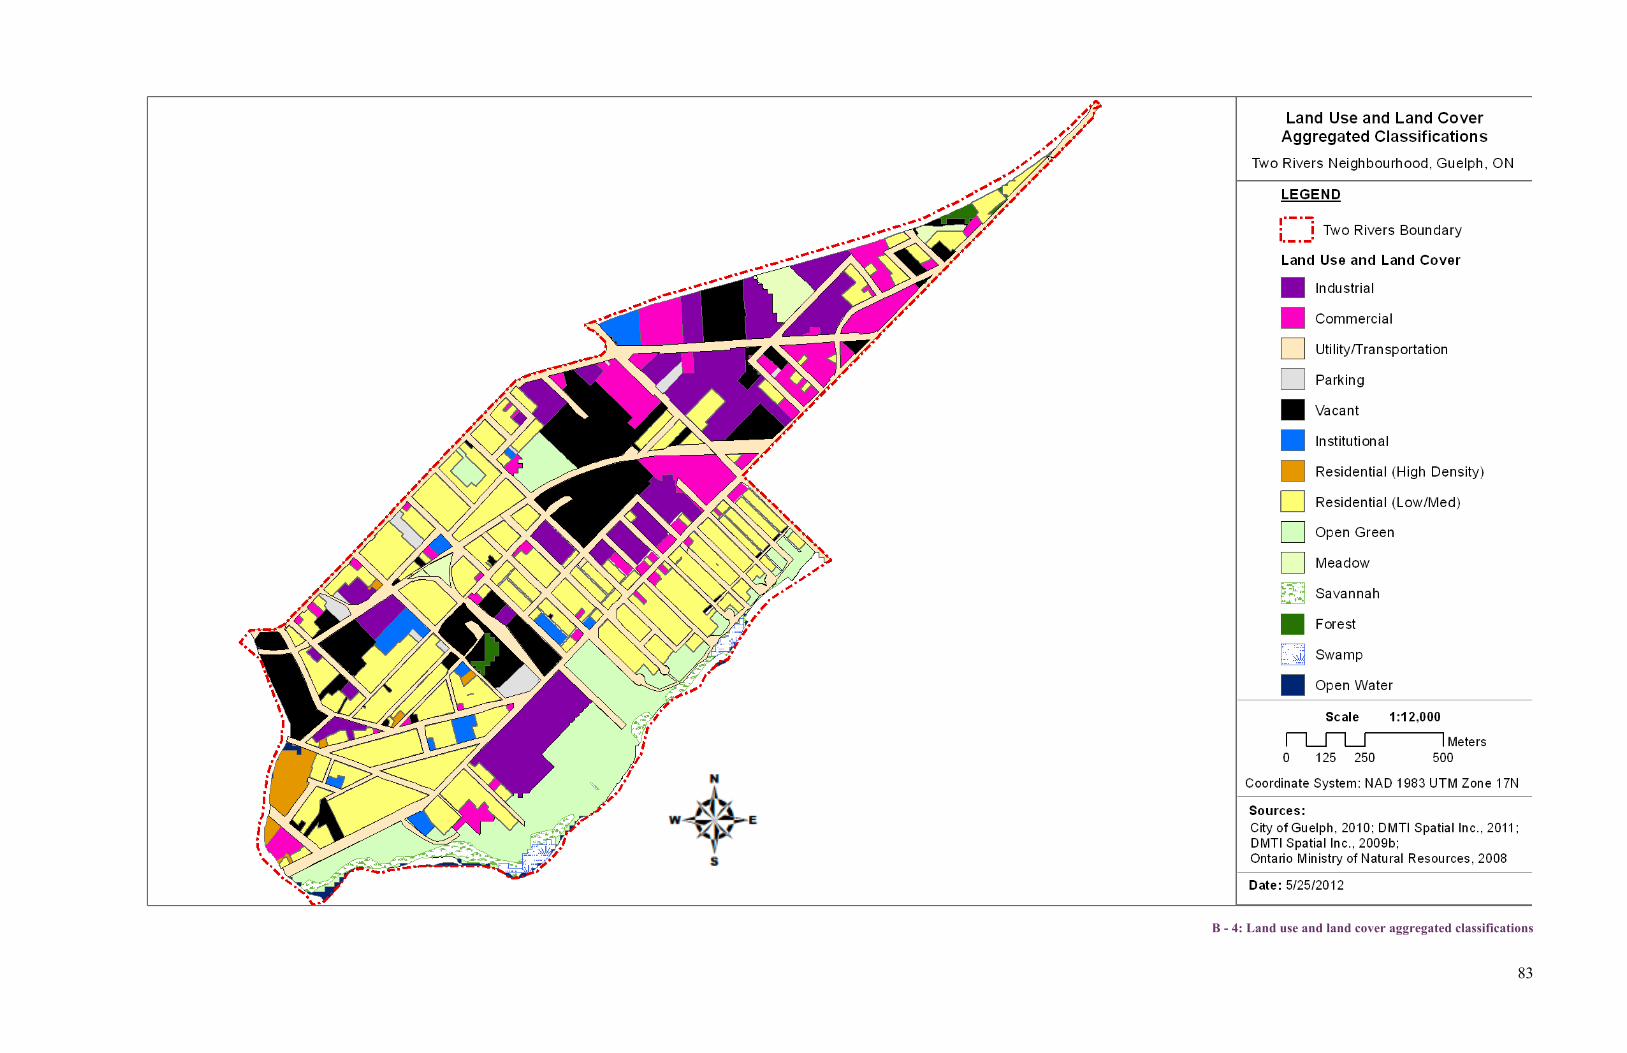
83
B - 4: Land use and land cover aggregated classifications
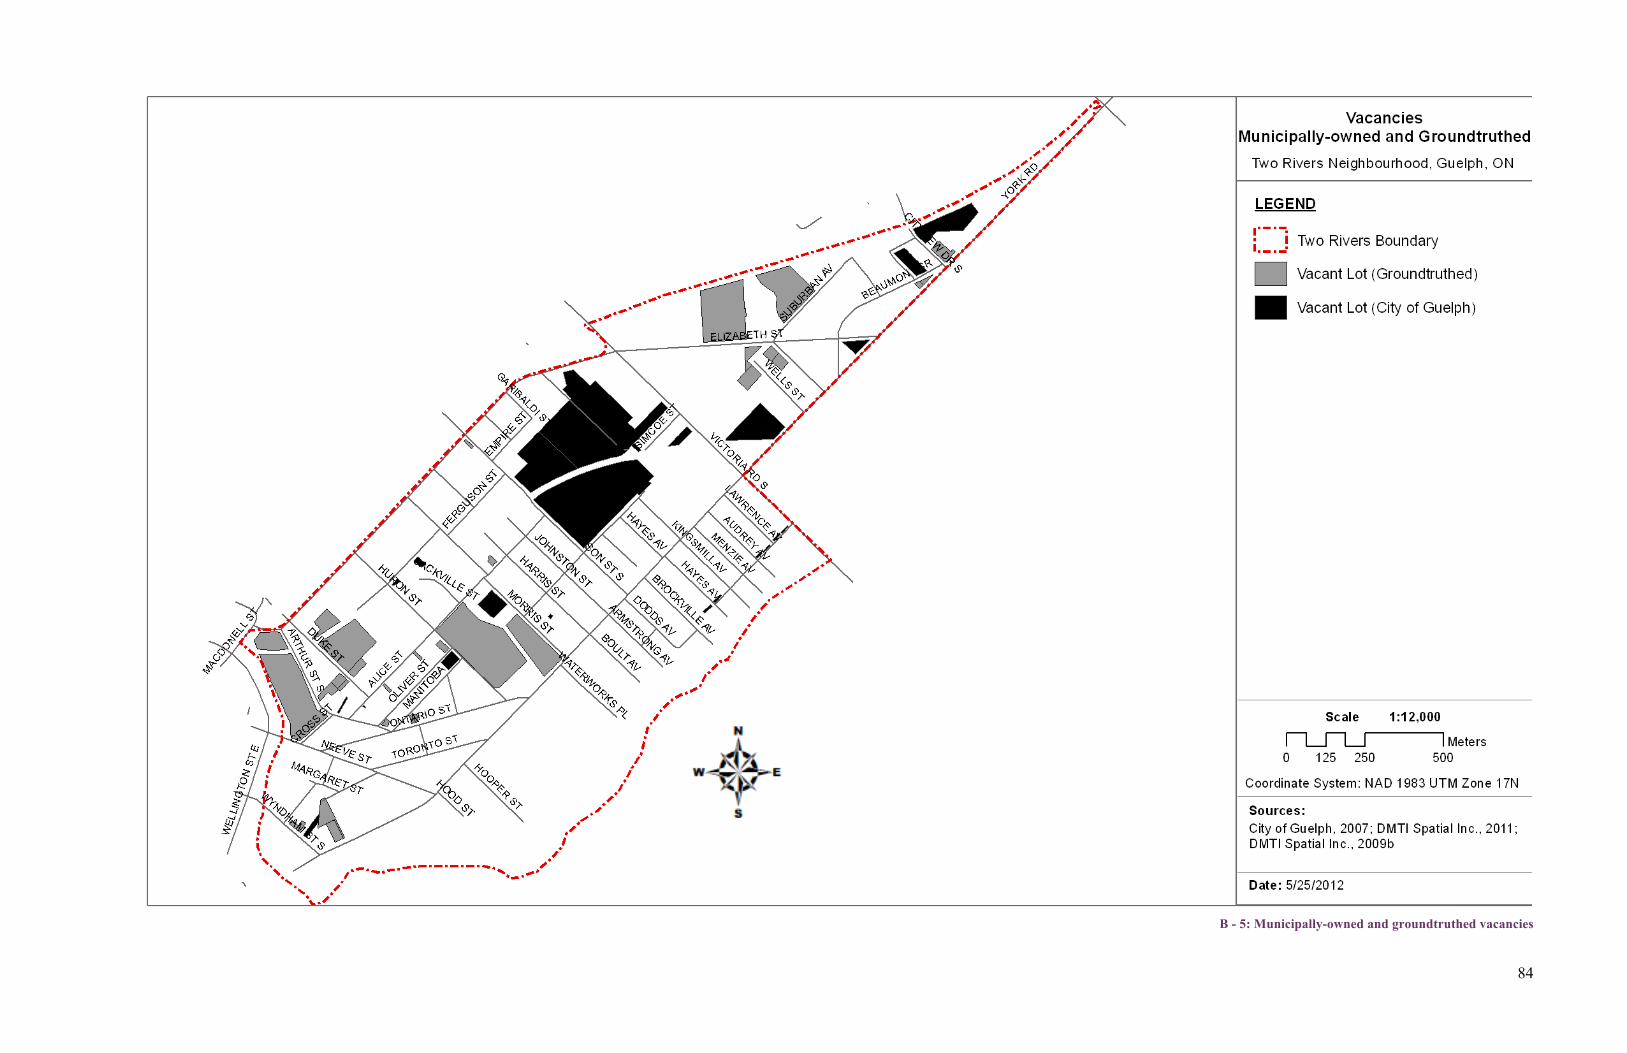
84
B - 5: Municipally-owned and groundtruthed vacancies
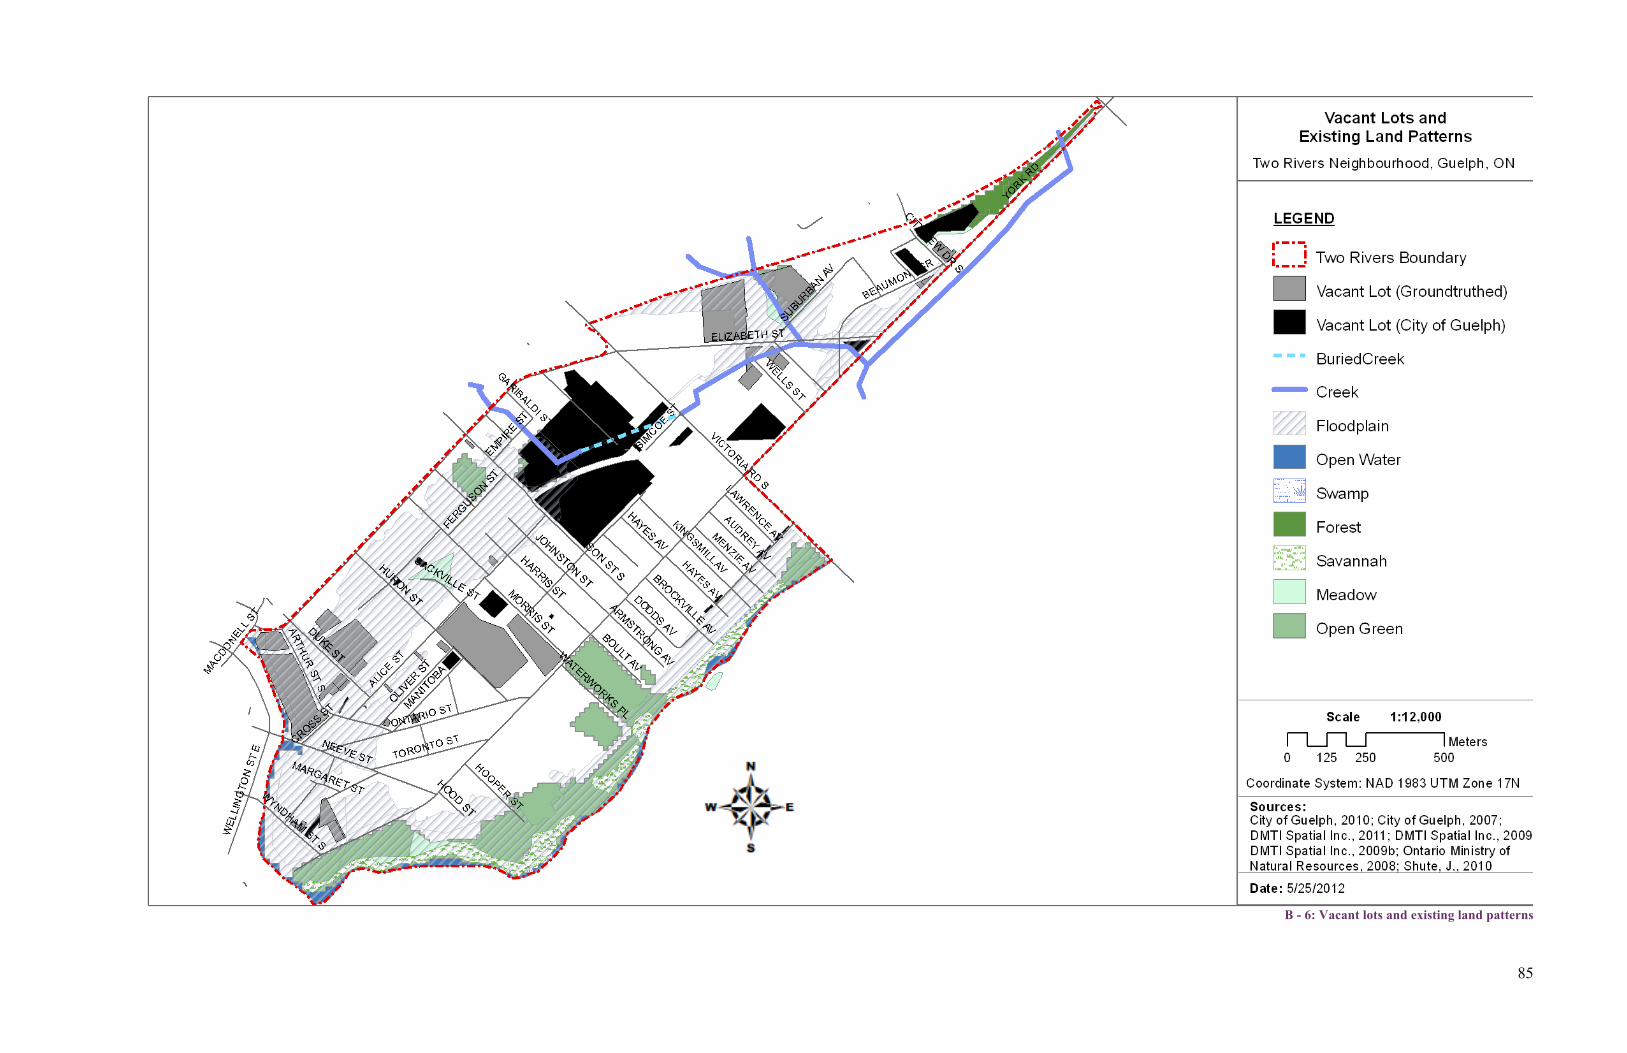
85
B - 6: Vacant lots and existing land patterns
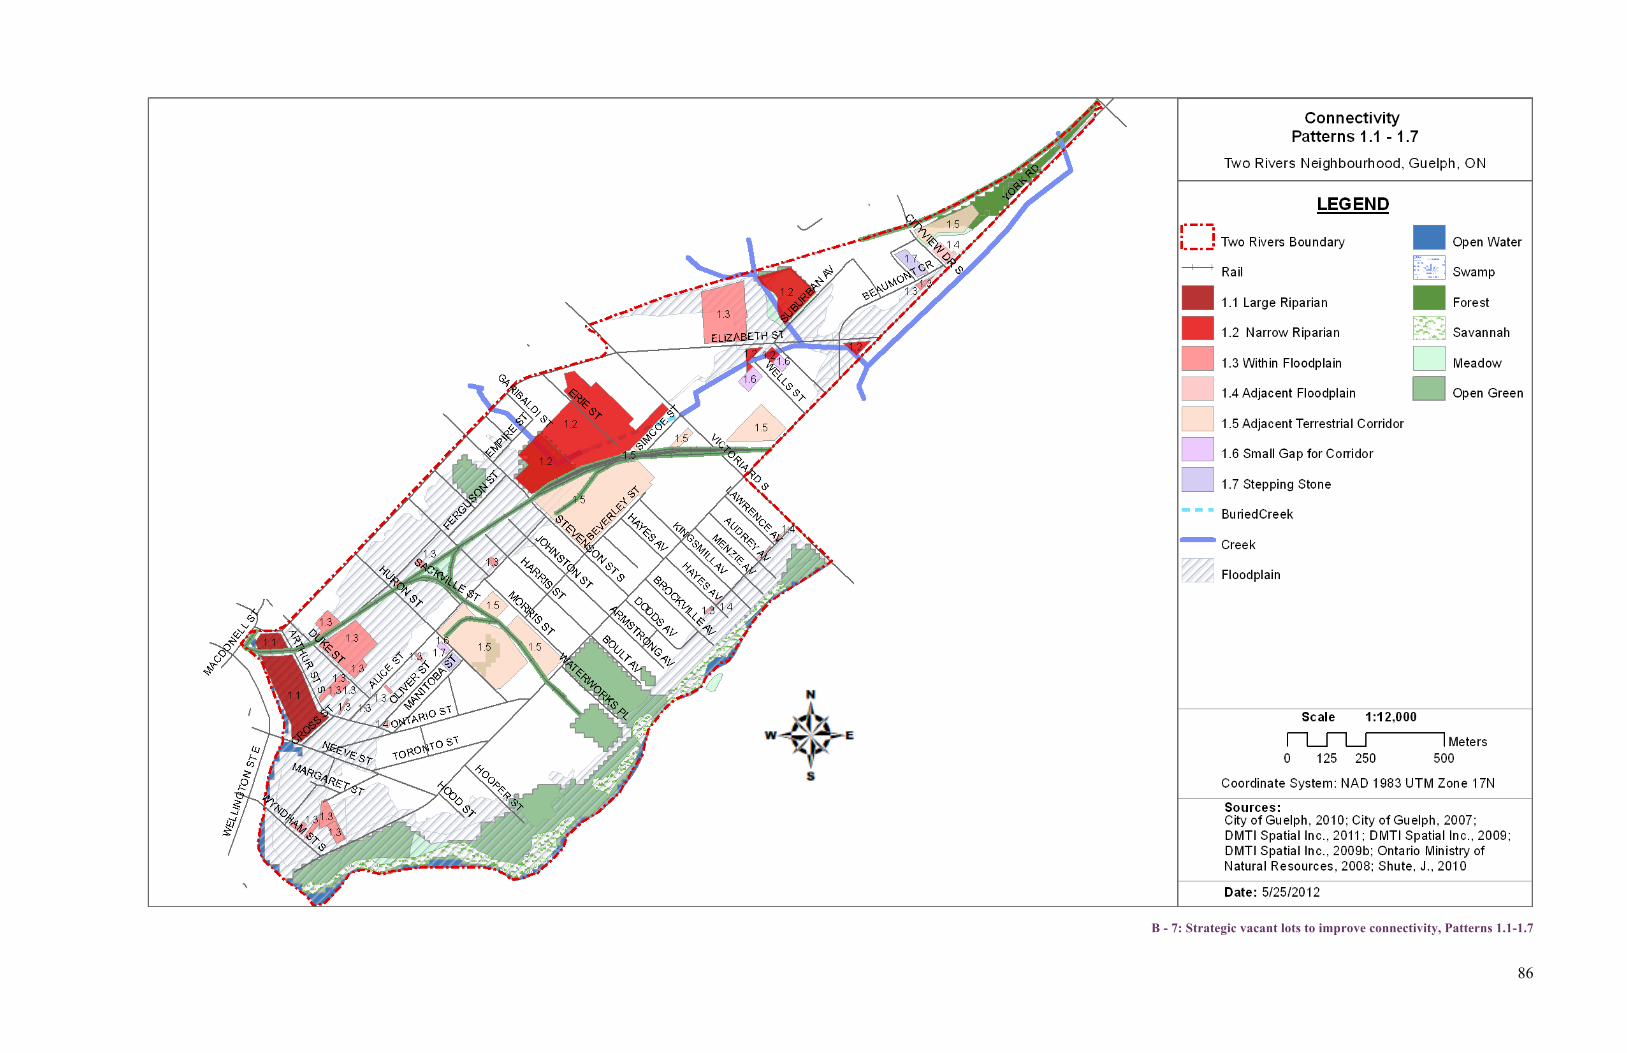
86
B - 7: Strategic vacant lots to improve connectivity, Patterns 1.1-1.7
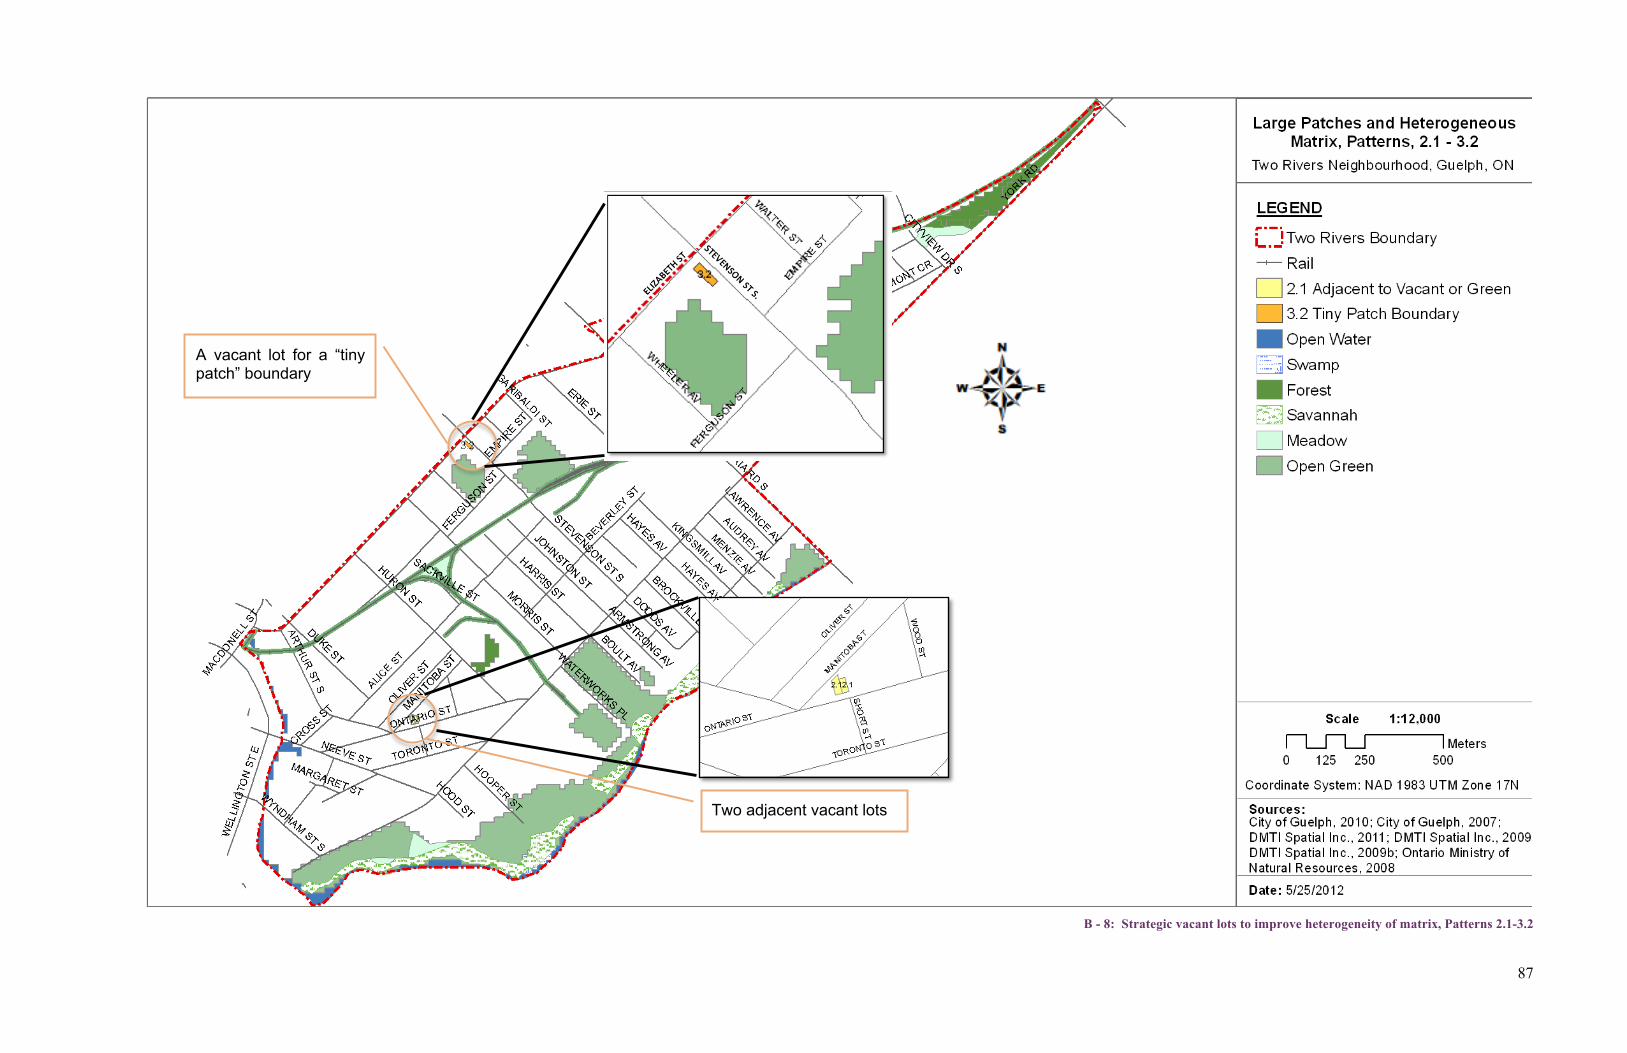
87
B - 8: Strategic vacant lots to improve heterogeneity of matrix, Patterns 2.1-3.2
A vacant lot for a “tiny patch” boundary
Two adjacent vacant lots
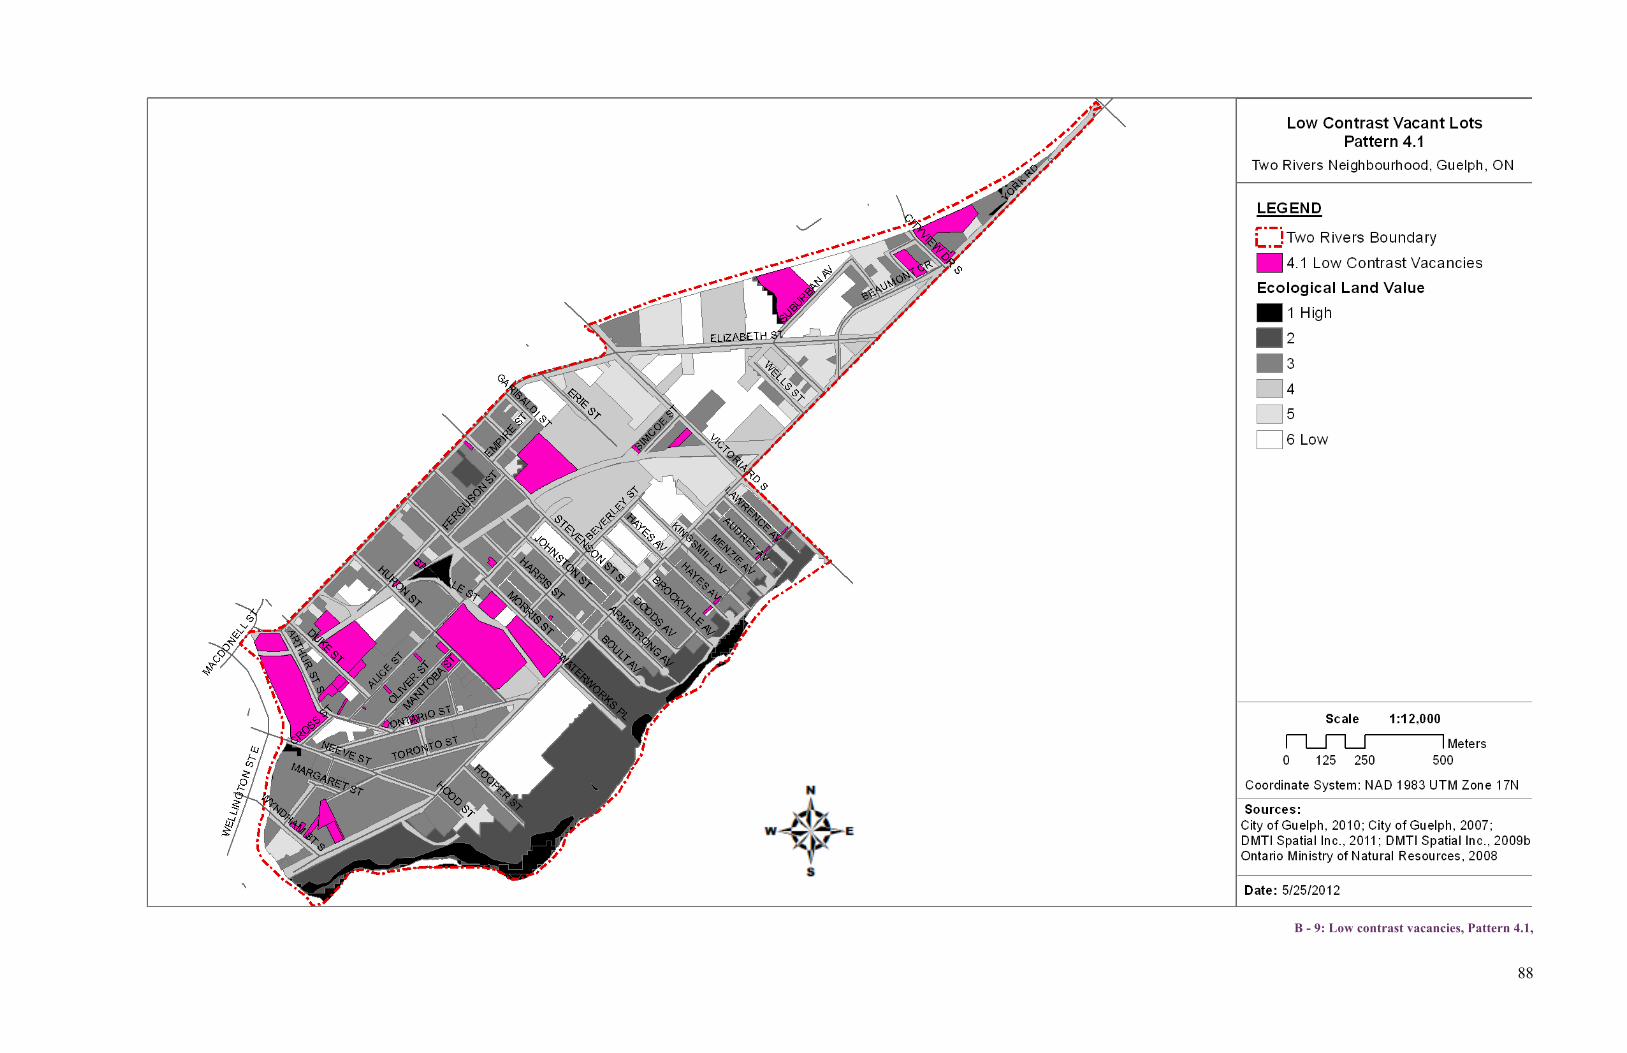
88
B - 9: Low contrast vacancies, Pattern 4.1,
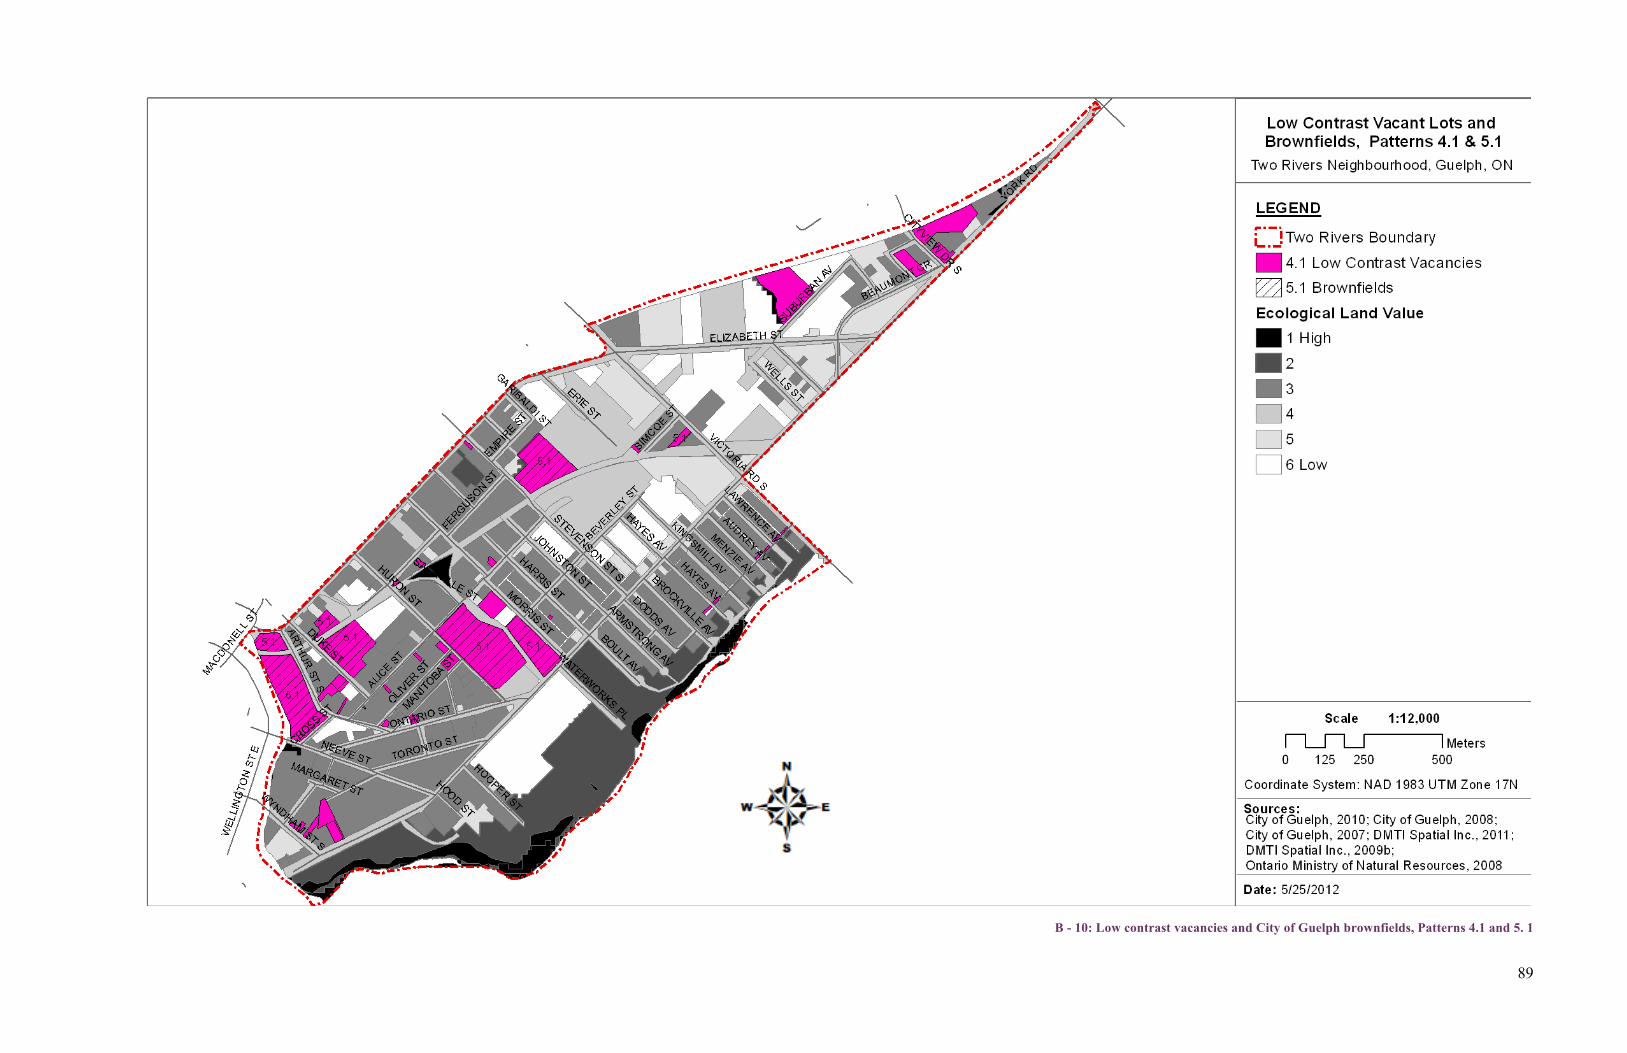
89
B - 10: Low contrast vacancies and City of Guelph brownfields, Patterns 4.1 and 5. 1
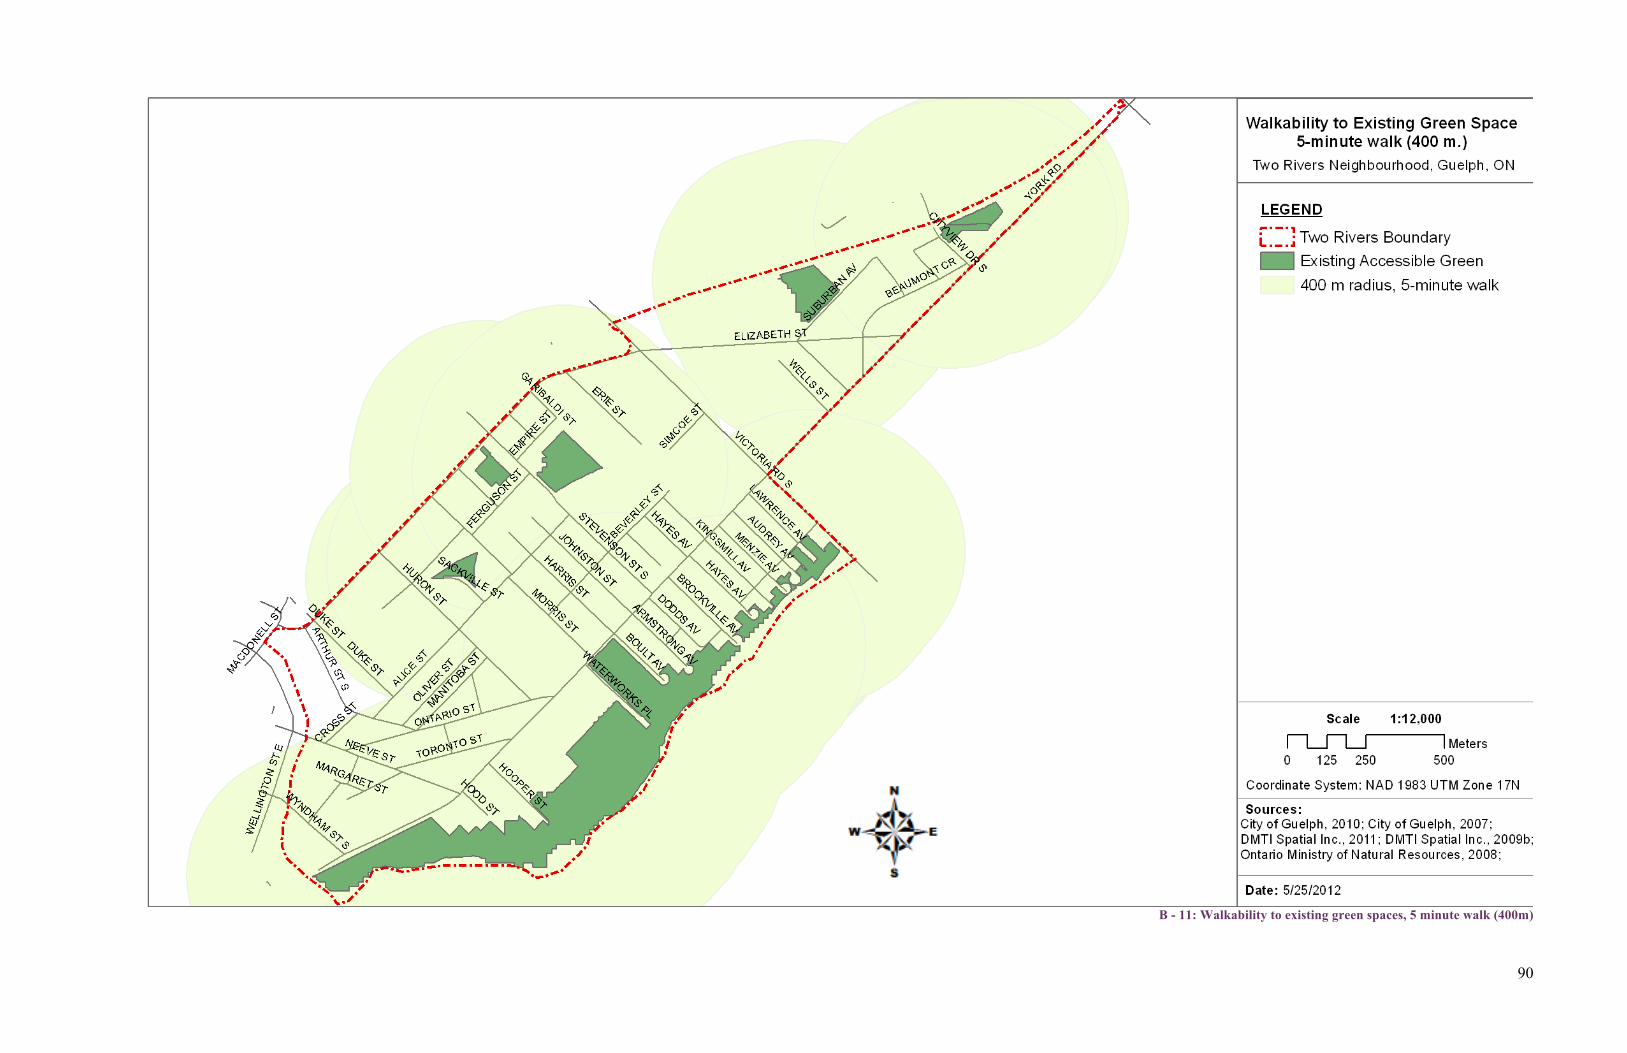
90
B - 11: Walkability to existing green spaces, 5 minute walk (400m)
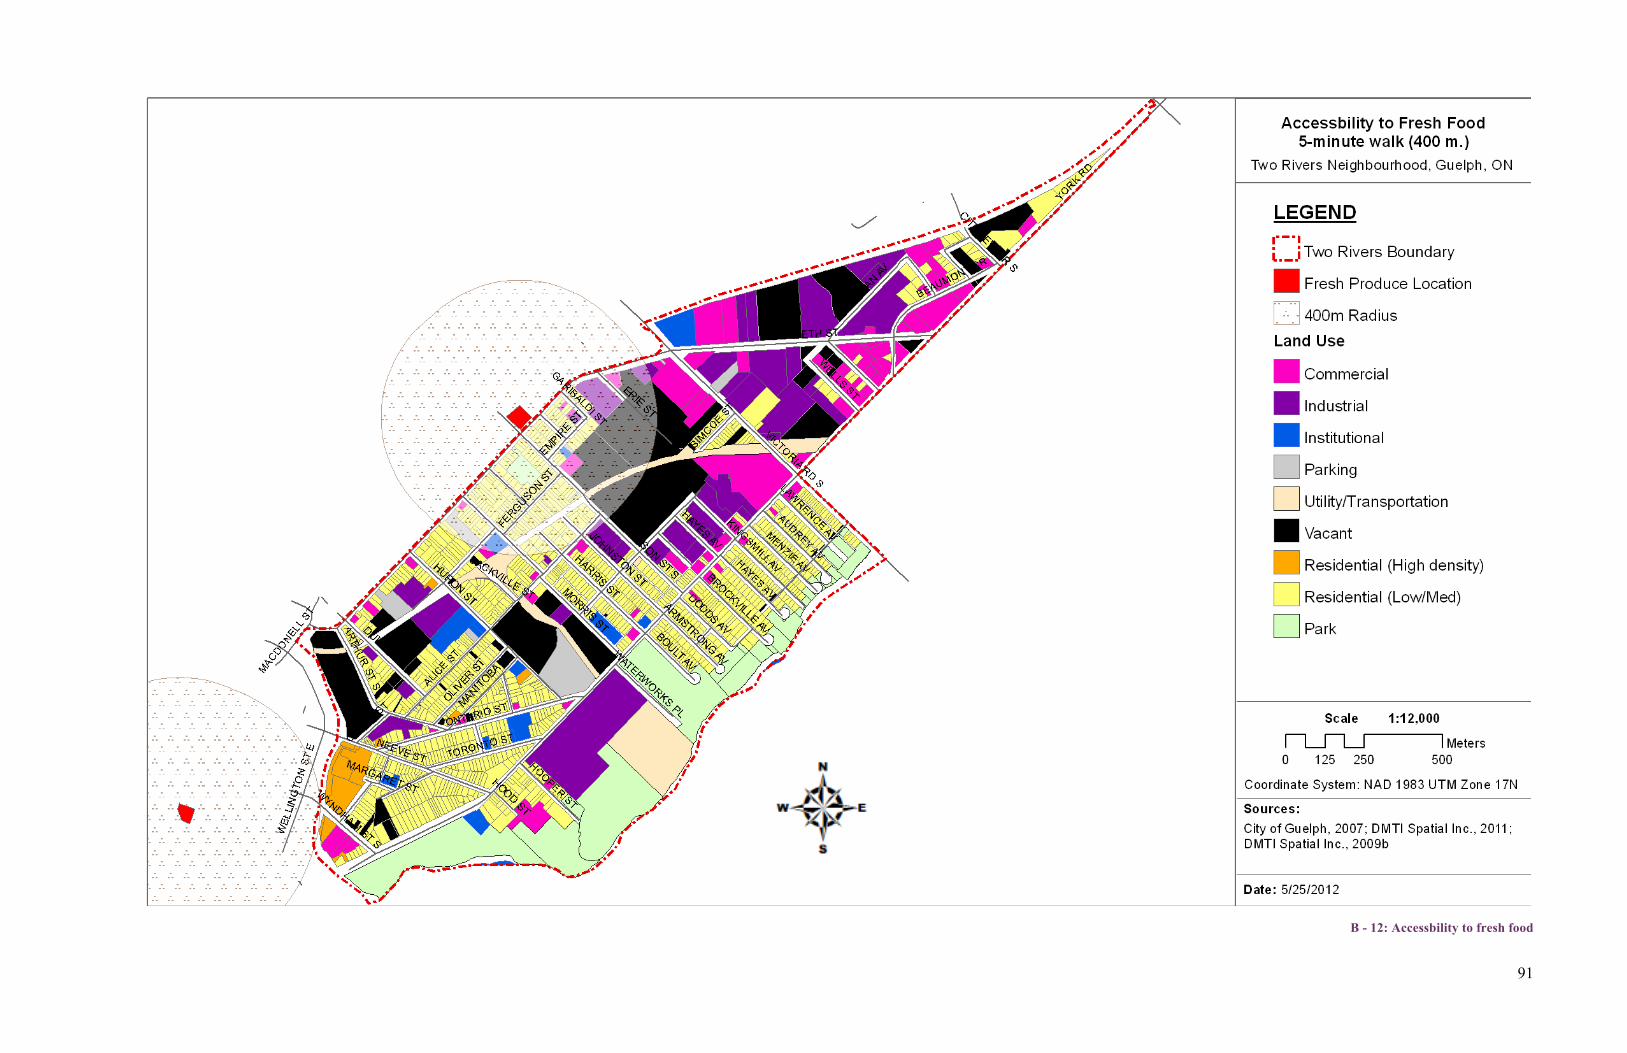
91
B - 12: Accessbility to fresh food
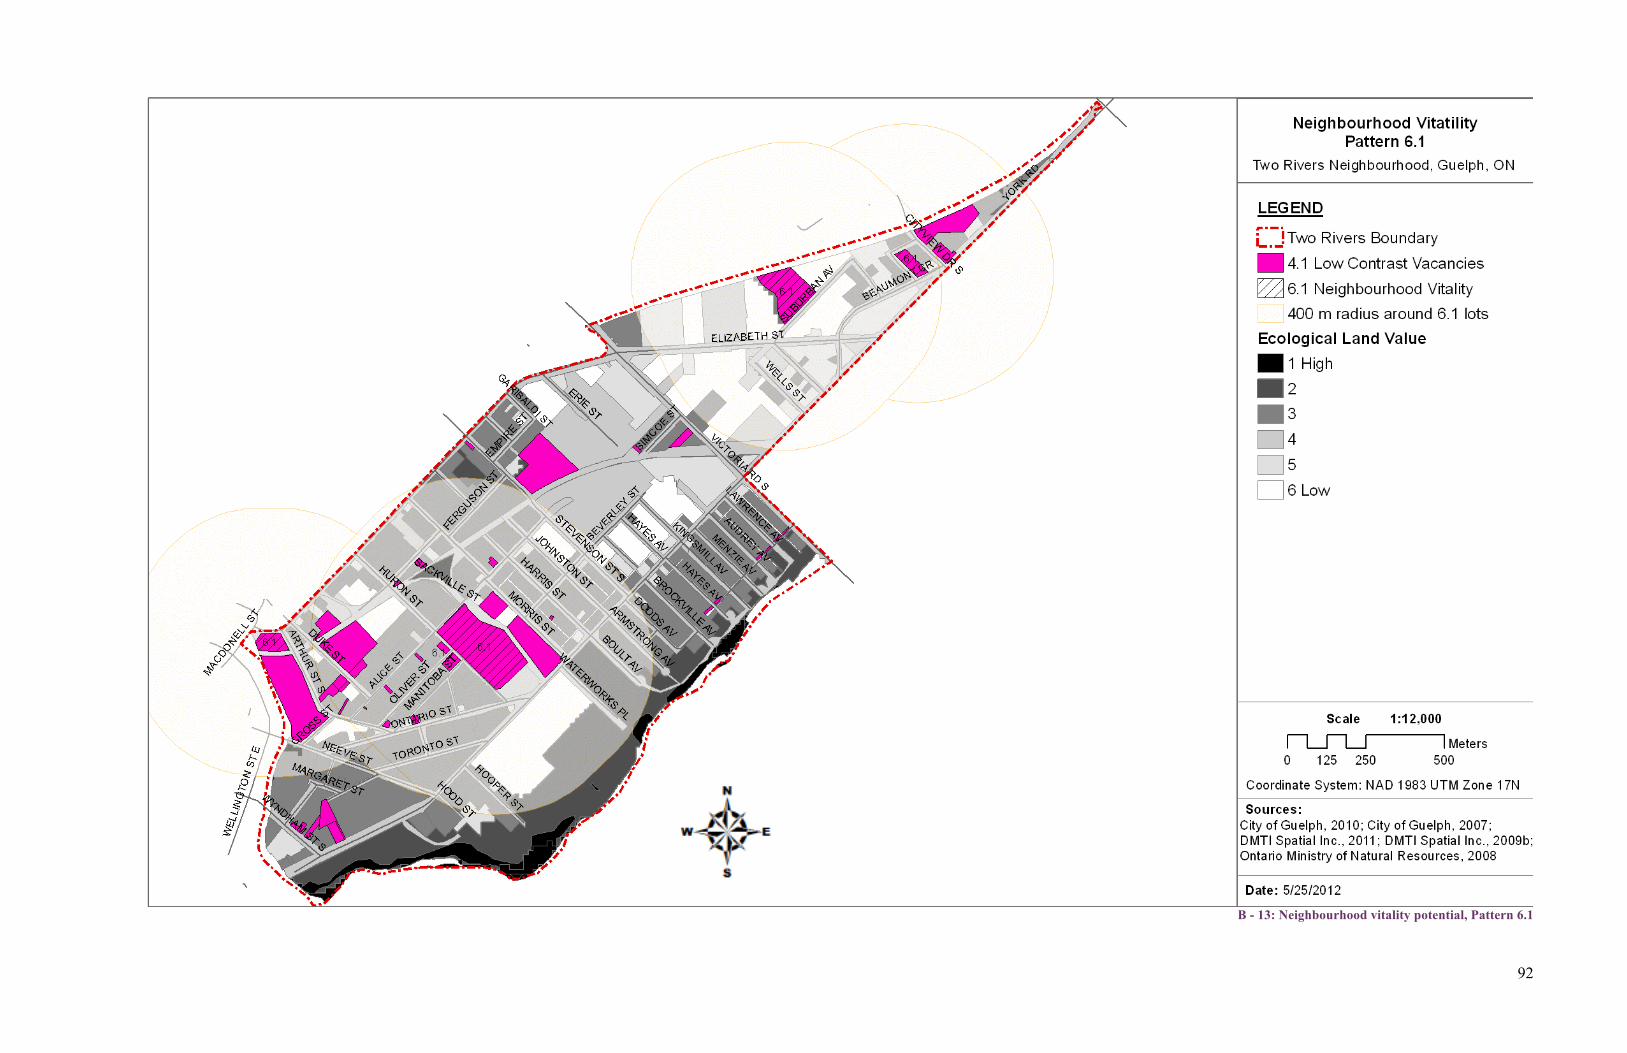
92
B - 13: Neighbourhood vitality potential, Pattern 6.1
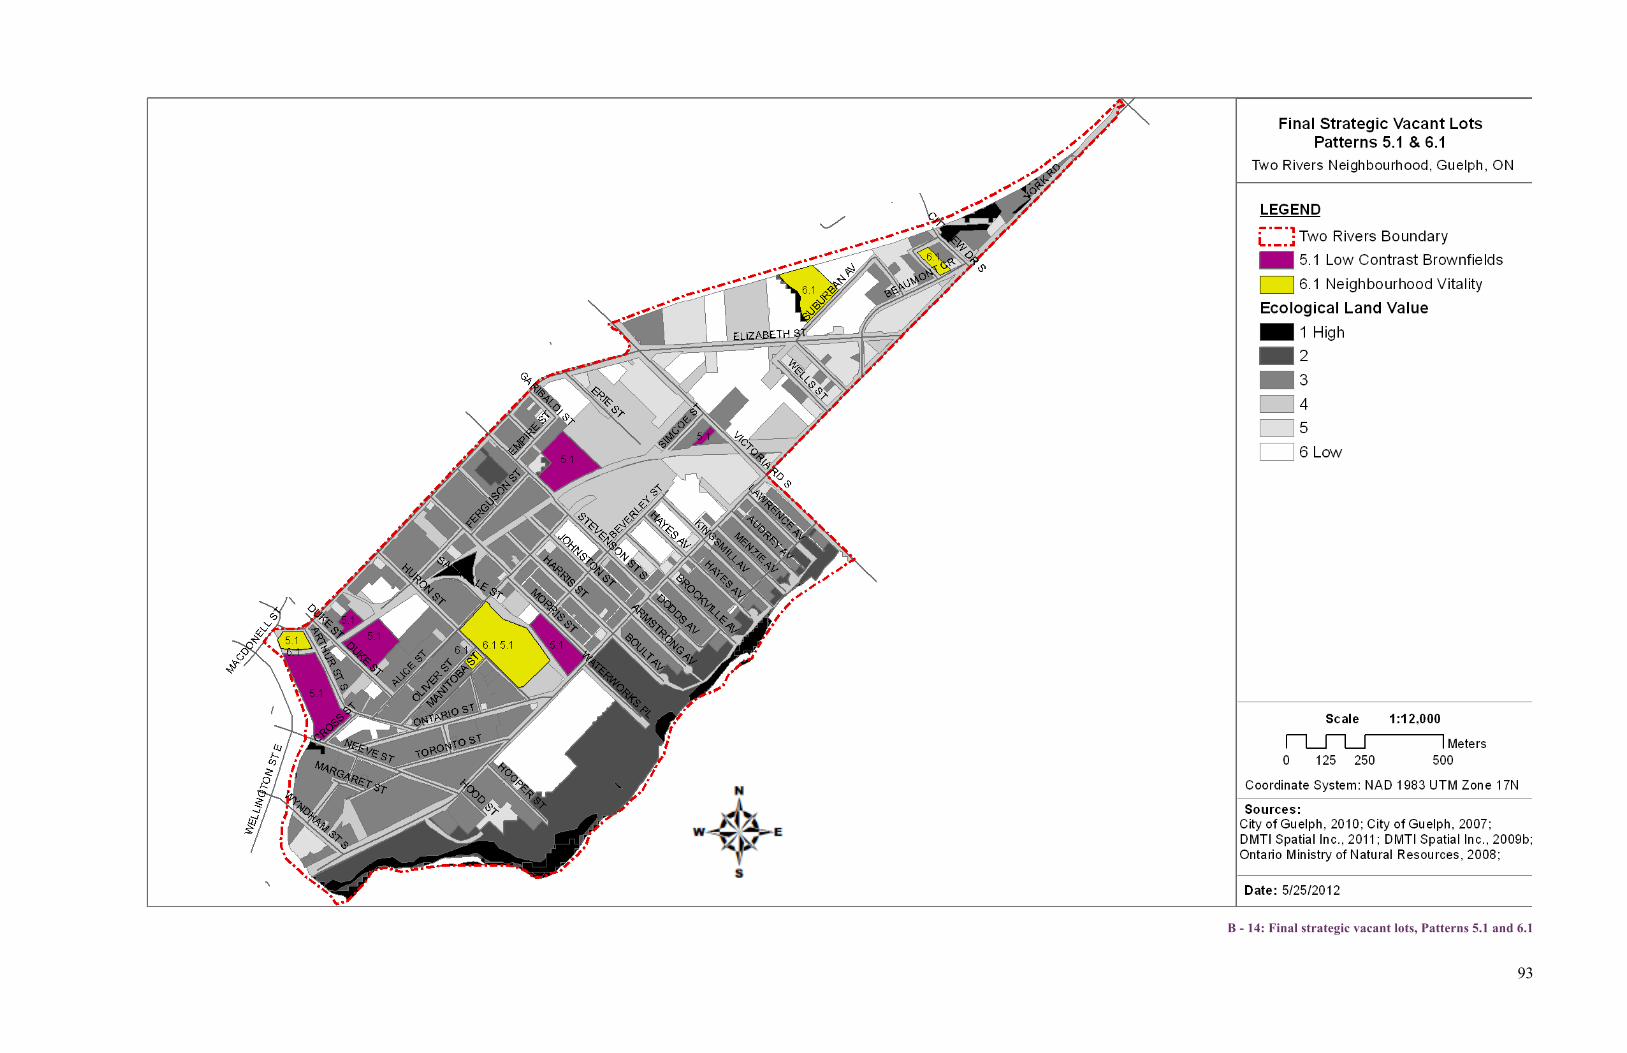
93
B - 14: Final strategic vacant lots, Patterns 5.1 and 6.1
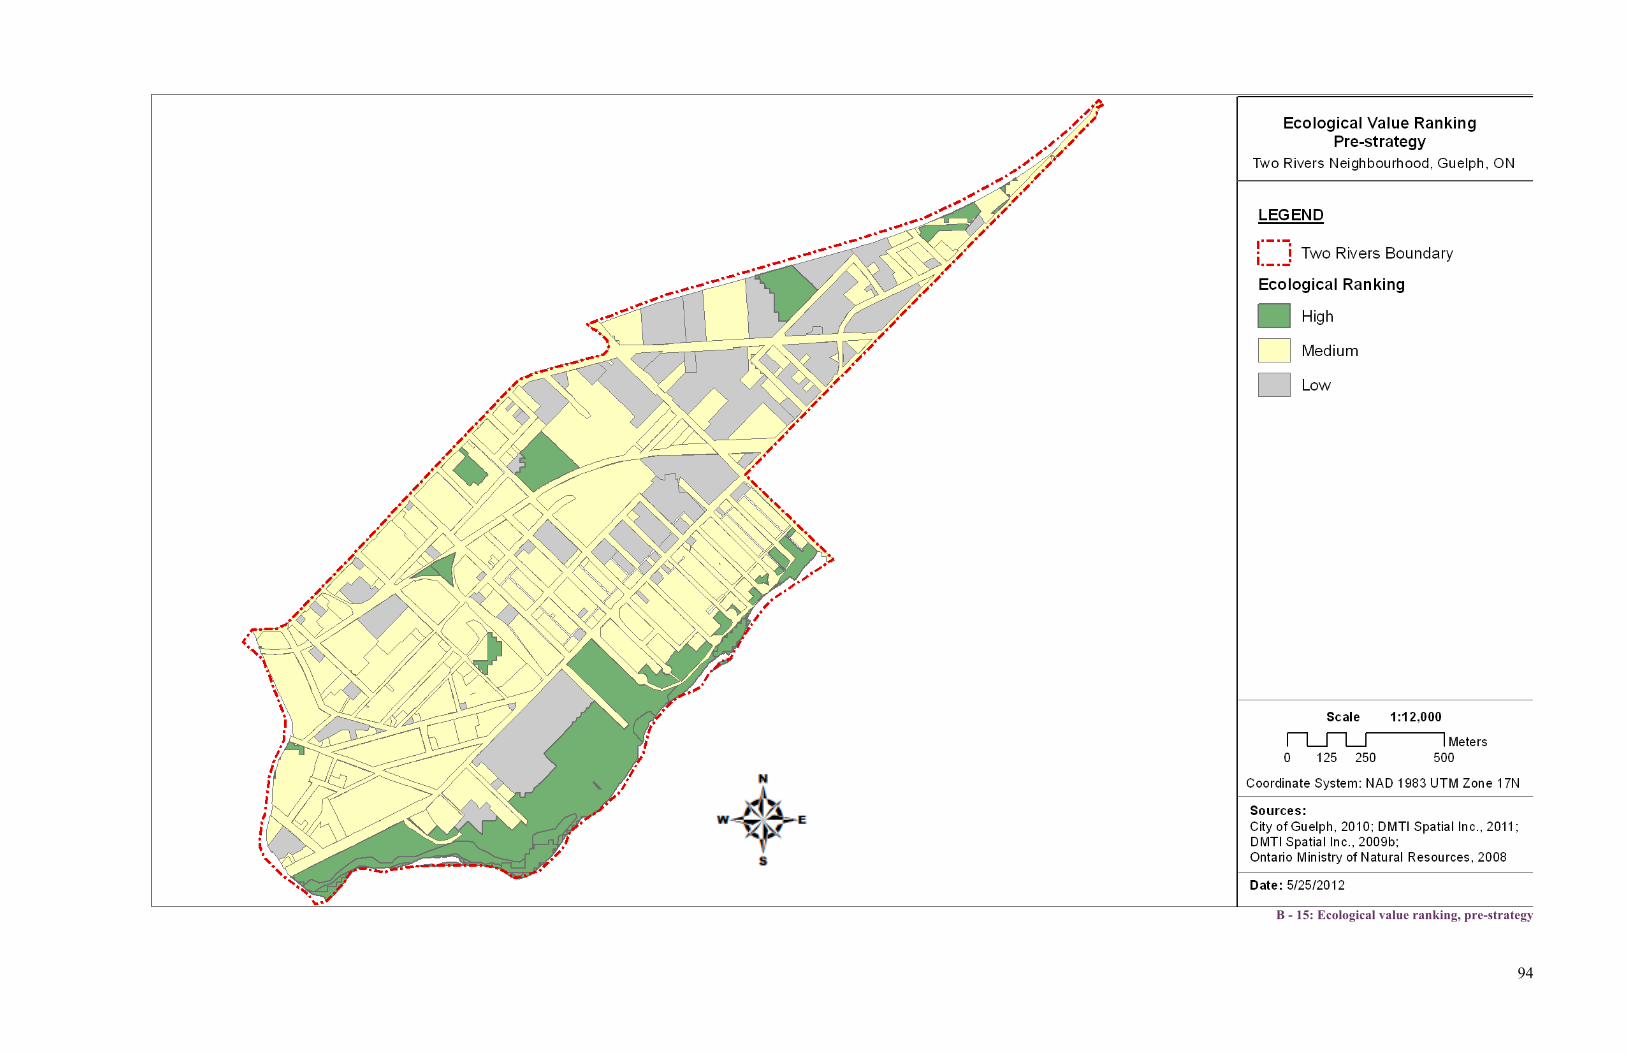
94
B - 15: Ecological value ranking, pre-strategy
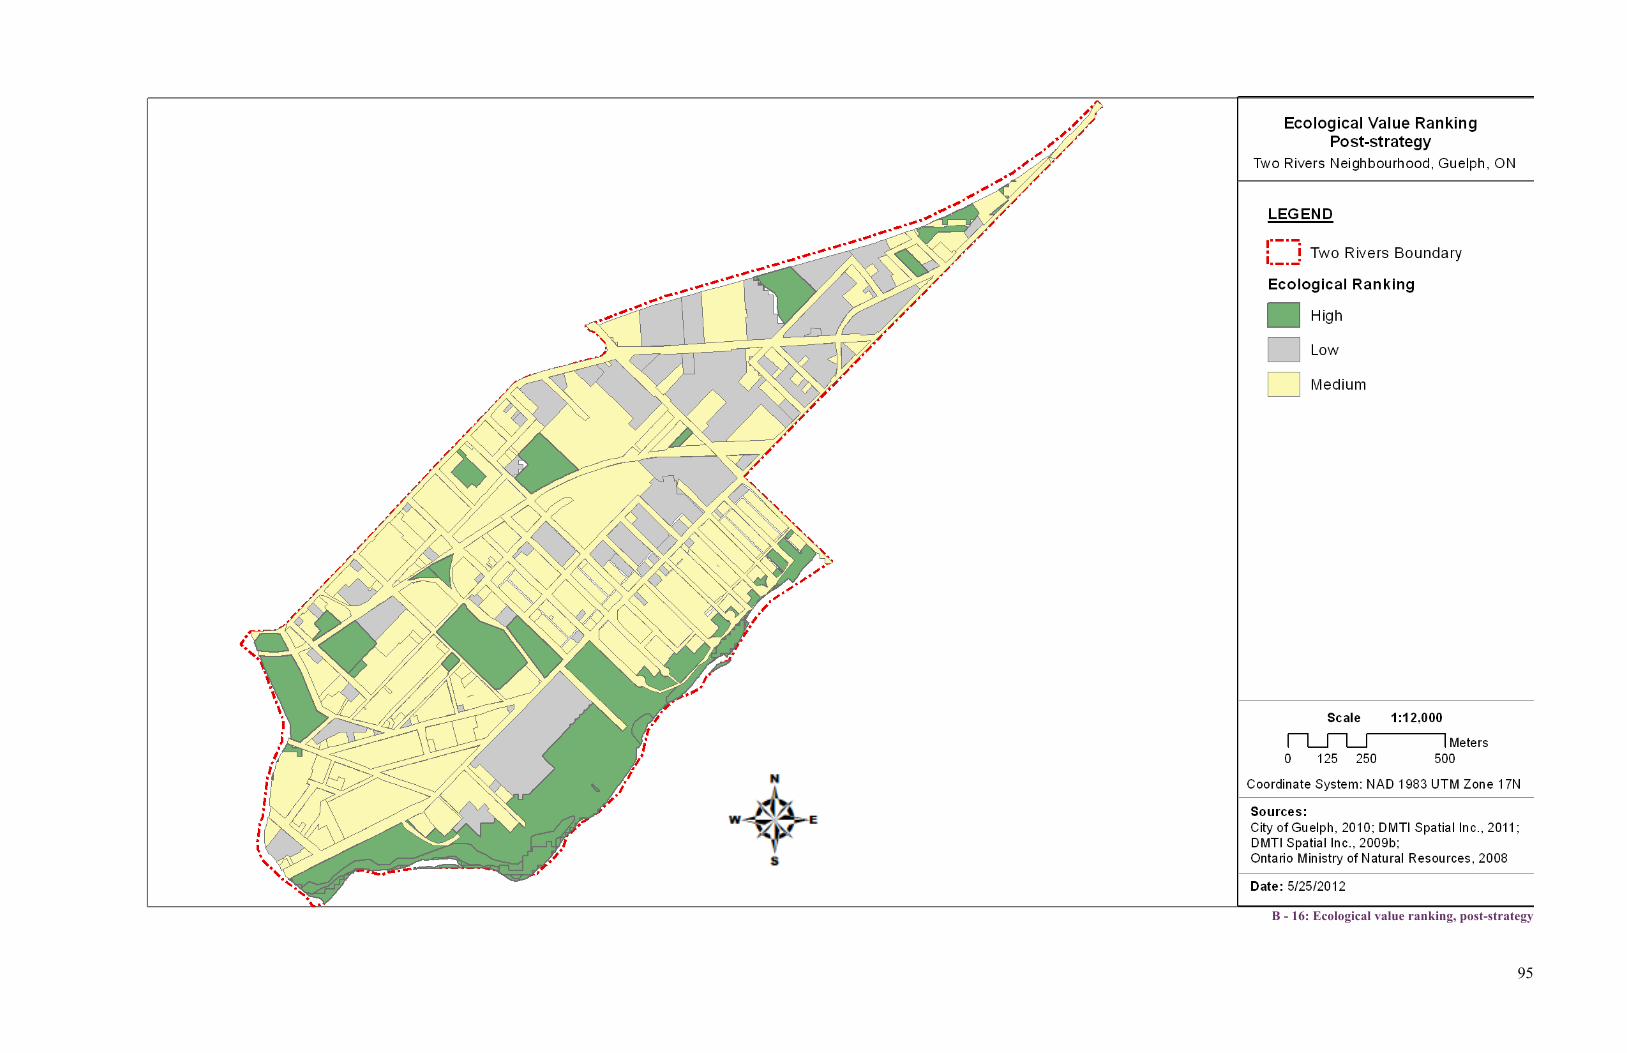
95
B - 16: Ecological value ranking, post-strategy


![rajswasthya.nic.inrajswasthya.nic.in/251 dt 19.04.2015 RUHS 2014 MO POSTING...I / 2015/2 s / 04/2015 VACANT POS] VACANT POS] VACANT POST VACANT POST VACANT POST VACANT POST VACANT](https://img.pdfslide.us/doc/110x75/5ab992577f8b9aa6018e0de9/dt-19042015-ruhs-2014-mo-postingi-20152-s-042015-vacant-pos-vacant-pos.jpg)