Embed Size (px)
Citation preview

Raymond James 20th Equity ConferenceOctober 10, 2012
Continental ResourcesInvestor Relations Update
November 28, 2012

Forward-Looking Information
2
Cautionary Statement for the Purpose of the "Safe Harbor" Provisions of the Private Securities Litigation Reform Act of 1995:
This press release includes "forward-looking statements" within the meaning of Section 27A of the Securities Act of 1933 and Section 21E of the Securities
Exchange Act of 1934. All statements included in this press release other than statements of historical fact, including, but not limited to, statements or
information concerning the Company's future operations, performance, financial condition, production and reserves, schedules, plans, timing of
development, returns, budgets, costs, business strategy, objectives, and cash flow, are forward-looking statements. When used in this press release, the
words "could," "may," "believe," "anticipate," "intend," "estimate," "expect," "project," "budget," "plan," "continue," "potential," "guidance," "strategy,"
and similar expressions are intended to identify forward-looking statements, although not all forward-looking statements contain such identifying words.
Forward-looking statements are based on the Company's current expectations and assumptions about future events and currently available information
as to the outcome and timing of future events. Although the Company believes that the expectations reflected in the forward-looking statements are
reasonable and based on reasonable assumptions, no assurance can be given that such expectations will be correct or achieved or that the assumptions
are accurate. When considering forward-looking statements, readers should keep in mind the risk factors and other cautionary statements described
under Part I, Item 1A. Risk Factors included in the Company's Annual Report on Form 10-K for the year ended December 31, 2011, registration statements
and other reports filed from time to time with the Securities and Exchange Commission (SEC), and other announcements the Company makes from time
to time.
The Company cautions readers that these forward-looking statements are subject to all of the risks and uncertainties, most of which are difficult to predict
and many of which are beyond the Company's control, incident to the exploration for, and development, production, and sale of, crude oil and natural
gas. These risks include, but are not limited to, commodity price volatility, inflation, lack of availability of drilling and production equipment and services,
environmental risks, drilling and other operating risks, regulatory changes, the uncertainty inherent in estimating crude oil and natural gas reserves and in
projecting future rates of production, cash flows and access to capital, the timing of development expenditures, and the other risks described under Part I,
Item 1A. Risk Factors in the Company's Annual Report on Form 10-K for the year ended December 31, 2011, registration statements and other reports
filed from time to time with the SEC, and other announcements the Company makes from time to time.
Readers are cautioned not to place undue reliance on forward-looking statements, which speak only as of the date hereof. Should one or more of the risks
or uncertainties described in this press release occur, or should underlying assumptions prove incorrect, the Company's actual results and plans could
differ materially from those expressed in any forward-looking statements. All forward-looking statements are expressly qualified in their entirety by this
cautionary statement. This cautionary statement should also be considered in connection with any subsequent written or oral forward-looking statements
that the Company, or persons acting on its behalf, may make.
Except as otherwise required by applicable law, the Company disclaims any duty to update any forward-looking statements to reflect events or
circumstances after the date of this press release.

Continental Resources, Inc.
#1 oil producer in Williston Basin
610 MMBoe* proved reserves at MY2012 – 20% growth
Strong 3Q 2012 results� Record production of 105,874 Boepd in September 2012
� Averaged 102,964 Boepd in 3Q – 55% increase over 3Q 2011
� $492.3 MM EBITDAX for 3Q 2012 – 46% increase from 3Q 2011
� $1,368.7 MM EBITDAX for YTD 9/30/12; +53% YOY**
� $1.2 billion of new 5% senior unsecured notes (yield 4.624%)
On track for 57-59% production growth in 2012 (YOY)
3
*CLR estimate of proved reserves at MY2012.
**See reconciliation of EBITDAX to GAAP net income in the Appendix at the end of this presentation.

Strong EBITDAX and Cash Margins
4
EBITDAX ($MM) Cash Margins
$451
$811
$1,304$1,369
$0
$200
$400
$600
$800
$1,000
$1,200
$1,400
$1,600
2009 2010 2011 YTD 9/30/12
69%
73%
75%
73%
66%
67%
68%
69%
70%
71%
72%
73%
74%
75%
76%
2009 2010 2011 YTD 9/30/12
1 See reconciliation of EBITDAX to net income in the Appendix at the end of this presentation.

Bakken: King of Tight Oil Fields
5
Continuous oil field of unprecedented magnitude• 15,000 sq. miles, 87% proven productive
• 24 BBoe technically recoverable (Oct. 2010)
Field continues to grow• Deeper intervals
• Down-spacing
True oil play• Premium crude, refiner’s crude of choice

CLR: King of the Bakken & #1 Oil Producer
6
#1 Bakken producer, driller and leasehold owner• 13% production • 10% rigs• 10% acreage
Net unrisked potential (MB + TF1 only)• 1.5 BBoe• 3,988 locations
Assets continue to grow:• Vertically• Geographically• Strategically

As of 20102011-2012 producer
As of 2012
MB + TF1: Early Stages of Full Development
13,000 sq. miles under development
202 rigs operating• CLR: 19 operated rigs
Less than 1 well per 1280-acre unit on average
4-to-8 wells per zone for full development
Bakken producer Three Forks producer
Full Development Mode
Ongoing Expansion
120 Miles
7
No
rth
Da
ko
ta
Mo
nta
na
25 Miles

Exploring While Developing
8
Lower TF increases OOIP 57%
903 BBo in place (2012)• 32 BBo recoverable @ 3.5%
• 36 BBo @ 4%
• 45 BBo @ 5%
577 BBo in place (2010)• 24 BBoe recoverable
• 20 BBo (3.5% recovery factor)
• 320-acre spacing per zone
Gamma Ray Resistivity
BA
KK
EN
TH
RE
E F
OR
KS
Nisku
Lodgepole
Upper
Lower
Middle
MBKKN
BA
KK
EN
PE
TR
OLE
UM
SY
ST
EM
1
2
4
3
2010
308’
2012

No
rth
Dak
ota
Mo
nta
na
CLR: Three Forks Pioneer
9
25 Miles
160-acre development
Sunline 11-1TF1,023 Boepd IP
320-acre development
320-acre development
TF2, TF3
TF2, TF3, TF4
TF2, TF3, TF4
CLR Core Location
Charlotte 2-22H (TF2)1,396 Boepd IP
Charlotte 3-22H1st test of 3rd bench
Three Forks Isopach Map
Drilled 25% of all TF wells
Proved separation of MB + TF1
10-well coring program – oil shows in TF2, TF3 + TF4
Completed first TF2 producer
First TF3 test being completed
Capital for 2013• TF accelerated de-risking - $70MM
• 320 acre spacing pilot - $161MM
• 160 acre spacing pilot - $36MM

Type curve• 10,000’ lateral / 30 stages• 603 MBoe EUR• Completed well costs (CWC)
• Single well ($9.2MM)
• ECO-Pad well ($8.5MM)
• 82.5% NRI
0
3
6
9
12
15
18
21
0
100
200
300
400
500
600
700
0 100 200 300 400 500
Monthly
Oil
Equiv
(MBoe)
Cum
Oil
Equiv
(MBOE)
Months
Bakken Type Curve
Cum Oil Equiv (MBoe) Oil Equiv (MBoe)
Current Target
Single Well Economics
10

0
20,000
40,000
60,000
80,000
100,000
120,000
140,000
1 11 21 31 41 51 61 71 81 91 101 111 121 131 141 151 161 171 181 191 201
Foo
tage
Dril
led
Days
35% Reduction
Florida Alpha ECO-Pad: 6-well pad
129,321’ drilled in 128 days$21.8MM spud to rig
release cost
6 single wells201 days$29.3MM spud to rig release cost
$7.5MM Drilling Savings with Pad Drilling
Glimpse of the Future
11

Bakken Premium Light Sweet Crude vs. Other Benchmarks Improved Refinery Yield
12
0.00
0.10
0.20
0.30
0.40
0.50
0.60
0.70
0.80
0.90
0
5
10
15
20
25
30
35
40
45
0%
10%
20%
30%
40%
50%
60%
70%
80%
90%
100%
Light Ends
Gasoline
Jet Fuel
Distillate
Resid
Crude Quality: API Gravity & Sulfur Distillation Cuts
●API° ●Sulfur % wt

Williston Basin Evacuation Capacity
13
Pro
duct
ion
volu
me
(MM
Bop
d)
0.0
3.5
0.0
0.5
1.0
1.5
2.0
2.5
3.0
3.5
3Q12 4Q12 1Q13 2Q13 3Q13 4Q13 1Q14 2Q14 3Q14 4Q14 1Q15 2Q15 3Q15 4Q15 1Q16 2Q16 3Q16 4Q16 1Q17 2Q17 3Q17
TransCanada East (42") Enbridge Sandpiper (24")
OneOk Bakken Express (24") TransCanada Keystone XL
SB - High Prairie (16") Western Fuels - NewTown
Enbridge - Berthold Plains - Ross
Hess - Tioga Savage - Trenton
Rangeland - Epping Musket - Dore
Various - Dickinson BOE - Dickinson
UET - Van Hook UET - Beulah
Various - Stampede EOG - Stanley
Pony Express (24") Enbridge BPEP
Plains - Bakken North Butte
Enbridge ND Tesoro Refinery
200 Rig Growth 250 Rig Growth
Bentek Forecast
Rail0.9 MMBopd
CommittedPipeline0.9 MMBopd
ProposedPipeline1.3 MMBopd
(CLR) (CLR)
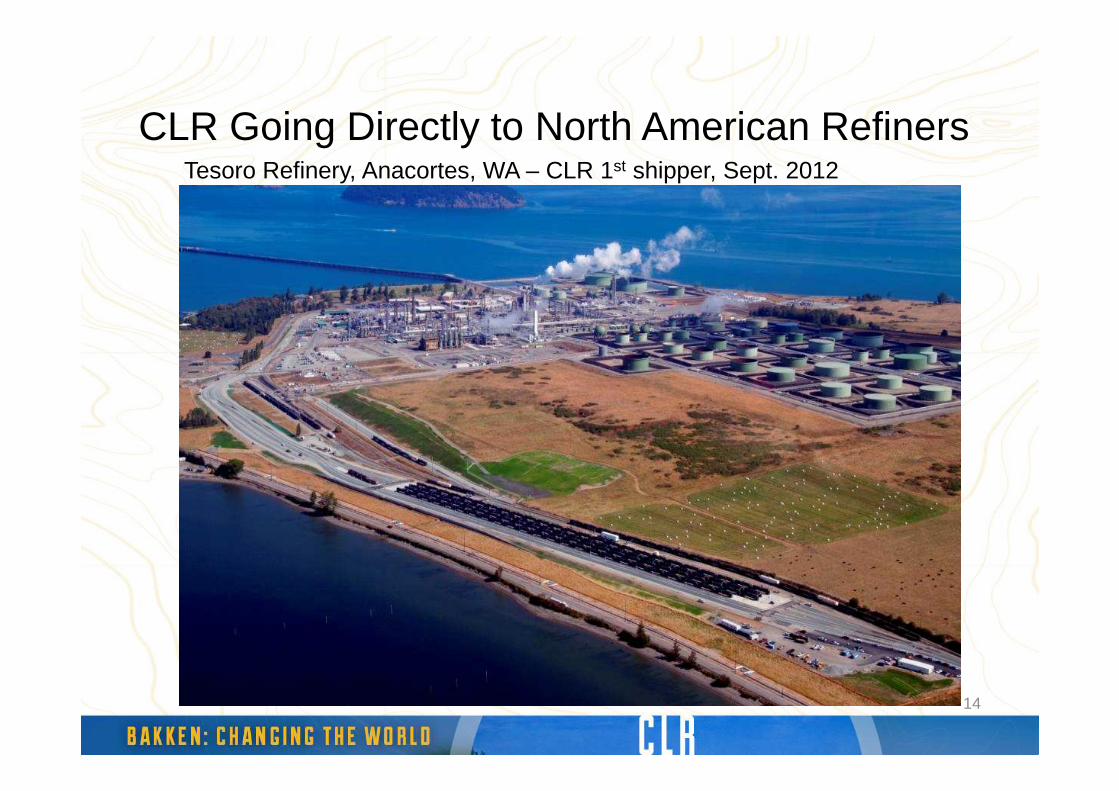
CLR Going Directly to North American Refiners
14
Tesoro Refinery, Anacortes, WA – CLR 1st shipper, Sept. 2012

What’s the “SCOOP”?
15
3 of the top oil-producing counties in Oklahoma
3.2 BBo produced
60 reservoirs
Epicenter of Oklahoma Oil
South Central Oklahoma Oil Province
“SCOOP”
Golden Trend (1945)590 MMBo
Sho-Vel-Tum (1905)1,433 MMBoHealdton (1913)
363 MMBo
Knox97 MMBo
“SCOOP”

SCOOP: A New, High-Impact Resource Play
Thick, high-quality resource shale reservoir
1.8 BBoe net reserve potential to CLR*• 2,200 net locations*
• 25-50% oil, 60-75% total liquids
40-55% ROR**
Commanding leasehold position with 197,340 net acres as of 9/30/2012
16*Based on 80-acre spacing ** $3.50 gas/$90 oil

Here’s the “SCOOP”
17
World-class resource shale• Up to 400’ of oil-rich shale
• Dual reservoir target
Excellent siliceous reservoir • Highly fractured
Source of the oil“SCOOP”
Cana Field
The Woodford Shale70 BBo remains in-situ
“SCOOP”
Okl
ahom
a
Texas
Woodford Shale
Thickness
>300 ft
100 ft
200 ft
25 Miles
Tex
as
Oklahoma
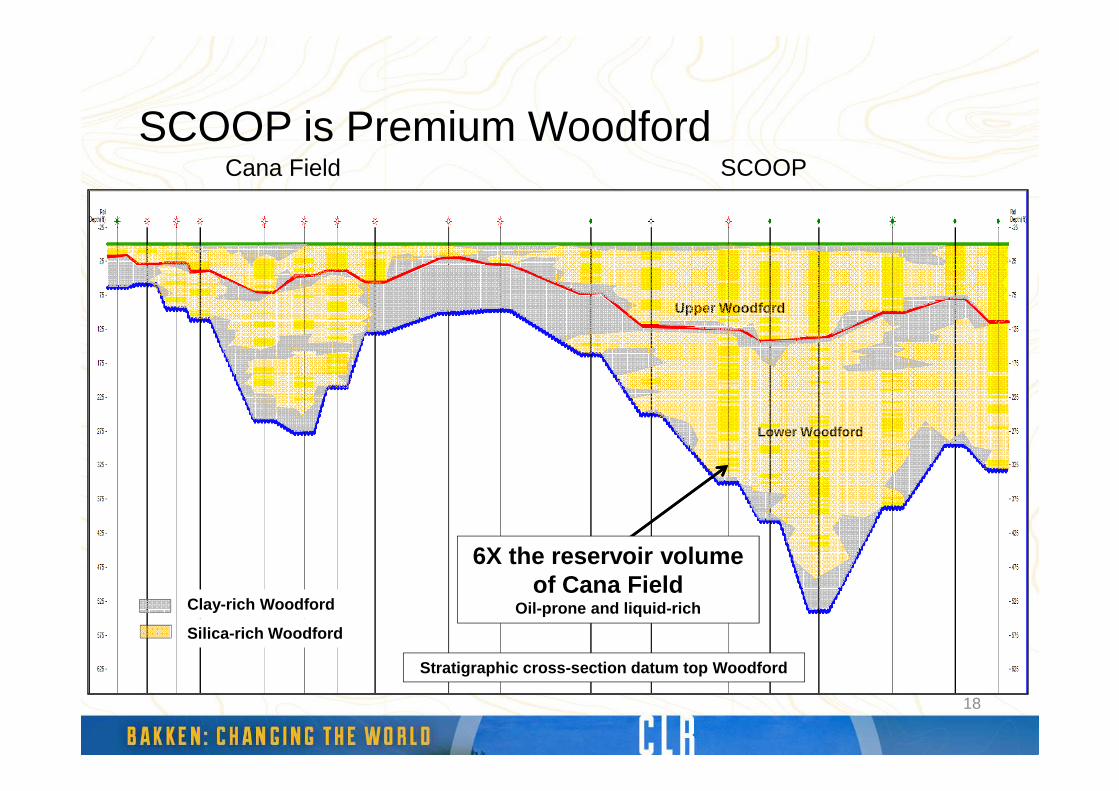
SCOOP is Premium Woodford
18
Cana Field SCOOP
Clay-rich Woodford
Silica-rich Woodford
Upper Woodford
Lower Woodford
6X the reservoir volume of Cana Field
Oil-prone and liquid-rich
Stratigraphic cross-section datum top Woodford

SCOOP: Why Stealth?
19
94,000 acres at YE 2010 (3% HBP)
197,340 acres as of 9/30/12 (20% HBP)
We’ve Been Leasing!
12 Miles
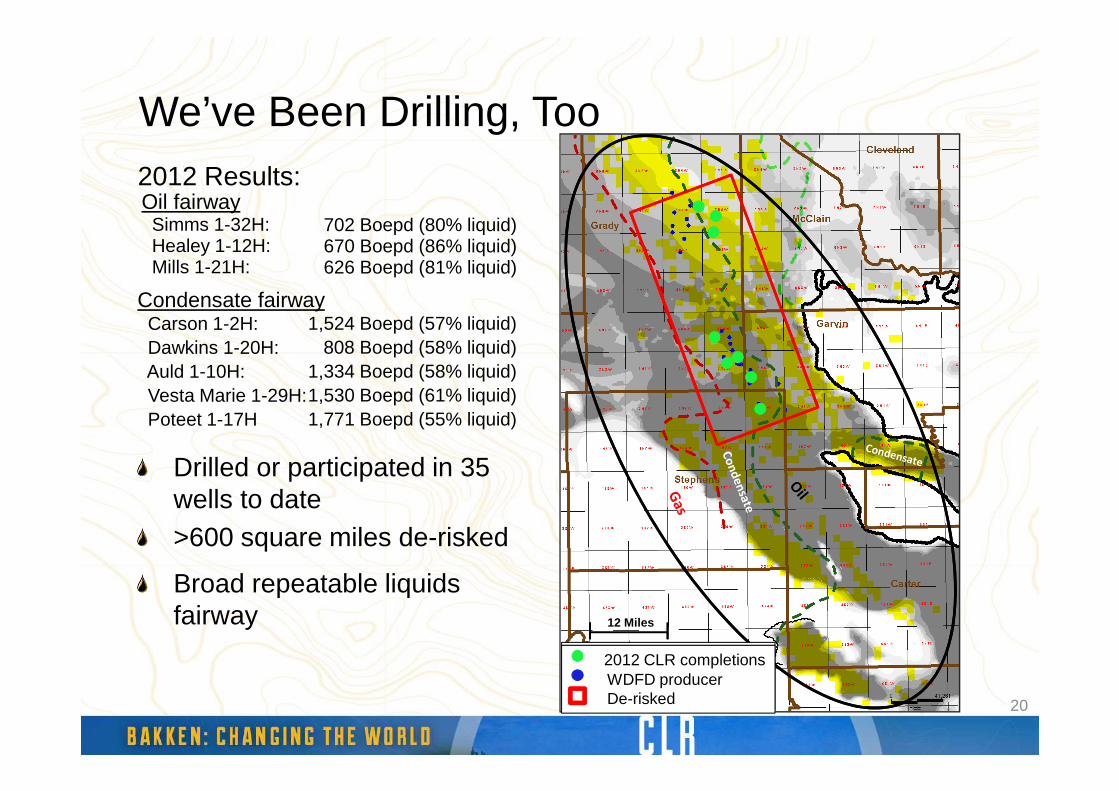
We’ve Been Drilling, Too
20
Drilled or participated in 35 wells to date
2012 Results:Oil fairwaySimms 1-32H: Healey 1-12H: Mills 1-21H:
702 Boepd (80% liquid)670 Boepd (86% liquid)626 Boepd (81% liquid)
Condensate fairwayCarson 1-2H:Dawkins 1-20H:Auld 1-10H:Vesta Marie 1-29H:Poteet 1-17H
1,524 Boepd (57% liquid)808 Boepd (58% liquid)
1,334 Boepd (58% liquid)1,530 Boepd (61% liquid)1,771 Boepd (55% liquid)
Broad repeatable liquids fairway
2012 CLR completionsWDFD producer
>600 square miles de-risked
2012 CLR completionsWDFD producerDe-risked
12 Miles
Oil $9.0 MMOil $8.5 MMCondensate $9.5 MMCondensate $9.0 MM
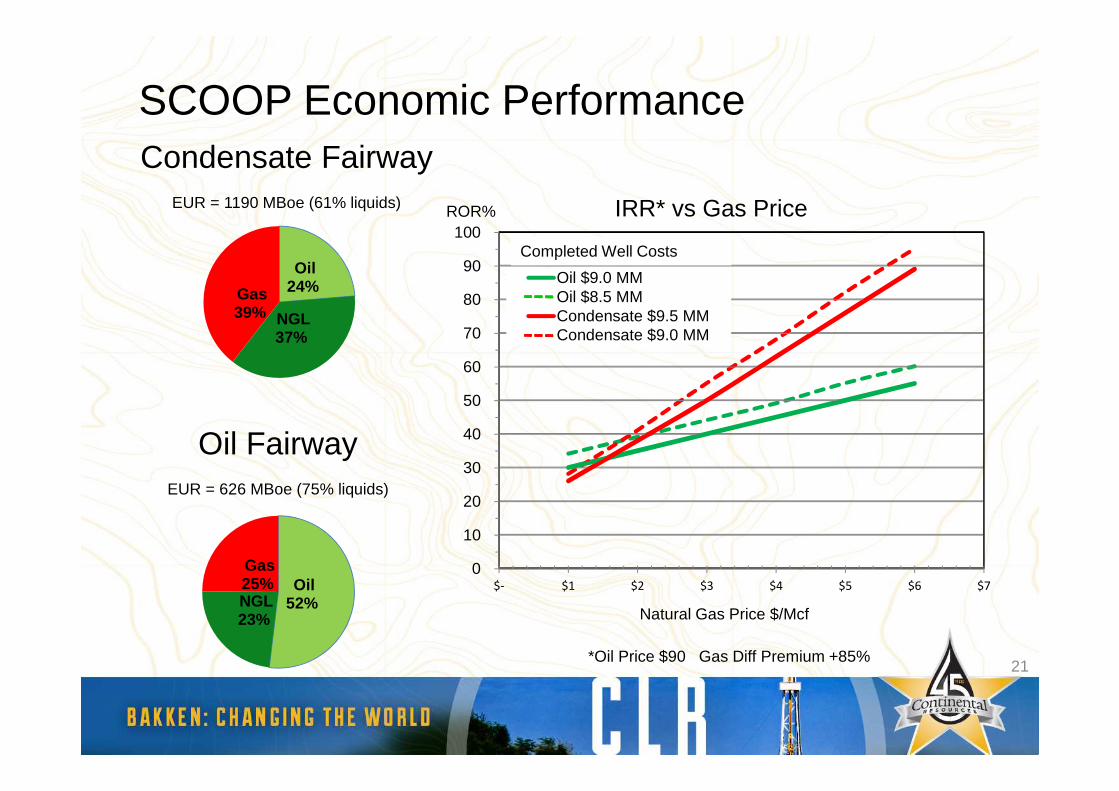
SCOOP Economic Performance
21
Oil24%
NGL37%
Gas39%
Condensate FairwayEUR = 1190 MBoe (61% liquids)
Oil52%NGL
23%
Gas25%
Oil FairwayEUR = 626 MBoe (75% liquids)
0
10
20
30
40
50
60
70
80
90
100
$- $1 $2 $3 $4 $5 $6 $7
IRR* vs Gas Price
Oil $9.0 MMOil $8.5 MMCondensate $9.5 MMCondensate $9.0 MM
Natural Gas Price $/Mcf
*Oil Price $90 Gas Diff Premium +85%
ROR%
Completed Well Costs

Realizing CLR’s Growth Potential
22
-
1,000
2,000
3,000
4,000
5,000
6,000
7,000
8,000
320 BK/TF-160WDFD Spacing
160 BK/TF-80WDFD Spacing
Other
NW Cana
SCOOP
TF3/TF4
TF2
Bakken/TF1
Unbooked Net Resource Potential(MMBoe)
-
2,000
4,000
6,000
8,000
10,000
12,000
14,000
16,000
18,000
320 BK/TF- 160WDFD Spacing
160 BK/TF-80WDFD Spacing
Other
NW Cana
SCOOP
TF3/TF4
TF2
Bakken/TF1
Unrisked Potential Net Wells(Net Wells)
Continental estimated proved reserves MY2012: 610 MMBoe
7,000
4,1008,850
16,950
* Calculations exclude non-prospective acreage.

5-Year Target: Another Triple!
23
0
30
60
90
120
2012* 2013** 2014 2015 2016 2017
48
108+
36
0
500
1000
1500
2000
2011 MY2012 2013 2014 2015 2016 2017
508
1,524
*Midpoint of 57%-to-59% guidance range.**Midpoint of 30% to 35% guidance range.
Production Proved Reserves
610*
97MBoepd
300MBoepd
*CLR Estimate
MMBoe MMBoe

Drilling Capital Allocation ($2.9B)
2013 Capital Expenditures Budget
Total Capital Expenditures ($3.4B)
Exploratory Drilling $430MM
Other$460MM
Development Drilling $2,510MM
Exploratory 15%
Other Development
4%
SCOOP15%
Average operated rigsGross wellsNet wells
201233
847286
201335
738300
24
Bakken 66%

25
$11.3 $2.1
$9.2
$0.4 $0.3 $0.3
$8.2
0
2
4
6
8
10
12
OSO AverageWell Cost (1H 12)
CLR CostEfficiencies
ISO Average WellCost (1H 12)
CompletionEfficiencies
DrillingEfficiencies
Multi-Well Pads Targeted ISOAverage Well Cost
(YE 2013)
$ Million
Low-Cost Bakken Operator$ Million
$9.5
Historical Target
18%Increase
8%Increase
*
*Weighted average well cost, pads and single wells.
2012 2013
OSO Average
Well Cost
(1H 2012)
ISO Average
Well Cost
(1H 2012)

Summary: CLR’s Clear Vision of Growth
Expand and de-risk plays while developing premier oily assets
Operating excellence and continued cost efficiency
Assure transportation/infrastructure gets built as we grow
Implement marketing strategy to reach premier markets
Bring value forward by• Accelerating growth• Managing the margins• Mitigating business risks
Maintain strong balance sheet and financial flexibility26

Appendix
27

2013 Operational and Financial Guidance
28
2013 Production growth range 30% to 35%
Capital expenditures* $3.4B
Price differentials:
WTI crude oil (per barrel of oil) $8 to $11
Henry Hub natural gas (per Mcf) +$1.00 to $1.50
Operating expenses:
Production expense per Boe $5.50 to $5.90
Production tax as a percent
of oil and gas revenues** 8% to 9%
DD&A per Boe $19 to $21
G&A expense per Boe*** $2.40 to $2.90
Non-cash equity compensation per Boe $0.70 to $0.90
Income tax rate 38%
Deferred taxes 90% to 95%
* Excludes acquisition capital expenditures
**Does not include other expenses, such as natural gas transportation fees, which could represent another 1%.
***Excludes non-cash equity compensation

Swaps and Collars As of 10/26/12
29
Crude Oil Derivative Positions SwapsBbls Wtd. Avg. Price Floor Ceiling
Swaps - WTI 1,840,000 $88.69Swaps - Brent 1,058,000 $111.17Collars - WTI 1,340,440 $80.00 $94.71
Swaps - WTI 11,862,500 $92.66Swaps - Brent 2,372,500 $109.19Collars - WTI 8,760,000 $86.92 $99.46
Swaps - WTI 10,311,250 $96.20Swaps - Brent 4,745,000 $100.43Collars - Brent 1,460,000 $90.00 $107.50
Swaps - Brent 1,277,500 $98.48
SwapsMMBtus Wtd. Avg. Price
Swaps - Henry Hub 18,250,000 $3.76
January 2014 - December 2014
Natural Gas Derivative PositionsPeriod and Type of Contract
January 2013 - December 2013
Collars Wtd. Avg. PricePeriod and Type of Contract
October 2012 - December 2012
January 2013 - December 2013
January 2015 - December 2015

Capital Efficiency
30
1 Recycle ratio is calculated as the 3-yr average profit per BOE divided by the 3-yr average F&D cost per BOE
2 Peers include APC, CHK, CXO, DNR, DVN, PXP, SD and WLL.
Source: KeyBanc
$0
$1
$2
$3
$4
$5
$6
CLR Peer 1 Peer 2 Peer 3 Peer 4 Peer 5 Peer 6 Peer 7 Peer 8
5.0x
3.2x
2.7x2.3x
2.1x1.8x 1.7x
1.2x 1.1x
Recycle Ratio – Industry Leader(1)(2)

EBITDAX Reconciliation to GAAP
31
We use a variety of financial and operational measures to asses our performance. Among these measures is EBITDAX. EBITDAX represents earnings (net income) before interest expense,
income taxes, depreciation, depletion, amortization and accretion, property impairments, exploration expenses, non-cash gains and losses resulting from the requirements of accounting for
derivatives, and non-cash equity compensation expense. EBITDAX is not a measure of net income or operating cash flows as determined by GAAP. Management believes EBITDAX is useful
because it allows us to more effectively evaluate our operating performance and compare the results of our operations from period to period without regard to our financing methods or
capital structure. We exclude the items listed above from net income in arriving at EBITDAX because those amounts can vary substantially from company to company within our industry
depending upon accounting methods and book values of assets, capital structures and the method by which the assets were acquired. EBITDAX should not be considered as an alternative to,
or more meaningful than, net income or operating cash flows as determined in accordance with GAAP or as an indicator of a company’s operating performance or liquidity. Certain items
excluded from EBITDAX are significant components in understanding and assessing a company’s financial performance, such as a company’s cost of capital and tax structure, as well as the
historic costs of depreciable assets, none of which are components of EBITDAX. Our computations of EBITDAX may not be comparable to other similarly titled measures of other companies.
We believe that EBITDAX is a widely followed measure of operating performance and may also be used by investors to measure our ability to meet future debt service requirements, if any.
Our revolving credit facility requires that we maintain a total funded debt to EBITDAX ratio of no greater than 4.0 to 1.0 on a rolling four-quarter basis. This ratio represents the sum of
outstanding borrowings and letters of credit under our revolving credit facility plus our note payable and senior note obligations, divided by total EBITDAX for the most recent four quarters.
We were in compliance with this covenant for all periods presented. The following table represents a reconciliation of our net income to EBITDAX for the periods presented:
Year Ended December 31,Three
Months Ended
YTD
2009 2010 2011 9/30/12 9/30/12in thousands
Net income $ 71,338 $ 168,255 $ 429,072 $ 44,096 $ 518,874 Interest expense 23,232 53,147 76,722 39,205 95,174Provision for income taxes 38,670 90,212 258,373 22,931 315,819Depreciation, depletion, amortization and accretion 207,602 243,601 390,899 189,374 499,847Property impairments 83,694 64,951 108,458 27,375 93,153Exploration expenses 12,615 12,763 27,920 4,899 17,752Impact from derivative instruments:
Total (gain) loss on derivatives, net 1,520 130,762 30,049 158,294 (144,377)
Total realized (cash flow) gain (loss) on derivatives, net 569 35,495 (34,106) (1,394) (48,375)
Non-cash (gain) loss on derivatives, net 2,089 166,257 (4,057) 156,900 (192,752)Non-cash equity compensation 11,408 11,691 16,572 7,499 20,804EBITDAX $ 450,648 $ 810,877 $ 1,303,959 $ 492,279 $ 1,368,671

CLR: 4.5 BBoe Bakken Resource Potential
32
-
500
1,000
1,500
2,000
2,500
3,000
3,500
4,000
4,500
5,000
320 BK/TFSpacing
160 BK/TFSpacing
TF3/TF4
TF2
Bakken/TF1
Unbooked Net Resource Potential
(MMBoe)
2,836
4,472
-
2,000
4,000
6,000
8,000
10,000
12,000
14,000
320 BK/TFSpacing
160 BK/TFSpacing
TF3/TF4
TF2
Bakken/TF1
Unrisked Potential Net Wells
(Net Wells)
6,718
13,285
CLR Bakken estimated proved reserves MY2012: 380 MMBoe(calculations exclude non-prospective acreage)

Decreasing Stimulation Costs per Stage
$0
$20
$40
$60
$80
$100
$120
$140
33
$114$124
$111 $108$98
$ ThousandsPer Stage
*Costs include pumping services, wireline, water, packers and plugs.

SCOOP: 1.8 BBoe Woodford Resource Potential
34
-
200
400
600
800
1,000
1,200
1,400
1,600
1,800
2,000
160 WoodfordSpacing
80 WoodfordSpacing
SCOOP
Net Unbooked Resource Potential
(MMBoe)
839
1,800
-
500
1,000
1,500
2,000
2,500
160 WoodfordSpacing
80 WoodfordSpacing
SCOOP
Unbooked Unrisked Potential Net Wells
(Net Wells)
1,114
2,242

SCOOP Type Curves
1350 BTU gas35
Condensate Fairway Type CurveEUR: 1190 MBoe (61% liquids)
Oil Fairway Type CurveEUR: 626 MBoe (75% liquids)
10
100
1000
10000
0 6 12 18 24 30 36 42 48
BO
PD
, MC
FD
Months
Gas Oil
10
100
1000
10000
0 6 12 18 24 30 36 42 48
BO
PD
, MC
FD
Months
Gas Oil