Embed Size (px)
Citation preview
RATES OF GLUCOSE PRODUCTION AND OXIDATION IN NORMAL AND DIABETIC RATS
BY DEWITT STETTEN, JR., ISAAC D. WELT, DWIGHT J. INGLE, AND ERVING H. MORLEY
(From the Division of Nutrition and Physiology, The Public Health Research Institute of the City of New York, Inc., New York, New York, and the Research
Laboratories, The Upjohn Company, Kalamazoo, Michigan)
(Iteceived for publication, February 14, 1951)
Variations in the rates of glucose production and utilization by the in- tact rat have been studied both by the technique of continuous intra- venous injection (1) and the isotope technique (2). The present report deals with the results of a collaborative effort in which the two approaches have been merged with the intent of evaluating these rates under various conditions. Rats under barbiturate anesthesia were given a constant intravenous injection of a solution containing uniformly labeled C?4-glucose at such a rate as to provoke continuous glucosuria. The injection was continued until a plateau, a fairly constant level of radioactivity in the urinary glucose, was achieved, at which time its specific activity was com- pared with that of the glucose being infused. This ratio, considered in conjunction with the known rate of glucose injection, permitted the cal- culation of r, the rate at which glucose was being generated from non- isotopic precursors, since
(1)
whence
a(r + R) = AR
where R is the rate of injection, in mg. of glucose per hour per rat, and A and a are the specific activities of injected and excreted glucose respec- tively. Obviously only the rate of generation of glucose from carbon sources which were not derived from glucose during the experimental period is measured by the method employed. It clearly does not include such contributions to body glucose which resulted from resynthesis from pre- cursors which had themselves arisen from glucose during this period.
Experiments have been conducted upon rats previously untreated, phlo- rhizinized rats, and on rats rendered diabetic by injection of alloxan. In all cases, rats were fasted prior to the experiment in order to minimize any contribution of sugar from the gastrointestinal tract. In the previ- ously untreated animals a relatively high injection rate, 333 mg. of glu-
817
by guest on June 12, 2018http://w
ww
.jbc.org/D
ownloaded from
818 GLUCOSE PRODUCTION AND OXIDATIOX
case per hour, was found necessary to insure glucosuria and as a conse- quence a greater error in r, fAr, resulted from a given error in a. This fact is apparent from Equation 3 which is obtained by differentiation of Equation 2 with respect to a.
&Ar = =FAa
In the alloxsnized and phlorhizinized animals, the rate of infusion, R, could be reduced to 83.3 mg. of glucose per hour, with a consequent smaller error in the calculated rate of glucose production.
In addition to urinary glucose, expired CO2 was collected through a tracheal cannula during that period of time when the specific activity of urinary glucose was at a plateau level. In contrast to the situation with glucose, the specific activity of COZ, under the present experimental con- ditions, fails to attain a plateau in a reasonable period of time, in con- formity with the results obtained by others under somewhat different conditions (3). The observed continuous increase in specific activity of COZ is undoubtedly attributable to the increasing contribution of Cl402 from the oxidation of such other metabolites as the body forms from glucose, and this increase may be expected to continue until every carbon atom which is derivable from glucose in the body of the rat has attained a steady isotope concentration. These considerations introduce a difficulty into any estimate of the rate of biological oxidation of glucose which is based upon the experimental determination of the ratio of specific activity in glucose to that in CO2 (3, 4). It appears to the present workers that the basis of this difficulty lies in the meaning assigned to the phrase “oxidation of glucose.” Carbon atoms of COs can, on the one hand, arise from glucose by fairly direct pathways of glycolysis and oxidation, and, on the other hand, glucose carbon can be delivered to CO2 by devious channels in which other metabolic intermediates such as the fatty acids or certain amino acids intervene. The extent to which these indirect pathways are in- cluded in the definition of “oxidation of glucose” is doubtless determined by the experimental procedure employed, but it is not possible, in the present procedure, to assess with any precision the quantities of CO2 which have arisen from glucose over one or over another pathway.
Despite these difficulties it is of interest to compare the specific activities of exhaled CO, with those of circulating glucose under various experimental conditions. This ratio is equal to the fraction of CO, which has been de- rived by any pathway from glucose at a given time under given conditions. This fraction multiplied by the quantity of CO, exhaled per hour gives the corresponding quantity of CO, derived from glucose per’hour, again at that time and by any pathway, and from this value the rate of complete oxi-
by guest on June 12, 2018http://w
ww
.jbc.org/D
ownloaded from
STETTEN, WELT, INGLE, AND MORLEY 819
dation of glucose, as defined by this experimental procedure, can be com- puted.
Glycogen was isolated from the livers of the normal and the phlorhi- zinized animals at the termination of each experiment. No glycogen could be recovered from the livers of the alloxan-diabetic rats.
EXPERIMENTAL
Preparation of P-Glucose-A sample of ethanol-extracted bean leaves which had previously been allowed to form starch in an atmosphere con- taining Cl402 was kindly supplied by Dr. Martin Gibbs. The starch, after isolation (5), was heated under a reflux for 30 minutes in 2 N HzS04. Sulfate ions were removed by treatment of the resultant solution with the calculated amount of BaC03 and the filtered solution was finally passed through columns containing Amberlite resins lR-100-H and IR-4B. To
TABLE I
Composition of Fluid Diet
gm. Cellu flour (Chicago Dietetic Supply/
House) 120 Osborne-Mendel salt mixture. 40 Dried yeast (Pabst). 100 Wheat germ oil. 10 Cod liver oil. 10 IMazola oil + 100 mg. vitamin K. . 10
m. Mazola oil. Casein (Labco) .I Starch Dextrin Sucrose Water to make total;
190 160 200 190 200
of ._.,.......... ’ .I
2000
this solution, 300 gm. of anhydrous glucose were added as carrier. After the material had been concentrated in vacua to a syrup, about 2 liters of ethanol were added, and crystalliza’tion induced by seeding at 55” (6).
CcHr206. Calculated, C 40.0, H 6.7; found, C 40.1, H 6.5
The product exhibited 1400 c.p.m. per milliatom of C and one further recrystallization from aqeous ethanol at 55” resulted in no significant change in this figure.
Animal Experiments-Male rats of the Sprague-Dawley strain were fed a stock diet of Archer dog pellets until they reached a weight of 240 to 290 gm. The animals were then adapted to the forced feeding of a medium carbohydrate fluid diet (Table I) in amounts of 13 ml. each morning and late afternoon for 14 days or longer prior to experimentation. A period of 24 to 48 hours of fasting preceded the actual experiment (see below). On the morning of the experiment the rats were anesthetized by injection of cyclopal sodium, 11 mg. per 100 gm. of body weight. Through an abdominal incision, the tip of the bladder was excised, and a small plastic
by guest on June 12, 2018http://w
ww
.jbc.org/D
ownloaded from
820 GLUCOSE PRODUCTION AND OXIDATION
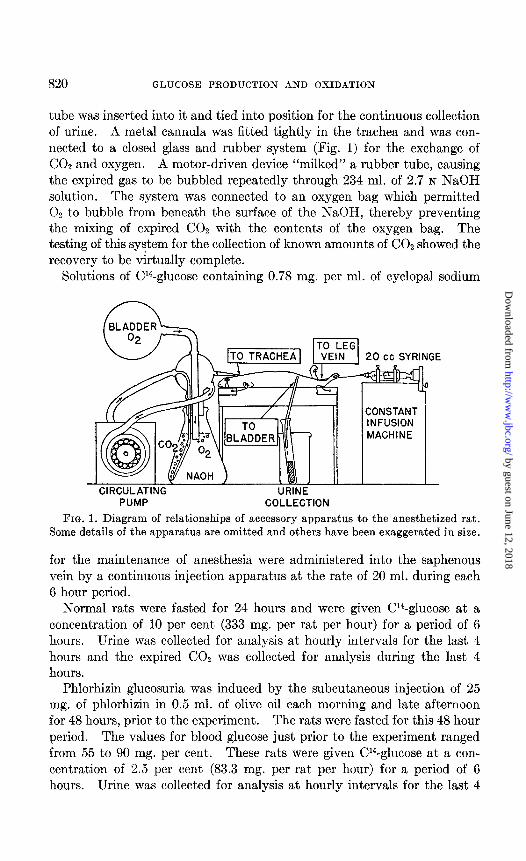
tube was inserted into it and tied into position for the continuous collection of urine. A metal cannula was fitted tightly in the trachea and was con- nected to a closed glass and rubber system (Fig. 1) for the exchange of COZ and oxygen. A motor-driven device “milked” a rubber tube, causing the expired gas to be bubbled repeatedly through 234 ml. of 2.7 N NaOH solution. The system was connected to an. oxygen bag which permitted O2 to bubble from beneath the surface of the NaOH, thereby preventing the mixing of expired COz with the contents of the oxygen bag. The testing of this system for the collection of known amounts of CO2 showed the recovery to be v&rally complete.
Solutions of Cl*-glucose containing 0.78 mg. per ml. of cyclopal sodium
CIRCULATING URINE PUMP COLLECTION
FIG. 1. Diagram of relationships of accessory apparatus to the anesthetized rat. Some details of the apparatus are omitted and others have been exaggerated in size.
for the maintenance of anesthesia were administered into the saphenous vein by a continuous injection apparatus at the rate of 20 ml. during each 6 hour period.
Normal rats were fasted for 24 hours and were given C14-glucose at a concentration of 10 per cent (333 mg. per rat per hour) for a period of 6 hours. Urine was collected for analysis at hourly intervals for the last 4 hours and the expired CO2 was collected for analysis during the last 4 hours.
Phlorhizin glucosuria was induced by the subcutaneous injection of 25 mg. of phlorhizin in 0.5 ml. of olive oil each morning and late afternoon for 48 hours, prior to the experiment. The rats were fasted for this 48 hour period. The values for blood glucose just prior to the experiment ranged from 55 to 90 mg. per cent. These rats were given C14-glucose at a con- centration of 2.5 per cent (83.3 mg. per rat per hour) for a period of 6 hours. Urine was collected for analysis at hourly intervals for the last 4
by guest on June 12, 2018http://w
ww
.jbc.org/D
ownloaded from
STETTEN, WELT, INGLE, AND MORLEY 821
hours and the expired CO2 was collected for analysis during the last 4 hours.
Alloxan diabetes was induced by the injection of alloxan into the sa- phenous vein at a dose of 28 mg. per kilo of rat. Only severely diabetic rats were selected for experimentation. The range of values for their urinary glucose was 6.1 to 7.8 gm. per 24 hours. The rats were fasted for 24 hours prior to the beginning of the tests. C14-Glucose was given at a concentration of 2.5 per cent (83.3 mg. per rat per hour) for a period of 12
hours. Urine was collected at hourly intervals for the last 6 hours and the expired COZ was collected for analysis during the last 4 hours.
In one experiment upon a normal rat a considerably more radioactive sample of glucose (25,200 c.p.m. per milliatom of C) was employed. The injection fluid in this case contained 8.89 per cent of glucose (296 mg. per rat per hour). In this experiment the injection was continued for 12 hours and not only hourly urine samples but also hourly COZ samples were collected separately.
Expired COz-Aliquots of the alkaline solution containing expired COZ were analyzed in the Van Slyke manometric apparatus, and BaC03 was prepared, plated out, and counted by procedures previously described (7).
Liver Glycogen-The entire liver, excised at the end of the experiment, was digested in hot 30 per cent KOH, and glycogen was precipitated and purified as previously described (7).
Urinary Glucose-To each hourly urine sample were added 1 ml. of redistilled phenylhydrazine and 2 ml. of an acetate buffer (50 mg. of sodium acetate + 60 mg. of acetic acid per ml.), and the mixture was heated at 100” for 50 minutes. 5 ml. of cold Hz0 were added and, after 3 hours of refrigeration, phenylglucosazone was, removed by filtration and washed with cold acetone. The product was recrystallized from aqueous methanol and the resultant crystals of typical form were removed by filtration, washed with alcohol and ether, and dried in vacua over PZOs.
C&H2z04N4. Calculated. C 60.3, H 6.2, N 15.6
Found. “ 60.5, “ 6.4, “ 15.4, ash 0.2
Further recrystallization of this product, in several samples, failed to alter significantly the specific activity. Likewise transformation of this material to phenylglucosatriazole (8) had no effect on the specific activity of the glucose moiety.
All specific activities were determined for organic compounds after a wet ashing and conversion to BaC03 by procedures previously described (7).
Rates of Glucose Production-When glucose was injected into normal rats at the rate of 333 mg. per hour, the specific activity of urinary glucose was
by guest on June 12, 2018http://w
ww
.jbc.org/D
ownloaded from
822 GLUCOSE PRODUCTION AND OXIDATION
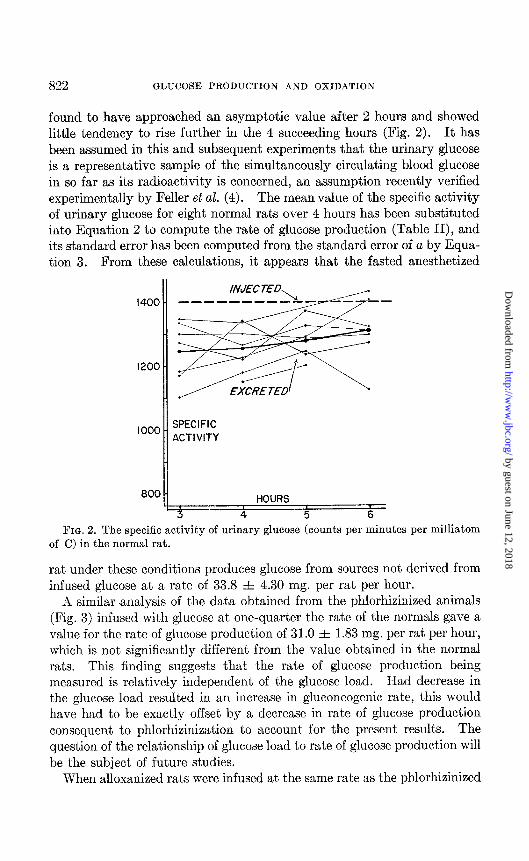
found to have approached an asymptotic value after 2 hours and showed little tendency to rise further in the 4 succeeding hours (Fig. 2). It has been assumed in this and subsequent experiments that the urinary glucose is a representative sample of the simultaneously circulating blood glucose in so far as its radioactivity is concerned, an assumption recently verified experimentally by Feller et al. (4). The mean value of the specific activity of urinary glucose for eight normal rats over 4 hours has been substituted into Equation 2 to compute the rate of glucose production (Table II), and its standard error has been computed from the standard error of a by Equa- tion 3. From these calculations, it appears that the fasted anesthetized
1200 -
,ooo SPECIFIC ACTIVITY
FIG. 2. The specific activity of urinary glucose (counts per minutes per milliatom of C) in the normal rat.
rat under these conditions produces glucose from sources not derived from infused glucose at a rate of 33.8 A 4.30 mg. per rat per hour.
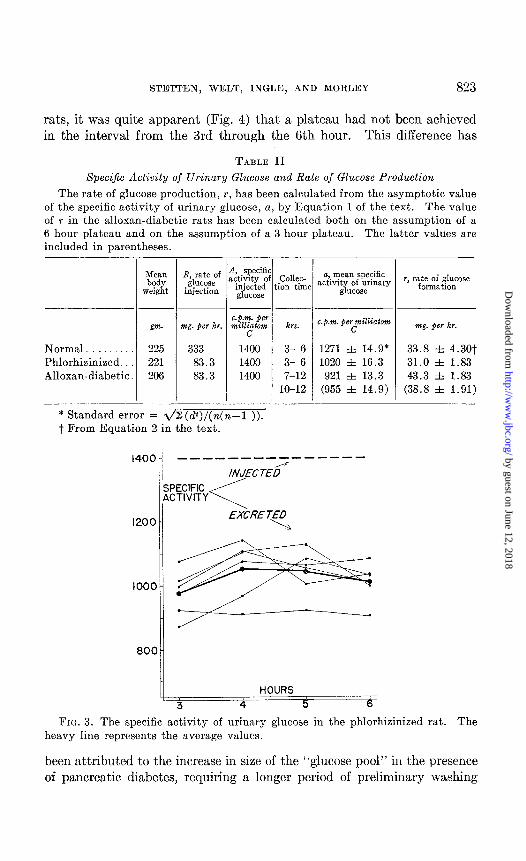
,4 similar analysis of the data obtained from the phlorhizinized animals (Fig. 3) infused with glucose at one-quarter the rate of the normals gave a value for the rate of glucose production of 31.0 ZL 1.83 mg. per rat per hour, which is not significantly different from the value obtained in the normal rats. This finding suggests that the rate of glucose production being measured is relatively independent of the glucose load. Had decrease in the glucose load resulted in an increase in gluconeogenic rate, this would have had to be exactly offset by a decrease in rate of glucose production consequent to phlorhizinization to account for the present results. The question of the relationship of glucose load to rate of glucose production will be the subject of future studies.
When alloxanized rats were infused at the same rate as the phlorhizinized
by guest on June 12, 2018http://w
ww
.jbc.org/D
ownloaded from
STETTEN, WELT, INGLE, AND MORLEY 823
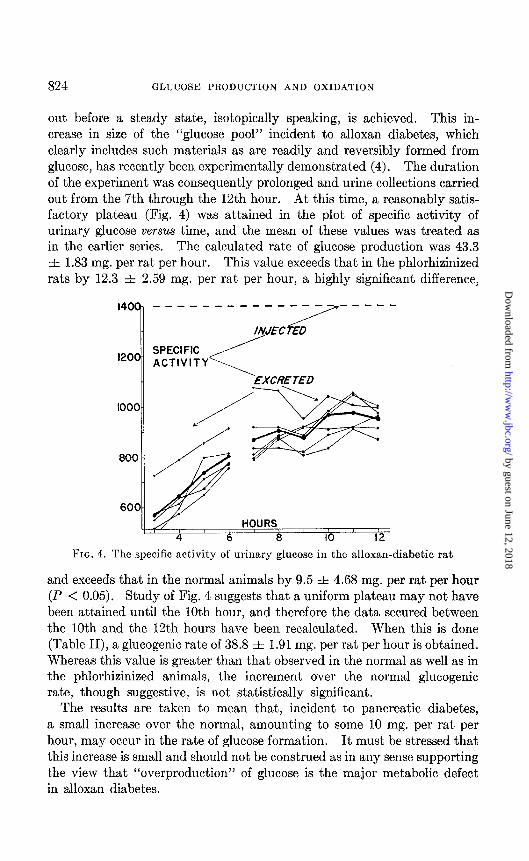
rats, it was quite apparent (Fig. 4) that a plateau had not been achieved in the interval from the 3rd through the 6th hour. This difference has
TABLE II
Specific Activity of Urinary Glucose and Rate of Glucose Production
The rate of glucose production, r, has been calculated from the asymptotic value of the specific activity of urinary glucose, a, by Equation 1 of the text. The value of T in the alloxan-diabetic rats has been calculated both on the assumption of a 6 hour plateau and on the assumption of a 3 hour plateau. The latter values are included in parentheses.
Mean body
R, rate of &;;eyci$ glucose
weight injection injected glucose
c.g.?tf. per im. mg. per hr. mill~tm
Normal. 225 333 1400 Phlorhizinized. 221 83.3 1400 Alloxan-diabetic. 206 83.3 1400
* Standard error = dz(o?)/(n(n-1 )). t From Equation 2 in the text.
-
; t
_
-
Collec- ion tim
13,. mean specific xtlvity of urinary
glucose
hrs.
3- 6 1271 f 14.9* 3- 6 1020 zt 16.3 7-12 921 r!G 13.3
10-12 (955 f 14.9)
I, rate of glucose formation
nzg. per hr.
33.8 f 4.307 31.0 f 1.83 43.3 f 1.83
(38.8 f 1.91)
1400 ___--------- --- /7
INJECTED
-SPECIFIC ACTIVITY
<
1200 EXCRETED
-
1000
800
HOURS
- 3 4 5 6
FIG. 3. The specific activity of urinary glucose in the phlorhizinized rat. The heavy line represents the average values.
been attributed to the increase in size of the “glucose pool” in the presence of pancreatic diabetes, requiring a longer period of preliminary washing
by guest on June 12, 2018http://w
ww
.jbc.org/D
ownloaded from
824 GLUCOSE PRODUCTION AND OXIDATION
out before a steady state, isotopically speaking, is achieved. This in- crease in size of the “glucose pool” incident to alloxan diabetes, which clearly includes such materials as are readily and reversibly formed from glucose, has recently been experimentally demonstrated (4). The duration of the experiment was consequently prolonged and urine collections carried out from the 7th through the 12th hour. At this time, a reasonably satis- factory plateau (Fig. 4) was attained in the plot of specific activity of urinary glucose versus time, and the mean of these values was treated as in the earlier series. The calculated rate of glucose production was 43.3 f 1.83 mg. per rat per hour. This value exceeds that in the phlorhizinized rats by 12.3 f 2 59 mg. per rat per hour, a highly significant difference,
1400
1200.
800 -
600.
____-----m-v-- -----
/ INJEC ED
SPECIFIC ACTIVITY
Yl I I HOURS
4 6 8 IO 12
FIG. 4. The specific activity of urinary glucose in the alloxan-diabetic rat
and exceeds that in the normal animals by 9.5 f 4.68 mg. per rat per hour (P < 0.05). Study of Fig. 4 suggests that a uniform plateau may not have been attained until the 10th hour, and therefore the data secured between the 10th and the 12th hours have been recalculated. When this is done (Table II), a glucogenic rate of 38.8 & 1.91 mg. per rat per hour is obtained. Whereas this value is greater than that observed in the normal as well as in the phlorhizinized animals, the increment over the normal glucogenic rate, though suggestive, is not statistically significant.
The results are taken to mean that, incident to pancreatic diabetes, a small increase over the normal, amounting to some 10 mg. per rat per hour, may occur in the rate of glucose formation. It must be stressed that this increase is small and should not be construed as in any sense supporting the view that “overproduction” of glucose is the major metabolic defect in alloxan diabetes.
by guest on June 12, 2018http://w
ww
.jbc.org/D
ownloaded from
STETTEN, WELT, INGLE, AND MORLEY 825
It should be reiterated that in all of these calculations the rate measured is that of glucose production from non-isotopic precursors. That many potentially glucogenic tissue constituents are acquiring radioactive carbon during the course of the experiment is indicated by the results of Wick et al. (3), but the present experiments do not permit evaluation of the magnitude of contribution from this source to C14-glucose.
Oxidation of Glucose to COz-The mean specific activity of the COz ex-
TABLE III
Specijic Activity of Expired CO2
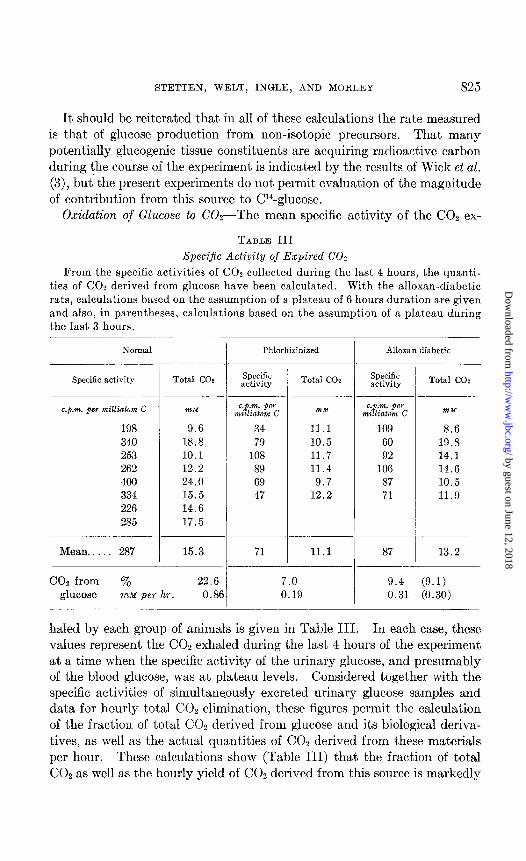
From the specific activities of CO2 collected during the last 4 hours, the quanti- ties of CO2 derived from glucose have been calculated. With the alloxan-diabetic rats, calculations based on the assumption of a plateau of 6 hours duration are given and also, in parentheses, calculations based on the assumption of a plateau during the last 3 hours.
Normal Phlorhizinized Alloxan-diabetic
Specific activity Total COe Specific activity Total COz Specific
activity Total COz
c.p.m. per mizziaton c
34 79
108 89 69 47
?md
11.1 10.5 11.7 11.4
9.7 12.2
c.p.m. per mizziatm c
109 60 92
106 87 71
198 9.6 340 18.8 253 10.1 262 12.2 400 24.0 334 15.5 226 14.6 285 17.5
8.6 19.8 14.1 14.6 10.5 11.9
Mean. 287 15.3 71 11.1 87
COZ from % 22.6 7.0 9.4 glucose m.w per hr. 0.86 0.19 0.31
13.2
19.1) 10.30)
haled by each group of animals is given in Table III. In each case, these values represent the CO2 exhaled during the last 4 hours of the experiment at a time when the specific activity of the urinary glucose, and presumably of the blood glucose, was at plateau levels. Considered together with the specific activities of simultaneously excreted urinary glucose samples and data for hourly total COz elimination, these figures permit the calculation of the fraction of total CO2 derived from glucose and its biological deriva- tives, as well as the actual quantities of CO1 derived from these materials per hour. These calculations show (Table III) that the fraction of total CO2 as well as the hourly yield of CO, derived from this source is markedly
by guest on June 12, 2018http://w
ww
.jbc.org/D
ownloaded from
826 GLUCOSE PRODUCTION AND OXIDATION
subnormal in both the phlorhizinized and in the alloxan-diabetic rats. In the phlorhizinized animals these decreases are probably attributable to the lower level of blood glucose concentration. In the alloxan-diabetic animals, however, such an explanation is not possible. The finding strongly indicates a definite inhibition incident to diabetes at some point or points along the pathway blood glucose + expired COZ, although it is clearly not possible from the present experiments to specify the inhibited process.
INJECTED\
24000 R
220007
20000-
18000-
16000-
14000-
12000- SPECIFIC
EXCRETED’ GLUCOSE
ACTIVITY 10000
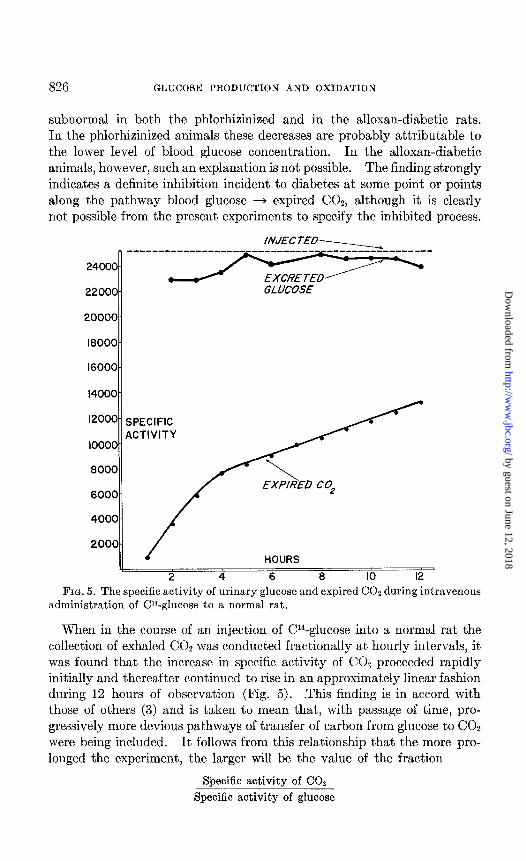
FIG. 5. The specific activity of urinary glucose and expired CO2 during intravenous administration of Cl4-glucose to a normal rat.
When in the course of an inject,ion of C4-glucose into a normal rat the collection of exhaled CO, was conducted fractionally at hourly intervals, it was found that the increase in specific activity of CO, proceeded rapidly initially and thereafter continued to rise in an approximately linear fashion during 12 hours of observation (Fig. 5). .This finding is in accord with those of others (3) and is taken to mean that, with passage of time, pro- gressively more devious pathways of transfer of carbon from glucose to CO2 were being included. It follows from this relationship that the more pro- longed the experiment, the larger will be the value of the fraction
Specific activity of CO2
Specific activity of glucose
by guest on June 12, 2018http://w
ww
.jbc.org/D
ownloaded from
STETTEN, WELT, INGLE, AND MORLEY 827
and that consequently, if such data are to be employed in estimates of the rate of glucose oxidation, an arbitrary time must be selected. We have elected in the present calculations to employ the CO2 exhaled after the specific activity of circulating glucose had attained a plateau. Despite the somewhat arbitrary nature of this judgment, it is felt that useful in- formation is gained from comparison of the values obtained from the three types of experimental animals and that such comparison is essentially valid. It may be pointed out that, in so far as the alloxanized animals were carried for I2 rather than 6 hours, the deviation from the normal observed in the oxidation of glucose by these animals is probably less than that which actually occurred.
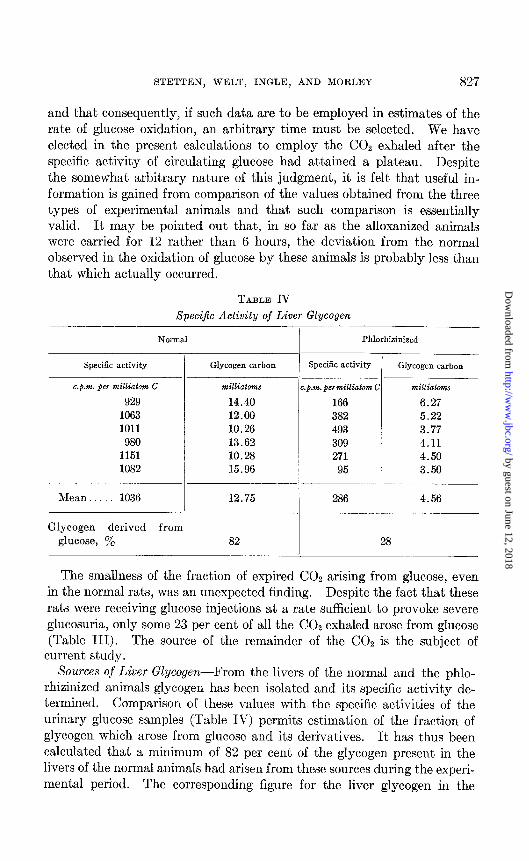
TABLE IV SpeciJic Activity of Liver Glycogen
Normal Phlorhizinized
Specific activity Glycogen carbon Specific activity Glycogen carbon
c.fi.m. &?r millialm c miz1iotoms c.g.m. fwmilliotom c milliatms
929 14.40 166 6.27 1063 12.00 382 5.22 1011 10.26 493 3.77
980 13.62 309 4.11 1151 10.28 271 4.50 1082 15.96 95 3.50
Mean. 1036 12.75 286 4.56
Glycogen derived from glucose, y. 82 28
The smallness of the fraction of expired COZ arising from glucose, even in the normal rats, was an unexpected finding. Despite the fact that these rats were receiving glucose injections at a rate sufficient to provoke severe glucosuria, only some 23 per cent of all the COZ exhaled arose from glucose (Table III). The source of the remainder of the CO2 is the subject of
current study. Sources of Liver Glycogen-From the livers of the normal and the phlo-
rhizinized animals glycogen has been isolated and its specific activity de- termined. Comparison of these values with the specific activities of the urinary glucose samples (Table IV) permits estimation of the fraction of glycogen which arose from glucose and its derivatives. It has thus been calculated that a minimum of 82 per cent of the glycogen present in the livers of the normal animals had arisen from these sources during the experi- mental period. The corresponding figure for the liver glycogen in the
by guest on June 12, 2018http://w
ww
.jbc.org/D
ownloaded from
828 GLUCOSE PRODUCTION AND OXIDATION
phlorhizinized rats was 28 per cent, and this difference has again been attributed to the lower blood glucose concentration in the latter group. No glycogen was recovered from the livers of the alloxan-diabetic rats.
DISCUSSION
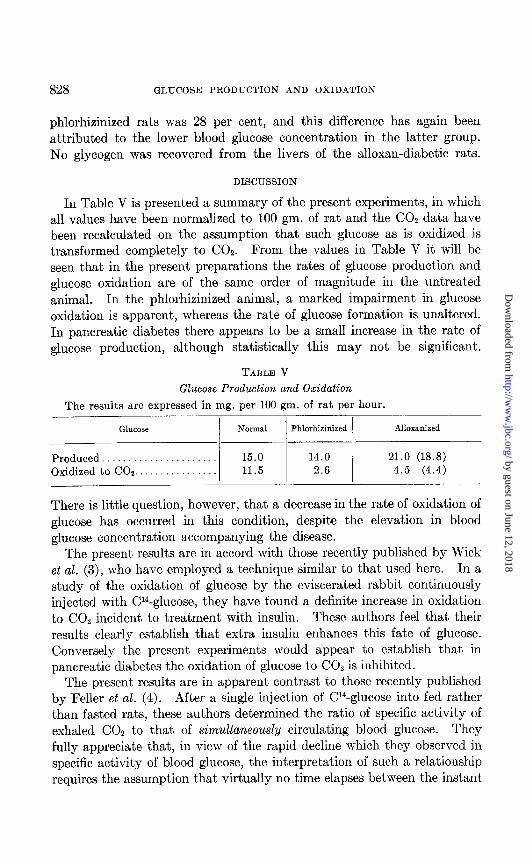
In Table V is presented a summary of the present experiments, in which all values have been normalized to 100 gm. of rat and the CO2 data have been recalculated on the assumption that such glucose as is oxidized is transformed completely to COZ. From the values in Table V it will be seen that in the present preparations the rates of glucose production and glucose oxidation are of the same order of magnitude in the untreated animal. In the phlorhizinized animal, a marked impairment in glucose oxidation is apparent, whereas the rate of glucose formation is unaltered. In pancreatic diabetes there appears to be a small increase in the rate of glucose production, although statistically this may not be significant.
TABLE V
Glucose Production and Oxidation The results are expressed in mg. per 100 gm. of rat per hour.
GhiXe / Normal 1 Phlorhizinized 1 Alloxanized
Produced......................
Oxidized to COz.. .
There is little question, however, that a decrease in the rate of oxidation of glucose has occurred in this condition, despite the elevation in blood glucose concentration accompanying the disease.
The present results are in accord with those recently published by Wick et al. (3), who have employed a technique similar to that used here. In a study of the oxidation of glucose by the eviscerated rabbit continuously injected with Cl*-glucose, they have found a definite increase in oxidation to COZ incident to treatment with insulin. These authors feel that their results clearly establish that extra insulin enhances this fate of glucose. Conversely the present experiments would appear to establish that in pancreatic diabetes the oxidation of glucose to CO, is inhibited.
The present results are in apparent contrast to those recently published by Feller et al. (4). After a single injection of C14-glucose into fed rather than fasted rats, these authors determined the ratio of specific activity of exhaled CO, to that of simultaneously circulating blood glucose. They fully appreciate that, in view of the rapid decline which they observed in specific activity of blood glucose, the interpretation of such a relationship requires the assumption that virtually no time elapses between the instant
by guest on June 12, 2018http://w
ww
.jbc.org/D
ownloaded from
STETTEN, WELT, INGLE, AND MORLEY 829
of removal of a molecule of glucose from the blood stream and the moment of appearance of CO2 derived from it in the expired air. This assumption appears improbable to the present workers, and indeed there is evidence in the paper of Feller et al. (4) that it is not valid. Thus they find that approximately 1 hour elapses between the moment of injection of U4-glu- case and the time of attainment of maximal radioactivity in expired CO,. Whatever factors produced this delay in the 1st hour may be presumed to be operating during succeeding hours also. Feller et al. (4) cite as evi- dence in support of their assumption the claim that the hemilogarithmic plots of specific activity versus time for blood glucose and CO2 are parallel. Careful study reveals that these lines, as they plot them, converge ap- preciably, a convergence which is reflected in their own calculations. It is perhaps worth noting that, whereas the California group failed to find an inhibition of oxidation of glucose in the intact diabetic rat, the same laboratory (9) has more recently reported the occurrence of precisely such an inhibition when liver slices derived from the diabetic rat were studied.
The present procedure was designed to avoid the necessity of this assumption made by Feller et al. In order to do this, a constant level of specific activity in circulating glucose has been maintained, in so far as possible, and this has necessitated the use of anesthetized animals. An- esthesia undoubtedly introduces a disturbance in physiology, but it is noteworthy that even in the experiments of Feller et al. (4) etherization was necessary both at the beginning and at the end of each experiment.
It has previously been established (10) that the diabetic rat is less com- petent than the normal rat to employ glucose in lipogenesis, a finding recently confirmed in a study of liver slices (9). From the present results, it is concluded that the diabetic rat exhibits a similar inhibition in the oxi- dation of glucose to COS. From tlie fact that Wick et al. (3) report an increase in the appearance of glucose carbon atoms in all products ex- plored, incident to insulin administration, it may be inferred that the lack of insulin affects all fates of glucose adversely.
The authors wish to express their gratitude to Miss Mildred C. Prestrud, Miss Kathryn E. Thomas, and Mr. Harold I. Nachimson for assistance in the performance of various analytical procedures.
SUMMARY
By means of continuous intravenous injection of a solution of C14- glucose into anesthetized rats, constant, levels of specific activity of urinary, and presumably circulating, glucose have been attained in untreated, phlorhizinized, and alloxan-diabetic rats.
From the specific activities of injected and excreted glucose and the
by guest on June 12, 2018http://w
ww
.jbc.org/D
ownloaded from
830 GLUCOSE PRODUCTION AND OXIDATION
rate of injection, the rate of formation of glucose from sources not derived from the infused glucose has been calculated. This rate, found to be 14 to 15 mg. per 100 gm. of rat per hour in the normal and in the phlo- rhizinized animals, exhibited a statistically barely significant increase to about 21 mg. per 100 gm. of rat per hour in the alloxan-diabetic rats.
From the specific activity of the exhaled COZ, a marked decrease in the rate of total oxidation of glucose was observed incident to phlorhizin or alloxan administration. The normal rat was estimated to oxidize 11.5 mg. of glucose per 100 gm. of rat per hour, whereas the phlorhizinized and alloxan-diabetic rats oxidized 2.6 and 4.5 mg. per 100 gm. per hour re- spectively.
BIBLIOGRAPHY
1. Ingle, D. J., Proc. Am. Diabetes Assn., 8,3 (1948). 2. Stetten, D., Jr., and Klein, B. V., J. Biol. Chem., 159,593 (1945). 3. Wick, A. N., Drury, D. R., Bancroft, R. W., and MacKay, E. M., J. Biol. Chem.,
188, 241 (1951). 4. Feller, D. D., Strisower, E. H., and Chaikoff, I. L., J. Biol. Chem., 187, 571
(1950). 5. Putnam, E. W., Hassid, W. Z., Krotkov, G., and Barker, H. A., J. Biol. Chem.,
173, 785 (1948). 6. Bates, F. J., and associates, Polarimetry, saccharimetry and the sugars, Wash-
ington (1942). 7. Stetten, M. R., and Stetten, D., Jr., J. BioZ. Chem., 187, 241 (1950). 8. Hann, R. M., and Hudson, C. S., J. Am. Chem. Xoc., 66,735 (1944). 9. Chernick, S. S., and Chaikoff, I. L., J. Biol. Chem., 188,389 (1951).
10. Stetten, D., Jr., and Boxer, G. E., J. Biol. Chem., 166, 271 (1944).
by guest on June 12, 2018http://w
ww
.jbc.org/D
ownloaded from
Ingle and Erving H. MorleyDeWitt Stetten, Jr., Isaac D. Welt, Dwight J.
DIABETIC RATSAND OXIDATION IN NORMAL AND RATES OF GLUCOSE PRODUCTION
1951, 192:817-830.J. Biol. Chem.
http://www.jbc.org/content/192/2/817.citation
Access the most updated version of this article at
Alerts:
When a correction for this article is posted•
When this article is cited•
alerts to choose from all of JBC's e-mailClick here
tml#ref-list-1
http://www.jbc.org/content/192/2/817.citation.full.haccessed free atThis article cites 0 references, 0 of which can be by guest on June 12, 2018
http://ww
w.jbc.org/
Dow
nloaded from