Embed Size (px)
Citation preview
Spring 2017, VOL. 30, NO. 4; ISSN 1051-0796
Research Notes and Editorials Include:
► Note from Rasch SIG Chair – Leigh Harrell-Williams
► Diagnosing Item Misfit with Tukey-Hann Functions and RISE Statistics– George
Engelhard, Jr., Jeremy Kyle Jennings
► On Algorithms, ‘Big Data’ and the Future of Psychometrics – Kenneth Royal,
Melanie Lybarger
► JMLE “barely used”? – John M. Linacre
► List of (additional) AERA Rasch Measurement presentations
► Profiles in Rasch Measurement – David Torres Irribarra
Transactions of the Rasch Measurement SIG
American Educational Research Association
RMT Rasch Measurement Transactions
Rasch Measurement Transactions 30:4 Spring 2017 1606
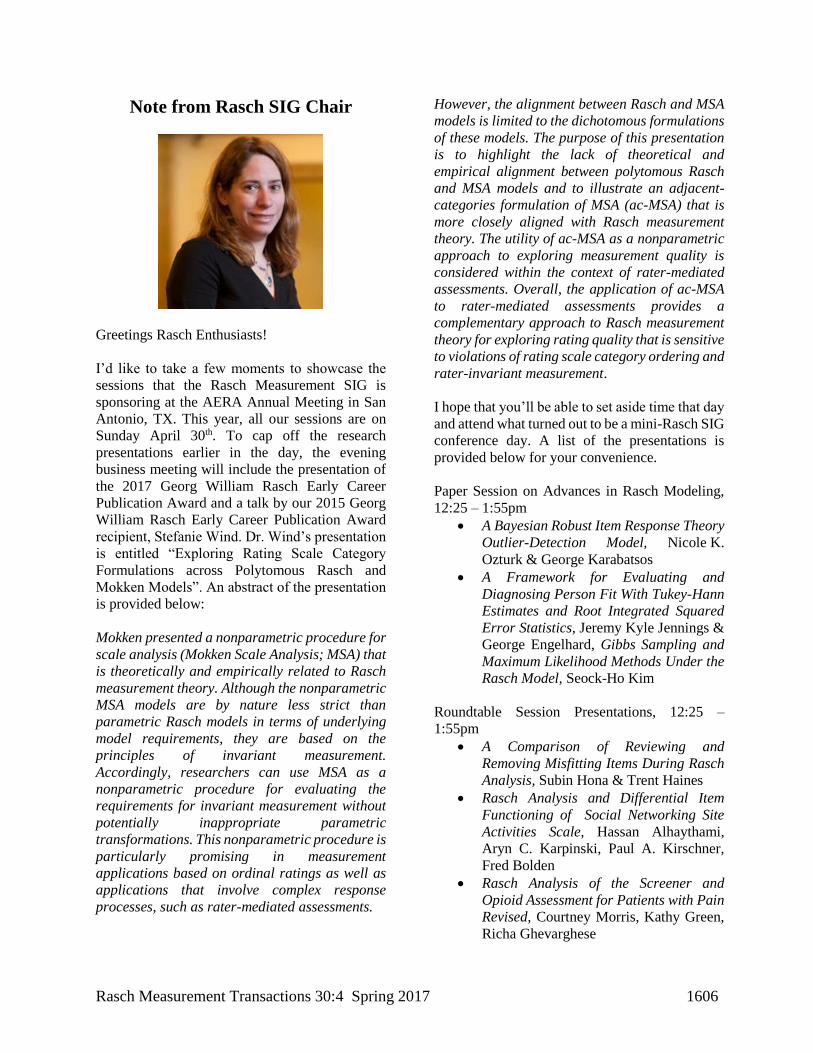
Note from Rasch SIG Chair
Greetings Rasch Enthusiasts!
I’d like to take a few moments to showcase the
sessions that the Rasch Measurement SIG is
sponsoring at the AERA Annual Meeting in San
Antonio, TX. This year, all our sessions are on
Sunday April 30th. To cap off the research
presentations earlier in the day, the evening
business meeting will include the presentation of
the 2017 Georg William Rasch Early Career
Publication Award and a talk by our 2015 Georg
William Rasch Early Career Publication Award
recipient, Stefanie Wind. Dr. Wind’s presentation
is entitled “Exploring Rating Scale Category
Formulations across Polytomous Rasch and
Mokken Models”. An abstract of the presentation
is provided below:
Mokken presented a nonparametric procedure for
scale analysis (Mokken Scale Analysis; MSA) that
is theoretically and empirically related to Rasch
measurement theory. Although the nonparametric
MSA models are by nature less strict than
parametric Rasch models in terms of underlying
model requirements, they are based on the
principles of invariant measurement.
Accordingly, researchers can use MSA as a
nonparametric procedure for evaluating the
requirements for invariant measurement without
potentially inappropriate parametric
transformations. This nonparametric procedure is
particularly promising in measurement
applications based on ordinal ratings as well as
applications that involve complex response
processes, such as rater-mediated assessments.
However, the alignment between Rasch and MSA
models is limited to the dichotomous formulations
of these models. The purpose of this presentation
is to highlight the lack of theoretical and
empirical alignment between polytomous Rasch
and MSA models and to illustrate an adjacent-
categories formulation of MSA (ac-MSA) that is
more closely aligned with Rasch measurement
theory. The utility of ac-MSA as a nonparametric
approach to exploring measurement quality is
considered within the context of rater-mediated
assessments. Overall, the application of ac-MSA
to rater-mediated assessments provides a
complementary approach to Rasch measurement
theory for exploring rating quality that is sensitive
to violations of rating scale category ordering and
rater-invariant measurement.
I hope that you’ll be able to set aside time that day
and attend what turned out to be a mini-Rasch SIG
conference day. A list of the presentations is
provided below for your convenience.
Paper Session on Advances in Rasch Modeling,
12:25 – 1:55pm
A Bayesian Robust Item Response Theory
Outlier-Detection Model, Nicole K.
Ozturk & George Karabatsos
A Framework for Evaluating and
Diagnosing Person Fit With Tukey-Hann
Estimates and Root Integrated Squared
Error Statistics, Jeremy Kyle Jennings &
George Engelhard, Gibbs Sampling and
Maximum Likelihood Methods Under the
Rasch Model, Seock-Ho Kim
Roundtable Session Presentations, 12:25 –
1:55pm
A Comparison of Reviewing and
Removing Misfitting Items During Rasch
Analysis, Subin Hona & Trent Haines
Rasch Analysis and Differential Item
Functioning of Social Networking Site
Activities Scale, Hassan Alhaythami,
Aryn C. Karpinski, Paul A. Kirschner,
Fred Bolden
Rasch Analysis of the Screener and
Opioid Assessment for Patients with Pain
Revised, Courtney Morris, Kathy Green,
Richa Ghevarghese
Rasch Measurement Transactions 30:4 Spring 2017 1607
Paper Session on Applications of the Rasch
Model, 2:15 – 3:45pm
A Multidimenional Rasch Analysis of the
Preschool Instructional Leadership
Survey, Karen Fong & Heather Horsley
An Application of the Mixture Rasch
Model: A Cross-Cultural Comparison of
Eighth-Grade Mathematics Achievement
on the Fourth TIMSS, Turker Tokey,
Kathy E. Green, & Cahit Polat
Score Reporting Using the Rasch Model,
Subin Hona & Trent Haines
A Rasch Analysis of a Global
Engagement Measurement Survey , Meng
Fan, Noel Shadoween, & Lisa Chieffo
Rasch SIG Business Meeting, 6:15 – 7:45pm
Discussion of SIG Business
Presentation of 2017 Georg William
Rasch Early Career Publication Award
Exploring Rating Scale Category
Formulations across Polytomous Rasch
and Mokken Models, Stefanie Wind, 2015
Georg William Rasch Early Career
Publication Award recipient
As always, I would like to extend the opportunity
for Rasch Measurement SIG members to reach
out to me with questions, concerns or suggestions
regarding the SIG. I look forward to hearing from
you.
Sincerely,
Leigh M. Harrell-Williams
Rasch Measurement SIG Chair
Diagnosing Item Misfit with Tukey-Hann
Functions and RISE Statistics
It is well known that good model-data fit is needed
in order to realize the invariant measurement
properties of the Rasch model (Engelhard, 2013a).
Engelhard (2013b) described a nonparametric
approach for estimating person response functions
based on a smoothing function called hanning that
was suggested by Tukey (1977) based on a
method proposed by von Hann (1903). This
estimator provides a nonparametric approach for
modeling a functional relationship between item
difficulties and person locations on a latent
variable. In this article, we use the Tukey-Hann
Function to estimate non-parametric item
response functions. A simple version of this
algorithm recommended by Velleman and
Hoaglin (1981) is given by
si = (yi-1 + 2yi + yi+1) / 4 [1]
where yi is replaced by si. In the context of item
response functions, the sequence of values that
define the x-axis are based on person measures,
and the values on the y-axis to be smoothed by
Equation 1 are the dichotomous item responses
(where yi = 0,1 with 0 representing an incorrect
response and 1 representing a correct response by
persons on item i ). These smoothed values offer
an approach for illuminating various aberrant and
unexpected patterns through graphical displays.
In essence, the first iteration reflects empirical
proportions (weighted) of number correct
responses for three subsets of persons grouped by
adjacent thetas or sum scores. These values can
continue to be smoothed in an iterative fashion
until a desirable balance is found for presenting
the item response function.
Graphical displays provide a useful approach for
diagnosing item misfit. However, it is also
important for practitioners to have numerical
indicators of model-data fit for each item. There
are numerous methods that have been proposed
for summarizing item fit, and there are a variety
of weaknesses associated with each method
(Karabatsos, 2000). An intuitive approach for
summarizing item fit can be developed based on
the RISE statistic (Douglas and Cohen, 2001).
The RISE statistic is defined as follows:
Rasch Measurement Transactions
www.rasch.org/rmt
Editor: Kenneth Royal
Email submissions to: Editor \at/ Rasch.org Copyright © 2017 Rasch Measurement SIG, AERA
Permission to copy is granted.
RMT Editor Emeritus: John M. Linacre
Rasch SIG Chair: Leigh Harrell-Williams
Secretary: Mikaela Raddatz
Treasurer: Matt Schulz
Program Chairs: Sara Hennings & Liru Zhang
Rasch SIG website: www.raschsig.org
Rasch Measurement Transactions 30:4 Spring 2017 1608
1/ 2
* 2[ ( ) ( )] ( )RISE P P f d
(2)
where P() and P*() are the probabilities for the
Rasch-based and Tukey-Hann IRFs respectively
(Douglas & Cohen, 2001). In essence, we are
looking at the distance between the parametric
IRF based on the Rasch model (Rasch,
1960/1980) and the non-parametric IRF (Tukey-
Hann). Various methods, such as the bootstrap
(Wolfe, 2013), can be used to generate an
empirical sampling distribution for determining
the critical value of the RISE statistic for each
item. The steps for calculating these item-fit
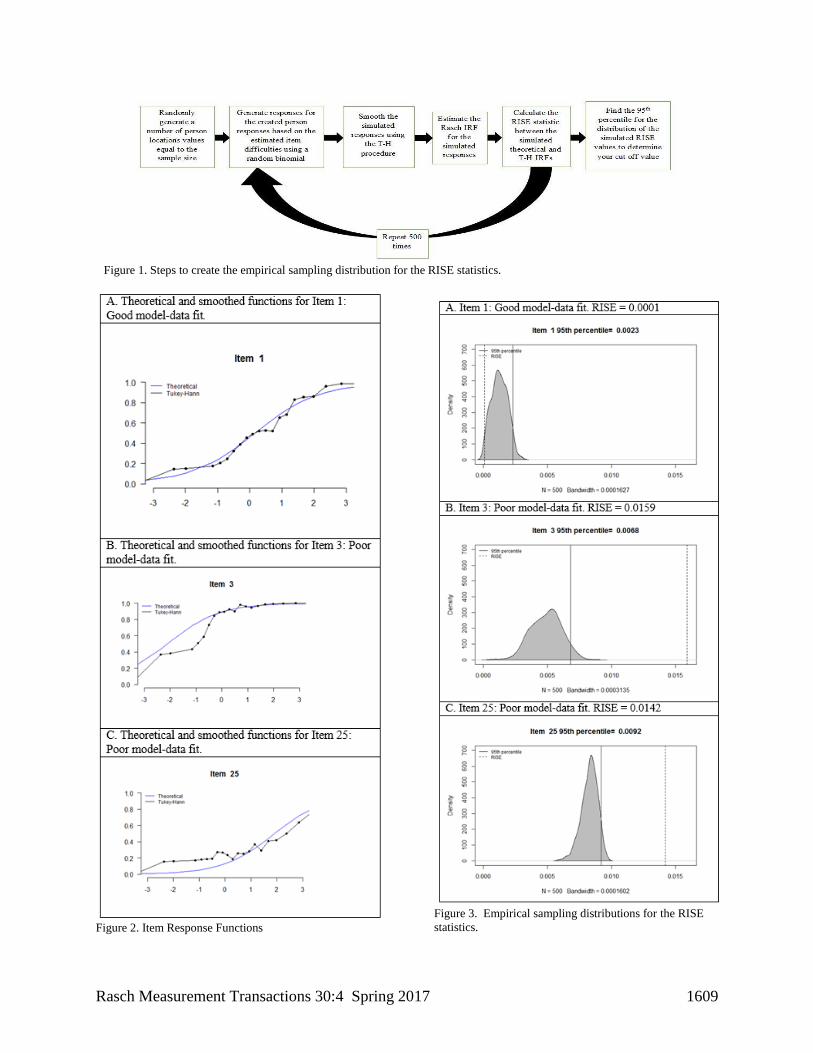
statistics are shown in Figure 1.
Three item response functions are shown in
Figure 2 in order to illustrate the use of the Tukey-
Hann Function in conjunction with the RISE
statistic. Panel A in Figure 2 shows an item with
good fit between the parametric and Tukey-Hann
IRFs. Panels B and C in Figure 2 show item
misfits with observable deviations between
Tukey-Hann and Rasch-based IRFs. Figure 3
illustrates the three empirical sampling
distributions of the RISE statistics for these items
with critical values set at the 95th percentile. For
example, the dotted line in Panel A (Figure 3)
shows RISE value of .0001 with a critical value of
.0023 based on the 95th percentile of the empirical
sampling distribution—this indicates good
model-data fit. Panels B and C (Figure 3) show
RISE values (dotted lines) that are above the
critical values implying misfit for both items.
In summary, item response functions provide
graphical displays that convey information
model-data fit for each item. The RISE statistic
adds a numerical summary of item fit that can be
used in conjunction with the graphical displays.
We have described an approach for obtaining
empirical sampling distributions that can be used
to provide guidance in identifying misfitting
items. Future research is needed on how these
statistics compare to other Rasch-based fit
statistics, as well as the Type I error and power of
this approach for detecting specific types of item
misfit. Model-data fit indices can provide
guidance regarding item quality, but as Rasch
(1960/1980) pointed out:
"A model is never true, but only more or less
adequate" ( p. 92)
George Engelhard, Jr., Jeremy Kyle Jennings
The University of Georgia
References
Douglas, J., & Cohen, A. (2001). Nonparametric
item response function estimation for assessing
parametric model fit. Applied Psychological
Measurement, 25(3), 234-243.
Engelhard, G. (2013a). Invariant measurement:
Using Rasch models in the social, behavioral, and
health sciences. New York: Routledge.
Engelhard, G. (2013b). Hanning person response
functions. Rasch Measurement Transactions,
26(4), 1392-1393.
Karabatsos, G. (2000). A critique of Rasch
residual fit statistics. Journal of Applied
Measurement, 1, 152-176.
Rasch, G. (1960/1980). Probabilistic Models for
Some Intelligence and Attainment Tests.
Copenhagen: Danish Institute for Educational
Research. (Expanded edition, Chicago:
University of Chicago Press, 1980).
Tukey, J.W. (1977). Exploratory data analysis.
Reading, MA: Addison-Wesley Publishing
Company.
Wolfe, E. W. (2013). A bootstrap approach to
evaluating person and item fit to the Rasch
model. Journal of Applied Measurement, 14(1),
1-9.
Velleman, P.F., & Hoaglin, D.C. (1981).
Applications, basics, and computing of
exploratory data analysis. Boston, MA: Duxbury
Press.
von Hann, J. (1903). Handbook of climatology.
New York: The Macmillan Company.
Rasch Measurement Transactions 30:4 Spring 2017 1609
Figure 2. Item Response Functions
Figure 3. Empirical sampling distributions for the RISE
statistics.
Figure 1. Steps to create the empirical sampling distribution for the RISE statistics.
Rasch Measurement Transactions 30:4 Spring 2017 1610
On Algorithms, ‘Big Data’ and the Future
of Psychometrics
The topic of automation replacing human jobs has
been receiving a great deal of media attention in
recent months. In January, the McKinsey Global
Institute (Manyika et al., 2017) published a report
stating 51% of job tasks (not jobs) could be
automated with current technologies. The topic of
‘big data’ and algorithms was also briefly
discussed on the Rasch listserv last year and
offered a great deal of food-for-thought regarding
the future of psychometrics in particular. Several
individuals noted a number of automated scoring
procedures are being developed and fine-tuned,
and each offer a great deal of promise. Multiple
commenters noted the potential benefits of
machine scoring using sophisticated algorithms,
such as power, precision, and reliability. Some
comments even predicted humans will become
mostly obsolete in the future of psychometrics.
Certainly, there is much to get excited about when
thinking about the possibilities. However, there
remain some issues that should encourage us to
proceed with extreme caution.
The Good
For many years now, algorithms have played a
significant role in our everyday lives. For
example, if you visit an online retailer’s website
and click to view a product, you will likely be
presented a number of recommendations for
related products based on your presumed
interests. In fact, years ago Amazon employed a
number of individuals whose job was to critique
books and provide recommendations to
customers. Upon developing an algorithm that
analyzed data about what customers had
purchased, sales increased dramatically. Although
some humans were (unfortunately) replaced with
computers, the ‘good’ was that sales skyrocketed
for both the immediate and foreseeable long-term
future and the company was able to employ many
more people. Similarly, many dating websites
now use information about their subscribers to
predict matches that are likely to be compatible.
In some respects, this alleviates the need for
friends and acquaintances to make what are often
times awkward introductions between two parties,
and feel guilty if the recommendation turns out to
be a bad one. The ‘good’, in this case, is the ability
to relieve people that have to maintain
relationships with each party of the uncomfortable
responsibility of playing matchmaker.
While the aforementioned algorithms are
generally innocuous, there are a number of
examples that futurists predict will change most
everything about our lives. For example, in recent
years Google’s self-driving cars have gained
considerable attention. Futurists imagine a world
in which computerized cars will completely
replace the need for humans to know how to drive.
These cars will be better drivers than humans -
they will have better reflexes, enjoy greater
awareness of other vehicles, and will operate
distraction-free (Marcus, 2012). Further, these
cars will be able to drive closer together, at faster
speeds, and will even be able to drop you off at
work while they park themselves. Certainly, there
is much to look forward to when things go as
planned, but there is much to fear when things do
not.
The Bad
Some examples of algorithmic failures are easy to
measure in terms of costs. In 2010, the ‘flash
crash’ occurred when an algorithmic failure from
a firm in Kansas who ordered a single mass sell
and triggered a series of events that led the Dow
Jones Industrial Average into a tailspin. Within
minutes, nearly $9 trillion in shareholder value
was lost (Baumann, 2013). Although the stocks
later rebounded that day, it was not without
enormous anxiety, fear and confusion.
Rasch Measurement Transactions 30:4 Spring 2017 1611
Another example involving economics also
incorporates psychosocial elements. Several years
ago, individuals (from numerous countries) won
lawsuits against Google when the autocomplete
feature linked libelous and unflattering
information to them when their names were
entered into the Google search engine. Lawyers
representing Google stated "We believe that
Google should not be held liable for terms that
appear in autocomplete as these are predicted by
computer algorithms based on searches from
previous users, not by Google itself." (Solomon,
2011). Courts, however, sided with the plaintiffs
and required Google to manually change the
search suggestions.
Another example involves measures that are more
abstract, and often undetectable for long periods
of time. Consider ‘aggregator’ websites that
collect content from other sources and reproduces
it for further proliferation. News media sites are
some of the most common examples of
aggregators. The problem is media organizations
have long been criticized with allegations of bias.
Cass Sunstein, Director of the Harvard Law
School's program on Behavioral Economics and
Public Policy, has long discussed the problems of
‘echo chambers’, a phenomenon that occurs when
people consume only the information that
reinforces their views (2009). This typically
results in extreme views, and when like-minded
people get together, they tend to exhibit extreme
behaviors. The present political landscapes in the
United States (e.g., democrats vs. republicans)
and Great Britain (e.g., “Brexit” - Britain leaving
the European Union) highlight some of the
consequences that result from echo chambers.
Although algorithms may not be directly
responsible for divisive political views throughout
the U.S. (and beyond), their mass proliferation of
biased information and perspectives certainly
contributes to group polarization that may
ultimately leave members of a society at odds with
one another. Some might argue these costs are
among the most significant of all.
The Scary
Gary Marcus, a professor of cognitive science at
NYU, has published a number of pieces in The
New Yorker discussing what the future may
potentially hold if (and when) computers and
robots reign supreme. In a 2012 article he presents
the following scenario:
Your car is speeding along a bridge at fifty miles
per hour when an errant school bus carrying forty
innocent children crosses its path. Should your
car swerve, possibly risking the life of its owner
(you), in order to save the children, or keep going,
putting all forty kids at risk? If the decision must
be made in milliseconds, the computer will have
to make the call.
Marcus’ example underscores a very serious
problem regarding algorithms and computer
judgments. That is, when we outsource our
control we are also outsourcing our moral and
ethical judgment.
Let us consider another example. The Impermium
corporation, which was acquired by Google in
2014, was essentially an anti-spam company
whose software purported to automatically
“identify not only spam and malicious links, but
all kinds of harmful content—such as violence,
racism, flagrant profanity, and hate speech—and
allows site owners to act on it in real-time, before
it reaches readers.” As Marcus (2015) points out,
how does one “translate the concept of harm into
the language of zeroes and ones?” Even if a
technical operation was possible to do this, there
remains the problem that morality and ethics is
hardly a universally agreed upon set of ideals.
Morality and ethics are, at best, a work-in-
progress for humans, as cultural differences and a
host of contextual circumstances presents an
incredibly complex array of confounding
variables. These types of programming decisions
could have an enormous impact on the world. For
example, algorithms that censor free speech in
democratic countries could spark civil unrest
among people already suspicious of their
government; individuals flagged to be in violation
of an offense could have his/her reputation
irreparably damaged, be terminated by an
employer, and/or charged with a crime(s). When
we defer to computers and algorithms to make our
decisions for us, we are entrusting that they have
all the ‘right’ answers. This is a very scary
proposition given the answers fed to machines
Rasch Measurement Transactions 30:4 Spring 2017 1612
come from data, which are often messy, out-of-
date, subjective, and lacking in context.
An additional concern involves the potential to
program evil into code. While it is certainly
possible that someone could program evil as part
of an intentional, malicious act (e.g., terrorism),
we are referring to evil in the sense of thoughtless
actions that affect others. Melissa Orlie (1997),
expanding on the idea of “ethical trespassing” as
originally introduced by political theorist Hannah
Arendt, discusses the notion of ‘ordinary evil’.
Orlie argues that despite our best intentions,
humans inevitably trespass on others by failing to
predict every possible way in which our decisions
might impact others. Thoughtless actions and
unintended consequences must, therefore, be
measured, included, and accounted for in our
calculations and predictions. That said, the ability
to do this perfectly in most contexts can never be
achieved, so it would seem each day would
present a new potential to open Pandora’s Box.
Extensions to Psychometrics
Some believe the ‘big data’ movement and
advances in techniques designed to handle big
data will, for the most part, make
psychometricians obsolete. No one knows for sure
what the future holds, but at present that seems to
be a somewhat unlikely proposition. First,
members of the psychometric community are
notorious for being incredibly tedious with
respect to not only the accuracy of information,
but also the inferences made and the way in which
results are used. Further, it is apparent that the
greatest lessons learned from previous
algorithmic failures pertains to the unintended
consequences, albeit economically, socially,
culturally, politically, and legally that may result
(e.g., glitches that result in stock market plunges,
legal liability for mistakes, increased divisions in
political attitudes, etc.). Competing validity
conceptualizations aside, earnest efforts to
minimize unintended consequences is something
most psychometricians take very seriously and
already do. If anything, it seems psychometricians
who perform algorithmic audits (Morozov, 2013)
and think meticulously about identifying various
‘ordinary evils’ could only complement a future
in which algorithms are used exclusively. Perhaps
instead of debating whether robots are becoming
more human or if humans are becoming more
robotic, we would be better off simply
appreciating and leveraging the strengths of both?
Kenneth D. Royal, North Carolina State University
Melanie Lybarger, Independent Consultant
References
Baumann, N. (2013). Too fast to fail: How high-
speed trading fuels Wall Street disasters. Mother
Jones. Available at:
http://www.motherjones.com/politics/2013/02/hi
gh-frequency-trading-danger-risk-wall-street
Marcus, G. (2012). Moral machines. The New
Yorker. Available at:
http://www.newyorker.com/news/news-
desk/moral-machines
Marcus, G. (2015). Teaching robots to be moral.
The New Yorker. Available at:
http://www.newyorker.com/tech/elements/teachi
ng-robots-to-be-moral
Orlie, M. (1997). Living ethically, acting
politically. Cornell University Press, Ithaca, NY.
Morozov, E. To Save Everything, Click Here: The
Folly of Technological Solutionism (2013).
PublicAffairs Publishing, New York, NY.
Solomon, K. (2011). Google loses autocomplete
lawsuit. Techradar. Available at:
http://www.techradar.com/news/internet/google-
loses-autocomplete-lawsuit-941498
Sunstein, C. R. (2009). Republic.com 2.0.
Princeton University Press, Princeton, NJ.
Manyika, J., Chui, M., Miremadi, M., Bughin, J.,
George, K., Willmott, P., & Dewhurst, M. (2017).
A future that works: Automation, employment,
and productivity. The McKinsey Global Institute.
Available at: http://www.mckinsey.com/global-
themes/digital-disruption/harnessing-automation-
for-a-future-that-works
Rasch Measurement Transactions 30:4 Spring 2017 1613
JMLE “barely used”?
Question: Psychometrika, 81 (4), 1069-1092,
2016, contains a paper entitled “Joint Maximum
Likelihood Estimation for Diagnostic
Classification Models”. Its Abstract says “JMLE
has been barely used in Psychometrics because
JMLE parameter estimators typically lack
statistical consistency.” This struck me as odd
because (1) Winsteps is not exactly what I would
consider “barely used” and (2) I’ve found the
estimates to be rather consistent. Have you heard
this argument before? - Michael Peabody
Reply: “Lack statistical consistency”? - Yes,
JMLE is “inconsistent” in the statistical sense that
an infinite amount of data would not produce the
exactly-correct parameter estimates. This is due to
estimation bias. JMLE (the only method for which
“observed score=expected score” for both the
persons and the items) does have easily-
correctable estimation bias. This bias is only
noticeable for short tests (for which person
estimates are necessarily imprecise). It was
discussed in the statistical literature in the 1980s,
for instance, www.rasch.org/memo45.htm. To my
knowledge, no one has ever produced a practical
example where the JMLE estimation bias changed
substantive decisions based on the estimates!
Usually we don't bother to correct for it because it
is small and inconsequential. Bias correction is
also awkward when anchoring person abilities or
item difficulties. (Most Rasch estimation methods
cannot anchor person abilities.) The
Psychometrika paper uses information outside the
data to correct this bias.
JMLE advantages include robustness against
missing data, such as CAT tests, and no
assumptions about person or item distributions. It
also produces equivalent estimates for persons
and items if the dataset is transposed (persons =
columns, items = rows) which is useful in
situations where it is unclear which is the “person”
(object of measurement) and which is the “item”
(agent of measurement), such as Georg Rasch's
original dataset of traffic accidents using time-of-
day and street-intersections. Most Rasch
estimation methods use one estimation method for
the items (CMLE, MMLE, PMLE, etc.), then
anchor the item difficulties and use the “observed
score = expected score” MLE method, often with
adjustments, when person ability estimates
(thetas) are needed for individuals.
And yes, Winsteps and Facets use JMLE and are
widely used by practical people who need
robustness and flexibility more than statistical
perfection.
John Michael Linacre
Journal of Applied Measurement
Vol. 17, No. 4, 2016
Does Instruction Affect the Underlying
Dimensionality of a Kinesiology Test? - Nikolaus
Bezruczko, Eva Frank, and Kyle Perkins
Sample Size and Statistical Conclusions from
Tests of Fit to the Rasch Model According to the
Rasch Unidimensional Measurement Model
(RUMM) Program in Health Outcome
Measurement - Peter Hagell and Albert
Westergren
Simultaneous Ability and Difficulty Estimation
Via the Linear Discriminant Function - Jon-Paul
Paolino
Examining Class Differences in Method Effects
Related to Negative Wording: An Example using
Rasch Mixture Modeling - Grant B. Morgan,
Christine DiStefano, and Robert W. Motl
Assessment of Acute Trauma Exposure Response
for FIRE-EMS Personnel - Melissa C. Hofmann
A Rasch Rating Scale Analysis of the Presence of
Nursing Scale-RN - Carol T. Kostovich, Beyza
Aksu Dünya, Lee A. Schmidt,and Eileen G. Collins
Assessing the Psychometric Properties of
Alternative Items for Certification - Mary Anne
Krogh and Timothy Muckle
Likert is Pronounced “LICK-urt” not “LIE-kurt”
and the Data are Ordinal not Interval - Patty Kero
and Daniel Lee
Richard Smith, Editor, www.jampress.org
Rasch Measurement Transactions 30:4 Spring 2017 1614
List of additional Rasch-Related
Presentations for AERA 2017
Identifying Misfitting Achievement Estimates in
Performance Assessments: An Illustration Using
Rasch and Mokken Scale Analyses, Angela
Adrienne Walker, Emory University, Stefanie
Anne Wind, The University of Alabama -
Tuscaloosa
A Rasch Model to Explore the Psychometric
Properties of Client Ratings of Counselor
Competence (CRCC), Hang Jo, Haiyan Bai, K
Dayle Jones, University of Central Florida
Gibbs Sampling and Maximum Likelihood
Methods Under the Rasch Model, Seock-Ho Kim,
University of Georgia
Investigating Rasch and 2PL Short-Form Model
Selection by Minimizing Out-Sample
Classification Error, Anthony Raborn, University
of Florida
Mixture Rasch Model Analysis of a Professional
Preparation Survey for Teachers, Teacher
Candidates, and Teacher Education Program
Faculty, Turker Toker, University of Denver,
Kathy E. Green, University of Denver, Kent
Seidel, University of Colorado Denver
Exploring Rating Scale Category Formulations
across Polytomous Rasch and Mokken Models,
Stefanie Anne Wind, The University of Alabama -
Tuscaloosa
Measuring the learning gains of undergraduate
students: A longitudinal study using the Rasch
modeling, Joseph Chow, Hong Kong University
of Science and Technology, Phoebe Mok
Understanding and Responding to Students’
Mathematical Thinking: A Study in Measurement
and Theory Building, Laurie O. Cavey,
Michele Carney, Gwyneth Hughes, Boise State
University
Measuring Preparedness for Teaching Math: An
Application of Rasch Analysis, Liuhan Cai,
University of Nebraska – Lincoln
A Rasch Analysis of Three Socialization and
Communication Measures in 4th-Year Doctor of
Pharmacy Students, Kelli Ryan, Kent State
University, Joseph M LaRochelle, Xavier
University of Louisiana, Arny C. Karpinski,
Abdullah Alsayar, Kent State University
Measuring Students’ College and Career
Readiness in English Language Arts using a
Rasch-based Self-Efficacy Scale, Shelagh M.
Peoples, Kathleen Marie Flanagan,
Massachusetts Dept. of Elementary and
Secondary Education
Comparability of Paper-and-Pencil and Two
Computer-Based Tests, Joseph Hardcastle,
American Association for the Advancement of
Science, Cari F. Herrmann-Abell, George E.
DeBoer, American Association for the
Advancement of Science
Assessing Argumentative Writing: A Facets
Analysis of Rater Use of a Claim-Evidence-
Reasoning Rubric, Lisa J. Lynn, Kimberly A.
Lawless, University of Illinois at Chicago
Evaluation of the extended version of My Teacher
questionnaire: One-parameter logistic model,
Ridwan Maulana, University of Groningen
Michelle Helms-Lorenz, University of Groningen
Investigation of the Psychometric Properties of
the National Higher Education Entrance
Examination in China, Do-Hong Kim, Chuang
Wang, University of North Carolina - Charlotte
Chunlian Jiang, University of Macau
Psychometric Properties and Convergent Validity
of the Chinese Version of the Rosenberg Self-
Esteem Scale, Meng-Ting Lo, The Ohio State
University – Columbus, Ssu-Kuang Chen,
National Chiao Tung University, Taiwan
Ann A. O'Connell, The Ohio State University
Principals' Use of Rating Scale Categories in
Teacher Evaluation, Stefanie Anne Wind, The
University of Alabama – Tuscaloosa, Chia-Lin
Tsai, University of Missouri, Sara Bernice
Chapman, University of Delaware, Christi
Crosby Bergin, University of Missouri
Rasch Measurement Transactions 30:4 Spring 2017 1615
The Effect of Item and Examinee Characteristics
on Item Score and Response time on USMLE,
Ren Liu, University of Florida, Jonathan D.
Rubright, Irina Grabovsky, National Board of
Medical Examiners
The Trust Game: A Study of Relational Trust in
Elementary Schools of Valparaíso Province,
Chile. Jose Weinstein, Universidad Diego
Portales, Dagmar Raczynski, The Pontifical
Catholic University of Chile
Work in Progress: Toward a Progression Model
of Competence-Based Employability, Dominik
Emanuel Froehlich, University of Vienna,
Mingyang Liu, University of Toledo, Beatrice Van
der Heijden
Persistence of Effects to Fifth Grade
Carolyn J. Layzer, Fatih Unlu, Abt Associates Inc.
Douglas H. Clements, Julie Sarama, University of
Denver, Christopher B. Wolfe, Mary Elaine
Spitler, State University of New York
The Role of Cooperating Teachers in Preparing
Preservice Teachers: A District-Wide Portrait,
Kavita Kapadia Matsko, National Louis
University, Matthew Ronfeldt, Hillary L. Greene,
University of Michigan - Ann Arbor, Michelle
Reininger, Stanford University, Stacey L.
Brockman, University of Michigan - Ann Arbor
Continual Improvement of a Student Evaluation
of Teaching Over Seven Semesters at A State
University, Christopher Rates, Xiufeng Liu, Carol
Vanzile-Tamsen, University at Buffalo - SUNY
Cathleen Morreale
Using R Software for Item Response Theory
(IRT) Model Calibrations, Ki Matlock Cole,
Oklahoma State University, Insu Paek, Florida
State University, Taeyoung Kim, University at
Buffalo - SUNY
Measuring and Understanding Black Women's
Mathematics Identity, Nicole Michelle Joseph,
Vanderbilt University, Elizabeth Anderson,
University of Denver
Developing a Measure of Students' Subjective
Experience of Appreciation, Cristian Gugiu
Lynley H. Anderman, The Ohio State University
NASA Education internship STEM outcomes
measurement: Developing valid and reliable
surveys from the inside out, Lisa Elizabeth Wills,
Valador, Inc. for NASA Office of Education
Carolyn Knowles, Roosevelt Y. Johnson, National
Aeronautics and Space Administration
An Exploration of Medical Knowledge
Degradation on Recertification Examination, Ya
Zhang, University of Pittsburgh, Jeremy Kyle
Jennings, University of Georgia – Athens, Andrew
Dallas, National Commission on Certification of
Physician Assistants
Principals’ Accuracy in Evaluating Teachers’
SEL Effectiveness, Christi Crosby Bergin,
University of Missouri, Sara Bernice Chapman,
University of Delaware, Eli Andrew Jones,
Chia-Lin Tsai, Sara L. Prewett, University of
Missouri – Columbia
Analyzing Item Measure Hierarchies to Develop
a Model of Students' Proportional Reasoning,
Michele Carney, Boise State University, Everett
V. Smith, EVS Psychometric Services, LLC
Psychometric Examination of a Risk Perception
Scale for Evaluation, Anthony P Setari, District of
Columbia Public Schools, Kelly D. Bradley,
University of Kentucky, Marjorie L. Stanek,
Kentucky Justice and Public Safety Cabinet
Rasch-related Coming Events
Apr. 26-30, 2017, Wed.-Sun. NCME, San
Antonio, TX, www.ncme.org
Apr. 27-May 1, 2017, Thur.-Mon. AERA, San
Antonio, TX. www.aera.net
May 26-June 23, 2017, Fri.-Fri. Online
workshop: Practical Rasch Measurement –
Core Topics (E. Smith, Winsteps),
www.statistics.com
June 30-July 29, Fri.-Fri. Online workshop:
Practical Rasch Measurement – Further
Topics (E. Smith, Winsteps),
July 31-Aug. 3, 2017, Mon.-Thurs. Joint
IMEKO TC1-TC7-TC13 Symposium, Rio de
Janeiro, Brazil, www.imeko-tc7-rio.org.br
Rasch Measurement Transactions 30:4 Spring 2017 1616
Profiles in Rasch Measurement
My name is David Torres Irribarra, and one of my
main interests in life is learning and discussing
about the practice of measurement in the social
sciences. I am currently pursuing this interest as
an assistant professor at the School of Psychology
of the Pontificia Universidad Católica de Chile.
I originally studied psychology, starting with an
interest in cognitive psychology, that later on
evolved into the more applied field of educational
psychology. My interest in psychometrics more
generally was prompted while wrestling with
questions about how to learn about someone's
cognitive processes in order to assess learning and
change.
I had the great opportunity to pursue this interest
by attending the Quantitative Methods and
Evaluation program within the School of
Education of the University of California,
Berkeley. I spent several years there studying with
Mark Wilson, learning from and about the Rasch
tradition and its approach to measurement in the
social sciences, and trying to understand both its
connections to larger statistical frameworks and
its philosophical implications for the practice of
educational and psychological measurement.
All the reading and discussions with my fellow
students and with Mark led me to focus on two
main areas, namely, working on an understanding
of measurement from the perspective of the
Pragmatic tradition in philosophy, and the
development of ordinal models that take
advantage of features of both latent class models
and item response models.
My work on the philosophical foundations of
measurement is motivated by the need to
understand the many ways in which we claim to
conduct social measurement, trying to identify the
common threads in all these different approaches,
and particularly the threads that underpin our trust
in measurement results. I see Pragmatism as one
way to give a coherent and meaningful account of
measurement of relevant attributes in service of
larger social goals.
On the modeling side, I have been working on the
use of ordinal latent class models and their
connections to members of the Rasch family of
models. In particular, as part of my dissertation
work I proposed an ordinal version of Fischer's
linear logistic test model. My interest in this kind
of model is based on the idea of maximizing the
coherence between our theoretical models of
cognition, the statistical model we use to
formalize them, and the interpretations that we
want to make based on them; in this sense, I see
ordinal models as a good fit for many
psychological and educational theories, especially
in cases where the final desired outcome is the
classification of individuals into a set of ordered,
or partially ordered, groups.
On a more practical note, I would like to mention
here that one of my side projects is an R package
for plotting Wright Maps based on the output of
software such as Conquest or R estimation
packages. The package—called WrightMap—is
made in collaboration with Rebecca Freund, and
we are always looking for feedback in order to
improve it.
I want to thank Ken Royal for the opportunity to
tell you a bit about my work. I am always
interested in talking about these conceptual and
statistical measurement topics, and I would be
happy to hear from any member of the Rasch
community interested in discussing them.