Embed Size (px)
Citation preview
1099
*Corresponding Author: [email protected]
Rasch Analysis of the University Student Depression Inventory (USDI) Using the Polytomous Partial Credit Model
Sherwin E. Balbuena1*, Dalisay S. Maligalig2, and Maria Ana T. Quimbo3
1Department of Mathematics and Statistics, Dr. Emilio B. Espinosa Sr. Memorial State College of Agriculture and Technology, Mandaon, Masbate 5411 Philippines
2Institute of Statistics, College of Arts and Sciences University of the Philippines Los Baños, College, Laguna 4031 Philippines
3Institute for Governance and Rural Development, College of Public Affairs and Development, University of the Philippines Los Baños, College, Laguna 4031 Philippines
The University Student Depression Inventory (USDI; Khawaja and Bryden 2006) is a 30-item scale that is used to measure depressive symptoms among university students. Its psychometric properties have been widely investigated under the classical test theory (CTT). This study explored the application of the polytomous Rasch partial credit model (PCM) in evaluating the USDI using response data from a sample of Filipino university students (n = 441). Using sequential tests under the Rasch measurement framework, model fitting was performed through item- and person-fit analyses to detect and address possible sources of measurement noise, followed by tests of local independence and differential item functioning (DIF). Results revealed that the original scale contained five misfitting items (6, 7, 10, 12, 20); hence, the deletion of such items was proposed to provide a new but psychometrically sound measure of student depression. Further analysis of the data detected person misfits whose responses were removed in subsequent analyses of local independence and DIF. One pair of locally dependent items (25, 26) and three gender-biased items (1, 3, 8) were detected, which necessitates further item review for possible idiosyncratic meanings. This study showed that Rasch analysis of self-reported questionnaires like the USDI can complement factor analytic approaches, especially in the detection of multiple sources of measurement errors that may undermine the quality of survey data.
Keywords: item response, measurement error, misfit evaluation, student depression, validation
INTRODUCTION Depression in the university context, referred to here as student depression, is measured through the administration of an instrument known as the USDI (Khawaja and Bryden 2006). The instrument was originally developed and validated using a sample of Australian college students. Using an initial number of generated 125 items, the researchers extracted three factors after performing principal component factor analysis (FA) with oblique and orthogonal rotation methods. The final instrument was composed of 30 items classified into three sub-scales: 1) lethargy (nine items), 2) cognitive-emotional (14 items), and 3) academic motivation (seven items). Subscale 1 contains items on fatigue, attention problems, and task performance; subscale 2 on suicidal ideation, feeling of
Philippine Journal of Science150 (5): 1099-1114, October 2021ISSN 0031 - 7683Date Received: 15 Feb 2021

1100
worthlessness, emotional anguish, and loneliness; and subscale 3 on motivation to study and attend classes. The instrument’s internal consistency and test-retest reliability were found to be very high. Convergent validity and divergent validity were very satisfactory as the USDI scores were highly correlated with the Depression, Anxiety, and Stress Scale (DASS; Lovibond and Lovibond 1995) scores, and the measures could discriminate well between high and low levels of life satisfaction measured by the Subjective State Subscale of the Life Satisfaction Scale (Kopina 1996).
The validity and reliability of the USDI have already been investigated by several researchers. Psychometric validation studies using multi-cultural student populations confirmed the factor structure of the USDI (Sharif et al. 2011; Romaniuk and Khawaja 2013; Khawaja et al. 2013; Habibi et al. 2014). To obtain a measure of student depression using the USDI, the ordinal scores for all the items are summated, and a higher total indicates a higher risk of depressive disorder. The questionnaire has been used for estimating the prevalence of depressive symptoms among college students abroad (Mikolajczyk et al. 2008; Gesinde and Sanu 2014; Deb et al. 2016) and in the Philippines (Lee et al. 2013; Baring and Lee 2020).
Student depression is a latent characteristic whose measurement precision is largely dependent on the quality of responses made by students and on the validity of items used in the instrument. Response bias or the tendency of students to respond inaccurately or falsely to USDI items is a threat to the power and validity of depression severity estimates (Osborne and Blanchard 2011). An invalid item, or an item that does not contribute useful information about the construct of depression, is a threat to the content validity of the entire instrument.
Most depression scales, like the USDI, have been developed using the CTT approach to the assessment of validity and reliability, which is primarily implemented using FA. However, one limitation of FA is its inability to check for multiple sources of measurement error. Traditionally, FA relies on the assumption that an instrument is valid and reliable if it contains items that load highly on known factors associated with the latent trait being measured and if the responses to these items are internally consistent. Furthermore, it does not provide for the item- and person-level analyses to identify items that did not function as intended and to detect response sets, which makes instruments developed under the FA framework more error-prone due to inadvertent inclusion of undesirable items and person responses. While there is an alternative measurement framework offered by the Rasch model, it remains underutilized due to computational complexity (Wood 1987; Rost 1999).
The Rasch model is a mathematical model for constructing measures based on a probabilistic function of the relationship between an item’s difficulty and a person’s ability (Rasch 1960). The most basic formulation is the dichotomous Rasch model, which is also referred to as the one-parameter logistic model. Let {0,1}niX x be a dichotomous random variable – where x = 0 and x = 1 indicate “no” and “yes” responses, respectively – to a questionnaire item. The following function models the probability that person n will agree with the item i:
( 1)1
n i
n inieP X
e
(1)
where i is the difficulty of item i and n is the ability of person n. This function conjectures that the higher a person’s ability relative to the difficulty of an item: the higher the probability of an affirmative response on that item, a relation that can be illustrated by a sigmoid graph with the person ability as the abscissa and the probability of agreeing as the ordinate. It can be done by simple algebraic manipulation of Equation 1:
( 1)ln1 ( 1)
nin i
ni
P XP X
(2)
where (1– P) is the probability of disagreeing. The model is based on a simple logic that all persons have a higher probability of correctly answering easier items and a lower probability of correctly answering more difficult items (Bond and Fox 2015). It is governed by the principle of invariant measurement, which is derived through specific objectivity, i.e. item difficulty can be estimated independently of persons included in the sample and person ability can be estimated independently of items included in the test (Wright and Linacre 1987). Furthermore, it provides
Philippine Journal of Science Vol. 150 No. 5, October 2021
Balbuena et al.: Application of the Rasch Model

1101
estimates of person measure (or person ability) and item location (or item difficulty) that can be calibrated on the same continuous scale (Wright 1977). More importantly, it provides for statistical tests of model fit (Smith 2000) even at the item and person levels (Curtis and Boman 2007) to detect possible sources of measurement noise. These properties comprise the strength of the Rasch model that are absent in the theoretical bedrocks of FA; hence, the former can be utilized complementarily with the latter.
To date, the application of the Rasch model in analyzing the USDI has not been investigated. While several studies confirmed the factor structure of the USDI under the CTT framework, there is a need to assess the USDI using a different measurement perspective to verify its purported psychometric properties, detect problematic responses and items to reduce measurement errors, and ultimately construct interval-level measures of student depression.
In the present research, we analyzed the quality of USDI items in their original English form and the five-point Likert rating scale format using the Rasch model framework. The analysis involved assessments of item fit, local dependence (LD), DIF, as well as the instrument’s reliability, targeting, person fit, and person measure distribution. A sequential procedure based on Rasch model assumptions was developed to detect and remove dysfunctional items and problematic response patterns. The procedure was empirically applied to the USDI response data from a sample of college students to assess the appropriateness of the instrument when used in the Philippine university context.
MATERIALS AND METHODS
Sampling and Data Collection The data that was used for this study was collected by a Survey Operations undergraduate class in the University of the Philippines Los Baños (UPLB), Laguna, Philippines. As the major requirement of completing the course, under the guidance of the course lecturer and laboratory instructors, the students acting as survey team designed and implemented a probability sample survey.
In the first semester of the academic year 2018–2019 (covering the period August–December 2018), the team conducted a survey on the mental health status of undergraduate students. At the time of the survey design, access to the list of all undergraduate students enrolled during the term could not be granted because of data privacy issues. In the absence of a good sampling frame that lists all population units, the survey team had to design a probability sample given the limited available information. Hence, indirect sampling was used (Kalton and Anderson 1986; Deville and Lavallée 2006; Lavallée 2014), in which related lists were used to eventually sample students. In this case, since the list of courses offered in the eight colleges was publicly available, the design used was to stratify by colleges and to sample the courses (classes). The survey team then visited the sampled classes and, with the permission of the lecturers, requested the students in each sampled class to provide their names and email addresses. All sampled classes agreed to provide the necessary information to enable the selection of students.
Because students could be in several classes and their chance of being selected could vary according to the number of classes that they were enrolled in, a generalized weight share method was used to assign the appropriate weights to sampled students. The number of students sampled in a class was determined based on a rough estimate of the cost ratio of surveying a class to surveying a student and the assumption that students in a class share similar demographic characteristics. Given the sample size, the optimum number of students and classes were calculated. The optimum number of students in each class was computed using the formula:
(3)
where is the total time (in h) it would take to go to the sampled class while t is the total time (in h) it would take to inform and obtain the student details. Lastly, is the intraclass correlation computed by dividing the variation within the sum of squares by the total sum of squares. The optimum number of classes to be sampled was determined using the formula (Kish 1976):
Philippine Journal of Science Vol. 150 No. 5, October 2021
Balbuena et al.: Application of the Rasch Model

1102
(4)
where a is the number of lecture classes to be sampled.
Colleges in the university were treated as strata, from which lecture classes were selected randomly.
The survey team sent email invitations to sampled students to accomplish a Google Form containing the USDI with a 100% response rate. The sampled students accomplished the form on their own. The email invitations that were sent to students stated the importance of the study and assured that individual answers would remain confidential, that only summary statistics would be published, and that participation was voluntary. The UPLB Institute of Statistics management approved the conduct of the survey. The data that was given to the researchers was anonymized.
Respondents A total of 441 college students (160 males, 281 females), ranging in age from 16–29 yr (mean = 19.76, SD = 1.5), served as respondents of this study. Most students were freshmen (n = 200, 45%), 133 were seniors (30%), 79 were juniors (18%), 23 were sophomores (5%), and six students (1%) did not indicate their academic year level.
Data Analysis Data were fitted to the Rasch model using the eRm package in R (Mair and Hatzinger 2007). eRm performs an unweighted conditional maximum likelihood estimation (MLE) method to estimate item severities by conditioning on the person score and joint MLE to estimate person measures. It also calculates item and person fit statistics, scale reliability, item residuals, and constructs person-item maps (PIMs) and item category characteristic curves.
Model selection. Since the response format used for the USDI items has five categories, this study used the polytomous Rasch model, also known as the PCM (Masters 1982). The use of PCM meets the requirement of the model for estimation stability (Linacre 1994, 2000) since all the items in the data had at least 10 ratings per category. In the context of this study, the PCM models the probability for a student j to give a response category x to the item associated with depressive symptoms i, given her/his depression level ˆ
j , and the joint item location and
threshold estimates ik as:
0
1 0
ˆ ˆexp { }ˆ ˆ( | , ) , 0,1,...,
ˆ ˆexp { }j
x
j ikk
ji j ik im h
j ikh k
P X x x m
(5)
where 0
0
ˆ ˆ{ } 0j ikk
; 0 1
ˆ ˆ ˆ ˆ{ } { }h h
j ik j ikk k
.
Fit analysis. In Rasch model analysis, item fit statistics are used to determine whether the questionnaire items measure a unidimensional latent characteristic. There are two item fit statistics that are based on the observed deviations of responses from the Rasch model expectations: infit and outfit statistics (Wright and Masters 1982; Linacre and Wright 1994). The fit statistics are formulated below.
Let Xni be a response of person n to item i. The infit statistic for item i is given by:
Philippine Journal of Science Vol. 150 No. 5, October 2021
Balbuena et al.: Application of the Rasch Model

1103
2var( )
var( )
N
ni nin
i N
nin
X zv
X
(6)
where:
( )var( )
ni nini
ni
X E XzX
(7)
is the standardized residual. Note that 2 2var( ) ( ( ))ni ni ni niz X X E X . Hence, by letting
( )ni ni niy X E X and var( )ni niW X , Equation 7 can be simplified as:
2 2N N
ni ni nin n
i N N
ni nin n
W z yv
W W
(8)
where the variance is:
2
0 0
i im m
ni nik nik nikk k
W x k
(9)
Such is the case in the case of polytomous PCM, , where mi is the number of response categories in item i.
The expected value of the infit statistic is 1 and the variance is:
2
22
( )N
ni nin
i N
nin
C Wq
W
(10)
The infit is an “information-weighted” fit statistic for each item so that it is sensitive to responses by individuals (respondents) with severity scores in the range near the severity level of the particular item.
On the other hand, the outfit is an “unweighted” fit statistic that is very sensitive to only a few outliers or unusual responses. Considering its structure, in practice, a few highly unexpected responses can cause very high outfit statistics. The outfit statistic for item i is given by:
2
1
1 N
i nin
u zN
(11)
where zni is the standardized residual and N is the total number of persons. The expected value of outfit statistic is 1 and the corresponding variance is:
Philippine Journal of Science Vol. 150 No. 5, October 2021
Balbuena et al.: Application of the Rasch Model

1104
2 2
1 1( )N
nii
n ni
CV uN W N
(12)
where Cni is the kurtosis of xni.
Note that both the infit and outfit statistics have an expected value of 1.0. Values above 1.0 indicate items that are less strongly or consistently related to the underlying condition (latent characteristic) measured by the instrument. Nord (2014) refers to these statistics as item “misfit” statistics, as higher values indicate poorer fit. Some rules-of-thumb have been proposed in identifying items with a good fit to the Rasch model (Wright and Linacre 1994; Bond and Fox 2015). If properly interpreted, outfit statistics may help detect items that show cognitive problems or have idiosyncratic meanings for small subpopulations.
Person fit analysis. Fit indices (i.e. outfit and infit) for each of the 441 respondents were computed. To detect persons with highly unpredictable responses, the criteria used were that both person outfit and infit (joint misfit) values fall beyond the recommended range of mean square values. Bond and Fox (2015) and Wright and Linacre (1994) suggested some reasonable mean square value ranges for infit and outfit. For rating scales or Likert-type survey questionnaires, a range of 0.6–1.4 was recommended, and an even wider range of 0.5–1.5 for small sample sizes and few items (Linacre 2017). But this study made the range even narrower and closer to the expected value of 1.0, approaching the range of 0.7–1.3 recommended for multiple-choice items to minimize measurement errors. The narrower range is also the most commonly used in studies involving Rasch analysis (Müller 2020), and the stability of mean square values within this range was well-documented (Smith et al. 2008).
Reliability analysis. To determine the result of person removal on the quality of data, the instrument reliability was assessed using the Person Separation Index (PSI), an analog of Cronbach’s alpha. The two PSI’s were compared for the same instrument when the full sample was used and when the reduced sample (i.e. full sample minus misfits) was used. Observed negligible differences between the two indices could indicate that the instrument’s internal consistency was preserved.
Item fit analysis. After removing persons with highly unpredictable responses, the item parameters were re-estimated and the model fit of the instrument items re-evaluated. The same recommended range of mean square values (i.e. 0.7–1.3) for outfit and infit was used. Items with both infit and outfit (joint misfit) values below the lower limit or above the upper limit of the range were removed as these were believed to be measuring a different dimension, thus violating the unidimensionality assumption of the Rasch model (Wright and Panchapakesan 1969).
The fit of the items after removal of misfitting items was re-evaluated using the same procedure as before. Dropping off items based on their consistently high values for both outfit and infit was done until no further items showed joint misfits. Items with a good fit to the model are assumed to collectively measure a unidimensional latent characteristic. Furthermore, the reliability was assessed and the PSIs of the original and reduced versions of the instrument were compared to make sure that the new instrument remained internally consistent.
Tests of local independence and item bias. For the retained items, local independence and DIF or item bias were assessed. To detect local independence (otherwise, LD) of pairs of items, item residual correlations (IRCs) were performed. IRC coefficients above 0.3 are indicative of dependency between items (Tennant and Conaghan 2007). To detect DIF, ordinal logistic regression in the lordif package in R (Choi et al. 2011) was used, where gender served as the reference group. Items with very low p-values for the chi-squared statistics (p < 0.05) were flagged for gender bias.
RESULTS AND DISCUSSION Results of person fit analysis showed 69 misfit persons, which comprised 16% of the sample. The responses of misfit persons are believed to distort the measurement system (Linacre 2002) and could inflate error variance (Curtis 2001). Hence, these persons were removed from the subsequent analysis, as the information they provided could contribute to measurement disturbance. Research showed that the removal of persons with suspicious response patterns from the sample improved the fit of data to the Rasch model (Artner 2016). Despite this reduction in sample size, the remaining sample is still sufficient since its number still exceeds the recommended minimum to produce statistically stable measures (Linacre 1994; Azizan et al. 2020).
Philippine Journal of Science Vol. 150 No. 5, October 2021
Balbuena et al.: Application of the Rasch Model

1105
Crosstabulation of the response frequencies of misfits and non-misfits against the five response categories per item showed dissimilar patterns. For a difficult item CE17 (“The activities I used to enjoy no longer interest me”) in Appendix Figure Ia, misfit persons tend to select the lowest category of 1 (labeled as “not at all”), which may indicate social desirability bias (Krumpal 2013), while those fit persons select the second-to-the-lowest category of 2 (labeled as “rarely”). For an easy item LG01 (“I am more tired than I used to be”) in Appendix Figure Ib, fit persons prefer the second-to-the-highest category of 4 (labeled as “most of the time”) unlike those misfit persons selecting the categories 3 (labeled as “sometimes”) and 5 (labeled as “all the time”). Contingency tables were also constructed taking into account the survey design weights. Results of the chi-square and Cramer’s V statistics for all the items showed significant relationships in the response frequencies (p < 0.001). This implies that misfit persons have a statistically different pattern of responses compared to the rest of the sample persons.
After the removal of misfit persons, new parameter estimates were obtained. Comparing these with the previous estimates, slight changes in the item severity and ordering and noticeable changes in outfit/infit for some items were observed. Item AM06 (“I don’t attend lectures as much as I used to”) and CE07 (“I have thought about killing myself”) consistently showed very high mean square values for both infit and outfit (Appendix Figure II); hence, they were labeled as misfits. One possible explanation for this misfit is that university life is characterized by regular attendance to lectures. Also, note that the respondents were interviewed when they were supposed to be attending classes. So, this item would more likely fit those who have consistently missed classes and are at risk of dropping out or, probably, students with a high degree of introversion and serious feelings of isolation. Furthermore, Item CE07 surprisingly showed evidence of misfit after removing misfit persons. While research shows that this item is the most severe manifestation of depression in the general population (Olsen et al. 2003; Forkmann et al. 2013; Balsamo et al. 2014), it did not fit the student population. Suicidal ideation may be the most severe symptom of clinical depression but not of depression in students. Furthermore, students certainly did not report their actual suicidal thoughts and attempts due to the stigma attached to these behaviors within Filipino culture (Crittenden et al. 1992; Redaniel et al. 2011). Furthermore, Item CE10 (“No one cares about me”) had an infit value exceeding the threshold, but this is considered trivial. Hence, only two items (AM06 and CE07) were considered for removal, as these items were believed to contribute substantial error variance to analysis.
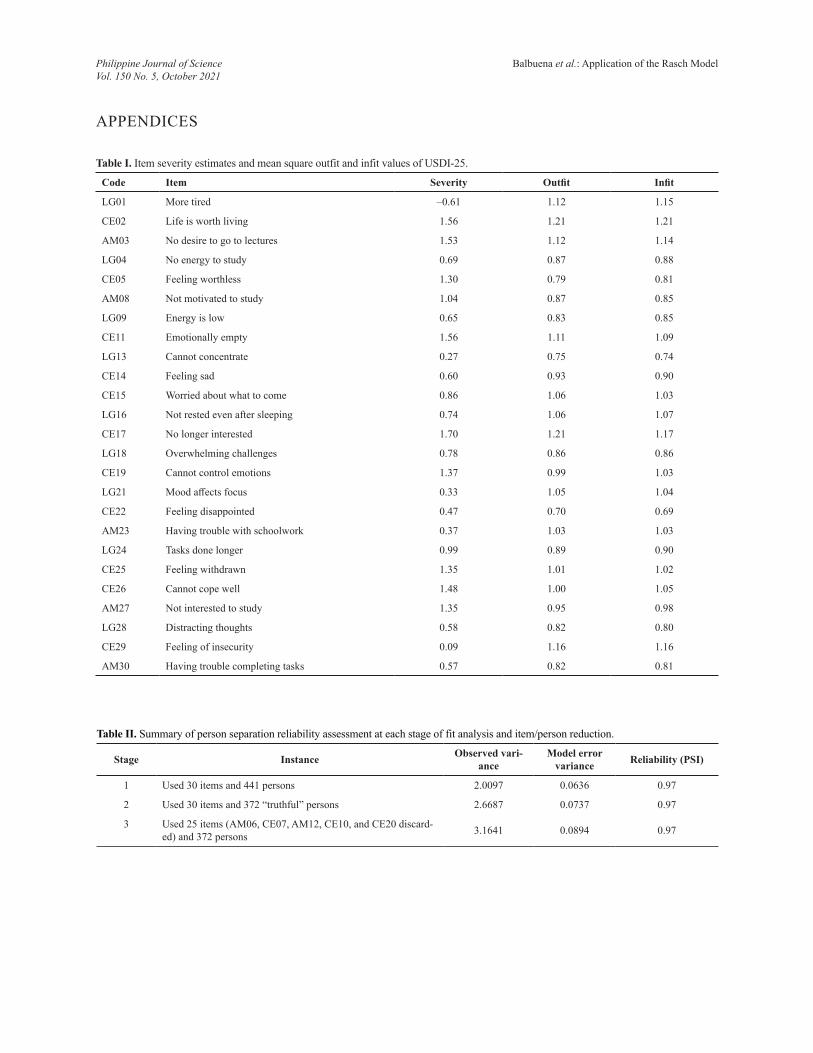
After removal of items AM06 and CE07, three more items were found to show very high outfit/infit values: AM12 (“Going to university is pointless”), CE10 (“No one cares about me”), and CE20 (“I spend more time alone than I used to”). This was to be expected since these items previously showed high mean square fit values secondary to those of the two already discarded. Following item removal, both the outfit and infit values of these items escalated and exceeded the cutoff; hence, these three items were labeled as misfits. Probably, the items were already redundant. If the contents of these items are compared, they are much related to the ones already removed. For example, items AM12 and CE20 are almost similar to item AM06 as they all express a feeling of social isolation. Item CE10 expresses a negative attitude towards peers, an emotion related to suicidal ideation manifested in item CE07. These findings further substantiate the idea that the construct of student depression is different from or less severe than that of clinical depression, as feelings of social isolation and thoughts about death are not part of (or do not fit) its domains. Further removing these three items from the data showed no further items misfitting the Rasch model (Appendix Table I). Consequently, the original USDI was reduced to a 25-item scale, referred to here as USDI-25.
Reliability analysis was done all throughout the instrument assessment process, especially when a set of misfit persons or a set of misfit items was dropped from the analysis. Appendix Table II shows the summary of reliability analysis at each instance of dropping persons or items. It was noted that the PSI remained unchanged at 0.97 after the removal of 69 persons. Subsequent item reductions also did not compromise the reliability. Furthermore, using the PSI, we obtained the Separation G (Fisher 1992) as follows:
G = = "True" SD / Error SD (13)
where G = 5.69, which is based on the computed PSI in Appendix Table II.
Separation is the number of statistically different performance categories that the instrument can identify in the sample of respondents (Wright 1996). A separation of 5.69 implies that only about six levels of performance can be consistently identified by the USDI for the sample of Filipino university students. Hence, we propose the following levels of depression risk: extremely low, very low, somewhat low, somewhat high, very high, and extremely high.
Philippine Journal of Science Vol. 150 No. 5, October 2021
Balbuena et al.: Application of the Rasch Model

1106
After fitting the data to the Rasch model, the item severity estimates can be considered as valid measures of location along the continuum of depression severity. By constructing a PIM for USDI-25, the relative orders of the items based on the values of item estimates expressed in logits can be ascertained. The PIM illustrates the arrangement of the items from less severe to more severe manifestations of student depression based on the item location (solid circle) and threshold (hollow circle) estimates (Appendix Figure III).
PIM can be used to reveal the severity of depressive symptoms represented by the items. When the items were classified into two groups (i.e. less severe and more severe) based on their location above or below the median item measure, it was observed that most of the items in the below-median group were under the Lethargy subscale, whereas most of the items in the above-median group belonged to the Cognitive-Emotional subscale. Items under the Academic Motivation subscale did not show any distinguishable severity classification. Based on extreme locations, the least severe symptom of depression was fatigue or feeling tired (somatic) as manifested in Item LG01 (“I am more tired than I used to be”), while the most severe symptom is anhedonia or loss of interest in things previously enjoyed (cognitive-emotional) as manifested in Item CE17 (“The activities I used to enjoy no longer interest me”). These results are consistent with the findings of other studies on Rasch analysis of other depression scales [e.g. Shea et al. (2009) on DASS; Siegert et al. (2010) on Beck Depression Inventory-II or BDI-II; Pallant and Tennant (2007) on Hospital Anxiety and Depression Scale or HADS]. In these studies, location estimates of items on tiredness or lethargy were found near –1.00 log-odds units (logits), indicating higher endorsability of items or less severe depressive symptoms; locations of items on unhappiness and loss of interest are found near +1.00 logits, suggesting lower item endorsability or more severe depressive symptoms.
The USDI-25 was found to function well with a sample of Filipino university students. It is a well-targeted instrument since the distribution of item measures was found to coincide with that of the person measures (Appendix Figure III). Bradley and Sampson (2006) described a well-targeted instrument as having a range of item estimates spanning at least the width of the person measures. Furthermore, no item was found to exhibit disordered thresholds, which means the scale structure (i.e. five-point Likert) used worked as intended and that the responses of students increased monotonically with increasing depression level.
The result of IRCs showed one pair of LD items. Item CE25 (“I feel withdrawn when I’m around others”) and item CE26 (“I do not cope well”) showed high linear association in their residuals (r = 0.3151). Correlation coefficients above 0.3 are indicative of dependency between items (Tennant and Conaghan 2007). Significant correlations among the items after removing the influence of the underlying trait could also indicate a violation of the unidimensionality assumption (Lee 2004). Another problem with LD is that it may show spuriously very high-reliability indices (Wainer and Kiely 1987). Hence, these items were deemed problematic, either because they were redundant or because they jointly measure another dimension apart from depression. However, for these types of items, the decision is not to discard either of them but to review each item’s contents for possible revision. Item CE26 (“I do not cope well”) represents a broad statement of coping, which may be rewritten to suit the university setting. It may be rephrased as follows: “I do not cope well with academic work”. The other item, CE25 (“I feel withdrawn when I’m around others”), represents a feeling of social withdrawal in a broad social milieu, which may be rewritten as “I feel withdrawn when I’m in the class”. Furthermore, Wainer and Kiely (1987) suggested that LD items be rewritten by merging the two-item statements into one “super-item”. Hence, the two items may be combined as follows: “I find it difficult to participate and cope with the class activities.” This item may no longer belong to the Cognitive-Emotional dimension of the USDI. Further analysis is needed to determine the factor that loads highly on this new item.
For the USDI to provide unbiased measures of student depression, any subgroups of persons with the same depression level must not have differential patterns of responses to a given item. To detect item bias or DIF, ordinal logistic regression was performed, with respondent gender as the reference group. A proportional-odds logistic regression model proposed by Agresti (1990) was applied by estimating a single set of regression coefficients for all cumulative logits with different intercepts, where an intercept-only (null) model and three nested models for each item are formulated in a hierarchy with supplementary predictor variables, e.g. depression level and gender (Choi et al. 2011). Two criteria for detecting DIF were used: a) the chi-squared criterion based on the likelihood ratio χ2 test (Swaminathan and Rogers 1990) and b) the computation of pseudo R2 measures for the three nested models and differences between them. Two results were obtained from the analyses: a) three items [LG01 (“I am more tired than I used to be”), AM03 (“I do not have any desire to go to lectures”), and AM08 (“I don't feel motivated to study”)] were flagged for DIF when the chi-squared criterion was used (differential scores of males and females are shown in
Philippine Journal of Science Vol. 150 No. 5, October 2021
Balbuena et al.: Application of the Rasch Model

1107
Appendix Figure IV) and b) no items flagged for DIF when the R2 criterion was used. These inconsistent results were due to the different methods used, as suggested by Crane et al. (2006).
The graphs in Appendix Figure IV show the expected amount of change in depression estimates when DIF is accounted for. The graph on the left shows a box-and-whisker plot of this change. The interquartile range, representing the middle 50% of the differences (bound between the bottom and top of the shaded box), spanned roughly from –0.004 to +0.005 with a median of approximately 0.00. In both graphs, the y-axis is the difference (initial minus purified) and the x-axis of the right graph is the initial depression level. On the x-y plane on the right, the person estimates were plotted separately for males and females. The interpretation of these graphs is as follows: across the entire continuum of depression, females (black circle) show a positive difference, suggesting that accounting for DIF leads to lower scores than the initial scores; for males (red triangle), the pattern is reversed. However, these three gender-biased items were not discarded, since they may be reviewed for possible idiosyncratic meanings in content, or gender-specific item parameters for these items may be used to provide separate norms of depression measure for male and female students (Tennant and Pallant 2007).
For the USDI-25, each student’s level of depression was determined by adding the ordinal values assigned to his/her ordinal responses to all the items, resulting in an integer measure ranging from 25–125, which is called the raw score. Since the USDI-25 fit the Rasch model, equivalent interval-level measures in log-odds units (logits) for the raw scores were obtained, as shown in Appendix Table III. If the scatterplot of raw scores and logit measures is constructed, an almost linear relationship can be observed for some middle scores (Appendix Figure V). Between raw scores 40–110, the scatterplot resembles a straight line. Within this range, interpolation using a linear function can provide a valid transformation from the discrete score to continuous person measure.
Using the PCM item severity estimates as a basis, the provisional cutoffs for the different depression levels that we propose based on the person separation G were computed, as shown in Appendix Table IV. The most severe item CE17 had a location of 1.70 logits, while the least severe item LG01 had a location of –0.61 logits, which were used as the cutoffs for the extremely high and extremely low depression levels, respectively. The distance between these two locations was divided into four equal intervals to form cutoffs for the other four middle levels of depression. Corresponding raw scores were obtained based on the PCM person parameter estimates. Finally, the ordinal measures constructed in this study and provisional cutoffs obtained may be used to classify college students into six groups of vulnerability to suffer severe depression. Any student screened using the streamlined version of the USDI may be classified based on his/her raw score and may be given appropriate intervention based on his/her level of depression risk. Cutoffs may be recalibrated when sufficient data from screening records become available.
CONCLUSION While the USDI is valid and reliable in the factor-analytic perspective, no attempt at the writing of this paper has been made to validate the instrument using the Rasch measurement framework. Therefore, the present research uses Rasch analysis to investigate the psychometric properties of the original USDI. Results show that it does not provide a sound measure of student depression in the Philippine university setting. The use of the revised USDI-25 is recommended; however, it cannot be used to diagnose or confirm clinical depression, but it can be used as a device for early detection of depression risk among university students to provide school-based mental health professionals sound basis in designing appropriate interventions. Rasch analysis also reveals additional properties of the shorter version such as good targeting, appropriate response format, and internal consistency. Furthermore, Rasch calibration of the USDI offers the alternative use of continuous person measures in lieu of the summated scores to satisfy some conditions set by common parametric statistics. However, some items found to be locally dependent and gender-biased are recommended for revision to ensure measurement precision and fairness.
One limitation of this study is the removal of some respondents due to misfits. For researchers planning to conduct similar studies in the future, we recommend that caution must be taken when discarding person responses based merely on model misfit. Removing persons from survey data poses another threat to the representativeness of the sample. While weeding out of misfit persons improves model fit and reduces measurement error, far more serious problems would arise following an enormous reduction in sample size, such as biased estimation of depression prevalence and invalid inferences. Hence, aside from exclusion of misfits from analysis of survey data, alternative methods to handle person misfits may be explored, such as including misfits in the analysis after imputing their
Philippine Journal of Science Vol. 150 No. 5, October 2021
Balbuena et al.: Application of the Rasch Model

1108
health status, i.e. to replace the aberrant item response of a person with a given location on the latent continuum by considering the responses of good-fit persons with the same location.
It is recommended that data cleaning be used as a routine in the analysis of survey data taken from self-reported questionnaires like the USDI, and Rasch analysis be used complementarily with FA to detect persons that would contribute unnecessary random noise in the subsequent analyses. Although Rasch analysis cannot identify the type of response bias (e.g. acquiescence, social desirability, guessing, and malingering) that may have occurred, it can at least provide information about possible sources of measurement noise that may undermine the detection and estimation of population characteristics, particularly latent traits.
ACKNOWLEDGMENTS This study was made possible through a grant from the Republic of the Philippines Commission on Higher Education K to 12 Transition Program–Scholarships for Graduate Studies. We also would like to thank the UPLB Institute of Statistics for granting the researchers access to the data set.
STATEMENT ON CONFLICT OF INTEREST We declare no conflict of interest.
NOTES ON APPENDICES The complete appendices section of the study is accessible at http://philjournsci.dost.gov.ph
REFERENCES AGRESTI A. 1990. Categorical data analysis. New York: John Wiley and Sons.
ARTNER R. 2016. A simulation study of person-fit in the Rasch model. Psych Test & Assess Mod 58(3): 531–536.
AZIZAN NH, MAHMUD Z, RAMBLI A. 2020. Rasch Rating Scale Item Estimates using Maximum Likelihood Approach: Effects of Sample Size on the Accuracy and Bias of the Estimates. Intl J of Adv Sci & Tech 29(4): 2526–2531.
BALSAMO M, GIAMPAGLIA G, SAGGINO A. 2014. Building a new Rasch-based self-report inventory of depression. Neuropsy Dis and Treat 10: 153.
BARING R, LEE RB. 2020. How Much Do Academic Performance, Lifestyle, and Social Relationships Explain Depressive Symptoms in Filipino University Students? A Regression Model. Asia-Pac Soc Sci Rev 20(2): 14–21.
BOND T, FOX CM. 2015. Applying the Rasch model: fundamental measurement in the human sciences: Routledge.
BRADLEY KD, SAMPSON SO. 2006. Constructing a quality assessment through Rasch techniques: the process of measurement, feedback, reflection and change. In: Applications of Rasch Measurement in Science Education. Liu X, Boone W eds. Maple Grove, MN: JAM Press. p. 23–44.
CHOI SW, GIBBONS LE, CRANE PK. 2011. Lordif: an R package for detecting differential item functioning using iterative hybrid ordinal logistic regression/item response theory and Monte Carlo simulations. J Stat Soft 39(8): 1–30.
CRANE PK, GIBBONS LE, JOLLEY L, VAN BELLE G. 2006. Differential item functioning analysis with ordinal logistic regression techniques: DIFdetect and difwithpar. Med Care. p. S115–S123.
CRITTENDEN KS, FUGITA SS, BAE H, LAMUG CB, UN C. 1992. A cross-cultural study of self-report depressive symptoms among college students. J Cross-Cult Psych 23(2): 163–178.
Philippine Journal of Science Vol. 150 No. 5, October 2021
Balbuena et al.: Application of the Rasch Model

1109
CURTIS D. 2001. Misfits: people and their problems: what might it all mean? Intl Educ J 2(4): 91–99.
CURTIS DD, BOMAN P. 2007. X-Ray Your Data with Rasch. Intl Educ J 8(2): 249–259.
DEB S, BANU PR, THOMAS S, VARDHAN RV, RAO PT, KHAWAJA N. 2016. Depression among Indian university students and its association with perceived university academic environment, living arrangements and personal issues. Asian J Psych 23: 108–117.
DEVILLE JC, LAVALLÉE P. 2006. Indirect Sampling: The Foundations of the Generalized Weight Share Method. Surv Meth 32(2): 165–176.
FISHER WP. 1992. Reliability statistics. Rasch Meas Trans 6: 238
FORKMANN T, GAUGGEL S, SPANGENBERG L, BRÄHLER E, GLAESMER H. 2013. Dimensional assessment of depressive severity in the elderly general population: psychometric evaluation of the PHQ-9 using Rasch analysis. J Aff Dis 148(2–3): 323–330.
GESINDE AM, SANU OJ. 2014. Prevalence and gender difference in self-reported depressive symptomatology among Nigerian university students: implication for depression counselling. The Counsellor 33(2): 129–140.
HABIBI M, KHAWAJA NG, MORADI S, DEHGHANI M, FADAEI Z. 2014. University Student Depression Inventory: measurement model and psychometric properties. Aus J of Psych 66(3): 149–157.
KALTON G, ANDERSON DW. 1986. Sampling rare populations. J Roy Stat Soc: Ser A (Gen) 149(1): 65–82.
KHAWAJA NG, BRYDEN KJ. 2006. The development and psychometric investigation of the University Student Depression Inventory. J Aff Dis 96(1–2): 21–29.
KHAWAJA NG, SANTOS MLR, HABIBI M, SMITH R. 2013. University students' depression: a cross-cultural investigation. High Educ Res & Devt 32(3): 392–406.
KISH L. 1976. Optima and proxima in linear sample designs. J Roy Stat Soc: Ser A (Gen) 139(1): 80–95.
KOPINA OS. 1996. Psychometric review of the life satisfaction scale. Meas Stress Traum & Adapt. p. 194–197.
KRUMPAL I. 2013. Determinants of social desirability bias in sensitive surveys: a literature review. Qual & Quant 47(4): 2025–2047.
LAVALLÉE P. 2014. Indirect sampling for hard-to-reach populations. In: Hard-to-Survey Populations. Tourangeau R, Edwards B, Johnson TP, Wolter KM, Bates N eds. Cambridge: Cambridge University Press. p. 445–467.
LEE RB, MARIA MS, ESTANISLAO S, RODRIGUEZ C. 2013. Factors associated with depressive symptoms among Filipino university students. PLOS ONE 8(11): e79825.
LEE YW. 2004. Examining passage-related local item dependence (LID) and measurement construct using Q3 statistics in an EFL reading comprehension test. Lang Test 21(1): 74–100.
LINACRE JM, WRIGHT BD. 1994. (Dichotomous mean-square) chi-square fit statistics. Rasch Meas Trans 8(2): 360.
LINACRE JM. 1994. Sample size and item calibration stability. Rasch Meas Trans 7: 328.
LINACRE JM. 2000. Comparing and choosing between “partial credit models” (PCM) and “rating scale models” (RSM). Rasch Meas Trans 14(3): 768.
LINACRE JM. 2002. What do infit and outfit, mean-square and standardized mean? Rasch Meas Trans 16(2): 878.
LINACRE, JM. 2017. Teaching Rasch measurement. Rasch Meas Trans 31(2): 1630–1631.
LOVIBOND PF, LOVIBOND SH. 1995. The structure of negative emotional states: Comparison of the Depression Anxiety Stress Scales (DASS) with the Beck Depression and Anxiety Inventories. Beh Res Ther 33(3): 335–343.
MAIR P, HATZINGER R. 2007. Extended Rasch Modeling: The eRm package for the application of IRT models in R. J Stat Soft 20(9): 1–20.
MASTERS GN. 1982. A Rasch model for partial credit scoring. Psychometrika 47(2): 149–174.
MIKOLAJCZYK RT, MAXWELL AE, EL ANSARI W, NAYDENOVA V, STOCK C, ILIEVA S, ..., NAGYOVA I. 2008. Prevalence of depressive symptoms in university students from Germany, Denmark, Poland and Bulgaria. Soc Psycho Psychi Epid 43(2): 105–112.
Philippine Journal of Science Vol. 150 No. 5, October 2021
Balbuena et al.: Application of the Rasch Model

1110
MÜLLER M. 2020. Item fit statistics for Rasch analysis: can we trust them? J Stat Dist App 7(1): 1–12.
NORD M. 2014. Introduction to item response theory applied to food security measurement: Basic concepts, parameters, and statistics. Technical Paper. Rome: FAO. Retrieved on 07 Dec 2020 from http://www.fao.org/economic/ess/ess-fs/voices/en
OLSEN LR, JENSEN DV, NOERHOLM V, MARTINY K, BECH P. 2003. The internal and external validity of the Major Depression Inventory in measuring severity of depressive states. Psych Med 33(2): 351–356.
OSBORNE JW, BLANCHARD MR. 2011. Random responding from participants is a threat to the validity of social science research results. Front Psych 1: 220.
PALLANT JF, TENNANT A. 2007. An introduction to the Rasch measurement model: an example using the Hospital Anxiety and Depression Scale (HADS). Brit J Clin Psych 46(1): 1–18.
RASCH G. 1960. Probabilistic models for some intelligence and attainment tests, Chapters V–VII and X. Copenhagen: Danish Institute for Educational Research.
REDANIEL MT, LEBANAN-DALIDA MA, GUNNELL D. 2011. Suicide in the Philippines: time trend analysis (1974–2005) and literature review. BMC Pub Heal 11(1): 536.
ROMANIUK M, KHAWAJA NG. 2013. University Student Depression Inventory (USDI): Confirmatory factor analysis and review of psychometric properties. J Aff Dis 150(3): 766–775.
ROST J. 1999. Was ist aus dem Rasch-Modell geworden. Psych Runds 50(3): 140–156.
SHARIF AR, GHAZI-TABATABAEI M, HEJAZI E, ASKARABAD MH, DEHSHIRI GR. 2011. Confirmatory factor analysis of the University Student Depression Inventory (USDI). Procedia-Soc Beh Sci 30: 4–9.
SHEA TL, TENNANT A, PALLANT JF. 2009. Rasch model analysis of the Depression, Anxiety and Stress Scales (DASS). BMC Psych 9(1): 1–10.
SIEGERT RJ, TENNANT A, TURNER-STOKES L. 2010. Rasch analysis of the Beck Depression Inventory-II in a neurological rehabilitation sample. Disab Rehab 32(1): 8–17.
SMITH AB, RUSH R, FALLOWFIELD LJ, VELIKOVA G, SHARPE M. 2008. Rasch fit statistics and sample size considerations for polytomous data. BMC Med Res Meth 8(1): 1–11.
SMITH RM. 2000. Fit analysis in latent trait measurement models. J App Meas 1(2): 199–218.
SWAMINATHAN H, ROGERS HJ. 1990. Detecting differential item functioning using logistic regression procedures. J Educ Meas 27(4): 361–370.
TENNANT A, CONAGHAN PG. 2007. The Rasch measurement model in rheumatology: What is it and why use it, when should it be applied, and what should one look for in a Rasch paper? Arth Care Res 57(8): 1358–1362.
TENNANT A, PALLANT JF. 2007. DIF matters: a practical approach to test if Differential Item Functioning makes a difference. Rasch Meas Trans 20(4): 1082–1084.
WAINER H, KIELY GL. 1987. Item clusters and computerized adaptive testing: a case for testlets. J Educ Meas 24(3): 185–201.
WOOD TM. 1987. Putting item response theory into perspective. Res Quart Exer Sport 58(3): 216–220.
WRIGHT BD, LINACRE JM. 1987. Dichotomous Rasch model derived from specific objectivity. Rasch Meas Trans 1(1): 5-6.
WRIGHT BD, LINACRE JM. 1994. Reasonable mean-square fit values. Rasch Meas Trans 8(3): 370.
WRIGHT BD, MASTERS GN. 1982. Rating scale analysis. MESA Press.
WRIGHT BD, PANCHAPAKESAN N. 1969. A procedure for sample-free item analysis. Educ Psych Meas 29(1): 23–48.
WRIGHT BD. 1977. Solving measurement problems with the Rasch model. J Educ Meas 14(2): 97–116.
WRIGHT BD. 1996. Reliability and separation. Rasch Meas Trans 9(4): 472.
Philippine Journal of Science Vol. 150 No. 5, October 2021
Balbuena et al.: Application of the Rasch Model
1111
Table II. Summary of person separation reliability assessment at each stage of fit analysis and item/person reduction.
Stage Instance Observed vari-ance
Model error variance Reliability (PSI)
1 Used 30 items and 441 persons 2.0097 0.0636 0.97
2 Used 30 items and 372 “truthful” persons 2.6687 0.0737 0.97
3 Used 25 items (AM06, CE07, AM12, CE10, and CE20 discard-ed) and 372 persons 3.1641 0.0894 0.97
APPENDICES
Table I. Item severity estimates and mean square outfit and infit values of USDI-25.
Code Item Severity Outfit Infit
LG01 More tired –0.61 1.12 1.15
CE02 Life is worth living 1.56 1.21 1.21
AM03 No desire to go to lectures 1.53 1.12 1.14
LG04 No energy to study 0.69 0.87 0.88
CE05 Feeling worthless 1.30 0.79 0.81
AM08 Not motivated to study 1.04 0.87 0.85
LG09 Energy is low 0.65 0.83 0.85
CE11 Emotionally empty 1.56 1.11 1.09
LG13 Cannot concentrate 0.27 0.75 0.74
CE14 Feeling sad 0.60 0.93 0.90
CE15 Worried about what to come 0.86 1.06 1.03
LG16 Not rested even after sleeping 0.74 1.06 1.07
CE17 No longer interested 1.70 1.21 1.17
LG18 Overwhelming challenges 0.78 0.86 0.86
CE19 Cannot control emotions 1.37 0.99 1.03
LG21 Mood affects focus 0.33 1.05 1.04
CE22 Feeling disappointed 0.47 0.70 0.69
AM23 Having trouble with schoolwork 0.37 1.03 1.03
LG24 Tasks done longer 0.99 0.89 0.90
CE25 Feeling withdrawn 1.35 1.01 1.02
CE26 Cannot cope well 1.48 1.00 1.05
AM27 Not interested to study 1.35 0.95 0.98
LG28 Distracting thoughts 0.58 0.82 0.80
CE29 Feeling of insecurity 0.09 1.16 1.16
AM30 Having trouble completing tasks 0.57 0.82 0.81
Philippine Journal of Science Vol. 150 No. 5, October 2021
Balbuena et al.: Application of the Rasch Model

1112
Table III. Some raw scores for the USDI-25 data and their Rasch-derived person measures and standard errors estimated using PCM.
Raw score Person measure SE Raw score Person
measure SE Raw score Person measure SE
26 -5.45 1.03 61 0.01 0.28 90 2.04 0.26
28 -4.23 0.63 62 0.09 0.28 91 2.10 0.26
30 -3.60 0.51 63 0.16 0.28 92 2.17 0.26
33 -2.96 0.42 64 0.24 0.27 93 2.24 0.26
34 -2.79 0.41 65 0.31 0.27 94 2.30 0.26
36 -2.48 0.38 66 0.39 0.27 95 2.37 0.26
37 -2.34 0.37 67 0.46 0.27 96 2.44 0.26
38 -2.20 0.36 68 0.54 0.27 97 2.51 0.26
39 -2.07 0.35 69 0.61 0.27 98 2.58 0.26
40 -1.95 0.35 70 0.68 0.27 99 2.65 0.27
41 -1.83 0.34 71 0.75 0.27 100 2.72 0.27
42 -1.72 0.33 72 0.82 0.27 101 2.79 0.27
43 -1.61 0.33 73 0.89 0.26 103 2.94 0.27
44 -1.50 0.32 74 0.96 0.26 104 3.02 0.28
45 -1.40 0.32 75 1.03 0.26 105 3.09 0.28
46 -1.30 0.32 76 1.10 0.26 106 3.17 0.29
47 -1.20 0.31 77 1.17 0.26 107 3.26 0.29
48 -1.10 0.31 78 1.24 0.26 108 3.34 0.29
49 -1.01 0.31 79 1.30 0.26 109 3.43 0.30
50 -0.91 0.30 80 1.37 0.26 110 3.52 0.31
51 -0.82 0.30 81 1.44 0.26 111 3.62 0.31
52 -0.73 0.30 82 1.51 0.26 112 3.72 0.32
53 -0.65 0.29 83 1.57 0.26 113 3.82 0.33
54 -0.56 0.29 84 1.64 0.26 115 4.05 0.35
55 -0.47 0.29 85 1.70 0.26 117 4.33 0.39
56 -0.39 0.29 86 1.77 0.26 118 4.48 0.41
57 -0.31 0.29 87 1.84 0.26 119 4.66 0.44
58 -0.23 0.28 88 1.90 0.26 122 5.42 0.60
59 -0.15 0.28 89 1.97 0.26 123 5.85 0.72
Table IV. Rasch-based and raw score cutoffs for the six levels of student depression.
Rasch measure (in logits) Raw scoreDepression level
Lower limit Upper limit Lower limit Upper limit
−∞ −0.61 25 53 Extremely low
−0.61 −0.03 54 61 Very low
−0.03 0.55 62 68 Somewhat low
0.55 1.13 69 76 Somewhat high
1.13 1.71 77 84 Very high
1.71 ∞ 85 125 Extremely high
Philippine Journal of Science Vol. 150 No. 5, October 2021
Balbuena et al.: Application of the Rasch Model

1113
Figure I. Crosstabulation bar charts for the frequency of responses of fit versus misfit persons at different response categories for: a) a difficult item CE17 (Cramer’s V = 0.338, p < 0.001) and b) an easy item LG01 (Cramer’s V = 0.257, p < 0.001).
Figure II. Infit and outfit mean square values of USDI items after removal of 69 misfitting persons.
Figure III. The PIM for USDI-25 showing the distribution of estimated person measures and the locations of the items (solid circle) along the latent dimension (depression severity) with corresponding response category threshold estimates (hollow circles).
Philippine Journal of Science Vol. 150 No. 5, October 2021
Balbuena et al.: Application of the Rasch Model

1114
Figure IV. Difference between initial and purified USDI scores for each respondent.
Figure V. Integer score to Rasch person measure transformation showing the almost linear relationship between raw scores 40 and 110.
Philippine Journal of Science Vol. 150 No. 5, October 2021
Balbuena et al.: Application of the Rasch Model