Embed Size (px)
Citation preview

RESEARCH Open Access
Rasch analysis of the Meaning in LifeQuestionnaire among adults from SouthAfrica, Australia, and New ZealandLusilda Schutte1* , Marié P. Wissing1, Suria M. Ellis2, Paul E. Jose3 and Dianne A. Vella-Brodrick4
Abstract
Background: Meaning in life is a key indicator of subjective well-being and quality of life. Further developments inunderstanding and enhancing the construct will depend inter alia on the sound measurement thereof. This study isat the forefront of applying modern psychometric techniques to the Meaning in Life Questionnaire, a scale widelyused to assess meaning in life.
Method: The Rasch rating scale model was applied to the Presence and Search subscales of the Meaning in LifeQuestionnaire using a sample of 601 adults from South Africa, Australia, and New Zealand.
Results: The Presence subscale was insensitive at high levels of presence of meaning while the majority of therespondents fell in that range. Removal of item 9 (“My life has no clear purpose”) and collapsing the response categoriesindicative of low and medium levels of the latent construct significantly improved the subscale’s targeting and fit to theRasch model, resulting in a subscale that exhibited differential item functioning on items 1 (“I understand mylife’s meaning”), 4 (“My life has a clear sense of purpose”), and 5 (“I have a good sense of what makes my lifemeaningful”) for country, but none for gender, age group, or education level. The Search subscale yieldeddisordered category threshold calibrations, but after collapsing some of the response categories representinglow and medium levels of the target construct, a subscale that demonstrated good fit to the Rasch model,good targeting, and no differential item functioning resulted.
Conclusions: In terms of this particular scale, adaptation of the rating scale and removal of item 9 is recommended.Country-level parameter estimates may be needed for items that exhibited differential item functioning. The study alsohas significant implications for the theory, measurement, and practice of meaning in and quality of life in general.Reasons for and the far-reaching implications of the insensitivity of the Presence subscale for high levels of presence ofmeaning on, for example, the correlation between meaning in life and indicators of health are contemplated. Furtherinvestigation of the construct’s nature and measurement, especially at high levels, is indicated.
Keywords: Rasch modelling, Meaning in Life Questionnaire, Eudaimonic well-being, Psychometric properties, Modernpsychometrics, Item response theory, Positive psychology, Quality of life
* Correspondence: [email protected] Unit for Trans-disciplinary Health Research, North-West University,Potchefstroom, South AfricaFull list of author information is available at the end of the article
© 2016 Schutte et al. Open Access This article is distributed under the terms of the Creative Commons Attribution 4.0International License (http://creativecommons.org/licenses/by/4.0/), which permits unrestricted use, distribution, andreproduction in any medium, provided you give appropriate credit to the original author(s) and the source, provide a link tothe Creative Commons license, and indicate if changes were made. The Creative Commons Public Domain Dedication waiver(http://creativecommons.org/publicdomain/zero/1.0/) applies to the data made available in this article, unless otherwise stated.
Schutte et al. Health and Quality of Life Outcomes (2016) 14:12 DOI 10.1186/s12955-016-0414-x

BackgroundQuality of life involves an evaluative judgement of an in-dividual’s physical, cognitive, emotional, and social func-tioning and can be based on subjective (self-report) and/or objective (independent sources of information) indi-cators [1, 2]. Although quality of life research tradition-ally focused on situations and factors that undermine orendanger quality of life, recent research has increasinglystressed the importance of incorporating positive con-structs, such as subjective well-being, positive emotions,and character virtues and strengths in the conceptualisa-tion and study of quality of life [2, 3]. One of the keyconstructs that is widely considered an integral part of alife well-lived and quality of life is meaning in life [4–7].A myriad of studies have explored the relationship be-tween meaning in life and mental well-being, as well aspsychopathology [8]. Also, the association betweenmeaning in life and health-related quality of life has beenestablished in multiple studies [9].In order to study meaning in life and its quality of life
concomitants, the construct has to be conceptualised the-oretically. Different models are used in the literature toconceptualise this complex phenomenon, for examplethose of Wong [10], Schnell [11], and Steger [12]. Steger’smodel differentiates between presence of meaning, whichinvolves “the extent to which people comprehend, makesense of, or see significance in their lives, accompanied bythe degree to which they perceive themselves to have apurpose, mission, or overarching aim in life” [12], andsearch for meaning, which refers to “the strength, inten-sity, and activity of people’s desire and efforts to establishand/or augment their understanding of the meaning, sig-nificance, and purpose of their lives” [13].Theoretically and empirically sound measurement in-
struments that assess meaning in life are crucial for therigorous study of the construct, to understand its associa-tions with psychological well-being and psychopathology,and to assess the impact of interventions targeting mean-ing in life. Various models of meaning have been opera-tionalized in self-report questionnaires (see [14] for asystematic review of these measures). One such scale thatis widely used and recognized for its outstanding psycho-metric properties [14] is the Meaning in Life Question-naire (MLQ) [15], which operationalizes Steger’s [12]model of meaning in life. Steger et al. [15] showed that thescale, which consists of two subscales corresponding tothe theory, namely Presence of Meaning (MLQ-P) andSearch for Meaning (MLQ-S), demonstrated sufficient in-ternal consistency and test-retest reliability, as well asstructural, convergent, and discriminant validity in threeAmerican student samples.Since the initial development study of the MLQ [15],
which utilised only data from American student samples,good psychometric properties of the scale have been
shown in a number of other contexts, cultures, and trans-lations. For example, validity and reliability were shownfor the English version of the scale among a web-basedsurvey of adults [16], an American sample of people diag-nosed with serious mental illnesses in an inpatient setting[17], and in a multi-cultural South African student setting[18]; for the Japanese translation of the scale among aJapanese student sample [19]; for the Spanish translationof the scale among a Spanish student sample [20]; and forthe Turkish version of the scale among a combined collegestudent and adult community sample [21].Even though the MLQ is widely appraised to possess
good psychometric properties [14] and the measure hasbeen found to function well across age groups [13] andcross-culturally [13, 21, 22], the scale has, as far as weare aware of, never been evaluated from an item re-sponse theory (IRT) perspective. IRT provides a modernand reputedly superior alternative to classical test theory,as it discriminates more finely among different sourcesof error, especially regarding features of individual itemsthat may influence their performance [23]. The family ofIRT models share the assumption that the probability ofa respondent endorsing any particular item is consideredto be a function of the respondent’s level on the under-lying latent variable that is measured and the character-istics of the item [24].The Rasch model, specifying only one parameter to
characterize each item (item difficulty), is the simplest IRTmodel and was developed by the Danish mathematician,Georg Rasch [25, 26]. Unlike in other IRT models andclassical test theory techniques where the intent is to finda model that best fits the data, the Rasch model requiresthe data to fit the model in order to yield objective meas-urement [27]. The Rasch model postulates that usefulmeasurement involves a unidimensional construct in-creasing or decreasing monotonically along an intervalscale [28]. Rasch modelling provides a method to trans-form ordinal data (e.g. data from Likert-type items) intocontinuous, equal interval units (logits), which allows forthe summation of the items’ raw scores, where thesummed raw score is a sufficient statistic [29, 30]. Raschanalysis can be used in scale development, for example byreviewing the functioning of the response categories, theunidimensionality of the scale, and the targeting of themeasure [31]. Moreover, Rasch modelling can be used toinvestigate differential item functioning (i.e., when differ-ent demographic groups responded differentially to anitem despite equal levels of the latent construct), thus en-hancing the assessment of item-level cross-cultural invari-ance of measurement scales [32].
The present studyIn the present study, the Meaning in Life Questionnaire[15] was examined against the assumptions of the Rasch
Schutte et al. Health and Quality of Life Outcomes (2016) 14:12 Page 2 of 15

model. This is the first known study where the scale isanalysed using an item response theory (in particular,Rasch modelling) approach. By applying the Raschmodel, we explored the unidimensionality of each sub-scale, the functionality of the response categories, andhow well the sample was targeted by the scale. We alsoexamined differential item functioning (DIF) of the scalefor a range of demographic variables.
MethodParticipantsThe sample (N = 601) consisted of about equal sizedgroups of adults from South Africa, New Zealand, andAustralia, who all completed the original English versionof the MLQ as part of a battery of scales used in theinternational Eudaimonic and Hedonic Happiness Inves-tigation (EHHI) project [33]. Participants were selectedto be fluent in English, have at least secondary educa-tion, and be between 30 and 60 years of age. The aimwas to factorially cross gender, age (three age groups of30-39 years, 40-49 years, and 50-60 years), and educa-tion level (secondary and tertiary education). The socio-demographic profile of the sample is summarised inTable 1.
MeasuresSocio-demographic questionnaireDemographic information of each participant, includingcountry of residence, gender, age group, and educationlevel, was obtained.
Meaning in Life Questionnaire (MLQ) [15]The MLQ comprises two subscales that was developedto be relatively independent: Presence of Meaning(MLQ-P) and Search for Meaning (MLQ-S) [15].
Responses to 10 statements are provided on a ratingscale with response options 1 =Absolutely Untrue, 2 =Mostly Untrue, 3 = Somewhat Untrue, 4 =Can’t Say Trueor False, 5 = Somewhat True, 6 =Mostly True, and 7 =Absolutely True. In the original validation study amongAmerican students, the scale exhibited good internalconsistency and test-retest reliability, as well as struc-tural, convergent, and discriminant validity, with theCronbach’s alpha values of the Presence subscale varyingbetween 0.82 and 0.86 and for the Search subscale be-tween 0.86 and 0.87 [15]. Good internal consistency reli-ability was found in South African student [18], NewZealand adult [34], and web-based Australian samples[35], with alpha-values of .85, .90, and .88, respectively,for the MLQ-P, and .94, .91, and .92, respectively, for theMLQ-S.
Procedure and ethical considerationsA mixed-methods cross-sectional survey design wasused, where participants responded to open-ended ques-tions related to happiness, meaning in life, and goals,and completed a battery of quantitative measurementscales. For the current investigation, only responses tosocio-demographic questions and the MLQ were used.In order to avoid the potential complications of missingvalues and imputation techniques in Rasch analyses, re-spondents who generated missing values on the MLQwere removed from the sample. This involved 15 partici-pants from South Africa, whose removal was justified bythe fact that the original South African sample was lar-ger than the samples from Australia and New Zealand.The sample from New Zealand contained no missing re-sponses, and for the Australian sample six respondentswere removed. Ethical approval was obtained from therespective regulatory ethics committees in each country.Participants were recruited by research leaders withineach country using poster and newspaper advertisementsand the snowball-method. Participants were providedwith information on the study prior to voluntaryparticipation.
Data analysisData were analysed using the Rasch rating scale model[25], which assumes that the distances between thethresholds of polytomous items (i.e., the probabilisticmidpoints between adjacent response categories) areequal across all items. The Winsteps® 3.81 software [36]was used for all analyses, except for the graphical pres-entation of the person-item threshold distributions(Fig. 2), which was obtained from RUMM2030™ [37].The MLQ-P and MLQ-S were evaluated separately,since the scale was designed to yield two relatively inde-pendent subscales [15]. Since no single aspect of Raschanalysis is definitive in identifying the optimal data-
Table 1 Demographic profile of the sample
South Africa New Zealand Australia Total
Gender
Male 101 107 79 287
Female 115 108 91 314
Age
M (SD) 44.11 (8.53) 44.45 (8.85) 44.62 (8.84) 44.38 (8.72)
30-39 77 71 53 201
40-49 71 72 58 201
50-60 68 72 59 199
Education level
Secondary 106 106 68 280
Tertiary 106 109 102 317
Missing 4 0 0 4
Total 216 215 170 601
Schutte et al. Health and Quality of Life Outcomes (2016) 14:12 Page 3 of 15

model relationship, multiple tests and graphical repre-sentations should be used to examine the characteristicsof the items and persons [30]. The following interrelatedfacets of Rasch analysis should be considered simultan-eously to inform decisions.
Person and item separation and reliabilityPerson separation and reliability indices indicate howwell one can discern persons along the measured vari-able [28] and values larger than 2 and 0.8, respectively,imply that the items are sensitive enough to differentiatetwo levels of persons according to their level of intensityon the construct (high and low scorers) [38]. Item separ-ation and reliability indices are indicative of the capacityof the instrument to define a unique hierarchy of itemsalong the measured construct [28] and values larger than3 and 0.9, respectively, suggest that the sample is largeenough to confirm the item challenge order (on threelevels of item challenge) [38].
Unidimensionality and local independenceAccording to the Rasch model, useful measurement isobtained when a unidimensional construct is measuredby locally independent items [30]. In terms of unidimen-sionality, item infit or outfit mean square statisticssmaller than 0.6 can be indicative of overfit, and valueslarger than 1.4 of underfit when the rating scale model isused [28]. The point-biserial correlation of an item indi-cates whether higher scores on the item correspond withhigher levels of the underlying construct and positivevalues are expected [38]. In addition, lack of unidimen-sionality may exist when the eigenvalue of the first con-trast in a Rasch principal components analysis of theresiduals (PCA-R) (i.e., the first component after theRasch component has been removed) is larger than 2.0,and when the variance explained by the Rasch compo-nent is small (e.g., < 40 %) [38]. Correlations betweenthe residuals of item pairs of around 0.7 are indicative ofhigh local dependence, while correlations around 0.4 areconsidered to be low [38].
Response category functioningRasch analysis enables the researcher to investigate howthe respondents used the rating scale so that scale devel-opers can decide on the optimal number and combin-ation of rating scale categories [31, 39]. This task can beaccomplished by examining how the data fit the Raschmodel after response categories were collapsed. Bondand Fox [28] provided guidelines in this regard, includ-ing that the collapse should make intuitive sense andthat the ideal is to create a uniform frequency distribu-tion over the categories with each category containing atleast 10 observations. Also, the average measures of thecategories and the category threshold estimates should
increase monotonically, with the category threshold esti-mates having steep gradients (at least 1.4 logits, but nomore than 5.0 logits) to ensure that each category repre-sents a distinct portion of the latent variable – this canalso be investigated graphically by looking at the cat-egory probability curves. Lastly, the infit and outfit meansquare statistics of each response category should be lessthan 2.0.
TargetingRasch analysis can be used to detect gaps in the con-tinuum of the measured construct by identifying poor tar-geted items or persons, such as items for which there is aninsufficient number of persons with an intensity levelcomparable to the item challenge1, or persons for whichthere is an insufficient number of items with a challengelevel comparable to the person’s intensity [40]. This goalcan be attained by examining the person-item thresholddistributions generated by RUMM2030™, which offers avisual comparison of the distribution of the person inten-sity levels (top part of the graph) and the item challengelevels (bottom part of the graph) along the latent trait con-tinuum, with the information provided by the items alsomapped onto the person distribution.
Differential item functioningRasch analysis can assist in identifying differential itemfunctioning (DIF), which occurs when different groups ofpeople within the sample responded in a different way toan item despite equal levels of the construct that was mea-sured. In this study, uniform DIF [31] was investigated forcountry, gender, age group, and education level. The degreeof DIF was assessed by comparing p-values from the poly-tomous version of the Mantel-Haenszel statistic [41, 42]against a Bonferroni-corrected 5 % significance level, as wellas the DIF Contrast, which is indicative of moderate tolarge DIF when it is larger than or equal to 0.64 [38].
ResultsResults for the presence subscaleMLQ-PAlthough the MLQ-P yielded person and item separationand reliability indices that were in line with the guidelinesand the results from the PCA-R suggested sufficient unidi-mensionality and local independence of the items (seeTable 2), item 9 (“My life has no clear purpose”) showedmisfit based on its infit and outfit mean square statistics(see Table 3). Also, response category 1 (Absolutely untrue)exhibited a low frequency and misfit based on its outfitmean square statistic (see Table 4). Although the averagemeasures and threshold calibrations increased monotonic-ally as the categories increased, the threshold calibrationswere close to each other, indicating that categories 2(Mostly untrue), 3 (Somewhat untrue), and 4 (Can’t say true
Schutte et al. Health and Quality of Life Outcomes (2016) 14:12 Page 4 of 15

or false) were the most likely to be endorsed on only a smallportion of the latent construct (see Table 4 and Fig. 1).From the person-item threshold distribution (Fig. 2) it wasclear that the person intensity was in general higher thanthe item challenge, indicating that the scale exhibited poortargeting for persons with high levels of the latent con-struct. The MLQ-P showed DIF for country on items 1 (“Iunderstand my life’s meaning”), 4 (“My life has a clear senseof purpose”), and 9 (“My life has no clear purpose”), asdepicted in Table 6. There was no significant DIF for gen-der, age group, or education level.
In an attempt to remedy the problems highlighted forMLQ-P, all possible combinations of response category col-lapses were explored, but none of the collapses resolved theproblems with item 9. Therefore the next step was to re-move item 9, resulting in a 4-item scale (hereafter labelledMLQ-P-4).
Results for the MLQ-P-4The person and item separation and reliability indicesimproved significantly after item 9 was dropped fromthe scale (see Table 2). The PCA-R yielded results that
Table 2 Separation, reliability, fit, and dimensionality by subscale and analysis
Analysis Separation Reliability Infit MNSQ Outfit MNSQ Dimensionality and local independence
Person Item Person Item M SD M SD Eigenvalue of 1st contrast % Variance explained Max residual r
MLQ-P 2.00 3.84 .80 .94 1.01 0.57 1.01 0.59 1.7 59.3 .04
MLQ-P-4 2.42 5.81 .85 .97 0.99 0.16 0.96 0.14 1.6 69.7 None
MLQ-P-4 1122345 2.41 5.91 .85 .97 0.99 0.14 0.98 0.14 1.6 69.1 None
MLQ-P-4 1222345 2.43 5.71 .86 .97 0.99 0.14 0.96 0.14 1.4 69.0 None
MLQ-S 2.45 5.90 .86 .97 0.99 0.17 0.97 0.17 1.6 68.7 None
MLQ-S 1223345 2.50 5.59 .86 .97 0.99 0.17 0.99 0.17 1.6 63.5 None
MLQ-S 1233456 2.52 5.74 .86 .97 0.99 0.16 0.98 0.99 1.6 66.5 None
Ideal values >2 >3 >0.8 >0.9 <1.4 Small <1.4 Small <2 >40 % <0.2
Note. MNSQ mean square statistic, Eigenvalue of 1st contrast eigenvalue of the 1st contrast in the Rasch principal components analysis of the residuals, % Varianceexplained % variance explained by the Rasch component in the Rasch principal components analysis of the residuals, Max residual r maximum positive residualcorrelation, MLQ-P original Presence of Meaning subscale of the Meaning in Life Questionnaire, MLQ-P-4 MLQ-P with item 9 removed, MLQ-P-4 1122345 MLQ-P-4with response categories 1 and 2 collapsed and categories 3 and 4 collapsed, MLQ-P-4 1222345 MLQ-P-4 with response categories 2, 3, and 4 collapsed, MLQ-Soriginal Search for Meaning subscale of the Meaning in Life Questionnaire, MLQ-S 1223345 MLQ-S with response categories 2 and 3 collapsed and categories 4and 5 collapsed, MLQ-S 1233456 MLQ-S with response categories 3 and 4 collapsed
Table 3 Meaning In Life Questionnaire: item measures, standard errors, and fit statistics
δ SE Infit Outfit δ SE Infit Outfit δ SE Infit Outfit
MLQ-P MLQ-P-4 MLQ-P-4 1122345
1. I understand my life’s meaning. 0.09 0.04 0.92 0.90 0.10 0.06 1.23 1.17 0.09 0.07 1.21 1.20
4. My life has a clear sense of purpose. 0.17 0.04 0.60 0.62 0.23 0.06 0.79 0.80 0.31 0.07 0.83 0.82
5. I have a good sense of what makes my lifemeaningful.
-0.34 0.05 0.71 0.66 -0.61 0.06 1.04 0.97 -0.75 0.07 0.96 0.94
6. I have discovered a satisfying life purpose. 0.19 0.04 0.69 0.70 0.27 0.06 0.92 0.88 0.36 0.07 0.94 0.94
9. My life has no clear purpose.a -0.12 0.05 2.13 2.18
MLQ-S MLQ-S 1223345 MLQ-S 1233456
2. I am looking for something that makes my lifefeel meaningful.
-0.30 0.04 1.14 1.11 -0.44 0.07 1.09 1.09 -0.36 0.05 1.11 1.10
3. I am always looking to find my life’s purpose. -0.06 0.04 0.96 0.93 -0.12 0.07 0.96 0.96 -0.06 0.05 0.99 0.98
7. I am always searching for something thatmakes my life feel significant.
-0.20 0.04 1.05 1.03 -0.29 0.07 1.02 1.04 -0.24 0.05 1.02 1.04
8. I am seeking a purpose or mission for my life. 0.10 0.04 0.67 0.65 0.18 0.07 0.69 0.69 0.12 0.05 0.69 0.69
10. I am searching for meaning in my life. 0.46 0.04 1.12 1.12 0.67 0.07 1.19 1.17 0.54 0.05 1.13 1.11
Ideal values >0.6<1.4 >0.6<1.4 >0.6<1.4 >0.6<1.4 >0.6<1.4 >0.6<1.4
Note. MLQ Meaning in Life Questionnaire, MLQ-P original Presence of Meaning subscale of the MLQ, MLQ-P-4 MLQ-P with item 9 removed, MLQ-P-4 1122345 MLQ-P-4 with response categories 1 and 2 collapsed and categories 3 and 4 collapsed, MLQ-P-4 1222345 MLQ-P-4 with response categories 2, 3, and 4 collapsed, MLQ-Soriginal Search for Meaning subscale of the MLQ, MLQ-S 1223345 MLQ-S with response categories 2 and 3 collapsed and categories 4 and 5 collapsed, MLQ-S1233456 MLQ-S with response categories 3 and 4 collapsed. δ average item challenge, SE standard error of the item challenge, Infit infit mean square statistic, Oufitoutfit mean square statisticaThe original item 9 was reversed in these analyses
Schutte et al. Health and Quality of Life Outcomes (2016) 14:12 Page 5 of 15
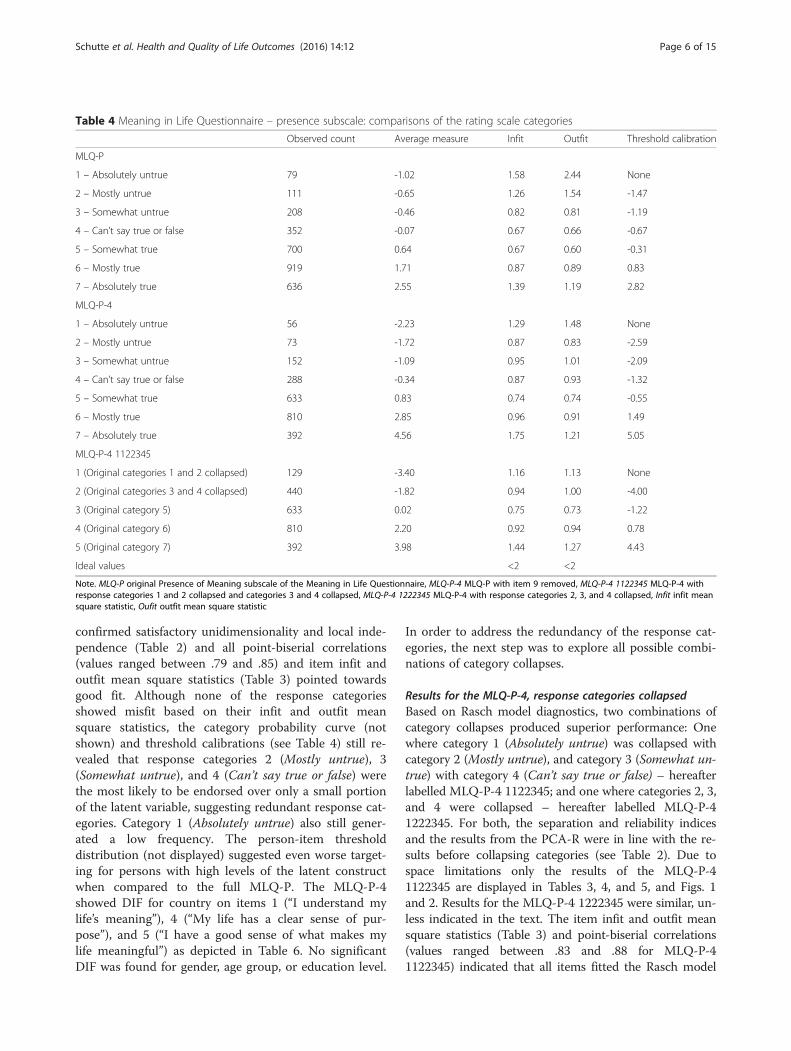
confirmed satisfactory unidimensionality and local inde-pendence (Table 2) and all point-biserial correlations(values ranged between .79 and .85) and item infit andoutfit mean square statistics (Table 3) pointed towardsgood fit. Although none of the response categoriesshowed misfit based on their infit and outfit meansquare statistics, the category probability curve (notshown) and threshold calibrations (see Table 4) still re-vealed that response categories 2 (Mostly untrue), 3(Somewhat untrue), and 4 (Can’t say true or false) werethe most likely to be endorsed over only a small portionof the latent variable, suggesting redundant response cat-egories. Category 1 (Absolutely untrue) also still gener-ated a low frequency. The person-item thresholddistribution (not displayed) suggested even worse target-ing for persons with high levels of the latent constructwhen compared to the full MLQ-P. The MLQ-P-4showed DIF for country on items 1 (“I understand mylife’s meaning”), 4 (“My life has a clear sense of pur-pose”), and 5 (“I have a good sense of what makes mylife meaningful”) as depicted in Table 6. No significantDIF was found for gender, age group, or education level.
In order to address the redundancy of the response cat-egories, the next step was to explore all possible combi-nations of category collapses.
Results for the MLQ-P-4, response categories collapsedBased on Rasch model diagnostics, two combinations ofcategory collapses produced superior performance: Onewhere category 1 (Absolutely untrue) was collapsed withcategory 2 (Mostly untrue), and category 3 (Somewhat un-true) with category 4 (Can’t say true or false) – hereafterlabelled MLQ-P-4 1122345; and one where categories 2, 3,and 4 were collapsed – hereafter labelled MLQ-P-41222345. For both, the separation and reliability indicesand the results from the PCA-R were in line with the re-sults before collapsing categories (see Table 2). Due tospace limitations only the results of the MLQ-P-41122345 are displayed in Tables 3, 4, and 5, and Figs. 1and 2. Results for the MLQ-P-4 1222345 were similar, un-less indicated in the text. The item infit and outfit meansquare statistics (Table 3) and point-biserial correlations(values ranged between .83 and .88 for MLQ-P-41122345) indicated that all items fitted the Rasch model
Table 4 Meaning in Life Questionnaire – presence subscale: comparisons of the rating scale categories
Observed count Average measure Infit Outfit Threshold calibration
MLQ-P
1 – Absolutely untrue 79 -1.02 1.58 2.44 None
2 – Mostly untrue 111 -0.65 1.26 1.54 -1.47
3 – Somewhat untrue 208 -0.46 0.82 0.81 -1.19
4 – Can’t say true or false 352 -0.07 0.67 0.66 -0.67
5 – Somewhat true 700 0.64 0.67 0.60 -0.31
6 – Mostly true 919 1.71 0.87 0.89 0.83
7 – Absolutely true 636 2.55 1.39 1.19 2.82
MLQ-P-4
1 – Absolutely untrue 56 -2.23 1.29 1.48 None
2 – Mostly untrue 73 -1.72 0.87 0.83 -2.59
3 – Somewhat untrue 152 -1.09 0.95 1.01 -2.09
4 – Can’t say true or false 288 -0.34 0.87 0.93 -1.32
5 – Somewhat true 633 0.83 0.74 0.74 -0.55
6 – Mostly true 810 2.85 0.96 0.91 1.49
7 – Absolutely true 392 4.56 1.75 1.21 5.05
MLQ-P-4 1122345
1 (Original categories 1 and 2 collapsed) 129 -3.40 1.16 1.13 None
2 (Original categories 3 and 4 collapsed) 440 -1.82 0.94 1.00 -4.00
3 (Original category 5) 633 0.02 0.75 0.73 -1.22
4 (Original category 6) 810 2.20 0.92 0.94 0.78
5 (Original category 7) 392 3.98 1.44 1.27 4.43
Ideal values <2 <2
Note. MLQ-P original Presence of Meaning subscale of the Meaning in Life Questionnaire, MLQ-P-4 MLQ-P with item 9 removed, MLQ-P-4 1122345 MLQ-P-4 withresponse categories 1 and 2 collapsed and categories 3 and 4 collapsed, MLQ-P-4 1222345 MLQ-P-4 with response categories 2, 3, and 4 collapsed, Infit infit meansquare statistic, Oufit outfit mean square statistic
Schutte et al. Health and Quality of Life Outcomes (2016) 14:12 Page 6 of 15

well and the response categories showed good fit, withthreshold calibrations increasing monotonically and beingsufficiently distanced from each other (see Table 4 andFig. 1). For the MLQ-P-4 1222345, the frequency of cat-egory 1 (Absolutely untrue) was low, while the MLQ-P-41122345 yielded a larger frequency for category 1. Collaps-ing the categories improved the targeting of the scaleconsiderably (see Fig. 2). Both the MLQ-P-4 1122345and the MLQ-P-4 1222345 showed DIF for countryon items 1 (“I understand my life’s meaning”) and 5(“I have a good sense of what makes my life meaning-ful”) as shown in Table 6. No significant DIF wasfound for gender, age group, or education level.
Results for the search subscaleMLQ-SThe separation and reliability indices for the MLQ-Swere in line with the guidelines, and the results from thePCA-R pointed to sufficient unidimensionality and localindependence (see Table 2). Considering the item infitand outfit mean square statistics (Table 3) and the point-
biserial correlations (values ranged between .80 and .85),all items fitted the Rasch model well. Although the infitand outfit mean square statistics of the response cat-egories adhered to the guidelines, the threshold calibra-tions of categories 2 (Mostly untrue), 3 (Somewhatuntrue), and 4 (Can’t say true or false) were disordered,pointing towards problematic use of the rating scale (seeTable 5), which is also evident in the category probabilitycurve (Fig. 1). The person-item threshold distribution(Fig. 2) portrayed that the average item challenge wasslightly lower than the average person intensity, butfrom the information curve it is clear that there was sub-stantial information available for the majority of respon-dents. There was no significant DIF for country, gender,age group, or education level. In an attempt to remedythe disordered threshold calibrations, all possible combi-nations of response category collapses were explored.
Results for the MLQ-S, response categories collapsedBased on Rasch model diagnostics, two combinations ofcategory collapses stood out as superior: One where
Fig. 1 Category probability curves of the Meaning in Life Questionnaire (MLQ). MLQ-P =Original Presence of Meaning subscale of the MLQ; MLQ-P-41122345 =MLQ-P-4 with response categories 1 and 2 collapsed and categories 3 and 4 collapsed. MLQ-S = Original Search for Meaning subscale of theMLQ; MLQ-S 1233456 =MLQ-S with response categories 3 and 4 collapsed
Schutte et al. Health and Quality of Life Outcomes (2016) 14:12 Page 7 of 15

category 2 (Mostly untrue) was collapsed with category 3(Somewhat untrue), as well as category 4 (Can’t say trueor false) with category 5 (Somewhat true) – hereafter la-belled MLQ-S 1223345; and one where categories 3(Somewhat untrue) and 4 (Can’t say true or false) werecollapsed – hereafter labelled MLQ-S 1233456. Althoughthe item separation dropped slightly after collapsing thecategories, the person separation increased and the per-son and item reliability indices remained unchanged (seeTable 2). Results of the PCA-R suggested sufficient uni-dimensionality and local independence (see Table 2).Based on the item infit and outfit mean square statistics(Table 3) and the point-biserial correlations (valuesranged between .82 and .89 for MLQ-S 1223345 and be-tween .82 and .88 for MLQ-S 1233456), all items mani-fested adequate fit. The problem of disordered categorythresholds has been resolved, the distances between thethreshold calibrations have improved, and the infit andoutfit mean square statistics of the response categoriespointed towards satisfactory fit (see Table 5 and Fig. 1).The person-item threshold distribution (Fig. 2) sug-gested improved targeting for MLQ-S 1233456, but forMLQ-S 1223345 (not shown) the average item challengelevel was found to be more than the average person in-tensity level, which suggests less optimal targeting.There was no significant DIF for country, gender, agegroup, or education level.
DiscussionRasch analyses were conducted to investigate the psy-chometric properties of the Presence of and Search forMeaning subscales of the Meaning in Life Questionnaire,a scale which measures meaning in life – a key indicatorof quality of life, from a Rasch modelling point of view.Data from three different countries were used. ForMLQ-P, removal of item 9 (“My life has no clear pur-pose”) and collapsing response categories indicative oflow and medium levels of the latent construct signifi-cantly improved the fit to the Rasch model and the tar-geting of the scale, resulting in a scale that exhibited DIFon items 1 (“I understand my life’s meaning”), 4 (“My lifehas a clear sense of purpose”), and 5 (“I have a goodsense of what makes my life meaningful”) for country,but no DIF for gender, age group, or education level.The MLQ-S yielded disordered category threshold cali-brations, but after collapsing some of the response cat-egories representing low and medium levels of the targetconstruct, a scale that demonstrated good fit to theRasch model, good targeting, and no DIF resulted. Sev-eral specific aspects of the results will now be discussed.
Reversed itemThe first significant finding that warrants discussion isthe poor performance of item 9 (“My life has no clearpurpose”), the only reversed item in the MLQ-P scale. In
Fig. 2 Person-item threshold distributions of the Meaning in Life Questionnaire (MLQ). MLQ-P = Original Presence of Meaning subscale of theMLQ; MLQ-P-4 1122345 =MLQ-P-4 with response categories 1 and 2 collapsed and categories 3 and 4 collapsed. MLQ-S = Original Search forMeaning subscale of the MLQ; MLQ-S 1233456 =MLQ-S with response categories 3 and 4 collapsed. Person-item threshold distributions wereobtained from RUMM2030™
Schutte et al. Health and Quality of Life Outcomes (2016) 14:12 Page 8 of 15

a review on misresponse to reversed and negated items,Weijters and Baumgartner [43] advocated for the inclu-sion of reversed items in measurement scales as it canprovide many benefits (e.g., control acquiescence, dis-rupt careless responding, and promote a broader cover-age of the content domain), but stressed that it shouldbe done with caution. A reversed item that is merely thenegation of an item in the main direction (in point offact, item 9 is basically the negation of item 4, “My lifehas a clear sense of purpose”), does not hold the benefitof broadening the content domain tapped by the instru-ment, and has the disadvantages inherent in negateditems (e.g., accurately assessing level of agreement withstatements that contain negation requires considerablecognitive strain) and reversed items (e.g., cross-culturaldifferences in response styles such as acquiescence). Wetherefore follow the guidance provided by Weijters andBaumgartner [43], who advised against the use of ne-gated reversals, and consequently we recommend the re-moval of item 9, which will result in a 4-item Presenceof Meaning subscale.Steger et al. [15] stated that the reversed item was
retained in the hope of discouraging automatic response
sets. It is our view that this concern is to a large extentalready handled by the mixed administration of the Pres-ence and Search subscales. If item 9 is removed, how-ever, the remaining items 4 to 6 will tap presence ofmeaning and the last three items will tap search formeaning. To guard against careless responding and re-sponse sets, we recommend shuffling the last six items(item 9 excluded) so that the respondent does not re-spond to three items from the same subscale insequence.
Number of response categoriesFor both subscales, the response categories indicative oflow and medium levels of the latent construct appearedto be redundant and for the search subscale, the cat-egory thresholds were disordered. These findings suggestthat the respondents were unable to distinguish reliablyamong the categories, and consequently fewer categoriesshould yield more consistent, reliable scores. Weijters,Cabooter, and Schillewaert [44] suggested that seven re-sponse categories may be acceptable for populationswho are expected to have high cognitive abilities, verbalskills, or questionnaire experience, such as college
Table 5 Meaning in Life Questionnaire – search subscale: comparisons of the rating scale categories
Observed count Average measure Infit Outfit Threshold calibration
MLQ-S
1 – Absolutely untrue 335 -1.99 1.53 1.52 None
2 – Mostly untrue 406 -1.45 0.72 0.77 -2.23
3 – Somewhat true 254 -0.55 0.83 0.84 -0.46
4 – Can’t say true or false 408 -0.07 0.75 0.67 -0.81
5 – Somewhat true 731 0.51 0.81 0.84 -0.38
6 – Mostly true 530 1.38 0.98 0.99 1.17
7 – Absolutely true 341 2.14 1.70 1.30 2.70
MLQ-S 1223345
1 (Original category 1) 335 -3.11 1.43 1.39 None
2 (Original categories 2 and 3 collapsed) 660 -1.87 0.79 0.77 -3.55
3 (Original categories 4 and 5 collapsed) 1139 0.21 0.74 0.75 -1.27
4 (Original category 6) 530 1.72 0.91 0.91 1.64
5 (Original category 7) 341 2.68 1.37 1.43 3.18
MLQ-S 1233456
1 (Original category 1) 335 -2.47 1.52 1.46 None
2 (Original category 2) 406 -1.80 0.69 0.71 -2.65
3 (Original categories 3 and 4 collapsed) 662 -0.39 0.78 0.76 -1.45
4 (Original category 5) 731 0.53 0.76 0.79 -0.06
5 (Original category 6) 530 1.52 0.96 0.99 1.25
6 (Original category 7) 341 2.35 1.55 1.43 2.90
Ideal values <2 <2
Note. MLQ-S original Search for Meaning subscale of the Meaning in Life Questionnaire, MLQ-S 1223345 MLQ-S with response categories 2 and 3 collapsed andcategories 4 and 5 collapsed, MLQ-S 1233456 MLQ-S with response categories 3 and 4 collapsed. Infit infit mean square statistic, Oufit outfit mean square statistic
Schutte et al. Health and Quality of Life Outcomes (2016) 14:12 Page 9 of 15

Table 6 Meaning in Life Questionnaire – presence subscale: differential item functioning for country
MLQ-P (Bonferroni α = 0.003) MLQ-P-4 (Bonferroni α = 0.004) MLQ-P-4 1122345 (Bonferroni α = 0.004)
Item DIF Measure(DIF S.E.) Contrast MH DIF Measure(DIF S.E.) Contrast MH DIF Measure(DIF S.E.) Contrast MH
AU SA NZ AU SA NZ AU SA NZ
1 0.38 (0.08) -0.28 (0.08) 0.16 (0.07) AU > SA AU > SANZ> SA
0.36 (0.10) -0.28 (0.11) 0.19 (0.09) AU > SA AU > SA 0.45 (0.13) -0.41 (0.13) 0.25 (0.12) AU > SANZ> SA
AU > SANZ> SA
4 0.32 (0.08) -0.12 (0.08) 0.30 (0.07) AU > SANZ> SA
0.25 (0.10) 0.00 (0.10) 0.41 (0.09) NZ > SA
5 -0.76 (0.12) -0.15 (0.11) -0.89 (0.11) SA > NZ SA > AUSA> NZ
-0.97 (0.14) -0.24 (0.12) -1.07 (0.12) SA > AUSA> NZ
SA > AUSA> NZ
9a -0.79 (0.10) 0.41 (0.07) -0.19 (0.08) SA > AU SA > AUNZ> AUSA> NZ
Note. MLQ-P original Presence of Meaning subscale of the Meaning in Life Questionnaire, MLQ-P-4 MLQ-P with item 9 removed, MLQ-P-4 1122345 MLQ-P-4 with response categories 1 and 2 collapsed and categories 3and 4 collapsed, Bonferroni α Bonferroni-corrected significance level, DIF measure item challenge for the particular country, DIF S.E. standard error of item challenge for the particular country, Contrast if the DIF contrast(i.e., the difference between the two countries’ DIF measures) was larger than or equal to 0.64, the countries are specified in this column, MH if the p-value of the Mantel-Haenszel test was smaller than Bonferroni α,the countries are specified in this column, AU Australian sample, SA South African sample, NZ sample from New Zealand. In columns DIF Contrast and MH, x > y implies that respondents from country x found itsignificantly harder to endorse the item than respondents from country y given equal levels of presence of meaningaThe original item 9 was reversed in these analyses
Schutteet
al.Health
andQuality
ofLife
Outcom
es (2016) 14:12
Page10
of15

students, but that a 5-point scale may be more appropri-ate for the general population. For future use, we recom-mend either a 6-point rating scale where the midpointcategory 4 = Can’t say true or false is dropped, or a 5-point scale with categories 1 = Absolutely untrue, 2 =Un-true, 3 =Unsure, 4 = True, 5 =Absolutely true (the issueof whether to include a midpoint category is much de-bated in the literature [44, 45]).
TargetingIn the present study, the average level of meaning in lifecaptured by the items was substantially lower than theaverage level of presence of meaning manifested by per-sons who completed the scale, suggesting poor targeting.In fact, the scale provided little information for respon-dents with high levels of presence of meaning while atthe same time most of the respondents fell within thatrange. This could have significant practical implications.Correlations in correlational studies will be largely influ-enced by the minority of people exhibiting lower levelsof presence of meaning as reflected by lower scores onthe MLQ-P, while nuances of presence of meaning at thehigher end of the continuum will not be captured well.This can, for example, influence outcomes of studieswhere the associations between meaning in life and indi-cators of health and quality of life are studied signifi-cantly. In addition, in experimental studies or studieswhere intervention programs are evaluated, the MLQ-Pwould probably not detect changes in meaning in life ofpeople on the higher end of the continuum, which in-volves the majority of people, as the scale is not sensitiveto changes at the higher end of the continuum.Different explanations can be given for the findings re-
garding the targeting of the MLQ-P. One apparently ob-vious explanation is that there are not enough items orresponse options to capture high levels of the presenceof meaning continuum and such items or response op-tions should be added. However, given that the question-naire already allows respondents to rate statements like“I understand my life’s meaning” to be “absolutely true”,it is not clear what kind of items or response optionscan be added to capture even higher levels of presenceof meaning in life.Another possible explanation pertains to the nature of
presence of meaning as a construct and its distributionin the general population. The fact that the majority ofthe respondents endorsed high levels of presence ofmeaning according to their scores on the MLQ-P couldsimply tell us that most people indeed experience theirlives as basically meaningful: Most respondents’ level ofpresence of meaning were higher than the levels wherethe scale had optimal information, merely because thereis not much variability at the upper end of the under-lying construct continuum. Such an explanation speaks
to the findings of Heintzelman and King [46], who con-ducted a review of research on meaning in life from epi-demiological data and studies using the MLQ-P [15] andthe Purpose in Life Test [47]. They found that diversesamples rated themselves significantly above the mid-point on self-report measures of meaning in life andconcluded that most people experience their lives as“pretty meaningful”. This line of thought can be linkedto psychopathology literature where “quasi-traits” aredistinguished. Reise and Waller [48] defines a quasi-traitas “a unipolar construct in which one end of the scalerepresents severity and the other pole represents its ab-sence (depression versus not depressed)” which “is incontrast to a bipolar construct, where both ends of thescale represent meaningful variation (depression versushappiness)”. In psychopathology research, the existenceof quasi-traits with their associated peaked informationcurves (with the peaks in the range representing severelevels of the trait) has been found in many item responsetheory applications and often led researchers to con-clude that items needed to be added or adapted to pro-vide information at low (less severe) levels of the traitcontinuum [48]. According to Reise and Waller [48] thisreasoning is problematic when working with quasi-traits:If the underlying latent construct is a quasi-trait, suchattempts may be futile – it will be difficult (if not impos-sible) to formulate items that yield information acrossthe continuum of the trait. Similarly we can ask whetherit would be possible to develop items designed to cap-ture even higher levels of presence of meaning, orwhether we should conclude that the variation of pres-ence of meaning is limited at the higher end of the con-tinuum, although the majority of people attain such highlevels.If we settle with the conclusion that the majority of
the population attained maximum levels of presence ofmeaning, we will inevitably have to re-evaluate the use-fulness of, for example, interventions that aim to en-hance meaning in life in the general population (most ofwhom have attained high levels of meaning in life). Thequestion would be what the (large) portion of peoplewith high levels of meaning would gain from interven-tions that intend to enhance meaning. Accepting thatthe majority of the population have already attainedlevels of presence of meaning that do not allow formuch improvement may pose further questions. For ex-ample, could it be possible that icons of eudaimonic liv-ing, such as Mahatma Ghandi, Mother Theresa, orNelson Mandela, who sacrificed their lives for a greatercause, have experienced levels of meaning in life similarto the majority of people? Or should we rather concludethat the nuances of presence of meaning at higher levelsare just not captured by the current conceptualisationand operationalization of the construct?
Schutte et al. Health and Quality of Life Outcomes (2016) 14:12 Page 11 of 15

Another way to explain the poor targeting of theMLQ-P may be that the subscale applies a rather narrowunderstanding of meaning in life, with all items para-phrasing the notion of having found a sense of meaningor purpose in life. By repeating the same content usingslightly different syntax, the scale actually operates in asimilar way to a one or two-item measure, which couldcontribute to the inability of the scale to differentiatewell at the higher end of the continuum. Alternativemeasures that capture a broader sense of meaning in life,such as the Sources of Meaning and Meaning in LifeQuestionnaire (SoMe) that operationalises meaningful-ness through coherence, significance, direction, and be-longing [11], may display better sensitivity.In addition, one can argue that participants’ presence
of meaning in life was not really as high as they indi-cated it to be – social desirability may have augmentedtheir scores artificially. However, presence of meaning inlife has been found to be unrelated to scores on mea-sures of social desirability in several studies [15, 49] and,as argued by Heintzelman and King [46], high presenceof meaning scores have been found consistently amongdiverse samples, including anonymous samples wheresocial desirability may not have been a big concern. Thehigh scores could have also been due to a generalisationeffect – when asked to respond to items that concernglobal meaning in life, people may not be sure whatmeaning actually refers to. They may have a broad un-derstanding of meaning and therefore think that theygenerally experience meaning. However, if the constitu-ents of meaning are spelled out, they might realise thatthey don’t have as much meaning as they initiallythought.One may also reason that the lack of sensitivity to
varying nuances of meaning in life at the higher end ofthe continuum relates to the fact that the scale relieson self-report and alternative avenues to capture mean-ing in life should be explored. This approach may beproblematic because meaning in life is, at its heart, asubjective experience. Several studies have argued thatself-report is the best way to capture meaning in life[46, 50, 51]. However, obtaining self-report using lessstructured approaches may add value, for example byusing experience sampling methods [52] or qualitativemethods.
Differential Item Functioning (DIF)The data in this study were gathered in three differentcountries and two gender groups, three age groups, andtwo levels of education were distinguished. Of all thesedemographic variables, significant DIF was only detectedfor items from the Presence subscale based on the coun-try variable. The absence of DIF is the desirable outcome
should data from the different demographic groups becombined or compared [53].The significant country DIF for items from the Pres-
ence of Meaning subscale warrants further attention. Be-fore removal of item 9 (“My life has no clear purpose”),the item exhibited DIF for country: Given equal levels ofthe latent trait, respondents from South Africa tended torespond more strongly towards the extreme True re-sponse categories than respondents from New Zealandand Australia, and, similarly participants from NewZealand were more inclined to extreme responses in theTrue direction than participants from Australia. After re-moval of item 9 and before collapsing the response cat-egories, item 1 (“I understand my life’s meaning”)manifested DIF, where Australians found it harder to en-dorse the item than South Africans given equal levels ofthe latent construct. After collapsing categories, thisfinding was extended – respondents from both NewZealand and Australia found it significantly harder toendorse item 1 than respondents from South Africagiven equal levels of the construct. Also, before collaps-ing categories, participants from New Zealand found itharder to endorse item 4 (“My life has a clear sense ofpurpose”) than participants from South Africa givenequal levels of the latent trait. Last, given equal levels ofthe latent construct, participants from South Africafound it harder to endorse item 5 (“I have a good senseof what makes my life meaningful”) than respondentsfrom Australia and New Zealand, both before and aftercollapsing categories. Country-specific parameter esti-mates may be needed for these items of the Presencesubscale, that is, the dataset can be split by country andthese items should be calibrated separately for eachcountry [54].The two items that respondents from Australia and
New Zealand found harder to endorse than South Afri-cans given equal levels of the latent construct (i.e., items1 and 4) refer to comprehending one’s life meaning andhaving a clear sense of purpose – both can be seen as aglobal state of grasping one’s life meaning, without refer-ring to the elements that brings meaning to one’s life.South Africa is a developing country and together withthe many challenges the country faces come multipleopportunities for individuals to contribute and to have asense of purpose. This may especially be the case for ed-ucated individuals who may feel that they have skills andknowledge that can really make a difference in a countrywith many challenges (based on the selection criteria ofthis study all participants had at least secondary educa-tion). Australia and New Zealand, on the other hand, arefirst world countries with a lot more stability and cer-tainty. People from such countries may feel that things“go right” regardless of their contribution which maypossibly lead to having a less clear sense of purpose and
Schutte et al. Health and Quality of Life Outcomes (2016) 14:12 Page 12 of 15

meaning comprehension. Another possible explanationmay be connected with the fact that the specific SouthAfrican group in this study exhibited a higher frequencyof religious practice (mostly Christianity) than the par-ticipants from Australia and New Zealand. Religiositymay be associated with a clear sense of purpose andmeaning comprehension.The item that South Africans found harder to endorse
than respondents from Australia and New Zealand givenequal levels of the latent trait (item 5) refers to anawareness of the constituents of a meaningful life – theelements that make one’s life meaningful. One possibilityis to infer that people (in this case, South Africans) whofind it easier to agree with items referring to a globalcomprehension of one’s life’s meaning (items 1 and 4),may not have such a pressing need to know what the el-ements are that make their lives feel meaningful – onemay argue that they take it for granted or that theyspend less time attending to the specific details of whythey find their lives meaningful. In contrast, people whofind it more challenging to agree with items related tocomprehending one’s life meaning and having a clearsense of purpose (in this case respondents fromAustralia and New Zealand), may be more attentive tothe things that add life meaning.For both items 4 and 9, South Africans tended to an-
swer more strongly in the True direction when com-pared to respondents from Australia and New Zealandgiven equal levels of the latent construct. In other words,South Africans were more inclined to find both the non-reversed, non-negated statement “My life has a clearsense of purpose” (item 4) and the reversed, negatedstatement “My life has no clear purpose” (item 9) true.This points to a discrepancy which poses questionsabout the possible influence of response styles involvedin responding to the reversed item that could havecaused DIF. This finding provides additional support forthe deletion of item 9.Since all aspects of Rasch analysis are interconnected
[30], the existence of cross-country DIF on the Presencesubscale could have influenced the rest of the findings.Future research should explore whether the findings ofthis study replicate in more culturally homogeneoussamples where DIF is not present.
Limitations and future directionsWhile the study makes important contributions to thebody of knowledge about meaning in life and the meas-urement thereof across three countries, it also possessedseveral limitations. This study made use of the Raschmodel, which is considered to be a one-parameter IRTmodel that includes only item difficulty as a parameter.Although the Rasch model has very attractive
mathematical properties, analysing MLQ data usingmore complex IRT models will also be of value.In this study, recommendations regarding the removal
of item 9 (“My life has no clear purpose”) and categorycollapses were made a posteriori based on removing theitem from and collapsing categories of data attainedusing the original full scale. These recommendationsshould be tested in new datasets gathered with a revisedscale.The fact that the sample in this study comes from
three different countries can be seen as a strength in thesense that diversity is reflected in the study of an alreadywell-established scale. In addition, it allowed us to inves-tigate DIF across the three countries. The fact that evi-dence was found for DIF across the countries, however,points towards the possibility that the scale may functiondifferentially across the different country groups whichcould have had an influence on the rest of the results.This suggests the need for repetition of the study inmore culturally homogeneous groups to investigatewhether the findings replicate when cross-country influ-ences are not present.Another important avenue for future research is the
revisiting of presence of meaning in life as a construct,in particular with regards to the higher end of the con-struct continuum. The content domain of presence ofmeaning should be explored qualitatively in order todeepen our understanding of the construct, especially athigh levels. For example, by investigating lay people’sconceptualisations of meaning in life, we may identifysub-facets of meaning in life which may provide greatervariance at the upper end of the continuum.
ConclusionsThe rigorous measurement of meaning in life is essentialfor the study of this key aspect of well-being and qualityof life. The present study was the first to apply item re-sponse theory, in particular Rasch modelling, to investi-gate the psychometric properties and item-levelequivalence of the MLQ across different demographicvariables. The study offered valuable insights into thefunctioning of the MLQ in groups from South Africa,Australia, and New Zealand and the construct of mean-ing in life and the measurement thereof in general. Inparticular, the MLQ displayed good psychometric poten-tial from a Rasch modelling perspective. However, sev-eral directions for revision were highlighted. First, thestudy pointed out that seven response categories may betoo many when measuring meaning in life in the generalpopulation, and suggested that five or six response cat-egories may be more appropriate. In addition, the studyconfirmed the potential problems involved in reversed,negated items, and suggested that this type of itemshould rather be avoided – removing the reversed
Schutte et al. Health and Quality of Life Outcomes (2016) 14:12 Page 13 of 15

phrased item 9 (“My life has no clear purpose”) was in-dicated. Although no DIF was found for the Search sub-scale, the Presence subscale displayed significant DIF forthe country variable on four of its five items. Hypotheseswere articulated to explore possible sources of the DIF,and it was suggested that country-level parameter esti-mates may be needed for these items. The existence ofDIF pointed to the necessity of repeating this study inmore mono-cultural settings to investigate whether thefindings replicate. Furthermore, it was shown that peoplewith high scores on presence of meaning were not tar-geted well by this highly commended meaning in lifescale, while at the same time most of the respondentsfell in that range. Reasons for and the extensive implica-tions of this finding were contemplated and the vital im-portance of further exploration of the nature of theconstruct of presence of meaning and the measurementthereof, particularly at high levels, was indicated.
Endnotes1In the ability testing environment, where Rasch mod-
elling originated, the term item difficulty is often used torefer to the level of the latent construct captured by theitem, while person ability describes the level of the latenttrait held by the respondent. For the purpose of thecurrent study where meaning in life is studied, wedeemed the terms item challenge and person intensitymore suitable and used them in the manuscript.
Competing interestsThe authors declare that they have no competing interests.
Authors’ contributionsMPW and DAVB participated in the design and planning of the study. MPW,DAVB and PEJ took responsibility for the data gathering. LS performed andinterpreted the statistical analyses, drafted the manuscript, incorporated allsuggestions from the co-authors into the manuscript and prepared the finalmanuscript for submission. MPW provided continuous feedback regardingthe draft document. SME, DAVB, and PEJ revised the manuscript critically forimportant intellectual content. All authors read and approved the finalmanuscript. The study forms part of the doctoral thesis of LS.
AcknowledgementsThe South African research was financially supported by the NationalResearch Foundation (NRF) of South Africa by funding for the FORT3research project and for a doctoral scholarship. Opinions expressed andconclusions arrived are those of the authors and are not necessarily to beattributed to the NRF. Funding was also provided in the form of a doctoralscholarship by the North-West University, South Africa. The New Zealand re-search was financially supported by a Marsden grant from the Royal Societyof New Zealand awarded to the fourth author. This study is based on datafrom the international Eudaimonic-Hedonic Happiness Investigation (EHHI).The authors wish to thank the anonymous reviewers for insightful commentson the manuscript.
Author details1Africa Unit for Trans-disciplinary Health Research, North-West University,Potchefstroom, South Africa. 2Statistical Consultation Services, North-WestUniversity, Potchefstroom, South Africa. 3School of Psychology, VictoriaUniversity of Wellington, Wellington, New Zealand. 4Melbourne GraduateSchool of Education, University of Melbourne, Melbourne, Australia.
Received: 13 August 2015 Accepted: 14 January 2016
References1. Efklides A, Moraitou D. Introduction: Looking at quality of life and well-
being from a positive psychology perspective. In: Efklides A, Moraitou D,editors. New York. NY: Springer; 2013. p. 1–14.
2. Keyes CL, Fredrickson BL, Park N. Positive psychology and the quality of life.In: Land KC, Michalos AC, Sirgy MJ, editors. Handbook of social indicatorsand quality of life research. New York, NY: Springer; 2012. p. 99–112.
3. Efklides A, Moraitou D, editors. A positive psychology perspective on qualityof life. New York, NY: Springer; 2013.
4. Frankl VE. Man’s search for meaning: An introduction to logotherapy. NewYork, NY: Washington Square Press; 1963.
5. Ryff CD. Happiness is everything, or is it? Explorations on the meaning ofpsychological well-being. J Pers Soc Psychol. 1989;57(6):1069–81.doi:10.1037/0022-3514.57.6.1069.
6. Steger MF, Shin JY, Shim Y, Fitch-Martin A. Is meaning in life a flagshipindicator of well-being? In: Waterman AS, editor. The best within us: Positivepsychology perspectives on eudaimonia. Washington, DC: AmericanPsychological Association; 2013. p. 159–82.
7. Baumeister RF, Vohs KD. The pursuit of meaningfulness in life. In: Snyder CR,Lopez SJ, Snyder CR, Lopez SJ, editors. Handbook of positive psychology.New York, NY: Oxford University Press; 2002. p. 608–18.
8. Steger MF. Experiencing meaning in life: Optimal functioning at the nexusof well-being, psychopathology, and spirituality. In: Wong PTP, editor. Thehuman quest for meaning: Theories, research, and applications 2nd ed.Personality and clinical psychology series. New York, NY: Routledge;2012. p. 165–84.
9. Park CL. Integrating positive psychology into health-related quality of liferesearch. Qual Life Res. 2015;24(7):1645–51. doi:10.1007/s11136-014-0889-z.
10. Wong PTP. Meaning therapy: an integrative and positive existentialpsychotherapy. J Contemp Psychother. 2010;40(2):85–93. doi:10.1007/s10879-009-9132-6.
11. Schnell T. The Sources of Meaning and Meaning in Life Questionnaire(SoMe): relations to demographics and well-being. J Posit Psychol.2009;4(6):483–99. doi:10.1080/17439760903271074.
12. Steger MF. Meaning in life. In: Lopez SJ, Snyder CR, Lopez SJ, Snyder CR,editors. Oxford handbook of positive psychology. 2nd ed. Oxford library ofpsychology. 2nd ed. New York, NY: Oxford University Press; 2009. p. 679–87.
13. Steger MF, Kashdan TB, Sullivan BA, Lorentz D. Understanding the Searchfor Meaning in Life: personality, cognitive style, and the dynamic betweenseeking and experiencing meaning. J Pers. 2008;76(2):199–228.doi:10.1111/j.1467-6494.2007.00484.x.
14. Brandstätter M, Baumann U, Borasio GD, Fegg MJ. Systematic reviewof meaning in life assessment instruments. Psychooncology.2012;21(10):1034–52. doi:10.1002/pon.2113.
15. Steger MF, Frazier P, Oishi S, Kaler M. The Meaning in Life Questionnaire:assessing the presence of and search for meaning in life. J Couns Psychol.2006;53(1):80–93. doi:10.1037/0022-0167.53.1.80.
16. Steger MF, Oishi S, Kashdan TB. Meaning in life across the life span: levelsand correlates of meaning in life from emerging adulthood to olderadulthood. J Posit Psychol. 2009;4(1):43–52. doi:10.1080/17439760802303127.
17. Schulenberg SE, Strack KM, Buchanan EM. The meaning in lifequestionnaire: psychometric properties with individuals with serious mentalillness in an inpatient setting. J Clin Psychol. 2011;67(12):1210–9.doi:10.1002/jclp.20841.
18. Temane L, Khumalo IP, Wissing MP. Validation of the Meaning in LifeQuestionnaire in a South African context. J Psychol Afr. 2014;24(1):81–95.doi:10.1080/14330237.2014.904088.
19. Steger MF, Kawabata Y, Shimai S, Otake K. The meaningful life in Japan andthe United States: levels and correlates of meaning in life. J Res Pers. 2008;42(3):660–78. doi:10.1016/j.jrp.2007.09.003.
20. Steger MF, Frazier PA, Zacchanini JL. Terrorism in two cultures: stress andgrowth following September 11 and the Madrid train bombings. J LossTrauma. 2008;13(6):511–27. doi:10.1080/15325020802173660.
21. Boyraz G, Lightsey OR, Can A. The Turkish version of the Meaning in LifeQuestionnaire: assessing the measurement invariance across Turkishand American adult samples. J Pers Assess. 2013;95(4):423–31.doi:10.1080/00223891.2013.765882.
Schutte et al. Health and Quality of Life Outcomes (2016) 14:12 Page 14 of 15

22. Khumalo IP, Wissing MP, Schutte L, De Klerk W. Translation andmeasurement invariance of the Meaning in Life Questionnaire across threelanguages in South Africa. 2015. Manuscript submitted for publication.
23. DeVellis RF. Scale development: Theory and applications. vol Book, Whole.Thousand Oaks, CA: Sage; 2012.
24. Thomas ML. The value of item response theory in clinical assessment: areview. Assessment. 2011;18(3):291–307. doi:10.1177/1073191110374797.
25. Andrich D. Application of a psychometric rating model to orderedcategories which are scored with successive integers. Appl Psychol Meas.1978;2(4):581–94. doi:10.1080/14330237.2014.904088.
26. Rasch G. Probabilistic models for some intelligence and attainment tests.Copenhagen, Denmark: Danmarks Peadagogiske Institut; 1960.
27. Andrich D. Controversy and the Rasch model: a characteristic ofincompatible paradigms? Med Care. 2004;42(1):1–16.
28. Bond TG, Fox CM. Applying the Rasch model: Fundamental measurementin the human sciences. 2nd ed. New York, NY: Routledge; 2007.
29. da Rocha NS, Chachamovich E, de Almeida Fleck MP, Tennant A. Anintroduction to Rasch analysis for Psychiatric practice and research.J Psychiatr Res. 2013;47(2):141–8. doi:10.1016/j.jpsychires.2012.09.014.
30. Hagquist C, Bruce M, Gustavsson JP. Using the Rasch model in nursingresearch: an introduction and illustrative example. Int J Nurs Stud. 2009;46(3):380–93. doi:10.1016/j.ijnurstu.2008.10.007.
31. Tennant A, Conaghan PG. The Rasch measurement model in rheumatology:what is it and why use it? When should it be applied, and what shouldone look for in a Rasch paper? Arthritis Rheum. 2007;57(8):1358–62.doi:10.1002/art.23108.
32. Myers ND, Wolfe EW, Feltz DL, Penfield RD. Identifying differential itemfunctioning of rating scale items with the Rasch model: an introduction andan application. Meas Phys Educ Exerc Sci. 2006;10(4):215–40.doi:10.1207/s15327841mpee1004_1.
33. Delle Fave A, Brdar I, Freire T, Vella-Brodrick D, Wissing MP. The eudaimonicand hedonic components of happiness: qualitative and quantitativefindings. Soc Indicat Res. 2011;100(2):185–207. doi:10.1007/s11205-010-9632-5.
34. Grouden ME, Jose PE. How do sources of meaning in life vary according todemographic factors? N Z J Psychol. 2014;43(3):29–38.
35. Cohen K, Cairns D. Is searching for Meaning in Life associated with reducedsubjective well-being? Confirmation and possible moderators. J HappinessStud. 2012;13(2):313–31. doi:10.1007/s10902-011-9265-7.
36. Linacre JM. Winsteps (Version 3.81.0). Beaverton, Oregon: Winsteps.com;2014.
37. Andrich D, Sheridan B, Luo G. Rumm 2030 for Windows (Version 5.52).Perth, Australia: Rumm Laboratory; 2014.
38. Linacre JM. A user’s guide to Winsteps Ministep Rasch-model computerprograms: Program manual 3.81.0. Beaverton, Oregon: Winsteps.com; 2014.
39. Fox CM, Jones JA. Uses of Rasch modeling in counseling psychologyresearch. J Couns Psychol. 1998;45(1):30. 0022-0167/98/53.00.
40. Chao RC-L, Green KE. Rasch analysis of the Outcome Questionnaire withAfrican Americans. Psychol Assess. 2013;25(2):568–82. doi:10.1037/a0032083.
41. Mantel N. Chi-square tests with one degree of freedom; extensions of theMantel- Haenszel procedure. J Am Stat Assosiation. 1963;58(303):690–700.
42. Mantel N, Haenszel W. Statistical aspects of the analysis of data fromretrospective studies of disease. J Natl Cancer Inst. 1959;22(4):719–48.
43. Weijters B, Baumgartner H. Misresponse to reversed and negateditems in surveys: a review. J Mark Res (JMR). 2012;49(5):737–47.doi:10.1509/jmr.11.0368.
44. Weijters B, Cabooter E, Schillewaert N. The effect of rating scale format onresponse styles: the number of response categories and response categorylabels. Int J Res Mark. 2010;27(3):236–47. doi:10.1016/j.ijresmar.2010.02.004.
45. Nowlis SM, Kahn BE, Dhar R. Coping with ambivalence: the effect ofremoving a neutral option on consumer attitude and preferencejudgments. J Consum Res. 2002;29(3):319–34. doi:10.1086/344431.
46. Heintzelman SJ, King LA. Life is pretty meaningful. Am Psychol. 2014;69(6):561–74. doi:10.1037/a0035049.
47. Crumbaugh JC, Maholick LT. An experimental study in existentialism: thepsychometric approach to Frankl’s concept of noogenic neurosis. J ClinPsychol. 1964;20(2):200–7. doi:10.1002/1097-4679(196404)20:2<200::AID-JCLP2270200203>3.0.CO;2-U.
48. Reise SP, Waller NG. Item response theory and clinical measurement. AnnuRev Clin Psychol. 2009;5:27–48. doi:10.1146/annurev.clinpsy.032408.153553.
49. Liu S-S, Gan Y-Q. Reliability and validity of the Chinese version of theMeaning in Life Questionnaire. Chin Mental Health J. 2010;24(6):478–82.
50. Heintzelman SJ, King LA. On knowing more than we can tell: intuitiveprocesses and the experience of meaning. J Posit Psychol. 2013;8(6):471–82.doi:10.1080/17439760.2013.830758.
51. Kashdan T, Biswas-Diener R, King L. Reconsidering happiness: the costs ofdistinguishing between hedonics and eudaimonia. J Posit Psychol. 2008;3(4):219–33. doi:10.1080/17439760802303044.
52. Trull TJ, Ebner-Priemer UW. Using Experience Sampling Methods/EcologicalMomentary Assessment (ESM/EMA) in clinical assessment and clinicalresearch: introduction to the special section. Psychol Assess. 2009;21(4):457–62. doi:10.1037/a0017653.
53. Sireci SG. Evaluating test and survey items for bias across languages andcultures. In: Matsumoto D, Van de Vijver FJR, editors. Cross-cultural researchmethods in psychology. Culture and psychology. New York, NY: CambridgeUniversity Press; 2011. p. 216–43.
54. Pallant JF, Tennant A. An introduction to the Rasch measurement model: anexample using the Hospital Anxiety and Depression Scale (HADS). Br J ClinPsychol. 2007;46(1):1–18. doi:10.1348/014466506X96931.
• We accept pre-submission inquiries
• Our selector tool helps you to find the most relevant journal
• We provide round the clock customer support
• Convenient online submission
• Thorough peer review
• Inclusion in PubMed and all major indexing services
• Maximum visibility for your research
Submit your manuscript atwww.biomedcentral.com/submit
Submit your next manuscript to BioMed Central and we will help you at every step:
Schutte et al. Health and Quality of Life Outcomes (2016) 14:12 Page 15 of 15