Embed Size (px)
DESCRIPTION
eläke, eläkkeet
Citation preview
Pension obligations of government employer pension schemes and social security pension schemes established in EU countries Final Report
Research Center for Generational Contracts
By order of the European Central Bank Christoph Müller Bernd Raffelhüschen Olaf Weddige January 2009
Pension obligations of government employer
pension schemes and social security pension schemes
established in EU countries
Christoph Müller
Bernd Raffelhüschen*
Olaf Weddige**
Research Center for Generational Contracts
Freiburg University
January 2009
* Research Center for Generational Contracts, Freiburg University, and University of Bergen, Norway. ** Research Center for Generational Contracts, Freiburg University, 79085 Freiburg, Germany (Fax: +49-761-203 2290; [email protected]). We would like to thank Christian Hagist, Stefan Moog and Johannes Vatter for valuable comments as well as Marlis Schairer, Sabrina Schmutz, Andreas Fleig, Mario Gronert-Àlvarez and Felix Schnurr for their excellent assistance. Special thanks go to Matthias Heidler who made a major contribution to the development of the methodology applied in this survey. All errors remain our own.
Contents
Contents ................................................................................................................................................................... I
List of tables .......................................................................................................................................................... VI
List of figures ......................................................................................................................................................... IX
List of abbreviations ......................................................................................................................................... XII
1 Introduction ........................................................................................................................................ 1
2 Methodology ...................................................................................................................................... 3
2.1 Concepts for measuring implicit pension debt ............................................................... 3
2.2 Calculating accrued-to-date liabilities – the Freiburg model ..................................... 4
2.3 Accumulated benefit obligations vs. projected benefit obligations ....................... 9
3 General assumptions and data description ......................................................................... 14
3.1 Population ................................................................................................................................... 14
3.2 Age-specific pension benefits ............................................................................................. 15
3.3 Growth and discount rates ................................................................................................... 21
4 AT – Austria ...................................................................................................................................... 26
4.1 Demographic situation .......................................................................................................... 26
4.2 General characteristics of the pension system .............................................................. 28
4.3 Recent reforms of the pension system ............................................................................. 28
4.4 Results ........................................................................................................................................... 30
5 BG – Bulgaria ................................................................................................................................... 34
5.1 Demographic situation .......................................................................................................... 34
5.2 General characteristics of the pension system .............................................................. 36
5.3 Recent reforms of the pension system ............................................................................. 37
5.4 Results ........................................................................................................................................... 38
I
6 CZ – Czech Republic ..................................................................................................................... 41
6.1 Demographic situation .......................................................................................................... 41
6.2 General characteristics of the pension system .............................................................. 43
6.3 Recent reforms of the pension system ............................................................................. 44
6.4 Results ........................................................................................................................................... 44
7 DE – Germany ................................................................................................................................. 48
7.1 Demographic situation .......................................................................................................... 48
7.2 General characteristics of the pension system .............................................................. 51
7.3 Recent reforms of the pension system ............................................................................. 53
7.4 Results ........................................................................................................................................... 53
8 ES – Spain ......................................................................................................................................... 57
8.1 Demographic situation .......................................................................................................... 57
8.2 General characteristics of the pension system .............................................................. 59
8.3 Recent reforms of the pension system ............................................................................. 60
8.4 Results ........................................................................................................................................... 60
9 FI – Finland ....................................................................................................................................... 63
9.1 Demographic situation .......................................................................................................... 63
9.2 General characteristics of the pension system .............................................................. 65
9.3 Recent reforms of the pension system ............................................................................. 67
9.4 Results ........................................................................................................................................... 68
10 FR – France ....................................................................................................................................... 72
10.1 Demographic situation ...................................................................................................... 72
10.2 General characteristics of the pension system ......................................................... 74
10.3 Recent reforms of the pension system ........................................................................ 75
10.4 Results ...................................................................................................................................... 76
II
11 GR – Greece ...................................................................................................................................... 80
11.1 Demographic situation ...................................................................................................... 80
11.2 General characteristics of the pension system ......................................................... 82
11.3 Recent reforms of the pension system ........................................................................ 82
11.4 Results ...................................................................................................................................... 83
12 HU – Hungary .................................................................................................................................. 86
12.1 Demographic situation ...................................................................................................... 86
12.2 General characteristics of the pension system ......................................................... 88
12.3 Recent reforms of the pension system ........................................................................ 89
12.4 Results ...................................................................................................................................... 89
13 IT – Italy.............................................................................................................................................. 92
13.1 Demographic situation ...................................................................................................... 92
13.2 General characteristics of the pension system ......................................................... 94
13.3 Recent reforms of the pension system ........................................................................ 95
13.4 Results ...................................................................................................................................... 96
14 LT – Lithuania .................................................................................................................................. 99
14.1 Demographic situation ...................................................................................................... 99
14.2 General characteristics of the pension system ....................................................... 101
14.3 Recent reforms of the pension system ...................................................................... 102
14.4 Results .................................................................................................................................... 103
15 LV – Latvia ....................................................................................................................................... 106
15.1 Demographic situation .................................................................................................... 106
15.2 General characteristics of the pension system ....................................................... 108
15.3 Recent reforms of the pension system ...................................................................... 109
15.4 Results .................................................................................................................................... 109
III
16 MT – Malta ...................................................................................................................................... 112
16.1 Demographic situation .................................................................................................... 112
16.2 General characteristics of the pension system ....................................................... 114
16.3 Recent reforms of the pension system ...................................................................... 115
16.4 Results .................................................................................................................................... 116
17 NL – Netherlands ......................................................................................................................... 121
17.1 Demographic situation .................................................................................................... 121
17.2 General characteristics of the pension system ....................................................... 123
17.3 Results .................................................................................................................................... 124
18 PL – Poland ..................................................................................................................................... 127
18.1 Demographic situation .................................................................................................... 127
18.2 General characteristics of the pension system ....................................................... 129
18.3 Recent reforms of the pension system ...................................................................... 130
18.4 Results .................................................................................................................................... 130
19 PT – Portugal ................................................................................................................................. 135
19.1 Demographic situation .................................................................................................... 135
19.2 General characteristics of the pension system ....................................................... 137
19.3 Recent reforms of the pension system ...................................................................... 138
19.4 Results .................................................................................................................................... 140
20 SE – Sweden................................................................................................................................... 144
20.1 Demographic situation .................................................................................................... 144
20.2 General characteristics of the pension system ....................................................... 146
20.3 Recent reforms of the pension system ...................................................................... 147
20.4 Results .................................................................................................................................... 148
IV
V
21 SK – Slovakia .................................................................................................................................. 151
21.1 Demographic situation .................................................................................................... 151
21.2 General characteristics of the pension system ....................................................... 153
21.3 Recent reforms of the pension system ...................................................................... 154
21.4 Results .................................................................................................................................... 156
22 UK – United Kingdom ................................................................................................................ 159
22.1 Demographic situation .................................................................................................... 159
22.2 General characteristics of the pension system ....................................................... 161
22.3 Recent reforms of the pension system ...................................................................... 161
22.4 Results .................................................................................................................................... 162
23 Cross-country comparison ....................................................................................................... 164
24 Conclusion and outlook ............................................................................................................ 172
References ......................................................................................................................................................... 174
Appendix ............................................................................................................................................................ 177
Supplementary tables 2007 ................................................................................................................... 177
Profiles .................................................................................................................................................. 194
List of tables
Table 1: Definitions of pension liabilities .................................................................................................... 3
Table 2: Model of the supplementary table ............................................................................................ 25
Table 3: Social security and government employer pension payments Austria (in bn. EUR)
.................................................................................................................................................................................. 31
Table 4: Supplementary table Austria 2006 (PBO, in bn. EUR) ......................................................... 31
Table 5: Supplementary table Austria 2006 (ABO, in bn. EUR) ........................................................ 33
Table 6: Social security pension payments Bulgaria (in million BGN) ........................................... 38
Table 7: Supplementary table Bulgaria 2006 (PBO, in bn. BGN) ...................................................... 39
Table 8: Supplementary table Bulgaria 2006 (ABO, in bn. BGN) ..................................................... 40
Table 9: Social security pension payments Czech Republic (in bn. CZK) ..................................... 45
Table 10: Supplementary table Czech Republic 2006 (PBO, in bn. CZK) ...................................... 46
Table 11: Supplementary table Czech Republic 2006 (ABO, in bn. CZK) ..................................... 47
Table 12: Social security pension payments Germany (in bn. EUR) ............................................... 53
Table 13: Government employer pension payments Germany (in bn. EUR) .............................. 54
Table 14: Supplementary table Germany 2006 (PBO, in bn. EUR) .................................................. 55
Table 15: Supplementary table Germany 2006 (ABO, in bn. EUR) .................................................. 56
Table 16: Social security pension payments Spain (in bn. EUR) ...................................................... 61
Table 17: Supplementary table Spain 2006 (PBO, in bn. EUR) ......................................................... 61
Table 18: Supplementary table Spain 2006 (ABO, in bn. EUR) ......................................................... 62
Table 19: Social security pension payments Finland (in bn. EUR, private sector) ..................... 68
Table 20: Social security pension payments Finland (in bn. EUR, public sector) ...................... 69
Table 21: Supplementary table Finland 2006 (PBO, in bn. EUR) ..................................................... 70
Table 22: Supplementary table Finland 2006 (ABO, in bn. EUR) ..................................................... 71
Table 23: Social security pension payments France (in bn. EUR) .................................................... 77
Table 24: Government employer pension payments France (in bn. EUR)................................... 77
Table 25: Supplementary table France 2006 (PBO, in bn. EUR) ....................................................... 78
Table 26: Supplementary table France 2006 (ABO, in bn. EUR) ....................................................... 79
Table 27: Social security pension payments Greece (in bn. EUR) ................................................... 83
Table 28: Supplementary table Greece 2006 (PBO, in bn. EUR) ...................................................... 84
Table 29: Supplementary table Greece 2006 (ABO, in bn. EUR) ...................................................... 85
Table 30: Social security pension payments Hungary (in bn. HUF) ............................................... 89
Table 31: Supplementary table Hungary 2006 (PBO, in bn. HUF) ................................................... 90
Table 32: Supplementary table Hungary 2006 (ABO, in bn. HUF) .................................................. 91
Table 33: Social security pension payments Italy (in bn. EUR) ......................................................... 96
VI
Table 34: Government employer pension payments Italy (in bn. EUR) ........................................ 97
Table 35: Supplementary table Italy 2006 (PBO, in bn. EUR) ............................................................ 97
Table 36: Supplementary table Italy 2006 (ABO, in bn. EUR) ............................................................ 98
Table 37: Social security and government employer pension payments Lithuania (in million
EUR) ...................................................................................................................................................................... 103
Table 38: Supplementary table Lithuania 2006 (PBO, in bn. EUR) ................................................ 104
Table 39: Supplementary table Lithuania 2006 (ABO, in bn. EUR) ............................................... 105
Table 40: Social security pension payments Latvia (in million LVL) ............................................. 110
Table 41: Supplementary table Latvia 2006 (PBO, in bn. LVL) ....................................................... 110
Table 42: Supplementary table Latvia 2006 (ABO, in bn. LVL) ....................................................... 111
Table 43: Social security and government employer pension payments Malta (in million
EUR) ...................................................................................................................................................................... 117
Table 44: Supplementary table Malta 2006 (PBO, in bn. EUR) ....................................................... 118
Table 45: Supplementary table Malta 2006 (ABO, in bn. EUR) ....................................................... 119
Table 46: Social security pension payments Netherlands (in bn. EUR) ....................................... 124
Table 47: Supplementary table Netherlands 2006 (PBO, in bn. EUR) .......................................... 125
Table 48: Supplementary table Netherlands 2006 (ABO, in bn. EUR) ......................................... 126
Table 49: Social security pension payments Poland (in bn. PLN) ................................................. 131
Table 50: Government employer pension payments Poland (in bn. PLN) ................................ 132
Table 51: Supplementary table Poland 2006 (PBO, in bn. PLN)..................................................... 133
Table 52: Supplementary table Poland 2006 (ABO, in bn. PLN) .................................................... 134
Table 53: Social security and government employer pension payments Portugal (in bn.
EUR) ...................................................................................................................................................................... 141
Table 54: Supplementary table Portugal 2006 (PBO, in bn. EUR) ................................................. 142
Table 55: Supplementary table Portugal 2006 (ABO, in bn. EUR) ................................................. 143
Table 56: Social security pension payments Sweden (in bn. SEK) ................................................ 148
Table 57: Supplementary table Sweden 2006 (PBO, in bn. SEK) ................................................... 149
Table 58: Supplementary table Sweden 2006 (ABO, in bn. SEK) ................................................... 150
Table 59: Social security and government employer pension payments Slovakia (in bn. SKK)
................................................................................................................................................................................ 156
Table 60: Supplementary table Slovakia 2006 (PBO, in bn. SKK) .................................................. 157
Table 61: Supplementary table Slovakia 2006 (ABO, in bn. SKK) .................................................. 158
Table 62: Social security pension payments United Kingdom (in bn. GBP) .............................. 162
Table 63: Supplementary table United Kingdom 2006 (PBO, in bn. GBP) ................................. 162
Table 64: Main determining factors of pension liabilities in the EU ............................................ 171
Table 65: Supplementary table Bulgaria 2007 (PBO, in bn. BGN) ................................................. 178
VII
VIII
Table 66: Supplementary table Bulgaria 2007 (ABO, in bn. BGN) ................................................. 178
Table 67: Supplementary table Germany 2007 (PBO, in bn. EUR) ................................................ 179
Table 68: Supplementary table Germany 2007 (ABO, in bn. EUR) ................................................ 179
Table 69: Supplementary table Spain 2007 (PBO, in bn. EUR) ....................................................... 180
Table 70: Supplementary table Spain 2007 (ABO, in bn. EUR) ....................................................... 180
Table 71: Supplementary table Finland 2007 (PBO, in bn. EUR) ................................................... 181
Table 72: Supplementary table Finland 2007 (ABO, in bn. EUR) ................................................... 181
Table 73: Supplementary table France 2007 (PBO, in bn. EUR) ..................................................... 182
Table 74: Supplementary table France 2007 (ABO, in bn. EUR) ..................................................... 182
Table 75: Supplementary table Greece 2007 (PBO, in bn. EUR) .................................................... 183
Table 76: Supplementary table Greece 2007 (ABO, in bn. EUR) .................................................... 183
Table 77: Supplementary table Hungary 2007 (PBO, in bn. HUF) ................................................. 184
Table 78: Supplementary table Hungary 2007 (ABO, in bn. HUF) ................................................ 184
Table 79: Supplementary table Lithuania 2007 (PBO, in bn. EUR) ................................................ 185
Table 80: Supplementary table Lithuania 2007 (ABO, in bn. EUR) ............................................... 185
Table 81: Supplementary table Latvia 2007 (PBO, in bn. LVL) ....................................................... 186
Table 82: Supplementary table Latvia 2007 (ABO, in bn. LVL) ....................................................... 186
Table 83: Supplementary table Malta 2007 (PBO, in bn. EUR) ....................................................... 187
Table 84: Supplementary table Malta 2007 (ABO, in bn. EUR) ....................................................... 187
Table 85: Supplementary table Netherlands 2007 (PBO, in bn. EUR) .......................................... 188
Table 86: Supplementary table Netherlands 2007 (ABO, in bn. EUR) ......................................... 188
Table 87: Supplementary table Poland 2007 (PBO, in bn. PLN)..................................................... 189
Table 88: Supplementary table Poland 2007 (ABO, in bn. PLN) .................................................... 189
Table 89: Supplementary table Portugal 2007 (PBO, in bn. EUR) ................................................. 190
Table 90: Supplementary table Portugal 2007 (ABO, in bn. EUR) ................................................. 190
Table 91: Supplementary table Sweden 2007 (PBO, in bn. SEK) ................................................... 191
Table 92: Supplementary table Sweden 2007 (ABO, in bn. SEK) ................................................... 191
Table 93: Supplementary table Slovakia 2007 (PBO, in bn. SKK) .................................................. 192
Table 94: Supplementary table Slovakia 2007 (ABO, in bn. SKK) .................................................. 192
Table 95: Supplementary table United Kingdom 2007 (PBO, in bn. GBP) ................................. 193
List of figures
Figure 1: Rescaled profile of average existing retirees’ benefits in 2006 (here: France, social
security, male) .................................................................................................................................................... 16
Figure 2: Phasing out of average existing retirees’ benefits profile from the year 2006 to
2045 (here: France, social security, male) ................................................................................................. 17
Figure 3: Rescaled profile of average new retirees’ benefits for 2006 (here: France, social
security, male) .................................................................................................................................................... 18
Figure 4: Build-up of average future (existing) retirees’ pension benefits profile from year
2006 to 2055 (here: France, social, security, male, values adjusted for growth and inflation)
.................................................................................................................................................................................. 19
Figure 5: Accrued-to-date amount of average future retirees’ pension benefits profile from
year 2006 to 2075 (here: France, values adjusted for growth and inflation) .............................. 20
Figure 6: Future pension expenditures (here: France, present value in 2006) .......................... 21
Figure 7: Population structure in Austria (2006), age groups 0 to 100 years ............................. 26
Figure 8: Development of elderly persons (aged 60+) in Austria, 2006=100 ............................ 27
Figure 9: Population structure in Bulgaria (2006), age groups 0 to 100 years ........................... 35
Figure 10: Development of elderly persons (aged 60+) in Bulgaria, 2006=100 ........................ 36
Figure 11: Insurable income in Bulgaria by age and sex (2006, in BGN) ...................................... 37
Figure 12: Population structure in the Czech Republic (2006), age groups 0 to 100 years .. 42
Figure 13: Development of elderly persons (aged 60+) in the Czech Republic, 2006=100 . 43
Figure 14: Population structure in Germany (2006), age groups 0 to 100 years ...................... 48
Figure 15: Development of elderly persons (aged 60+) in Germany, 2006=100 ...................... 49
Figure 16: Structure of Civil Servants’ population in Germany (2006) .......................................... 50
Figure 17: Development of elderly civil servants (60+) in Germany, 2006=100 ....................... 51
Figure 18: Population structure in Spain (2006), age groups 0 to 100 years .............................. 58
Figure 19: Development of elderly persons (aged 60+) in Spain, 2006=100 ............................. 59
Figure 20: Population structure in Finland (2006), age groups 0 to 100 years .......................... 64
Figure 21: Development of elderly persons (aged 60+) in Finland, 2006=100 ......................... 65
Figure 22: Population structure in France (2006), age groups 0 to 100 years ........................... 73
Figure 23: Development of elderly persons (aged 60+) in France, 2006=100 ........................... 74
Figure 24: Population structure in Greece (2006), age groups 0 to 100 years ........................... 80
Figure 25: Development of elderly persons (aged 60+) in Greece, 2006=100 .......................... 81
Figure 26: Population structure in Hungary (2006), age groups 0 to 100 years ........................ 87
Figure 27: Development of elderly persons (aged 60+) in Hungary, 2006=100 ....................... 88
Figure 28: Population structure in Italy (2006), age groups 0 to 100 years ................................ 93
IX
Figure 29: Development of elderly persons (aged 60+) in Italy, 2006=100 ................................ 94
Figure 30: Population structure in Lithuania (2006), age groups 0 to 100 years .................... 100
Figure 31: Development of elderly persons (aged 60+) in Lithuania, 2006=100 ................... 101
Figure 32: Population structure in Latvia (2006), age groups 0 to 100 years ........................... 107
Figure 33: Development of elderly persons (aged 60+) in Latvia, 2006=100 .......................... 108
Figure 34: Population structure in Malta (2006), age groups 0 to 100 years ............................ 112
Figure 35: Development of elderly persons (aged 60+) in Malta, 2006=100 ........................... 113
Figure 36: Gross average income in Malta by age and sex (2006, in EUR) ................................ 116
Figure 37: Population structure in the Netherlands (2006), age groups 0 to 100 years ...... 122
Figure 38: Development of elderly persons (aged 60+) in the Netherlands, 2006=100 ...... 123
Figure 39: Population structure in Poland (2006), age groups 0 to 100 years ......................... 127
Figure 40: Development of elderly persons (aged 60+) in Poland, 2006=100 ........................ 128
Figure 41: Population structure in Portugal (2006), age groups 0 to 100 years ...................... 136
Figure 42: Development of elderly persons (aged 60+) in Portugal, 2006=100 ..................... 137
Figure 43: Wage profile CGA (Portugal) by age (2006, in EUR) ...................................................... 140
Figure 44: Population structure in Sweden (2006), age groups 0 to 100 years ....................... 145
Figure 45: Development of elderly persons (aged 60+) in Sweden, 2006=100 ...................... 146
Figure 46: Population structure in Slovakia (2006), age groups 0 to 100 years ...................... 152
Figure 47: Development of elderly persons (aged 60+) in Slovakia, 2006=100 ...................... 153
Figure 48: Population structure in the UK (2006), age groups 0 to 100 years ......................... 159
Figure 49: Development of elderly persons (aged 60+) in the UK, 2006=100 ......................... 160
Figure 50: Cross-country comparison of pension liabilities 2006 (in per cent of GDP 2006,
PBO) ...................................................................................................................................................................... 165
Figure 51: Cross-country comparison of pension expenditures 2006 (in per cent of GDP
2006) .................................................................................................................................................................... 166
Figure 52: Cross-country comparison of the development of elderly persons (60+) 2006 to
2045 (2006 = 100), Euro area ...................................................................................................................... 167
Figure 53: Cross-country comparison of the development of elderly persons (60+) 2006 to
2045 (2006 = 100), non-Euro area ............................................................................................................. 168
Figure 54: Cross-country comparison of public pension expenditures 2006 to 2055
(present value 2006, in per cent of GDP 2006, PBO), Euro area ..................................................... 169
Figure 55: Cross-country comparison of public pension expenditures 2006 to 2055
(present value 2006, in per cent of GDP 2006, PBO), non-Euro area ........................................... 170
Figure 56: Public pension profile Austria: Average benefit per resident (2006, in EUR) ...... 194
Figure 57: Public pension profile Bulgaria: Average benefit per resident (2006, in BGN) ... 194
X
XI
Figure 58: Public pension profile Czech Republic: Average benefit per resident (2006, in
CZK) ...................................................................................................................................................................... 195
Figure 59: Social security pension profile Germany: Average benefit per resident (2006, in
EUR) ...................................................................................................................................................................... 195
Figure 60: Government employer pension profile Germany: Average benefit per member
of civil servants’ population (2006, in EUR) ........................................................................................... 196
Figure 61: Public pension profile Spain: Average benefit per resident (2006, in EUR) ......... 197
Figure 62: Public pension profile Finland (private sector): Average benefit per resident
(2006, in EUR) .................................................................................................................................................... 197
Figure 63: Public pension profile Finland (VaEL scheme): Average benefit per resident
(2006, in EUR) .................................................................................................................................................... 198
Figure 64: Public pension profile Finland (public sector except VaEL): Average benefit per
resident (2006, in EUR) .................................................................................................................................. 198
Figure 65: Public pension profile France: Average benefit per resident (2006, in EUR) ....... 199
Figure 66: Public pension profile Greece: Average benefit per resident (2006, in EUR) ...... 199
Figure 67: Public pension profile Hungary: Average benefit per resident (2006, in HUF) .. 200
Figure 68: Public pension profile Italy: Average benefit per resident (2006, in EUR) ............ 200
Figure 69: Public pension profile Lithuania: Average benefit per resident (2006, in EUR) . 201
Figure 70: Public pension profile Latvia: Average benefit per resident (2006, in LVL) ......... 201
Figure 71: Public pension profile Malta: Average benefit per resident (2006, in EUR) ......... 202
Figure 72: Public pension profile Netherlands: Average benefit per resident (2006, in EUR)
................................................................................................................................................................................ 202
Figure 73: Public pension profile Poland: Average benefit per resident (2006, in PLN) ...... 203
Figure 74: Public pension profile Portugal (general system): Average benefit per resident
(2006, in EUR) .................................................................................................................................................... 203
Figure 75: Public pension profile Portugal (CGA): Average benefit per resident (2006, in
EUR) ...................................................................................................................................................................... 204
Figure 76: Public pension profile Sweden: Average benefit per resident (2006, in SEK) ..... 204
Figure 77: Social security pension profile Slovakia: Average benefit per resident (2006, in
SKK) ....................................................................................................................................................................... 205
Figure 78: Government employer pension profile Slovakia: Average benefit per resident
(2006, in SKK) .................................................................................................................................................... 205
Figure 79: Public pension profile United Kingdom: Average benefit per resident (2006, in
GBP) ...................................................................................................................................................................... 206
List of abbreviations
ABO Accumulated benefit obligations
AOW Algemene Ouderdomswet (Dutch basic pension scheme)
ADL Accrued-to-date liabilities
AdL Alterssicherung der Landwirte (German old age security pension scheme for farmers)
AT Austria
BG Bulgaria
BGN Bulgarian Lev (national currency of Bulgaria)
bn. billion
CGA Caixa Geral de Aposentações (public employee pension scheme in Portugal)
CMFB Committee on Monetary, Financial and Balance of Payments Statistics
COLA Cost of living adjustment
CPI Consumer price index
CSSA Czech social security administration
CZ Czech Republic
CZK Czech Koruna (national currency of the Czech Republic)
DE Deutschland (Germany)
DRV Deutsche Rentenversicherung (general German old age security pension scheme)
ECB European Central Bank
EMU European Economic and Monetary Union
ERM European Exchange Rate Mechanism
ES Espana (Spain)
EU European Union
EUR Euro (European currency)
FDC Financial defined contribution
FER Pension scheme for farmers in Poland
FI Finland
FN Footnote
FR France
FUS Fundusz Ubezpieczen Spolecznych (Polish social insurance scheme)
GBP Pound Sterling (national currency of the United Kingdom)
GDP Gross domestic product
GR Greece
HU Hungary
XII
HUF Hungarian Forint (national currency of Hungary)
IAS Indexante de Apoios Sociais (measure of social support in Portugal)
IBO Indexed benefit obligations
IPD Implicit pension debt
IT Italy
KELA Pension regulation for employees of the social insurance institution Finland
KiEL Evangelical-Lutheran church pensions act
KuEL Local government pensions act Finland
LT Lithuania
LTL Lithuanian Litas (national currency of Lithuania)
LUTUL Farm closure allowance act Finland
LV Latvia
LVL Latvian Lats (national currency of Latvia)
m. million
MEL Seamen’s pensions act Finland
MIG Minimum income guarantee
MT Malta
MYEL Farmers’ pensions act Finland
NDC Non-financial defined contribution; notional defined contribution
NL Netherlands
NSSG National statistical service of Greece
OECD Organisation for Economic Co-operation and Development
PAYG Pay-as-you-go
PL Poland
PLN Polish Zloty (national currency of Poland)
PBO Projected benefit obligations
PT Portugal
RCG Research Center for Generational Contracts, Freiburg University
SE Sweden
SEK Swedish Krona (national currency of Sweden)
SHIW Survey on household income and wealth (Bank of Italy)
SK Slovakia
SKK Slovakian Koruna (national currency of Slovakia before January 1st, 2009)
SNA System of National Accounts
SS Seguridad Social (Spanish social security system)
XIII

XIV
SVB Soziale Verzekeringbank (administrative body of the Dutch AOW)
TyEL Employees pensions act Finland
UK United Kingdom
VaEL State employees’ pensions act Finland
VBL Versorgungsanstalt des Bundes und der Länder (supplementary pension scheme for public employees not being civil servants)
YEL Self-employed persons' pensions act Finland
ZUS Zaklad Ubezpieczen Spolecznych (Polish social insurance institution)
Introduction
1 Introduction
In most industrialised countries, issues concerning sound and sustainable finances are
ranking highly on the political agenda. The problem of sustainable fiscal policy, however,
always starts with the question of how to measure success. Traditional fiscal measures
based on cash-flow deficits and the sizes of outstanding debts are unreliable as indicators
of fiscal sustainability.1 Thus, the debt and deficit criteria for fiscal “harmonization” – the
so-called Maastricht criteria – may prove to be short-sighted and insufficient. This is due to
the fact that implicit liabilities such as future payments accruing in unfunded retirement or
health care systems are absent from current fiscal flows. In fact, only the sum of the explicit
debt accounted in official statistics and the implicit debt generated in pay-as-you-go
(PAYG) systems are able to reveal the whole extent of public debt.
With this study we are aiming to take a closer look at an important part of the implicit debt,
the pension obligations in EU countries. Several factors influencing the extent of pension
obligations have considerably changed in recent decades. Many government pension
schemes are now maturing; a lot of Western EU countries are facing the retirement of post-
war baby-boomers and thus, have one phenomenon in common: a significant process of
“double ageing” of the population. Due to the baby-boom followed by the subsequent
baby-bust during the post-war period and steady increases in life-expectancy, future
populations in these countries will dramatically change in their age structure. The
proportion of the elderly will increase because of low fertility and rising life expectancy.
Other EU countries – especially former members of the Warsaw Pact – show different
demographic developments than the ones mentioned above. In many cases, sharply
decreased fertility rates in the last 15 years combined with considerable differences in life
expectancy between men and women can be observed. The consequences of these
developments are described in the respective country chapters.
The instructing party of this project is the European Central Bank (ECB). After having
finished the pilot study in January 2008 which contained calculations of pension liabilities
for eight countries of the EU,2 the Research Center for Generational Contracts (RCG) was
instructed in June 2008 to carry out calculations for all countries represented in the
1 See European Commission (1999), p. 17 et sqq. for further explanations. 2 See Heidler, Raffelhueschen and Weddige (2008).
1
Introduction
2
Contact Group on Pensions.3 Thus, the scope of this project is to quantify the pension
obligations of government employer pension schemes and social security pension
schemes of 19 EU countries.4 These are eleven Euro area countries and eight states which
do not belong to the Euro Area. The project focuses on a standardized estimation of
accrued-to-date liabilities (ADL), i.e. the obligations that would have to be paid if the
systems were phased out immediately.
The report is organised as follows: Chapter 2 presents the methodology developed at the
RCG to calculate the accrued-to-date liabilities. Chapter 3 gives an overview of the general
assumptions as well as a description of the applied data. This includes information
regarding population data, age-specific pension benefits, growth and discount rates.
The following 19 chapters report our findings for the pension liabilities of the various
countries. We proceed in alphabetical order of country codes, starting with Austria (AT)
and ending with the United Kingdom (UK). All these chapters are structured in the same
manner. The first section gives an overview of the country’s demographic situation; the
second section describes the general characteristics of the countries’ pension systems. It
may be mentioned that not all pension schemes described in this part were taken into
account when calculating accrued-to-date liabilities. This is due to the fact that in this
report only pension schemes classified in the general government sector are considered.
Each of these chapters finishes with a presentation of our findings. All age-sex-specific
pension profiles used for calculations can be found in the appendix.
Chapter 23 compares the results of the former chapters showing the relative position of
each country concerning the accrued-to-date liabilities as a fraction of the country’s GDP.
Furthermore, the main determining factors for the level of pension liabilities are advised.
The last chapter of this report summarizes and gives a rough outline for further research in
the field of measuring pension liabilities.
3 The Contact Group on Pensions (referred to as the Contact Group from now on) has been established by the Committee for Monetary, Financial and Balance of Payments statistics (CMFB) in January 2008 to follow-up the work of the Eurostat/ECB Task Force on Pensions (referred to as the Task Force from now on), especially to derive estimates for obligations of pension schemes and social security classified in the general government of all EU countries. 4 It was originally intended to examine the pension schemes of all 27 EU countries. This has not been done due to problems in data supply.
Methodology
2 Methodology
2.1 Concepts for measuring implicit pension debt
Before beginning any calculation of implicit pension debt (IPD) it should be made perfectly
clear what kind of liability is referred to, and to which degree entitlements from private
households are included.5 In the relevant literature, three main definitions of pension
liabilities are well-established: 6
a) Accrued-to-date liabilities: these contain the actual pension payments and the
present value of pensions to be paid in the future on the basis of accrued rights; no rights
can be accrued after the base year - neither by present nor by future workers.
b) Current workers and pensioners’ liabilities: in this case allowance is made for the
pension scheme to continue its existence until the last contributor of today dies, while no
new entrants are allowed.
c) Open-system liabilities: these also include the present value of pensions of new
workers under current rules; the range of options extends from including only children not
yet in the labour force, to an infinite perspective.
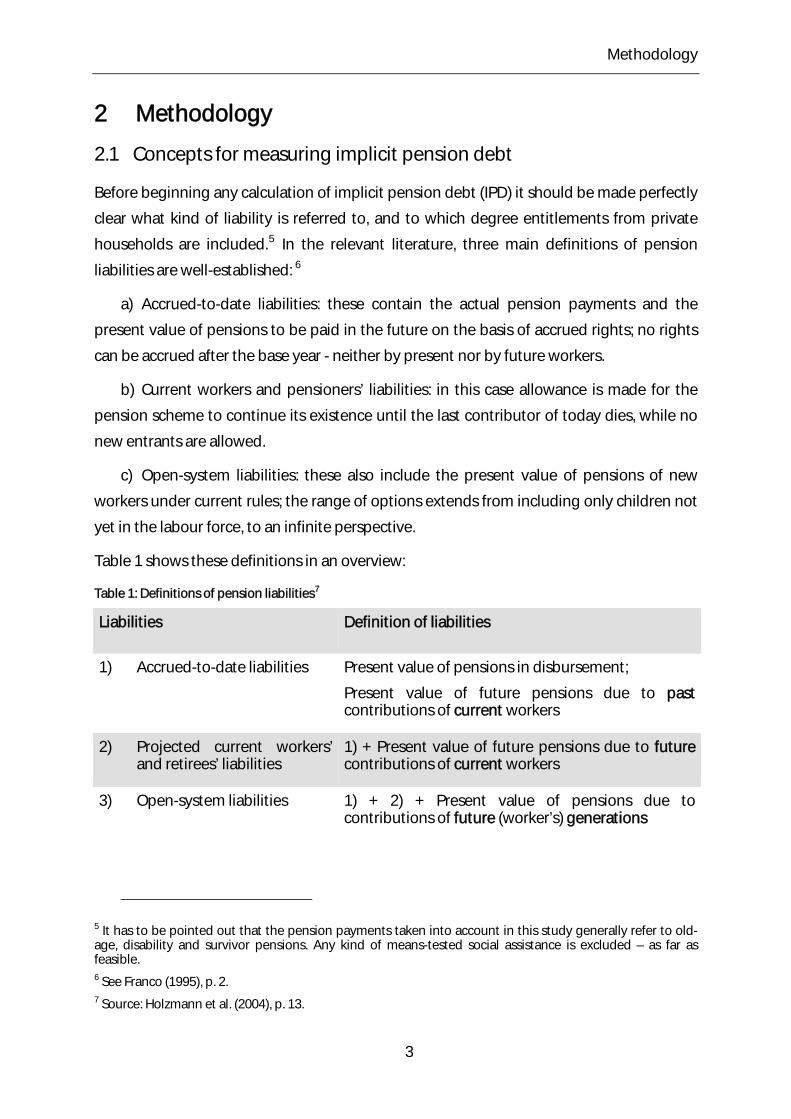
Table 1 shows these definitions in an overview:
Table 1: Definitions of pension liabilities7
Liabilities Definition of liabilities
1) Accrued-to-date liabilities Present value of pensions in disbursement;
Present value of future pensions due to past contributions of current workers
2) Projected current workers’ and retirees’ liabilities
1) + Present value of future pensions due to future contributions of current workers
3) Open-system liabilities 1) + 2) + Present value of pensions due to contributions of future (worker’s) generations
5 It has to be pointed out that the pension payments taken into account in this study generally refer to old-age, disability and survivor pensions. Any kind of means-tested social assistance is excluded – as far as feasible. 6 See Franco (1995), p. 2. 7 Source: Holzmann et al. (2004), p. 13.
3
Methodology
This table demonstrates that the difference between the three main definitions of pension
liabilities reflects alternative views on how future pension benefits should be considered.
For instance, looking at the concept of open-system liabilities, current pensioners and
workers as well as future workers (and thus all future retirees) are taken into consideration.
In contrast, accrued-to-date liabilities regard only rights accrued by existing and former
workers until the base year.
Looking at the definition of accrued-to-date liabilities one might come to the opinion that
except for projecting the population no assumptions regarding the future have to be
made – due to the fact that no entitlements can be accrued in the future.
However, this view is certainly wrong. First of all, almost every pension scheme features
some kind of indexation which adjusts the pensions to economic circumstances on a
regular basis. This means that pensions either grow in line with price inflation, per capita
wage growth, or a mixed index according to the corresponding benefit formula. Hence,
this index has to be estimated. Apart from that, in certain pension systems the indexation
does not depend on per capita wage growth but rather on general GDP growth. Thus an
assumption regarding the future development of GDP has to be made. Furthermore there
are pension systems like the general pension scheme in Germany where the indexation
depends on a factor which measures the relation between retirees and contributors
(known as the sustainability factor). In this case, an assumption regarding the future labour
market has to be taken. These examples show that even when applying the concept of
accrued-to-date liabilities as a supposedly safe concept without too many uncertainties, a
lot of assumptions regarding the demographic and economic developments have to be
made. The assumptions regarding this report are described in chapter 3.
2.2 Calculating accrued-to-date liabilities – the Freiburg model
The starting point for the calculation of the accrued-to-date liabilities with the Freiburg
model is the method of Generational accounting.8 In general this method can be used for
a wide variety of purposes. For this project, the method is applied for public pension
schemes9 in isolation and to the group of existing retirees and current contributors (future
8 This method was developed by Auerbach, Kotlikoff and Gokhale (1991, 1992 and 1994). See Raffelhüschen (1999) and Bonin (2001) for a detailed depiction of theory and application as well as limitations of the method of generational accounting. 9 The terms “public pension scheme”, “government pension scheme” and “pension scheme in general government” are used as synonyms. However, we differentiate between two different types of schemes. The government employer pension scheme indicates the pension scheme for civil servants, whereas the social security pension scheme describes a general pension scheme. For a discussion of the definition of government pension schemes see European Central Bank/Eurostat Task Force (2008), p. 20 et sqq.
4
Methodology
retirees) only. 10 Furthermore the standard method is modified in order to account for the
accrued-to-date amount of benefits instead of considering future pension benefits in total.
The core presumption is a projection of per capita future pension benefits based on
today’s existing retirees’ benefits. We outline below the entire calculation procedure of the
accrued-to-date liabilities of the government pension schemes in five steps.
Step 1: First of all, age-sex-specific projections of base year’s population need to be
calculated. The demographic model used to generate these projections is based on a
discrete and deterministic formulation of the cohort component method.11
The three major determinants of future population changes are in general fertility,
mortality, and migration. Since accrued-to-date liabilities regard only rights accrued by
existing and former workers until the base year, migration of the base year population are
irrelevant.12 The development of survival rates is considered by adjusting the initial set of
survival rates with an exponential adjustment procedure.13
Step 2: We start with the estimation of the average age-sex-specific existing retirees’
benefits in the base year. As mentioned before, the projection of these pension benefits is
the centre piece of the calculations since we develop the accrued-to-date claims by
manipulation of the existing retiree’s benefits. It has to be emphasized that in our
calculations we only look at average individuals within the respective age groups, i.e., we
do not separate groups of retirees. We rather separate the calculation of age-sex-specific
benefits for existing and future retirees assuming that individuals are on average to some
extent an existing and a future retiree in every age-year of their life-cycle.
Before going further into detail we briefly sketch out the projection approach for existing
retirees’ benefits. First of all, the benefits are calculated by distributing the aggregated
amount of today’s pension expenditures to the different cohorts in retirement age. By this
procedure we create an age-sex-specific benefits’ cross-section profile generated from the
budget and micro data of the observed country. Secondly, these average existing retirees’
10 For a close look on the application of generational accounting to public pension schemes see Heidler (2008). 11 For a detailed description of the demographic model applied see Bonin (2001). 12 In the pilot study of this project fertility rates were set to zero as well (see Heidler, Raffelhueschen and Weddige (2008)). However, from our current point of view this is not an adequate procedure as it disregards orphan’s pensions. Furthermore, there are regulations in certain pension schemes which make it necessary to include assumptions regarding fertility rates into our calculations (e.g. the sustainability factor in Germany, see chapter 2.1). Therefore fertility rates have been implemented in our calculations. 13 This procedure is suggested by Pflaumer (1988). See also Bonin (2001), p. 248.
5
Methodology
benefits are projected into the future by assuming that they remain constant except for
indexation of the benefits.
Formally, the estimation of the existing retirees’ benefits is based on the following identity:
(1) = −
= ∑ , ,
b
b bk b D
P pk b kC
This identity states that the sum of age-specific individual pension benefits pb,k (in the base
year b of the cohort born in k) weighted with the cohort size Cb,k must equal the
corresponding macroeconomic pension, denoted by Pb.14 The problem of equation (1) is
that it holds only in theory. While macroeconomic data, typically taken from national
accounting statistics, is relative exact, micro data is in general difficult to gather and tends
to be afflicted with inaccuracies. To resolve this problem generational accountants
estimate re-scaled age-sex-specific benefit profiles.
This is done in two steps. First, age-sex-specific information regarding per capita pension
benefits has to be collected in order to capture the relative fiscal position of different age
groups as accurately as possible. The vector of relative pension benefits by age taken from
the statistics, (τt,t-D, …τt,k, …, τt,t), is then denoted by τt,k.15 Note that this vector is supposed
to show only the relative pension position in period t of an individual born in the year k
and thus imposes less restriction on the accuracy and availability of micro data on the
absolute level. Second, the estimated relative age distribution is tallied with the
corresponding aggregate pension benefit Pb by application of a proportional, non-age-
specific benchmarking factor, denoted by ϕ. The relative distribution of pension payments
is re-evaluated according to
(2) ϕτ=, ,b k b k
p
for all living generations b-D ≤ k ≤ b, where ϕ is defined by
(3) ϕτ
= −
=∑ , ,
bb
b k b kk b D
P
C.
Equation (3) assures that Equation (1) is finally satisfied such that the expenditures to
existing retirees are assigned with age-sex-specific profiles to the base year population.
14 Please note that D represents the maximum age of an individual which is 100 years by our assumption. 15 For ease of notation we drop the sex-specific notation as from now on.
6
Methodology
Finally, the resulting rescaled average age-sex-specific existing retirees’ benefits are
projected according to the indexation rules of the respective country:
(4) −= +, ,
(1 )exis t b
t k b kp p g ,
for all cohorts b-D ≤ k ≤ b living in the base year.
This equation states that an individual already retired in base year b receives the same
pension in a specific year t as in the base year b, only corrected by the indexation g of
pension in payment. Furthermore equation (4) implies a “phasing out” of the stock of
existing pension benefits since it holds only for all living generations. Thus all existing
retirees’ pensions of the base year will have disappeared at latest when the youngest
existing retiree of the base year is dead.
Step 3: The age-sex-specific pension profile for future retirees, which is the basis for the
estimation of accrued-to-date entitlements, is calculated by manipulating the base year
existing retirees’ benefits. This is done in three steps. First, the difference of the existing
benefits for a consecutive age year (during the base year) provides the pension benefits for
new retirees.16 These are valorised for a specific year t. Second, if necessary, a deduction
factor is used (defined by a reform or for instance inherent like in NDC systems). Third, the
(cumulated) average future retirees’ benefits are calculated by summing up year-by-year
the new retirees’ benefits and thus accounting for the fact that an individual can receive on
average for any future year t a new retiree benefit.
Formally, the new retirees benefit in a specific year t for a cohort k is developed
firstly by calculating the absolute change in existing retirees benefit of the cohort b-(t-k)
(the cohort with the same age (t-k) in the base year b) to the cohort one year younger in
the base year, namely b-(t-1-k).
,
new
t kp
17 After that this base year payment is valorised with
( ) −+1
t b
v where v is the valorisation rate according to the benefit formula. On top on that
the new retirees’ benefits are diminished according to a deduction factor θ,t k
of the
benefit formula. Equation (5) sums up:
(5) θ −
− − − − −= − +⎡ ⎤⎣ ⎦, , , ( ) , ( 1 )(1 )new exis exis t b
t k t k b b t k b b t kp p p v
,
16 Note that new retirees’ benefits represent those benefits that are paid for the first time upon retirement in a specific year t>b. 17 Changes at latest after the age of 67 years are set to zero since new retirees’ old-age benefits after the age of 67 are negligible. However, this does not count for widow’s pensions.
7
Methodology
for all living cohorts b-D ≤ k ≤b.
Finally, the future (existing) retirees’ benefits need to be calculated. This is done by
cumulating year-by-year the respective equation (5). Therefore, the age-sex-specific
future retiree pension benefits for a specific year t of the cohort k is defined by:
,
new
t kp
(6) , −= + +
, 1,(1 )fut fut new
t k t k t kp p g p
,
for all cohorts b-D ≤ k ≤ b.
From this equation it follows that the average individual born in the year k receives a
future benefit in the year t (t>b) which is composed of the pension payment one period
earlier (t-1) corrected by the growth rate g plus the pensions paid to new retirees in this
year. Thus, the age-sex-specific benefit profile for future retirees builds up step by step.
Step 4: Now, in order to meet accrued-to-date liabilities, only the part of the future pension
benefits (of current workers) has to be considered which is earned until the base year. This
means in turn that must be cut by a factor ,
new
t kp λ
,t k representing the cohort-specific
amount of entitlements of current contributors in relation to the full entitlements.
Future pension benefits are thus finally defined by
(7) λ−= + +, 1, ,
(1 )fut fut new
t k t k t k t kp p g p
,,
for all cohorts b-D ≤ k ≤ b.
Note that the accrued-to-date concept requires a definition of the valorisation and
accruing process for the entitlements. HHAsH HaH H HHmatterH HofH H HHprincipleH there are several
possibilities to account for. Chapter X2.3X defines the two approaches applied in this survey.
Step 5: Finally, the accrued-to-date liabilities of the pension scheme are calculated by
discounting and summing up the above projected pension benefits over the cohorts living
in the base year.
Thus, the accrued-to-date liabilities ADLb can be expressed like this:
(8) +
−= = −
+=
+∑ ∑ , ,
,
( )
(1 )
exis futb D bt k t k
b tt bt b k b D
p pADL C
r k
This means that every period t the existing retirees pension benefits ( ) and the pension
rights accrued until the base year ( ) – which are both discounted by the factor (1+r) for
every future year (t-b) – are multiplied with the number of members of this age cohort Ct,k.
,
exis
t kp
,
fut
t kp
8
Methodology
This is done for every age-group, beginning with the ones born in k=b-D, which goes back
100 years prior to the base year.
2.3 Accumulated benefit obligations vs. projected benefit obligations
Regarding the difference between accumulated benefit obligations (ABO) and projected
benefit obligations (PBO), certain issues have to be clarified in order to get a clear
discussion basis. This refers to the theoretical definition of pension entitlements’
calculation on the one hand, and to the implementation of the difference between ABO
and PBO in our model on the other hand. We begin with the definition:
UDefinition of ABO and PBO
At first, it has to be made perfectly clear that the difference between ABO and PBO only
refers to the question of how to project entitlements of individuals not yet retired into the
future. This means that entitlements of individuals already receiving pensions in the base
year – and therefore already having earned full pension rights – are not influenced by the
choice between ABO and PBO at all.
When we speak of ABO, what we mean is ABO indexed for prices.18,19 If somebody has
worked 20 out of 40 years given the benefit formula is expressed in terms of final pay
(wage or salary) and years worked, ABO is half of the present value, given the discount rate,
of what the end-40 years' entitlement would be if no allowance is made for possible future
pay increases, whether from promotions or general increases in real pay rates. The real
value of the entitlement accrued to date is preserved at the time of maturity. It follows that
I) either estimates of price-indexed ABO must project future price increases and so
discount projected final price-indexed pay of 20 years ahead to the present, using a
nominal interest rate which includes the same expectation of inflation or, alternatively, II)
must use today's real pay as the projected real pay in 20 years' time, and discount back by a
real interest rate.
18 This definition is adapted from John Walton (member of the ECB/ Eurostat Task Force) who kindly took stand to the difference between ABO and PBO. He points out that “ABO indexed for prices” is often referred to as IBO (indexed benefit obligations). But due to the fact that IBO is also regarded as another form of PBO in some cases, we work with “ABO indexed for prices” which we call “ABO” in the future for simplification reasons. 19 Please note that both definitions are based on a benefit formula which depends on the final pay before retirement only. We are well aware of the fact that most of the European pension systems take into consideration a longer history of contributions when it comes to the calculation of first paid pensions. In this case, the difference between ABO and PBO also depends on how former contributions are considered in relation to present contributions, or in other words: How are former contributions valorized at the point of retirement?
9
Methodology
PBO is defined in the following way: It represents the entitlement today based on a
projection of eventual entitlements at retirement. Thus, after 20 years out of 40 years'
service, you calculate the pension amount induced by the projected final pay level after 40
years of service including the impact of likely promotions as well as general wage growth,
halve it (20 years out of 40), and express today's entitlement by discounting it. In addition
to promotions, the projection of eventual entitlements takes account of projected real
increases in pay at the current grade and other grades, up to the time of retirement.
Increases to reflect inflation are taken out, if the discount rate is expressed in real terms,
otherwise they are included both in projected final pay levels and the discount rate.
This means that when referring to PBO the only factor that reduces the employee’s
pension entitlement in comparison with the retiree’s pension entitlement is the smaller
amount of years into service – in our example 20 out of 40 years. When applying ABO, not
only the smaller amount of working years is taken into account, but also the generally
lower payment in that time, regardless if it stems from personal or general wage increases.
This leads to the assumption that PBO entitlements will in most cases be higher than ABO
entitlements, simply because ABO does not allow for future personal or general wage
increases.20
UImplementation of ABO and PBO
As described previously in this chapter, we estimate pension entitlements by calculating
future pension payments. This is – simplistically said – done by projecting present age-sex-
specific pension payments into the future, taking into account the indexation of the
respective pension scheme as well as any pension reforms which have been decided
already and will have an impact of future pensions. In order to receive the accrued-to-date
liabilities of a pension scheme, it is crucial to divide the beneficiaries of future pension
payments into two groups: The first group consists of persons who receive pension
payments already today. The members of this group dispose of full pension entitlements
due to the fact that they have already retired and are not able to increase their pensions by
paying contributions.21 It follows that in our model the pension payments of this group –
20 In an unlikely case of zero future wage increases – neither from promotions nor from increases of the general wage level – ABO and PBO entitlements would be the same. There are even situations imaginable where ABO entitlements could exceed PBO’s. This would be the case if either the general future real wage growth is assumed to be negative or if personal wage developments will decrease due to smaller wages for senior employees. 21 This counts only for pension schemes which do not allow their beneficiaries to increase their pension after retirement, i.e. by taking up employment, paying contributions and thus augmenting their pension entitlements.
10
Methodology
the “existing retirees” (or more precisely: persons who are already in retirement in the base
year) – are projected in line with the relevant indexation until the last retiree dies.
The second group consists of persons who do not receive pension payments yet. They
have earned some kind of pension entitlements in the past – regardless if they just took up
employment one year ago or if they are close before retirement – and will probably earn
more pension entitlements in the future, up to that point of time when they will retire. It
follows that this group does not dispose of full pension entitlements yet. The accrued-to-
date liabilities approach includes entitlements earned up to the base year only, therefore
the projected future pension payments of the “future retiree” (or more precisely: person
who will retire after the base year)22 has to be reduced. At that point the question of ABO
versus PBO enters the picture:
In a first step, we will distance ourselves from the accrued-to-date idea, just as it is
exercised in the model primarily. In every single year after the base year, new pensioners
will enter the pension scheme. The question to be answered first is what the amount of the
first paid benefit will be in relation to the new pensioners’ benefits in the base year. Let the
amount of first paid pension – sometimes referred to as the primary insurance amount
(PIA) – in the year be and the constant per-capita wage growth in real terms be .
When applying the PBO approach, the first paid pension will be defined like the following:
(9) + = +1
(1 )t t
x x g
Since is assumed to be constant over time, the first paid pension can also be expressed
subject to the base year .
(10) −
+ = +1
(1 )t b
t bx x g
When we change to the ABO approach, one has to bear in mind that no allowance is made
for future pay increases. In the current case, only the general wage growth is observed. It
follows that the first paid pension of a future year t in the ABO approach changes to:
(11) =t b
x x
The difference between equations (10) and (11) can be explained by the different
approaches of ABO and PBO. PBO takes into account general future wage growth while
22 Please note that “future retirees” involve all individuals that retire after the base year. In contrast to this, “new retirees” indicate individuals who retire in a certain year x in the future. Those individuals who retire in the year x will in that year enter the group of “future retirees”. In the year x +1 they will still be “future retirees” but not “new retirees” anymore.
11
Methodology
ABO does not consider any future changes of wage; the wage level of the base year is held
constant in real terms.23
The second difference between ABO and PBO can be observed when reducing the
primarily calculated full benefits of “new pensioners” according to the concept of accrued-
to-date liabilities. The full benefits are reduced by a vector – the “accrued-to-date vector” –,
which expresses the share of entitlements earned until the base year to the amount of
entitlements which qualifies for a full pension. This share is given for every projection year.
It is straightforward that the share decreases from a value close to one for primary
pensions paid out shortly after the base year up to a value of close to zero for primary
pensions paid out in the far future. This vector is multiplied with the respective accounts of
full pension entitlements and as an outcome we have the pension entitlements earned up
to the base year for every projection year, the accrued-to-date entitlements. The difference
between ABO and PBO in this regard is given by the different consideration of personal
wage increases during working life. Generally, the wage of an average individual is less
than the average wage at the beginning of a career and ends up somewhere above
average closely before retirement – PBO takes this effect into account, ABO does not.
Regarding the accrued-to-date vector in the PBO approach, only the missing amount of
contribution years has to be taken into account, due to the fact that the full pension
primarily calculated by the model includes assumptions for personal and general wage
growth. Let the average age of entering the work force and collecting first pension
entitlements be 20 years, and the average retirement age 60 years. It follows that for an
individual aged 35 in the base year, the PBO accrued-to-date entitlements add up to 15/40
of the full pension. According to this, the PBO accrued-to-date vector should show a value
of 15/40 for this age group.
Referring to the same example for the ABO approach, one does not only need to consider
the 25 missing years up to the point of retirement, but also the wage (which has not
developed up to the point of retirement) has to be taken into account. This means that in
most cases the entitlements of an individual aged 35 in the base year will be less than
15/40 of the full pension. The question of how large the difference between the ABO and
PBO accrued-to-date vector will be is answered by age-specific wage profiles from the
respective country which show the development of an average career’s wage.
23 It is crucial that this only counts for the calculation of the first paid pension or PIA. When projecting a benefit which has already been paid out before, i.e. the indexation of existing benefits, a constant real wage growth is assumed. In this regard the ABO approach displays a schizophrenic world where in one situation future wage growth is considered and in the other it is not.
12

Methodology
13
In summary the difference between ABO and PBO consists of two parts. The first part is the
general wage growth, in most cases connected to general economic growth. The second
part is the development of wage during an average career.
General assumptions and data description
3 General assumptions and data description
As we have already indicated, the empirical evaluation of the accrued-to-date liabilities
requires two projections. First, one needs a population projection of which the basic
principles will be described in Section 3.1. Secondly, the average pension benefits received
as well as the accrued-to-date future retirees benefits need to be estimated by age and sex.
The data required for this procedure are described in Section 3.2. Section 3.3 debates the
standard growth rate suitable to uprate base year per capita pension benefits, and
discusses the appropriate interest rate for discounting future payments.
This general data description is valid for all country studies presented subsequently. Where
country studies deviate from the outlined default procedure to cope with national
peculiarities, this is stated in the respective country chapter. Unless indicated otherwise, all
population data has been taken from Eurostat.24 Data regarding age- and sex specific
pension payments have been supplied by the members of the Contact Group, i.e. the
national statistical bodies or national central banks of the participating countries. This also
counts for data regarding aggregate pension payments. Thus, it is to some extent up to the
members of the Contact Group from the various countries, if only old-age pensions or
disability and survivor pensions as well are to be integrated in our calculations.
3.1 Population
At the outset of any calculation of implicit debt, projections of the base year population by
age and sex, which reach as much as a maximum of 100 years into the future, are the base
of the results presented in this study.25 Most EU member states publish population
projections conducted by their national statistical bodies. However, these official estimates
typically cover only a time span of 30 to 50 years and thus are not far-sighted enough to
meet the requirements of accrued-to-date liabilities. Therefore, it is necessary to conduct
our own projections which prolong official forecasts. The starting point of the population
projections used in this study is the population structure by age and sex observed at the
start of the respective base year 2005, 2006 or 2007. Following the component method,
the age composition of the population is updated in each year by first subjecting the initial
population structure to age-sex-specific mortality. Subsequently the respective age
specific birth rates are applied for every projection year. The implementation of the
24 See http://www.ec.europa.eu/eurostat. 25 According to the assumption that the maximum age is D=100.
14
General assumptions and data description
component method requires assumptions with respect to the future development of age-
specific mortality. As the standard case, all demographic projections are parameterised
according to the Eurostat population projections, trend scenario, national level, base year
2004, baseline variant (EUROPOP2004).26 Descriptions of the future demographic
developments of the various countries examined can be found in the particular country
chapters.
3.2 Age-specific pension benefits
This section describes the general assumptions for the projection of age-specific pension
benefits. Furthermore, we describe exemplarily input data by demonstrating step 2 to 5
described in Section 2.2 for the case of social security in France for average males (see
Figure 1 to Figure 5).27
As outlined in the previous chapter, the estimation of the base year average existing
retirees’ benefits by age is the centre piece of the projection. This is done by aggregating a
benefit profile by age and sex over the base year population and then re-evaluating it in a
way that the aggregates based on micro-profiles and population data correspond to the
respective government budget aggregates in the base year.28 The estimation of relative
age-profiles thus requires household or individual micro-statistics. The necessary data
were retrieved from micro-data surveys provided by national central banks or national
statistical bodies. The construction of relative age-profiles from these sources depends on
data accuracy and availability. Theoretically different profiles for different types of
pensions (old-age, disability and survivor pensions) as well as for the different pension
schemes (social security or government employer scheme) should be available and used
accordingly.
26 As Eurostat does not show life expectancy data for the year 2007, we had to draw on the assumptions of EUROPOP2004. As the up-to-date version EUROPOP2008 does not contain these assumptions, EUROPOP2004 is also employed for life expectancies in 2050, due to consistency reasons. We are aware of the fact that EUROPOP2008 assumptions feature higher life expectancies until 2050 than EUROPOP2004. Even without too much guessing it can be stated that the outcomes presented in this report would be higher when applying EUROPOP2008. 27 The employed pension profiles for all the countries examined in this survey can be found in the appendix. 28 Since our projection method does not correct aggregates for business cycle effects, base year economic performance is perpetuated indefinitely. This may lead to a bias. Nonetheless this effect seems not as critical in case of considering pension expenditures only since they are for the most part dominated by demography.
15
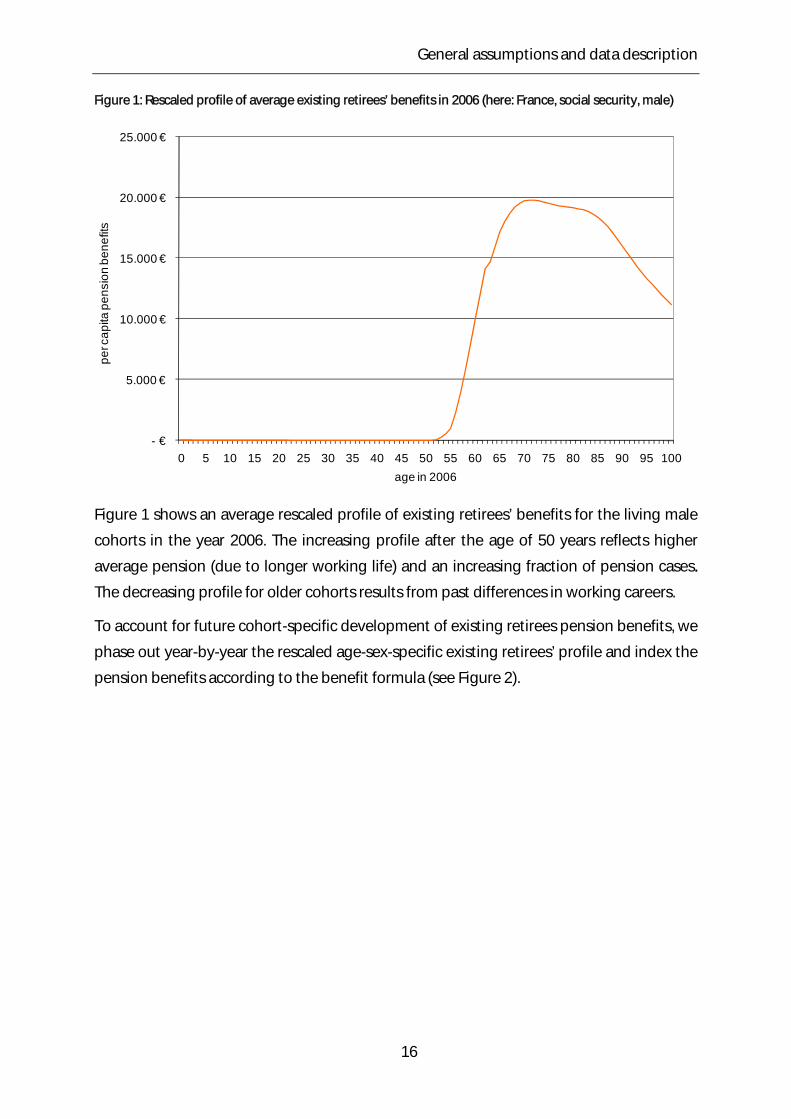
General assumptions and data description
Figure 1: Rescaled profile of average existing retirees’ benefits in 2006 (here: France, social security, male)
- €
5.000 €
10.000 €
15.000 €
20.000 €
25.000 €
0 5 10 15 20 25 30 35 40 45 50 55 60 65 70 75 80 85 90 95 100
per c
apita
pen
sion
ben
efits
fff
age in 2006
Figure 1 shows an average rescaled profile of existing retirees’ benefits for the living male
cohorts in the year 2006. The increasing profile after the age of 50 years reflects higher
average pension (due to longer working life) and an increasing fraction of pension cases.
The decreasing profile for older cohorts results from past differences in working careers.
To account for future cohort-specific development of existing retirees pension benefits, we
phase out year-by-year the rescaled age-sex-specific existing retirees’ profile and index the
pension benefits according to the benefit formula (see Figure 2).
16
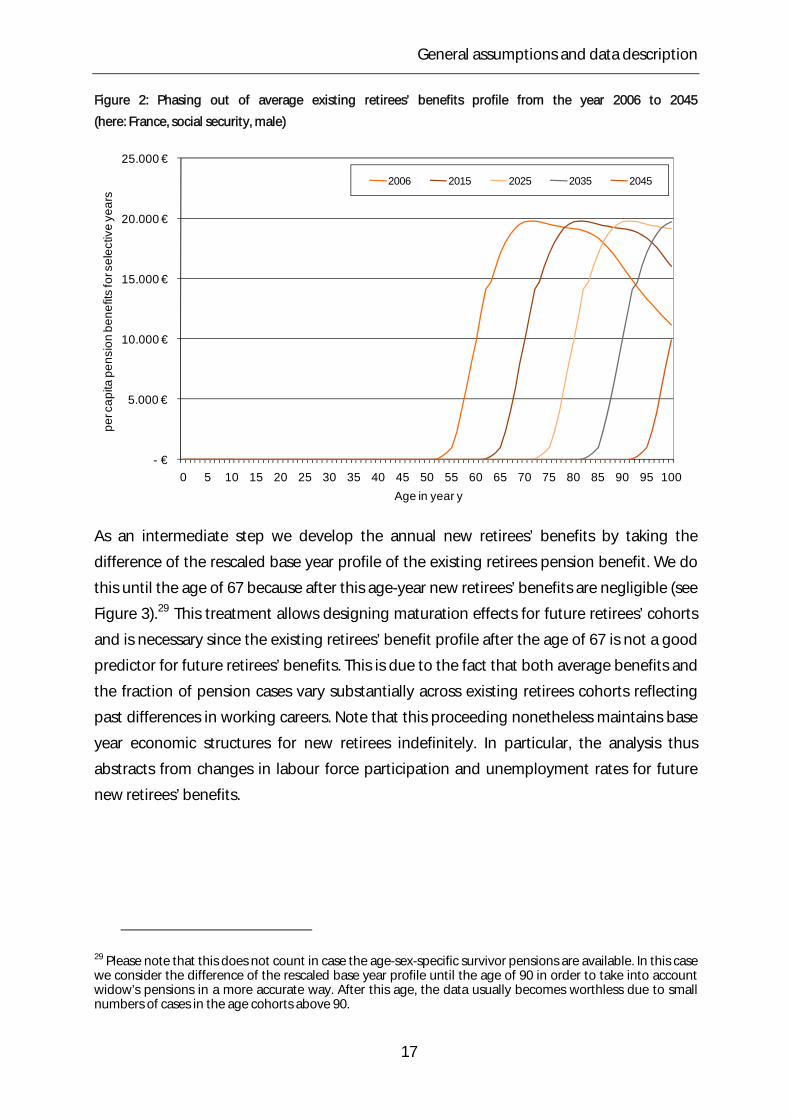
General assumptions and data description
Figure 2: Phasing out of average existing retirees’ benefits profile from the year 2006 to 2045
(here: France, social security, male)
- €
5.000 €
10.000 €
15.000 €
20.000 €
25.000 €
0 5 10 15 20 25 30 35 40 45 50 55 60 65 70 75 80 85 90 95 100
per c
apita
pen
sion
ben
efits
for s
elec
tive
year
sfff
Age in year y
2006 2015 2025 2035 2045
As an intermediate step we develop the annual new retirees’ benefits by taking the
difference of the rescaled base year profile of the existing retirees pension benefit. We do
this until the age of 67 because after this age-year new retirees’ benefits are negligible (see
Figure 3).29 This treatment allows designing maturation effects for future retirees’ cohorts
and is necessary since the existing retirees’ benefit profile after the age of 67 is not a good
predictor for future retirees’ benefits. This is due to the fact that both average benefits and
the fraction of pension cases vary substantially across existing retirees cohorts reflecting
past differences in working careers. Note that this proceeding nonetheless maintains base
year economic structures for new retirees indefinitely. In particular, the analysis thus
abstracts from changes in labour force participation and unemployment rates for future
new retirees’ benefits.
29 Please note that this does not count in case the age-sex-specific survivor pensions are available. In this case we consider the difference of the rescaled base year profile until the age of 90 in order to take into account widow’s pensions in a more accurate way. After this age, the data usually becomes worthless due to small numbers of cases in the age cohorts above 90.
17
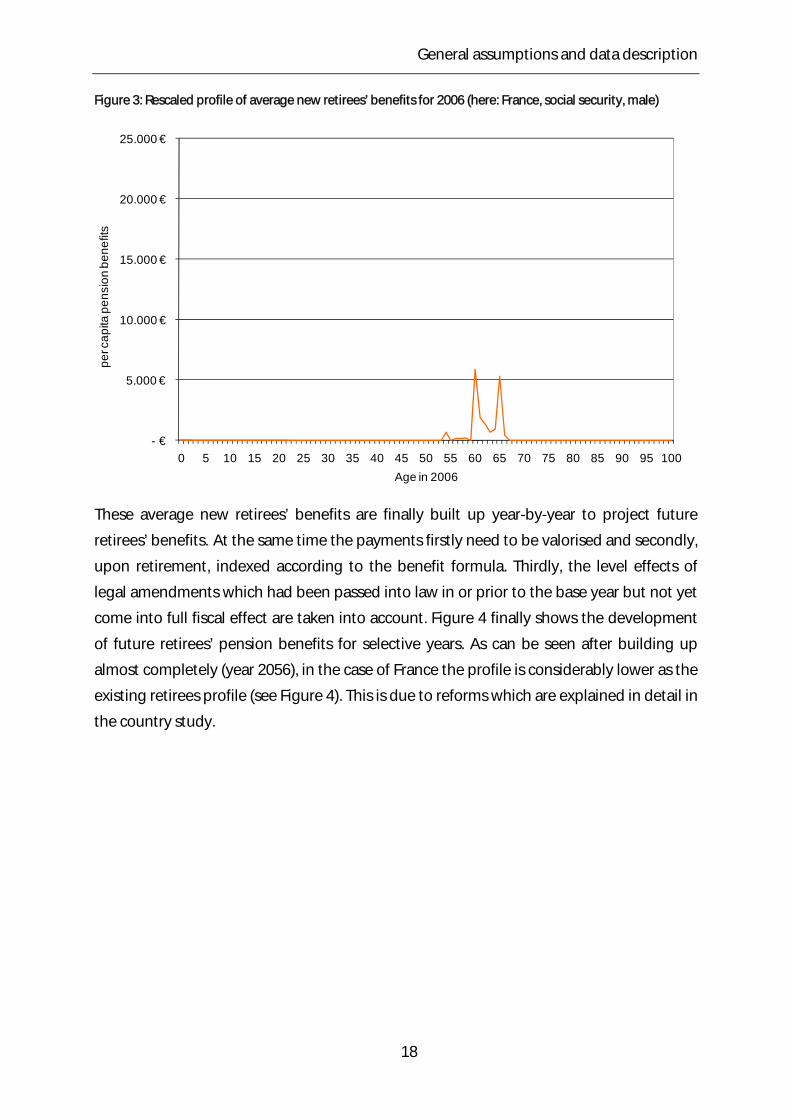
General assumptions and data description
Figure 3: Rescaled profile of average new retirees’ benefits for 2006 (here: France, social security, male)
- €
5.000 €
10.000 €
15.000 €
20.000 €
25.000 €
0 5 10 15 20 25 30 35 40 45 50 55 60 65 70 75 80 85 90 95 100
per c
apita
pen
sion
ben
efits
for
Age in 2006
These average new retirees’ benefits are finally built up year-by-year to project future
retirees’ benefits. F At the same time the payments firstly need to be valorised and secondly,
upon retirement, indexed according to the benefit formula. Thirdly, the level effects of
legal amendments which had been passed into law in or prior to the base year but not yet
come into full fiscal effect are taken into account. Figure 4 finally shows the development
of future retirees’ pension benefits for selective years. As can be seen after building up
almost completely (year 2056), in the case of France the profile is considerably lower as the
existing retirees profile (see Figure 4). This is due to reforms which are explained in detail in
the country study.
18
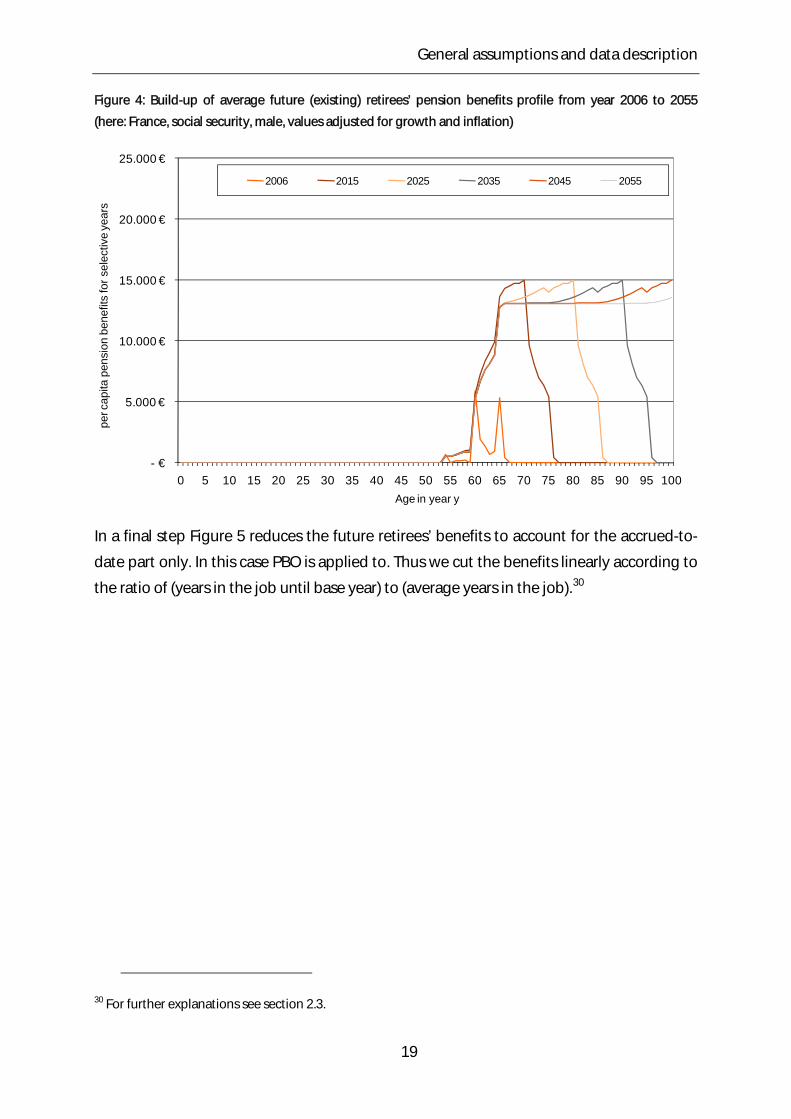
General assumptions and data description
Figure 4: Build-up of average future (existing) retirees’ pension benefits profile from year 2006 to 2055
(here: France, social security, male, values adjusted for growth and inflation)
- €
5.000 €
10.000 €
15.000 €
20.000 €
25.000 €
0 5 10 15 20 25 30 35 40 45 50 55 60 65 70 75 80 85 90 95 100
per c
apita
pen
sion
ben
efits
for s
elec
tive
year
sfff
Age in year y
2006 2015 2025 2035 2045 2055
In a final step Figure 5 reduces the future retirees’ benefits to account for the accrued-to-
date part only. In this case PBO is applied to. Thus we cut the benefits linearly according to
the ratio of (years in the job until base year) to (average years in the job).30
30 For further explanations see section 2.3.
19
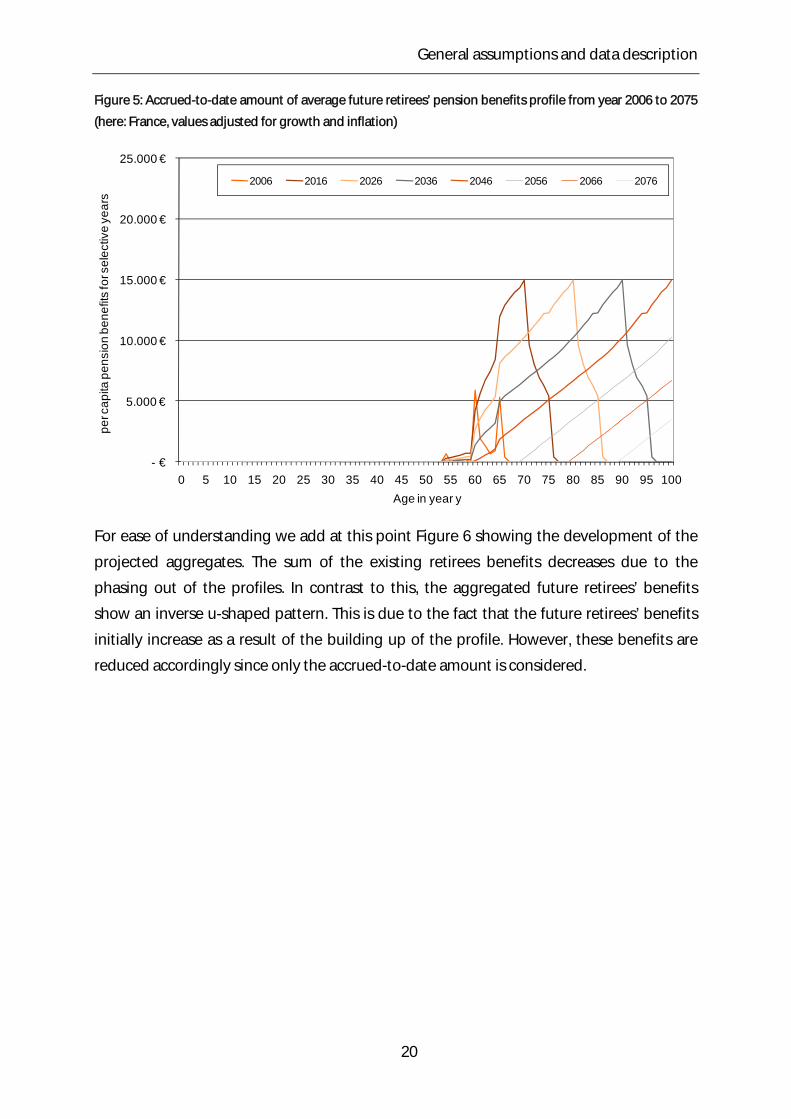
General assumptions and data description
Figure 5: Accrued-to-date amount of average future retirees’ pension benefits profile from year 2006 to 2075
(here: France, values adjusted for growth and inflation)
- €
5.000 €
10.000 €
15.000 €
20.000 €
25.000 €
0 5 10 15 20 25 30 35 40 45 50 55 60 65 70 75 80 85 90 95 100
per c
apita
pen
sion
ben
efits
for s
elec
tive
year
sfff
Age in year y
2006 2016 2026 2036 2046 2056 2066 2076
For ease of understanding we add at this point Figure 6 showing the development of the
projected aggregates. The sum of the existing retirees benefits decreases due to the
phasing out of the profiles. In contrast to this, the aggregated future retirees’ benefits
show an inverse u-shaped pattern. This is due to the fact that the future retirees’ benefits
initially increase as a result of the building up of the profile. However, these benefits are
reduced accordingly since only the accrued-to-date amount is considered.
20
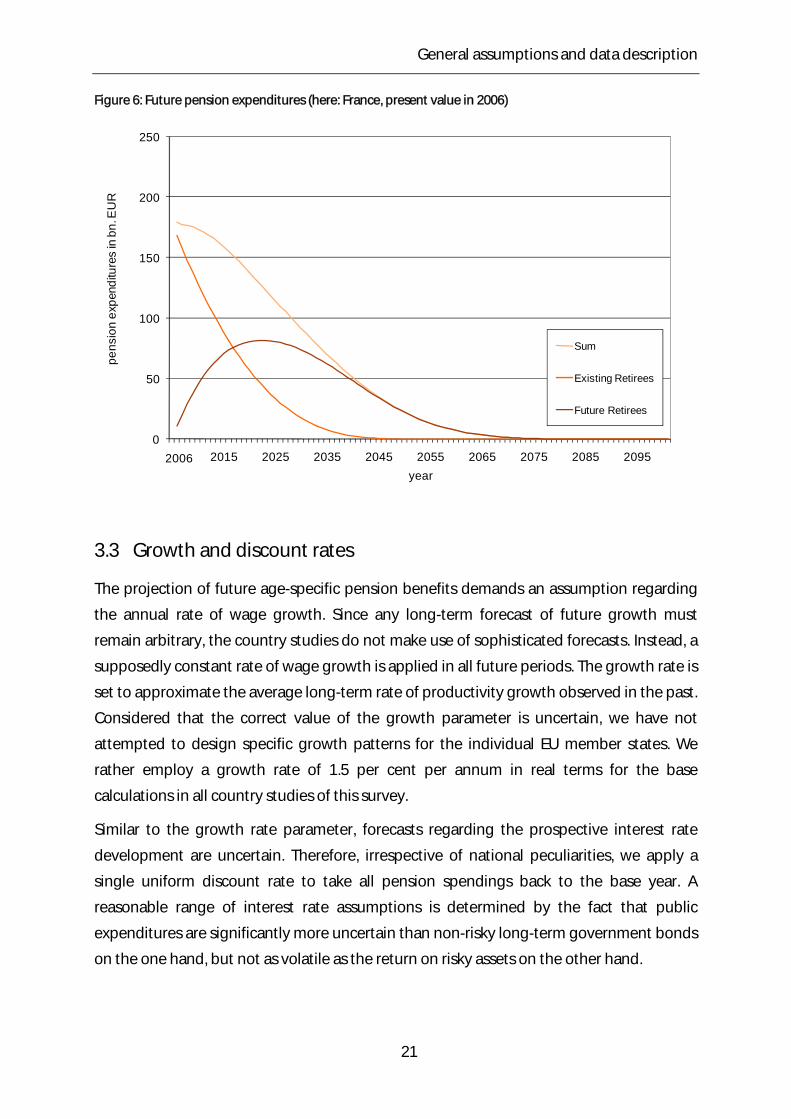
General assumptions and data description
Figure 6: Future pension expenditures (here: France, present value in 2006)
0
50
100
150
200
250
2015 2025 2035 2045 2055 2065 2075 2085 2095
pens
ion
expe
nditu
res
in b
n. E
UR
fff
year
Sum
Existing Retirees
Future Retirees
2006
3.3 Growth and discount rates
The projection of future age-specific pension benefits demands an assumption regarding
the annual rate of wage growth. Since any long-term forecast of future growth must
remain arbitrary, the country studies do not make use of sophisticated forecasts. Instead, a
supposedly constant rate of wage growth is applied in all future periods. The growth rate is
set to approximate the average long-term rate of productivity growth observed in the past.
Considered that the correct value of the growth parameter is uncertain, we have not
attempted to design specific growth patterns for the individual EU member states. We
rather employ a growth rate of 1.5 per cent per annum in real terms for the base
calculations in all country studies of this survey.
Similar to the growth rate parameter, forecasts regarding the prospective interest rate
development are uncertain. Therefore, irrespective of national peculiarities, we apply a
single uniform discount rate to take all pension spendings back to the base year. A
reasonable range of interest rate assumptions is determined by the fact that public
expenditures are significantly more uncertain than non-risky long-term government bonds
on the one hand, but not as volatile as the return on risky assets on the other hand.
21
General assumptions and data description
We have opted here for the lower bounds of the discount rate. Therefore we chose a
standard real discount rate of three per cent per annum, which reflects the ten-year
average of Euro area ten-year government bond yields.
At this point it is worth mentioning that the use of a constant discount rate implies a
serious simplification. It postulates that risk attitude is identical for all generations, and
remains constant over their life cycle. In general, more comprehensive sensitivity analyses
could take account for this variation. This also counts for the other key economic
parameters (unemployment rates and participation rates respectively), or changes in fiscal
policy, as well as likely changes in the behaviour of economic actors. Nevertheless, it seems
that for the scope of this project these further sensitivity analyses are beyond the scale of
the cross-country comparisons conducted in this report.
22
General assumptions and data description
BOX 1: The supplementary table31
One of the aims of the Task Force was to design a supplementary table on pensions which
is supposed to be included in the updated System of National Accounts (SNA). In this table,
all flows and stocks of all pension schemes (autonomous pension funds, segregated non
autonomous employer schemes, pension part of social security, etc.) are supposed to be
displayed. It will thus include details of pension flows and stocks that are recorded in the
core accounts plus those that are not included in the core accounts also giving a complete
view of households’ pension “assets”. In this report, liabilities have been calculated only for
general government pension schemes on the one hand and social security pension
schemes on the other hand (both currently not being included in the core accounts).
Therefore only the columns G and H of the supplementary table are relevant.32 These are
the columns shown in Table 2.
A brief description of the various rows of the supplementary table follows: The rows of the
table relate to balance sheet positions, transactions and other economic flows associated
with pension entitlements of the schemes included in the supplementary table. Row 1 and
row 10 show the opening stock (which is equal to the closing stock of the previous year)
and the closing stock of pension entitlements for the respective year. To allow meaningful
comparisons across EU member states, pension entitlements at the end of the year
(row 10) are related to countries’ respective GDP in that year as well. This value is indicated
underneath row 10. Row 2 sums up the different kinds of social contributions which can be
divided into Employer actual social contributions (row 2.1), Employer imputed social
contributions (row 2.2)33, Household actual social contributions (row 2.3), and Household
social contribution supplements (row 2.4). Row 2.4 can be regarded as the property
income of the households and is equal to the unwinding of the nominal discount rate.34
31 This box is based on chapter 3.2 of European Central Bank/Eurostat Task Force (2008). 32 Please note that in our supplementary table column G is not labeled entirely adequate. It should read general government employer pension scheme instead of general government only. This counts in general for supplementary tables displayed in this report. 33 For defined benefit schemes, employer imputed social contributions are generally measured as the balancing item – any changes in entitlements over the year not included in other rows of the table are captured here. This row would capture any "experience effects" where the observed outcome of pension modelling assumptions (real wage growth rate, discount rate) differs from the levels assumed. For social security pension schemes, Employer imputed social contributions as per definition do not exist, therefore this cell is blacked. 34 For all calculations, we assume a constant discount rate of 3.0 per cent and an inflation rate of 2.0 per cent (where necessary). Thus the nominal discount rate applicable here is 5.0 per cent. The (fictitious) property income is then estimated by taking the average of the opening and closing stock of entitlements as a basis and in a second step discounting this by 5.0 per cent.
23
General assumptions and data description
Row 3 is solely associated with imputed transactions of social security pension schemes
whereas row 4 represents the pension benefits paid during the year. Row 5 is intended to
simply present the changes in pension entitlements due to contributions and benefits.
Rows 6 to 9 show changes in volume due to transfers between pension schemes, changes
of assumptions like discount rate, wage growth or life expectancy, and other economic
flows. However, due to the fact that on the one hand constant discount and wage growth
rates are assumed in this report, while on the other hand no transfers between schemes or
other changes in volume are taken into account; these rows will be zero in the following
country-specific presentations. The exception of this rule is a pension reform which was
passed in the year which the supplementary table represents. In that case the impact of
this reform on the pension liabilities will be displayed in row 7.
It may be added that figures taken from national accounts are encoded in white colour.
Figures calculated by the RCG are marked grey whereas cells which are not applicable in
the respective pension scheme are shown in black (see Table 2).
Furthermore it is worth mentioning that in both cases – government employer pension
schemes as well as social security pension schemes – there is a cell which accounts for the
residual of the respective column. In case of government employer pension schemes
(column G), this cell can be found in row 2.2 (Employer imputed social contributions); in
social security pension schemes (column H), the residual is shown in row 3 (Other
(actuarial) increase of pension entitlements). This residual can be either positive or
negative, and there are various interpretations for a high or low (or even negative) value in
these cells. One might argue that in case of a positive value the government (as the
organizer of the pension schemes in both columns) is forced to compensate for that part of
the difference between opening and closing stock of pension liabilities which is not
levelled by the actual contributions less the pensions paid in that year. But this is just one
possible explanation, and as the final interpretation of the supplementary table does not
belong to the main goals of this report, this issue should rather be passed on to the Task
Force or more specifically to the Contact Group itself.
24
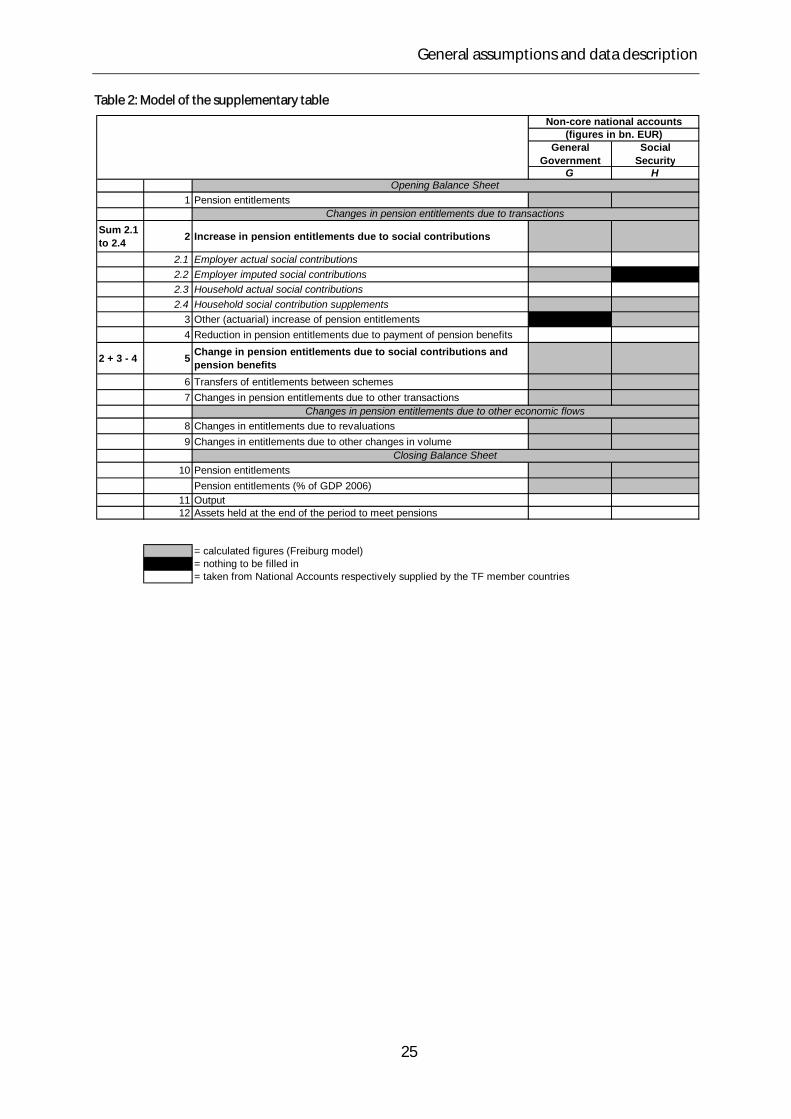
General assumptions and data description
Table 2: Model of the supplementary table
General Government
Social Security
G H
1 Pension entitlements
Sum 2.1 to 2.4 2 Increase in pension entitlements due to social contributions
2.1 Employer actual social contributions2.2 Employer imputed social contributions2.3 Household actual social contributions2.4 Household social contribution supplements
3 Other (actuarial) increase of pension entitlements4 Reduction in pension entitlements due to payment of pension benefits
2 + 3 - 4 5 Change in pension entitlements due to social contributions and pension benefits
6 Transfers of entitlements between schemes7 Changes in pension entitlements due to other transactions
8 Changes in entitlements due to revaluations9 Changes in entitlements due to other changes in volume
10 Pension entitlementsPension entitlements (% of GDP 2006)
11 Output12 Assets held at the end of the period to meet pensions
= calculated figures (Freiburg model)= nothing to be filled in = taken from National Accounts respectively supplied by the TF member countries
Closing Balance Sheet
Non-core national accounts(figures in bn. EUR)
Changes in pension entitlements due to transactions
Changes in pension entitlements due to other economic flows
Opening Balance Sheet
25
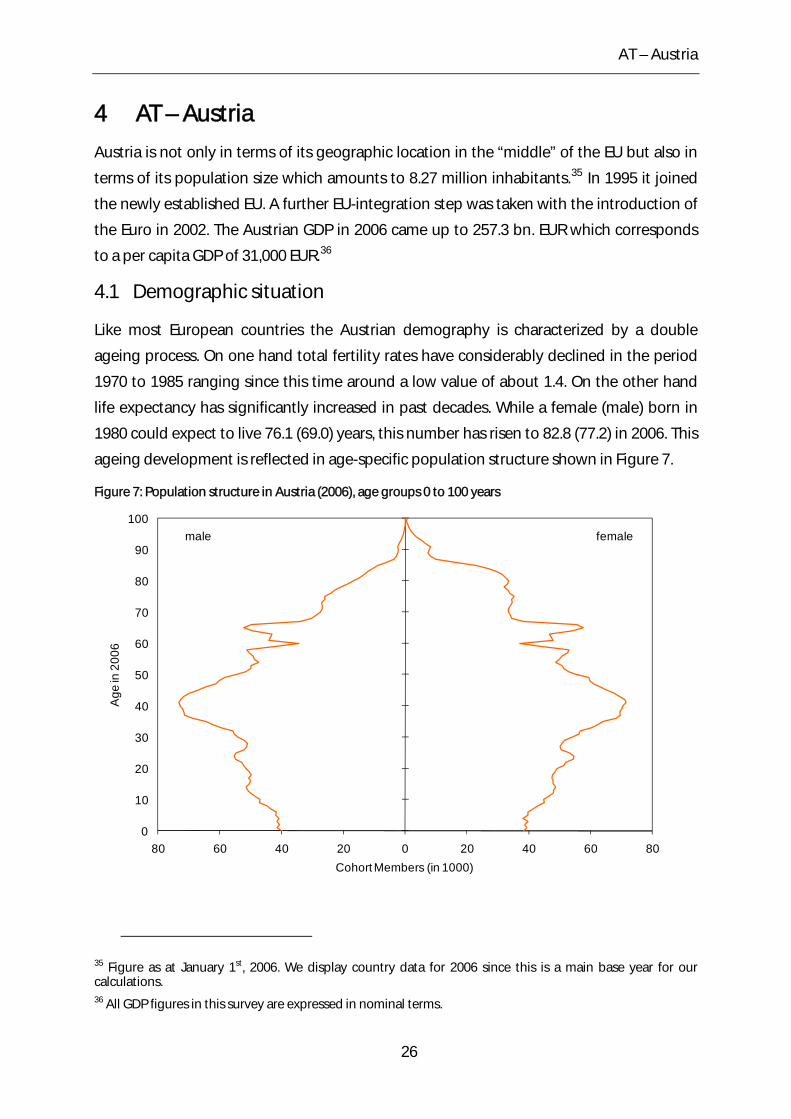
AT – Austria
4 AT – Austria
Austria is not only in terms of its geographic location in the “middle” of the EU but also in
terms of its population size which amounts to 8.27 million inhabitants.35 In 1995 it joined
the newly established EU. A further EU-integration step was taken with the introduction of
the Euro in 2002. The Austrian GDP in 2006 came up to 257.3 bn. EUR which corresponds
to a per capita GDP of 31,000 EUR.36
4.1 Demographic situation
Like most European countries the Austrian demography is characterized by a double
ageing process. On one hand total fertility rates have considerably declined in the period
1970 to 1985 ranging since this time around a low value of about 1.4. On the other hand
life expectancy has significantly increased in past decades. While a female (male) born in
1980 could expect to live 76.1 (69.0) years, this number has risen to 82.8 (77.2) in 2006. This
ageing development is reflected in age-specific population structure shown in Figure 7.
Figure 7: Population structure in Austria (2006), age groups 0 to 100 years
0
10
20
30
40
50
60
70
80
90
100
80 60 40 20 0 20 40 60 80
Age
in 2
006
Cohort Members (in 1000)
femalemale
35 Figure as at January 1st, 2006. We display country data for 2006 since this is a main base year for our calculations. 36 All GDP figures in this survey are expressed in nominal terms.
26
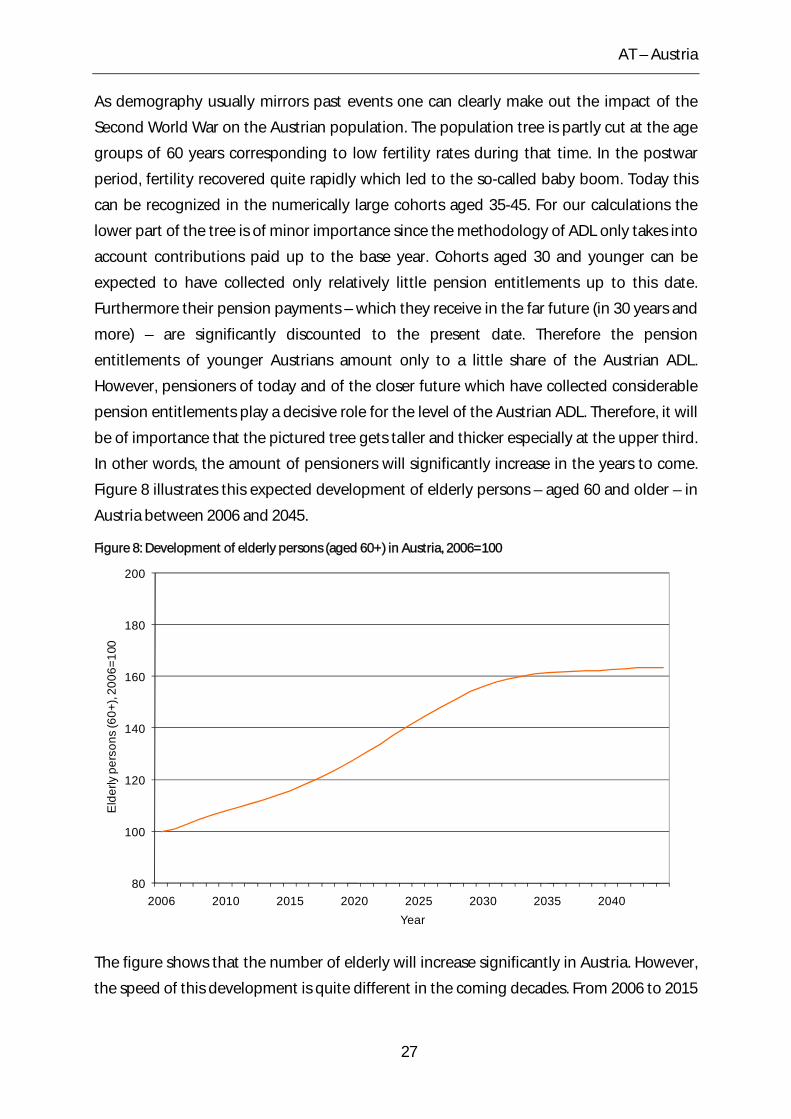
AT – Austria
As demography usually mirrors past events one can clearly make out the impact of the
Second World War on the Austrian population. The population tree is partly cut at the age
groups of 60 years corresponding to low fertility rates during that time. In the postwar
period, fertility recovered quite rapidly which led to the so-called baby boom. Today this
can be recognized in the numerically large cohorts aged 35-45. For our calculations the
lower part of the tree is of minor importance since the methodology of ADL only takes into
account contributions paid up to the base year. Cohorts aged 30 and younger can be
expected to have collected only relatively little pension entitlements up to this date.
Furthermore their pension payments – which they receive in the far future (in 30 years and
more) – are significantly discounted to the present date. Therefore the pension
entitlements of younger Austrians amount only to a little share of the Austrian ADL.
However, pensioners of today and of the closer future which have collected considerable
pension entitlements play a decisive role for the level of the Austrian ADL. Therefore, it will
be of importance that the pictured tree gets taller and thicker especially at the upper third.
In other words, the amount of pensioners will significantly increase in the years to come.
Figure 8 illustrates this expected development of elderly persons – aged 60 and older – in
Austria between 2006 and 2045.
Figure 8: Development of elderly persons (aged 60+) in Austria, 2006=100
80
100
120
140
160
180
200
2006 2010 2015 2020 2025 2030 2035 2040
Eld
erly
per
sons
(60+
), 20
06=1
00
Year
The figure shows that the number of elderly will increase significantly in Austria. However,
the speed of this development is quite different in the coming decades. From 2006 to 2015
27
AT – Austria
the rise in the number of elderly people is quite modest. As pointed out above this aspect
is relevant for the ADL calculated in this report. From 2015 to 2033 the slope becomes
steeper with increasingly larger cohorts reaching the age of 60. Not only the population
structure of 2006 can explain this rise in the number of elderly people but also the further
increase in life expectancy. According to the assumptions of Eurostat, male (female) born
in 2050 will live about five (six) years longer than their counterparts born in 2006. By 2033
there will be about 60 per cent more representatives of the age groups 60 and older. Only
after 2033 this rise will considerably slow down when all baby boomers have reached the
age of 60. But – as has been pointed out above – this deceleration will have little impact on
the ADL. Summing up, the number of future pensioners (people aged 60+) will
considerably increase in Austria in the coming decades with a slow start (2006-2015) and a
steep rise until 2033. In comparison to the other countries examined in this report the
Austrian ageing process represents the average.
4.2 General characteristics of the pension system
As most Bismarckian Systems, the Austrian pension system is strongly dominated by the
first pillar which is mandatory and based on a PAYG system. The second pillar
(occupational pensions) and the third pillar (private pension plans) play a minor but
increasing role for the Austrian old age provisions. Since the first pillar will be subject of
our calculations, it shall be described in more detail. Up to 2005, the public PAYG scheme
consisted of numerous different schemes for distinct occupational groups – reflecting the
historical development of the Austrian pension system. With the harmonization law of
2004 a uniform pension system for all employed under 50 years has been introduced. This
new pension system will gradually replace the many different pension schemes for self-
employed, civil servants, farmers and for private sector workers.
In the uniform pension system entitlements are subject to individual life-time earnings.
The maximum benefits of 80 per cent of average earnings are accrued at the statutory
retirement age of 65 years if one has collected 45 years of insurance years. While past
contributions are indexed by net wage growth, pension benefits are annually adjusted
according to consumer price index (CPI).
4.3 Recent reforms of the pension system
Triggered by present budgetary pressure and by future demographic challenges Austria
passed substantial pension reforms in the last years. With the reform of 2000 early
retirement ages were increased in the general schemes from 55 (60) to 56.5 (61.5) years for
women (men). Furthermore disability early retirement was abolished.
28
AT – Austria
Key parameters of the Austrian pension system have been considerably changed with the
reform of 2003. One of its main elements was the gradual increase (until 2033) of the
statutory retirement age for women to the present value of men: 65 years of age.
According to our estimations this part of the 2003 reform will reduce the Austrian ADL by
about two per cent of GDP in 2006.37 Moreover, the base of average earnings for the
pension calculation will be gradually extended from 15 to 40 years (until 2028) with the
reform of 2003. We assume that this reform step will reduce pension benefits by about six
per cent.38 Furthermore the accrual rate will be lowered from two to 1.78 until 2009, which
causes a reduction of pension benefits of eleven per cent. As a result the maximum
replacement rate of 80 per cent will be reached after an insurance history of 45 instead of
40 years. However, alongside a cap on pension losses was adopted. According to this
legislation, a pension granted as of 2004 may only be ten per cent lower than a
comparable pension granted at the end of 2003.39 Finally, the reform of 2003 consisted of
measures to further reduce early retirement in Austria including the abolishment of early
retirement on account of unemployment, raising further minimum age for long-term
insured men (women) to 65 (60) until 2017 as well as increasing pension deductions for
earlier retirement.
Alongside the pension system of tenured civil servants has been reformed in 2003. This
reform mirrors the steps taken in the private sector pension scheme. Thus, the period of
the assessment base has been increased to 40 years (with a transition period until 2028)
and the annual accrual rate has been reduced. Furthermore the statutory retirement age
for civil servants has been increased to 65 and discount rates for early retirement at age
61.5 years have been introduced.
Cornerstones of the latest major reform of 2004, effective since 2005, were the
introduction of a uniform pension system for all employed under 50 years and the
introduction of a new system of individual transparent pension accounts with the guiding
formula of 45/65/80 (i.e. the first pillar guarantees a pension benefit of 80 per cent of the
assessment base after 45 years of insurance and at the statutory retirement age of 65
years). Alongside the cap on pension losses was reduced to five per cent and will only
gradually be increased to ten per cent until 2024. It should be mentioned that this cap
37 This reform only has a minor impact on the Austrian pension liabilities since it only affects women born after 1963. 38 Due to a lack of data the value of a six per cent reduction is derived by using German age-sex-specific earning profiles. 39 This cap does not apply to pension losses due to changes in the early retirement provision.
29
AT – Austria
significantly offsets the cost savings achieved with the latest reforms. Thus, future pensions
in our calculations are also only cut to a maximum limit of ten per cent (by 2028).
Moreover, within the framework of the 2004 reform a sustainability factor has been
introduced into the Austrian pension system. However, this factor has only little in
common with its German or Portuguese counterparts. It only has an impact on future
pension benefits if life expectancies deviate from the medium forecast of Statistics Austria.
In our calculations we are not expecting such a deviation. Thus, the Austrian sustainability
factor – in contrast to the German or Portuguese one - has no impact on our results. The
reform of 2004 also changed the crediting of non-contributory periods such as child-care
times or military service. Due to a lack of data we did not take into account this reform step
in our calculations. Furthermore the possibility of early pension has been introduced
through the establishment of a pension corridor. Retiring between 62 and 68 is either
rewarded by pension credits in case of postponed retirement or discouraged by pension
discounts when retiring early. Credits as well as discounts amount to 4.2 per cent of the
assessment base per year.40 However, individuals who pursue a profession regarded as
extraordinarily straining are allowed to retire earliest at the age of 60 with a discount ratio
of 2.1 per cent. Moreover, the reform of 2004 on one hand replaced the inflation oriented
revaluation of pension entitlements by a method based on the average increase of the
respective contribution basis. On the other hand pensions will be indexed (from 2006 on)
according to CPI.
4.4 Results
In contrast to all other countries examined in this report except the UK, we did not receive
any data supply from Austria – apart from the budget data shown below. The age- and sex-
specific micro data for the pension system stems from the “Hauptverband der
österreichischen Sozialversicherungsträger”.41 The respective profile figures can be found
in the annex of this report.42
40 However, this rule only applies if at least 450 insurance months have been acquired. Furthermore discounts (credits) cannot exceed 15 (12.6) per cent of pension benefits. Losses from actuarial deductions are excluded from the loss cap of ten per cent. 41 Precisely the data on Austrian pension payments and beneficiaries by age and sex is taken from the “Pensionsversicherung – Jahresstatistik 2006” published by the Hauptverband der österreichischen Sozialversicherungsträger (2008). 42 Due to a lack of data we first of all assumed that the age-sex‐specific pension profiles of government employer pensions are relatively the same as in the social security pension system. The relative profiles thereafter have been scaled by the aggregated budget data of the government employer pensions.
30
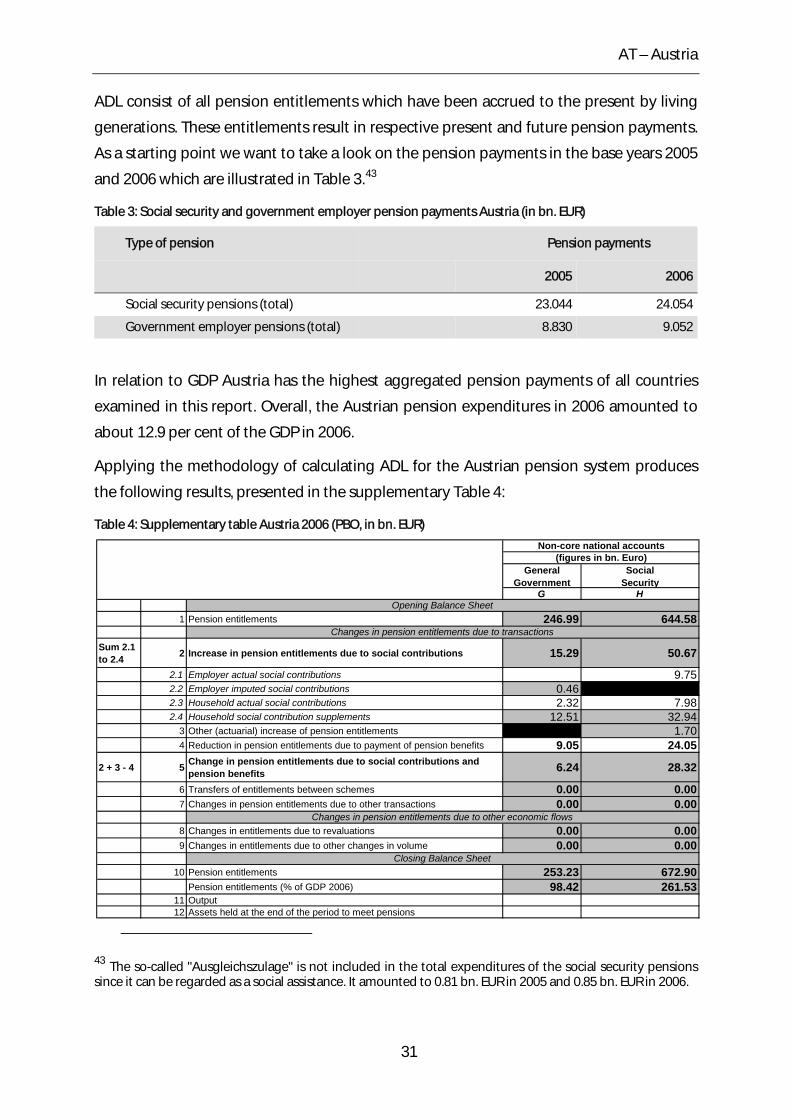
AT – Austria
ADL consist of all pension entitlements which have been accrued to the present by living
generations. These entitlements result in respective present and future pension payments.
As a starting point we want to take a look on the pension payments in the base years 2005
and 2006 which are illustrated in Table 3.43
Table 3: Social security and government employer pension payments Austria (in bn. EUR)
Type of pension Pension payments
2005 2006
Social security pensions (total) 23.044 24.054
Government employer pensions (total) 8.830 9.052
In relation to GDP Austria has the highest aggregated pension payments of all countries
examined in this report. Overall, the Austrian pension expenditures in 2006 amounted to
about 12.9 per cent of the GDP in 2006.
Applying the methodology of calculating ADL for the Austrian pension system produces
the following results, presented in the supplementary Table 4:
Table 4: Supplementary table Austria 2006 (PBO, in bn. EUR)
General Government
Social Security
G H
1 Pension entitlements 246.99 644.58
Sum 2.1 to 2.4 2 Increase in pension entitlements due to social contributions 15.29 50.67
2.1 Employer actual social contributions 9.752.2 Employer imputed social contributions 0.462.3 Household actual social contributions 2.32 7.982.4 Household social contribution supplements 12.51 32.94
3 Other (actuarial) increase of pension entitlements 1.704 Reduction in pension entitlements due to payment of pension benefits 9.05 24.05
2 + 3 - 4 5 Change in pension entitlements due to social contributions and pension benefits 6.24 28.32
6 Transfers of entitlements between schemes 0.00 0.007 Changes in pension entitlements due to other transactions 0.00 0.00
8 Changes in entitlements due to revaluations 0.00 0.009 Changes in entitlements due to other changes in volume 0.00 0.00
10 Pension entitlements 253.23 672.90Pension entitlements (% of GDP 2006) 98.42 261.53
11 Output12 Assets held at the end of the period to meet pensions
Closing Balance Sheet
Non-core national accounts(figures in bn. Euro)
Changes in pension entitlements due to transactions
Changes in pension entitlements due to other economic flows
Opening Balance Sheet
43 The so-called "Ausgleichszulage" is not included in the total expenditures of the social security pensions since it can be regarded as a social assistance. It amounted to 0.81 bn. EUR in 2005 and 0.85 bn. EUR in 2006.
31
AT – Austria
Column G – representing the liabilities for the civil servants – shows opening pension
entitlements to the amount of 246.99 bn. EUR. This value is increased by household actual
social contributions (2.32 bn. EUR), employer imputed social contributions (0.46 bn. EUR) as
well as household social contributions supplements (12.51 bn. EUR). Pension benefits paid
in 2006 add up to 9.05 bn. EUR, thus the change in pension entitlements amounts to 6.24
bn. EUR. The closing balance of pension entitlements comes up to 253.23 bn. EUR,
equivalent to 98.42 per cent of GDP in 2006.
The opening pension entitlements for the social security pension scheme accrue to a value
of 644.58 bn. EUR. Employer actual social contributions are 9.75 bn. EUR, those from
households add up to 7.98 bn.EUR. Household social contribution supplements come up
to 32.94 bn. EUR. These figures lead to an increase in pension entitlements due to social
contributions of 50.67 bn. EUR. Row 3 represents the residual figure which adds to 1.70 bn.
EUR. Pension benefits paid out in 2006 reduce the entitlements by 24.05 bn. EUR. Finally
the closing pension entitlements add up to a value of 672.90 bn. EUR which is equivalent
to 261.53 per cent of the GDP. Adding up the pension entitlements of column G and H
Austria shows pension entitlements to the amount of nearly 360 per cent of the GDP in
2006. When comparing the outcome of the various countries in chapter 23, we will
discover that this is a relatively high result. However, results change if one holds today´s
salaries constant using the ABO approach. Table 5 illustrates the respective outcomes.
32
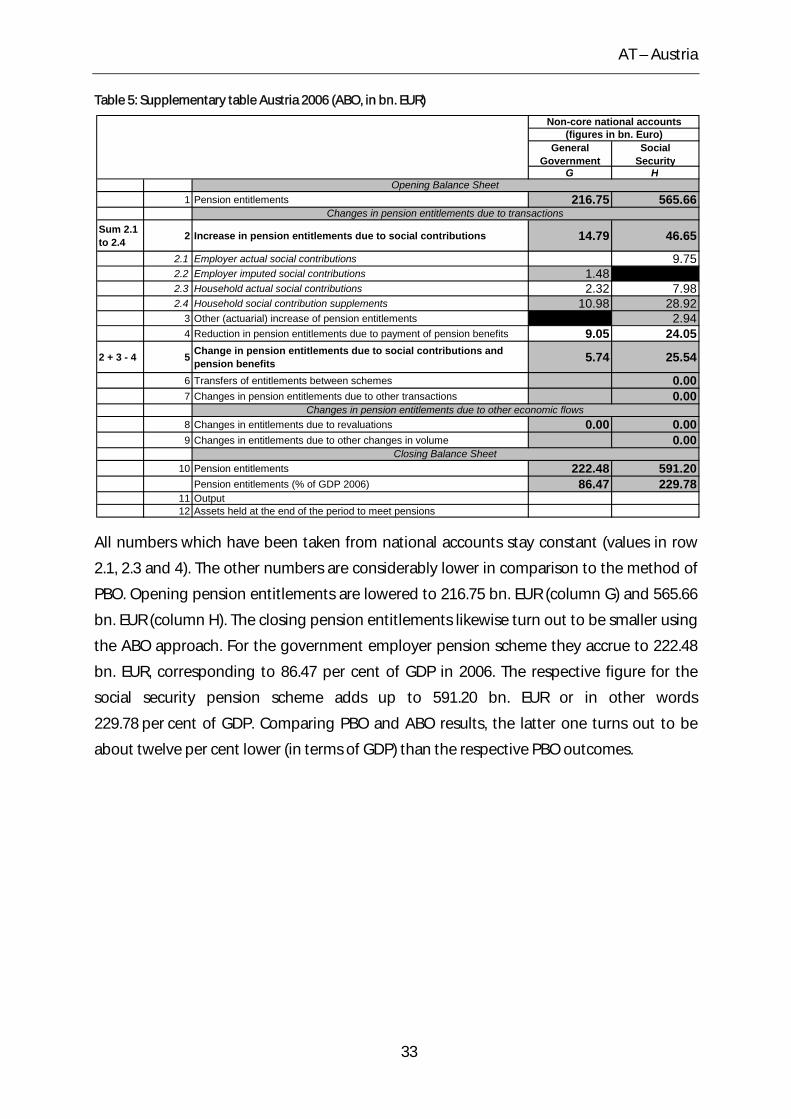
AT – Austria
Table 5: Supplementary table Austria 2006 (ABO, in bn. EUR)
General Government
Social Security
G H
1 Pension entitlements 216.75 565.66
Sum 2.1 to 2.4 2 Increase in pension entitlements due to social contributions 14.79 46.65
2.1 Employer actual social contributions 9.752.2 Employer imputed social contributions 1.482.3 Household actual social contributions 2.32 7.982.4 Household social contribution supplements 10.98 28.92
3 Other (actuarial) increase of pension entitlements 2.944 Reduction in pension entitlements due to payment of pension benefits 9.05 24.05
2 + 3 - 4 5 Change in pension entitlements due to social contributions and pension benefits 5.74 25.54
6 Transfers of entitlements between schemes 0.007 Changes in pension entitlements due to other transactions 0.00
8 Changes in entitlements due to revaluations 0.00 0.009 Changes in entitlements due to other changes in volume 0.00
10 Pension entitlements 222.48 591.20Pension entitlements (% of GDP 2006) 86.47 229.78
11 Output12 Assets held at the end of the period to meet pensions
Closing Balance Sheet
Non-core national accounts(figures in bn. Euro)
Changes in pension entitlements due to transactions
Changes in pension entitlements due to other economic flows
Opening Balance Sheet
All numbers which have been taken from national accounts stay constant (values in row
2.1, 2.3 and 4). The other numbers are considerably lower in comparison to the method of
PBO. Opening pension entitlements are lowered to 216.75 bn. EUR (column G) and 565.66
bn. EUR (column H). The closing pension entitlements likewise turn out to be smaller using
the ABO approach. For the government employer pension scheme they accrue to 222.48
bn. EUR, corresponding to 86.47 per cent of GDP in 2006. The respective figure for the
social security pension scheme adds up to 591.20 bn. EUR or in other words
229.78 per cent of GDP. Comparing PBO and ABO results, the latter one turns out to be
about twelve per cent lower (in terms of GDP) than the respective PBO outcomes.
33
BG – Bulgaria
5 BG – Bulgaria44
Bulgaria is populated by 7.72 million inhabitants.45 It has made a positive transition from a
centrally planned system to a market based economy. In the course of EU-accession in
January 2007 Bulgaria experienced a boost in trade and high economic growth rates. The
currency of Bulgaria is the Lev (BGN); 46 however, the Bulgarian government stated its will
to join the Euro Currency Area by 2012. Bulgaria´s GDP in 2006 amounted to 49.4 bn. BGN,
equal to 25.2 bn. EUR. GDP per capita added up to 3,300 EUR in 2006.
5.1 Demographic situation
As most post-communist countries Bulgaria experienced a considerable demographic
decline in the last two decades. The main factors causing this development are decreasing
fertility and high emigration rates. While total fertility amounted to about 2.00 in 1980, this
value decreased to 1.37 until 2006. The result is reflected in the population structure –
shown in Figure 9 – which resembles a tree cut down half way.
44 We would like to thank Anatoli Hristov and his colleagues from the Bulgarian National Statistical Institute for valuable comments on this chapter. 45 Figure as at January 1st, 2006. We display country data for 2006 since this is a main base year for our calculations. 46 The exchange rate is 1.9558 BGN to the Euro as per December 29th, 2006. All exchange rates applied in this survey stem from official releases of the ECB (see Euro foreign exchange reference rates, http://www.ecb.int/stats/exchange/eurofxref/html/index.en.html)
34
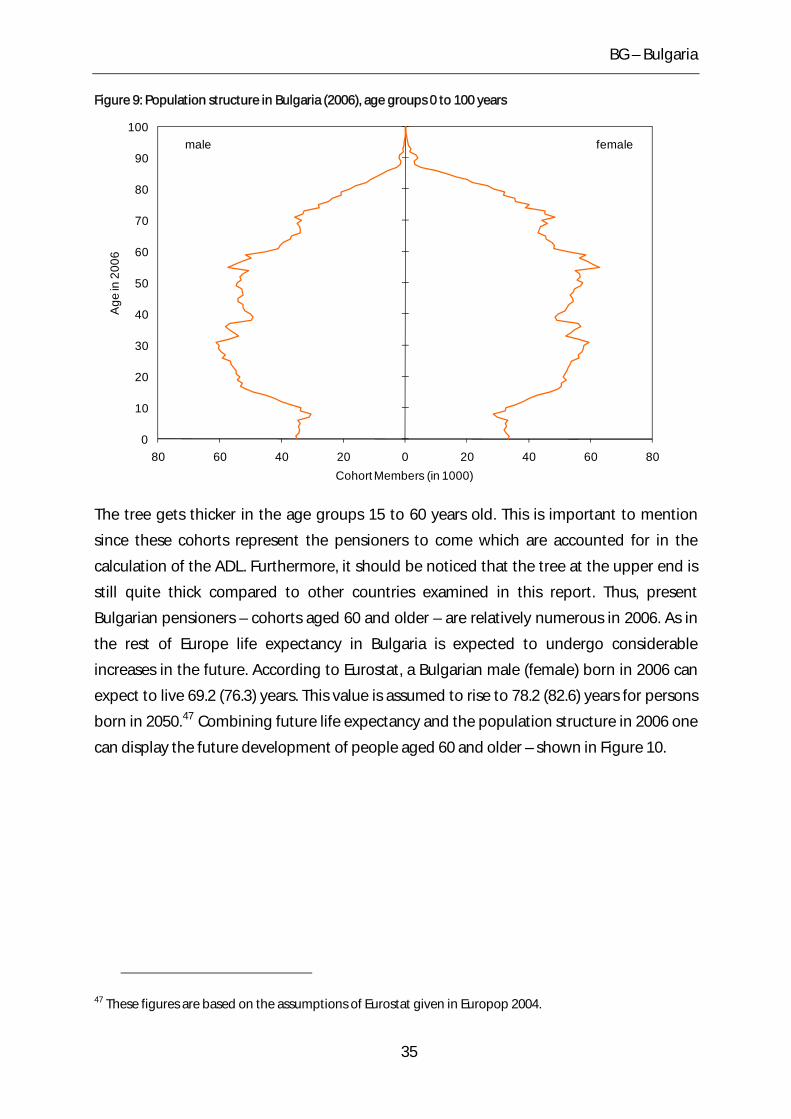
BG – Bulgaria
Figure 9: Population structure in Bulgaria (2006), age groups 0 to 100 years
0
10
20
30
40
50
60
70
80
90
100
80 60 40 20 0 20 40 60 80
Age
in 2
006
Cohort Members (in 1000)
femalemale
The tree gets thicker in the age groups 15 to 60 years old. This is important to mention
since these cohorts represent the pensioners to come which are accounted for in the
calculation of the ADL. Furthermore, it should be noticed that the tree at the upper end is
still quite thick compared to other countries examined in this report. Thus, present
Bulgarian pensioners – cohorts aged 60 and older – are relatively numerous in 2006. As in
the rest of Europe life expectancy in Bulgaria is expected to undergo considerable
increases in the future. According to Eurostat, a Bulgarian male (female) born in 2006 can
expect to live 69.2 (76.3) years. This value is assumed to rise to 78.2 (82.6) years for persons
born in 2050.47 Combining future life expectancy and the population structure in 2006 one
can display the future development of people aged 60 and older – shown in Figure 10.
47 These figures are based on the assumptions of Eurostat given in Europop 2004.
35
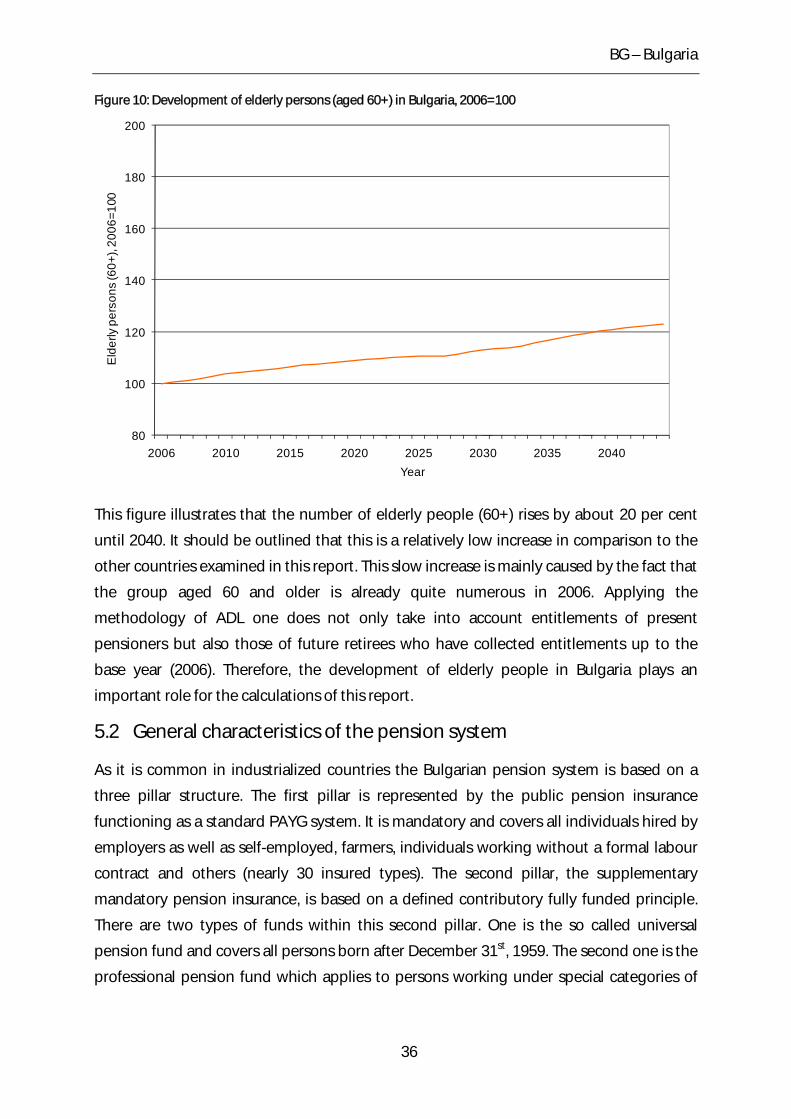
BG – Bulgaria
Figure 10: Development of elderly persons (aged 60+) in Bulgaria, 2006=100
80
100
120
140
160
180
200
2006 2010 2015 2020 2025 2030 2035 2040
Eld
erly
per
sons
(60+
), 20
06=1
00
Year
This figure illustrates that the number of elderly people (60+) rises by about 20 per cent
until 2040. It should be outlined that this is a relatively low increase in comparison to the
other countries examined in this report. This slow increase is mainly caused by the fact that
the group aged 60 and older is already quite numerous in 2006. Applying the
methodology of ADL one does not only take into account entitlements of present
pensioners but also those of future retirees who have collected entitlements up to the
base year (2006). Therefore, the development of elderly people in Bulgaria plays an
important role for the calculations of this report.
5.2 General characteristics of the pension system
As it is common in industrialized countries the Bulgarian pension system is based on a
three pillar structure. The first pillar is represented by the public pension insurance
functioning as a standard PAYG system. It is mandatory and covers all individuals hired by
employers as well as self-employed, farmers, individuals working without a formal labour
contract and others (nearly 30 insured types). The second pillar, the supplementary
mandatory pension insurance, is based on a defined contributory fully funded principle.
There are two types of funds within this second pillar. One is the so called universal
pension fund and covers all persons born after December 31st, 1959. The second one is the
professional pension fund which applies to persons working under special categories of
36
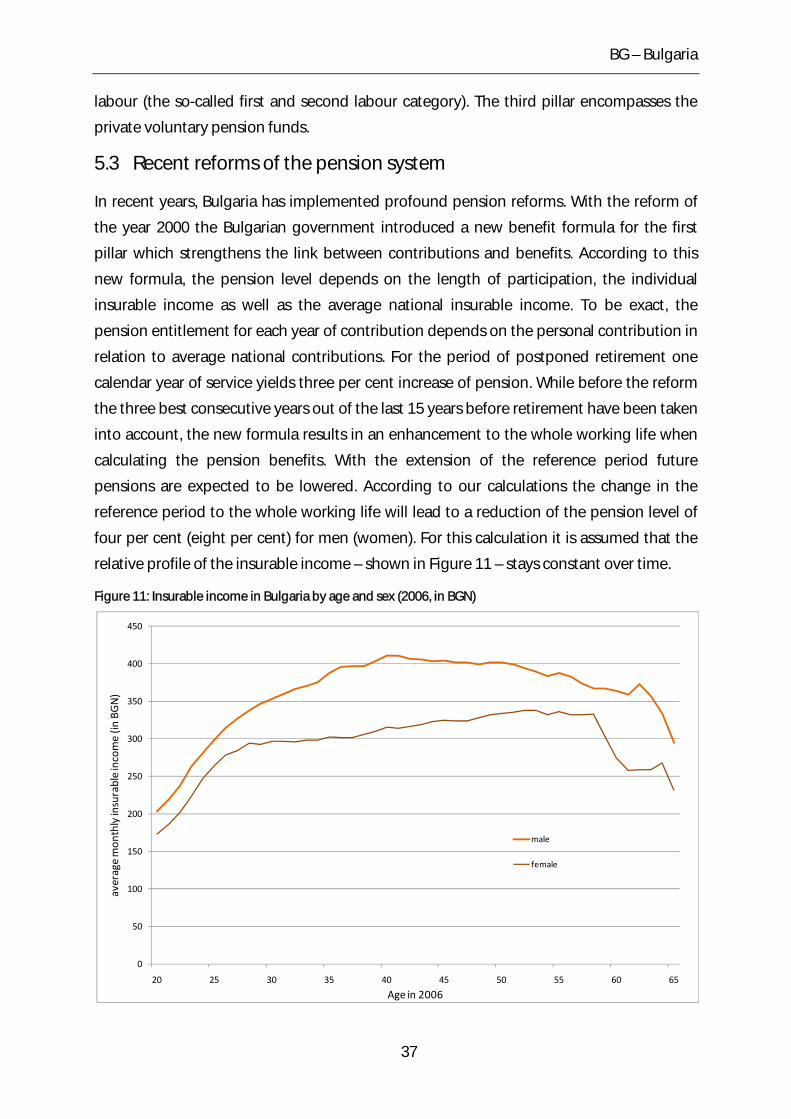
BG – Bulgaria
labour (the so-called first and second labour category). The third pillar encompasses the
private voluntary pension funds.
5.3 Recent reforms of the pension system
In recent years, Bulgaria has implemented profound pension reforms. With the reform of
the year 2000 the Bulgarian government introduced a new benefit formula for the first
pillar which strengthens the link between contributions and benefits. According to this
new formula, the pension level depends on the length of participation, the individual
insurable income as well as the average national insurable income. To be exact, the
pension entitlement for each year of contribution depends on the personal contribution in
relation to average national contributions. For the period of postponed retirement one
calendar year of service yields three per cent increase of pension. While before the reform
the three best consecutive years out of the last 15 years before retirement have been taken
into account, the new formula results in an enhancement to the whole working life when
calculating the pension benefits. With the extension of the reference period future
pensions are expected to be lowered. According to our calculations the change in the
reference period to the whole working life will lead to a reduction of the pension level of
four per cent (eight per cent) for men (women). For this calculation it is assumed that the
relative profile of the insurable income – shown in Figure 11 – stays constant over time.
Figure 11: Insurable income in Bulgaria by age and sex (2006, in BGN)
0
50
100
150
200
250
300
350
400
450
20 25 30 35 40 45 50 55 60 65
average mon
thly insurable income (in
BGN)
Age in 2006
male
female
37
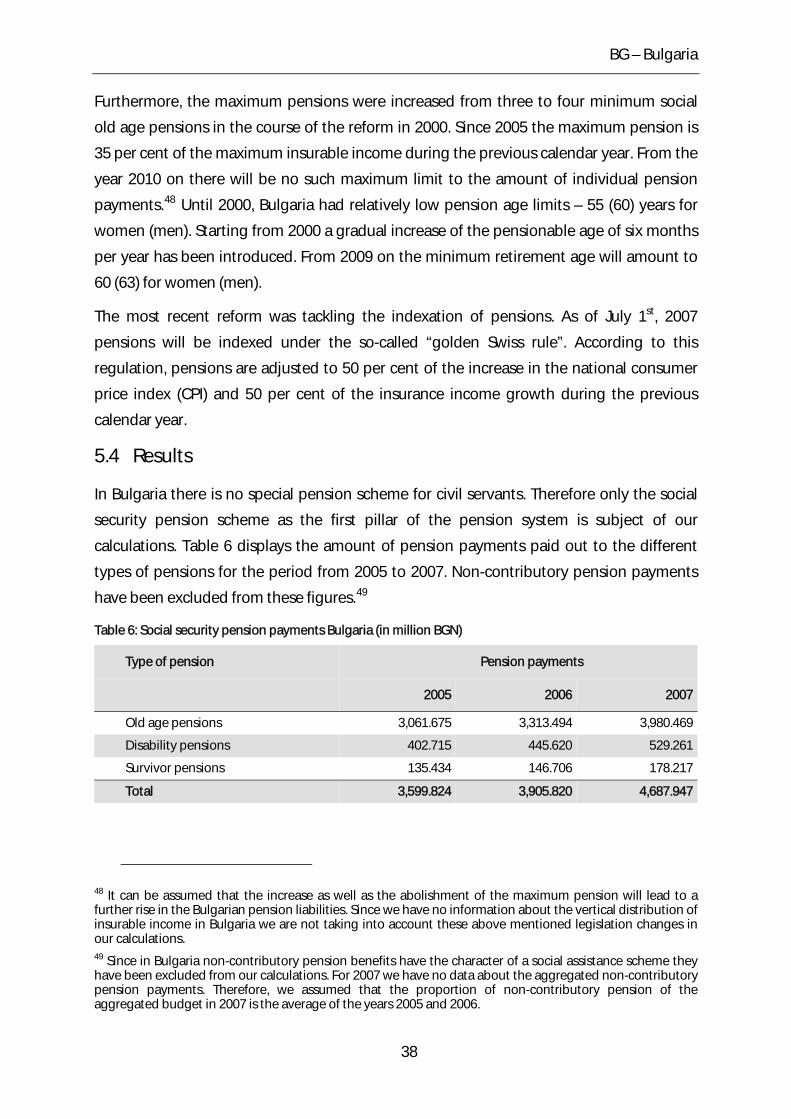
BG – Bulgaria
Furthermore, the maximum pensions were increased from three to four minimum social
old age pensions in the course of the reform in 2000. Since 2005 the maximum pension is
35 per cent of the maximum insurable income during the previous calendar year. From the
year 2010 on there will be no such maximum limit to the amount of individual pension
payments.48 Until 2000, Bulgaria had relatively low pension age limits – 55 (60) years for
women (men). Starting from 2000 a gradual increase of the pensionable age of six months
per year has been introduced. From 2009 on the minimum retirement age will amount to
60 (63) for women (men).
The most recent reform was tackling the indexation of pensions. As of July 1st, 2007
pensions will be indexed under the so-called “golden Swiss rule”. According to this
regulation, pensions are adjusted to 50 per cent of the increase in the national consumer
price index (CPI) and 50 per cent of the insurance income growth during the previous
calendar year.
5.4 Results
In Bulgaria there is no special pension scheme for civil servants. Therefore only the social
security pension scheme as the first pillar of the pension system is subject of our
calculations. Table 6 displays the amount of pension payments paid out to the different
types of pensions for the period from 2005 to 2007. Non-contributory pension payments
have been excluded from these figures.49
Table 6: Social security pension payments Bulgaria (in million BGN)
Type of pension Pension payments
2005 2006 2007
Old age pensions 3,061.675 3,313.494 3,980.469
Disability pensions 402.715 445.620 529.261
Survivor pensions 135.434 146.706 178.217
Total 3,599.824 3,905.820 4,687.947
48 It can be assumed that the increase as well as the abolishment of the maximum pension will lead to a further rise in the Bulgarian pension liabilities. Since we have no information about the vertical distribution of insurable income in Bulgaria we are not taking into account these above mentioned legislation changes in our calculations. 49 Since in Bulgaria non-contributory pension benefits have the character of a social assistance scheme they have been excluded from our calculations. For 2007 we have no data about the aggregated non-contributory pension payments. Therefore, we assumed that the proportion of non-contributory pension of the aggregated budget in 2007 is the average of the years 2005 and 2006.
38
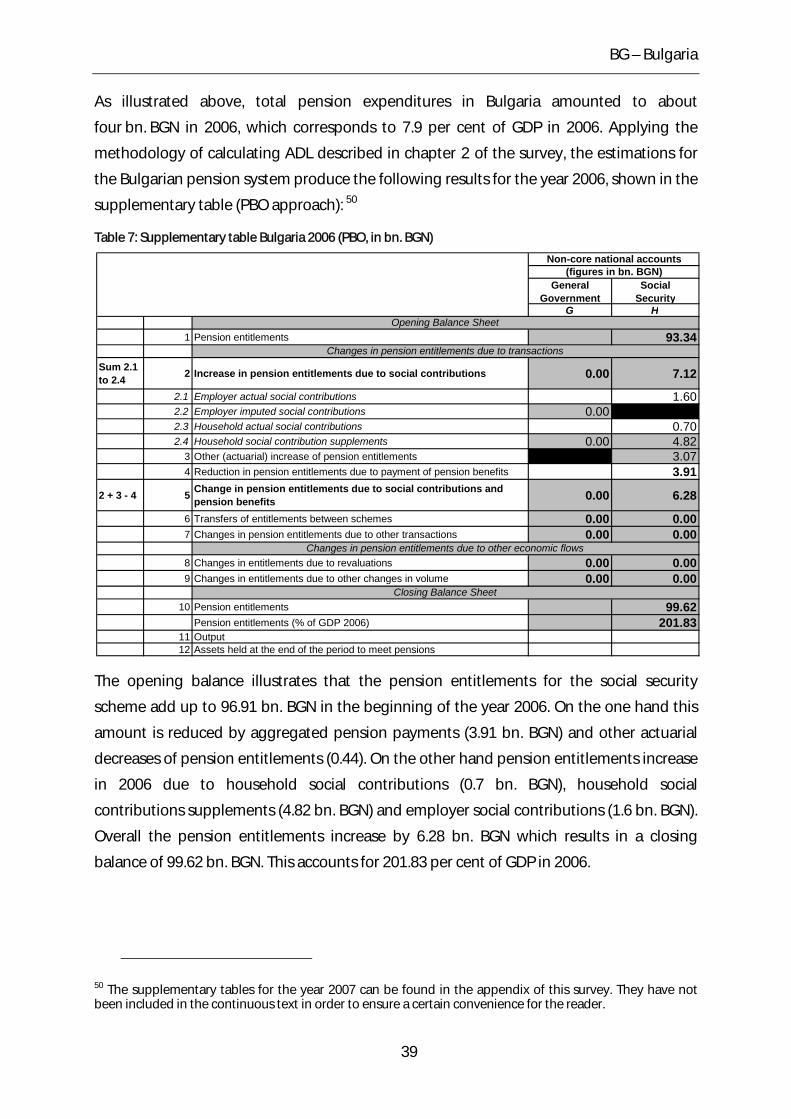
BG – Bulgaria
As illustrated above, total pension expenditures in Bulgaria amounted to about
four bn. BGN in 2006, which corresponds to 7.9 per cent of GDP in 2006. Applying the
methodology of calculating ADL described in chapter X2X of the survey, the estimations for
the Bulgarian pension system produce the following results for the year 2006, shown in the
supplementary table (PBO approach): 50
Table 7: Supplementary table Bulgaria 2006 (PBO, in bn. BGN)
General Government
Social Security
G H
1 Pension entitlements 93.34
Sum 2.1 to 2.4 2 Increase in pension entitlements due to social contributions 0.00 7.12
2.1 Employer actual social contributions 1.602.2 Employer imputed social contributions 0.002.3 Household actual social contributions 0.702.4 Household social contribution supplements 0.00 4.82
3 Other (actuarial) increase of pension entitlements 3.074 Reduction in pension entitlements due to payment of pension benefits 3.91
2 + 3 - 4 5 Change in pension entitlements due to social contributions and pension benefits 0.00 6.28
6 Transfers of entitlements between schemes 0.00 0.007 Changes in pension entitlements due to other transactions 0.00 0.00
8 Changes in entitlements due to revaluations 0.00 0.009 Changes in entitlements due to other changes in volume 0.00 0.00
10 Pension entitlements 99.62Pension entitlements (% of GDP 2006) 201.83
11 Output12 Assets held at the end of the period to meet pensions
Closing Balance Sheet
Non-core national accounts(figures in bn. BGN)
Changes in pension entitlements due to transactions
Changes in pension entitlements due to other economic flows
Opening Balance Sheet
The opening balance illustrates that the pension entitlements for the social security
scheme add up to 96.91 bn. BGN in the beginning of the year 2006. On the one hand this
amount is reduced by aggregated pension payments (3.91 bn. BGN) and other actuarial
decreases of pension entitlements (0.44). On the other hand pension entitlements increase
in 2006 due to household social contributions (0.7 bn. BGN), household social
contributions supplements (4.82 bn. BGN) and employer social contributions (1.6 bn. BGN).
Overall the pension entitlements increase by 6.28 bn. BGN which results in a closing
balance of 99.62 bn. BGN. This accounts for 201.83 per cent of GDP in 2006.
50 The supplementary tables for the year 2007 can be found in the appendix of this survey. They have not been included in the continuous text in order to ensure a certain convenience for the reader.
39
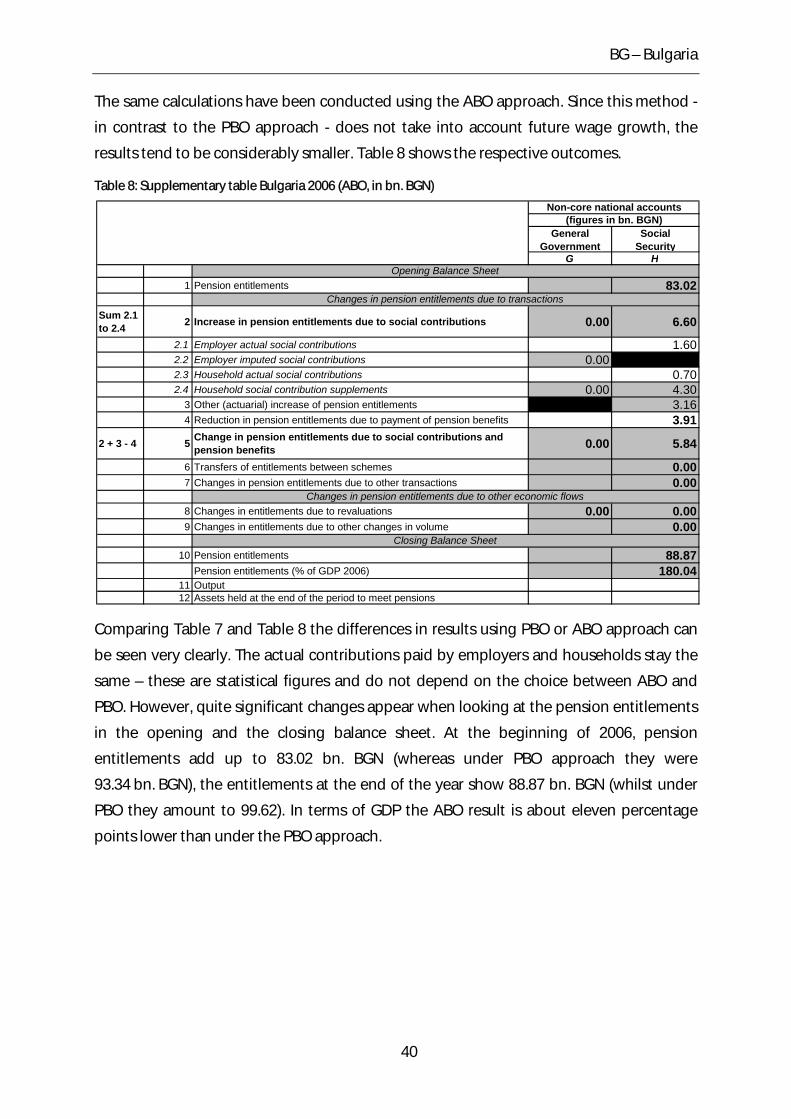
BG – Bulgaria
The same calculations have been conducted using the ABO approach. Since this method -
in contrast to the PBO approach - does not take into account future wage growth, the
results tend to be considerably smaller. Table 8 shows the respective outcomes.
Table 8: Supplementary table Bulgaria 2006 (ABO, in bn. BGN)
General Government
Social Security
G H
1 Pension entitlements 83.02
Sum 2.1 to 2.4 2 Increase in pension entitlements due to social contributions 0.00 6.60
2.1 Employer actual social contributions 1.602.2 Employer imputed social contributions 0.002.3 Household actual social contributions 0.702.4 Household social contribution supplements 0.00 4.30
3 Other (actuarial) increase of pension entitlements 3.164 Reduction in pension entitlements due to payment of pension benefits 3.91
2 + 3 - 4 5 Change in pension entitlements due to social contributions and pension benefits 0.00 5.84
6 Transfers of entitlements between schemes 0.007 Changes in pension entitlements due to other transactions 0.00
8 Changes in entitlements due to revaluations 0.00 0.009 Changes in entitlements due to other changes in volume 0.00
10 Pension entitlements 88.87Pension entitlements (% of GDP 2006) 180.04
11 Output12 Assets held at the end of the period to meet pensions
Closing Balance Sheet
Non-core national accounts(figures in bn. BGN)
Changes in pension entitlements due to transactions
Changes in pension entitlements due to other economic flows
Opening Balance Sheet
Comparing Table 7 and Table 8 the differences in results using PBO or ABO approach can
be seen very clearly. The actual contributions paid by employers and households stay the
same – these are statistical figures and do not depend on the choice between ABO and
PBO. However, quite significant changes appear when looking at the pension entitlements
in the opening and the closing balance sheet. At the beginning of 2006, pension
entitlements add up to 83.02 bn. BGN (whereas under PBO approach they were
93.34 bn. BGN), the entitlements at the end of the year show 88.87 bn. BGN (whilst under
PBO they amount to 99.62). In terms of GDP the ABO result is about eleven percentage
points lower than under the PBO approach.
40
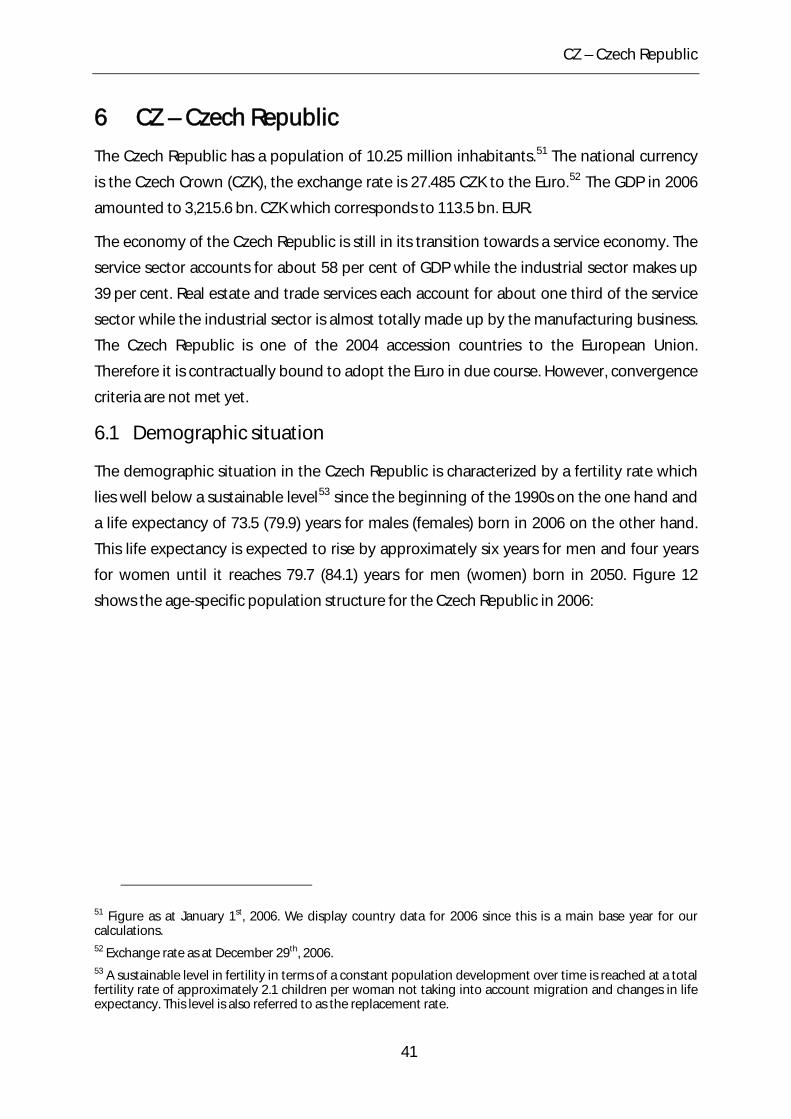
CZ – Czech Republic
6 CZ – Czech Republic
The Czech Republic has a population of 10.25 million inhabitants.51 The national currency
is the Czech Crown (CZK), the exchange rate is 27.485 CZK to the Euro.52 The GDP in 2006
amounted to 3,215.6 bn. CZK which corresponds to 113.5 bn. EUR.
The economy of the Czech Republic is still in its transition towards a service economy. The
service sector accounts for about 58 per cent of GDP while the industrial sector makes up
39 per cent. Real estate and trade services each account for about one third of the service
sector while the industrial sector is almost totally made up by the manufacturing business.
The Czech Republic is one of the 2004 accession countries to the European Union.
Therefore it is contractually bound to adopt the Euro in due course. However, convergence
criteria are not met yet.
6.1 Demographic situation
The demographic situation in the Czech Republic is characterized by a fertility rate which
lies well below a sustainable level53 since the beginning of the 1990s on the one hand and
a life expectancy of 73.5 (79.9) years for males (females) born in 2006 on the other hand.
This life expectancy is expected to rise by approximately six years for men and four years
for women until it reaches 79.7 (84.1) years for men (women) born in 2050. Figure 12
shows the age-specific population structure for the Czech Republic in 2006:
51 Figure as at January 1st, 2006. We display country data for 2006 since this is a main base year for our calculations. 52 Exchange rate as at December 29th, 2006. 53 A sustainable level in fertility in terms of a constant population development over time is reached at a total fertility rate of approximately 2.1 children per woman not taking into account migration and changes in life expectancy. This level is also referred to as the replacement rate.
41
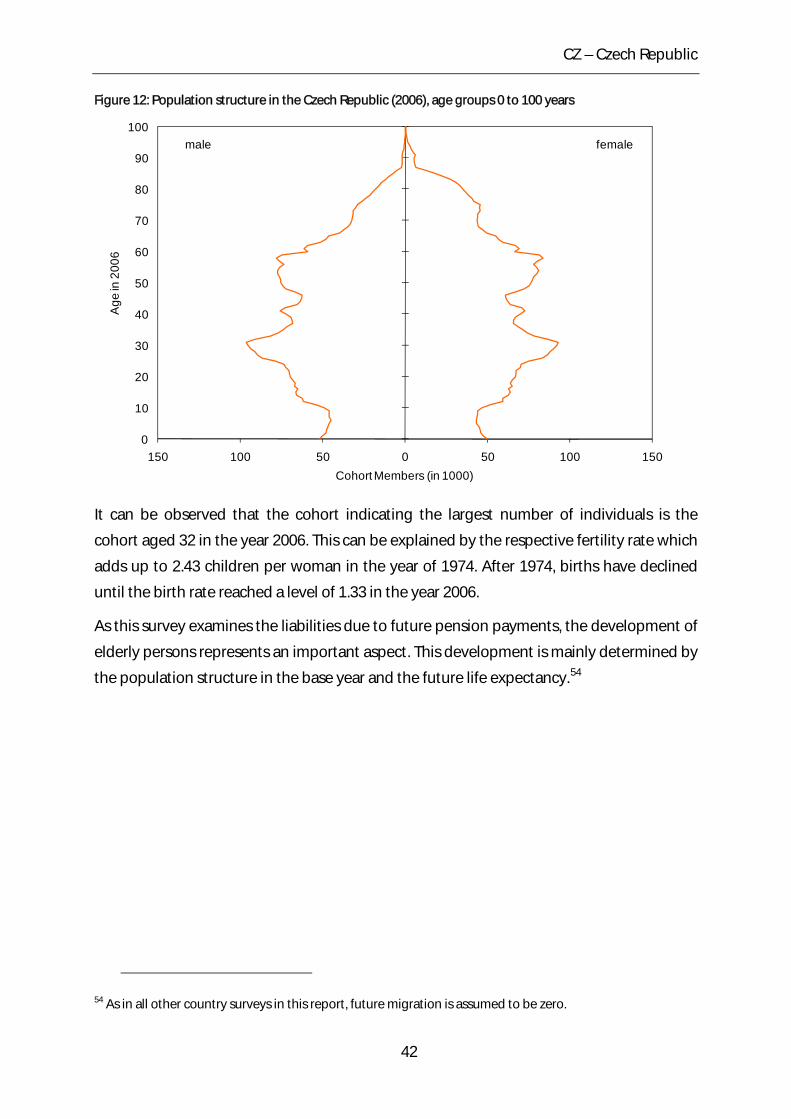
CZ – Czech Republic
Figure 12: Population structure in the Czech Republic (2006), age groups 0 to 100 years
0
10
20
30
40
50
60
70
80
90
100
150 100 50 0 50 100 150
Age
in 2
006
Cohort Members (in 1000)
femalemale
It can be observed that the cohort indicating the largest number of individuals is the
cohort aged 32 in the year 2006. This can be explained by the respective fertility rate which
adds up to 2.43 children per woman in the year of 1974. After 1974, births have declined
until the birth rate reached a level of 1.33 in the year 2006.
As this survey examines the liabilities due to future pension payments, the development of
elderly persons represents an important aspect. This development is mainly determined by
the population structure in the base year and the future life expectancy.54
54 As in all other country surveys in this report, future migration is assumed to be zero.
42
CZ – Czech Republic
Figure 13: Development of elderly persons (aged 60+) in the Czech Republic, 2006=100
80
100
120
140
160
180
200
2006 2010 2015 2020 2025 2030 2035 2040
Eld
erly
per
sons
(60+
), 20
06=1
00
Year
As Figure 13 shows, the number of elderly persons in the Czech Republic will increase by
more than 50 per cent until the year 2040. One reason for this is the large generation of 30
to 35 year old persons in 2006 who will enter the group of elderly persons in the years 2036
to 2041. The other reason can be figured out when looking at the life expectancy which is
expected to rise considerably until 2050, as described above. This numerical increase will
obviously have a major impact of the future pension payments, as will be indicated later in
this chapter.
6.2 General characteristics of the pension system
The Czech pension only weakly distinguishes between public and private employees since
only members of the armed forces receive their pensions directly out of the state budget.
All others are covered by the same mandatory defined benefit scheme. Furthermore, there
is only one large fund for old-age, disability, and survivor pensions. To this fund every
worker has to contribute 28 per cent of gross income split into 6.5 per cent to be paid by
employees and 21.5 per cent by employers. Self-employed pay the same contribution rate,
but their calculation base represents 50 per cent of the difference between incomes and
expenses, at least half of the average gross monthly wage. Furthermore, there is an
additional voluntary private fully funded scheme to which workers can contribute with tax-
preferred contributions.
43
CZ – Czech Republic
The pension is a combination of a basic flat rate pension of currently 1,400 CZK per month
paid to everyone who is eligible to a pension and an earnings related part. The
replacement rate is 1.5 percentage points per year of contribution on the average earnings
of the years since 1985. The period over which earnings will be averaged will increase until
2015 from when on it will remain constant for 30 years. The minimum earnings-related
pension is 770 CZK per month. Pension values are currently indexed to CPI growth
incremented by one third of average real wage growth.
Eligibility to a full pension is achieved at a legally defined age after at least 25 years of
contribution, with a generous regulation for study and child education times. The age is
currently raised by two months per year for men and 4 months per year for women to
reach a common 63 years in 2013. Women with children may retire earlier. With at least 15
years of contribution full pension can be claimed from the age of 65. Early retirement is
only possible incurring lifetime pension deductions.
6.3 Recent reforms of the pension system
Since 1989 there have been a number of small reforms. The fully funded voluntary scheme
was introduced in 1994 and the tax-preferred status was introduced after 1995. In 1995,
measures were taken to gradually increase the pension age from formerly 53-57/ 60 years
(women/men) to 59-63/ 63 years until 2013, together with an age requirement
harmonization between men and women. In 2003, the possibility to retire early with
reduced payments only until the regular pension age is reached was abolished along with
the possibility to receive working income without pension income being cut.
There has been an active discussion of reform measures in the Czech Republic for the last
few years which, so far, has only resulted in a “National Strategy Report on Adequate and
Sustainable Pensions”. Thus, since the current pension system is increasingly perceived to
be inadequate in facing the demographic change further reforms seem very likely. One
good reason for that is the case of Poland which made severe adjustments to its pension
system in a similar situation.
6.4 Results
There is no separate pension employer scheme for civil servants in the Czech Republic,
therefore only the social security pension scheme is subject to our calculations. However,
44
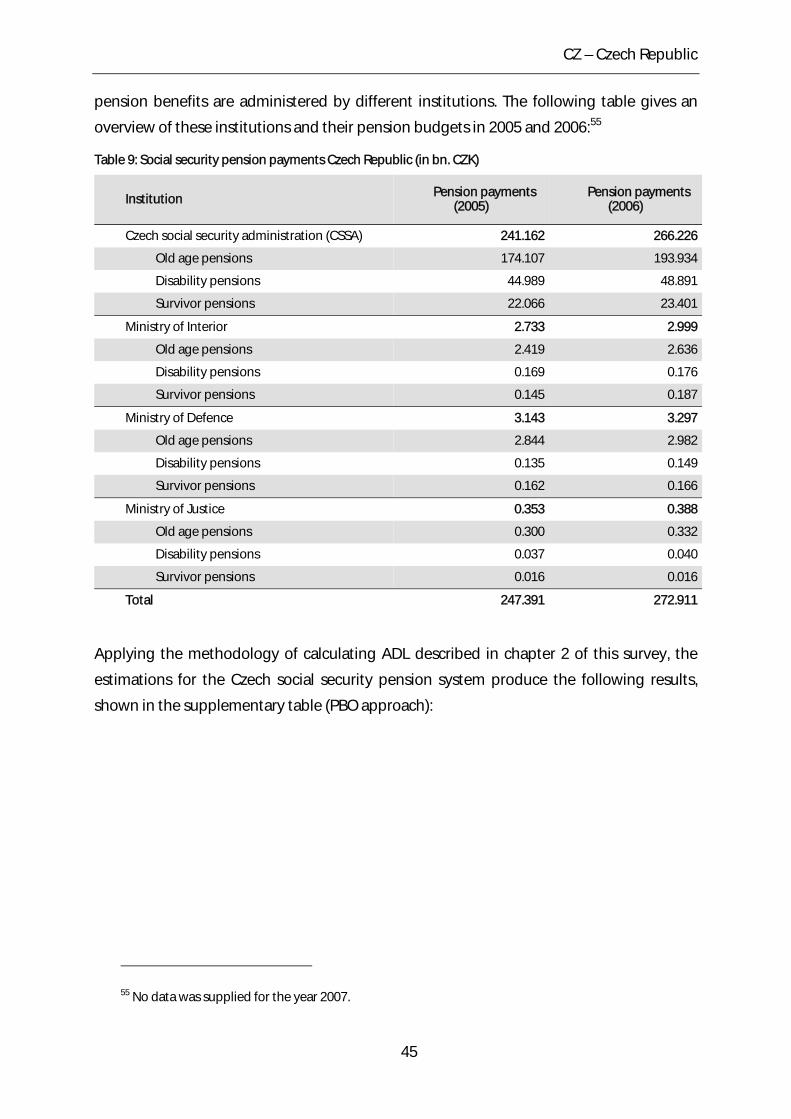
CZ – Czech Republic
pension benefits are administered by different institutions. The following table gives an
overview of these institutions and their pension budgets in 2005 and 2006:55
Table 9: Social security pension payments Czech Republic (in bn. CZK)
Institution Pension payments (2005)
Pension payments (2006)
Czech social security administration (CSSA) 241.162 266.226
Old age pensions 174.107 193.934
Disability pensions 44.989 48.891
Survivor pensions 22.066 23.401
Ministry of Interior 2.733 2.999
Old age pensions 2.419 2.636
Disability pensions 0.169 0.176
Survivor pensions 0.145 0.187
Ministry of Defence 3.143 3.297
Old age pensions 2.844 2.982
Disability pensions 0.135 0.149
Survivor pensions 0.162 0.166
Ministry of Justice 0.353 0.388
Old age pensions 0.300 0.332
Disability pensions 0.037 0.040
Survivor pensions 0.016 0.016
Total 247.391 272.911
Applying the methodology of calculating ADL described in chapter 2 of this survey, the
estimations for the Czech social security pension system produce the following results,
shown in the supplementary table (PBO approach):
55 No data was supplied for the year 2007.
45
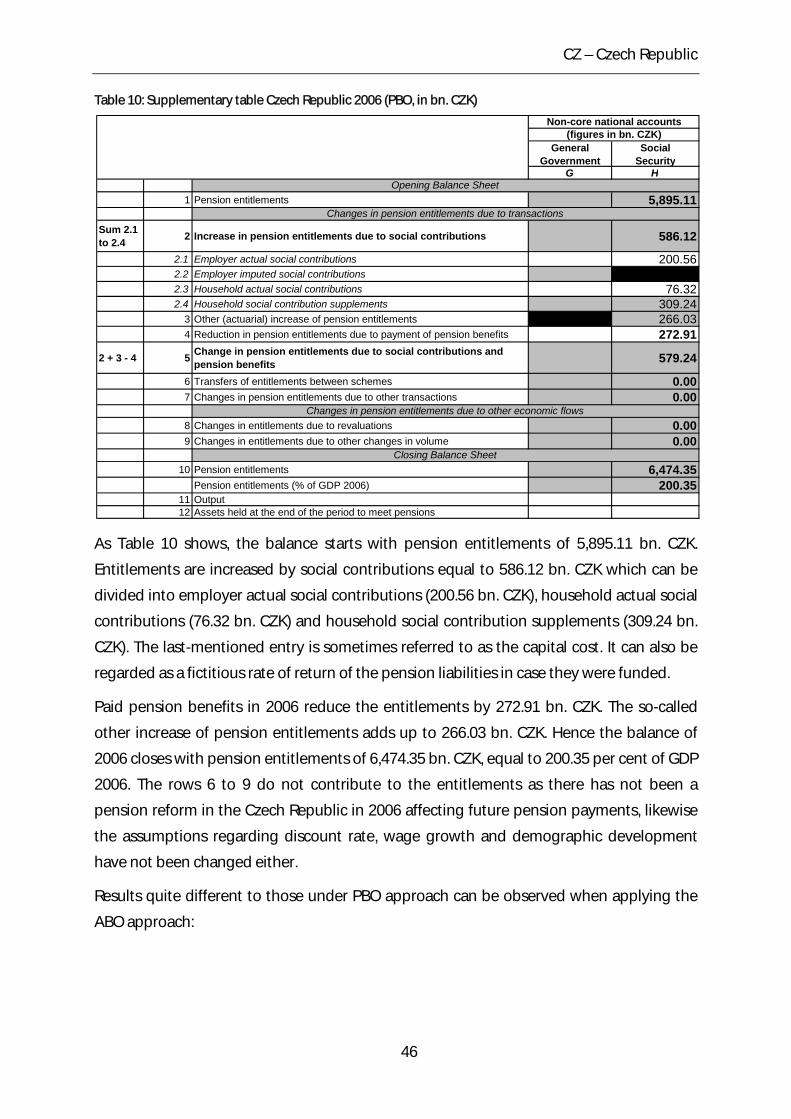
CZ – Czech Republic
Table 10: Supplementary table Czech Republic 2006 (PBO, in bn. CZK)
General Government
Social Security
G H
1 Pension entitlements 5,895.11
Sum 2.1 to 2.4 2 Increase in pension entitlements due to social contributions 586.12
2.1 Employer actual social contributions 200.562.2 Employer imputed social contributions2.3 Household actual social contributions 76.322.4 Household social contribution supplements 309.24
3 Other (actuarial) increase of pension entitlements 266.034 Reduction in pension entitlements due to payment of pension benefits 272.91
2 + 3 - 4 5 Change in pension entitlements due to social contributions and pension benefits 579.24
6 Transfers of entitlements between schemes 0.007 Changes in pension entitlements due to other transactions 0.00
8 Changes in entitlements due to revaluations 0.009 Changes in entitlements due to other changes in volume 0.00
10 Pension entitlements 6,474.35Pension entitlements (% of GDP 2006) 200.35
11 Output12 Assets held at the end of the period to meet pensions
Closing Balance Sheet
Non-core national accounts(figures in bn. CZK)
Changes in pension entitlements due to transactions
Changes in pension entitlements due to other economic flows
Opening Balance Sheet
As Table 10 shows, the balance starts with pension entitlements of 5,895.11 bn. CZK.
Entitlements are increased by social contributions equal to 586.12 bn. CZK which can be
divided into employer actual social contributions (200.56 bn. CZK), household actual social
contributions (76.32 bn. CZK) and household social contribution supplements (309.24 bn.
CZK). The last-mentioned entry is sometimes referred to as the capital cost. It can also be
regarded as a fictitious rate of return of the pension liabilities in case they were funded.
Paid pension benefits in 2006 reduce the entitlements by 272.91 bn. CZK. The so-called
other increase of pension entitlements adds up to 266.03 bn. CZK. Hence the balance of
2006 closes with pension entitlements of 6,474.35 bn. CZK, equal to 200.35 per cent of GDP
2006. The rows 6 to 9 do not contribute to the entitlements as there has not been a
pension reform in the Czech Republic in 2006 affecting future pension payments, likewise
the assumptions regarding discount rate, wage growth and demographic development
have not been changed either.
Results quite different to those under PBO approach can be observed when applying the
ABO approach:
46
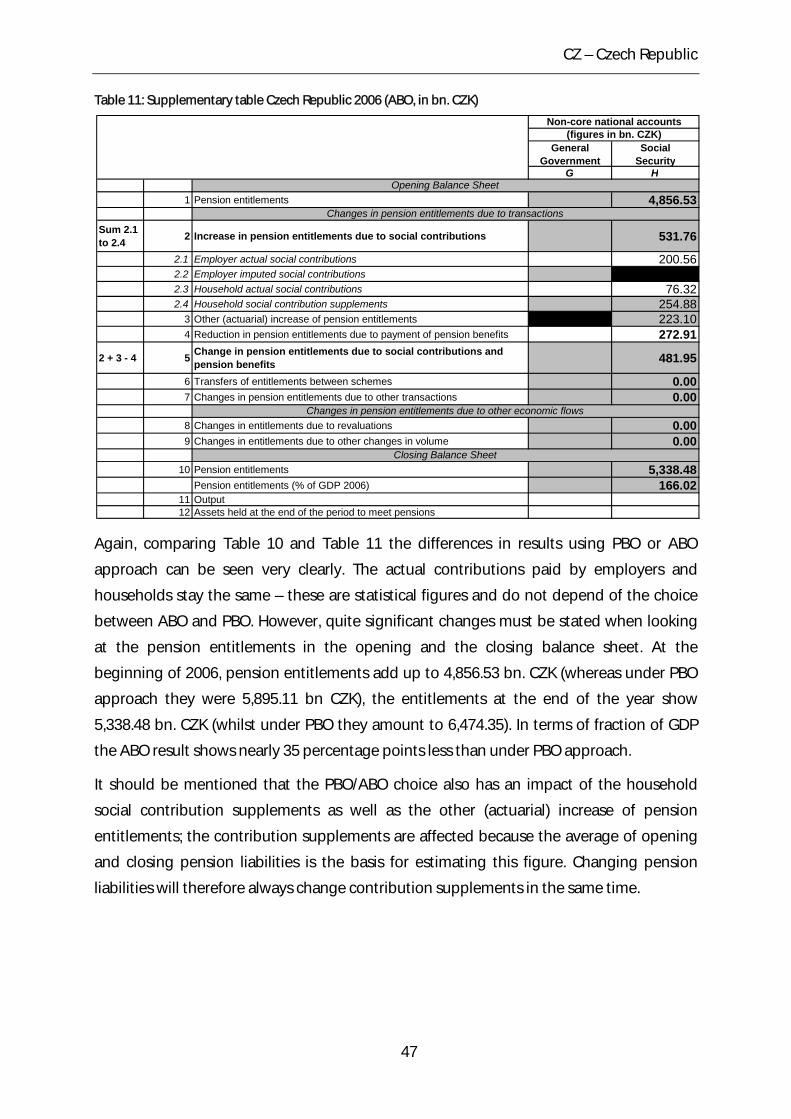
CZ – Czech Republic
Table 11: Supplementary table Czech Republic 2006 (ABO, in bn. CZK)
General Government
Social Security
G H
1 Pension entitlements 4,856.53
Sum 2.1 to 2.4 2 Increase in pension entitlements due to social contributions 531.76
2.1 Employer actual social contributions 200.562.2 Employer imputed social contributions2.3 Household actual social contributions 76.322.4 Household social contribution supplements 254.88
3 Other (actuarial) increase of pension entitlements 223.104 Reduction in pension entitlements due to payment of pension benefits 272.91
2 + 3 - 4 5 Change in pension entitlements due to social contributions and pension benefits 481.95
6 Transfers of entitlements between schemes 0.007 Changes in pension entitlements due to other transactions 0.00
8 Changes in entitlements due to revaluations 0.009 Changes in entitlements due to other changes in volume 0.00
10 Pension entitlements 5,338.48Pension entitlements (% of GDP 2006) 166.02
11 Output12 Assets held at the end of the period to meet pensions
Closing Balance Sheet
Non-core national accounts(figures in bn. CZK)
Changes in pension entitlements due to transactions
Changes in pension entitlements due to other economic flows
Opening Balance Sheet
Again, comparing Table 10 and Table 11 the differences in results using PBO or ABO
approach can be seen very clearly. The actual contributions paid by employers and
households stay the same – these are statistical figures and do not depend of the choice
between ABO and PBO. However, quite significant changes must be stated when looking
at the pension entitlements in the opening and the closing balance sheet. At the
beginning of 2006, pension entitlements add up to 4,856.53 bn. CZK (whereas under PBO
approach they were 5,895.11 bn CZK), the entitlements at the end of the year show
5,338.48 bn. CZK (whilst under PBO they amount to 6,474.35). In terms of fraction of GDP
the ABO result shows nearly 35 percentage points less than under PBO approach.
It should be mentioned that the PBO/ABO choice also has an impact of the household
social contribution supplements as well as the other (actuarial) increase of pension
entitlements; the contribution supplements are affected because the average of opening
and closing pension liabilities is the basis for estimating this figure. Changing pension
liabilities will therefore always change contribution supplements in the same time.
47
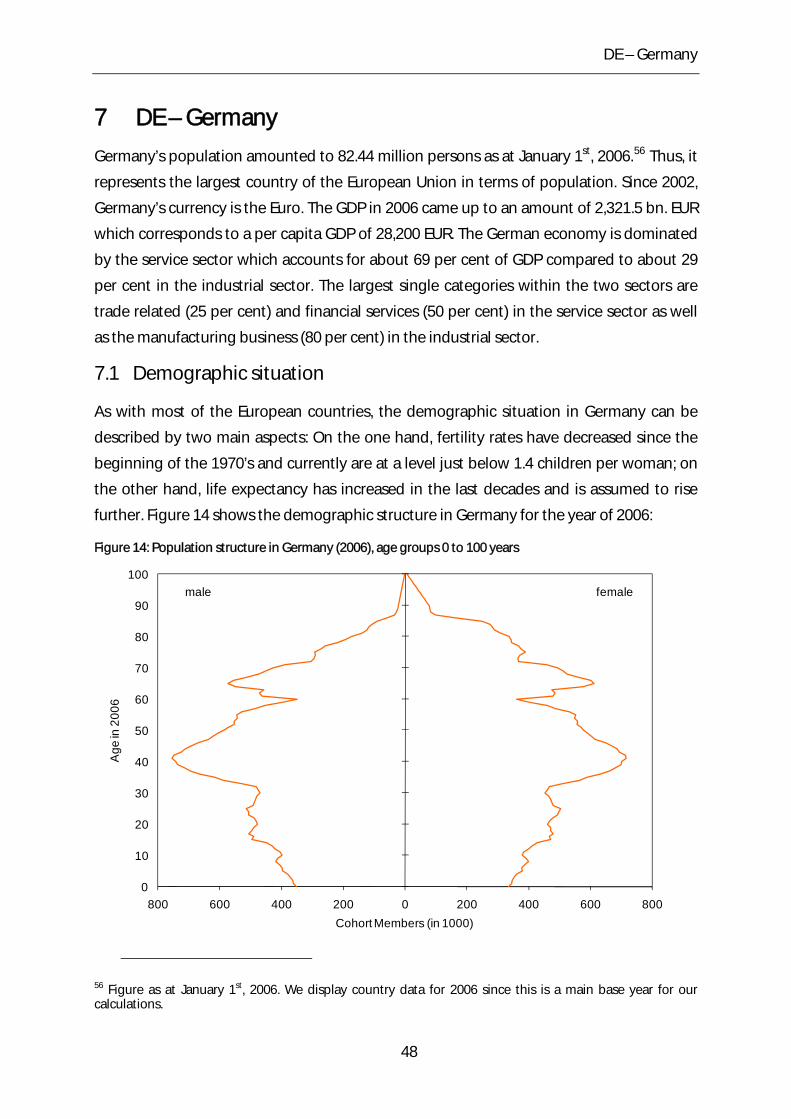
DE – Germany
7 DE – Germany
Germany’s population amounted to 82.44 million persons as at January 1st, 2006.56 Thus, it
represents the largest country of the European Union in terms of population. Since 2002,
Germany’s currency is the Euro. The GDP in 2006 came up to an amount of 2,321.5 bn. EUR
which corresponds to a per capita GDP of 28,200 EUR. The German economy is dominated
by the service sector which accounts for about 69 per cent of GDP compared to about 29
per cent in the industrial sector. The largest single categories within the two sectors are
trade related (25 per cent) and financial services (50 per cent) in the service sector as well
as the manufacturing business (80 per cent) in the industrial sector.
7.1 Demographic situation
As with most of the European countries, the demographic situation in Germany can be
described by two main aspects: On the one hand, fertility rates have decreased since the
beginning of the 1970’s and currently are at a level just below 1.4 children per woman; on
the other hand, life expectancy has increased in the last decades and is assumed to rise
further. Figure 14 shows the demographic structure in Germany for the year of 2006:
Figure 14: Population structure in Germany (2006), age groups 0 to 100 years
0
10
20
30
40
50
60
70
80
90
100
800 600 400 200 0 200 400 600 800
Age
in 2
006
Cohort Members (in 1000)
femalemale
56 Figure as at January 1st, 2006. We display country data for 2006 since this is a main base year for our calculations.
48
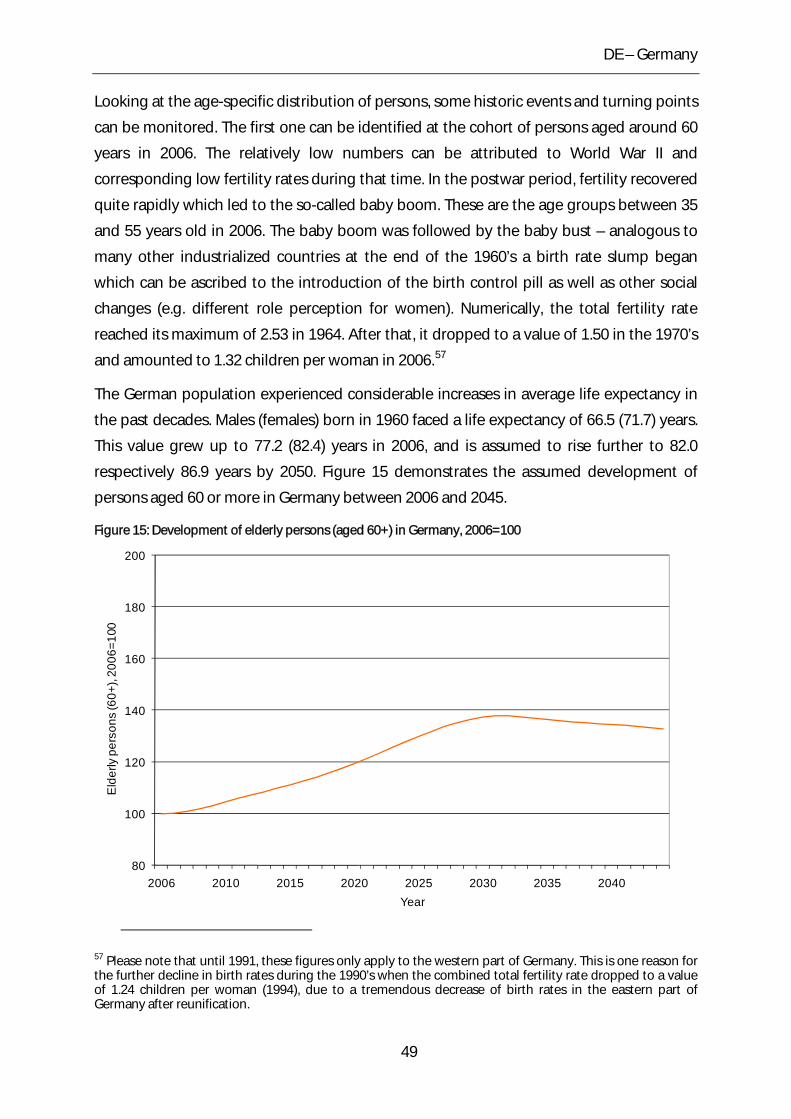
DE – Germany
Looking at the age-specific distribution of persons, some historic events and turning points
can be monitored. The first one can be identified at the cohort of persons aged around 60
years in 2006. The relatively low numbers can be attributed to World War II and
corresponding low fertility rates during that time. In the postwar period, fertility recovered
quite rapidly which led to the so-called baby boom. These are the age groups between 35
and 55 years old in 2006. The baby boom was followed by the baby bust – analogous to
many other industrialized countries at the end of the 1960’s a birth rate slump began
which can be ascribed to the introduction of the birth control pill as well as other social
changes (e.g. different role perception for women). Numerically, the total fertility rate
reached its maximum of 2.53 in 1964. After that, it dropped to a value of 1.50 in the 1970’s
and amounted to 1.32 children per woman in 2006.57
The German population experienced considerable increases in average life expectancy in
the past decades. Males (females) born in 1960 faced a life expectancy of 66.5 (71.7) years.
This value grew up to 77.2 (82.4) years in 2006, and is assumed to rise further to 82.0
respectively 86.9 years by 2050. Figure 15 demonstrates the assumed development of
persons aged 60 or more in Germany between 2006 and 2045.
Figure 15: Development of elderly persons (aged 60+) in Germany, 2006=100
80
100
120
140
160
180
200
2006 2010 2015 2020 2025 2030 2035 2040
Eld
erly
per
sons
(60+
), 20
06=1
00
Year
57 Please note that until 1991, these figures only apply to the western part of Germany. This is one reason for the further decline in birth rates during the 1990’s when the combined total fertility rate dropped to a value of 1.24 children per woman (1994), due to a tremendous decrease of birth rates in the eastern part of Germany after reunification.
49
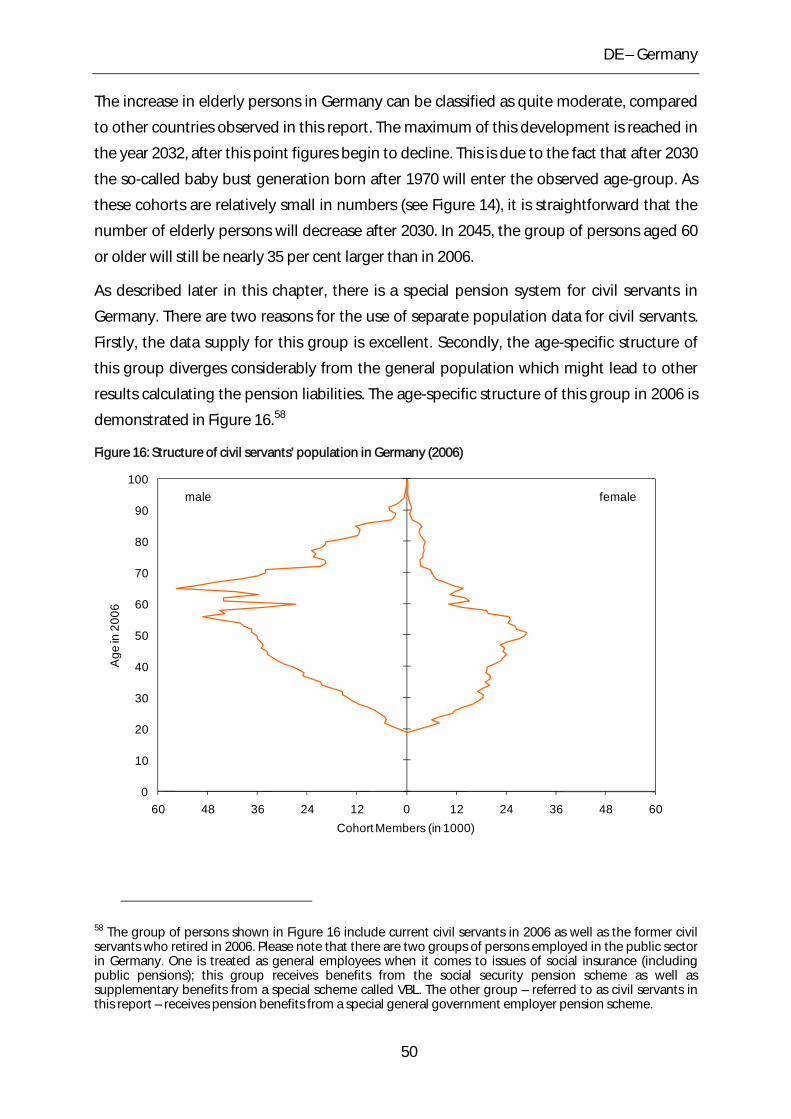
DE – Germany
The increase in elderly persons in Germany can be classified as quite moderate, compared
to other countries observed in this report. The maximum of this development is reached in
the year 2032, after this point figures begin to decline. This is due to the fact that after 2030
the so-called baby bust generation born after 1970 will enter the observed age-group. As
these cohorts are relatively small in numbers (see Figure 14), it is straightforward that the
number of elderly persons will decrease after 2030. In 2045, the group of persons aged 60
or older will still be nearly 35 per cent larger than in 2006.
As described later in this chapter, there is a special pension system for civil servants in
Germany. There are two reasons for the use of separate population data for civil servants.
Firstly, the data supply for this group is excellent. Secondly, the age-specific structure of
this group diverges considerably from the general population which might lead to other
results calculating the pension liabilities. The age-specific structure of this group in 2006 is
demonstrated in Figure 16.58
Figure 16: Structure of civil servants’ population in Germany (2006)
0
10
20
30
40
50
60
70
80
90
100
60 48 36 24 12 0 12 24 36 48 60
Age
in 2
006
Cohort Members (in 1000)
femalemale
58 The group of persons shown in Figure 16 include current civil servants in 2006 as well as the former civil servants who retired in 2006. Please note that there are two groups of persons employed in the public sector in Germany. One is treated as general employees when it comes to issues of social insurance (including public pensions); this group receives benefits from the social security pension scheme as well as supplementary benefits from a special scheme called VBL. The other group – referred to as civil servants in this report – receives pension benefits from a special general government employer pension scheme.
50
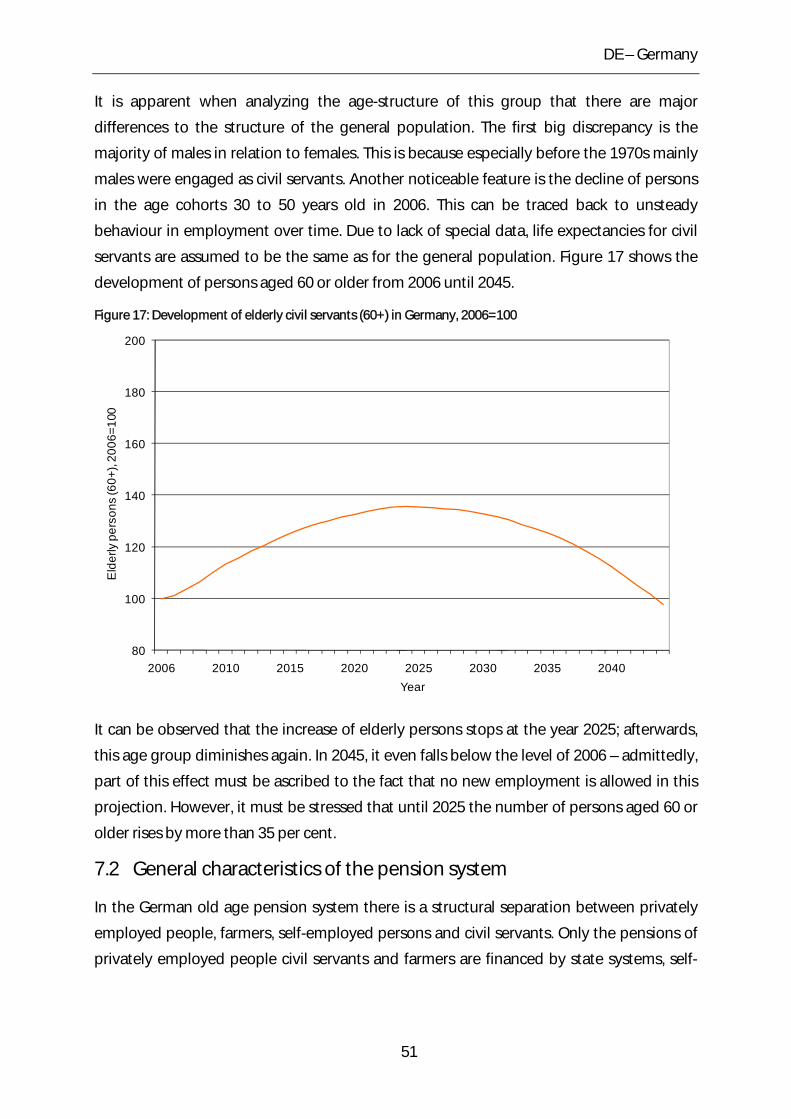
DE – Germany
It is apparent when analyzing the age-structure of this group that there are major
differences to the structure of the general population. The first big discrepancy is the
majority of males in relation to females. This is because especially before the 1970s mainly
males were engaged as civil servants. Another noticeable feature is the decline of persons
in the age cohorts 30 to 50 years old in 2006. This can be traced back to unsteady
behaviour in employment over time. Due to lack of special data, life expectancies for civil
servants are assumed to be the same as for the general population. Figure 17 shows the
development of persons aged 60 or older from 2006 until 2045.
Figure 17: Development of elderly civil servants (60+) in Germany, 2006=100
80
100
120
140
160
180
200
2006 2010 2015 2020 2025 2030 2035 2040
Eld
erly
per
sons
(60+
), 20
06=1
00
Year
It can be observed that the increase of elderly persons stops at the year 2025; afterwards,
this age group diminishes again. In 2045, it even falls below the level of 2006 – admittedly,
part of this effect must be ascribed to the fact that no new employment is allowed in this
projection. However, it must be stressed that until 2025 the number of persons aged 60 or
older rises by more than 35 per cent.
7.2 General characteristics of the pension system
In the German old age pension system there is a structural separation between privately
employed people, farmers, self-employed persons and civil servants. Only the pensions of
privately employed people civil servants and farmers are financed by state systems, self-
51
DE – Germany
employed persons are in schemes which is not state controlled.59 While there is a point
system based on contributions for private employees and farmers, civil servants do not pay
contributions; their post-retirement payments are seen as a compensation for their life-
time duty to serve the country and are in a way part of their salary.
For private sector employees there is a mandatory PAYG scheme to which they have to
contribute 19.9 per cent of their income, where payments are made by the employer and
the employee to equal parts. In 2001, a second pillar – the so-called “Riester-Rente” – was
introduced to which workers can contribute up to four per cent of their income. This
scheme is fully funded. Contributions or premiums respectively are tax-preferred as taxes
only need to be paid on benefits. At the same time an upper bound was set to
contributions for the first pillar (20 per cent until 2020, 22 per cent until 2030).
By contributing to the mandatory scheme people earn pension points with one point
corresponding to one year of average earnings. Earnings above an annually adjusted
threshold are not taken into account. The benefits are then calculated as the product of
accumulated points and the point values (different in East and West) after retirement. The
pension point value is annually adjusted by the growth of gross wages net of pension
contributions and notional contributions to the “Riester-Rente”. Furthermore, a
sustainability factor was introduced which anchors the point value to the ratio of
contributors to retirees.
The regular retirement age is still 65 (to be incremented between 2011 and 2029 to 67)
with a possibility for early retirement after the age of 60 which was raised to 63 from 2006.
There is a penalty of 0.3 percentage points per month of early retirement and a bonus of
0.5 percentage points per month of late retirement.
The pension for civil servants is calculated as a ratio of the final salary they have earned for
at least three years before retirement. The regular retirement age is 65.60 The replacement
rate is about 1.79 percentage points per year of service, with a maximum of 71.75 per
cent.61 Per year of retirement before the age of 63 there is a deduction of 3.6 percentage
points. Retirement is not possible before the age of 60.
59 In fact, the old age insurance for farmers (AdL) is regarded as part of the German social security pension scheme in this report. 60 However, there are exceptions for certain professional groups like policemen or firemen who have a regular retirement age of 60. 61 In 2001, the government decided to reduce the replacement rate from 75 per cent in 2003 to 71.75 in 2010. In 2007, the replacement rate amounted 72.97.
52
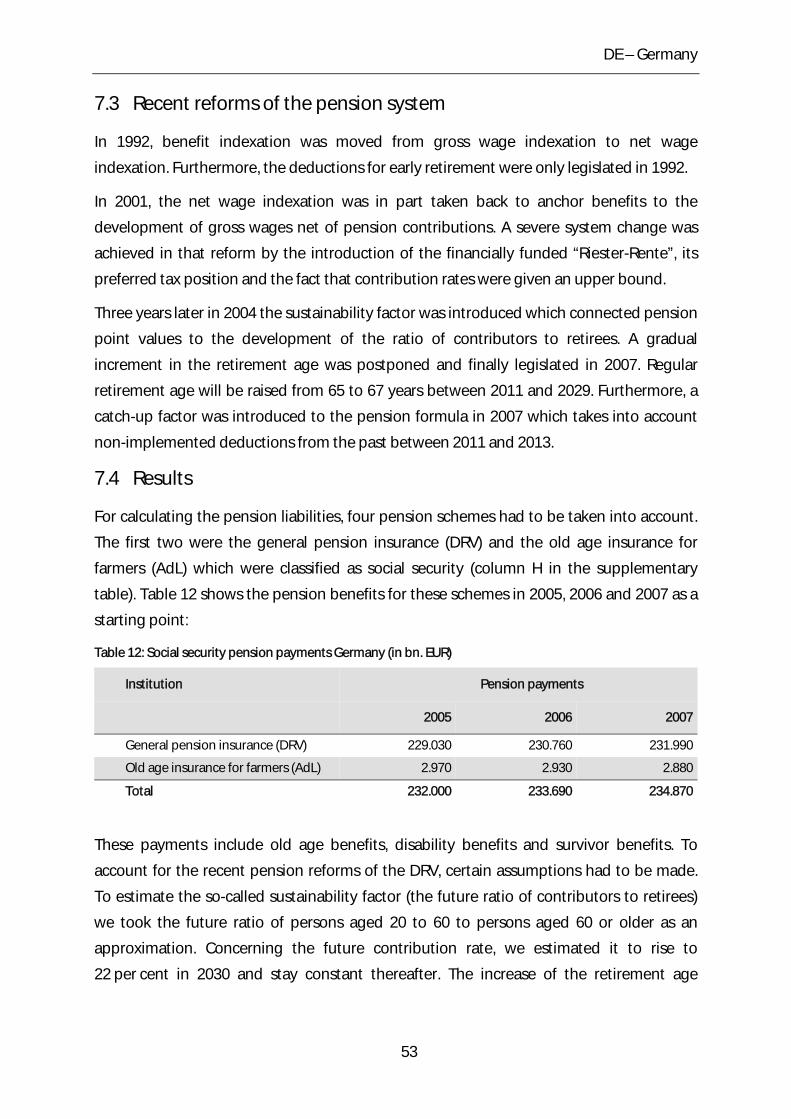
DE – Germany
7.3 Recent reforms of the pension system
In 1992, benefit indexation was moved from gross wage indexation to net wage
indexation. Furthermore, the deductions for early retirement were only legislated in 1992.
In 2001, the net wage indexation was in part taken back to anchor benefits to the
development of gross wages net of pension contributions. A severe system change was
achieved in that reform by the introduction of the financially funded “Riester-Rente”, its
preferred tax position and the fact that contribution rates were given an upper bound.
Three years later in 2004 the sustainability factor was introduced which connected pension
point values to the development of the ratio of contributors to retirees. A gradual
increment in the retirement age was postponed and finally legislated in 2007. Regular
retirement age will be raised from 65 to 67 years between 2011 and 2029. Furthermore, a
catch-up factor was introduced to the pension formula in 2007 which takes into account
non-implemented deductions from the past between 2011 and 2013.
7.4 Results
For calculating the pension liabilities, four pension schemes had to be taken into account.
The first two were the general pension insurance (DRV) and the old age insurance for
farmers (AdL) which were classified as social security (column H in the supplementary
table). Table 12 shows the pension benefits for these schemes in 2005, 2006 and 2007 as a
starting point:
Table 12: Social security pension payments Germany (in bn. EUR)
Institution Pension payments
2005 2006 2007
General pension insurance (DRV) 229.030 230.760 231.990
Old age insurance for farmers (AdL) 2.970 2.930 2.880
Total 232.000 233.690 234.870
These payments include old age benefits, disability benefits and survivor benefits. To
account for the recent pension reforms of the DRV, certain assumptions had to be made.
To estimate the so-called sustainability factor (the future ratio of contributors to retirees)
we took the future ratio of persons aged 20 to 60 to persons aged 60 or older as an
approximation. Concerning the future contribution rate, we estimated it to rise to
22 per cent in 2030 and stay constant thereafter. The increase of the retirement age
53
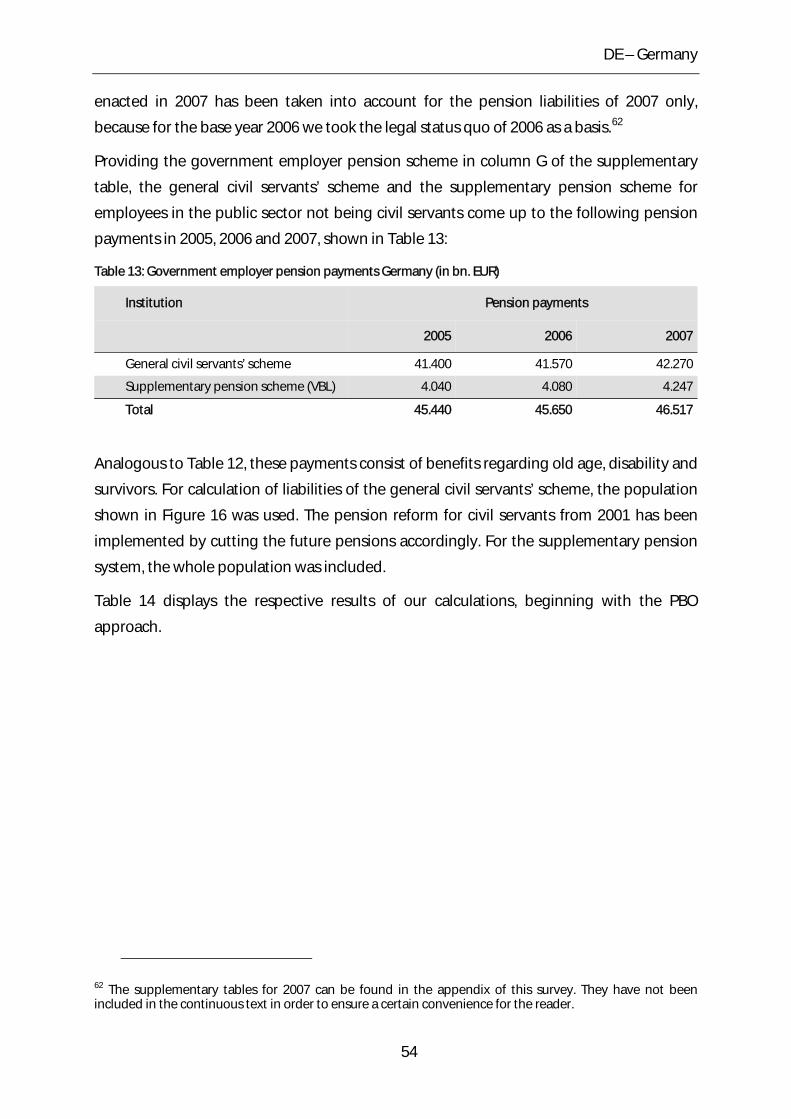
DE – Germany
enacted in 2007 has been taken into account for the pension liabilities of 2007 only,
because for the base year 2006 we took the legal status quo of 2006 as a basis.62
Providing the government employer pension scheme in column G of the supplementary
table, the general civil servants’ scheme and the supplementary pension scheme for
employees in the public sector not being civil servants come up to the following pension
payments in 2005, 2006 and 2007, shown in Table 13:
Table 13: Government employer pension payments Germany (in bn. EUR)
Institution Pension payments
2005 2006 2007
General civil servants’ scheme 41.400 41.570 42.270
Supplementary pension scheme (VBL) 4.040 4.080 4.247
Total 45.440 45.650 46.517
Analogous to Table 12, these payments consist of benefits regarding old age, disability and
survivors. For calculation of liabilities of the general civil servants’ scheme, the population
shown in Figure 16 was used. The pension reform for civil servants from 2001 has been
implemented by cutting the future pensions accordingly. For the supplementary pension
system, the whole population was included.
Table 14 displays the respective results of our calculations, beginning with the PBO
approach.
62 The supplementary tables for 2007 can be found in the appendix of this survey. They have not been included in the continuous text in order to ensure a certain convenience for the reader.
54
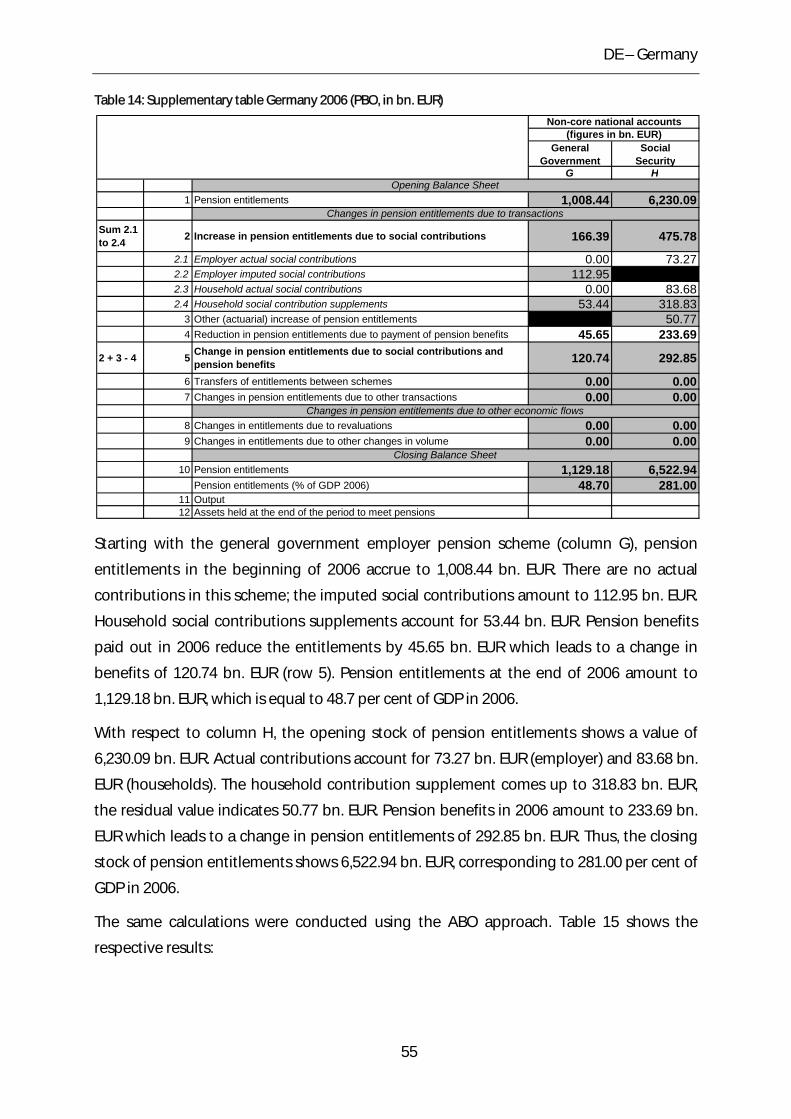
DE – Germany
Table 14: Supplementary table Germany 2006 (PBO, in bn. EUR)
General Government
Social Security
G H
1 Pension entitlements 1,008.44 6,230.09
Sum 2.1 to 2.4 2 Increase in pension entitlements due to social contributions 166.39 475.78
2.1 Employer actual social contributions 0.00 73.272.2 Employer imputed social contributions 112.952.3 Household actual social contributions 0.00 83.682.4 Household social contribution supplements 53.44 318.83
3 Other (actuarial) increase of pension entitlements 50.774 Reduction in pension entitlements due to payment of pension benefits 45.65 233.69
2 + 3 - 4 5 Change in pension entitlements due to social contributions and pension benefits 120.74 292.85
6 Transfers of entitlements between schemes 0.00 0.007 Changes in pension entitlements due to other transactions 0.00 0.00
8 Changes in entitlements due to revaluations 0.00 0.009 Changes in entitlements due to other changes in volume 0.00 0.00
10 Pension entitlements 1,129.18 6,522.94Pension entitlements (% of GDP 2006) 48.70 281.00
11 Output12 Assets held at the end of the period to meet pensions
Closing Balance Sheet
Non-core national accounts(figures in bn. EUR)
Changes in pension entitlements due to transactions
Changes in pension entitlements due to other economic flows
Opening Balance Sheet
Starting with the general government employer pension scheme (column G), pension
entitlements in the beginning of 2006 accrue to 1,008.44 bn. EUR. There are no actual
contributions in this scheme; the imputed social contributions amount to 112.95 bn. EUR.
Household social contributions supplements account for 53.44 bn. EUR. Pension benefits
paid out in 2006 reduce the entitlements by 45.65 bn. EUR which leads to a change in
benefits of 120.74 bn. EUR (row 5). Pension entitlements at the end of 2006 amount to
1,129.18 bn. EUR, which is equal to 48.7 per cent of GDP in 2006.
With respect to column H, the opening stock of pension entitlements shows a value of
6,230.09 bn. EUR. Actual contributions account for 73.27 bn. EUR (employer) and 83.68 bn.
EUR (households). The household contribution supplement comes up to 318.83 bn. EUR,
the residual value indicates 50.77 bn. EUR. Pension benefits in 2006 amount to 233.69 bn.
EUR which leads to a change in pension entitlements of 292.85 bn. EUR. Thus, the closing
stock of pension entitlements shows 6,522.94 bn. EUR, corresponding to 281.00 per cent of
GDP in 2006.
The same calculations were conducted using the ABO approach. Table 15 shows the
respective results:
55
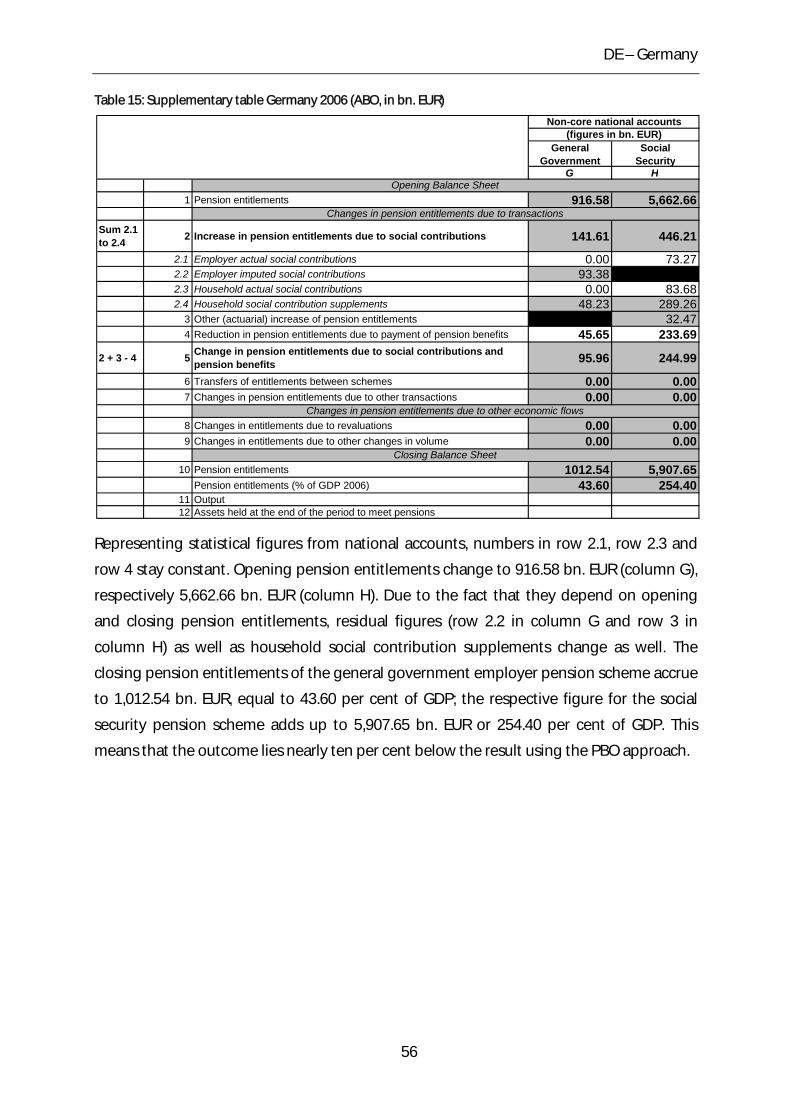
DE – Germany
Table 15: Supplementary table Germany 2006 (ABO, in bn. EUR)
General Government
Social Security
G H
1 Pension entitlements 916.58 5,662.66
Sum 2.1 to 2.4 2 Increase in pension entitlements due to social contributions 141.61 446.21
2.1 Employer actual social contributions 0.00 73.272.2 Employer imputed social contributions 93.382.3 Household actual social contributions 0.00 83.682.4 Household social contribution supplements 48.23 289.26
3 Other (actuarial) increase of pension entitlements 32.474 Reduction in pension entitlements due to payment of pension benefits 45.65 233.69
2 + 3 - 4 5 Change in pension entitlements due to social contributions and pension benefits 95.96 244.99
6 Transfers of entitlements between schemes 0.00 0.007 Changes in pension entitlements due to other transactions 0.00 0.00
8 Changes in entitlements due to revaluations 0.00 0.009 Changes in entitlements due to other changes in volume 0.00 0.00
10 Pension entitlements 1012.54 5,907.65Pension entitlements (% of GDP 2006) 43.60 254.40
11 Output12 Assets held at the end of the period to meet pensions
Closing Balance Sheet
Non-core national accounts(figures in bn. EUR)
Changes in pension entitlements due to transactions
Changes in pension entitlements due to other economic flows
Opening Balance Sheet
Representing statistical figures from national accounts, numbers in row 2.1, row 2.3 and
row 4 stay constant. Opening pension entitlements change to 916.58 bn. EUR (column G),
respectively 5,662.66 bn. EUR (column H). Due to the fact that they depend on opening
and closing pension entitlements, residual figures (row 2.2 in column G and row 3 in
column H) as well as household social contribution supplements change as well. The
closing pension entitlements of the general government employer pension scheme accrue
to 1,012.54 bn. EUR, equal to 43.60 per cent of GDP; the respective figure for the social
security pension scheme adds up to 5,907.65 bn. EUR or 254.40 per cent of GDP. This
means that the outcome lies nearly ten per cent below the result using the PBO approach.
56
ES – Spain
8 ES – Spain
Spain is the second largest country of the European Union in geographical terms. It has a
population of 43.75 million inhabitants as at January 1st, 2006.63 The Spanish economy has
been growing steadily since the transition towards democracy started in 1975. The
accession to the European Community in 1986 furthered the Spanish economic expansion
accompanied by a falling unemployment rate and a reduced inflation rate. It is one of the
twelve countries which introduced the Euro currency on January 1st, 2002. Its GDP is
estimated to be 982.3 bn. EUR in 2006, the corresponding per capita GDP amounts to
22,300 EUR. The Spanish labour force is estimated to be about 21.6 million.
8.1 Demographic situation
From a demographical point of view, Spain represents a special case among the countries
examined in this report. To investigate this issue a little further, one has to go back to the
30s and 40s of the previous century. From 1936 to 1939 the Spanish Civil War took place
resulting in a victory of the Nationalist forces under General Franco. However, in World War
II Spain was neutral, and no acts of war took place on Spanish territory. These two historic
facts can still be recognized in the age-specific population structure of 2006 which is
illustrated in Figure 18:
63 We display country data for 2006 since this is a main base year for our calculations.
57
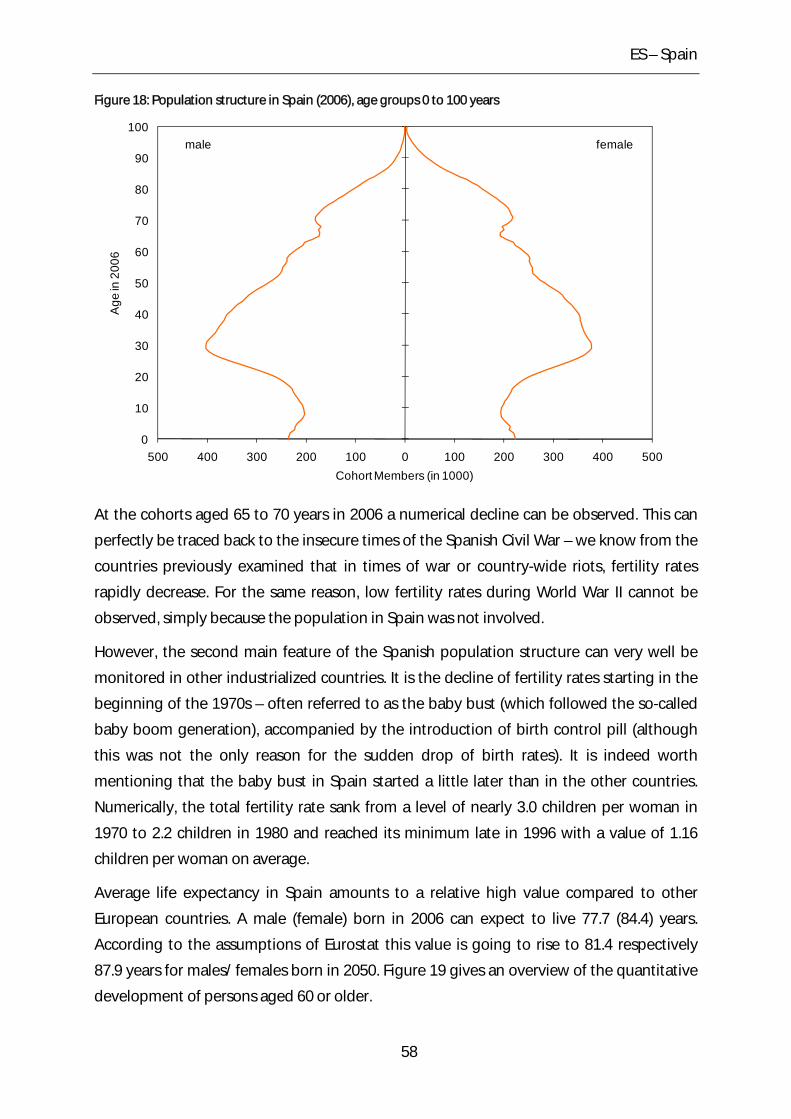
ES – Spain
Figure 18: Population structure in Spain (2006), age groups 0 to 100 years
0
10
20
30
40
50
60
70
80
90
100
500 400 300 200 100 0 100 200 300 400 500
Age
in 2
006
Cohort Members (in 1000)
femalemale
At the cohorts aged 65 to 70 years in 2006 a numerical decline can be observed. This can
perfectly be traced back to the insecure times of the Spanish Civil War – we know from the
countries previously examined that in times of war or country-wide riots, fertility rates
rapidly decrease. For the same reason, low fertility rates during World War II cannot be
observed, simply because the population in Spain was not involved.
However, the second main feature of the Spanish population structure can very well be
monitored in other industrialized countries. It is the decline of fertility rates starting in the
beginning of the 1970s – often referred to as the baby bust (which followed the so-called
baby boom generation), accompanied by the introduction of birth control pill (although
this was not the only reason for the sudden drop of birth rates). It is indeed worth
mentioning that the baby bust in Spain started a little later than in the other countries.
Numerically, the total fertility rate sank from a level of nearly 3.0 children per woman in
1970 to 2.2 children in 1980 and reached its minimum late in 1996 with a value of 1.16
children per woman on average.
Average life expectancy in Spain amounts to a relative high value compared to other
European countries. A male (female) born in 2006 can expect to live 77.7 (84.4) years.
According to the assumptions of Eurostat this value is going to rise to 81.4 respectively
87.9 years for males/ females born in 2050. Figure 19 gives an overview of the quantitative
development of persons aged 60 or older.
58
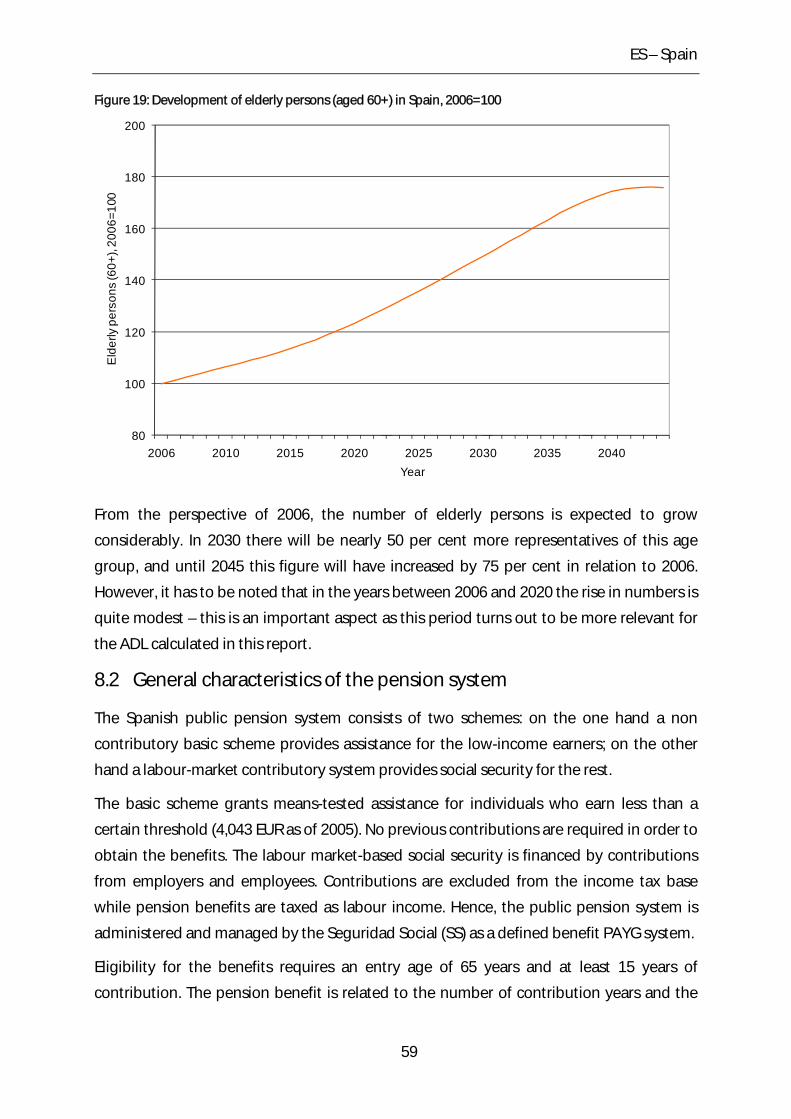
ES – Spain
Figure 19: Development of elderly persons (aged 60+) in Spain, 2006=100
80
100
120
140
160
180
200
2006 2010 2015 2020 2025 2030 2035 2040
Eld
erly
per
sons
(60+
), 20
06=1
00
Year
From the perspective of 2006, the number of elderly persons is expected to grow
considerably. In 2030 there will be nearly 50 per cent more representatives of this age
group, and until 2045 this figure will have increased by 75 per cent in relation to 2006.
However, it has to be noted that in the years between 2006 and 2020 the rise in numbers is
quite modest – this is an important aspect as this period turns out to be more relevant for
the ADL calculated in this report.
8.2 General characteristics of the pension system
The Spanish public pension system consists of two schemes: on the one hand a non
contributory basic scheme provides assistance for the low-income earners; on the other
hand a labour-market contributory system provides social security for the rest.
The basic scheme grants means-tested assistance for individuals who earn less than a
certain threshold (4,043 EUR as of 2005). No previous contributions are required in order to
obtain the benefits. The labour market-based social security is financed by contributions
from employers and employees. Contributions are excluded from the income tax base
while pension benefits are taxed as labour income. Hence, the public pension system is
administered and managed by the Seguridad Social (SS) as a defined benefit PAYG system.
Eligibility for the benefits requires an entry age of 65 years and at least 15 years of
contribution. The pension benefit is related to the number of contribution years and the
59
ES – Spain
contributions paid. The earnings base is pay over the last 15 years. Benefits start at 50 per
cent of the earnings base if an individual retires at 65 with the minimum required years of
contribution. Each additional year until 25 increases the benefits by three per cent and
afterwards by two per cent each additional contribution year until 35. Early retirement is
penalized with benefit reductions of eight per cent for every year of premature retirement;
by six per cent in the case of individuals who have contributed for at least 40 years.
Pensions are adjusted in line with inflation.64
The reform of 2002 has further abolished the mandatory retirement age in the private
sector (65 years of age) and incentivised labour after that age by increasing pension
benefits by two per cent for each additional year of work. Moreover, pensions have been
made compatible with part-time work, adjusting the pension benefits to the length of the
working day.
8.3 Recent reforms of the pension system
The New Law on Social Security Measures which came into force on January 1st, 2008
changed some parameters regarding early retirement pensions and old age pensions. The
goal of this pension reform was to increase labour participation and improve the balance
of the pension system in terms of long-term sustainability. The following adjustments have
been conducted: Preconditions to partial retirement have been incremented; incentives
for postponing old-age retirement have been improved and certain aspects of invalidity
pensions have been alterated.65
8.4 Results
Analogous to the previous chapters, we use the pension benefits paid in 2005, 2006 and
2007 as a starting point. These are shown in Table 16.66
64 For a closer look on the Spanish pension system, see OECD (2007), p. 181-182. 65 For a closer look on the pension reform 2007 in Spain see Ministry of Labour and Social Affairs (2008). 66 For the year 2007, no breakdown of total pension payments was available.
60
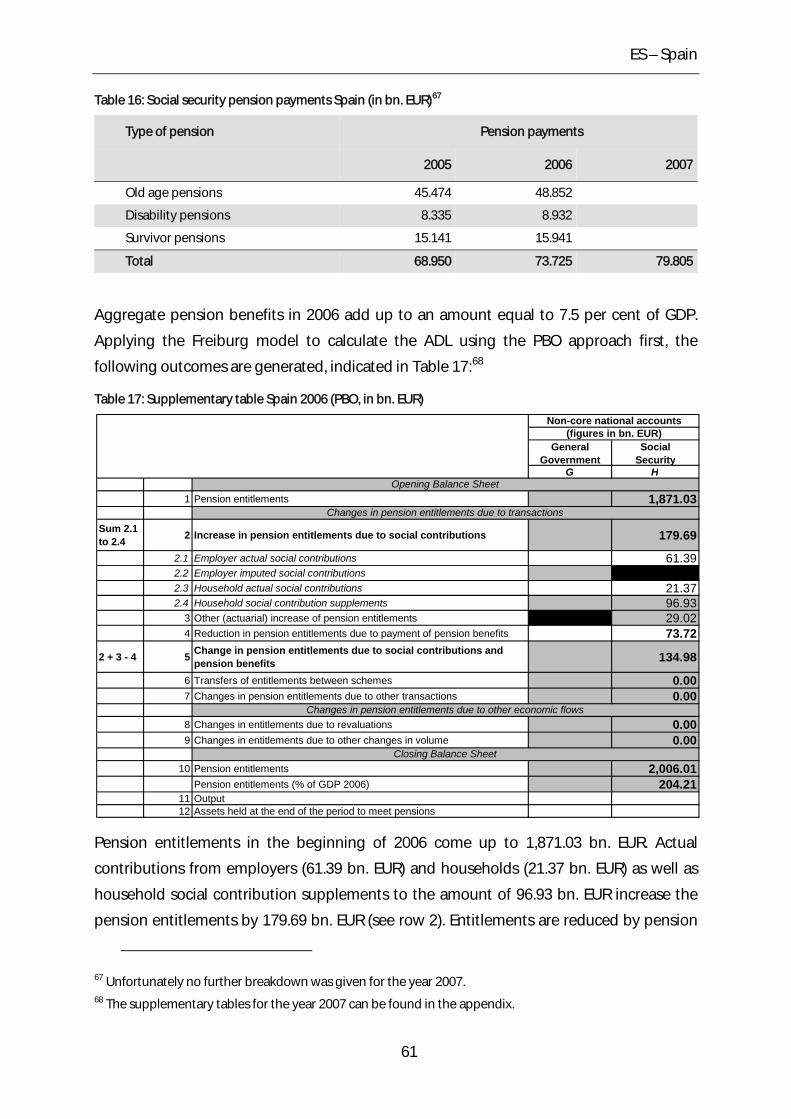
ES – Spain
Table 16: Social security pension payments Spain (in bn. EUR)67
Type of pension Pension payments
2005 2006 2007
Old age pensions 45.474 48.852
Disability pensions 8.335 8.932
Survivor pensions 15.141 15.941
Total 68.950 73.725 79.805
Aggregate pension benefits in 2006 add up to an amount equal to 7.5 per cent of GDP.
Applying the Freiburg model to calculate the ADL using the PBO approach first, the
following outcomes are generated, indicated in Table 17:68
Table 17: Supplementary table Spain 2006 (PBO, in bn. EUR)
General Government
Social Security
G H
1 Pension entitlements 1,871.03
Sum 2.1 to 2.4 2 Increase in pension entitlements due to social contributions 179.69
2.1 Employer actual social contributions 61.392.2 Employer imputed social contributions2.3 Household actual social contributions 21.372.4 Household social contribution supplements 96.93
3 Other (actuarial) increase of pension entitlements 29.024 Reduction in pension entitlements due to payment of pension benefits 73.72
2 + 3 - 4 5 Change in pension entitlements due to social contributions and pension benefits 134.98
6 Transfers of entitlements between schemes 0.007 Changes in pension entitlements due to other transactions 0.00
8 Changes in entitlements due to revaluations 0.009 Changes in entitlements due to other changes in volume 0.00
10 Pension entitlements 2,006.01Pension entitlements (% of GDP 2006) 204.21
11 Output12 Assets held at the end of the period to meet pensions
Closing Balance Sheet
Non-core national accounts(figures in bn. EUR)
Changes in pension entitlements due to transactions
Changes in pension entitlements due to other economic flows
Opening Balance Sheet
Pension entitlements in the beginning of 2006 come up to 1,871.03 bn. EUR. Actual
contributions from employers (61.39 bn. EUR) and households (21.37 bn. EUR) as well as
household social contribution supplements to the amount of 96.93 bn. EUR increase the
pension entitlements by 179.69 bn. EUR (see row 2). Entitlements are reduced by pension
67 Unfortunately no further breakdown was given for the year 2007. 68 The supplementary tables for the year 2007 can be found in the appendix.
61
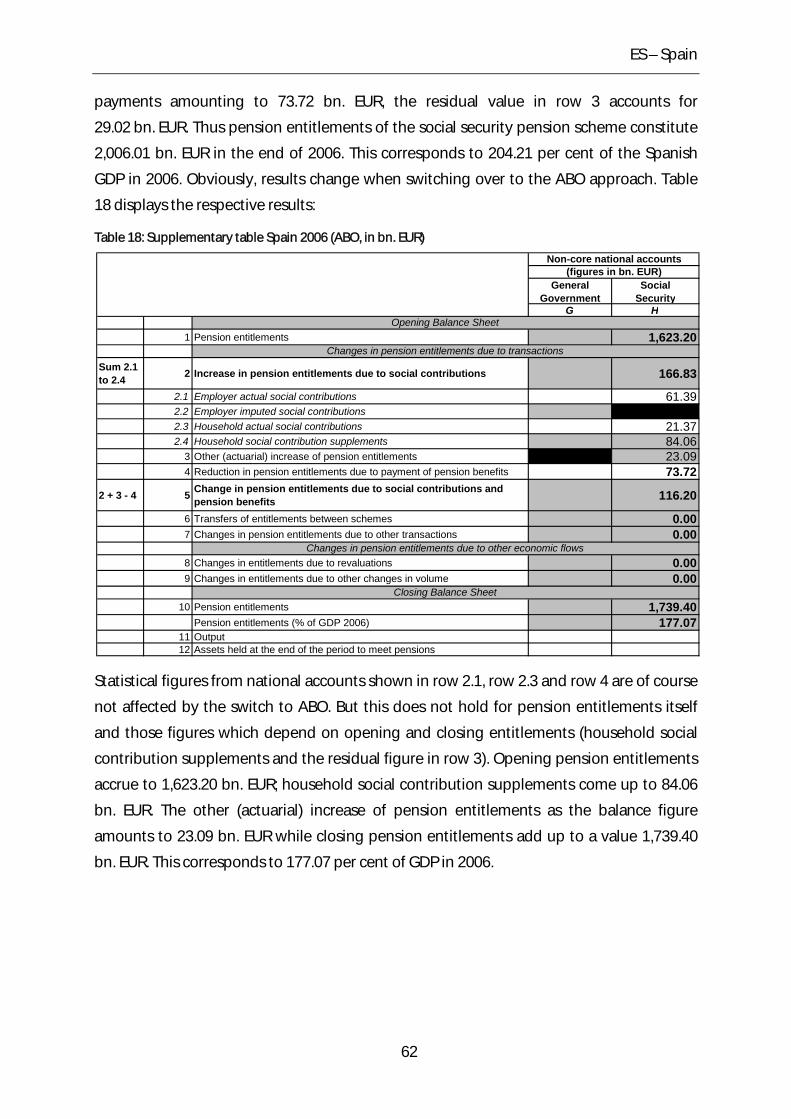
ES – Spain
payments amounting to 73.72 bn. EUR, the residual value in row 3 accounts for
29.02 bn. EUR. Thus pension entitlements of the social security pension scheme constitute
2,006.01 bn. EUR in the end of 2006. This corresponds to 204.21 per cent of the Spanish
GDP in 2006. Obviously, results change when switching over to the ABO approach. Table
18 displays the respective results:
Table 18: Supplementary table Spain 2006 (ABO, in bn. EUR)
General Government
Social Security
G H
1 Pension entitlements 1,623.20
Sum 2.1 to 2.4 2 Increase in pension entitlements due to social contributions 166.83
2.1 Employer actual social contributions 61.392.2 Employer imputed social contributions2.3 Household actual social contributions 21.372.4 Household social contribution supplements 84.06
3 Other (actuarial) increase of pension entitlements 23.094 Reduction in pension entitlements due to payment of pension benefits 73.72
2 + 3 - 4 5 Change in pension entitlements due to social contributions and pension benefits 116.20
6 Transfers of entitlements between schemes 0.007 Changes in pension entitlements due to other transactions 0.00
8 Changes in entitlements due to revaluations 0.009 Changes in entitlements due to other changes in volume 0.00
10 Pension entitlements 1,739.40Pension entitlements (% of GDP 2006) 177.07
11 Output12 Assets held at the end of the period to meet pensions
Closing Balance Sheet
Non-core national accounts(figures in bn. EUR)
Changes in pension entitlements due to transactions
Changes in pension entitlements due to other economic flows
Opening Balance Sheet
Statistical figures from national accounts shown in row 2.1, row 2.3 and row 4 are of course
not affected by the switch to ABO. But this does not hold for pension entitlements itself
and those figures which depend on opening and closing entitlements (household social
contribution supplements and the residual figure in row 3). Opening pension entitlements
accrue to 1,623.20 bn. EUR; household social contribution supplements come up to 84.06
bn. EUR. The other (actuarial) increase of pension entitlements as the balance figure
amounts to 23.09 bn. EUR while closing pension entitlements add up to a value 1,739.40
bn. EUR. This corresponds to 177.07 per cent of GDP in 2006.
62
FI – Finland
9 FI – Finland
Finland has a population of 5.26 million inhabitants as at January 1st, 2006.69 The national
currency is the Euro since Finland is one of the twelve countries which introduced the Euro
currency on January 1st, 2002. Finland has a highly industrialized free-market economy
with a per capita output even higher than other western economies such as France,
Germany or Sweden. The largest sector of the economy is services at 65.7 per cent,
followed by manufacturing and refining at 31.4 per cent. The GDP in 2006 added up to
167.0 bn. EUR; this corresponds to a per capita GDP of 31,700 EUR.
9.1 Demographic situation
Finland is, after Norway and Iceland, the most sparsely populated country in Europe.
Nevertheless, it features a rather interesting demographic history in terms of fertility. The
fertility rate after World War II showed an unusual high figure of 3.5 births per woman –
most other European countries faced fertility rates well below replacement level of 2.1 –, it
dropped to a minimum of 1.5 in 1973 as in most other European countries at that time,
finally stabilized at a value of around 1.8 and stayed at that level until 2006. The current
fertility rate can be regarded as the upper end in a European context, comparable to
countries like Denmark, Sweden or the UK. Figure 20 shows the age-specific population
structure of Finland in 2006.
69 Figure as at January 1st, 2006. We display country data for 2006 since this is a main base year for our calculations.
63
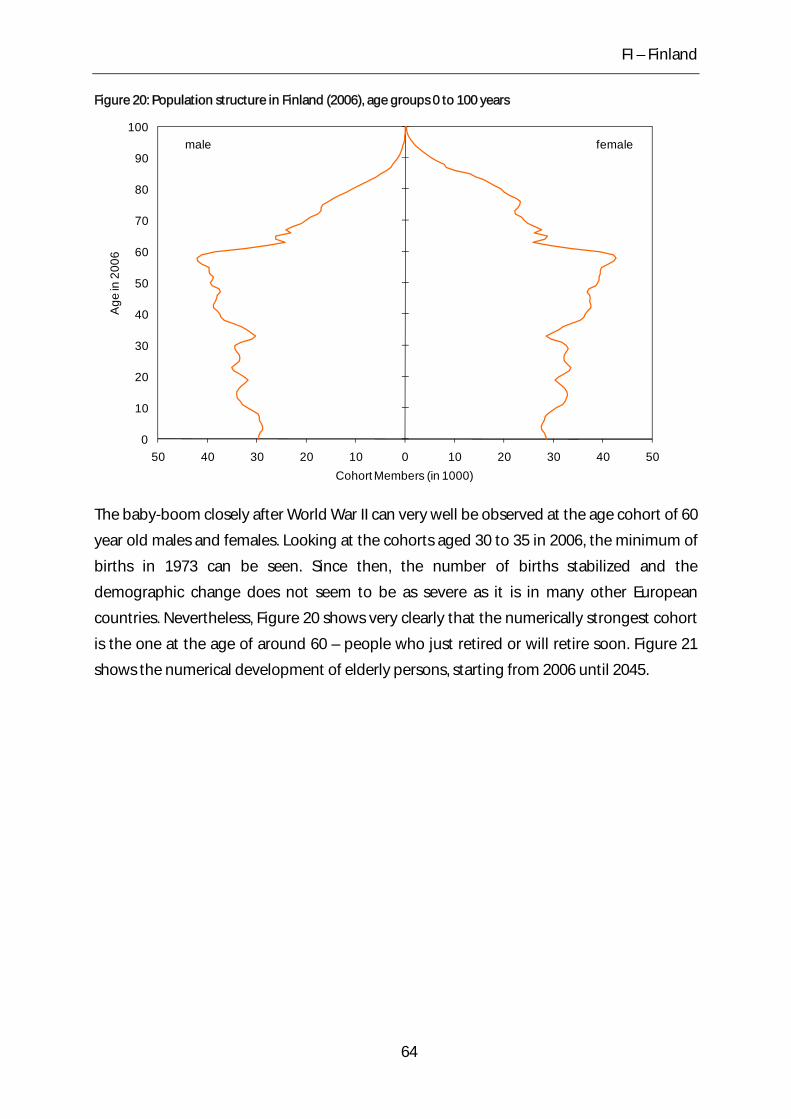
FI – Finland
Figure 20: Population structure in Finland (2006), age groups 0 to 100 years
0
10
20
30
40
50
60
70
80
90
100
50 40 30 20 10 0 10 20 30 40 50
Age
in 2
006
Cohort Members (in 1000)
femalemale
The baby-boom closely after World War II can very well be observed at the age cohort of 60
year old males and females. Looking at the cohorts aged 30 to 35 in 2006, the minimum of
births in 1973 can be seen. Since then, the number of births stabilized and the
demographic change does not seem to be as severe as it is in many other European
countries. Nevertheless, Figure 20 shows very clearly that the numerically strongest cohort
is the one at the age of around 60 – people who just retired or will retire soon. Figure 21
shows the numerical development of elderly persons, starting from 2006 until 2045.
64
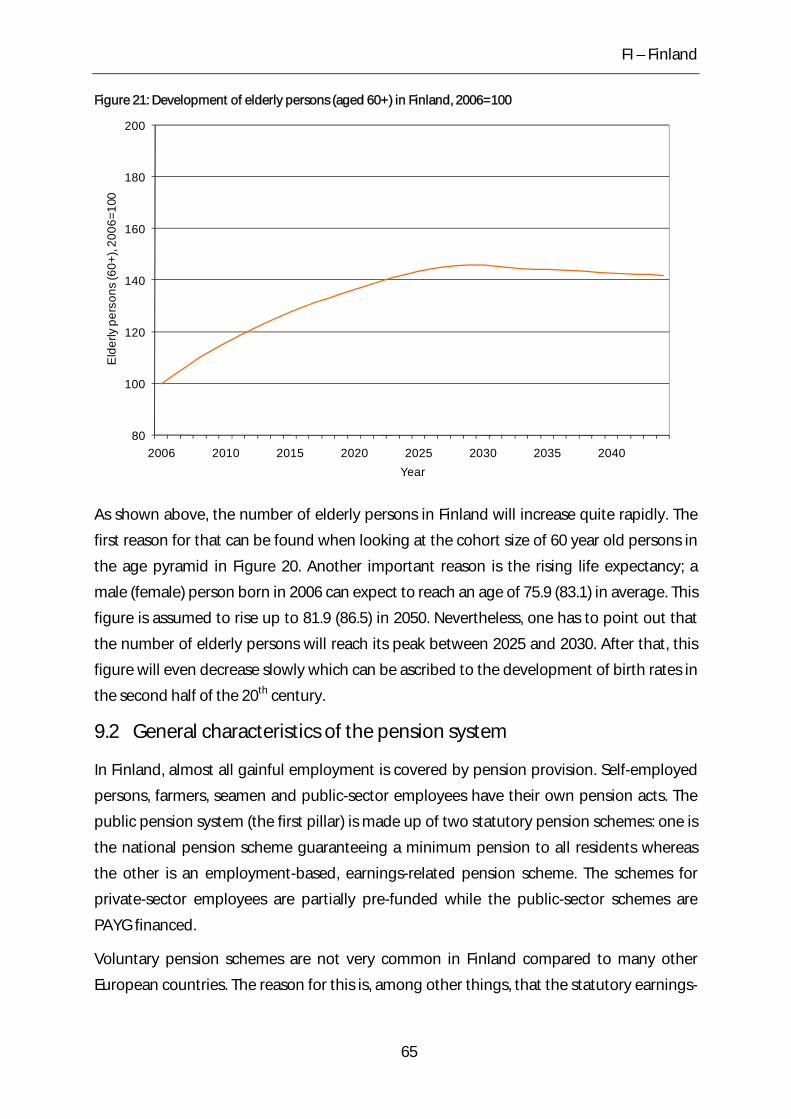
FI – Finland
Figure 21: Development of elderly persons (aged 60+) in Finland, 2006=100
80
100
120
140
160
180
200
2006 2010 2015 2020 2025 2030 2035 2040
Eld
erly
per
sons
(60+
), 20
06=1
00
Year
As shown above, the number of elderly persons in Finland will increase quite rapidly. The
first reason for that can be found when looking at the cohort size of 60 year old persons in
the age pyramid in Figure 20. Another important reason is the rising life expectancy; a
male (female) person born in 2006 can expect to reach an age of 75.9 (83.1) in average. This
figure is assumed to rise up to 81.9 (86.5) in 2050. Nevertheless, one has to point out that
the number of elderly persons will reach its peak between 2025 and 2030. After that, this
figure will even decrease slowly which can be ascribed to the development of birth rates in
the second half of the 20th century.
9.2 General characteristics of the pension system
In Finland, almost all gainful employment is covered by pension provision. Self-employed
persons, farmers, seamen and public-sector employees have their own pension acts. The
public pension system (the first pillar) is made up of two statutory pension schemes: one is
the national pension scheme guaranteeing a minimum pension to all residents whereas
the other is an employment-based, earnings-related pension scheme. The schemes for
private-sector employees are partially pre-funded while the public-sector schemes are
PAYG financed.
Voluntary pension schemes are not very common in Finland compared to many other
European countries. The reason for this is, among other things, that the statutory earnings-
65
FI – Finland
related pension scheme has no upper limit for the pensionable earnings or for the pension.
In 2000, pensions for voluntary schemes represented only 4.4 per cent of all pension
benefits while contributions were 5.6 per cent of total contribution. While the second pillar
occupational schemes are decreasing, individual savings are increasing their importance.
The statutory schemes are closely linked together, with the amount of national pension
depending on the size of the earnings-related pension benefits. Increases in the earnings-
related pension reduce the national pension by 50 per cent of the increase in the earnings-
related pension. If the earnings-related pension is above a defined level, the national
pension is not paid at all. Therefore only about half of pensioners who receive an earnings-
related pension also receive a national pension. At the same time there are 100,000
pensioners getting only national pension. Taking all pension types into account the total
number of pensioners in 2004 was roughly 1.3 million.
National pensions are intended to provide a basic retirement income for those whose
earnings-related pensions are small or non-existent. All residents of Finland are eligible for
the national pension. It is a flat-rate benefit, financed through taxes and contributions, and
is based on residence for people over 65 without a sufficient earnings related entitlement.
It is means-tested, which means that only those who do not receive an income pension
can receive the national pension at its maximum level.70
The financing of earnings-related pensions is a combination of a fully funded and a PAYG
system based on pension contributions from both employers and employees. The pre-
funded scheme covers approximately one quarter of earnings-related pension outlays, the
rest is financed through the PAYG system. Despite the partially funded system in pensions,
Finland’s earnings-related pension scheme is entirely of the defined-benefit type. The pre-
funding is collective in the sense that it actually has no effect on the size of the pension.
The main purpose of the pre-funding is to smooth pension contributions in the coming
years. The financial position of the earnings-related pension scheme is fairly good as the
system is running on surpluses. The annual surplus amounts to some 2.5 per cent in
relation to GDP. The market value of the pension fund’s assets was 58.7 per cent of GDP in
2004.
The earnings-related pension scheme consists of several pension acts, which together
cover the different sectors of the economy. In practice, all work between 18 and 67 years of
70 According to the final report of the European Central Bank/ Eurostat Task Force (2008), social assistance benefits shall not be considered in the supplementary table (see p. 20). The national pension scheme in Finland can be regarded as a social assistance scheme, thus, it will not be included in our calculations.
66
FI – Finland
age, as employee or as an entrepreneur, is insured through the earnings-related pension
acts.71 The individual pension is accumulated according to the following rules:
Pensions accrue from all earnings between the age of 18 to 52 at the rate of 1.5 per cent of
wages a year, from 53 to 62 at 1.9 per cent and from 63 to 68 at 1.5 (if he or she draws an
old-age pension) or 4.5 per cent a year without any cap. For a full-career worker working
from age 20 until retirement at age 65, the total lifetime accrual will be 77.5 per cent of
pensionable earnings.72
9.3 Recent reforms of the pension system
The Finnish pension system has been relatively stable over the last two decades as no
major structural changes have been made. However, the severe recession in the 1990s
forced cuts in labour costs and outlined the underlying problems of long-term
sustainability of the pension system. A number of parametric changes have been
implemented in the 1990s; these include, amongst others, an increase of the retirement
age and a reduction of the target replacement rate both in the public sector.
These modifications have been commonly perceived as a flexibility of the system and as a
feature showing the ability of the system to adapt to the changing circumstances. From
the other side, these parametric reforms have had quite substantial cost containing effects.
Without these reforms, the contribution rate would have had to increase by eight
percentage points over the next 30 years.
Since 1999, buffer funds have been developed in the earnings-related pension system in
order to control sudden disturbances caused by recessions. This measure is linked to
Finland’s participation in the European Economic and Monetary Union (EMU), as during a
recession the EMU requirements would otherwise be difficult to meet. The development of
buffer funds entails that in the period of strong economic growth the contribution rate can
be raised, and lowered during recession.
A major reform of the Finnish private sector earnings-related pension system was agreed
on in 2001-2002. The agreement was justified by the need to mitigate rising pension costs
due to population ageing, similar to arguments spurring many other recent reforms in
71 The private sector pension acts are the employees pensions act (TyEL), the seamen’s pensions act (MEL), the self-employed persons' pensions act (YEL), the farmers’ pensions act (MYEL) and the farm closure allowance act (LUTUL); the public sector pension acts are the state employees’ pensions act (VaEL) the local government pensions act (KuEL), the Evangelical-Lutheran church pensions act (KiEL) and the pension regulation for employees of the social insurance institution (KELA). 72 For a detailed description of the pension scheme in Finland, see European commission (2007), p. 331 et sqq.
67
FI – Finland
Europe. The large reform package consisted of an interesting combination of measures
that were expected to improve both the economic and social sustainability of the pension
system. The main aims were to base the pensionable pay on average earnings of the whole
career, to change the indexation of pension rights to 80:20 before retirement are and 20:80
after retirement (wage growth: CPI), to introduce a life expectancy coefficient which
adjusts pension expenditure according to the changes in life expectancy, and to
implement a flexible retirement age for the old age pension between ages 63 and 68.73
9.4 Results
The following tables show the total pension expenditures of the various pension schemes,
beginning with the private sector in Table 19:
Table 19: Social security pension payments Finland (in bn. EUR, private sector)
Type of pension Pension payments
2005 2006 2007
Old age pensions 5.492 5.912 6.377
Disability pensions 1.928 1.818 1.849
Survivor pensions 0.858 0.898 0.953
Total 8.278 8.628 9.179
Expressed as a fraction of the GDP in the respective year, the pension expenditures
changed from 5.3 per cent in 2005 to 5.2 per cent in 2006 and 5.1 per cent which means
that expenditures for private sector pension developed rather constantly with a small
downward trend. Table 20 shows the respective pension payments for the public sector
pensions, divided into the VaEL on the one hand and other public employees pensions on
the other hand:
73 For a detailed description of if the 2005 pension reform in Finland see Lassila and Valkonen (2006).
68
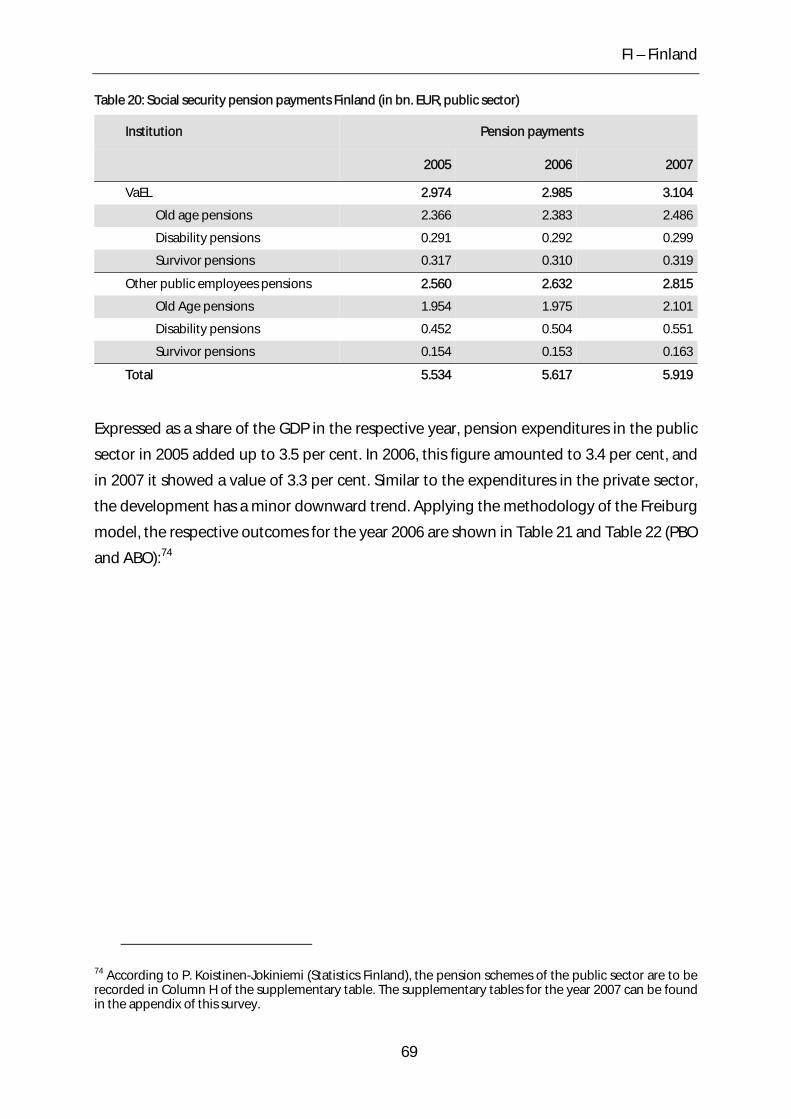
FI – Finland
Table 20: Social security pension payments Finland (in bn. EUR, public sector)
Institution Pension payments
2005 2006 2007
VaEL 2.974 2.985 3.104
Old age pensions 2.366 2.383 2.486
Disability pensions 0.291 0.292 0.299
Survivor pensions 0.317 0.310 0.319
Other public employees pensions 2.560 2.632 2.815
Old Age pensions 1.954 1.975 2.101
Disability pensions 0.452 0.504 0.551
Survivor pensions 0.154 0.153 0.163
Total 5.534 5.617 5.919
Expressed as a share of the GDP in the respective year, pension expenditures in the public
sector in 2005 added up to 3.5 per cent. In 2006, this figure amounted to 3.4 per cent, and
in 2007 it showed a value of 3.3 per cent. Similar to the expenditures in the private sector,
the development has a minor downward trend. Applying the methodology of the Freiburg
model, the respective outcomes for the year 2006 are shown in Table 21 and Table 22 (PBO
and ABO):74
74 According to P. Koistinen-Jokiniemi (Statistics Finland), the pension schemes of the public sector are to be recorded in Column H of the supplementary table. The supplementary tables for the year 2007 can be found in the appendix of this survey.
69
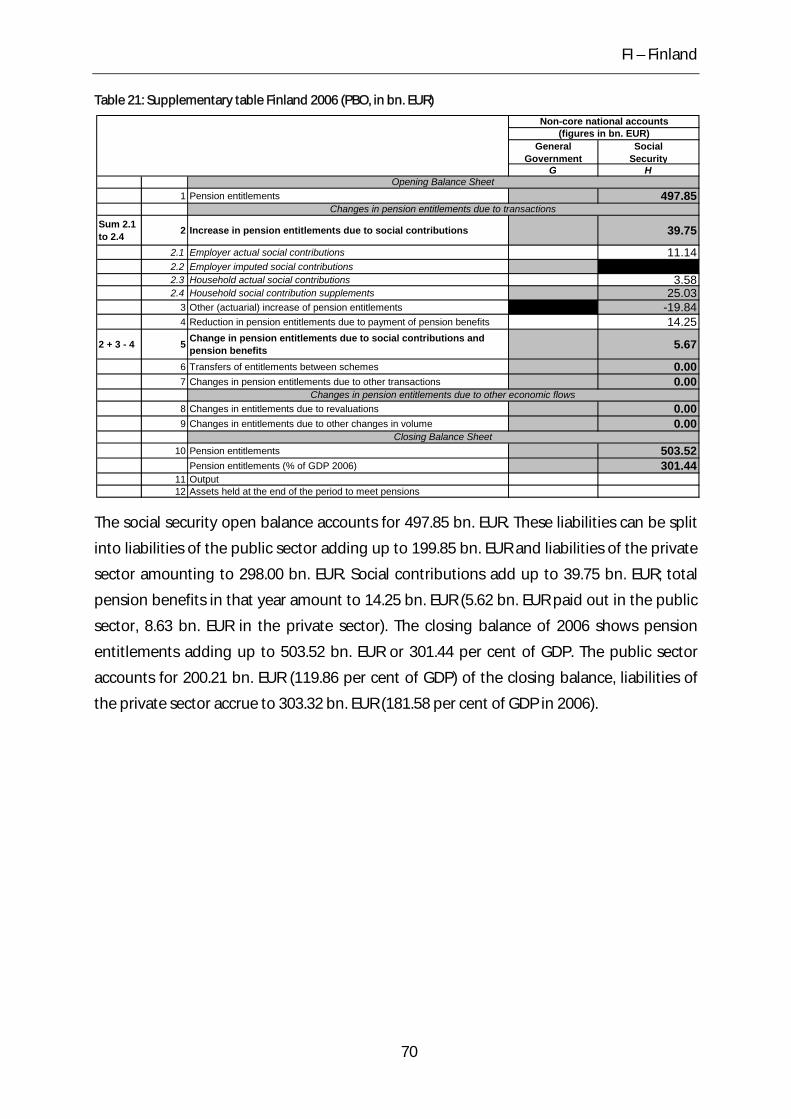
FI – Finland
Table 21: Supplementary table Finland 2006 (PBO, in bn. EUR)
General Government
Social Security
G H
1 Pension entitlements 497.85
Sum 2.1 to 2.4 2 Increase in pension entitlements due to social contributions 39.75
2.1 Employer actual social contributions 11.142.2 Employer imputed social contributions2.3 Household actual social contributions 3.582.4 Household social contribution supplements 25.03
3 Other (actuarial) increase of pension entitlements -19.844 Reduction in pension entitlements due to payment of pension benefits 14.25
2 + 3 - 4 5 Change in pension entitlements due to social contributions and pension benefits 5.67
6 Transfers of entitlements between schemes 0.007 Changes in pension entitlements due to other transactions 0.00
8 Changes in entitlements due to revaluations 0.009 Changes in entitlements due to other changes in volume 0.00
10 Pension entitlements 503.52Pension entitlements (% of GDP 2006) 301.44
11 Output12 Assets held at the end of the period to meet pensions
Closing Balance Sheet
Non-core national accounts(figures in bn. EUR)
Opening Balance Sheet
Changes in pension entitlements due to transactions
Changes in pension entitlements due to other economic flows
The social security open balance accounts for 497.85 bn. EUR. These liabilities can be split
into liabilities of the public sector adding up to 199.85 bn. EUR and liabilities of the private
sector amounting to 298.00 bn. EUR. Social contributions add up to 39.75 bn. EUR; total
pension benefits in that year amount to 14.25 bn. EUR (5.62 bn. EUR paid out in the public
sector, 8.63 bn. EUR in the private sector). The closing balance of 2006 shows pension
entitlements adding up to 503.52 bn. EUR or 301.44 per cent of GDP. The public sector
accounts for 200.21 bn. EUR (119.86 per cent of GDP) of the closing balance, liabilities of
the private sector accrue to 303.32 bn. EUR (181.58 per cent of GDP in 2006).
70
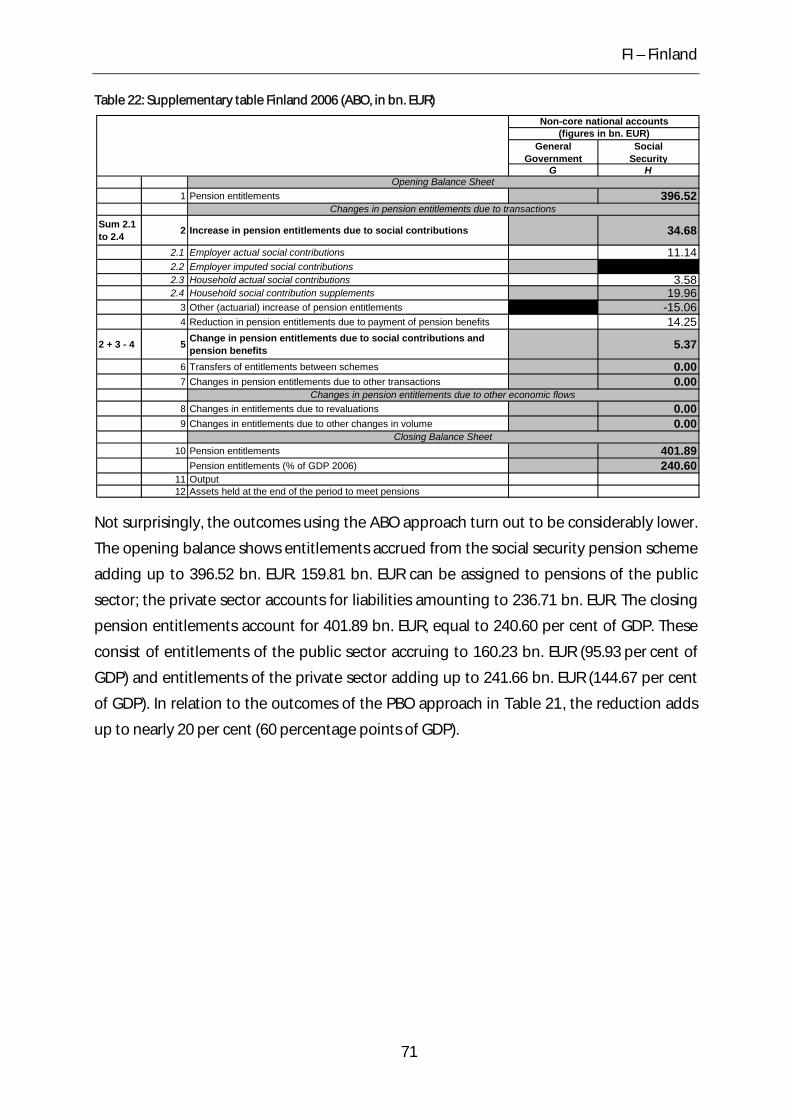
FI – Finland
Table 22: Supplementary table Finland 2006 (ABO, in bn. EUR)
General Government
Social Security
G H
1 Pension entitlements 396.52
Sum 2.1 to 2.4 2 Increase in pension entitlements due to social contributions 34.68
2.1 Employer actual social contributions 11.142.2 Employer imputed social contributions2.3 Household actual social contributions 3.582.4 Household social contribution supplements 19.96
3 Other (actuarial) increase of pension entitlements -15.064 Reduction in pension entitlements due to payment of pension benefits 14.25
2 + 3 - 4 5 Change in pension entitlements due to social contributions and pension benefits 5.37
6 Transfers of entitlements between schemes 0.007 Changes in pension entitlements due to other transactions 0.00
8 Changes in entitlements due to revaluations 0.009 Changes in entitlements due to other changes in volume 0.00
10 Pension entitlements 401.89Pension entitlements (% of GDP 2006) 240.60
11 Output12 Assets held at the end of the period to meet pensions
Closing Balance Sheet
Non-core national accounts(figures in bn. EUR)
Opening Balance Sheet
Changes in pension entitlements due to transactions
Changes in pension entitlements due to other economic flows
Not surprisingly, the outcomes using the ABO approach turn out to be considerably lower.
The opening balance shows entitlements accrued from the social security pension scheme
adding up to 396.52 bn. EUR. 159.81 bn. EUR can be assigned to pensions of the public
sector; the private sector accounts for liabilities amounting to 236.71 bn. EUR. The closing
pension entitlements account for 401.89 bn. EUR, equal to 240.60 per cent of GDP. These
consist of entitlements of the public sector accruing to 160.23 bn. EUR (95.93 per cent of
GDP) and entitlements of the private sector adding up to 241.66 bn. EUR (144.67 per cent
of GDP). In relation to the outcomes of the PBO approach in XXTable 21X, the reduction adds
up to nearly 20 per cent (60 percentage points of GDP).
71
FR – France
10 FR – France
The population of the French Republic amounted to 63.00 million inhabitants.75 The
national currency in France is the Euro. The GDP amounted to 1,807.5 bn. EUR in 2006
which is in accordance with a per capita GDP of 28,600 EUR.
The French economy is largely dominated by the service sector which accounts for about
77 per cent of GDP (excluding state sector) compared to about 20 per cent in the industrial
sector. The largest single contributions within the service sector stem from enterprise and
financial services including estate services (each accounting for about one third) and trade
services (about 20 per cent). Intermediates are the largest single category in the industrial
sector accounting for about one third of value added.
10.1 Demographic situation
Compared to most other EU members, France has had a relatively high fertility rate. On
average, a French woman gives birth to almost two children. This corresponds to a total
fertility rate of 2.0 in 2006. As with most industrialized countries, life expectancy in France
rose in the past and is expected to rise further in the future. Life expectancy for a male
person born in 2006 was 77.4 years, respectively 84.4 years for a female person. Until 2050,
life expectancy is assumed to rise to 82.7 and 89.1 accordingly (male/female).76 Figure 22
shows the age-specific population structure in France for the year of 2006.
75 Figure as at January 1st, 2006. We display country data for 2006 since this is a main base year for our calculations. 76 These figures apply to Metropolitan France only.
72
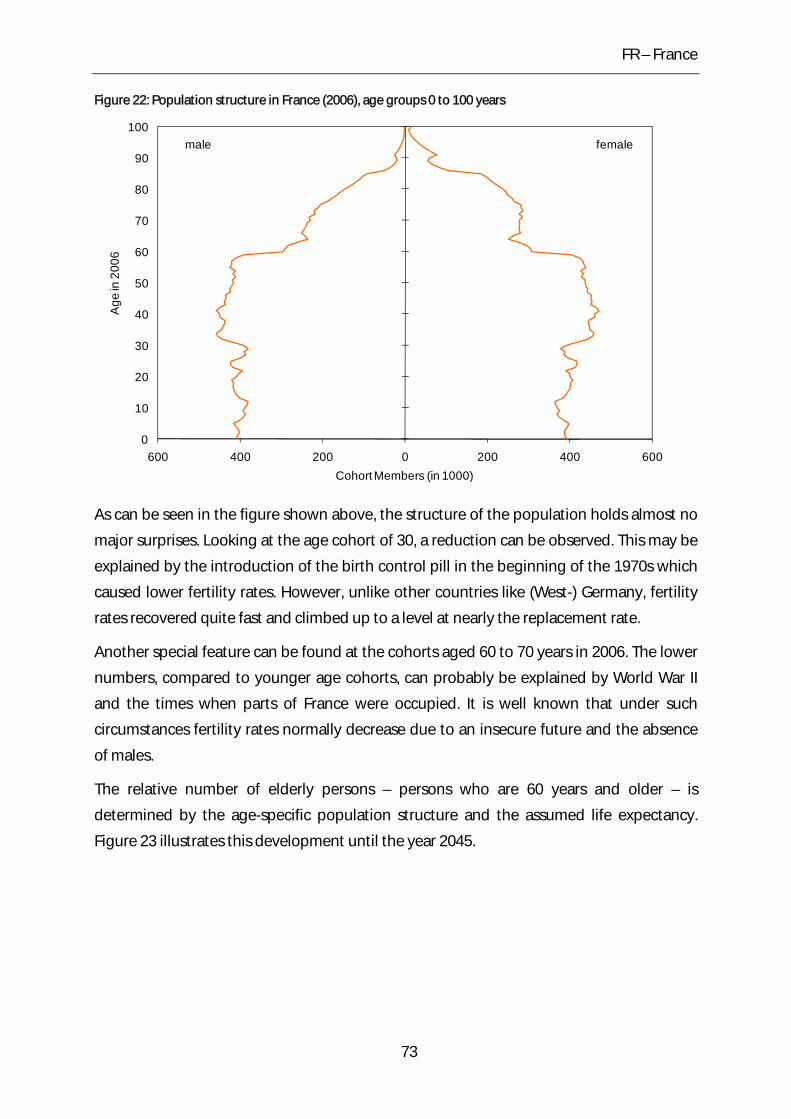
FR – France
Figure 22: Population structure in France (2006), age groups 0 to 100 years
0
10
20
30
40
50
60
70
80
90
100
600 400 200 0 200 400 600
Age
in 2
006
Cohort Members (in 1000)
femalemale
As can be seen in the figure shown above, the structure of the population holds almost no
major surprises. Looking at the age cohort of 30, a reduction can be observed. This may be
explained by the introduction of the birth control pill in the beginning of the 1970s which
caused lower fertility rates. However, unlike other countries like (West-) Germany, fertility
rates recovered quite fast and climbed up to a level at nearly the replacement rate.
Another special feature can be found at the cohorts aged 60 to 70 years in 2006. The lower
numbers, compared to younger age cohorts, can probably be explained by World War II
and the times when parts of France were occupied. It is well known that under such
circumstances fertility rates normally decrease due to an insecure future and the absence
of males.
The relative number of elderly persons – persons who are 60 years and older – is
determined by the age-specific population structure and the assumed life expectancy.
Figure 23 illustrates this development until the year 2045.
73
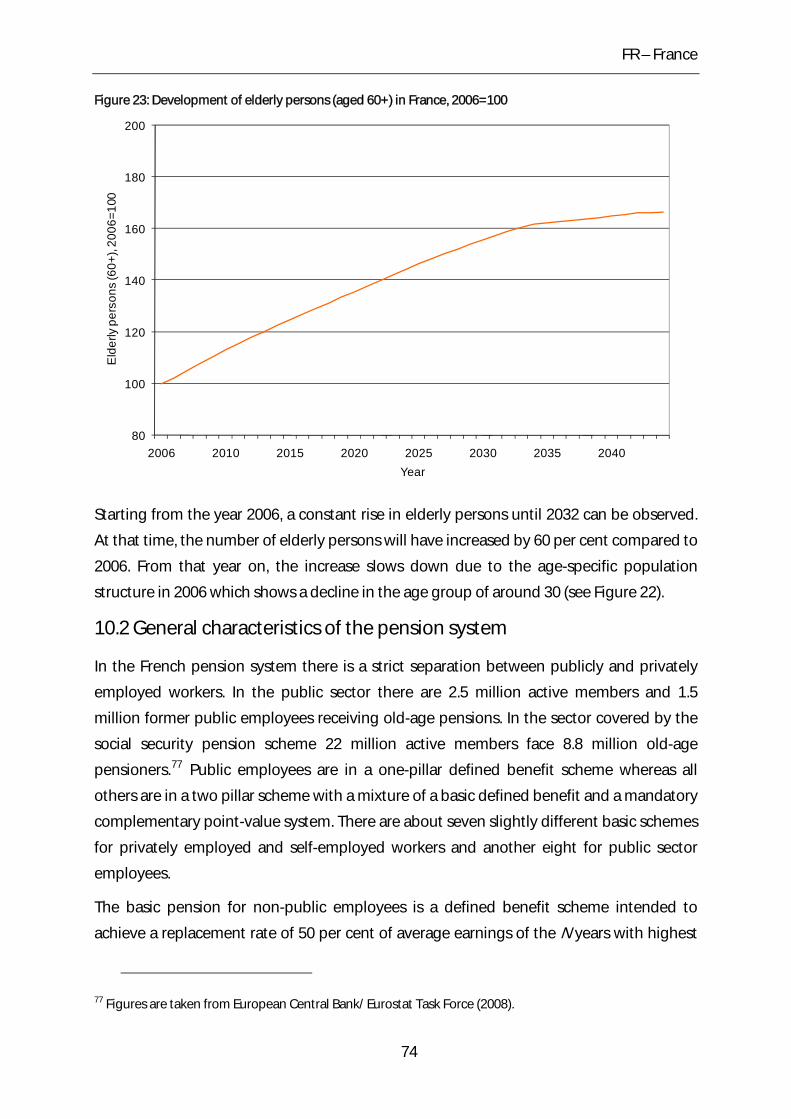
FR – France
Figure 23: Development of elderly persons (aged 60+) in France, 2006=100
80
100
120
140
160
180
200
2006 2010 2015 2020 2025 2030 2035 2040
Eld
erly
per
sons
(60+
), 20
06=1
00
Year
Starting from the year 2006, a constant rise in elderly persons until 2032 can be observed.
At that time, the number of elderly persons will have increased by 60 per cent compared to
2006. From that year on, the increase slows down due to the age-specific population
structure in 2006 which shows a decline in the age group of around 30 (see Figure 22).
10.2 General characteristics of the pension system
In the French pension system there is a strict separation between publicly and privately
employed workers. In the public sector there are 2.5 million active members and 1.5
million former public employees receiving old-age pensions. In the sector covered by the
social security pension scheme 22 million active members face 8.8 million old-age
pensioners.77 Public employees are in a one-pillar defined benefit scheme whereas all
others are in a two pillar scheme with a mixture of a basic defined benefit and a mandatory
complementary point-value system. There are about seven slightly different basic schemes
for privately employed and self-employed workers and another eight for public sector
employees.
The basic pension for non-public employees is a defined benefit scheme intended to
achieve a replacement rate of 50 per cent of average earnings of the N years with highest
77 Figures are taken from European Central Bank/ Eurostat Task Force (2008).
74
FR – France
earnings. N is currently incremented from ten years for those born 1933 or earlier by one
year per cohort to 25 years for those born 1948 and after. Eligibility for full pension requires
at least one out of two conditions: a minimum age of 65 combined with a demanded
contribution time T (160 quarters) or a minimum contribution time C currently being
raised linearly from 150 quarters for the cohorts of 1943 and earlier to 160 for to the 1948
cohort. Between the 1948 and 1952 cohorts T and C are increased by one quarter per year
up to 164 quarters. Thereafter these two parameters are meant to rise in line with life
expectancy, assigning two thirds of additional lifetime to working and the remainder to
retirement.
The pension is prorated by the ratio of actual contribution A to C with a maximum of 1. Per
year of retirement before contribution time T or 65 years of age (earliest age is 60) there is
an additional deduction of ten per cent to be reduced to five per cent soon. For every year
above minimum full pension requirements there is a bonus of three per cent. Benefits are
price-indexed.
The mandatory complementary scheme is a defined contribution point scheme. Employers
pay 60 per cent of the contributions, employees pay 40 per cent. Only 80 per cent of actual
contributions are transferred into points. The number of points is the annual contribution
over reference salary; the pension claim equals the number of points times the point value.
The reference salary is indexed to wage growth whereas the point value is indexed to the
CPI. There is a reduction of one percentage point per quarter when pension is claimed
before age 65.
The public sector pension scheme has, as yet, only one pillar which is defined benefit. The
target replacement rate of a full pension is 75 per cent of the final wage earned for at least
six months. The minimum required contribution time T for a full pension has been raised
by two quarters per year since 2003 and will fall in line with the one in the private sector
scheme at 160 quarters in 2008. Thereafter the same rules will be applied for both
schemes. To calculate the pension the 75 per cent are prorated by the ratio of actual
contribution to T, at most by one. Targeted pension age is 65. Since 2006 there is a
deduction per year that retirement is chosen before a certain age R or before T quarters of
contribution. R will be incremented gradually from 61 years in 2006 to 65 in the end; the
deduction will finally reach five per cent per year as for privately employed people.
10.3 Recent reforms of the pension system
There have been two major pension reforms in France in the last years. The first one, the
so-called Balladur reform goes back to 1993, the other one – the Fillon reform – was
75
FR – France
enacted in 2003. The Balladur reform in 1993 affected only the pensions in the private
sector. The detailed components were the following:
• Gradual increase of the duration condition by one quarter each year from 37.5 years
in 1993 to 40 years in 2003
• Shift of number of years on which past wages are averaged for calculating the
replacement rate; from ten years in pre-1993 conditions one year increase each year
until reaching the value of 25 years in 2008
• Change of formula used for re-evaluating past wages; re-evaluation from 1993
according to prices instead of general productivity growth
• Indexation of pensions after entry according to prices instead of wages.
The Fillon reform in 2003 affected mainly the pensions paid in the public sector, but there
were also some amendments in the private sector. All changes of the reform enacted in
2003 are described here:
• Increase of the duration condition in the public sector from 37.5 years in 2003 to 40
years in 2008 (which meant a convergence of conditions for private and public
sector)
• Further increase of the duration condition in the public sector as well as the private
sector to 41.75 years in 2020.
All of these reform steps were taken into account when calculating the accrued-to-date
liabilities. According to our estimations, the over-all effect of both of the above mentioned
reforms until the year 2020 is a decrease of new pensions by more than 25 per cent in the
public sector and nearly 22 per cent in the private sector in comparison with a fictitious
situation without any reforms.
10.4 Results
The French pension system possesses a government employer pension scheme for the
public sector and a social security pension scheme for the private sector. Table 23 and
XTable 24X show the pension expenditures of these schemes for the years 2005 to 2007.78
78 A further breakdown of pension payments was not available. Data source: Banque de France, Dominique Durant (email dated January 14th, 2009). Please note that since 2006 pensions of the “La Poste” employees are deemed to be financed through a separate scheme which does not belong to the general government scheme. Nevertheless, in our calculations the “La Poste” pensions have been added to the general
76
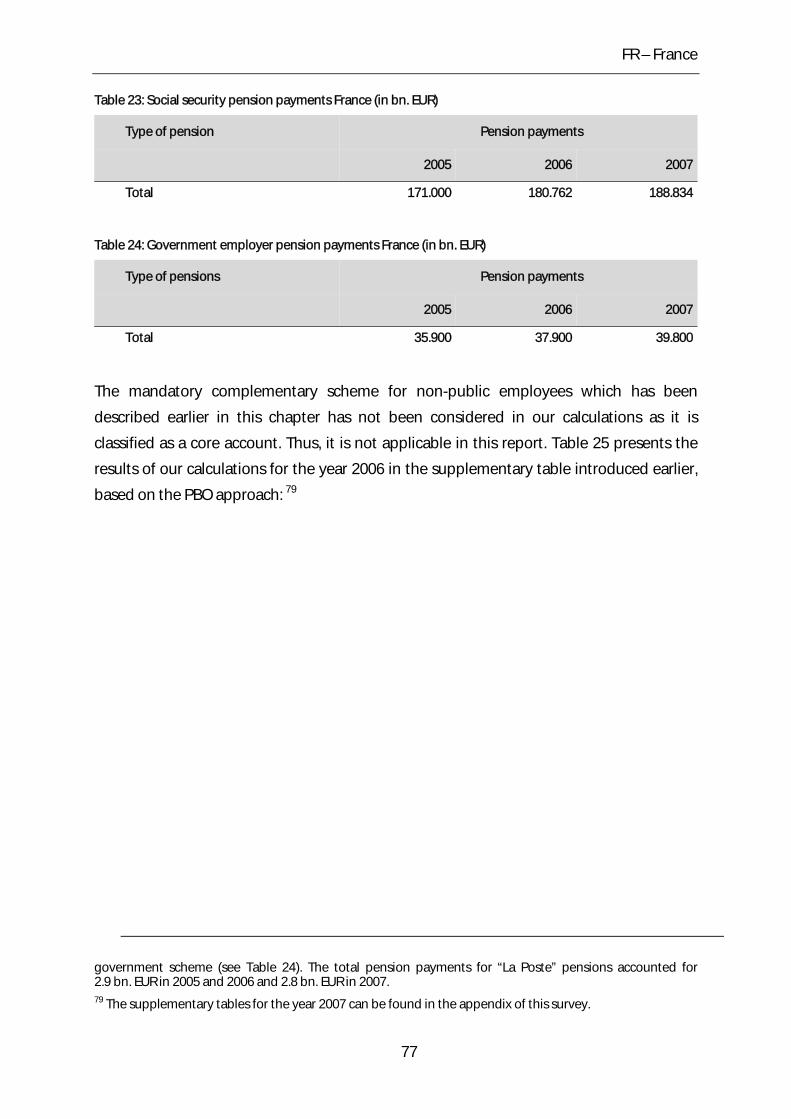
FR – France
Table 23: Social security pension payments France (in bn. EUR)
Type of pension Pension payments
2005 2006 2007
Total 171.000 180.762 188.834
Table 24: Government employer pension payments France (in bn. EUR)
Type of pensions Pension payments
2005 2006 2007
Total 35.900 37.900 39.800
The mandatory complementary scheme for non-public employees which has been
described earlier in this chapter has not been considered in our calculations as it is
classified as a core account. Thus, it is not applicable in this report. Table 25 presents the
results of our calculations for the year 2006 in the supplementary table introduced earlier,
based on the PBO approach: 79
government scheme (see Table 24). The total pension payments for “La Poste” pensions accounted for 2.9 bn. EUR in 2005 and 2006 and 2.8 bn. EUR in 2007. 79 The supplementary tables for the year 2007 can be found in the appendix of this survey.
77
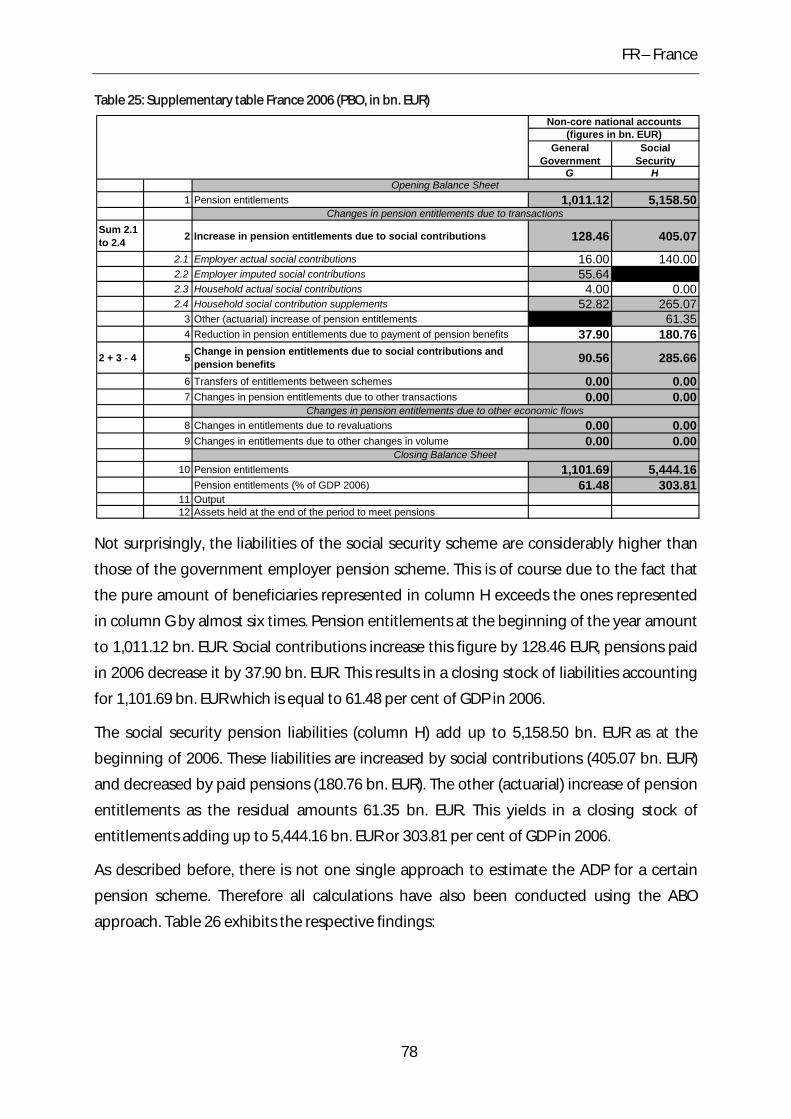
FR – France
Table 25: Supplementary table France 2006 (PBO, in bn. EUR)
General Government
Social Security
G H
1 Pension entitlements 1,011.12 5,158.50
Sum 2.1 to 2.4 2 Increase in pension entitlements due to social contributions 128.46 405.07
2.1 Employer actual social contributions 16.00 140.002.2 Employer imputed social contributions 55.642.3 Household actual social contributions 4.00 0.002.4 Household social contribution supplements 52.82 265.07
3 Other (actuarial) increase of pension entitlements 61.354 Reduction in pension entitlements due to payment of pension benefits 37.90 180.76
2 + 3 - 4 5 Change in pension entitlements due to social contributions and pension benefits 90.56 285.66
6 Transfers of entitlements between schemes 0.00 0.007 Changes in pension entitlements due to other transactions 0.00 0.00
8 Changes in entitlements due to revaluations 0.00 0.009 Changes in entitlements due to other changes in volume 0.00 0.00
10 Pension entitlements 1,101.69 5,444.16Pension entitlements (% of GDP 2006) 61.48 303.81
11 Output12 Assets held at the end of the period to meet pensions
Closing Balance Sheet
Non-core national accounts(figures in bn. EUR)
Changes in pension entitlements due to transactions
Changes in pension entitlements due to other economic flows
Opening Balance Sheet
Not surprisingly, the liabilities of the social security scheme are considerably higher than
those of the government employer pension scheme. This is of course due to the fact that
the pure amount of beneficiaries represented in column H exceeds the ones represented
in column G by almost six times. Pension entitlements at the beginning of the year amount
to 1,011.12 bn. EUR. Social contributions increase this figure by 128.46 EUR, pensions paid
in 2006 decrease it by 37.90 bn. EUR. This results in a closing stock of liabilities accounting
for 1,101.69 bn. EUR which is equal to 61.48 per cent of GDP in 2006.
The social security pension liabilities (column H) add up to 5,158.50 bn. EUR as at the
beginning of 2006. These liabilities are increased by social contributions (405.07 bn. EUR)
and decreased by paid pensions (180.76 bn. EUR). The other (actuarial) increase of pension
entitlements as the residual amounts 61.35 bn. EUR. This yields in a closing stock of
entitlements adding up to 5,444.16 bn. EUR or 303.81 per cent of GDP in 2006.
As described before, there is not one single approach to estimate the ADP for a certain
pension scheme. Therefore all calculations have also been conducted using the ABO
approach. Table 26 exhibits the respective findings:
78

FR – France
Table 26: Supplementary table France 2006 (ABO, in bn. EUR)
General Government
Social Security
G H
1 Pension entitlements 838.63 4,350.43
Sum 2.1 to 2.4 2 Increase in pension entitlements due to social contributions 108.56 363.64
2.1 Employer actual social contributions 16.00 140.002.2 Employer imputed social contributions 44.872.3 Household actual social contributions 4.00 0.002.4 Household social contribution supplements 43.70 223.64
3 Other (actuarial) increase of pension entitlements 61.764 Reduction in pension entitlements due to payment of pension benefits 37.90 180.76
2 + 3 - 4 5 Change in pension entitlements due to social contributions and pension benefits 70.66 244.63
6 Transfers of entitlements between schemes 0.00 0.007 Changes in pension entitlements due to other transactions 0.00 0.00
8 Changes in entitlements due to revaluations 0.00 0.009 Changes in entitlements due to other changes in volume 0.00 0.00
10 Pension entitlements 909.30 4,595.06Pension entitlements (% of GDP 2006) 50.74 256.43
11 Output12 Assets held at the end of the period to meet pensions
Closing Balance Sheet
Non-core national accounts(figures in bn. EUR)
Changes in pension entitlements due to transactions
Changes in pension entitlements due to other economic flows
Opening Balance Sheet
As expected, the results from these calculations are considerably lower than under the PBO
approach. In figures, the closing balance sheet of the government employer pension
scheme (column G) lies nearly 18 per cent below the results in Table 25. In the case of the
social security pension scheme the result is almost 16 per cent lower than before. All other
figures stay either the same (taken from national accounts) or are slightly modified
according to the fact that they depend on the opening and closing balance of
entitlements.80
79
80 For a detailed description of the differences between ABO and PBO approach see chapter 2.3.
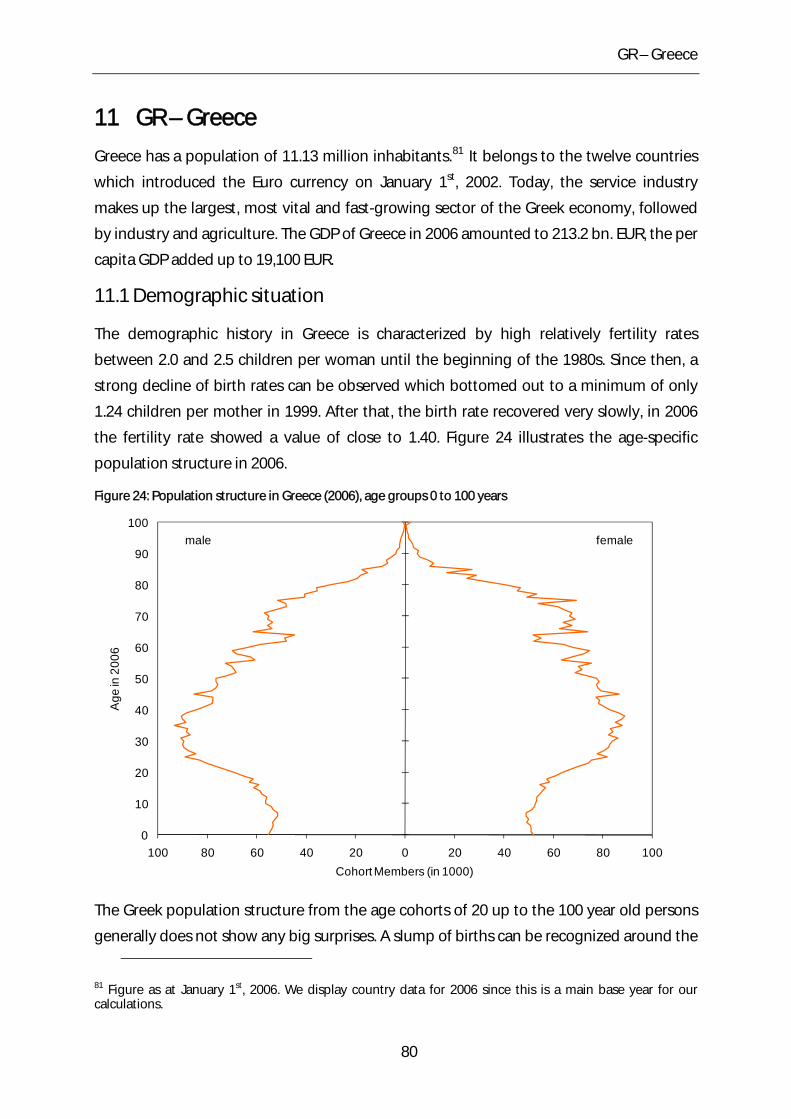
GR – Greece
11 GR – Greece
Greece has a population of 11.13 million inhabitants.81 It belongs to the twelve countries
which introduced the Euro currency on January 1st, 2002. Today, the service industry
makes up the largest, most vital and fast-growing sector of the Greek economy, followed
by industry and agriculture. The GDP of Greece in 2006 amounted to 213.2 bn. EUR, the per
capita GDP added up to 19,100 EUR.
11.1 Demographic situation
The demographic history in Greece is characterized by high relatively fertility rates
between 2.0 and 2.5 children per woman until the beginning of the 1980s. Since then, a
strong decline of birth rates can be observed which bottomed out to a minimum of only
1.24 children per mother in 1999. After that, the birth rate recovered very slowly, in 2006
the fertility rate showed a value of close to 1.40. Figure 24 illustrates the age-specific
population structure in 2006.
Figure 24: Population structure in Greece (2006), age groups 0 to 100 years
0
10
20
30
40
50
60
70
80
90
100
100 80 60 40 20 0 20 40 60 80 100
Age
in 2
006
Cohort Members (in 1000)
femalemale
The Greek population structure from the age cohorts of 20 up to the 100 year old persons
generally does not show any big surprises. A slump of births can be recognized around the
81 Figure as at January 1st, 2006. We display country data for 2006 since this is a main base year for our calculations.
80
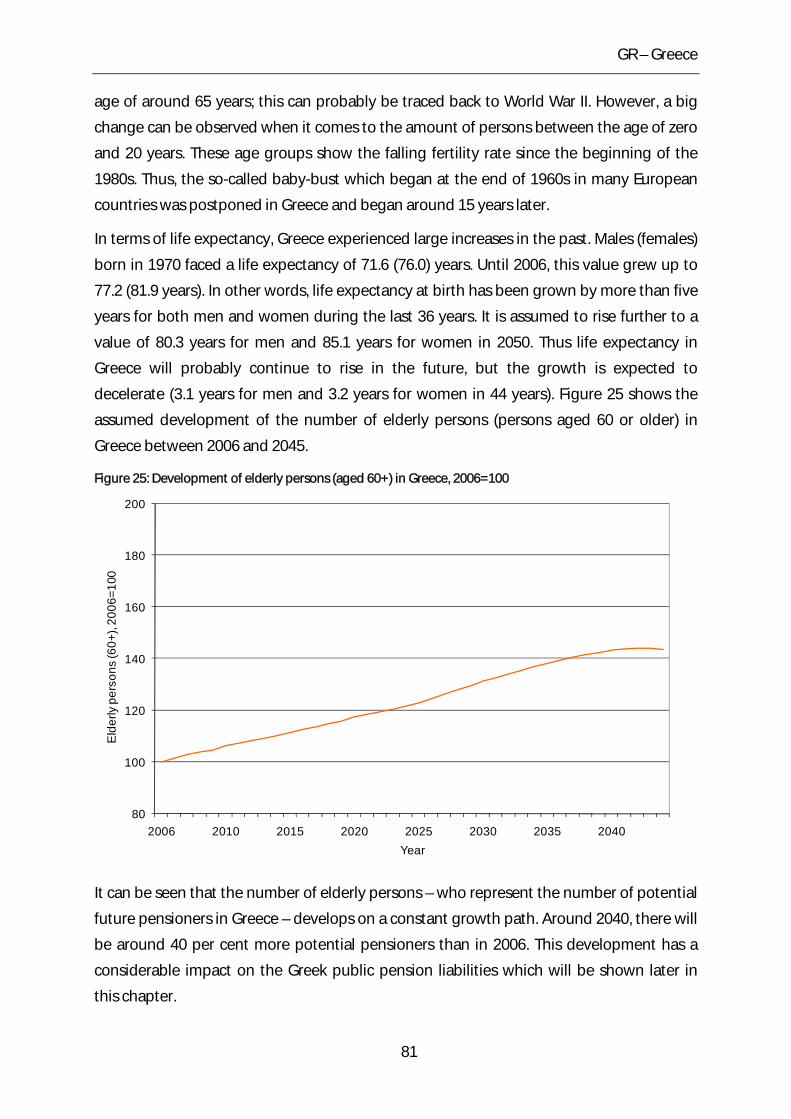
GR – Greece
age of around 65 years; this can probably be traced back to World War II. However, a big
change can be observed when it comes to the amount of persons between the age of zero
and 20 years. These age groups show the falling fertility rate since the beginning of the
1980s. Thus, the so-called baby-bust which began at the end of 1960s in many European
countries was postponed in Greece and began around 15 years later.
In terms of life expectancy, Greece experienced large increases in the past. Males (females)
born in 1970 faced a life expectancy of 71.6 (76.0) years. Until 2006, this value grew up to
77.2 (81.9 years). In other words, life expectancy at birth has been grown by more than five
years for both men and women during the last 36 years. It is assumed to rise further to a
value of 80.3 years for men and 85.1 years for women in 2050. Thus life expectancy in
Greece will probably continue to rise in the future, but the growth is expected to
decelerate (3.1 years for men and 3.2 years for women in 44 years). Figure 25 shows the
assumed development of the number of elderly persons (persons aged 60 or older) in
Greece between 2006 and 2045.
Figure 25: Development of elderly persons (aged 60+) in Greece, 2006=100
80
100
120
140
160
180
200
2006 2010 2015 2020 2025 2030 2035 2040
Eld
erly
per
sons
(60+
), 20
06=1
00
Year
It can be seen that the number of elderly persons – who represent the number of potential
future pensioners in Greece – develops on a constant growth path. Around 2040, there will
be around 40 per cent more potential pensioners than in 2006. This development has a
considerable impact on the Greek public pension liabilities which will be shown later in
this chapter.
81
GR – Greece
11.2 General characteristics of the pension system
The Greek pension system is very fragmented. It is the result of a long series of partial
legislative initiatives over the last fifty years. Notwithstanding the institutional
fragmentation in hundreds of pension funds and schemes, it is basically related to the
public pillar. While no major reforms had been introduced in the last decade on old age
pensions, some measures have been adopted to reduce the institutional complexity and to
improve the effectiveness of pension programmes especially to protect the elderly against
the risk of poverty. In terms of financing, the Greek pension system is in principle a PAYG
system while in terms of structure it is a defined-benefit scheme. As to its legal status, it is
mandatory and run by the wider public sector. The share of population covered by this
system is practically 100 per cent. The normal pension age is 65 for men and 60 for women,
equalized at 65 for all people entering the labour force from 1993. The primary pension
depends upon the question whether labour-market entry has been taken place before or
after 1993. The following description applies to the latter:
The primary pension is two per cent of earnings for each year of contributions up to 35
years. There is a maximum replacement rate of 70 per cent for people retiring at the
normal age or earlier. The earnings measure is the average over the last five years, earlier
earnings are valorized in line with increases defined in national incomes policy.82 The
indexation of pensions is discretionary, but it usually follows the inflation rate.
11.3 Recent reforms of the pension system
In the beginning of the 1990s, the Souflias reform and the Sioufas reform were passed.
These reforms reduced replacement rates, raised eligibility standards especially for public
sector employees and tightened the criteria for the payment of an invalidity pension. For
the cohorts of workers entering the labour market from 1993 onwards, common eligibility
rules were introduced. Especially the indexation rule was cut down to price indexation. The
last major reform – the Reppas reform – was passed in 2002. The most important changes
were the introduction of a uniform retirement age for the members of all funds and the
gradual reduction of replacement rates for public sector employees to 70 per cent starting
from January 2008.83
82 For further details see OECD (2007), p. 130 et sqq. 83 For detailed information about the pension reforms in Greece, see Triantafillou (2005), p. 8 et sqq.
82
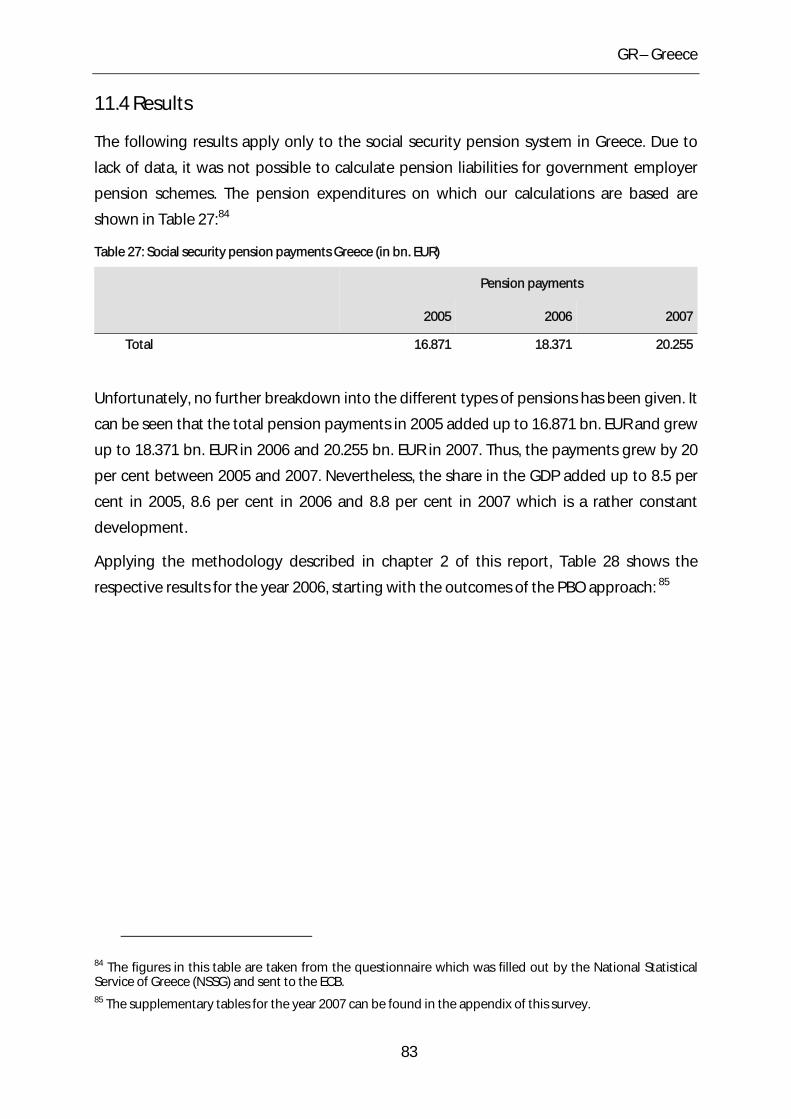
GR – Greece
11.4 Results
The following results apply only to the social security pension system in Greece. Due to
lack of data, it was not possible to calculate pension liabilities for government employer
pension schemes. The pension expenditures on which our calculations are based are
shown in Table 27:84
Table 27: Social security pension payments Greece (in bn. EUR)
Pension payments
2005 2006 2007
Total 16.871 18.371 20.255
Unfortunately, no further breakdown into the different types of pensions has been given. It
can be seen that the total pension payments in 2005 added up to 16.871 bn. EUR and grew
up to 18.371 bn. EUR in 2006 and 20.255 bn. EUR in 2007. Thus, the payments grew by 20
per cent between 2005 and 2007. Nevertheless, the share in the GDP added up to 8.5 per
cent in 2005, 8.6 per cent in 2006 and 8.8 per cent in 2007 which is a rather constant
development.
Applying the methodology described in chapter 2 of this report, Table 28 shows the
respective results for the year 2006, starting with the outcomes of the PBO approach: 85
84 The figures in this table are taken from the questionnaire which was filled out by the National Statistical Service of Greece (NSSG) and sent to the ECB. 85 The supplementary tables for the year 2007 can be found in the appendix of this survey.
83
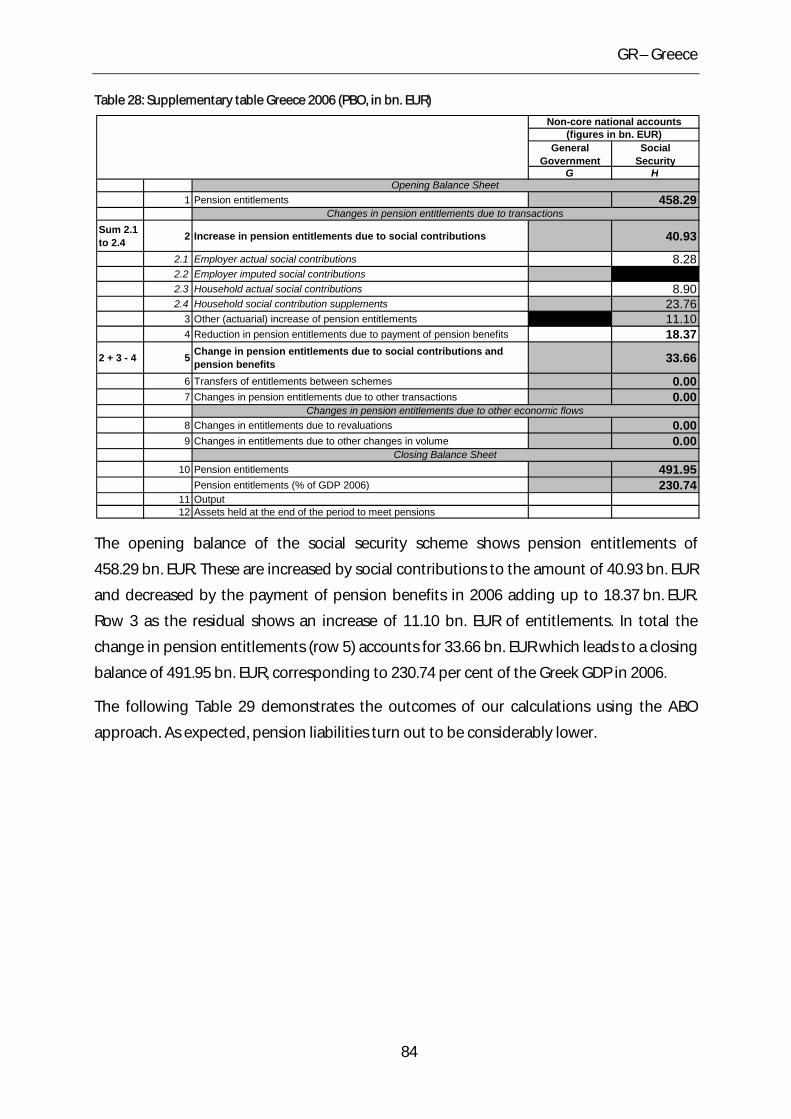
GR – Greece
Table 28: Supplementary table Greece 2006 (PBO, in bn. EUR)
General Government
Social Security
G H
1 Pension entitlements 458.29
Sum 2.1 to 2.4 2 Increase in pension entitlements due to social contributions 40.93
2.1 Employer actual social contributions 8.282.2 Employer imputed social contributions2.3 Household actual social contributions 8.902.4 Household social contribution supplements 23.76
3 Other (actuarial) increase of pension entitlements 11.104 Reduction in pension entitlements due to payment of pension benefits 18.37
2 + 3 - 4 5 Change in pension entitlements due to social contributions and pension benefits 33.66
6 Transfers of entitlements between schemes 0.007 Changes in pension entitlements due to other transactions 0.00
8 Changes in entitlements due to revaluations 0.009 Changes in entitlements due to other changes in volume 0.00
10 Pension entitlements 491.95Pension entitlements (% of GDP 2006) 230.74
11 Output12 Assets held at the end of the period to meet pensions
Closing Balance Sheet
Non-core national accounts(figures in bn. EUR)
Changes in pension entitlements due to transactions
Changes in pension entitlements due to other economic flows
Opening Balance Sheet
The opening balance of the social security scheme shows pension entitlements of
458.29 bn. EUR. These are increased by social contributions to the amount of 40.93 bn. EUR
and decreased by the payment of pension benefits in 2006 adding up to 18.37 bn. EUR.
Row 3 as the residual shows an increase of 11.10 bn. EUR of entitlements. In total the
change in pension entitlements (row 5) accounts for 33.66 bn. EUR which leads to a closing
balance of 491.95 bn. EUR, corresponding to 230.74 per cent of the Greek GDP in 2006.
The following Table 29 demonstrates the outcomes of our calculations using the ABO
approach. As expected, pension liabilities turn out to be considerably lower.
84
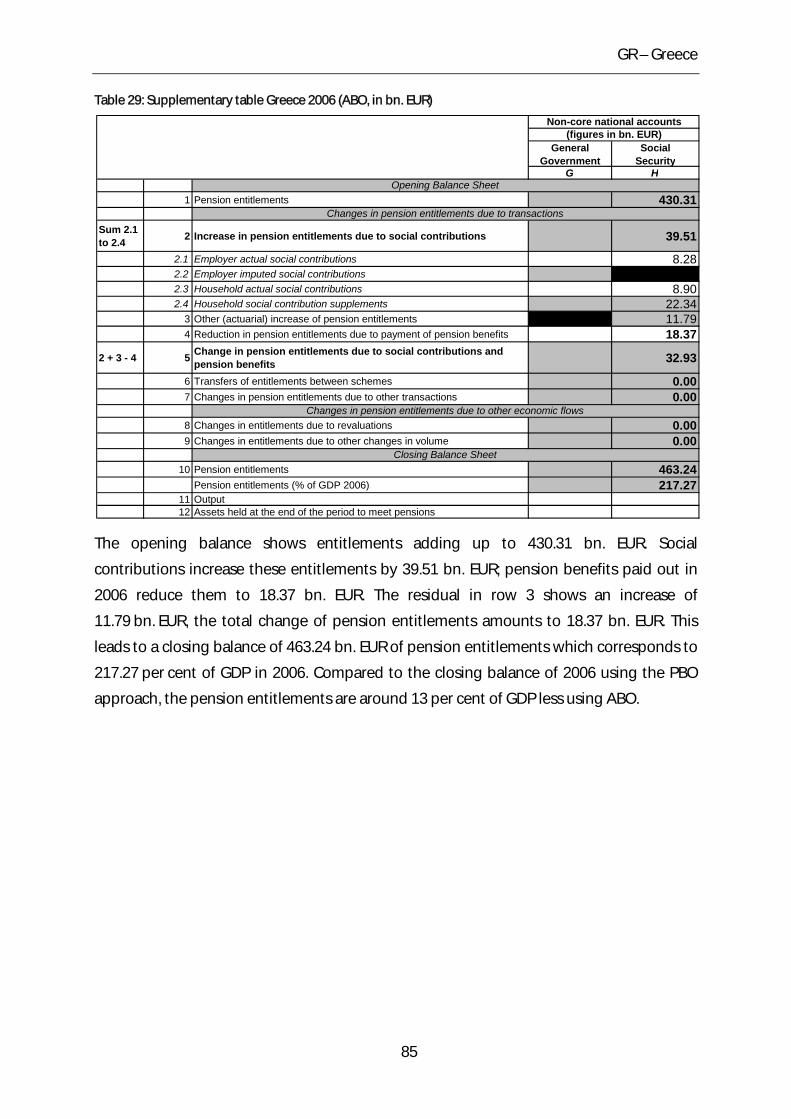
GR – Greece
Table 29: Supplementary table Greece 2006 (ABO, in bn. EUR)
General Government
Social Security
G H
1 Pension entitlements 430.31
Sum 2.1 to 2.4 2 Increase in pension entitlements due to social contributions 39.51
2.1 Employer actual social contributions 8.282.2 Employer imputed social contributions2.3 Household actual social contributions 8.902.4 Household social contribution supplements 22.34
3 Other (actuarial) increase of pension entitlements 11.794 Reduction in pension entitlements due to payment of pension benefits 18.37
2 + 3 - 4 5 Change in pension entitlements due to social contributions and pension benefits 32.93
6 Transfers of entitlements between schemes 0.007 Changes in pension entitlements due to other transactions 0.00
8 Changes in entitlements due to revaluations 0.009 Changes in entitlements due to other changes in volume 0.00
10 Pension entitlements 463.24Pension entitlements (% of GDP 2006) 217.27
11 Output12 Assets held at the end of the period to meet pensions
Closing Balance Sheet
Non-core national accounts(figures in bn. EUR)
Changes in pension entitlements due to transactions
Changes in pension entitlements due to other economic flows
Opening Balance Sheet
The opening balance shows entitlements adding up to 430.31 bn. EUR. Social
contributions increase these entitlements by 39.51 bn. EUR; pension benefits paid out in
2006 reduce them to 18.37 bn. EUR. The residual in row 3 shows an increase of
11.79 bn. EUR, the total change of pension entitlements amounts to 18.37 bn. EUR. This
leads to a closing balance of 463.24 bn. EUR of pension entitlements which corresponds to
217.27 per cent of GDP in 2006. Compared to the closing balance of 2006 using the PBO
approach, the pension entitlements are around 13 per cent of GDP less using ABO.
85
HU – Hungary
12 HU – Hungary
Hungary has a population of 10.07 million inhabitants.86 The Hungarian economy has
made a positive transition from a centrally planned system to a market based economy.
The private sector accounts for over 80 per cent of GDP. The accession to the European
Union in May 2004 further boosted trade in particular and the economy altogether. The
Hungarian Forint (HUF)87 is the currency of Hungary – however, the Hungarian
government has expressed its will to join the Euro Currency Area. This is not expected to
happen before 2012 since Hungary currently fails to meet the Maastricht criteria. Hungary’s
GDP in 2006 amounted to 23,785.2 bn. HUF which corresponds to 90.0 bn. EUR; the per
capita GDP added up to 8,900 EUR. The Hungarian labour force boasts only 4.21 million
people due to one of the lowest labour force participation rates of the OECD. With just
57 per cent of the employable population participating in the economy this figure is well
below the EU 25 average (63.8 per cent) as well as below the EU 15 average (65.2 per cent).
The unemployment rate shows that 7.4 per cent of the workforce is unemployed.
12.1 Demographic situation
Hungarian’s demographic history is characterized by relatively high fertility rates which
have decreased considerably only since the mid-1990s, and special effects after the
Hungarian Revolution of 1956. Figure 26 shows the age-specific population structure in
2006.
86 Figure as at January 1st, 2006. We display country data for 2006 since this is a main base year for our calculations. 87 The exchange rate of the Hungarian forint to the Euro is 251.77 as per December 29th, 2006.
86
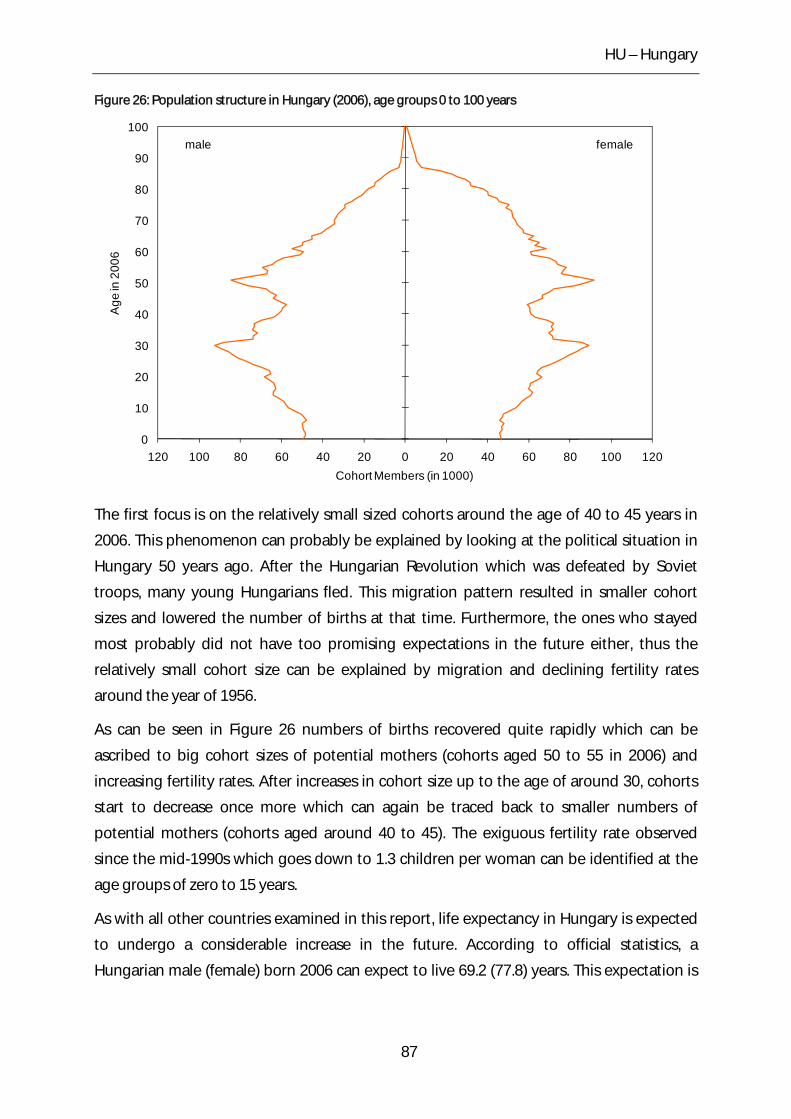
HU – Hungary
Figure 26: Population structure in Hungary (2006), age groups 0 to 100 years
0
10
20
30
40
50
60
70
80
90
100
120 100 80 60 40 20 0 20 40 60 80 100 120
Age
in 2
006
Cohort Members (in 1000)
femalemale
The first focus is on the relatively small sized cohorts around the age of 40 to 45 years in
2006. This phenomenon can probably be explained by looking at the political situation in
Hungary 50 years ago. After the Hungarian Revolution which was defeated by Soviet
troops, many young Hungarians fled. This migration pattern resulted in smaller cohort
sizes and lowered the number of births at that time. Furthermore, the ones who stayed
most probably did not have too promising expectations in the future either, thus the
relatively small cohort size can be explained by migration and declining fertility rates
around the year of 1956.
As can be seen in Figure 26 numbers of births recovered quite rapidly which can be
ascribed to big cohort sizes of potential mothers (cohorts aged 50 to 55 in 2006) and
increasing fertility rates. After increases in cohort size up to the age of around 30, cohorts
start to decrease once more which can again be traced back to smaller numbers of
potential mothers (cohorts aged around 40 to 45). The exiguous fertility rate observed
since the mid-1990s which goes down to 1.3 children per woman can be identified at the
age groups of zero to 15 years.
As with all other countries examined in this report, life expectancy in Hungary is expected
to undergo a considerable increase in the future. According to official statistics, a
Hungarian male (female) born 2006 can expect to live 69.2 (77.8) years. This expectation is
87
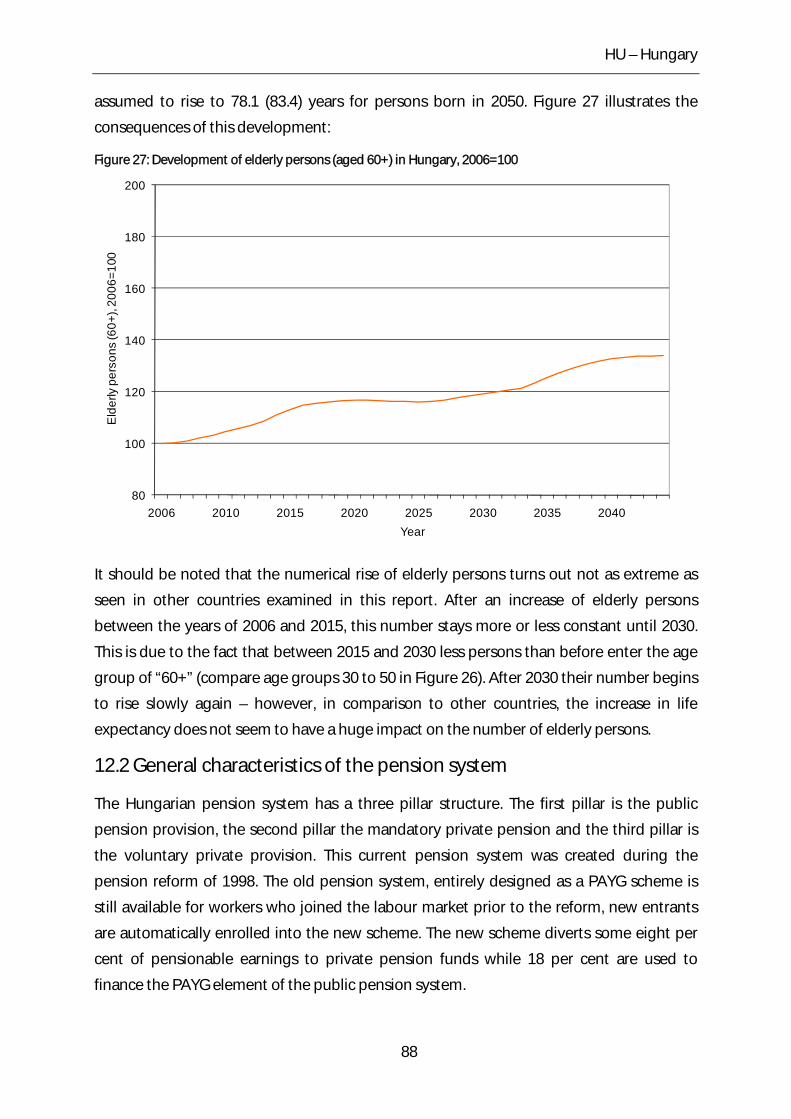
HU – Hungary
assumed to rise to 78.1 (83.4) years for persons born in 2050. Figure 27 illustrates the
consequences of this development:
Figure 27: Development of elderly persons (aged 60+) in Hungary, 2006=100
80
100
120
140
160
180
200
2006 2010 2015 2020 2025 2030 2035 2040
Eld
erly
per
sons
(60+
), 20
06=1
00
Year
It should be noted that the numerical rise of elderly persons turns out not as extreme as
seen in other countries examined in this report. After an increase of elderly persons
between the years of 2006 and 2015, this number stays more or less constant until 2030.
This is due to the fact that between 2015 and 2030 less persons than before enter the age
group of “60+” (compare age groups 30 to 50 in Figure 26). After 2030 their number begins
to rise slowly again – however, in comparison to other countries, the increase in life
expectancy does not seem to have a huge impact on the number of elderly persons.
12.2 General characteristics of the pension system
The Hungarian pension system has a three pillar structure. The first pillar is the public
pension provision, the second pillar the mandatory private pension and the third pillar is
the voluntary private provision. This current pension system was created during the
pension reform of 1998. The old pension system, entirely designed as a PAYG scheme is
still available for workers who joined the labour market prior to the reform, new entrants
are automatically enrolled into the new scheme. The new scheme diverts some eight per
cent of pensionable earnings to private pension funds while 18 per cent are used to
finance the PAYG element of the public pension system.
88
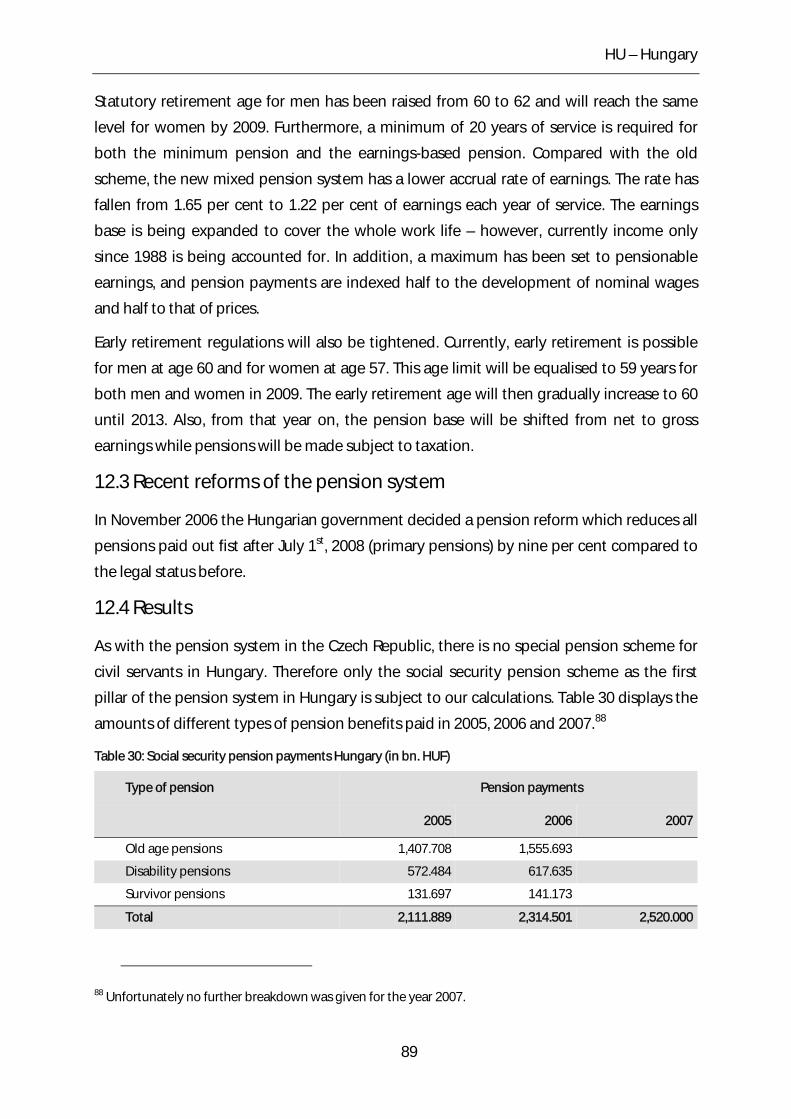
HU – Hungary
Statutory retirement age for men has been raised from 60 to 62 and will reach the same
level for women by 2009. Furthermore, a minimum of 20 years of service is required for
both the minimum pension and the earnings-based pension. Compared with the old
scheme, the new mixed pension system has a lower accrual rate of earnings. The rate has
fallen from 1.65 per cent to 1.22 per cent of earnings each year of service. The earnings
base is being expanded to cover the whole work life – however, currently income only
since 1988 is being accounted for. In addition, a maximum has been set to pensionable
earnings, and pension payments are indexed half to the development of nominal wages
and half to that of prices.
Early retirement regulations will also be tightened. Currently, early retirement is possible
for men at age 60 and for women at age 57. This age limit will be equalised to 59 years for
both men and women in 2009. The early retirement age will then gradually increase to 60
until 2013. Also, from that year on, the pension base will be shifted from net to gross
earnings while pensions will be made subject to taxation.
12.3 Recent reforms of the pension system
In November 2006 the Hungarian government decided a pension reform which reduces all
pensions paid out fist after July 1st, 2008 (primary pensions) by nine per cent compared to
the legal status before.
12.4 Results
As with the pension system in the Czech Republic, there is no special pension scheme for
civil servants in Hungary. Therefore only the social security pension scheme as the first
pillar of the pension system in Hungary is subject to our calculations. Table 30 displays the
amounts of different types of pension benefits paid in 2005, 2006 and 2007.88
Table 30: Social security pension payments Hungary (in bn. HUF)
Type of pension Pension payments
2005 2006 2007
Old age pensions 1,407.708 1,555.693
Disability pensions 572.484 617.635
Survivor pensions 131.697 141.173
Total 2,111.889 2,314.501 2,520.000
88 Unfortunately no further breakdown was given for the year 2007.
89
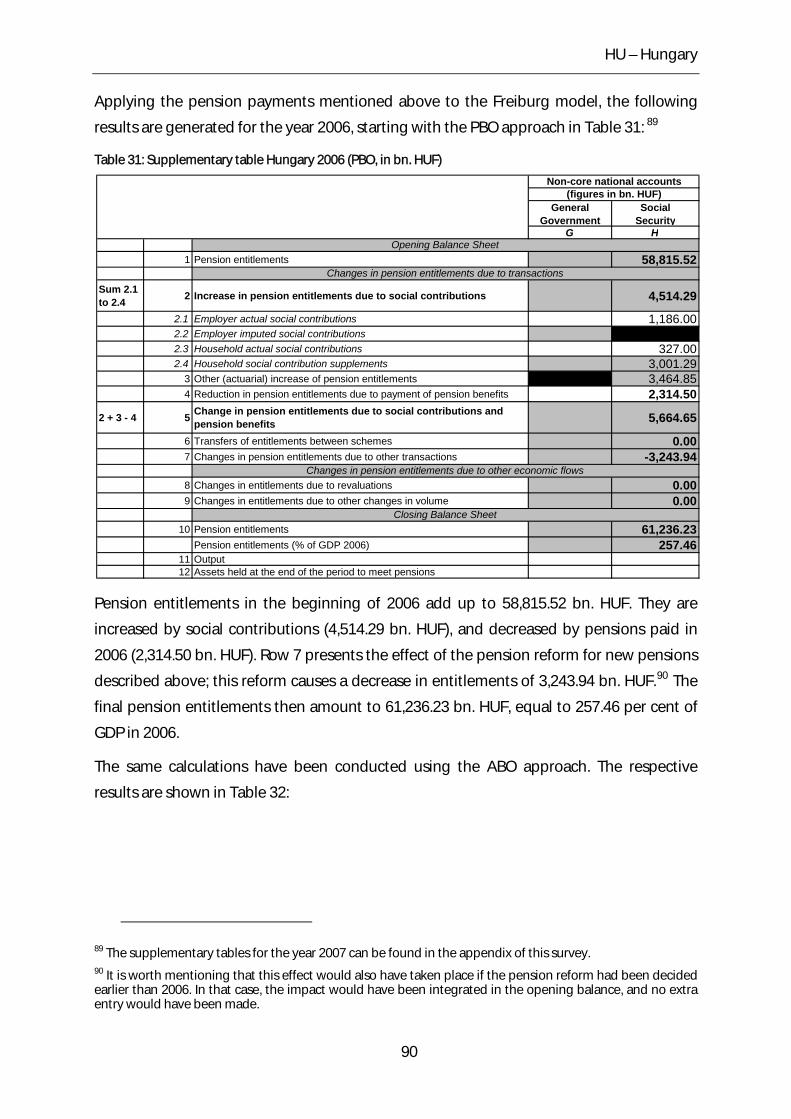
HU – Hungary
Applying the pension payments mentioned above to the Freiburg model, the following
results are generated for the year 2006, starting with the PBO approach in Table 31: 89
Table 31: Supplementary table Hungary 2006 (PBO, in bn. HUF)
General Government
Social Security
G H
1 Pension entitlements 58,815.52
Sum 2.1 to 2.4 2 Increase in pension entitlements due to social contributions 4,514.29
2.1 Employer actual social contributions 1,186.002.2 Employer imputed social contributions2.3 Household actual social contributions 327.002.4 Household social contribution supplements 3,001.29
3 Other (actuarial) increase of pension entitlements 3,464.854 Reduction in pension entitlements due to payment of pension benefits 2,314.50
2 + 3 - 4 5 Change in pension entitlements due to social contributions and pension benefits 5,664.65
6 Transfers of entitlements between schemes 0.007 Changes in pension entitlements due to other transactions -3,243.94
8 Changes in entitlements due to revaluations 0.009 Changes in entitlements due to other changes in volume 0.00
10 Pension entitlements 61,236.23Pension entitlements (% of GDP 2006) 257.46
11 Output12 Assets held at the end of the period to meet pensions
Closing Balance Sheet
Non-core national accounts(figures in bn. HUF)
Changes in pension entitlements due to transactions
Changes in pension entitlements due to other economic flows
Opening Balance Sheet
Pension entitlements in the beginning of 2006 add up to 58,815.52 bn. HUF. They are
increased by social contributions (4,514.29 bn. HUF), and decreased by pensions paid in
2006 (2,314.50 bn. HUF). Row 7 presents the effect of the pension reform for new pensions
described above; this reform causes a decrease in entitlements of 3,243.94 bn. HUF.90 The
final pension entitlements then amount to 61,236.23 bn. HUF, equal to 257.46 per cent of
GDP in 2006.
The same calculations have been conducted using the ABO approach. The respective
results are shown in Table 32:
89 The supplementary tables for the year 2007 can be found in the appendix of this survey. 90 It is worth mentioning that this effect would also have taken place if the pension reform had been decided earlier than 2006. In that case, the impact would have been integrated in the opening balance, and no extra entry would have been made.
90
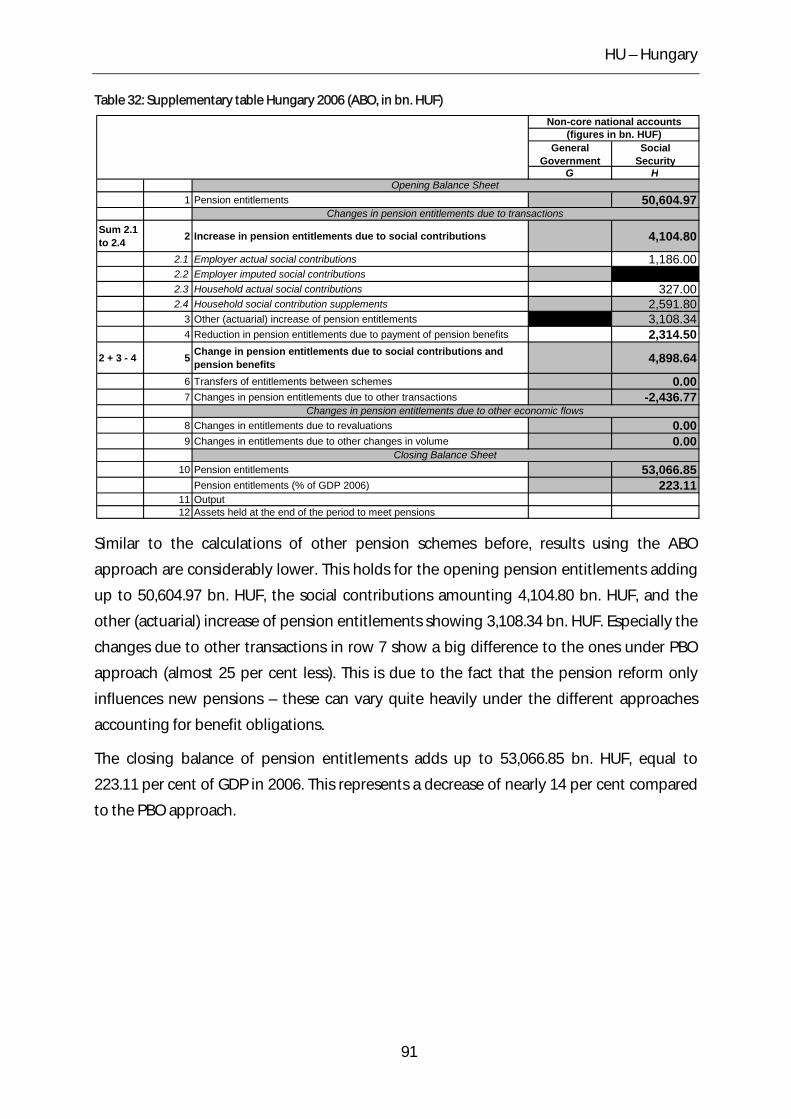
HU – Hungary
Table 32: Supplementary table Hungary 2006 (ABO, in bn. HUF)
General Government
Social Security
G H
1 Pension entitlements 50,604.97
Sum 2.1 to 2.4 2 Increase in pension entitlements due to social contributions 4,104.80
2.1 Employer actual social contributions 1,186.002.2 Employer imputed social contributions2.3 Household actual social contributions 327.002.4 Household social contribution supplements 2,591.80
3 Other (actuarial) increase of pension entitlements 3,108.344 Reduction in pension entitlements due to payment of pension benefits 2,314.50
2 + 3 - 4 5 Change in pension entitlements due to social contributions and pension benefits 4,898.64
6 Transfers of entitlements between schemes 0.007 Changes in pension entitlements due to other transactions -2,436.77
8 Changes in entitlements due to revaluations 0.009 Changes in entitlements due to other changes in volume 0.00
10 Pension entitlements 53,066.85Pension entitlements (% of GDP 2006) 223.11
11 Output12 Assets held at the end of the period to meet pensions
Closing Balance Sheet
Non-core national accounts(figures in bn. HUF)
Changes in pension entitlements due to transactions
Changes in pension entitlements due to other economic flows
Opening Balance Sheet
Similar to the calculations of other pension schemes before, results using the ABO
approach are considerably lower. This holds for the opening pension entitlements adding
up to 50,604.97 bn. HUF, the social contributions amounting 4,104.80 bn. HUF, and the
other (actuarial) increase of pension entitlements showing 3,108.34 bn. HUF. Especially the
changes due to other transactions in row 7 show a big difference to the ones under PBO
approach (almost 25 per cent less). This is due to the fact that the pension reform only
influences new pensions – these can vary quite heavily under the different approaches
accounting for benefit obligations.
The closing balance of pension entitlements adds up to 53,066.85 bn. HUF, equal to
223.11 per cent of GDP in 2006. This represents a decrease of nearly 14 per cent compared
to the PBO approach.
91
IT – Italy
13 IT – Italy
Italy currently has the fourth largest population in the European Union. It adds up to 58.75
million inhabitants as at January 1st, 2006.91 The economy of Italy remains divided into a
developed industrial North, dominated by private companies, and a less developed
agricultural South. Unemployment has been steadily decreasing (6.7 per cent in 2007, its
lowest level since 1992) but is severe in the South, where the unemployment rate partly
exceeds 20 per cent. Women and youth show significantly higher rates of unemployment
than men. The GDP in 2006 accounted for 1,480.0 bn. EUR, corresponding to a per capita
GDP of 25,100 EUR.
13.1 Demographic situation
Similar to many other Western European countries, Italy has experienced considerable
changes in terms of fertility in the last 40 years. In 1965, the fertility rate amounted to more
than 2.5 births per woman. The sudden drop in birth rates in most industrialized countries
at the end of the 1960s (also referred to as the baby bust) took place only in a weakened
form. Until 1977 the fertility rate stayed close to replacement level. Since that date the
birth rates decreased more rapidly until they reached a minimum of only 1.19 births per
woman in 1996. Today an average woman in Italy gives birth to 1.32 children, which
represents one of the lowest fertility rates in Europe. Figure 28 demonstrates the
population structure in Italy as at January 1st, 2006.
91 We display country data for 2006 since this is a main base year for our calculations.
92
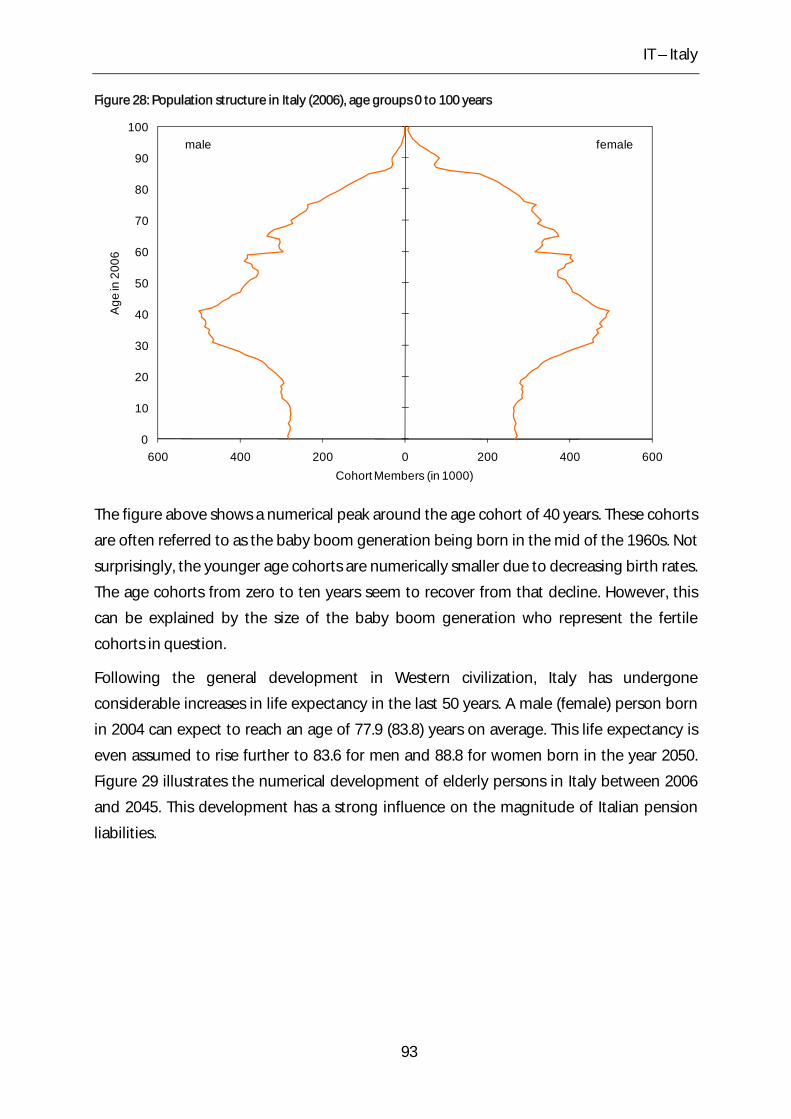
IT – Italy
Figure 28: Population structure in Italy (2006), age groups 0 to 100 years
0
10
20
30
40
50
60
70
80
90
100
600 400 200 0 200 400 600
Age
in 2
006
Cohort Members (in 1000)
femalemale
The figure above shows a numerical peak around the age cohort of 40 years. These cohorts
are often referred to as the baby boom generation being born in the mid of the 1960s. Not
surprisingly, the younger age cohorts are numerically smaller due to decreasing birth rates.
The age cohorts from zero to ten years seem to recover from that decline. However, this
can be explained by the size of the baby boom generation who represent the fertile
cohorts in question.
Following the general development in Western civilization, Italy has undergone
considerable increases in life expectancy in the last 50 years. A male (female) person born
in 2004 can expect to reach an age of 77.9 (83.8) years on average. This life expectancy is
even assumed to rise further to 83.6 for men and 88.8 for women born in the year 2050.
Figure 29 illustrates the numerical development of elderly persons in Italy between 2006
and 2045. This development has a strong influence on the magnitude of Italian pension
liabilities.
93
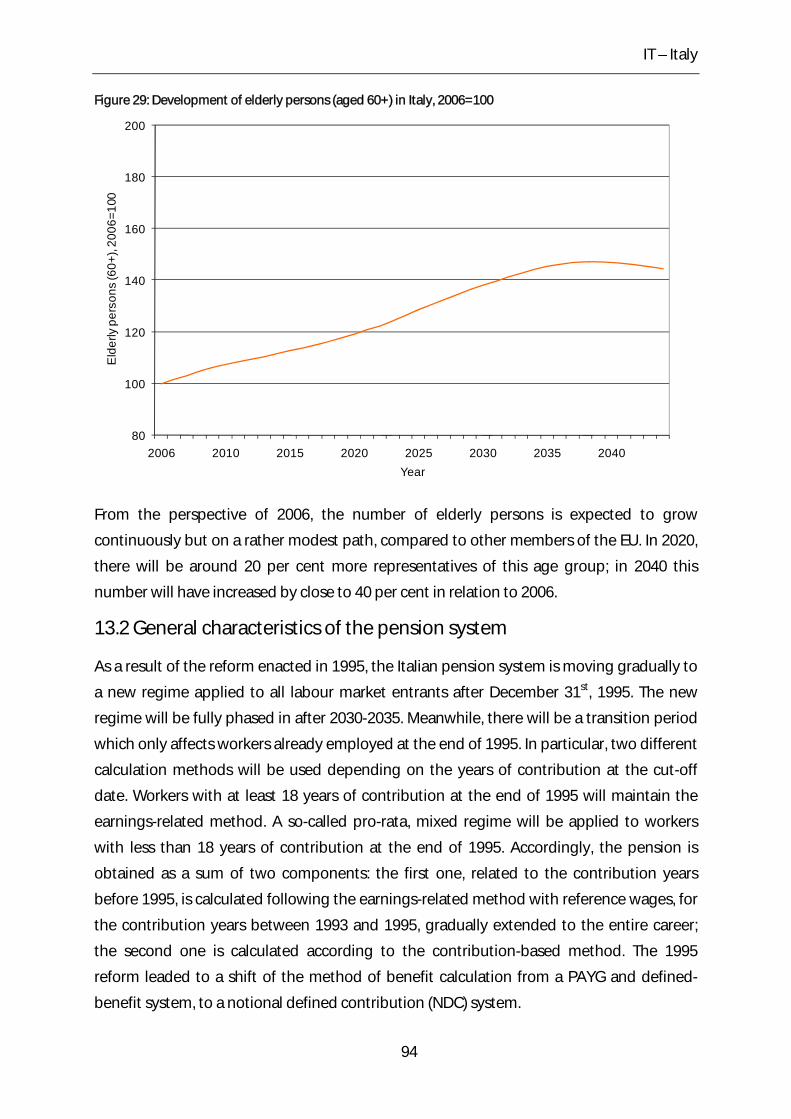
IT – Italy
Figure 29: Development of elderly persons (aged 60+) in Italy, 2006=100
80
100
120
140
160
180
200
2006 2010 2015 2020 2025 2030 2035 2040
Eld
erly
per
sons
(60+
), 20
06=1
00
Year
From the perspective of 2006, the number of elderly persons is expected to grow
continuously but on a rather modest path, compared to other members of the EU. In 2020,
there will be around 20 per cent more representatives of this age group; in 2040 this
number will have increased by close to 40 per cent in relation to 2006.
13.2 General characteristics of the pension system
As a result of the reform enacted in 1995, the Italian pension system is moving gradually to
a new regime applied to all labour market entrants after December 31st, 1995. The new
regime will be fully phased in after 2030-2035. Meanwhile, there will be a transition period
which only affects workers already employed at the end of 1995. In particular, two different
calculation methods will be used depending on the years of contribution at the cut-off
date. Workers with at least 18 years of contribution at the end of 1995 will maintain the
earnings-related method. A so-called pro-rata, mixed regime will be applied to workers
with less than 18 years of contribution at the end of 1995. Accordingly, the pension is
obtained as a sum of two components: the first one, related to the contribution years
before 1995, is calculated following the earnings-related method with reference wages, for
the contribution years between 1993 and 1995, gradually extended to the entire career;
the second one is calculated according to the contribution-based method. The 1995
reform leaded to a shift of the method of benefit calculation from a PAYG and defined-
benefit system, to a notional defined contribution (NDC) system.
94
IT – Italy
A national agreement between the Italian government and trade unions, signed in March
1997, has established harmonised rules for almost all employment in the public and
private sector. Under the earnings-related and mixed regimes (workers already insured as
of 1995) the age requirement to an old age pension is 65 for men and 60 for women jointly
with a minimum contribution period of 20 years for males and females. Before 1992, the
minimum retirement ages were, respectively, 60 and 55 for the private sector employees
and the minimum contribution period was 15 years.
Under the contribution-based regime (new entrants into the system after 1995) for males,
the possibility to receive a pension at an age lower than 65 is allowed to those with 40 or
more years of contributions, or to those with no less than 35 years of contributions and of
60 years of age, for the employed, and 61 years for the self-employed. The age limit is to
rise by a year from 2010 and another year from 2014, thus reaching 62 and 63 respectively.
For females, the possibility to receive a pension is allowed at 60 with five years of
contribution or, alternatively, with 40 or more years of contributions regardless of the age.
The indexation rules for pensions after retirement are the following: The indexation is 100
per cent of the inflation rate for the part of pension up to three times the minimum
pension, 90 per cent for the part between three and five times the minimum, and 75 per
cent for the part above five times the minimum.92, 93
13.3 Recent reforms of the pension system
To ensure fiscal consolidation and long-term fiscal sustainability, a pension reform process
was started in Italy at the beginning of the 1990s. After cutting down a quarter of the
prospective public sector pension liabilities with the pension reform in 1992, a major
reform was passed in 1995 introducing NDC in the PAYG pension pillar. This reform was in
many ways similar to the one in Sweden which was undertaken in 1994. The Italian NDC
pension reform has been described in the previous chapter.94
In 2004, the Law 243/2004 envisaged two main interventions to the public pension system:
one with short-term effects and one with structural effects noticeable in the medium-long
term. The main short-term effects were incentives to put off retiring. In the medium-long
92 Due to lack of more detailed information we assume an indexation of 100 per cent of inflation for all pensions. 93 A short summary on the public pension system in Italy can be found in OECD (2007), p. 142 et sqq. For an extensive description of the pension system see European Commission (2007), p. 161 et sqq. 94 For further details of the Italian NDC pension reform, see Franco and Sartor (2006).
95
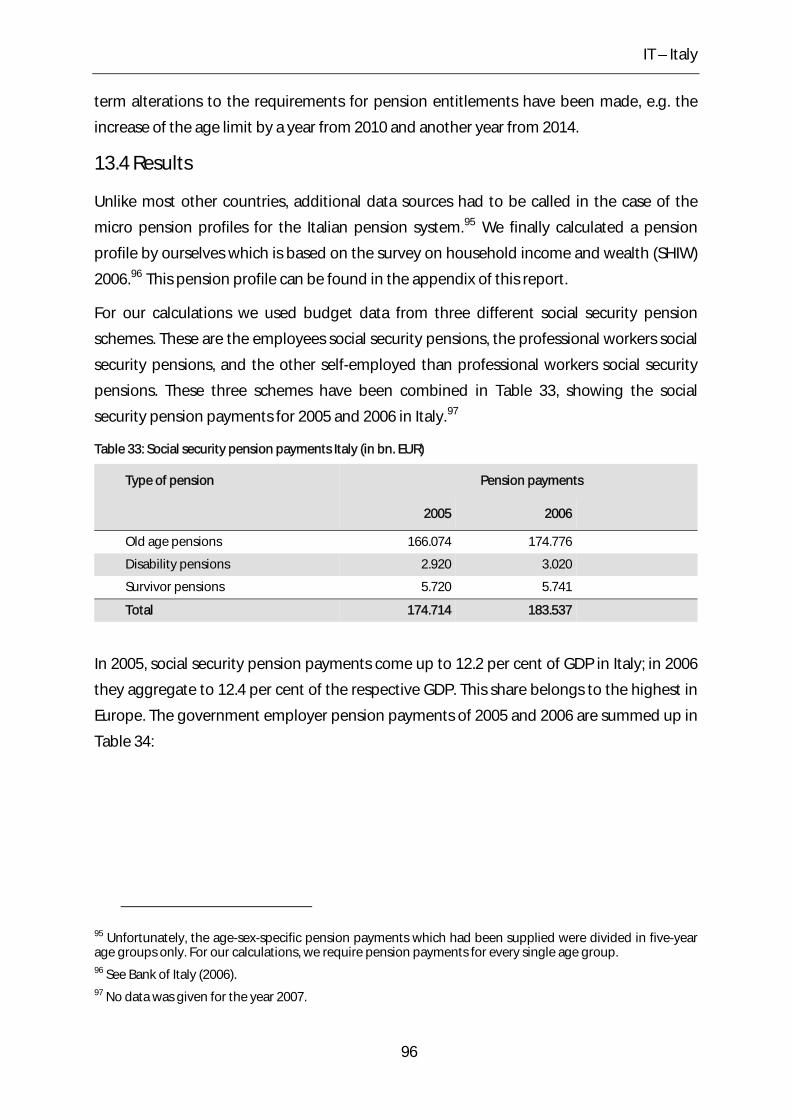
IT – Italy
term alterations to the requirements for pension entitlements have been made, e.g. the
increase of the age limit by a year from 2010 and another year from 2014.
13.4 Results
Unlike most other countries, additional data sources had to be called in the case of the
micro pension profiles for the Italian pension system.95 We finally calculated a pension
profile by ourselves which is based on the survey on household income and wealth (SHIW)
2006.96 This pension profile can be found in the appendix of this report.
For our calculations we used budget data from three different social security pension
schemes. These are the employees social security pensions, the professional workers social
security pensions, and the other self-employed than professional workers social security
pensions. These three schemes have been combined in Table 33, showing the social
security pension payments for 2005 and 2006 in Italy.97
Table 33: Social security pension payments Italy (in bn. EUR)
Type of pension Pension payments
2005 2006
Old age pensions 166.074 174.776
Disability pensions 2.920 3.020
Survivor pensions 5.720 5.741
Total 174.714 183.537
In 2005, social security pension payments come up to 12.2 per cent of GDP in Italy; in 2006
they aggregate to 12.4 per cent of the respective GDP. This share belongs to the highest in
Europe. The government employer pension payments of 2005 and 2006 are summed up in
Table 34:
95 Unfortunately, the age-sex-specific pension payments which had been supplied were divided in five-year age groups only. For our calculations, we require pension payments for every single age group. 96 See Bank of Italy (2006). 97 No data was given for the year 2007.
96
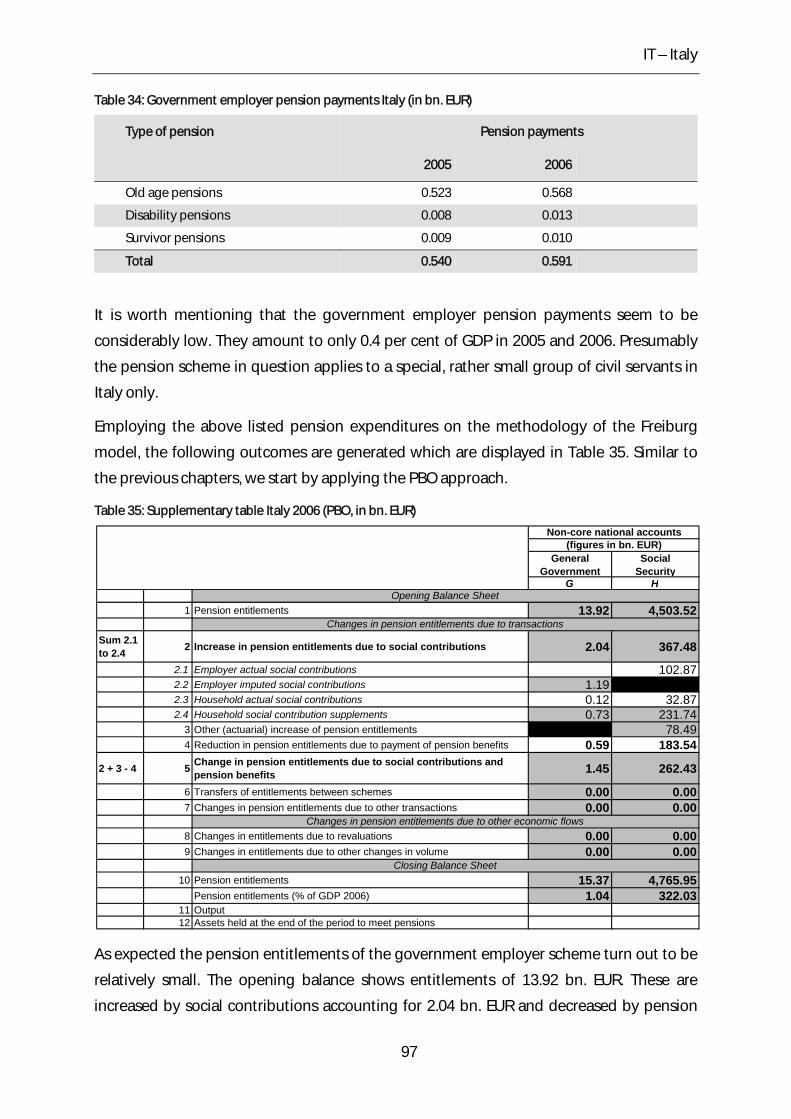
IT – Italy
Table 34: Government employer pension payments Italy (in bn. EUR)
Type of pension Pension payments
2005 2006
Old age pensions 0.523 0.568
Disability pensions 0.008 0.013
Survivor pensions 0.009 0.010
Total 0.540 0.591
It is worth mentioning that the government employer pension payments seem to be
considerably low. They amount to only 0.4 per cent of GDP in 2005 and 2006. Presumably
the pension scheme in question applies to a special, rather small group of civil servants in
Italy only.
Employing the above listed pension expenditures on the methodology of the Freiburg
model, the following outcomes are generated which are displayed in Table 35. Similar to
the previous chapters, we start by applying the PBO approach.
Table 35: Supplementary table Italy 2006 (PBO, in bn. EUR)
General Government
Social Security
G H
1 Pension entitlements 13.92 4,503.52
Sum 2.1 to 2.4 2 Increase in pension entitlements due to social contributions 2.04 367.48
2.1 Employer actual social contributions 102.872.2 Employer imputed social contributions 1.192.3 Household actual social contributions 0.12 32.872.4 Household social contribution supplements 0.73 231.74
3 Other (actuarial) increase of pension entitlements 78.494 Reduction in pension entitlements due to payment of pension benefits 0.59 183.54
2 + 3 - 4 5 Change in pension entitlements due to social contributions and pension benefits 1.45 262.43
6 Transfers of entitlements between schemes 0.00 0.007 Changes in pension entitlements due to other transactions 0.00 0.00
8 Changes in entitlements due to revaluations 0.00 0.009 Changes in entitlements due to other changes in volume 0.00 0.00
10 Pension entitlements 15.37 4,765.95Pension entitlements (% of GDP 2006) 1.04 322.03
11 Output12 Assets held at the end of the period to meet pensions
Closing Balance Sheet
Non-core national accounts(figures in bn. EUR)
Changes in pension entitlements due to transactions
Changes in pension entitlements due to other economic flows
Opening Balance Sheet
As expected the pension entitlements of the government employer scheme turn out to be
relatively small. The opening balance shows entitlements of 13.92 bn. EUR. These are
increased by social contributions accounting for 2.04 bn. EUR and decreased by pension
97
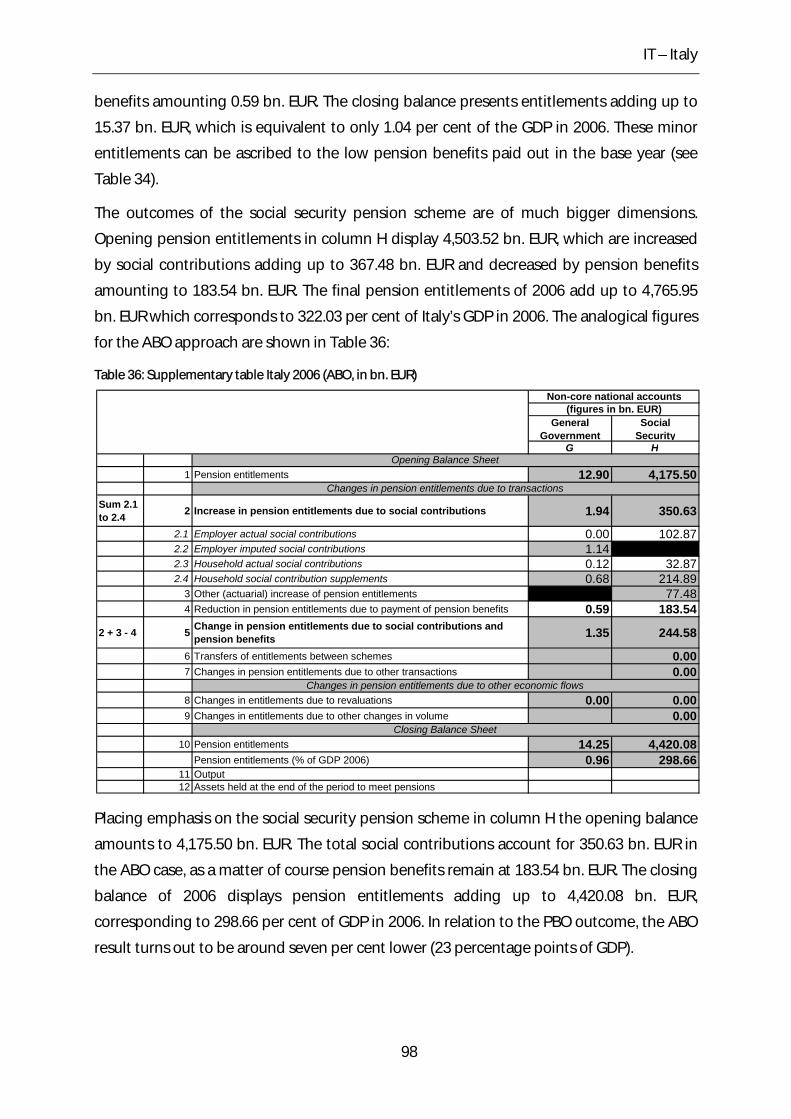
IT – Italy
benefits amounting 0.59 bn. EUR. The closing balance presents entitlements adding up to
15.37 bn. EUR, which is equivalent to only 1.04 per cent of the GDP in 2006. These minor
entitlements can be ascribed to the low pension benefits paid out in the base year (see
Table 34).
The outcomes of the social security pension scheme are of much bigger dimensions.
Opening pension entitlements in column H display 4,503.52 bn. EUR, which are increased
by social contributions adding up to 367.48 bn. EUR and decreased by pension benefits
amounting to 183.54 bn. EUR. The final pension entitlements of 2006 add up to 4,765.95
bn. EUR which corresponds to 322.03 per cent of Italy’s GDP in 2006. The analogical figures
for the ABO approach are shown in Table 36:
Table 36: Supplementary table Italy 2006 (ABO, in bn. EUR)
General Government
Social Security
G H
1 Pension entitlements 12.90 4,175.50
Sum 2.1 to 2.4 2 Increase in pension entitlements due to social contributions 1.94 350.63
2.1 Employer actual social contributions 0.00 102.872.2 Employer imputed social contributions 1.142.3 Household actual social contributions 0.12 32.872.4 Household social contribution supplements 0.68 214.89
3 Other (actuarial) increase of pension entitlements 77.484 Reduction in pension entitlements due to payment of pension benefits 0.59 183.54
2 + 3 - 4 5 Change in pension entitlements due to social contributions and pension benefits 1.35 244.58
6 Transfers of entitlements between schemes 0.007 Changes in pension entitlements due to other transactions 0.00
8 Changes in entitlements due to revaluations 0.00 0.009 Changes in entitlements due to other changes in volume 0.00
10 Pension entitlements 14.25 4,420.08Pension entitlements (% of GDP 2006) 0.96 298.66
11 Output12 Assets held at the end of the period to meet pensions
Closing Balance Sheet
Non-core national accounts(figures in bn. EUR)
Changes in pension entitlements due to transactions
Changes in pension entitlements due to other economic flows
Opening Balance Sheet
Placing emphasis on the social security pension scheme in column H the opening balance
amounts to 4,175.50 bn. EUR. The total social contributions account for 350.63 bn. EUR in
the ABO case, as a matter of course pension benefits remain at 183.54 bn. EUR. The closing
balance of 2006 displays pension entitlements adding up to 4,420.08 bn. EUR,
corresponding to 298.66 per cent of GDP in 2006. In relation to the PBO outcome, the ABO
result turns out to be around seven per cent lower (23 percentage points of GDP).
98
LT – Lithuania
14 LT – Lithuania98
Lithuania – the biggest Baltic country – has 3.40 million inhabitants.99 After the fall of the
iron curtain it has made a positive transition from a centrally planned system to a market
based economy. In the course of EU-accession in January 2004 Lithuania experienced a
boost in the trade and tourism sector and considerably high economic growth rates. The
currency of Lithuania is the Litas (LTL).100 After Lithuania only narrowly missed qualifying
for membership in the Euro zone in 2006, it is expected to join the Euro currency area in
the coming years. Lithuania´s GDP in 2006 amounted to 82.8 bn. LTL, corresponding to
24.0 bn. EUR. The respective per capita GDP added up to 7,050 EUR.
14.1 Demographic situation
With declining fertility rates and rises in life expectancy the Lithuanian demography
follows the same trend as the rest of Europe. However, comparing the absolute numbers of
fertility and life expectancy with the rest of the EU, Lithuania is not representing the
European average. Not only the total fertility rate of 1.31 is beyond the EU-average, but
also life expectancy in Lithuania is much lower than in the majority of the EU countries.
According to Eurostat a male (female) Lithuanian born in 2006 can expect to live for 65.3
(77) years. This value is expected to increase further until 2050 to 75.5 (83.7) for men
(women).101 Both factors – life expectancy and fertility – have a significant effect on the
age specific population structure shown in Figure 30:
98 We would like to thank Tomas Paulauskas from Statistics Lithuania for valuable comments on this chapter. 99 Figure as at January 1st, 2006. We display country data for 2006 since this is a main base year for our calculations. 100 The exchange rate is 3.4528 LTL to the Euro as per December 29th, 2006. 101 These figures are based on the estimation of Eurostat given in Europop 2004.
99
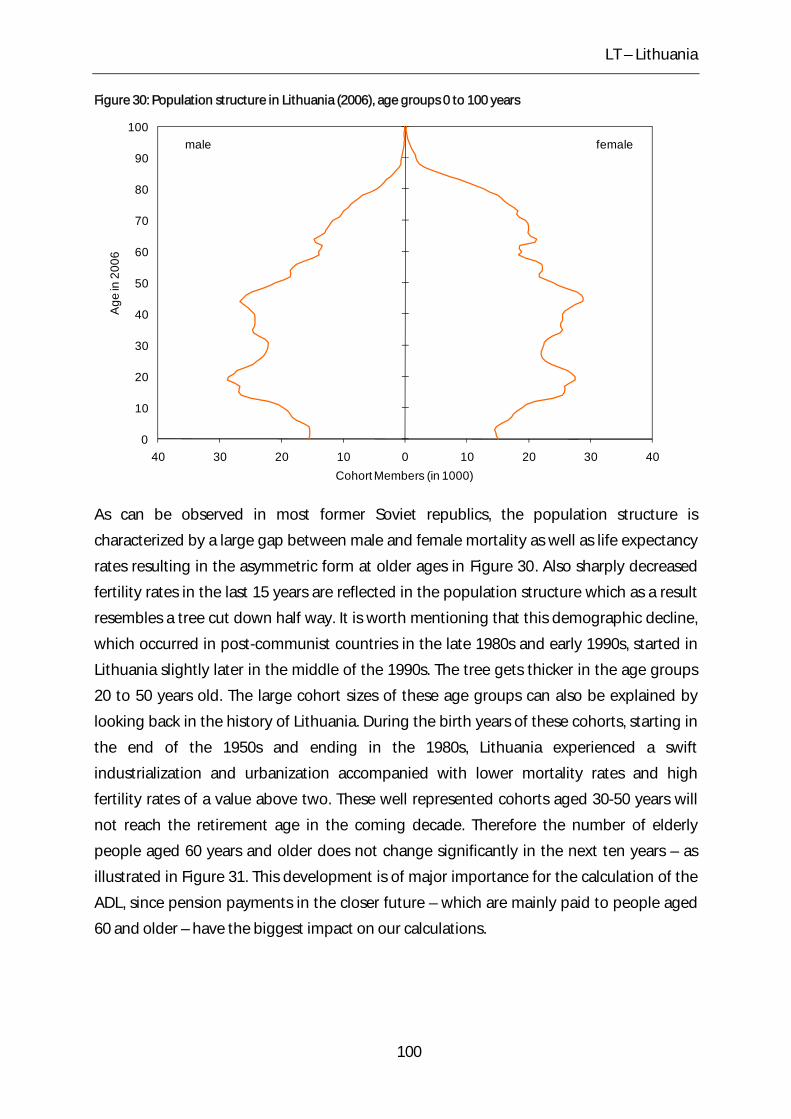
LT – Lithuania
Figure 30: Population structure in Lithuania (2006), age groups 0 to 100 years
0
10
20
30
40
50
60
70
80
90
100
40 30 20 10 0 10 20 30 40
Age
in 2
006
Cohort Members (in 1000)
femalemale
As can be observed in most former Soviet republics, the population structure is
characterized by a large gap between male and female mortality as well as life expectancy
rates resulting in the asymmetric form at older ages in XFigure 30X. Also sharply decreased
fertility rates in the last 15 years are reflected in the population structure which as a result
resembles a tree cut down half way. It is worth mentioning that this demographic decline,
which occurred in post-communist countries in the late 1980s and early 1990s, started in
Lithuania slightly later in the middle of the 1990s. The tree gets thicker in the age groups
20 to 50 years old. The large cohort sizes of these age groups can also be explained by
looking back in the history of Lithuania. During the birth years of these cohorts, starting in
the end of the 1950s and ending in the 1980s, Lithuania experienced a swift
industrialization and urbanization accompanied with lower mortality rates and high
fertility rates of a value above two. These well represented cohorts aged 30-50 years will
not reach the retirement age in the coming decade. Therefore the number of elderly
people aged 60 years and older does not change significantly in the next ten years – as
illustrated in Figure 31. This development is of major importance for the calculation of the
ADL, since pension payments in the closer future – which are mainly paid to people aged
60 and older – have the biggest impact on our calculations.
100
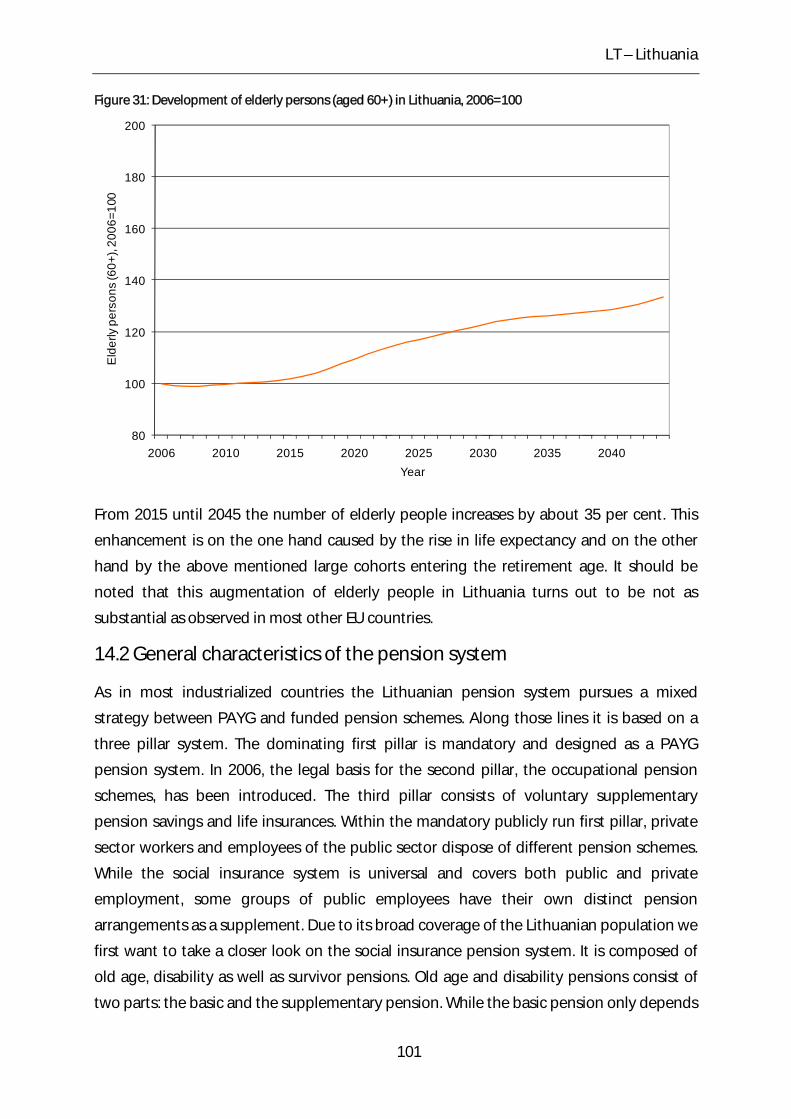
LT – Lithuania
Figure 31: Development of elderly persons (aged 60+) in Lithuania, 2006=100
80
100
120
140
160
180
200
2006 2010 2015 2020 2025 2030 2035 2040
Eld
erly
per
sons
(60+
), 20
06=1
00
Year
From 2015 until 2045 the number of elderly people increases by about 35 per cent. This
enhancement is on the one hand caused by the rise in life expectancy and on the other
hand by the above mentioned large cohorts entering the retirement age. It should be
noted that this augmentation of elderly people in Lithuania turns out to be not as
substantial as observed in most other EU countries.
14.2 General characteristics of the pension system
As in most industrialized countries the Lithuanian pension system pursues a mixed
strategy between PAYG and funded pension schemes. Along those lines it is based on a
three pillar system. The dominating first pillar is mandatory and designed as a PAYG
pension system. In 2006, the legal basis for the second pillar, the occupational pension
schemes, has been introduced. The third pillar consists of voluntary supplementary
pension savings and life insurances. Within the mandatory publicly run first pillar, private
sector workers and employees of the public sector dispose of different pension schemes.
While the social insurance system is universal and covers both public and private
employment, some groups of public employees have their own distinct pension
arrangements as a supplement. Due to its broad coverage of the Lithuanian population we
first want to take a closer look on the social insurance pension system. It is composed of
old age, disability as well as survivor pensions. Old age and disability pensions consist of
two parts: the basic and the supplementary pension. While the basic pension only depends
101
LT – Lithuania
on the length of the social insurance period the supplementary pension is determined by
additional factors. These include the accrual rate, the length of the social insurance period,
the individual wage coefficient (a ratio between person´s monthly earnings and the state
insured income) as well as the state insured income of the respective period. Benefits of
the supplementary pension in Lithuania are therefore to a greater extent linked to past
contributions. The present legal retirement age is 60 (62.5) years for women (men) –
having been gradually increased in recent years. After reaching the retirement age, a
person can continue to work and receive his/her earnings from work together with the old
age pension. If one chooses to retire after (before) the legal retirement age, the pension
will be increased (reduced) by 0.67 (0.4) per cent for every month. Looking at the
indexation of pensions, the basic pension is increased upon decision of the government.
The supplementary part of a pension is adjusted according to current year's average
insured income.102
The state pension scheme works independently from the social insurance pension system.
It is financed by the state budget and awarded to officials and military personnel, judges,
scientists, persons for distinguished achievements for the state (1st and 2nd degree) as well
as for victims and deprived persons. Furthermore, the state pensions consist of the so-
called social assistance state pensions which are paid to persons who do not have a
sufficient social insurance record.
14.3 Recent reforms of the pension system
As most European countries Lithuania is challenged by an ageing society; therefore it
underwent major pension reforms in recent years. With the pension reform starting in
1995, statutory retirement ages have been considerably increased in Lithuania. More
precisely, women’s (men’s) legal retirement age gradually rose from 55 (60) in 1995 to 60
(62.5) in 2006.
Another major reform was initiated in 2004. Its cornerstone was the establishment of the
funded tier of the public pension system. Accordingly, a person insured for the full pension
insurance (including basic and supplementary pensions) may choose to switch to the
funded tier. This implies that he/she directs a part of social insurance contributions,
dedicated for the supplementary part of the old age pension, to a personal account in a
102 Since we have no information about the future indexation of basic pensions – because it is indexed ad hoc by the government – we have to make the following assumption: For our calculations we presume that full pensions (basic and supplementary pensions) are indexed to 70 per cent by the growth of the insured income and to 30 per cent according to the CPI.
102

LT – Lithuania
chosen privately managed pension fund. The part of the contributions directed to private
pension funds was the following: 2.5 (2004), 3.5 (2005), 4.5 (2006) and 5.5 percentage
points of total 26 per cent paid for the pension insurance in 2007. For our calculations it is
important to notice that the supplementary part of the social insurance old age pension is
reduced respectively. In the long run this reform will have a substantial impact on the
pension system. However, taking the year 2006 as the base year of our calculations, this
reform plays only a minor role since most of pension entitlements have been accrued
under the pre-reform system.
14.4 Results
The aim of our calculation is to quantify pension entitlements accrued-to-date which can
be further differentiated into pension payments to present pensioners and to future
pensioners. The current total pension expenditures represent an appropriate starting point
for our calculations since they indicate how much is spent for present pensioners. Table 37
displays the aggregated pension benefits of the two pension schemes in Lithuania – social
security and state pensions.
Table 37: Social security and government employer pension payments Lithuania (in million EUR)
Type of pension Pension payments
2005 2006 2007
Social security pensions 1,278.090 1,439.396 2,071.827
Old age pensions 917.540 1,037.273 1,511.478
Disability pensions 285.658 325.395 446.794
Survivor pensions 74.892 76.728 113.555
State pensions 110.409 118.007 137.569
Total 1,388.499 1,557.403 2,209.396
Table 37 illustrates that total pension expenditures in Lithuania amounted to 1.56 bn. EUR
in 2006, which corresponds to 6.5 per cent of GDP. In comparison to most other European
countries these pension expenditures are relatively small. Therefore, one could assume
that the Lithuanian ADL are comparably small as well. This is first of all only a presumption
since other factors such as the demographic development, the indexation of future
pensions as well as recent pension reforms can have significant impacts on the ADL results.
103
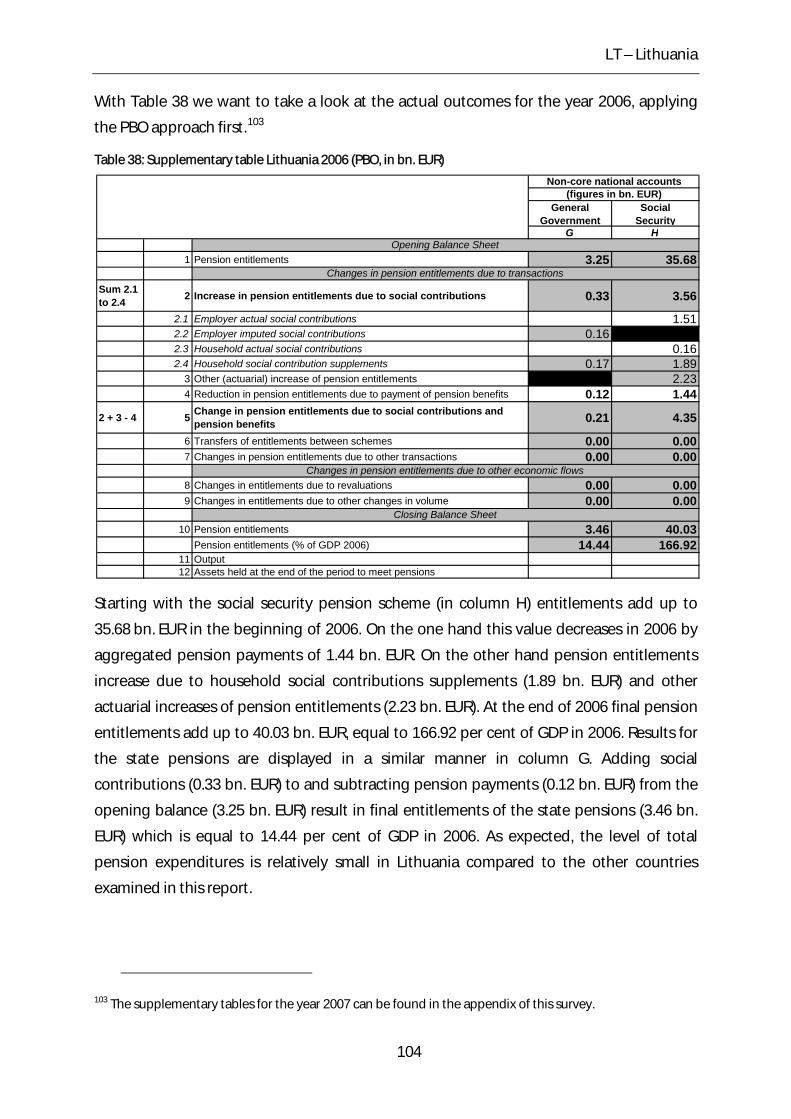
LT – Lithuania
With Table 38 we want to take a look at the actual outcomes for the year 2006, applying
the PBO approach first.103
Table 38: Supplementary table Lithuania 2006 (PBO, in bn. EUR)
General Government
Social Security
G H
1 Pension entitlements 3.25 35.68
Sum 2.1 to 2.4 2 Increase in pension entitlements due to social contributions 0.33 3.56
2.1 Employer actual social contributions 1.512.2 Employer imputed social contributions 0.162.3 Household actual social contributions 0.162.4 Household social contribution supplements 0.17 1.89
3 Other (actuarial) increase of pension entitlements 2.234 Reduction in pension entitlements due to payment of pension benefits 0.12 1.44
2 + 3 - 4 5 Change in pension entitlements due to social contributions and pension benefits 0.21 4.35
6 Transfers of entitlements between schemes 0.00 0.007 Changes in pension entitlements due to other transactions 0.00 0.00
8 Changes in entitlements due to revaluations 0.00 0.009 Changes in entitlements due to other changes in volume 0.00 0.00
10 Pension entitlements 3.46 40.03Pension entitlements (% of GDP 2006) 14.44 166.92
11 Output12 Assets held at the end of the period to meet pensions
Closing Balance Sheet
Non-core national accounts(figures in bn. EUR)
Changes in pension entitlements due to transactions
Changes in pension entitlements due to other economic flows
Opening Balance Sheet
Starting with the social security pension scheme (in column H) entitlements add up to
35.68 bn. EUR in the beginning of 2006. On the one hand this value decreases in 2006 by
aggregated pension payments of 1.44 bn. EUR. On the other hand pension entitlements
increase due to household social contributions supplements (1.89 bn. EUR) and other
actuarial increases of pension entitlements (2.23 bn. EUR). At the end of 2006 final pension
entitlements add up to 40.03 bn. EUR, equal to 166.92 per cent of GDP in 2006. Results for
the state pensions are displayed in a similar manner in column G. Adding social
contributions (0.33 bn. EUR) to and subtracting pension payments (0.12 bn. EUR) from the
opening balance (3.25 bn. EUR) result in final entitlements of the state pensions (3.46 bn.
EUR) which is equal to 14.44 per cent of GDP in 2006. As expected, the level of total
pension expenditures is relatively small in Lithuania compared to the other countries
examined in this report.
103 The supplementary tables for the year 2007 can be found in the appendix of this survey.
104
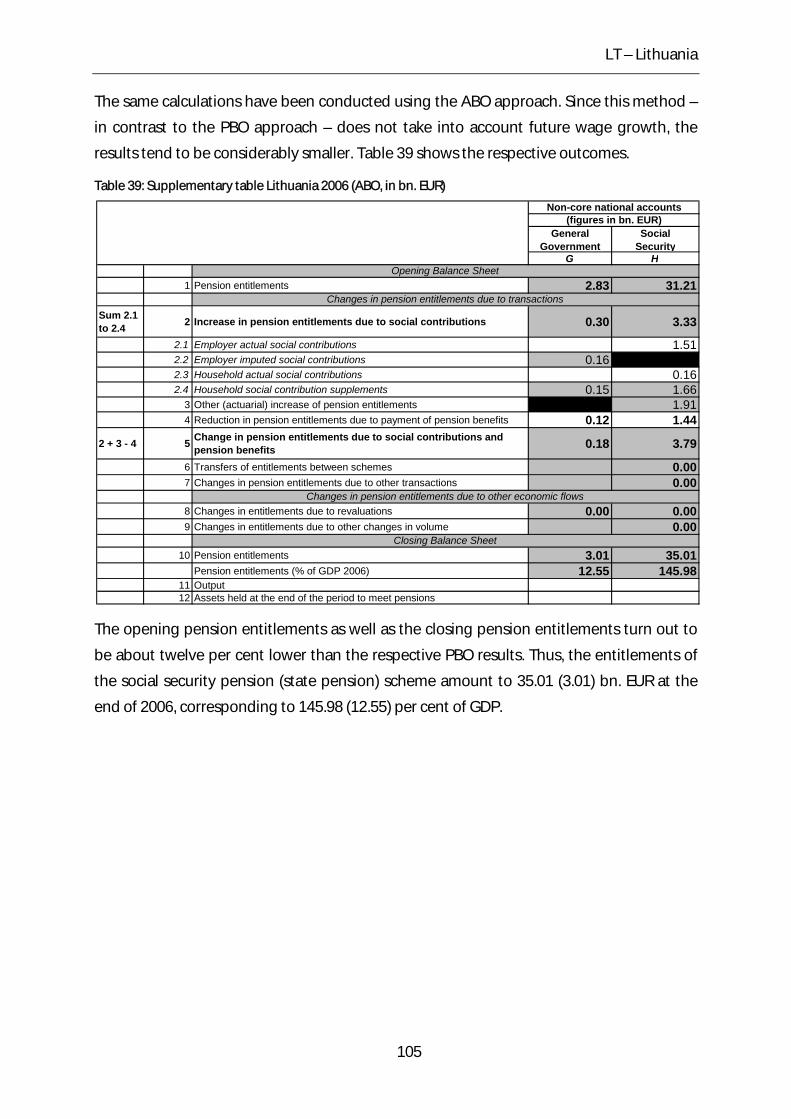
LT – Lithuania
The same calculations have been conducted using the ABO approach. Since this method –
in contrast to the PBO approach – does not take into account future wage growth, the
results tend to be considerably smaller. Table 39 shows the respective outcomes.
Table 39: Supplementary table Lithuania 2006 (ABO, in bn. EUR)
General Government
Social Security
G H
1 Pension entitlements 2.83 31.21
Sum 2.1 to 2.4 2 Increase in pension entitlements due to social contributions 0.30 3.33
2.1 Employer actual social contributions 1.512.2 Employer imputed social contributions 0.162.3 Household actual social contributions 0.162.4 Household social contribution supplements 0.15 1.66
3 Other (actuarial) increase of pension entitlements 1.914 Reduction in pension entitlements due to payment of pension benefits 0.12 1.44
2 + 3 - 4 5 Change in pension entitlements due to social contributions and pension benefits 0.18 3.79
6 Transfers of entitlements between schemes 0.007 Changes in pension entitlements due to other transactions 0.00
8 Changes in entitlements due to revaluations 0.00 0.009 Changes in entitlements due to other changes in volume 0.00
10 Pension entitlements 3.01 35.01Pension entitlements (% of GDP 2006) 12.55 145.98
11 Output12 Assets held at the end of the period to meet pensions
Closing Balance Sheet
Non-core national accounts(figures in bn. EUR)
Changes in pension entitlements due to transactions
Changes in pension entitlements due to other economic flows
Opening Balance Sheet
The opening pension entitlements as well as the closing pension entitlements turn out to
be about twelve per cent lower than the respective PBO results. Thus, the entitlements of
the social security pension (state pension) scheme amount to 35.01 (3.01) bn. EUR at the
end of 2006, corresponding to 145.98 (12.55) per cent of GDP.
105
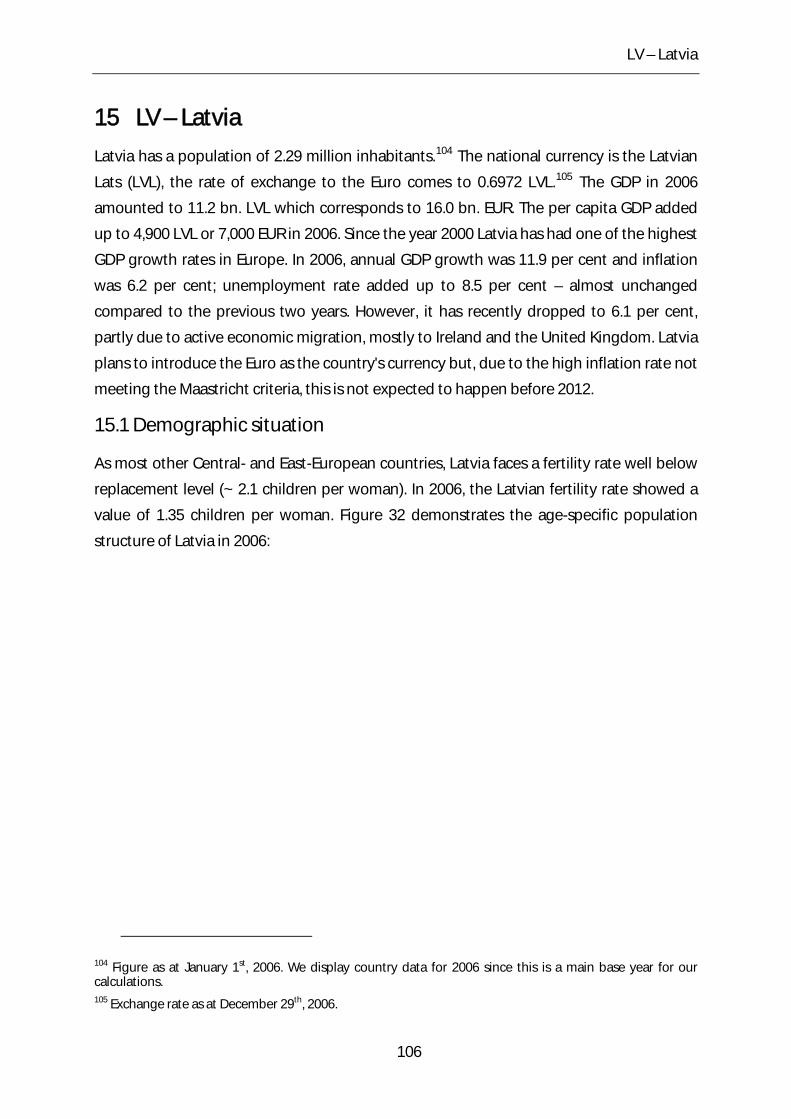
LV – Latvia
15 LV – Latvia
Latvia has a population of 2.29 million inhabitants.104 The national currency is the Latvian
Lats (LVL), the rate of exchange to the Euro comes to 0.6972 LVL.105 The GDP in 2006
amounted to 11.2 bn. LVL which corresponds to 16.0 bn. EUR. The per capita GDP added
up to 4,900 LVL or 7,000 EUR in 2006. Since the year 2000 Latvia has had one of the highest
GDP growth rates in Europe. In 2006, annual GDP growth was 11.9 per cent and inflation
was 6.2 per cent; unemployment rate added up to 8.5 per cent – almost unchanged
compared to the previous two years. However, it has recently dropped to 6.1 per cent,
partly due to active economic migration, mostly to Ireland and the United Kingdom. Latvia
plans to introduce the Euro as the country's currency but, due to the high inflation rate not
meeting the Maastricht criteria, this is not expected to happen before 2012.
15.1 Demographic situation
As most other Central- and East-European countries, Latvia faces a fertility rate well below
replacement level (~ 2.1 children per woman). In 2006, the Latvian fertility rate showed a
value of 1.35 children per woman. Figure 32 demonstrates the age-specific population
structure of Latvia in 2006:
104 Figure as at January 1st, 2006. We display country data for 2006 since this is a main base year for our calculations. 105 Exchange rate as at December 29th, 2006.
106
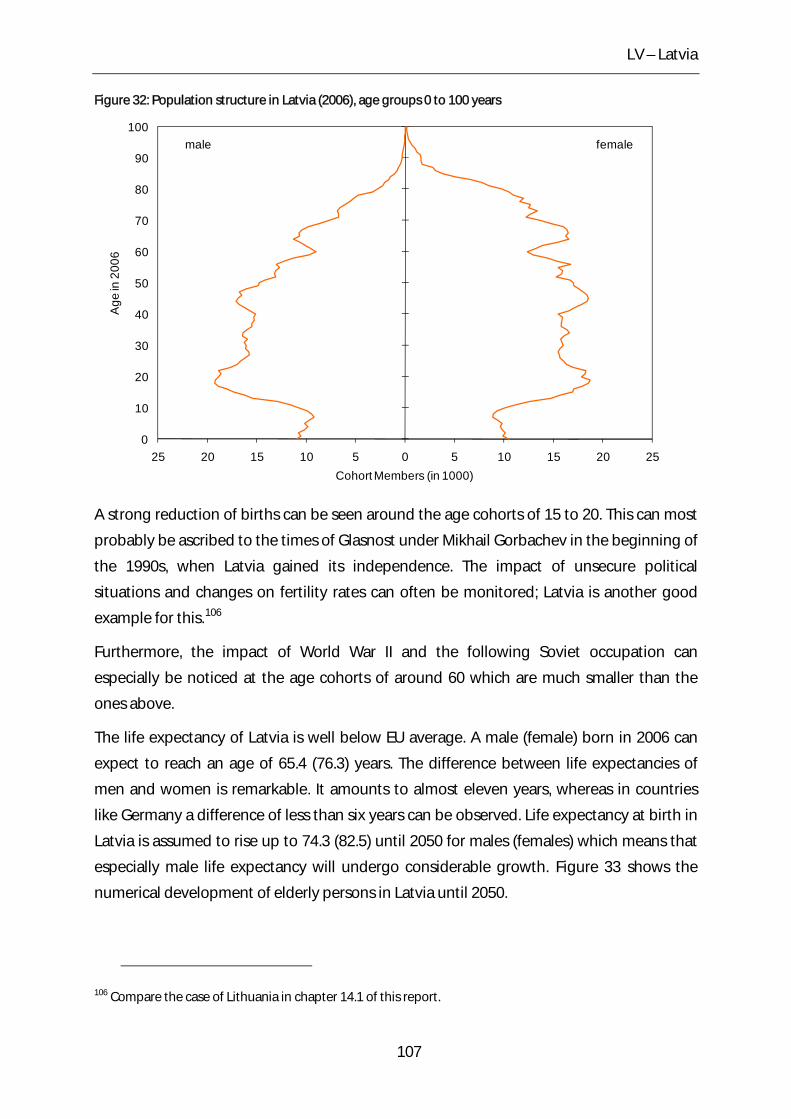
LV – Latvia
Figure 32: Population structure in Latvia (2006), age groups 0 to 100 years
0
10
20
30
40
50
60
70
80
90
100
25 20 15 10 5 0 5 10 15 20 25
Age
in 2
006
Cohort Members (in 1000)
femalemale
A strong reduction of births can be seen around the age cohorts of 15 to 20. This can most
probably be ascribed to the times of Glasnost under Mikhail Gorbachev in the beginning of
the 1990s, when Latvia gained its independence. The impact of unsecure political
situations and changes on fertility rates can often be monitored; Latvia is another good
example for this.106
Furthermore, the impact of World War II and the following Soviet occupation can
especially be noticed at the age cohorts of around 60 which are much smaller than the
ones above.
The life expectancy of Latvia is well below EU average. A male (female) born in 2006 can
expect to reach an age of 65.4 (76.3) years. The difference between life expectancies of
men and women is remarkable. It amounts to almost eleven years, whereas in countries
like Germany a difference of less than six years can be observed. Life expectancy at birth in
Latvia is assumed to rise up to 74.3 (82.5) until 2050 for males (females) which means that
especially male life expectancy will undergo considerable growth. XFigure 33X shows the
numerical development of elderly persons in Latvia until 2050.
106 Compare the case of Lithuania in chapter 14.1 of this report.
107
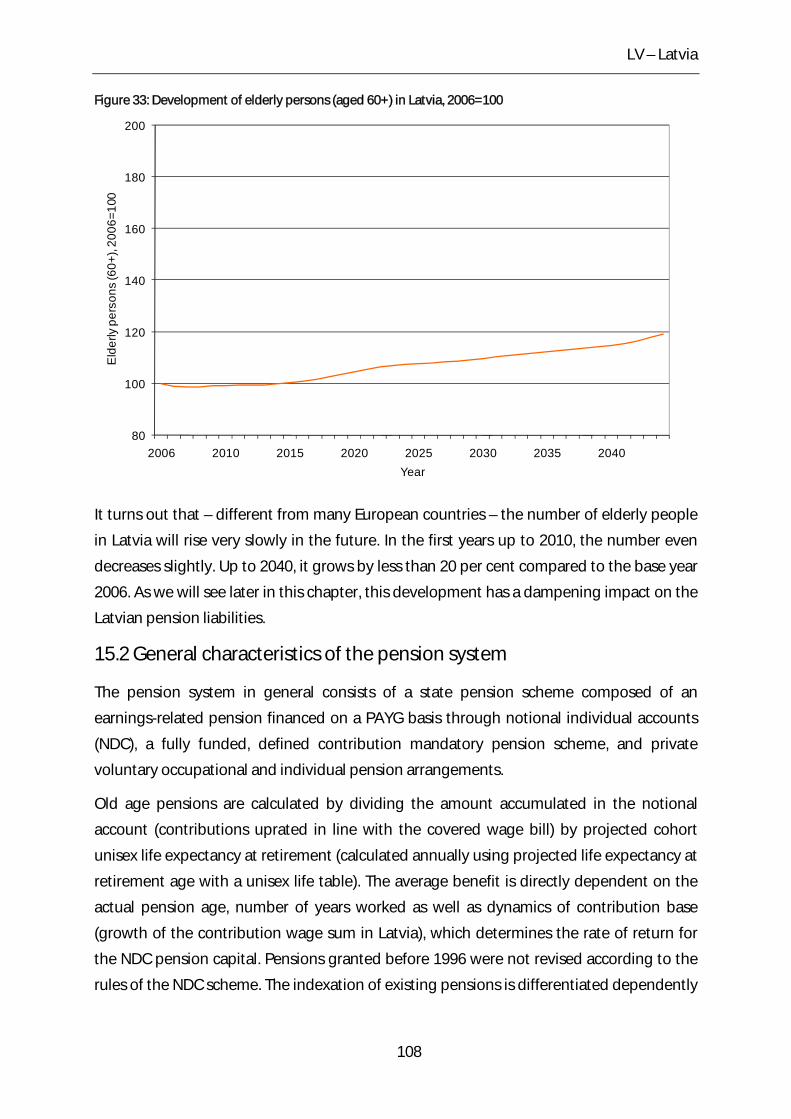
LV – Latvia
Figure 33: Development of elderly persons (aged 60+) in Latvia, 2006=100
80
100
120
140
160
180
200
2006 2010 2015 2020 2025 2030 2035 2040
Eld
erly
per
sons
(60+
), 20
06=1
00
Year
It turns out that – different from many European countries – the number of elderly people
in Latvia will rise very slowly in the future. In the first years up to 2010, the number even
decreases slightly. Up to 2040, it grows by less than 20 per cent compared to the base year
2006. As we will see later in this chapter, this development has a dampening impact on the
Latvian pension liabilities.
15.2 General characteristics of the pension system
The pension system in general consists of a state pension scheme composed of an
earnings-related pension financed on a PAYG basis through notional individual accounts
(NDC), a fully funded, defined contribution mandatory pension scheme, and private
voluntary occupational and individual pension arrangements.
Old age pensions are calculated by dividing the amount accumulated in the notional
account (contributions uprated in line with the covered wage bill) by projected cohort
unisex life expectancy at retirement (calculated annually using projected life expectancy at
retirement age with a unisex life table). The average benefit is directly dependent on the
actual pension age, number of years worked as well as dynamics of contribution base
(growth of the contribution wage sum in Latvia), which determines the rate of return for
the NDC pension capital. Pensions granted before 1996 were not revised according to the
rules of the NDC scheme. The indexation of existing pensions is differentiated dependently
108
LV – Latvia
on the amount of the pension. Small pensions are indexed considering the actual CPI and
50 per cent of the real growth of contribution wage sum. Other pensions are indexed with
CPI.107
Benefits can be claimed at any time from the retirement age. The transition to the
retirement age of 62 is carried out on a step-by-step basis, i.e. by six months each year.
Men have already reached the retirement age of 62 since 2003, but women will reach it in
2008. In 2006, legal retirement age for women was 61 years. Up to mid-2008 (early
retirement will be eliminated after this date), the legislation provides for a possibility to
retire two years before the age of 62 for men and two years before the increasing schedule
to 62 for women, if persons insurance record is 30 years or more. In 2003, the average age
of retirement was 61.1 for men and 57.7 for women.
15.3 Recent reforms of the pension system
In 1995, Latvia was the first country in Central and Eastern Europe to legislate a NDC
reform. The reform consists of two components: The non-financial defined contribution
(NDC) part was implemented on January 1st, 1996; a financial defined contribution (FDC)
part came into force on Juli 1st, 2001. People who reach the minimum pension age are
guaranteed a minimum pension which is financed by revenues outside the overall
contribution of 20 per cent. Rights acquired in the old scheme were converted to NDC
capital.108
15.4 Results
The results of our calculations regarding the pension liabilities of the social security
pension scheme in Latvia are based on the following pension expenditures from 2005,
2006 and 2007, which are shown in Table 40:
107 Due to a lack of further information, we assumed an average indexation rate of CPI plus 25 per cent of wage growth. 108 For a comprehensive description of the Latvian NDC pension system, see Palmer et al. (2006).
109
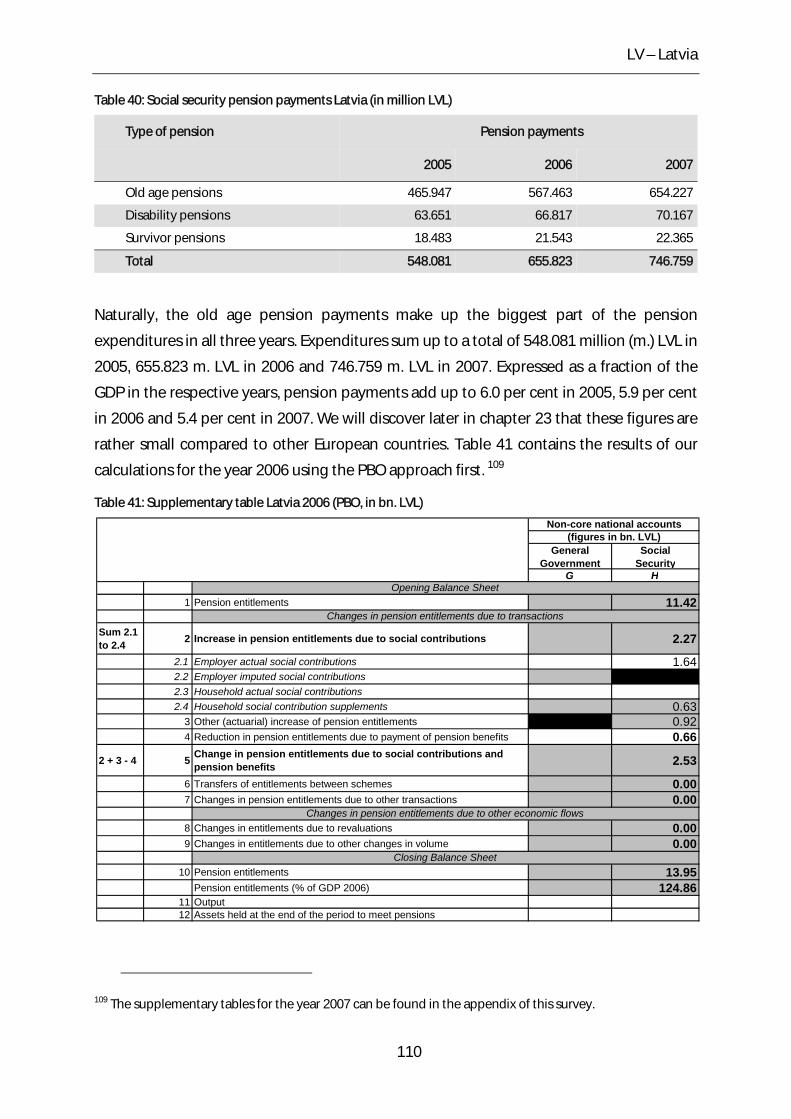
LV – Latvia
Table 40: Social security pension payments Latvia (in million LVL)
Type of pension Pension payments
2005 2006 2007
Old age pensions 465.947 567.463 654.227
Disability pensions 63.651 66.817 70.167
Survivor pensions 18.483 21.543 22.365
Total 548.081 655.823 746.759
Naturally, the old age pension payments make up the biggest part of the pension
expenditures in all three years. Expenditures sum up to a total of 548.081 million (m.) LVL in
2005, 655.823 m. LVL in 2006 and 746.759 m. LVL in 2007. Expressed as a fraction of the
GDP in the respective years, pension payments add up to 6.0 per cent in 2005, 5.9 per cent
in 2006 and 5.4 per cent in 2007. We will discover later in chapter 23 that these figures are
rather small compared to other European countries. Table 41 contains the results of our
calculations for the year 2006 using the PBO approach first. 109
Table 41: Supplementary table Latvia 2006 (PBO, in bn. LVL)
General Government
Social Security
G H
1 Pension entitlements 11.42
Sum 2.1 to 2.4 2 Increase in pension entitlements due to social contributions 2.27
2.1 Employer actual social contributions 1.642.2 Employer imputed social contributions2.3 Household actual social contributions2.4 Household social contribution supplements 0.63
3 Other (actuarial) increase of pension entitlements 0.924 Reduction in pension entitlements due to payment of pension benefits 0.66
2 + 3 - 4 5 Change in pension entitlements due to social contributions and pension benefits 2.53
6 Transfers of entitlements between schemes 0.007 Changes in pension entitlements due to other transactions 0.00
8 Changes in entitlements due to revaluations 0.009 Changes in entitlements due to other changes in volume 0.00
10 Pension entitlements 13.95Pension entitlements (% of GDP 2006) 124.86
11 Output12 Assets held at the end of the period to meet pensions
Closing Balance Sheet
Non-core national accounts(figures in bn. LVL)
Changes in pension entitlements due to transactions
Changes in pension entitlements due to other economic flows
Opening Balance Sheet
109 The supplementary tables for the year 2007 can be found in the appendix of this survey.
110
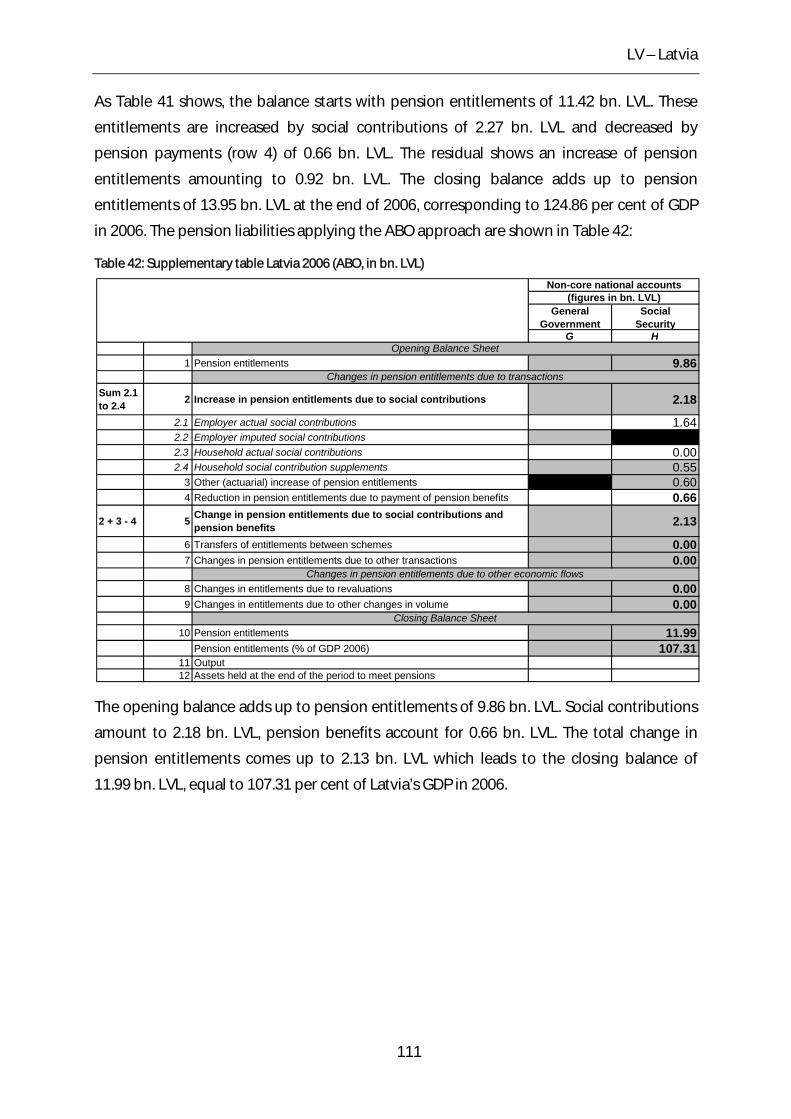
LV – Latvia
As Table 41 shows, the balance starts with pension entitlements of 11.42 bn. LVL. These
entitlements are increased by social contributions of 2.27 bn. LVL and decreased by
pension payments (row 4) of 0.66 bn. LVL. The residual shows an increase of pension
entitlements amounting to 0.92 bn. LVL. The closing balance adds up to pension
entitlements of 13.95 bn. LVL at the end of 2006, corresponding to 124.86 per cent of GDP
in 2006. The pension liabilities applying the ABO approach are shown in Table 42:
Table 42: Supplementary table Latvia 2006 (ABO, in bn. LVL)
General Government
Social Security
G H
1 Pension entitlements 9.86
Sum 2.1 to 2.4 2 Increase in pension entitlements due to social contributions 2.18
2.1 Employer actual social contributions 1.642.2 Employer imputed social contributions2.3 Household actual social contributions 0.002.4 Household social contribution supplements 0.55
3 Other (actuarial) increase of pension entitlements 0.604 Reduction in pension entitlements due to payment of pension benefits 0.66
2 + 3 - 4 5 Change in pension entitlements due to social contributions and pension benefits 2.13
6 Transfers of entitlements between schemes 0.007 Changes in pension entitlements due to other transactions 0.00
8 Changes in entitlements due to revaluations 0.009 Changes in entitlements due to other changes in volume 0.00
10 Pension entitlements 11.99Pension entitlements (% of GDP 2006) 107.31
11 Output12 Assets held at the end of the period to meet pensions
Closing Balance Sheet
Non-core national accounts(figures in bn. LVL)
Changes in pension entitlements due to transactions
Changes in pension entitlements due to other economic flows
Opening Balance Sheet
The opening balance adds up to pension entitlements of 9.86 bn. LVL. Social contributions
amount to 2.18 bn. LVL, pension benefits account for 0.66 bn. LVL. The total change in
pension entitlements comes up to 2.13 bn. LVL which leads to the closing balance of
11.99 bn. LVL, equal to 107.31 per cent of Latvia’s GDP in 2006.
111
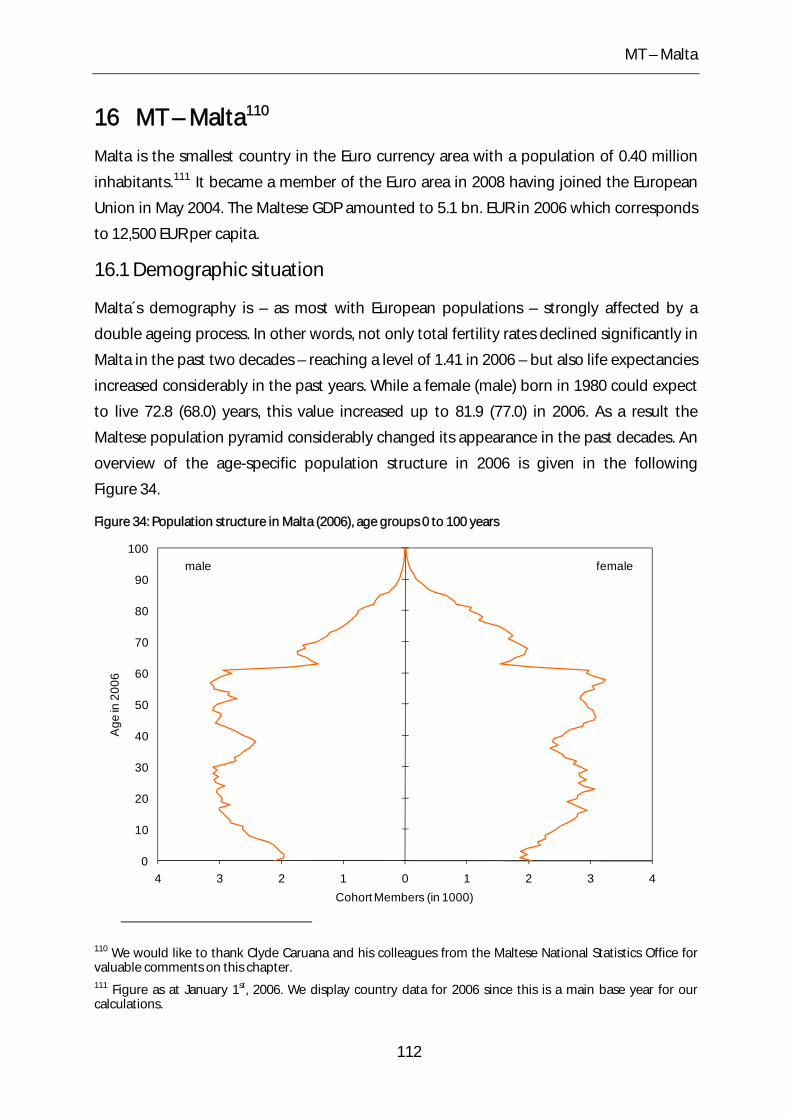
MT – Malta
16 MT – Malta110
Malta is the smallest country in the Euro currency area with a population of 0.40 million
inhabitants.111 It became a member of the Euro area in 2008 having joined the European
Union in May 2004. The Maltese GDP amounted to 5.1 bn. EUR in 2006 which corresponds
to 12,500 EUR per capita.
16.1 Demographic situation
Malta´s demography is – as most with European populations – strongly affected by a
double ageing process. In other words, not only total fertility rates declined significantly in
Malta in the past two decades – reaching a level of 1.41 in 2006 – but also life expectancies
increased considerably in the past years. While a female (male) born in 1980 could expect
to live 72.8 (68.0) years, this value increased up to 81.9 (77.0) in 2006. As a result the
Maltese population pyramid considerably changed its appearance in the past decades. An
overview of the age-specific population structure in 2006 is given in the following
Figure 34.
Figure 34: Population structure in Malta (2006), age groups 0 to 100 years
0
10
20
30
40
50
60
70
80
90
100
4 3 2 1 0 1 2 3 4
Age
in 2
006
Cohort Members (in 1000)
femalemale
110 We would like to thank Clyde Caruana and his colleagues from the Maltese National Statistics Office for valuable comments on this chapter. 111 Figure as at January 1st, 2006. We display country data for 2006 since this is a main base year for our calculations.
112
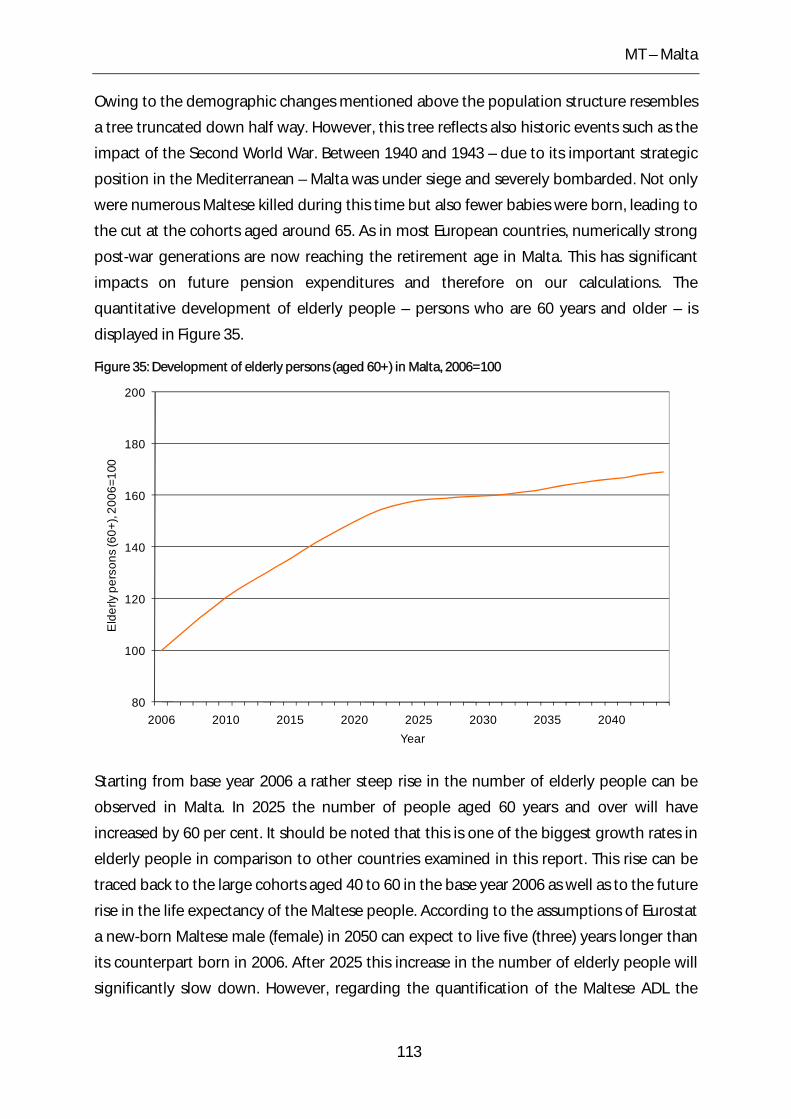
MT – Malta
Owing to the demographic changes mentioned above the population structure resembles
a tree truncated down half way. However, this tree reflects also historic events such as the
impact of the Second World War. Between 1940 and 1943 – due to its important strategic
position in the Mediterranean – Malta was under siege and severely bombarded. Not only
were numerous Maltese killed during this time but also fewer babies were born, leading to
the cut at the cohorts aged around 65. As in most European countries, numerically strong
post-war generations are now reaching the retirement age in Malta. This has significant
impacts on future pension expenditures and therefore on our calculations. The
quantitative development of elderly people – persons who are 60 years and older – is
displayed in Figure 35.
Figure 35: Development of elderly persons (aged 60+) in Malta, 2006=100
80
100
120
140
160
180
200
2006 2010 2015 2020 2025 2030 2035 2040
Eld
erly
per
sons
(60+
), 20
06=1
00
Year
Starting from base year 2006 a rather steep rise in the number of elderly people can be
observed in Malta. In 2025 the number of people aged 60 years and over will have
increased by 60 per cent. It should be noted that this is one of the biggest growth rates in
elderly people in comparison to other countries examined in this report. This rise can be
traced back to the large cohorts aged 40 to 60 in the base year 2006 as well as to the future
rise in the life expectancy of the Maltese people. According to the assumptions of Eurostat
a new-born Maltese male (female) in 2050 can expect to live five (three) years longer than
its counterpart born in 2006. After 2025 this increase in the number of elderly people will
significantly slow down. However, regarding the quantification of the Maltese ADL the
113
MT – Malta
development from 2006 to 2025 is more significant. For the explanation of this fact one
specific and important characteristic of the ADL approach shall be pointed out. Age groups
which retire in the near future (next 20 years) have accrued more entitlements than the
cohorts which receive a pension in the later future (after the next 20 years). This is due to
the fact that the latter are of younger age today and therefore have contributed for a
shorter period to the pension system.
16.2 General characteristics of the pension system
In line with the majority of Mediterranean countries the corner stone of the Maltese
pension system is represented by the first pillar. An occupational second pillar does not
exist in Malta, with the only exception being that of civil servants employed before 1979.
Individual savings – the third pillar – only play a minor role in Maltese old age provisions.
Nevertheless, they are expected to become more important for the income of future
pensioners.
Since the first pillar is in the focus of our analysis we shall describe it further. The first
(public and mandatory) pillar practically covers the entire Maltese population and is
financed as common by a PAYG system. It consists of a non-contributory as well as a
contributory scheme. The former scheme is a means-tested, flat rate benefit, securing a
minimum pension to people over age 61 for men and 60 for women. Its benefits are
indexed to inflation. The contributory scheme is named the “two-thirds” pension since it
amounts to two-thirds of the average reference wage. In the case of employees (self-
employed) the two thirds pension is calculated on the basis of the average basic wages
(net-income) during the best three (ten) out of the last ten years prior to retirement. For
the calculation of the pension, past wages (net-incomes) are generally indexed with the
relative cost of living increases. A full pension of two-thirds is payable to persons who have
paid or have been credited with 30 years of contributions (with a yearly average of 50
contributions). Fewer years of contributions result in linearly reduced pensions with the
minimum years of contributions amounting to nine.
The two-thirds pension covers all employees, self employed as well as civil servants
employed after 1979. However, civil servants appointed before 1979, persons enrolled in
the police force (after 25 years of service or 55 years of age), and members of the army are
entitled to receive the so-called Treasury Pension.112
112 According to the Maltese National Statistics Office the last civil servants to benefit from Treasury Pension will retire in 2020. Knowing that civil servants presently represent about 75 per cent of beneficiaries of
114

MT – Malta
Regarding the adjustment of pensions the Maltese pension system differentiates between
persons born before and persons born after 1962. Pensions of the former group are
adjusted on the highest of either the cost of living adjustment (COLA) or the increase in
wages awarded to the present occupant of the last post occupied by the pensioner.
According to the Maltese National Statistics Office pensions are indexed in practice by
about 90 per cent according to wage growth and ten per cent according to the COLA
increase. This proportion has been used in our calculations. Pensions of people born after
1962 are indexed by 70 per cent by the growth of the national average wage and
30 per cent by inflation. However, this new indexation rule will not apply before 2012. The
statutory retirement age for women (men) in Malta is 60 (61) years in 2006. This value will
gradually increase to 65.
16.3 Recent reforms of the pension system
Under the pressure of budget deficits and the demographic development described above
Malta adopted a rather profound pension reform in 2006. The most significant reform
steps and their implication for the ADL shall be outlined in the following section.
According to the new 2006 legislation the statutory pension age will be gradually raised (in
the period 2014 to 2023) to 65 years for men and women likewise. According to our
calculations this reform step reduces the Maltese pension liabilities by about seven per
cent of GDP in 2006. Furthermore, the necessary period of contribution to receive a full
two-thirds pension will be increased from 30 to 40 years (for people born after 1962). Also
another reform affects the pension calculation of persons born after 1962. Their pension
shall be determined on the best ten basic wages within the last forty years prior to
retirement. According to our calculations the change in the reference period to the best
ten years will lead to a reduction of the pension level of six (four) per cent for men
(women). For this calculation it is assumed that the relative profile of the insurable income
– shown in XFigure 36X – stays constant over time, the per capita wage growth amounts to
1.5 per cent and the average old age retirement age for both sexes is 61 years (and
gradually increases to 65).113 However, it should be noted that this reduction factor
Treasury Pensions, one can expect that total expenditures of this pension scheme will decrease considerably in the coming decades. 113 At present, average gross wages after the age of 61 decline tremendously. This might be due to the fact that elderly people work only part time. For our calculation we assume that the relative wage profile of the last ten years before retiring stays constant. In other words, somebody who retires in the future at the increased statutory retirement age of 65 is expected to have the same relative wage profile – with respect to the last ten years – as somebody who retires at the present statutory retirement age of 61.
115
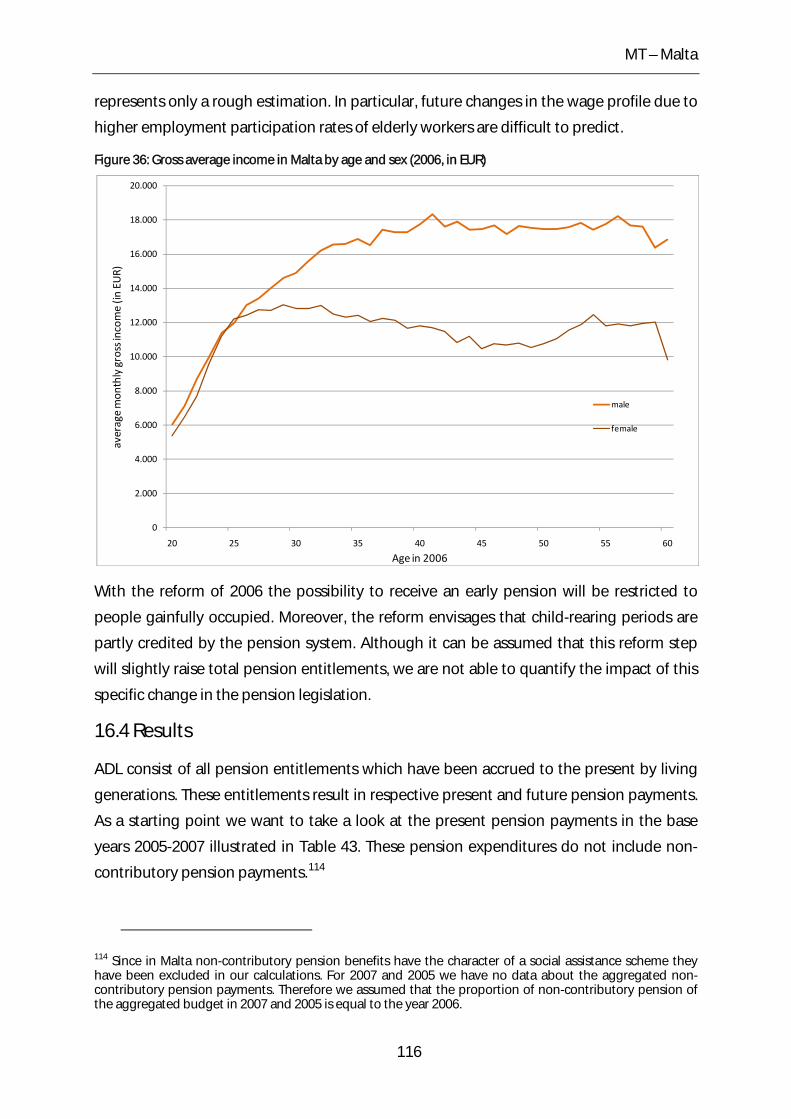
MT – Malta
represents only a rough estimation. In particular, future changes in the wage profile due to
higher employment participation rates of elderly workers are difficult to predict.
Figure 36: Gross average income in Malta by age and sex (2006, in EUR)
0
2.000
4.000
6.000
8.000
10.000
12.000
14.000
16.000
18.000
20.000
20 25 30 35 40 45 50 55 60
average mon
thly gross income (in
EUR)
Age in 2006
male
female
With the reform of 2006 the possibility to receive an early pension will be restricted to
people gainfully occupied. Moreover, the reform envisages that child-rearing periods are
partly credited by the pension system. Although it can be assumed that this reform step
will slightly raise total pension entitlements, we are not able to quantify the impact of this
specific change in the pension legislation.
16.4 Results
ADL consist of all pension entitlements which have been accrued to the present by living
generations. These entitlements result in respective present and future pension payments.
As a starting point we want to take a look at the present pension payments in the base
years 2005-2007 illustrated in Table 43. These pension expenditures do not include non-
contributory pension payments.114
114 Since in Malta non-contributory pension benefits have the character of a social assistance scheme they have been excluded in our calculations. For 2007 and 2005 we have no data about the aggregated non-contributory pension payments. Therefore we assumed that the proportion of non-contributory pension of the aggregated budget in 2007 and 2005 is equal to the year 2006.
116
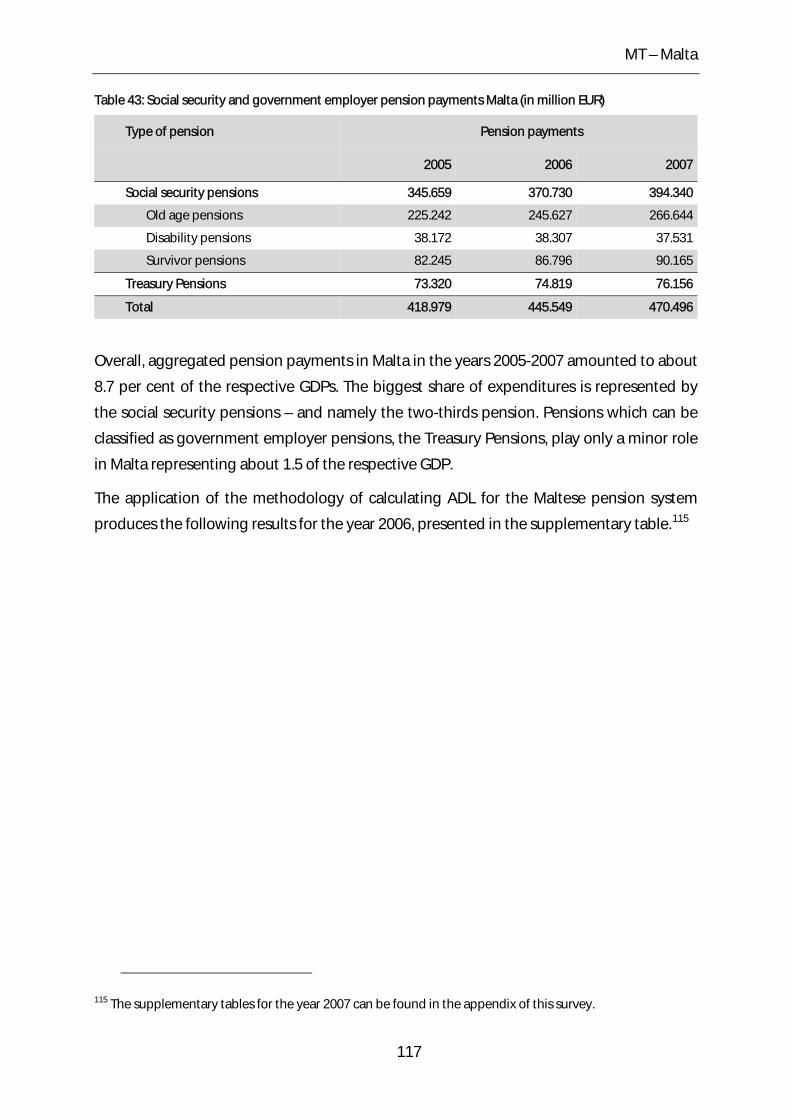
MT – Malta
Table 43: Social security and government employer pension payments Malta (in million EUR)
Type of pension Pension payments
2005 2006 2007
Social security pensions 345.659 370.730 394.340
Old age pensions 225.242 245.627 266.644
Disability pensions 38.172 38.307 37.531
Survivor pensions 82.245 86.796 90.165
Treasury Pensions 73.320 74.819 76.156
Total 418.979 445.549 470.496
Overall, aggregated pension payments in Malta in the years 2005-2007 amounted to about
8.7 per cent of the respective GDPs. The biggest share of expenditures is represented by
the social security pensions – and namely the two-thirds pension. Pensions which can be
classified as government employer pensions, the Treasury Pensions, play only a minor role
in Malta representing about 1.5 of the respective GDP.
The application of the methodology of calculating ADL for the Maltese pension system
produces the following results for the year 2006, presented in the supplementary table.115
115 The supplementary tables for the year 2007 can be found in the appendix of this survey.
117
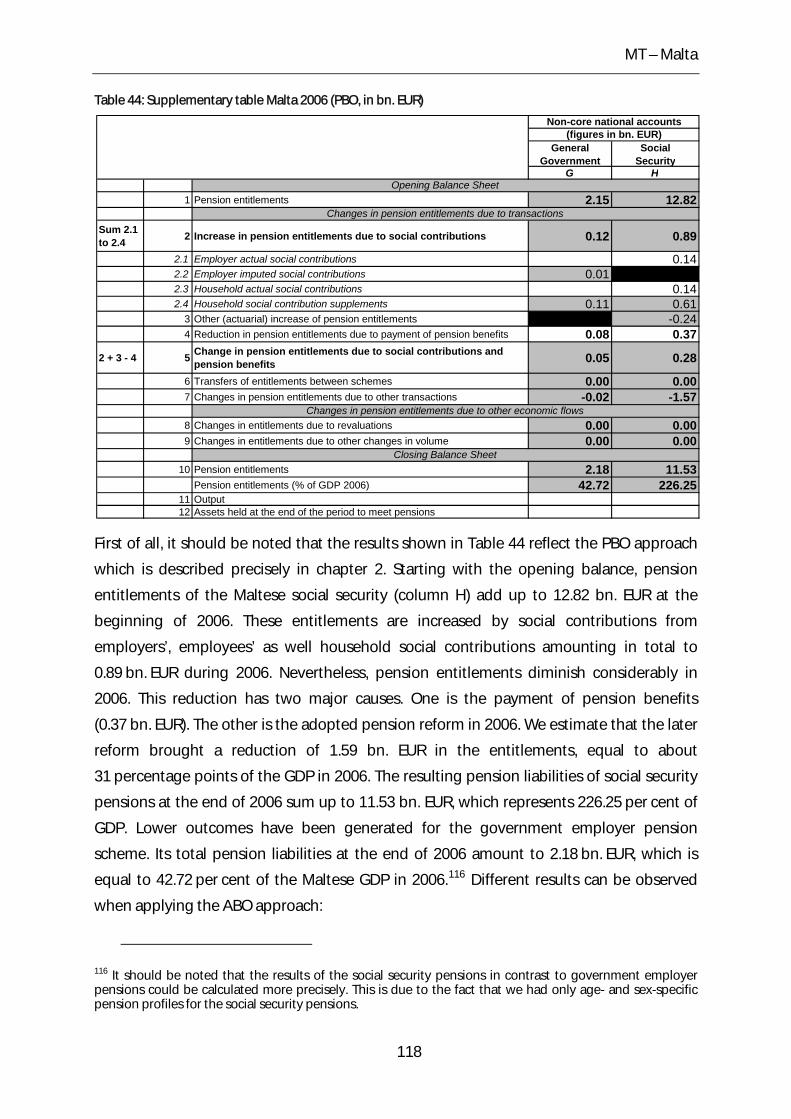
MT – Malta
Table 44: Supplementary table Malta 2006 (PBO, in bn. EUR)
General Government
Social Security
G H
1 Pension entitlements 2.15 12.82
Sum 2.1 to 2.4 2 Increase in pension entitlements due to social contributions 0.12 0.89
2.1 Employer actual social contributions 0.142.2 Employer imputed social contributions 0.012.3 Household actual social contributions 0.142.4 Household social contribution supplements 0.11 0.61
3 Other (actuarial) increase of pension entitlements -0.244 Reduction in pension entitlements due to payment of pension benefits 0.08 0.37
2 + 3 - 4 5 Change in pension entitlements due to social contributions and pension benefits 0.05 0.28
6 Transfers of entitlements between schemes 0.00 0.007 Changes in pension entitlements due to other transactions -0.02 -1.57
8 Changes in entitlements due to revaluations 0.00 0.009 Changes in entitlements due to other changes in volume 0.00 0.00
10 Pension entitlements 2.18 11.53Pension entitlements (% of GDP 2006) 42.72 226.25
11 Output12 Assets held at the end of the period to meet pensions
Closing Balance Sheet
Non-core national accounts(figures in bn. EUR)
Changes in pension entitlements due to transactions
Changes in pension entitlements due to other economic flows
Opening Balance Sheet
First of all, it should be noted that the results shown in Table 44 reflect the PBO approach
which is described precisely in chapter 2. Starting with the opening balance, pension
entitlements of the Maltese social security (column H) add up to 12.82 bn. EUR at the
beginning of 2006. These entitlements are increased by social contributions from
employers’, employees’ as well household social contributions amounting in total to
0.89 bn. EUR during 2006. Nevertheless, pension entitlements diminish considerably in
2006. This reduction has two major causes. One is the payment of pension benefits
(0.37 bn. EUR). The other is the adopted pension reform in 2006. We estimate that the later
reform brought a reduction of 1.59 bn. EUR in the entitlements, equal to about
31 percentage points of the GDP in 2006. The resulting pension liabilities of social security
pensions at the end of 2006 sum up to 11.53 bn. EUR, which represents 226.25 per cent of
GDP. Lower outcomes have been generated for the government employer pension
scheme. Its total pension liabilities at the end of 2006 amount to 2.18 bn. EUR, which is
equal to 42.72 per cent of the Maltese GDP in 2006.116 Different results can be observed
when applying the ABO approach:
116 It should be noted that the results of the social security pensions in contrast to government employer pensions could be calculated more precisely. This is due to the fact that we had only age- and sex-specific pension profiles for the social security pensions.
118
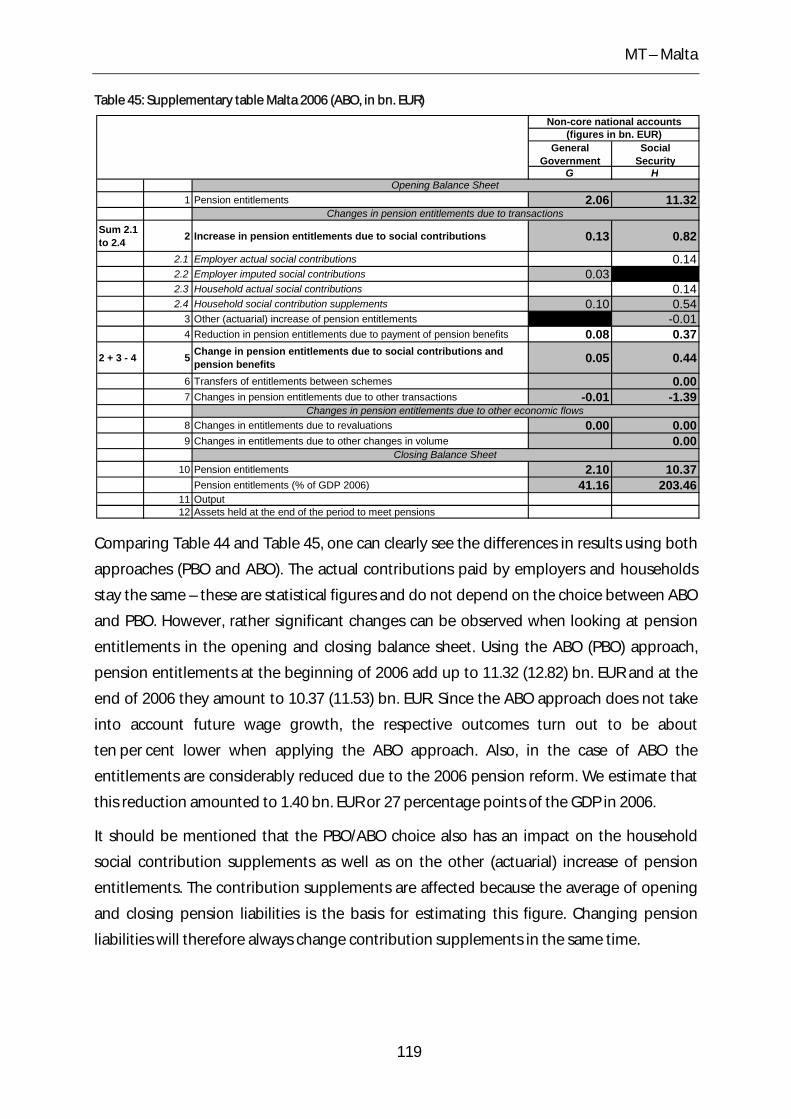
MT – Malta
Table 45: Supplementary table Malta 2006 (ABO, in bn. EUR)
General Government
Social Security
G H
1 Pension entitlements 2.06 11.32
Sum 2.1 to 2.4 2 Increase in pension entitlements due to social contributions 0.13 0.82
2.1 Employer actual social contributions 0.142.2 Employer imputed social contributions 0.032.3 Household actual social contributions 0.142.4 Household social contribution supplements 0.10 0.54
3 Other (actuarial) increase of pension entitlements -0.014 Reduction in pension entitlements due to payment of pension benefits 0.08 0.37
2 + 3 - 4 5 Change in pension entitlements due to social contributions and pension benefits 0.05 0.44
6 Transfers of entitlements between schemes 0.007 Changes in pension entitlements due to other transactions -0.01 -1.39
8 Changes in entitlements due to revaluations 0.00 0.009 Changes in entitlements due to other changes in volume 0.00
10 Pension entitlements 2.10 10.37Pension entitlements (% of GDP 2006) 41.16 203.46
11 Output12 Assets held at the end of the period to meet pensions
Closing Balance Sheet
Non-core national accounts(figures in bn. EUR)
Changes in pension entitlements due to transactions
Changes in pension entitlements due to other economic flows
Opening Balance Sheet
Comparing Table 44 and Table 45, one can clearly see the differences in results using both
approaches (PBO and ABO). The actual contributions paid by employers and households
stay the same – these are statistical figures and do not depend on the choice between ABO
and PBO. However, rather significant changes can be observed when looking at pension
entitlements in the opening and closing balance sheet. Using the ABO (PBO) approach,
pension entitlements at the beginning of 2006 add up to 11.32 (12.82) bn. EUR and at the
end of 2006 they amount to 10.37 (11.53) bn. EUR. Since the ABO approach does not take
into account future wage growth, the respective outcomes turn out to be about
ten per cent lower when applying the ABO approach. Also, in the case of ABO the
entitlements are considerably reduced due to the 2006 pension reform. We estimate that
this reduction amounted to 1.40 bn. EUR or 27 percentage points of the GDP in 2006.
It should be mentioned that the PBO/ABO choice also has an impact on the household
social contribution supplements as well as on the other (actuarial) increase of pension
entitlements. The contribution supplements are affected because the average of opening
and closing pension liabilities is the basis for estimating this figure. Changing pension
liabilities will therefore always change contribution supplements in the same time.
119

MT – Malta
120
Furthermore, the entitlements of the government employer pensions turn out to be lower
applying the ABO approach. At the end of 2006 they add up to 2.10 bn. EUR, which
corresponds to 41 per cent of GDP in 2006.
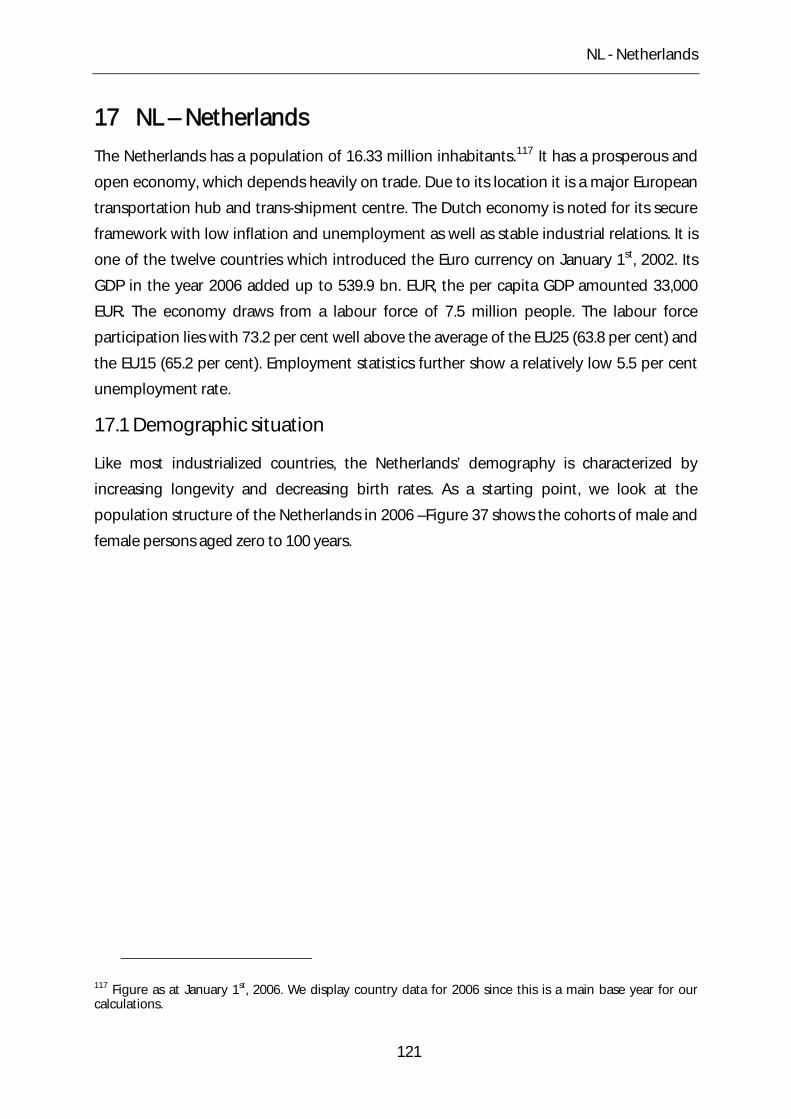
NL - Netherlands
17 NL – Netherlands
The Netherlands has a population of 16.33 million inhabitants.117 It has a prosperous and
open economy, which depends heavily on trade. Due to its location it is a major European
transportation hub and trans-shipment centre. The Dutch economy is noted for its secure
framework with low inflation and unemployment as well as stable industrial relations. It is
one of the twelve countries which introduced the Euro currency on January 1st, 2002. Its
GDP in the year 2006 added up to 539.9 bn. EUR, the per capita GDP amounted 33,000
EUR. The economy draws from a labour force of 7.5 million people. The labour force
participation lies with 73.2 per cent well above the average of the EU25 (63.8 per cent) and
the EU15 (65.2 per cent). Employment statistics further show a relatively low 5.5 per cent
unemployment rate.
17.1 Demographic situation
Like most industrialized countries, the Netherlands’ demography is characterized by
increasing longevity and decreasing birth rates. As a starting point, we look at the
population structure of the Netherlands in 2006 –Figure 37 shows the cohorts of male and
female persons aged zero to 100 years.
117 Figure as at January 1st, 2006. We display country data for 2006 since this is a main base year for our calculations.
121
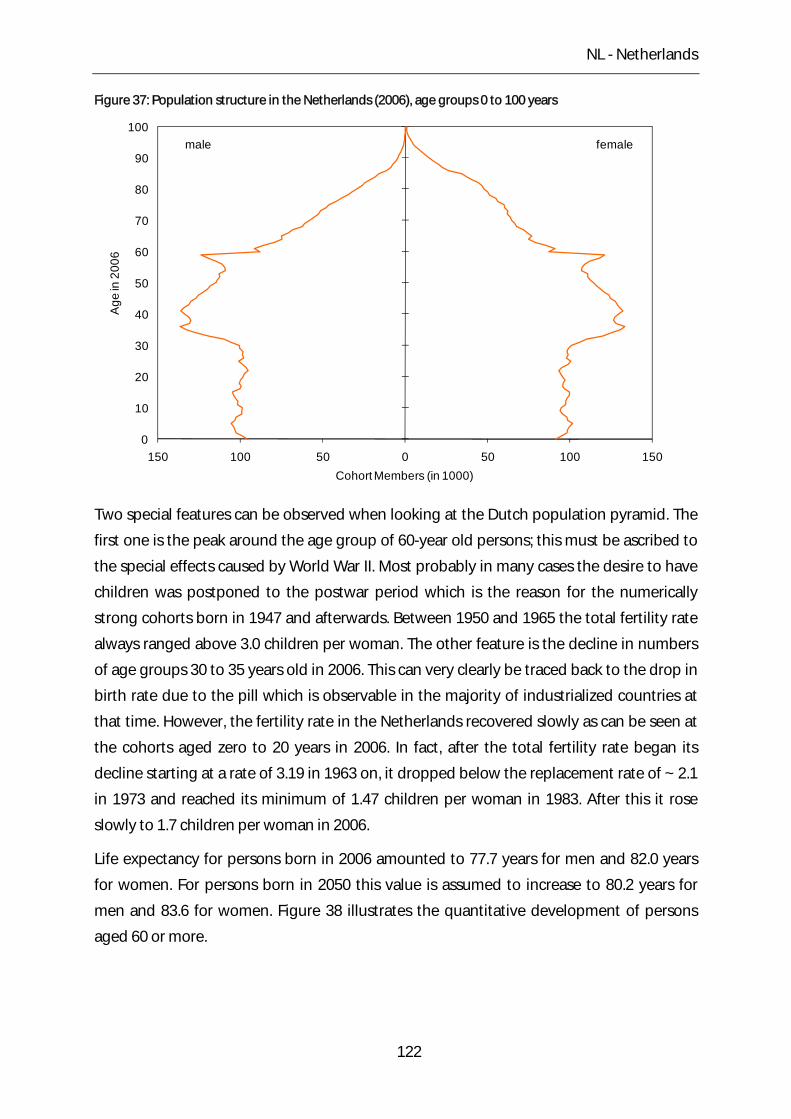
NL - Netherlands
Figure 37: Population structure in the Netherlands (2006), age groups 0 to 100 years
0
10
20
30
40
50
60
70
80
90
100
150 100 50 0 50 100 150
Age
in 2
006
Cohort Members (in 1000)
femalemale
Two special features can be observed when looking at the Dutch population pyramid. The
first one is the peak around the age group of 60-year old persons; this must be ascribed to
the special effects caused by World War II. Most probably in many cases the desire to have
children was postponed to the postwar period which is the reason for the numerically
strong cohorts born in 1947 and afterwards. Between 1950 and 1965 the total fertility rate
always ranged above 3.0 children per woman. The other feature is the decline in numbers
of age groups 30 to 35 years old in 2006. This can very clearly be traced back to the drop in
birth rate due to the pill which is observable in the majority of industrialized countries at
that time. However, the fertility rate in the Netherlands recovered slowly as can be seen at
the cohorts aged zero to 20 years in 2006. In fact, after the total fertility rate began its
decline starting at a rate of 3.19 in 1963 on, it dropped below the replacement rate of ~ 2.1
in 1973 and reached its minimum of 1.47 children per woman in 1983. After this it rose
slowly to 1.7 children per woman in 2006.
Life expectancy for persons born in 2006 amounted to 77.7 years for men and 82.0 years
for women. For persons born in 2050 this value is assumed to increase to 80.2 years for
men and 83.6 for women. Figure 38 illustrates the quantitative development of persons
aged 60 or more.
122
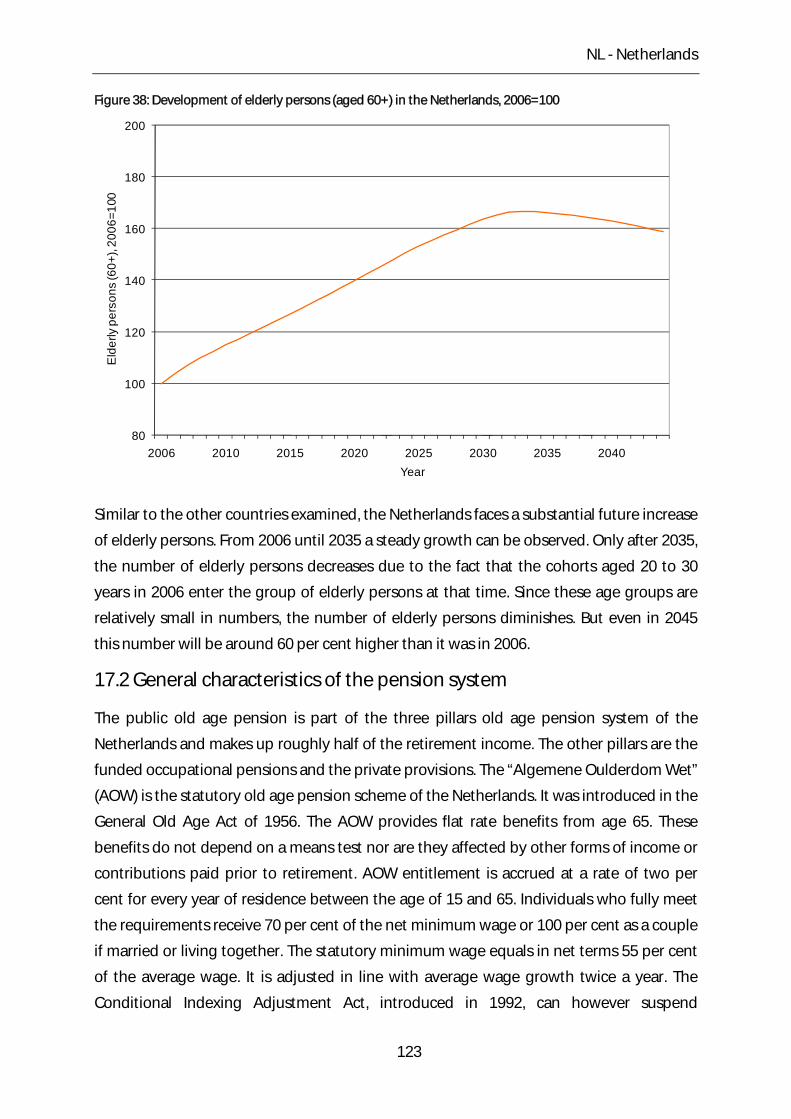
NL - Netherlands
Figure 38: Development of elderly persons (aged 60+) in the Netherlands, 2006=100
80
100
120
140
160
180
200
2006 2010 2015 2020 2025 2030 2035 2040
Eld
erly
per
sons
(60+
), 20
06=1
00
Year
Similar to the other countries examined, the Netherlands faces a substantial future increase
of elderly persons. From 2006 until 2035 a steady growth can be observed. Only after 2035,
the number of elderly persons decreases due to the fact that the cohorts aged 20 to 30
years in 2006 enter the group of elderly persons at that time. Since these age groups are
relatively small in numbers, the number of elderly persons diminishes. But even in 2045
this number will be around 60 per cent higher than it was in 2006.
17.2 General characteristics of the pension system
The public old age pension is part of the three pillars old age pension system of the
Netherlands and makes up roughly half of the retirement income. The other pillars are the
funded occupational pensions and the private provisions. The “Algemene Oulderdom Wet”
(AOW) is the statutory old age pension scheme of the Netherlands. It was introduced in the
General Old Age Act of 1956. The AOW provides flat rate benefits from age 65. These
benefits do not depend on a means test nor are they affected by other forms of income or
contributions paid prior to retirement. AOW entitlement is accrued at a rate of two per
cent for every year of residence between the age of 15 and 65. Individuals who fully meet
the requirements receive 70 per cent of the net minimum wage or 100 per cent as a couple
if married or living together. The statutory minimum wage equals in net terms 55 per cent
of the average wage. It is adjusted in line with average wage growth twice a year. The
Conditional Indexing Adjustment Act, introduced in 1992, can however suspend
123
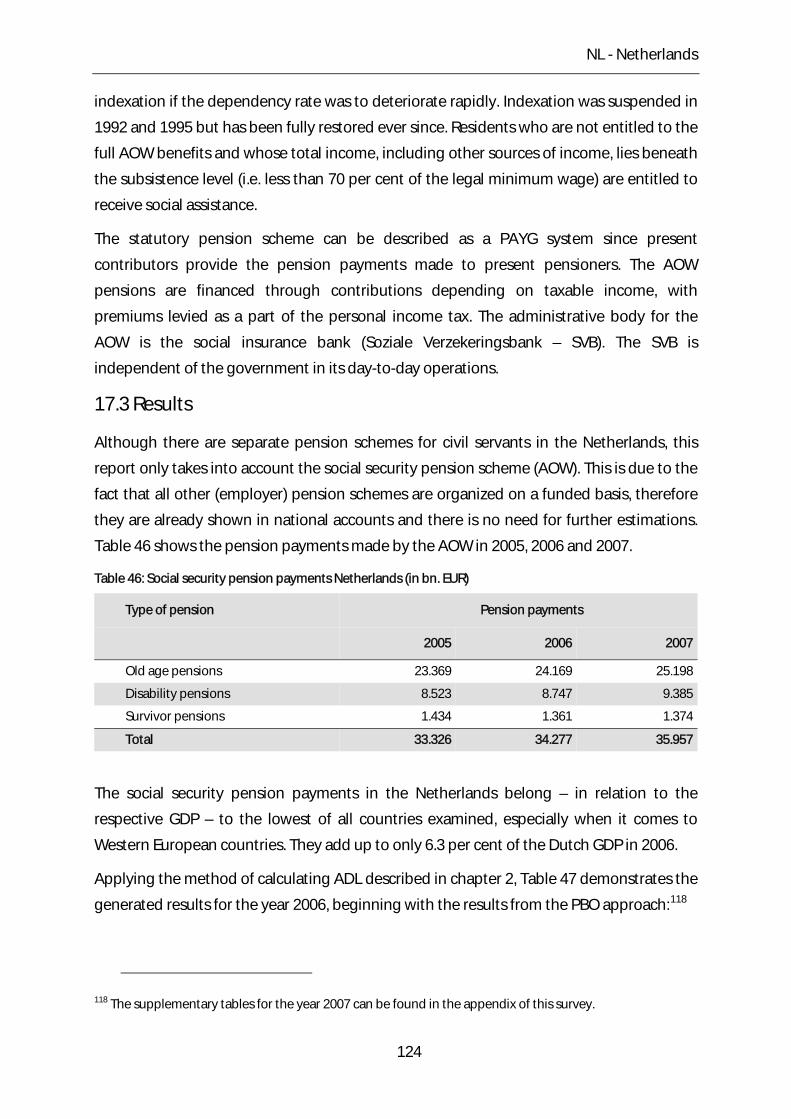
NL - Netherlands
indexation if the dependency rate was to deteriorate rapidly. Indexation was suspended in
1992 and 1995 but has been fully restored ever since. Residents who are not entitled to the
full AOW benefits and whose total income, including other sources of income, lies beneath
the subsistence level (i.e. less than 70 per cent of the legal minimum wage) are entitled to
receive social assistance.
The statutory pension scheme can be described as a PAYG system since present
contributors provide the pension payments made to present pensioners. The AOW
pensions are financed through contributions depending on taxable income, with
premiums levied as a part of the personal income tax. The administrative body for the
AOW is the social insurance bank (Soziale Verzekeringsbank – SVB). The SVB is
independent of the government in its day-to-day operations.
17.3 Results
Although there are separate pension schemes for civil servants in the Netherlands, this
report only takes into account the social security pension scheme (AOW). This is due to the
fact that all other (employer) pension schemes are organized on a funded basis, therefore
they are already shown in national accounts and there is no need for further estimations.
Table 46 shows the pension payments made by the AOW in 2005, 2006 and 2007.
Table 46: Social security pension payments Netherlands (in bn. EUR)
Type of pension Pension payments
2005 2006 2007
Old age pensions 23.369 24.169 25.198
Disability pensions 8.523 8.747 9.385
Survivor pensions 1.434 1.361 1.374
Total 33.326 34.277 35.957
The social security pension payments in the Netherlands belong – in relation to the
respective GDP – to the lowest of all countries examined, especially when it comes to
Western European countries. They add up to only 6.3 per cent of the Dutch GDP in 2006.
Applying the method of calculating ADL described in chapter 2, Table 47 demonstrates the
generated results for the year 2006, beginning with the results from the PBO approach:118
118 The supplementary tables for the year 2007 can be found in the appendix of this survey.
124
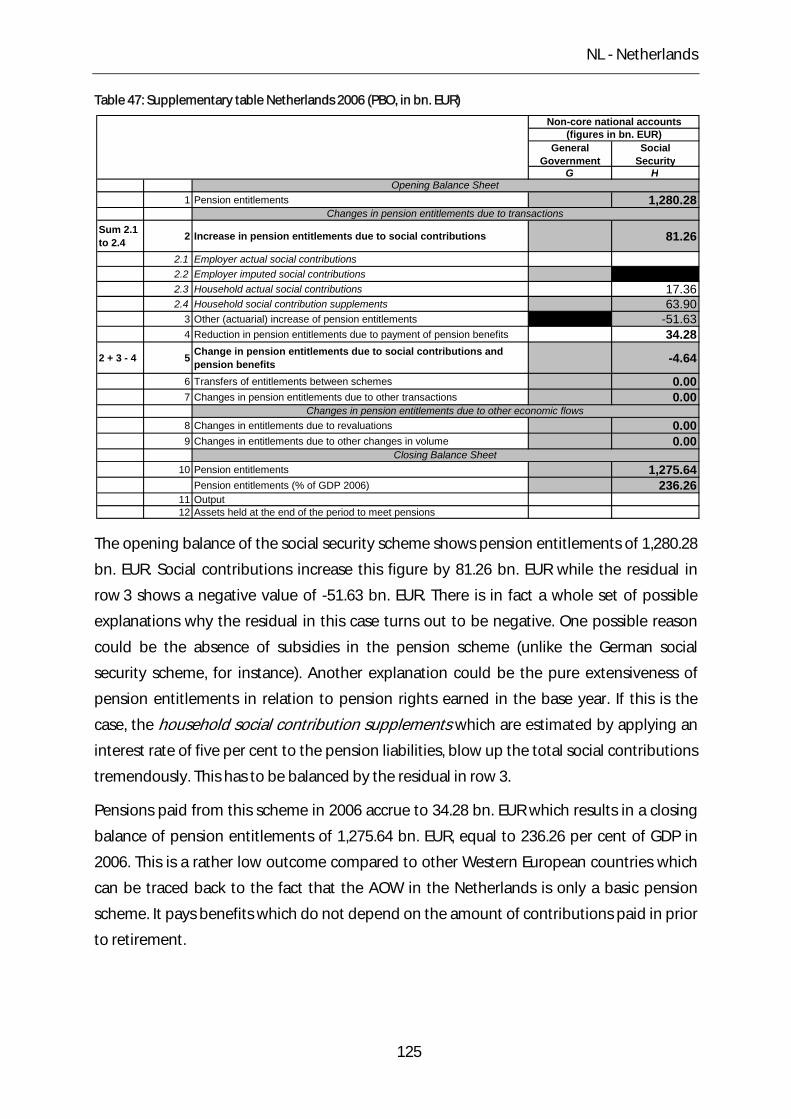
NL - Netherlands
Table 47: Supplementary table Netherlands 2006 (PBO, in bn. EUR)
General Government
Social Security
G H
1 Pension entitlements 1,280.28
Sum 2.1 to 2.4 2 Increase in pension entitlements due to social contributions 81.26
2.1 Employer actual social contributions2.2 Employer imputed social contributions2.3 Household actual social contributions 17.362.4 Household social contribution supplements 63.90
3 Other (actuarial) increase of pension entitlements -51.634 Reduction in pension entitlements due to payment of pension benefits 34.28
2 + 3 - 4 5 Change in pension entitlements due to social contributions and pension benefits -4.64
6 Transfers of entitlements between schemes 0.007 Changes in pension entitlements due to other transactions 0.00
8 Changes in entitlements due to revaluations 0.009 Changes in entitlements due to other changes in volume 0.00
10 Pension entitlements 1,275.64Pension entitlements (% of GDP 2006) 236.26
11 Output12 Assets held at the end of the period to meet pensions
Closing Balance Sheet
Non-core national accounts(figures in bn. EUR)
Changes in pension entitlements due to transactions
Changes in pension entitlements due to other economic flows
Opening Balance Sheet
The opening balance of the social security scheme shows pension entitlements of 1,280.28
bn. EUR. Social contributions increase this figure by 81.26 bn. EUR while the residual in
row 3 shows a negative value of -51.63 bn. EUR. There is in fact a whole set of possible
explanations why the residual in this case turns out to be negative. One possible reason
could be the absence of subsidies in the pension scheme (unlike the German social
security scheme, for instance). Another explanation could be the pure extensiveness of
pension entitlements in relation to pension rights earned in the base year. If this is the
case, the household social contribution supplements which are estimated by applying an
interest rate of five per cent to the pension liabilities, blow up the total social contributions
tremendously. This has to be balanced by the residual in row 3.
Pensions paid from this scheme in 2006 accrue to 34.28 bn. EUR which results in a closing
balance of pension entitlements of 1,275.64 bn. EUR, equal to 236.26 per cent of GDP in
2006. This is a rather low outcome compared to other Western European countries which
can be traced back to the fact that the AOW in the Netherlands is only a basic pension
scheme. It pays benefits which do not depend on the amount of contributions paid in prior
to retirement.
125
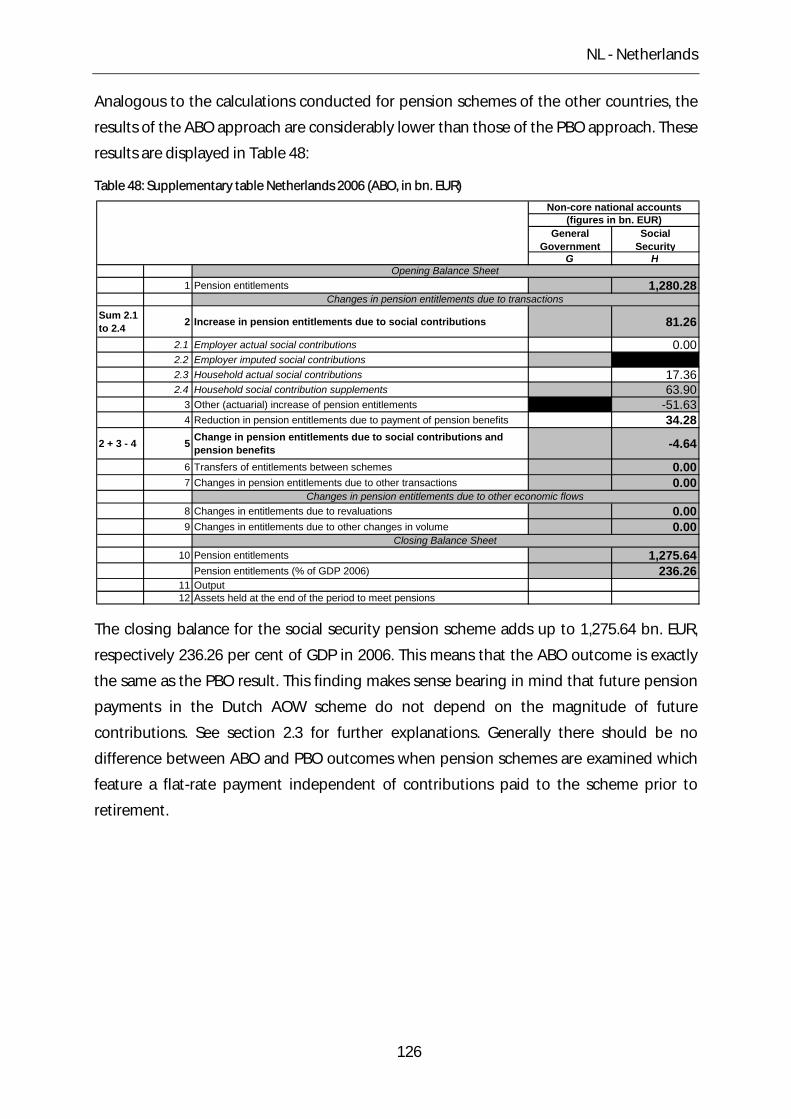
NL - Netherlands
Analogous to the calculations conducted for pension schemes of the other countries, the
results of the ABO approach are considerably lower than those of the PBO approach. These
results are displayed in Table 48:
Table 48: Supplementary table Netherlands 2006 (ABO, in bn. EUR)
General Government
Social Security
G H
1 Pension entitlements 1,280.28
Sum 2.1 to 2.4 2 Increase in pension entitlements due to social contributions 81.26
2.1 Employer actual social contributions 0.002.2 Employer imputed social contributions2.3 Household actual social contributions 17.362.4 Household social contribution supplements 63.90
3 Other (actuarial) increase of pension entitlements -51.634 Reduction in pension entitlements due to payment of pension benefits 34.28
2 + 3 - 4 5 Change in pension entitlements due to social contributions and pension benefits -4.64
6 Transfers of entitlements between schemes 0.007 Changes in pension entitlements due to other transactions 0.00
8 Changes in entitlements due to revaluations 0.009 Changes in entitlements due to other changes in volume 0.00
10 Pension entitlements 1,275.64Pension entitlements (% of GDP 2006) 236.26
11 Output12 Assets held at the end of the period to meet pensions
Closing Balance Sheet
Non-core national accounts(figures in bn. EUR)
Changes in pension entitlements due to transactions
Changes in pension entitlements due to other economic flows
Opening Balance Sheet
The closing balance for the social security pension scheme adds up to 1,275.64 bn. EUR,
respectively 236.26 per cent of GDP in 2006. This means that the ABO outcome is exactly
the same as the PBO result. This finding makes sense bearing in mind that future pension
payments in the Dutch AOW scheme do not depend on the magnitude of future
contributions. See section 2.3 for further explanations. Generally there should be no
difference between ABO and PBO outcomes when pension schemes are examined which
feature a flat-rate payment independent of contributions paid to the scheme prior to
retirement.
126
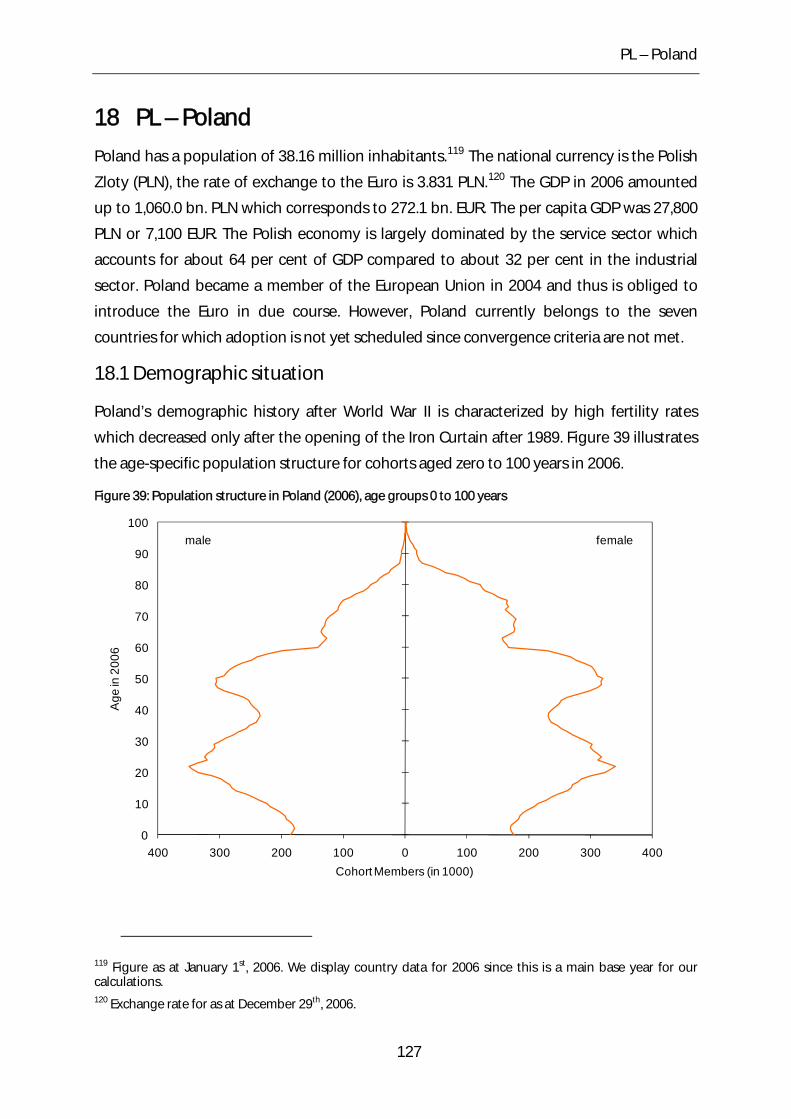
PL – Poland
18 PL – Poland
Poland has a population of 38.16 million inhabitants.119 The national currency is the Polish
Zloty (PLN), the rate of exchange to the Euro is 3.831 PLN.120 The GDP in 2006 amounted
up to 1,060.0 bn. PLN which corresponds to 272.1 bn. EUR. The per capita GDP was 27,800
PLN or 7,100 EUR. The Polish economy is largely dominated by the service sector which
accounts for about 64 per cent of GDP compared to about 32 per cent in the industrial
sector. Poland became a member of the European Union in 2004 and thus is obliged to
introduce the Euro in due course. However, Poland currently belongs to the seven
countries for which adoption is not yet scheduled since convergence criteria are not met.
18.1 Demographic situation
Poland’s demographic history after World War II is characterized by high fertility rates
which decreased only after the opening of the Iron Curtain after 1989. Figure 39 illustrates
the age-specific population structure for cohorts aged zero to 100 years in 2006.
Figure 39: Population structure in Poland (2006), age groups 0 to 100 years
0
10
20
30
40
50
60
70
80
90
100
400 300 200 100 0 100 200 300 400
Age
in 2
006
Cohort Members (in 1000)
femalemale
119 Figure as at January 1st, 2006. We display country data for 2006 since this is a main base year for our calculations. 120 Exchange rate for as at December 29th, 2006.
127
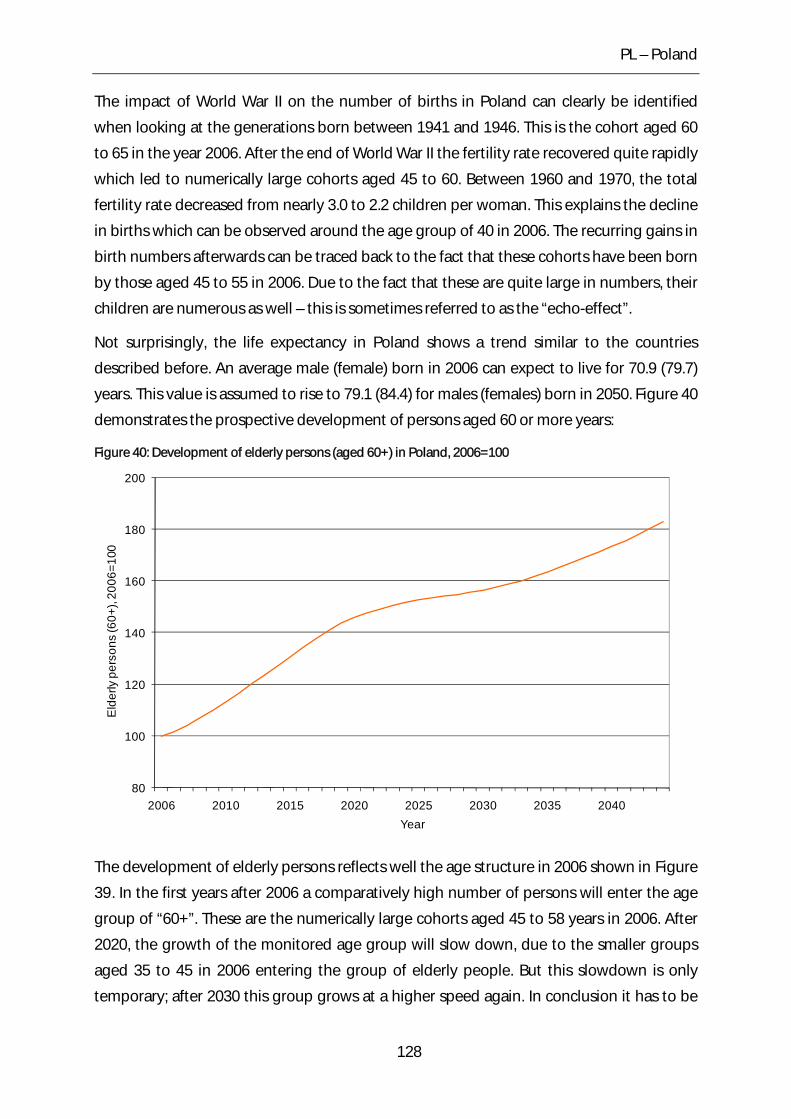
PL – Poland
The impact of World War II on the number of births in Poland can clearly be identified
when looking at the generations born between 1941 and 1946. This is the cohort aged 60
to 65 in the year 2006. After the end of World War II the fertility rate recovered quite rapidly
which led to numerically large cohorts aged 45 to 60. Between 1960 and 1970, the total
fertility rate decreased from nearly 3.0 to 2.2 children per woman. This explains the decline
in births which can be observed around the age group of 40 in 2006. The recurring gains in
birth numbers afterwards can be traced back to the fact that these cohorts have been born
by those aged 45 to 55 in 2006. Due to the fact that these are quite large in numbers, their
children are numerous as well – this is sometimes referred to as the “echo-effect”.
Not surprisingly, the life expectancy in Poland shows a trend similar to the countries
described before. An average male (female) born in 2006 can expect to live for 70.9 (79.7)
years. This value is assumed to rise to 79.1 (84.4) for males (females) born in 2050. Figure 40
demonstrates the prospective development of persons aged 60 or more years:
Figure 40: Development of elderly persons (aged 60+) in Poland, 2006=100
80
100
120
140
160
180
200
2006 2010 2015 2020 2025 2030 2035 2040
Eld
erly
per
sons
(60+
), 20
06=1
00
Year
The development of elderly persons reflects well the age structure in 2006 shown in XFigure
39X. In the first years after 2006 a comparatively high number of persons will enter the age
group of “60+”. These are the numerically large cohorts aged 45 to 58 years in 2006. After
2020, the growth of the monitored age group will slow down, due to the smaller groups
aged 35 to 45 in 2006 entering the group of elderly people. But this slowdown is only
temporary; after 2030 this group grows at a higher speed again. In conclusion it has to be
128
PL – Poland
emphasized that between 2006 and 2045 Poland features one of the biggest numerical
increases in elderly persons, compared to the other countries examined in this report.
18.2 General characteristics of the pension system
The Polish system is split into three different parts: There are institutionally distinguished
schemes for private sector employees, farmers and a number of civil servants groups which
are all financed at least in parts out of the official budget. The private sector scheme is the
only one relying significantly on contributions, a defined contribution scheme by now.
The private sector scheme
At the moment the Polish pension system is in a transition phase after the reform of 1999
which changed the general pension system from a defined benefit scheme to a non-
financial defined contribution (NDC) scheme. The pure new scheme under which all
workers born after 1968 will retire is designed as follows: The contribution is defined at
19.52 per cent of gross earnings with payment equally split between employers and
employees. 12.22 per cent are credited to individual accounts at the central insurance
institution (ZUS) with a rate of return equal to the wage sum growth of that year after
controlling for inflation, and the remaining 7.3 per cent are invested into private funds with
an individual and variable rate of return. As contributions to this system only started in
1999 there was an account value set for all people employed at that time which is to
represent their contributions up to 1998. After retirement, account values are converted
into an annuity which is based on the average unisex life expectancy of the age group at
the age of retirement. Retirement age is 65 years for men and 60 years for women with no
institutional early-retirement plans. Due to the system change, workers born before 1969
do not have the financial pillar in their accounts so that their total contribution is indexed
at real wage growth. People born before 1949 receive their pension still from a defined
benefit scheme, which grants them 24 per cent flat of the average wage. This amount is
incremented by a proportion of an average out of the best ten years in a row chosen from
the last 20 years of working. The proportion is 1.3 per cent per year of contribution. If
pension benefits fall below some defined threshold there is a supplement paid out of tax
accounts. In general, existing pensions are indexed with inflation rate plus 20 per cent of
real wage growth.121
121 For a detailed description of the Polish pension system see European Commission (2007), p.270 et sqq.
129
PL – Poland
Pension system for farmers
Pensions for farmers are paid mainly out of the state budget; the contribution ratio is only
about ten per cent. Farmers pay contributions equal to 30 per cent of the minimum old
age pension and are eligible to the ages of 60/65 years (women/men), provided they have
paid contributions for at least 25 years. The indexation of pensions corresponds to the one
used for the general private sector scheme.
Civil servants’ scheme
The civil servants’ scheme is not financed by contributions at all. A pension can be claimed
after a minimum service time of 15 years. Pension benefits are calculated as a proportion of
the final salary received with the replacement rate being 2.6 percentage points per year of
service and a maximum replacement rate of 75 per cent. Similar to the pension schemes
described above, the indexation follows the inflation plus 20 per cent real salary growth.
18.3 Recent reforms of the pension system
In 1999 the whole Polish social security system and with it the pension system underwent
a fundamental reform. Before 1999 there was a monolithic contribution rate of 36.59 per
cent to all social security schemes which did not take into account the burdens of the
different institutions. The system was defined benefit, granting workers a percentage of
the average of their best three years in a row as a pension. In contrast to the new system
there were possibilities of retirement as early as at 55 years of age in some cases. Due to
perceived immediate necessity of reform there was practically no phasing in. Only people
born before 1949 are exempt from the new rules since they had already acquired
considerable claims in the old system.122
18.4 Results
Analogous to what was conducted in the previous countries’ estimates, the aggregated
pension payments for the years 2005, 2006 and 2007 provide a starting point for our
calculations. Pension benefits from the social security pension schemes are shown in
Table 49.
122 A detailed description of the NDC system in Poland can be found in Chlón-Dominczak and Góra (2006).
130
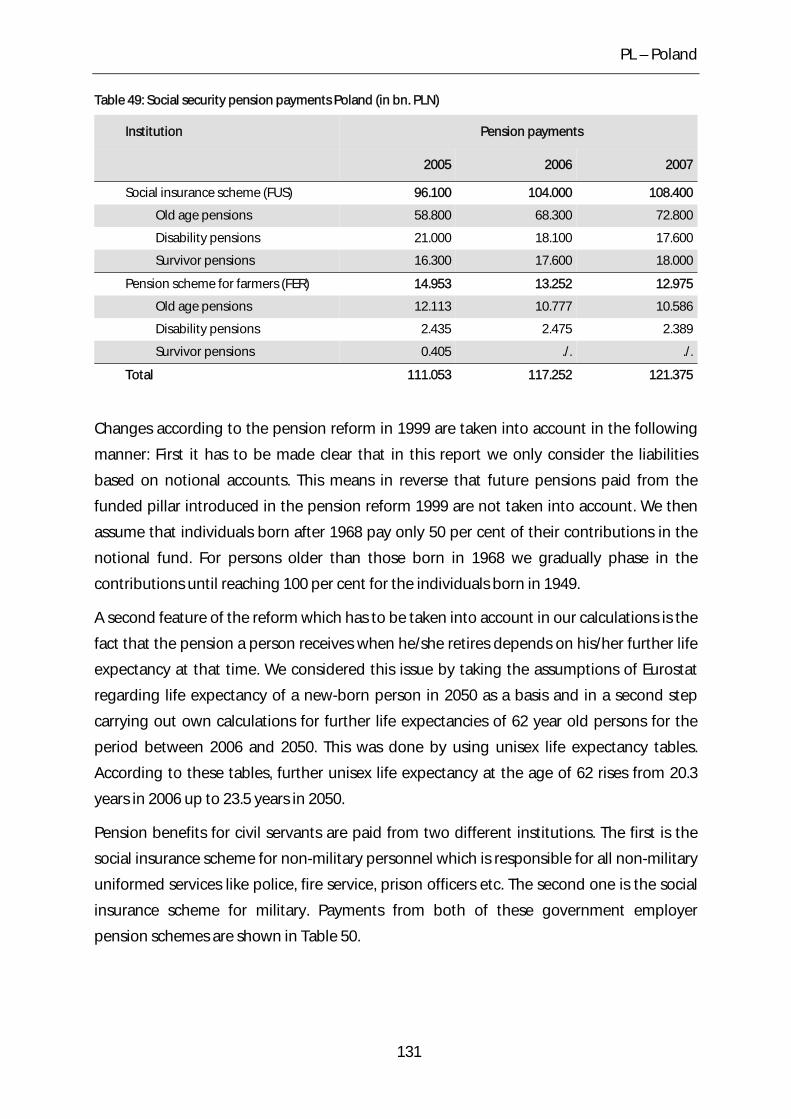
PL – Poland
Table 49: Social security pension payments Poland (in bn. PLN)
Institution Pension payments
2005 2006 2007
Social insurance scheme (FUS) 96.100 104.000 108.400
Old age pensions 58.800 68.300 72.800
Disability pensions 21.000 18.100 17.600
Survivor pensions 16.300 17.600 18.000
Pension scheme for farmers (FER) 14.953 13.252 12.975
Old age pensions 12.113 10.777 10.586
Disability pensions 2.435 2.475 2.389
Survivor pensions 0.405 ./. ./.
Total 111.053 117.252 121.375
Changes according to the pension reform in 1999 are taken into account in the following
manner: First it has to be made clear that in this report we only consider the liabilities
based on notional accounts. This means in reverse that future pensions paid from the
funded pillar introduced in the pension reform 1999 are not taken into account. We then
assume that individuals born after 1968 pay only 50 per cent of their contributions in the
notional fund. For persons older than those born in 1968 we gradually phase in the
contributions until reaching 100 per cent for the individuals born in 1949.
A second feature of the reform which has to be taken into account in our calculations is the
fact that the pension a person receives when he/she retires depends on his/her further life
expectancy at that time. We considered this issue by taking the assumptions of Eurostat
regarding life expectancy of a new-born person in 2050 as a basis and in a second step
carrying out own calculations for further life expectancies of 62 year old persons for the
period between 2006 and 2050. This was done by using unisex life expectancy tables.
According to these tables, further unisex life expectancy at the age of 62 rises from 20.3
years in 2006 up to 23.5 years in 2050.
Pension benefits for civil servants are paid from two different institutions. The first is the
social insurance scheme for non-military personnel which is responsible for all non-military
uniformed services like police, fire service, prison officers etc. The second one is the social
insurance scheme for military. Payments from both of these government employer
pension schemes are shown in Table 50.
131
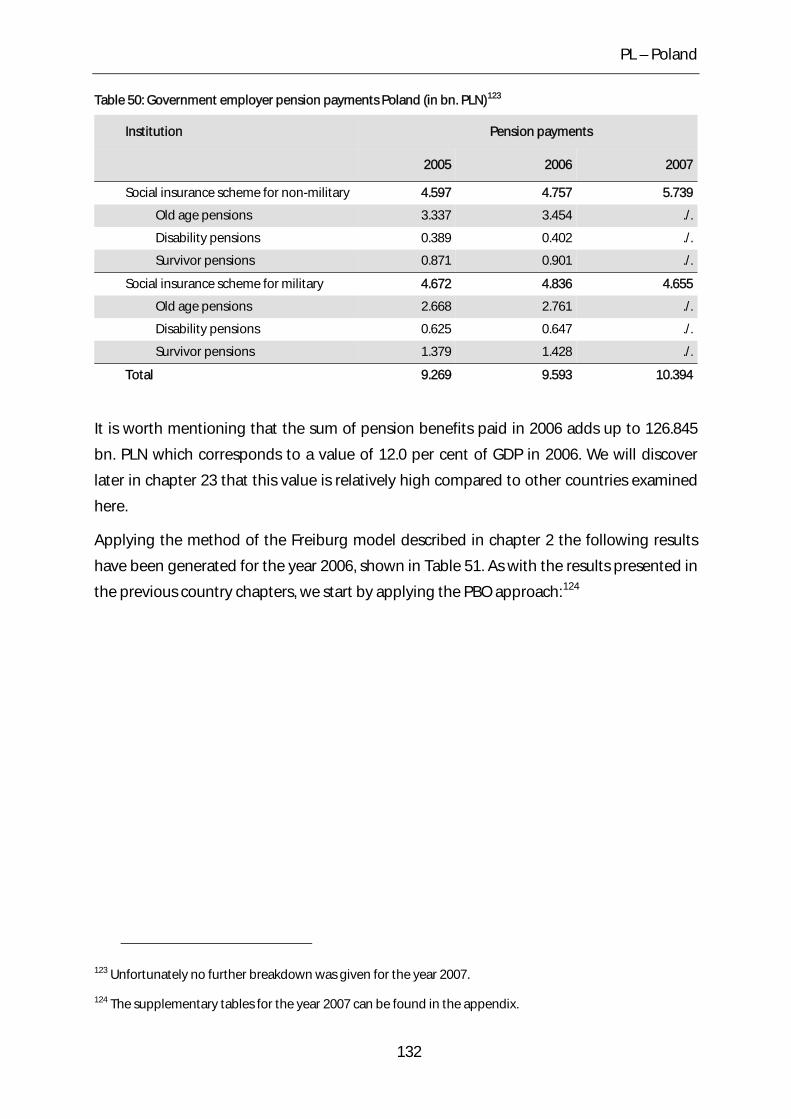
PL – Poland
Table 50: Government employer pension payments Poland (in bn. PLN)123
Institution Pension payments
2005 2006 2007
Social insurance scheme for non-military 4.597 4.757 5.739
Old age pensions 3.337 3.454 ./.
Disability pensions 0.389 0.402 ./.
Survivor pensions 0.871 0.901 ./.
Social insurance scheme for military 4.672 4.836 4.655
Old age pensions 2.668 2.761 ./.
Disability pensions 0.625 0.647 ./.
Survivor pensions 1.379 1.428 ./.
Total 9.269 9.593 10.394
It is worth mentioning that the sum of pension benefits paid in 2006 adds up to 126.845
bn. PLN which corresponds to a value of 12.0 per cent of GDP in 2006. We will discover
later in chapter 23 that this value is relatively high compared to other countries examined
here.
Applying the method of the Freiburg model described in chapter 2 the following results
have been generated for the year 2006, shown in Table 51. As with the results presented in
the previous country chapters, we start by applying the PBO approach:124
123 Unfortunately no further breakdown was given for the year 2007.
124 The supplementary tables for the year 2007 can be found in the appendix.
132
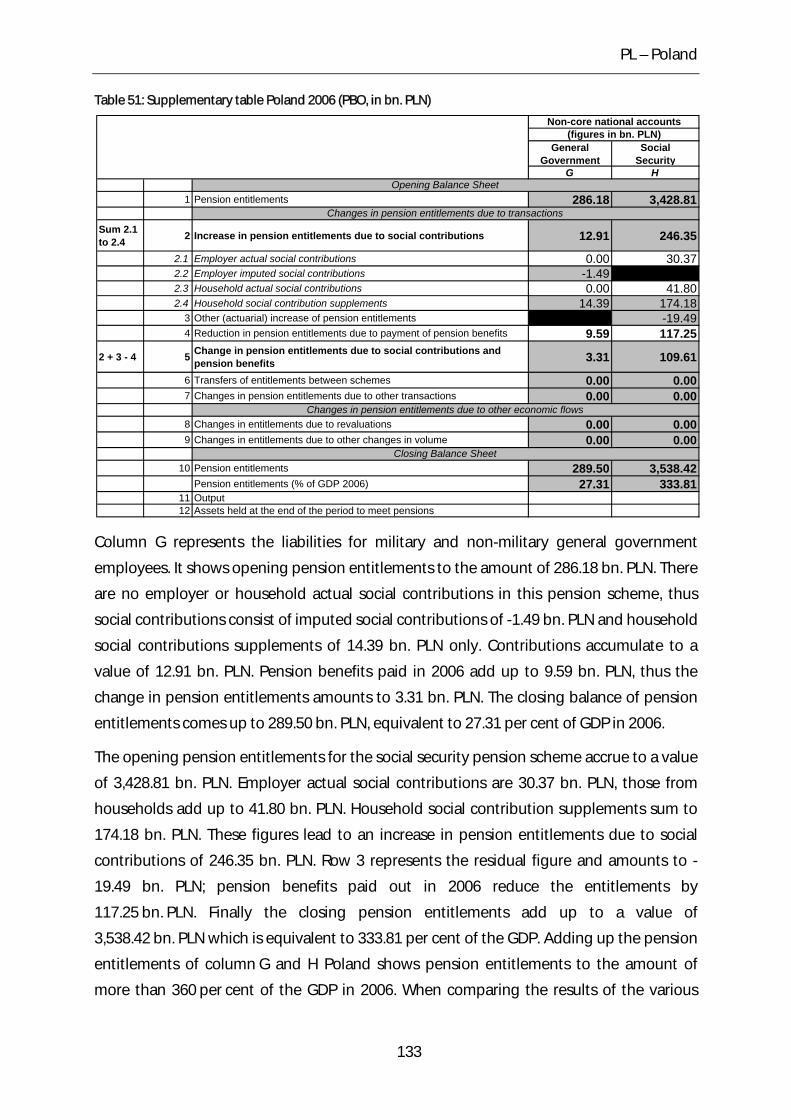
PL – Poland
Table 51: Supplementary table Poland 2006 (PBO, in bn. PLN)
General Government
Social Security
G H
1 Pension entitlements 286.18 3,428.81
Sum 2.1 to 2.4 2 Increase in pension entitlements due to social contributions 12.91 246.35
2.1 Employer actual social contributions 0.00 30.372.2 Employer imputed social contributions -1.492.3 Household actual social contributions 0.00 41.802.4 Household social contribution supplements 14.39 174.18
3 Other (actuarial) increase of pension entitlements -19.494 Reduction in pension entitlements due to payment of pension benefits 9.59 117.25
2 + 3 - 4 5 Change in pension entitlements due to social contributions and pension benefits 3.31 109.61
6 Transfers of entitlements between schemes 0.00 0.007 Changes in pension entitlements due to other transactions 0.00 0.00
8 Changes in entitlements due to revaluations 0.00 0.009 Changes in entitlements due to other changes in volume 0.00 0.00
10 Pension entitlements 289.50 3,538.42Pension entitlements (% of GDP 2006) 27.31 333.81
11 Output12 Assets held at the end of the period to meet pensions
Closing Balance Sheet
Non-core national accounts(figures in bn. PLN)
Changes in pension entitlements due to transactions
Changes in pension entitlements due to other economic flows
Opening Balance Sheet
Column G represents the liabilities for military and non-military general government
employees. It shows opening pension entitlements to the amount of 286.18 bn. PLN. There
are no employer or household actual social contributions in this pension scheme, thus
social contributions consist of imputed social contributions of -1.49 bn. PLN and household
social contributions supplements of 14.39 bn. PLN only. Contributions accumulate to a
value of 12.91 bn. PLN. Pension benefits paid in 2006 add up to 9.59 bn. PLN, thus the
change in pension entitlements amounts to 3.31 bn. PLN. The closing balance of pension
entitlements comes up to 289.50 bn. PLN, equivalent to 27.31 per cent of GDP in 2006.
The opening pension entitlements for the social security pension scheme accrue to a value
of 3,428.81 bn. PLN. Employer actual social contributions are 30.37 bn. PLN, those from
households add up to 41.80 bn. PLN. Household social contribution supplements sum to
174.18 bn. PLN. These figures lead to an increase in pension entitlements due to social
contributions of 246.35 bn. PLN. Row 3 represents the residual figure and amounts to -
19.49 bn. PLN; pension benefits paid out in 2006 reduce the entitlements by
117.25 bn. PLN. Finally the closing pension entitlements add up to a value of
3,538.42 bn. PLN which is equivalent to 333.81 per cent of the GDP. Adding up the pension
entitlements of column G and H Poland shows pension entitlements to the amount of
more than 360 per cent of the GDP in 2006. When comparing the results of the various
133
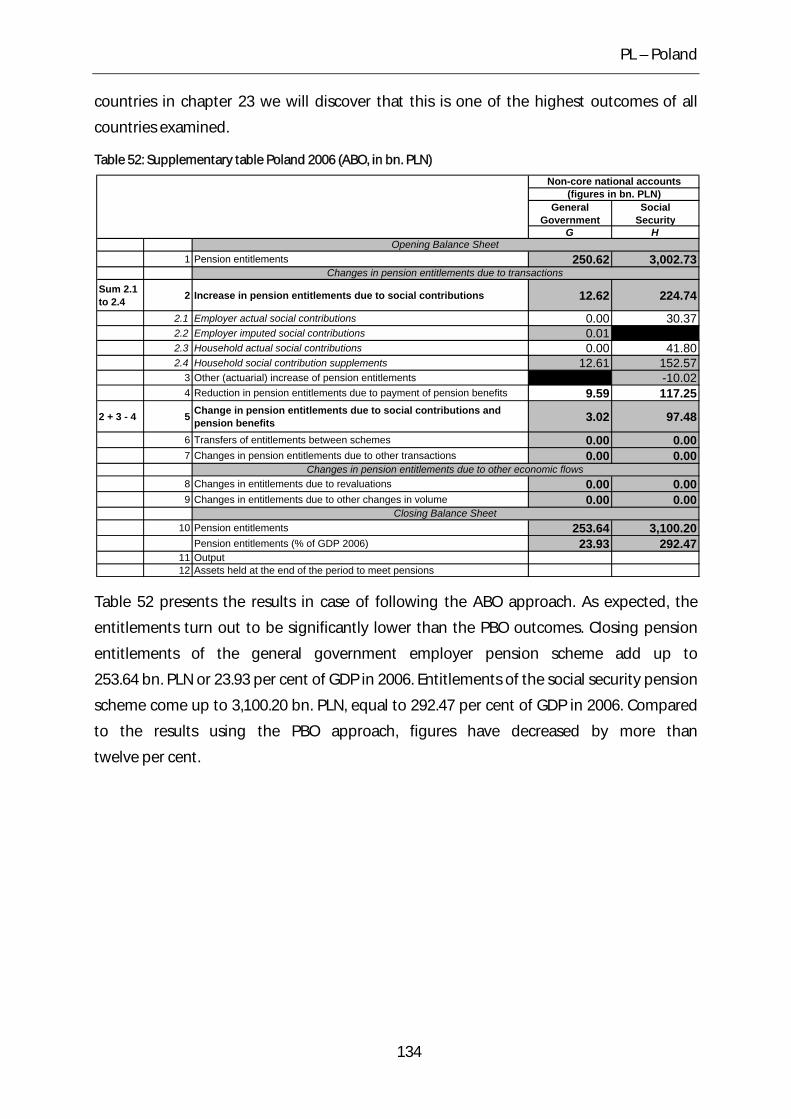
PL – Poland
countries in chapter 23 we will discover that this is one of the highest outcomes of all
countries examined.
Table 52: Supplementary table Poland 2006 (ABO, in bn. PLN)
General Government
Social Security
G H
1 Pension entitlements 250.62 3,002.73
Sum 2.1 to 2.4 2 Increase in pension entitlements due to social contributions 12.62 224.74
2.1 Employer actual social contributions 0.00 30.372.2 Employer imputed social contributions 0.012.3 Household actual social contributions 0.00 41.802.4 Household social contribution supplements 12.61 152.57
3 Other (actuarial) increase of pension entitlements -10.024 Reduction in pension entitlements due to payment of pension benefits 9.59 117.25
2 + 3 - 4 5 Change in pension entitlements due to social contributions and pension benefits 3.02 97.48
6 Transfers of entitlements between schemes 0.00 0.007 Changes in pension entitlements due to other transactions 0.00 0.00
8 Changes in entitlements due to revaluations 0.00 0.009 Changes in entitlements due to other changes in volume 0.00 0.00
10 Pension entitlements 253.64 3,100.20Pension entitlements (% of GDP 2006) 23.93 292.47
11 Output12 Assets held at the end of the period to meet pensions
Closing Balance Sheet
Non-core national accounts(figures in bn. PLN)
Changes in pension entitlements due to transactions
Changes in pension entitlements due to other economic flows
Opening Balance Sheet
Table 52 presents the results in case of following the ABO approach. As expected, the
entitlements turn out to be significantly lower than the PBO outcomes. Closing pension
entitlements of the general government employer pension scheme add up to
253.64 bn. PLN or 23.93 per cent of GDP in 2006. Entitlements of the social security pension
scheme come up to 3,100.20 bn. PLN, equal to 292.47 per cent of GDP in 2006. Compared
to the results using the PBO approach, figures have decreased by more than
twelve per cent.
134
PT – Portugal
19 PT – Portugal125
Portugal has a population of 10.57 million inhabitants.126 In 1986, it joined the European
Community alongside Spain and was in the group of the first eleven countries to adopt the
Euro in 1999. With the economic integration into the EU the Portuguese economy has
been steadily growing especially in the service industry. In 2006 its GDP amounted to
155.5 bn. EUR, corresponding to about 14,700 EUR per capita.
19.1 Demographic situation
Demography reflects to a huge degree the history of the respective country. Going
60 years back Portugal unlike most central European countries had a neutral position
during the Second World War – like its Iberian neighbour Spain. This fact can still be
recognized today looking at Figure 41. As one can see the cohort aged 60 years and older
is relatively numerously represented in Portugal. Despite the large number of elderly
people the Portuguese demography cannot be compared with the classical pyramid but
rather with the shape of a tree. Its narrow trunk is represented by the cohorts of the zero to
20 year olds. This form can be traced back to the decline of fertility rates beginning at the
end of the 1970s. Stated in numbers, the total fertility rate in Portugal sank from a level of
around 2.8 in 1970 per woman to 2.2 in 1980 and declining further until today with a level
of 1.35 (2006). The impact of international migration on the population dynamics as well as
on the labour force resources is not negligible, particularly in countries like Portugal where
the migration is a major determinant of demographic change. But nevertheless, since we
calculate entitlements of the present Portuguese population or more precisely of the
present Portuguese contributors, the level of future migration has no implication for our
results.
125 We would like to thank Maria Teresa Ferreira from Statistics Portugal for valuable comments and comprehensive updates of this chapter. 126 Figure as at January 1st, 2006. We display country data for 2006 since this is a main base year for our calculations.
135
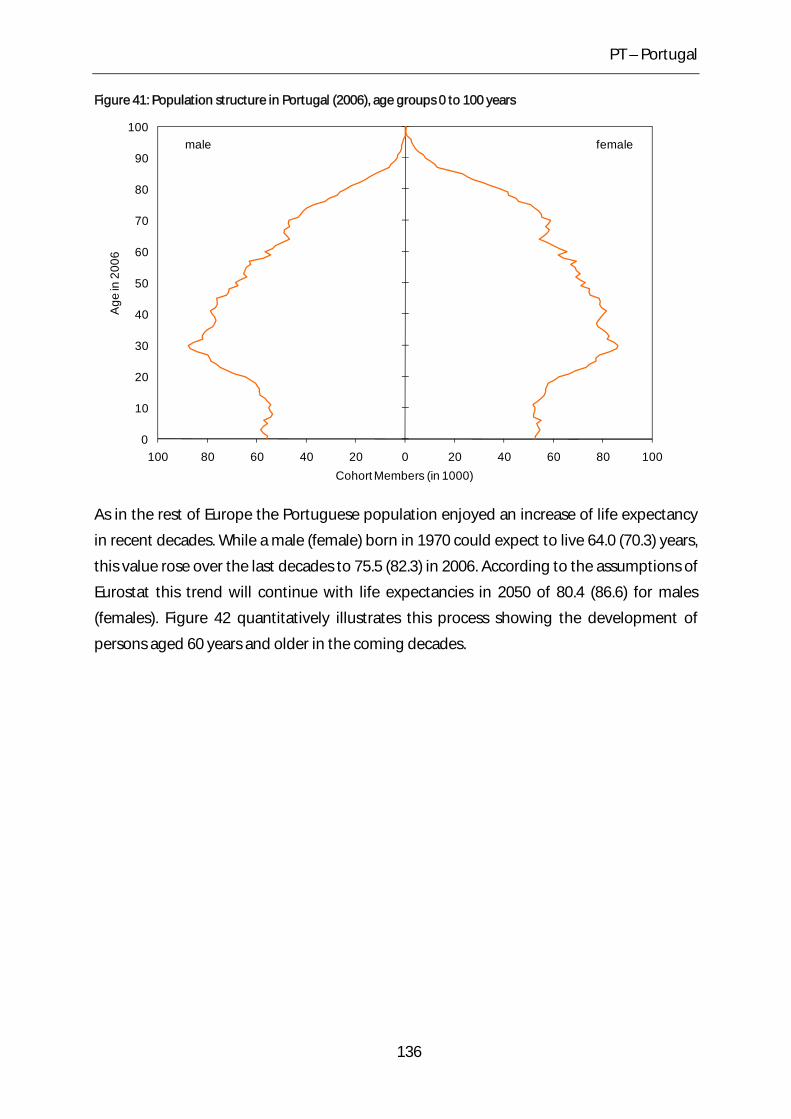
PT – Portugal
Figure 41: Population structure in Portugal (2006), age groups 0 to 100 years
0
10
20
30
40
50
60
70
80
90
100
100 80 60 40 20 0 20 40 60 80 100
Age
in 2
006
Cohort Members (in 1000)
femalemale
As in the rest of Europe the Portuguese population enjoyed an increase of life expectancy
in recent decades. While a male (female) born in 1970 could expect to live 64.0 (70.3) years,
this value rose over the last decades to 75.5 (82.3) in 2006. According to the assumptions of
Eurostat this trend will continue with life expectancies in 2050 of 80.4 (86.6) for males
(females). Figure 42 quantitatively illustrates this process showing the development of
persons aged 60 years and older in the coming decades.
136
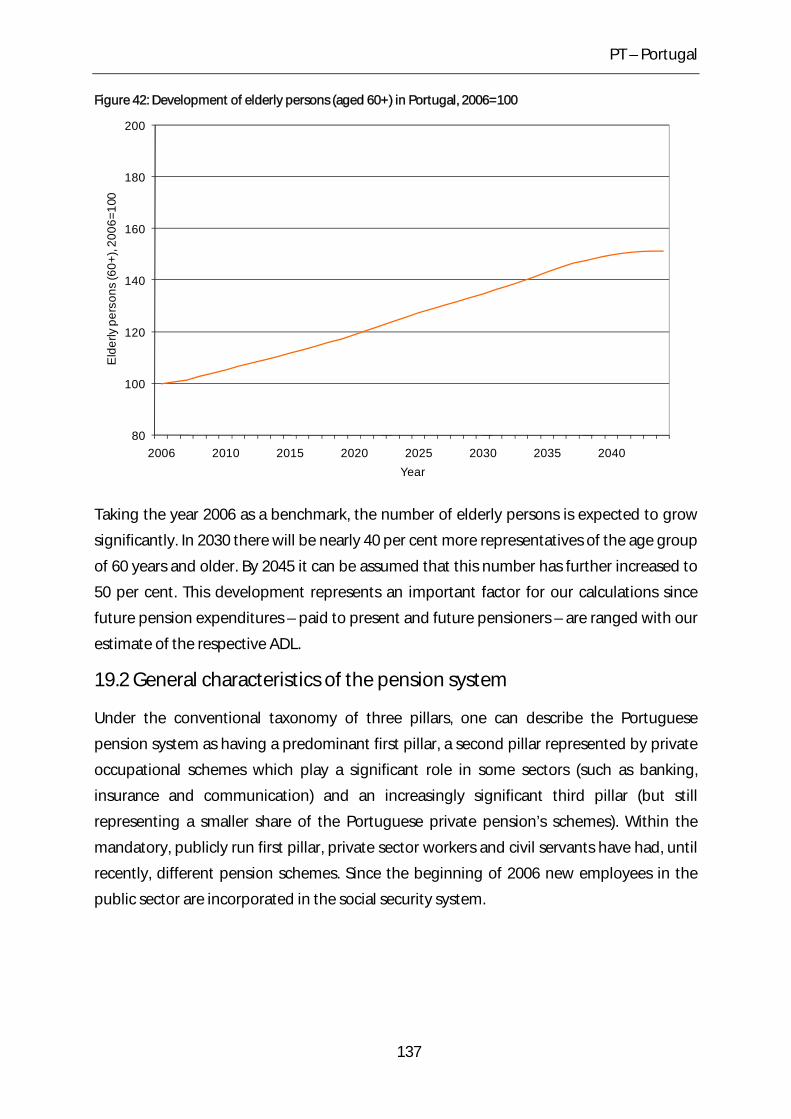
PT – Portugal
Figure 42: Development of elderly persons (aged 60+) in Portugal, 2006=100
80
100
120
140
160
180
200
2006 2010 2015 2020 2025 2030 2035 2040
Eld
erly
per
sons
(60+
), 20
06=1
00
Year
Taking the year 2006 as a benchmark, the number of elderly persons is expected to grow
significantly. In 2030 there will be nearly 40 per cent more representatives of the age group
of 60 years and older. By 2045 it can be assumed that this number has further increased to
50 per cent. This development represents an important factor for our calculations since
future pension expenditures – paid to present and future pensioners – are ranged with our
estimate of the respective ADL.
19.2 General characteristics of the pension system
Under the conventional taxonomy of three pillars, one can describe the Portuguese
pension system as having a predominant first pillar, a second pillar represented by private
occupational schemes which play a significant role in some sectors (such as banking,
insurance and communication) and an increasingly significant third pillar (but still
representing a smaller share of the Portuguese private pension’s schemes). Within the
mandatory, publicly run first pillar, private sector workers and civil servants have had, until
recently, different pension schemes. Since the beginning of 2006 new employees in the
public sector are incorporated in the social security system.
137
PT – Portugal
The social security system comprises a general regime (the so called “Regime Geral” which
applies to nearly all workers, including the self-employed), 127 a non-contributory regime
and a special regime for agricultural workers. The latter is closed to new contributors since
1986 and is expected to be phased out by 2045.
The general regime can be characterized as a defined benefit system working on a PAYG
financing basis. It entitles old age pensioners with at least 15 years of earnings registration
to an earnings-related pension.
The non-contributory regime, apart from attributing social pensions to those who have
never contributed to the social security system or are not eligible for a earnings-related
pension (because they have less than 15 years of earnings registration), also works on a
complementary basis of the contributive regime: every year a minimum threshold is set
according to the length of workers contributory career and if the pension benefit formula
falls under that threshold, the non-contributory regime covers the rest.
19.3 Recent reforms of the pension system
As most European countries Portugal is facing the challenges of an ageing society which
put substantial pressure on the Portuguese pension system – especially from a long term
perspective. Therefore the Portuguese government reacted with a number of reforms in
the last decade. Major reforms were taken in 2002 and 2006.
In 2002 the government introduced a new benefit formula for old age pensions in order to
take into account individual lifetime contributions. Under the old calculation formula the
best ten years out of the last 15 years were considered and an accrual rate of two per cent
was applied irrespective of the length of the workers career. Under the new formula
lifetime wages (up to a maximum of 40 years) are accounted for and accrual rates (ranging
from two per cent and 2.3 per cent) are set according to the workers’ wages and the length
of their contributory career. These new rules will not only lead to a stronger link between
contributions and benefits but also to a reduction of future pensions.
Additionally, in 2006 a tripartite agreement on the reform of social security was signed,
enabling the introduction of new measures and the reinforcement of the measures already
taken in 2002. In fact, due to the long transition rules established within the 2002 reform
the expected impact upon the social security system would be very slow. In that sense, one
of the measures taken within the 2006 reform was the introduction of new rules enabling a
127 There are special regimes for miners, longshoremen, fishermen, merchant seamen, civil aviation workers, air traffic controllers and dancers. Special regimes are gradually being unified within the general regime.
138
PT – Portugal
faster transition to the new pension benefit formula. Another significant measure was the
establishment of a new rule-of-law regarding the annual increases of pensions,
abandoning the indexation to the national minimum wage in favor of price indexation.
The new indexation of pensions is now linked to CPI as well as to the real GDP growth.
Furthermore, the indexation of pensions differs depending on the amount of the
pension.128 Another significant step taken in 2006 was the introduction of a sustainability
factor which adjusts pensions (from 2008 onwards) in accordance with changes in the life
expectancy. Other measures introduced within the 2006 reform consisted in: reinforcing
the mechanisms for the protection of long contributory careers; introducing a ceiling to
higher pensions; and promoting active ageing (giving bonuses to those who decide to
extend their working lives beyond the legal retirement age and increasing penalties for
early retirements).129
The 2006 tripartite agreement on the reform of social security also determines that the
above mentioned measures – namely, the sustainability factor, the indexing rules, the
incentives to prolong the working life and the penalties for early retirement – should be
adopted in a framework of convergence between different social protection schemes.
Regarding the convergence between the public employee pension system, the so-called
Caixa Geral de Aposentações (CGA) and the social security pension system, a gradual
increase (until 2015) of the statutory retirement age for civil servants from 60 to 65 is in
force.130 Furthermore, within this reform the pension benefit calculation has been
changed. Similar to the general scheme the average wage of the entire career – for those
appointed after 1993 – will be accounted for in the pension calculation. For civil servants
appointed before 1993 the pension calculation will be conducted as a weighted average of
the last monthly wage and the average wage since 2006, with the weights being the career
length before and after 2006. According to our calculations the change in the reference
period to the whole working life will lead to a reduction of the pension level of about
128 In our calculations we assume that future pensions will increase in accordance with the development of CPI and therefore stay constant in real terms. This scenario is based on the assumption that most of the pensions will amount to the range of 1.5 to six times the social support index (IAS) and the average growth rate of GDP will be between two and three per cent. 129 Due to a lack of data we could not implement the above mentioned other measures in our calculations. 130 In our calculations we assume that this reform step leads to an average reduction of pension payments of eleven per cent – comparing pensions in 2015 and 2006. Hereby we first of all take the assumption that the effective retirement age stays constant. Secondly we suppose that half of the civil servants will not have collected the necessary 30 years of contribution at the age of 55 in order to receive a penalty free early retirement. Therefore this group is confronted with a pension reduction of 4.5 per cent per year of increase in retirement age. This assumption is based on information – given by Statistics Portugal – that in 2006 the average years of contribution at the age of 55 amounted to 26.
139
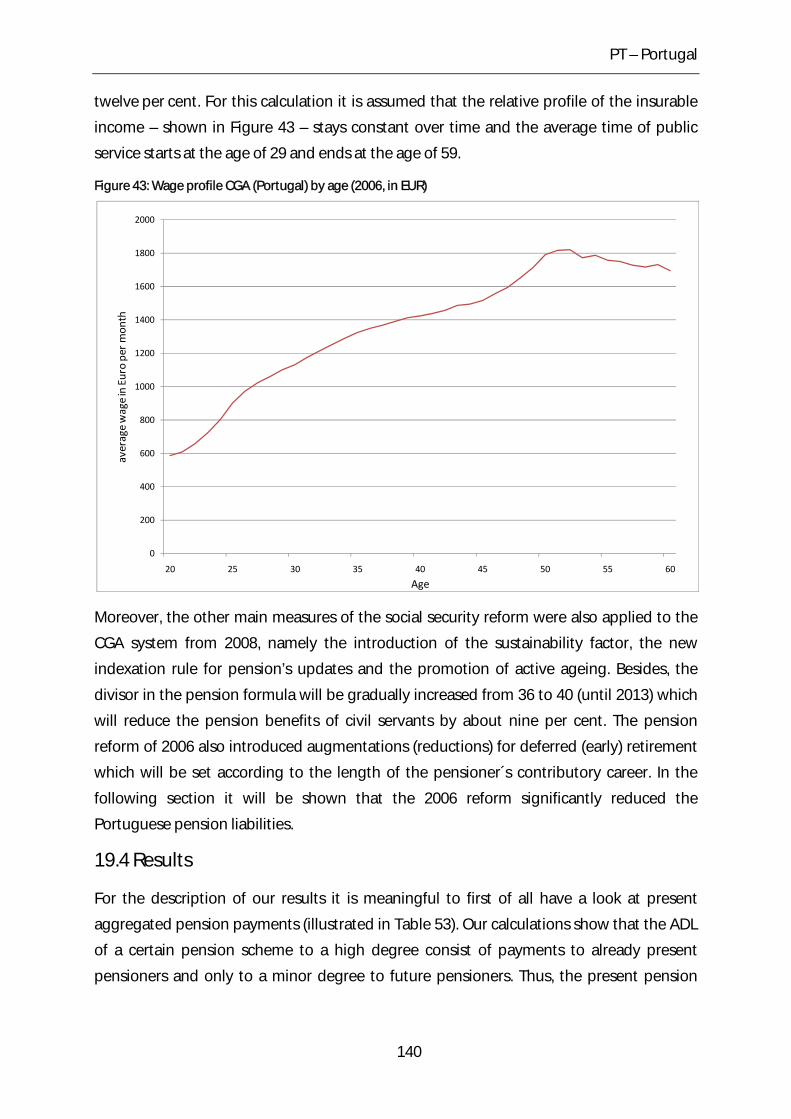
PT – Portugal
twelve per cent. For this calculation it is assumed that the relative profile of the insurable
income – shown in Figure 43 – stays constant over time and the average time of public
service starts at the age of 29 and ends at the age of 59.
Figure 43: Wage profile CGA (Portugal) by age (2006, in EUR)
0
200
400
600
800
1000
1200
1400
1600
1800
2000
20 25 30 35 40 45 50 55 60
average wage in Euro per mon
th
Age
Moreover, the other main measures of the social security reform were also applied to the
CGA system from 2008, namely the introduction of the sustainability factor, the new
indexation rule for pension’s updates and the promotion of active ageing. Besides, the
divisor in the pension formula will be gradually increased from 36 to 40 (until 2013) which
will reduce the pension benefits of civil servants by about nine per cent. The pension
reform of 2006 also introduced augmentations (reductions) for deferred (early) retirement
which will be set according to the length of the pensioner´s contributory career. In the
following section it will be shown that the 2006 reform significantly reduced the
Portuguese pension liabilities.
19.4 Results
For the description of our results it is meaningful to first of all have a look at present
aggregated pension payments (illustrated in Table 53). Our calculations show that the ADL
of a certain pension scheme to a high degree consist of payments to already present
pensioners and only to a minor degree to future pensioners. Thus, the present pension
140
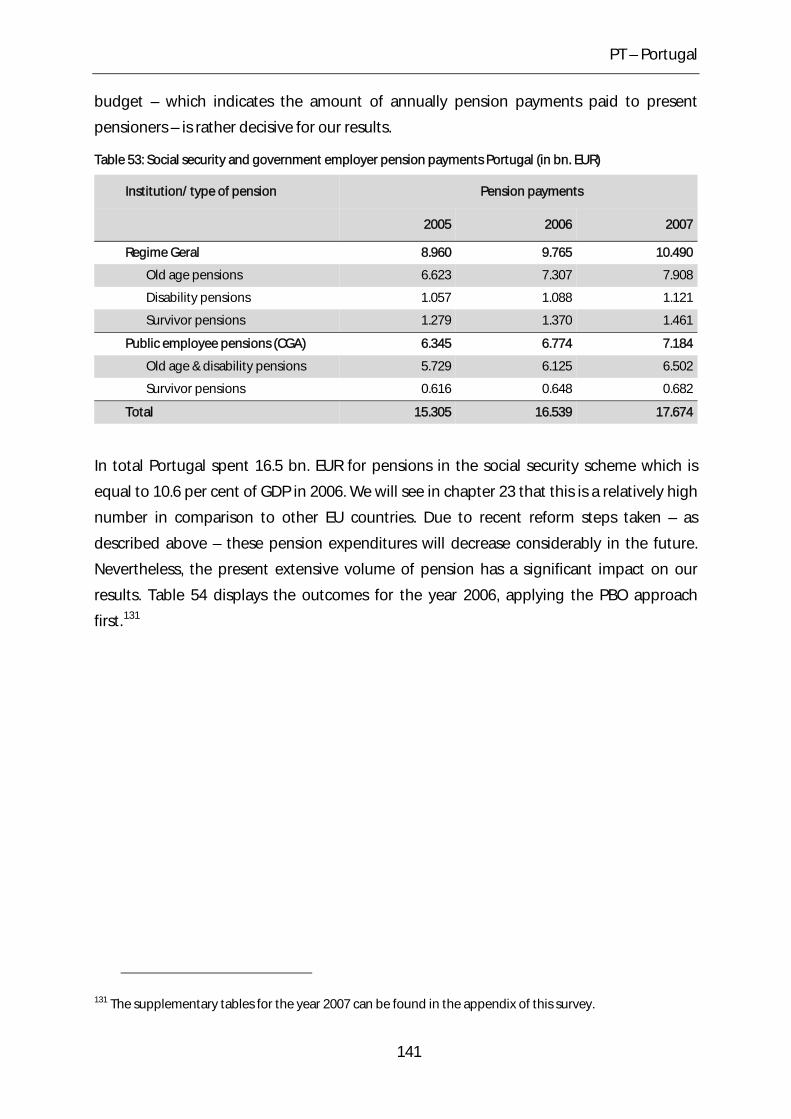
PT – Portugal
budget – which indicates the amount of annually pension payments paid to present
pensioners – is rather decisive for our results.
Table 53: Social security and government employer pension payments Portugal (in bn. EUR)
Institution/ type of pension Pension payments
2005 2006 2007
Regime Geral 8.960 9.765 10.490
Old age pensions 6.623 7.307 7.908
Disability pensions 1.057 1.088 1.121
Survivor pensions 1.279 1.370 1.461
Public employee pensions (CGA) 6.345 6.774 7.184
Old age & disability pensions 5.729 6.125 6.502
Survivor pensions 0.616 0.648 0.682
Total 15.305 16.539 17.674
In total Portugal spent 16.5 bn. EUR for pensions in the social security scheme which is
equal to 10.6 per cent of GDP in 2006. We will see in chapter 23 that this is a relatively high
number in comparison to other EU countries. Due to recent reform steps taken – as
described above – these pension expenditures will decrease considerably in the future.
Nevertheless, the present extensive volume of pension has a significant impact on our
results. Table 54 displays the outcomes for the year 2006, applying the PBO approach
first.131
131 The supplementary tables for the year 2007 can be found in the appendix of this survey.
141
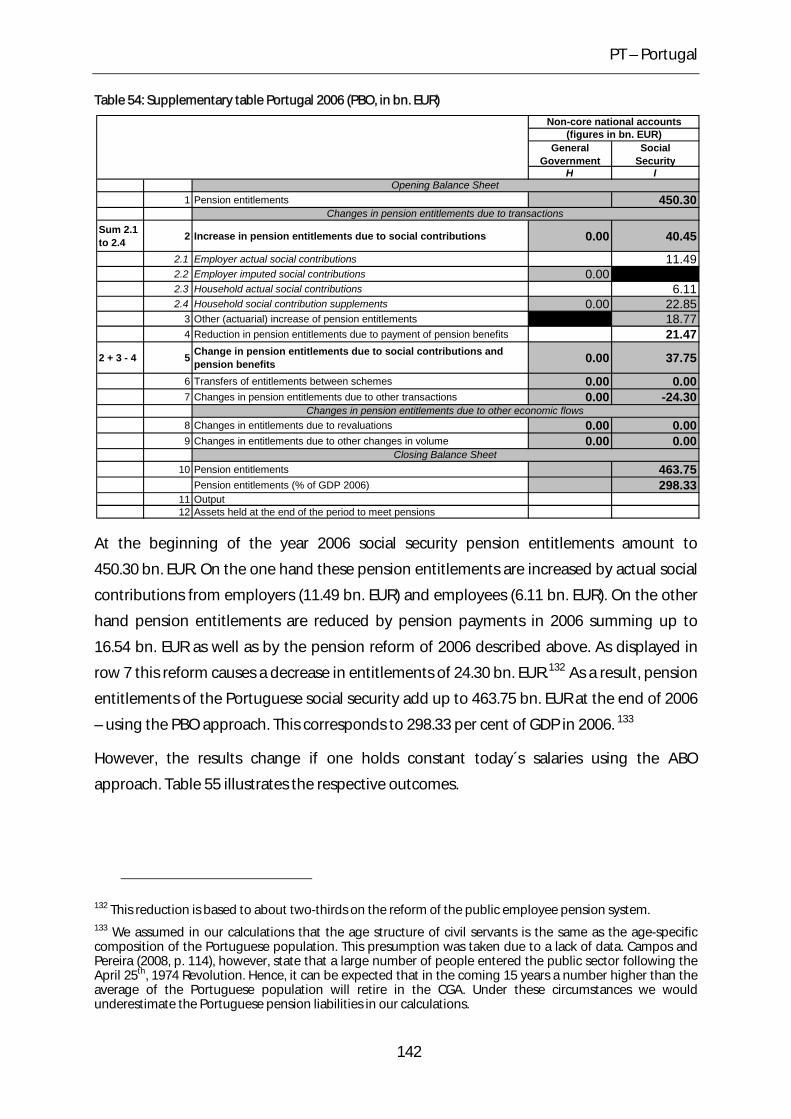
PT – Portugal
Table 54: Supplementary table Portugal 2006 (PBO, in bn. EUR)
General Government
Social Security
H I
1 Pension entitlements 450.30
Sum 2.1 to 2.4 2 Increase in pension entitlements due to social contributions 0.00 40.45
2.1 Employer actual social contributions 11.492.2 Employer imputed social contributions 0.002.3 Household actual social contributions 6.112.4 Household social contribution supplements 0.00 22.85
3 Other (actuarial) increase of pension entitlements 18.774 Reduction in pension entitlements due to payment of pension benefits 21.47
2 + 3 - 4 5 Change in pension entitlements due to social contributions and pension benefits 0.00 37.75
6 Transfers of entitlements between schemes 0.00 0.007 Changes in pension entitlements due to other transactions 0.00 -24.30
8 Changes in entitlements due to revaluations 0.00 0.009 Changes in entitlements due to other changes in volume 0.00 0.00
10 Pension entitlements 463.75Pension entitlements (% of GDP 2006) 298.33
11 Output12 Assets held at the end of the period to meet pensions
Closing Balance Sheet
Non-core national accounts(figures in bn. EUR)
Changes in pension entitlements due to transactions
Changes in pension entitlements due to other economic flows
Opening Balance Sheet
At the beginning of the year 2006 social security pension entitlements amount to
450.30 bn. EUR. On the one hand these pension entitlements are increased by actual social
contributions from employers (11.49 bn. EUR) and employees (6.11 bn. EUR). On the other
hand pension entitlements are reduced by pension payments in 2006 summing up to
16.54 bn. EUR as well as by the pension reform of 2006 described above. As displayed in
row 7 this reform causes a decrease in entitlements of 24.30 bn. EUR.132 As a result, pension
entitlements of the Portuguese social security add up to 463.75 bn. EUR at the end of 2006
– using the PBO approach. This corresponds to 298.33 per cent of GDP in 2006. 133
However, the results change if one holds constant today´s salaries using the ABO
approach. Table 55 illustrates the respective outcomes.
132 This reduction is based to about two-thirds on the reform of the public employee pension system. 133 We assumed in our calculations that the age structure of civil servants is the same as the age-specific composition of the Portuguese population. This presumption was taken due to a lack of data. Campos and Pereira (2008, p. 114), however, state that a large number of people entered the public sector following the April 25th, 1974 Revolution. Hence, it can be expected that in the coming 15 years a number higher than the average of the Portuguese population will retire in the CGA. Under these circumstances we would underestimate the Portuguese pension liabilities in our calculations.
142
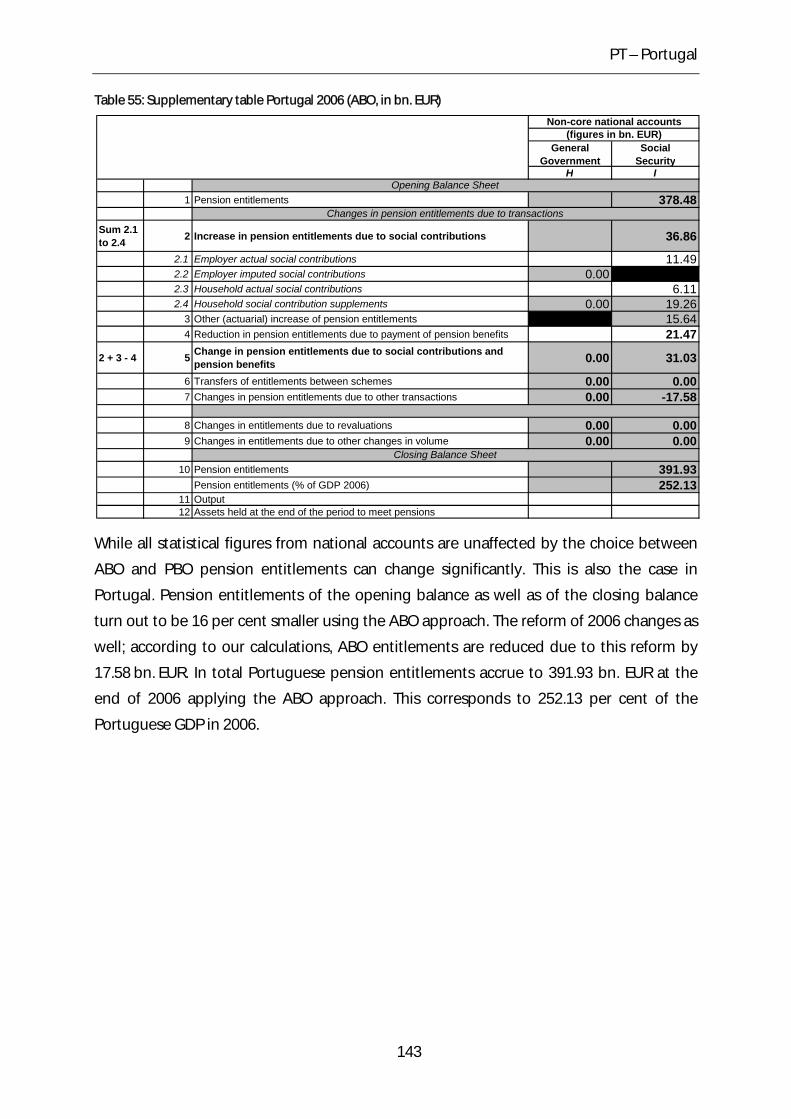
PT – Portugal
Table 55: Supplementary table Portugal 2006 (ABO, in bn. EUR)
General Government
Social Security
H I
1 Pension entitlements 378.48
Sum 2.1 to 2.4 2 Increase in pension entitlements due to social contributions 36.86
2.1 Employer actual social contributions 11.492.2 Employer imputed social contributions 0.002.3 Household actual social contributions 6.112.4 Household social contribution supplements 0.00 19.26
3 Other (actuarial) increase of pension entitlements 15.644 Reduction in pension entitlements due to payment of pension benefits 21.47
2 + 3 - 4 5 Change in pension entitlements due to social contributions and pension benefits 0.00 31.03
6 Transfers of entitlements between schemes 0.00 0.007 Changes in pension entitlements due to other transactions 0.00 -17.58
8 Changes in entitlements due to revaluations 0.00 0.009 Changes in entitlements due to other changes in volume 0.00 0.00
10 Pension entitlements 391.93Pension entitlements (% of GDP 2006) 252.13
11 Output12 Assets held at the end of the period to meet pensions
Closing Balance Sheet
Non-core national accounts(figures in bn. EUR)
Changes in pension entitlements due to transactions
Opening Balance Sheet
While all statistical figures from national accounts are unaffected by the choice between
ABO and PBO pension entitlements can change significantly. This is also the case in
Portugal. Pension entitlements of the opening balance as well as of the closing balance
turn out to be 16 per cent smaller using the ABO approach. The reform of 2006 changes as
well; according to our calculations, ABO entitlements are reduced due to this reform by
17.58 bn. EUR. In total Portuguese pension entitlements accrue to 391.93 bn. EUR at the
end of 2006 applying the ABO approach. This corresponds to 252.13 per cent of the
Portuguese GDP in 2006.
143
SE – Sweden
20 SE – Sweden
Sweden had a population of 9.05 million inhabitants as at January 1st, 2006.134 The national
currency is the Swedish Crown (SEK), which had an exchange rate of 9.0404 SEK to the EUR
as at December 29th, 2006. The GDP in Sweden was 2,900.8 bn. SEK in 2006, equal to a
value of 313.5 bn. EUR. This corresponds to a per capita GDP of 319,400 SEK or 34,500 EUR.
The Swedish economy is largely dominated by the service sector which accounts for about
60 per cent of GDP (excluding state sector) compared to about 27 per cent in
manufacturing. About 20 per cent of services are financial services; another 50 per cent are
trade related. This high trade dependence, particularly the high export dependence, might
have been a major incentive for the Swedish to vote against the adoption of the Euro in
the 2003 referendum, in order to keep a competitive exchange rate position. In contrast to
Denmark and the UK, Sweden is bound to the adoption by the accession treaty so that
adoption can only be delayed. The delay is achieved through an exchange rate policy
which does not satisfy the criteria of European Exchange Rate Mechanism (ERM) II.
20.1 Demographic situation
Sweden’s demographic history is characterized by increased life expectancy, considerable
immigration during and after World War II, and decreased fertility rates since the mid
1960s. Figure 44 illustrates the age-specific population structure of Sweden in 2006:
134 We display country data for 2006 since this is a main base year for our calculations.
144
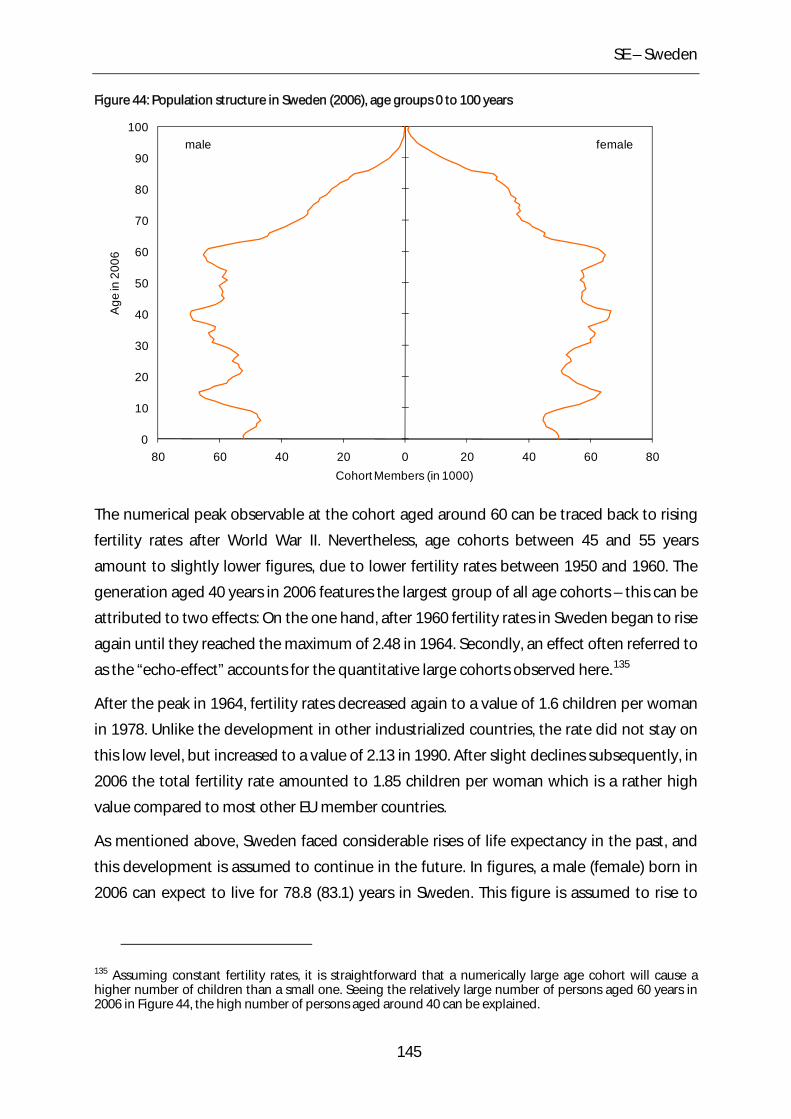
SE – Sweden
Figure 44: Population structure in Sweden (2006), age groups 0 to 100 years
0
10
20
30
40
50
60
70
80
90
100
80 60 40 20 0 20 40 60 80
Age
in 2
006
Cohort Members (in 1000)
femalemale
The numerical peak observable at the cohort aged around 60 can be traced back to rising
fertility rates after World War II. Nevertheless, age cohorts between 45 and 55 years
amount to slightly lower figures, due to lower fertility rates between 1950 and 1960. The
generation aged 40 years in 2006 features the largest group of all age cohorts – this can be
attributed to two effects: On the one hand, after 1960 fertility rates in Sweden began to rise
again until they reached the maximum of 2.48 in 1964. Secondly, an effect often referred to
as the “echo-effect” accounts for the quantitative large cohorts observed here.FF
135
After the peak in 1964, fertility rates decreased again to a value of 1.6 children per woman
in 1978. Unlike the development in other industrialized countries, the rate did not stay on
this low level, but increased to a value of 2.13 in 1990. After slight declines subsequently, in
2006 the total fertility rate amounted to 1.85 children per woman which is a rather high
value compared to most other EU member countries.
As mentioned above, Sweden faced considerable rises of life expectancy in the past, and
this development is assumed to continue in the future. In figures, a male (female) born in
2006 can expect to live for 78.8 (83.1) years in Sweden. This figure is assumed to rise to
135 Assuming constant fertility rates, it is straightforward that a numerically large age cohort will cause a higher number of children than a small one. Seeing the relatively large number of persons aged 60 years in 2006 in Figure 44, the high number of persons aged around 40 can be explained.
145
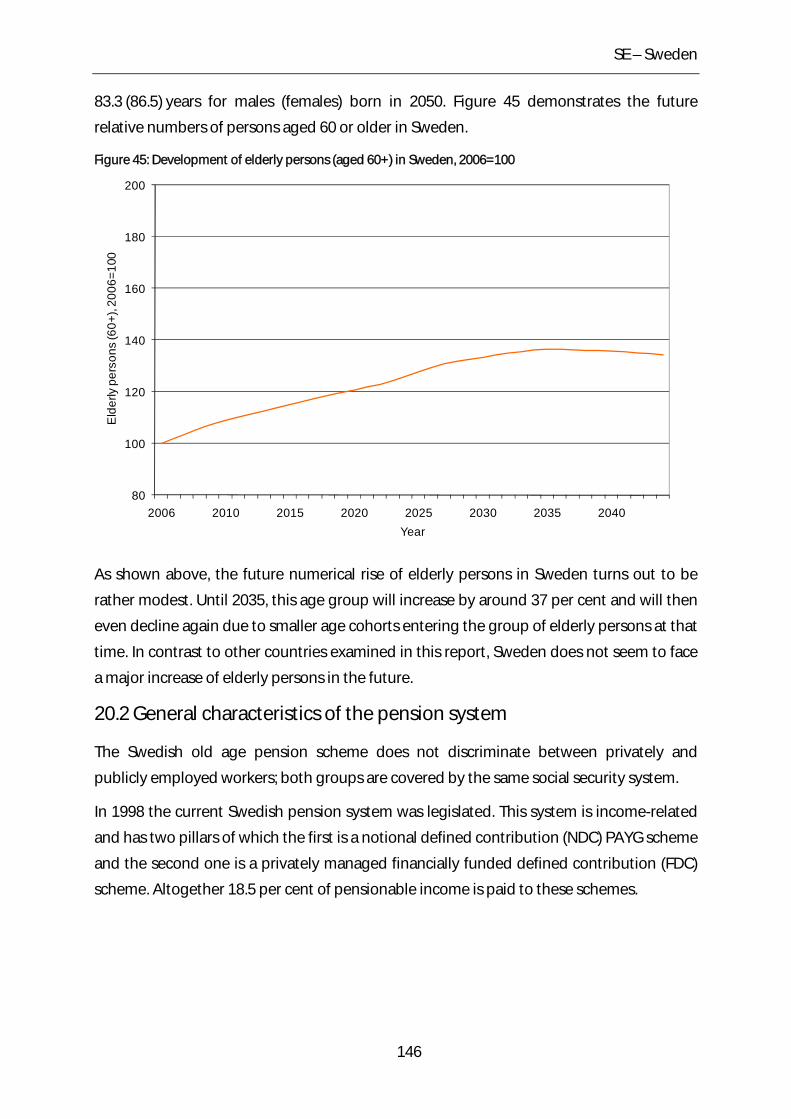
SE – Sweden
83.3 (86.5) years for males (females) born in 2050. Figure 45 demonstrates the future
relative numbers of persons aged 60 or older in Sweden.
Figure 45: Development of elderly persons (aged 60+) in Sweden, 2006=100
80
100
120
140
160
180
200
2006 2010 2015 2020 2025 2030 2035 2040
Eld
erly
per
sons
(60+
), 20
06=1
00
Year
As shown above, the future numerical rise of elderly persons in Sweden turns out to be
rather modest. Until 2035, this age group will increase by around 37 per cent and will then
even decline again due to smaller age cohorts entering the group of elderly persons at that
time. In contrast to other countries examined in this report, Sweden does not seem to face
a major increase of elderly persons in the future.
20.2 General characteristics of the pension system
The Swedish old age pension scheme does not discriminate between privately and
publicly employed workers; both groups are covered by the same social security system.
In 1998 the current Swedish pension system was legislated. This system is income-related
and has two pillars of which the first is a notional defined contribution (NDC) PAYG scheme
and the second one is a privately managed financially funded defined contribution (FDC)
scheme. Altogether 18.5 per cent of pensionable income is paid to these schemes.
146
SE – Sweden
Each working person contributes 16 per cent of pensionable income to the first pillar,
which is credited to a personal account indexed to wage growth per capita.136 The account
is notional since current pension obligations are paid out of current contributions so that
capital is not actually accumulated in the account.
In the second pillar every working person has to invest 2.5 per cent of pensionable income
into market funds among which they have a freedom of choice. Until recently the fund
transactions were managed by a state clearing house as a broker but upon request by
Eurostat these transactions are managed by private brokers since 2007. If a person does
not choose one or several funds of her own, the money is invested into a public fund
composed of bonds, domestic and foreign equities. Please note that only the first pillar is
subject to the calculations presented later in this chapter, as the second pillar does not
meet the requirements of the pension schemes examined in this report.
At the end of the working career the accumulated capital augmented by compensations
for periods of no employment for particular reasons (e.g. childbirth) is transformed into an
annuity by dividing the balance in the notional account by an annuity divisor. This divisor
is determined by further unisex life expectancy at retirement for a given cohort at age 65
and an imputed real rate of return of 1.6 per cent (which corresponds to a long-term real
growth rate of the economy assumed by the policy makers). Benefits are adjusted each
year for inflation.137
20.3 Recent reforms of the pension system
Before 1999 the Swedish system was a combination of a flat-rate pension called
folkpension (at the initial level of today’s guarantee) and an earnings-related part which
was defined benefit as opposed to the new defined contribution scheme. The benefit was
a proportion of the average wage of the best 15 years of the working career. Full eligibility
was achieved with 30 years of covered earnings at age 65; maximum pension age was 67.
The system is currently – until 2015 – in a transition period. People born 1937 or earlier are
still in the old system with the exception of the guarantee, where the new regulation is
136 An automatic mechanism using a balance ratio which relates the pension system’s assets (including the rate of return of the buffer funds) to its liabilities abandons indexation by average per capita wage growth in case the stability of the system is in danger. See Könberg et al (2006). 137 Benefits are also wage-indexed, but only with the difference between the assumed long-term wage growth of 1.6 per cent and the actual per capita real wages (for further details, see Könberg et al (2006)). Therefore the system is in principle CPI-indexed but has a “sustainability-factor” in case that economic growth deviates from an assumed “norm” of 1.6 per cent. For reasons of simplicity, we assumed CPI indexation for our calculations.
147
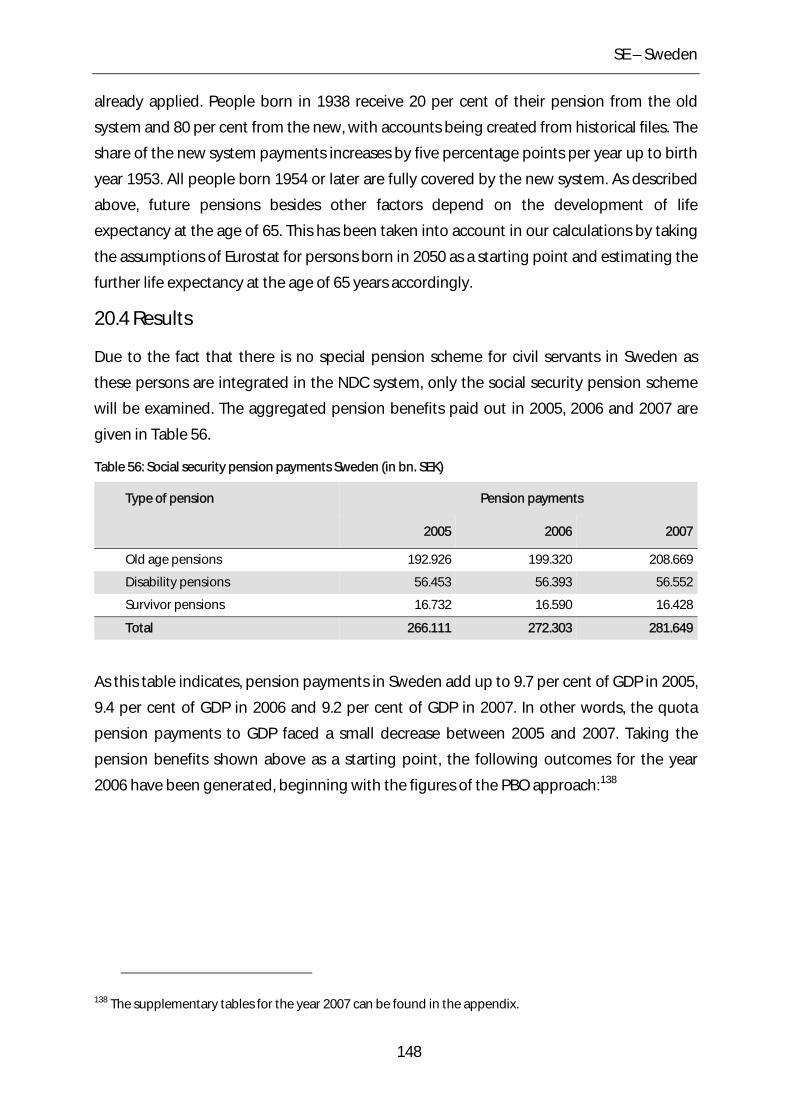
SE – Sweden
already applied. People born in 1938 receive 20 per cent of their pension from the old
system and 80 per cent from the new, with accounts being created from historical files. The
share of the new system payments increases by five percentage points per year up to birth
year 1953. All people born 1954 or later are fully covered by the new system. As described
above, future pensions besides other factors depend on the development of life
expectancy at the age of 65. This has been taken into account in our calculations by taking
the assumptions of Eurostat for persons born in 2050 as a starting point and estimating the
further life expectancy at the age of 65 years accordingly.
20.4 Results
Due to the fact that there is no special pension scheme for civil servants in Sweden as
these persons are integrated in the NDC system, only the social security pension scheme
will be examined. The aggregated pension benefits paid out in 2005, 2006 and 2007 are
given in Table 56.
Table 56: Social security pension payments Sweden (in bn. SEK)
Type of pension Pension payments
2005 2006 2007
Old age pensions 192.926 199.320 208.669
Disability pensions 56.453 56.393 56.552
Survivor pensions 16.732 16.590 16.428
Total 266.111 272.303 281.649
As this table indicates, pension payments in Sweden add up to 9.7 per cent of GDP in 2005,
9.4 per cent of GDP in 2006 and 9.2 per cent of GDP in 2007. In other words, the quota
pension payments to GDP faced a small decrease between 2005 and 2007. Taking the
pension benefits shown above as a starting point, the following outcomes for the year
2006 have been generated, beginning with the figures of the PBO approach:138
138 The supplementary tables for the year 2007 can be found in the appendix.
148
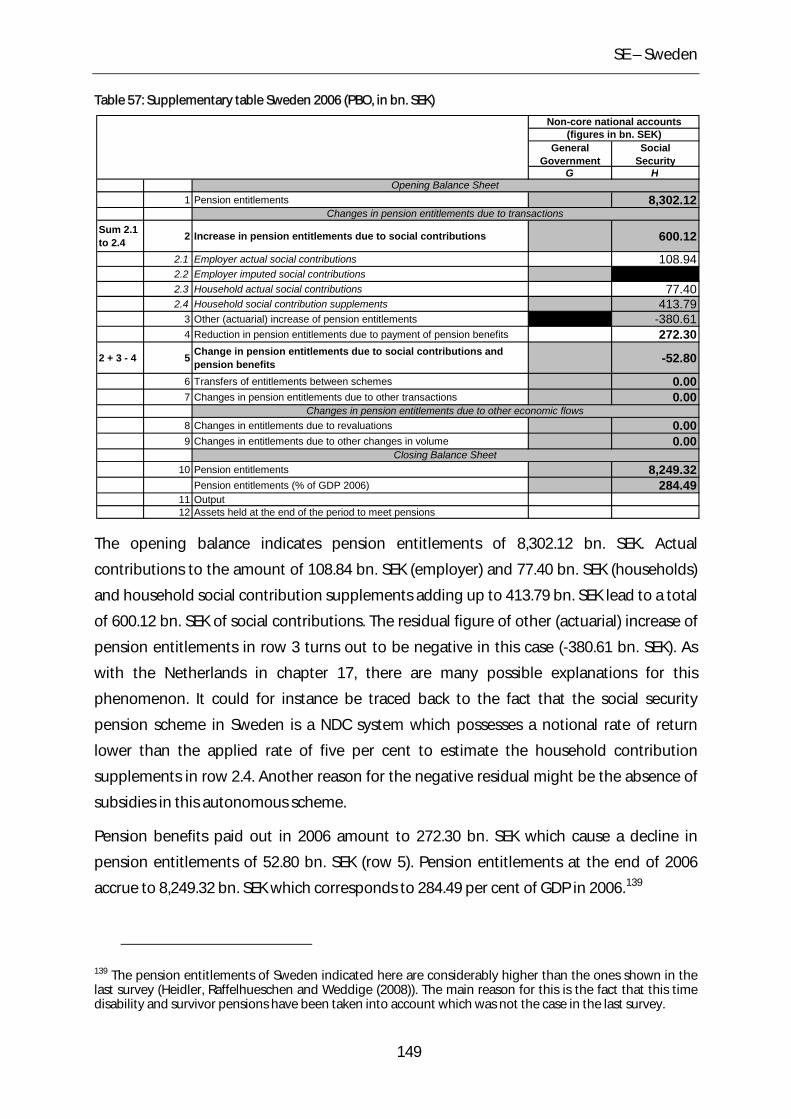
SE – Sweden
Table 57: Supplementary table Sweden 2006 (PBO, in bn. SEK)
General Government
Social Security
G H
1 Pension entitlements 8,302.12
Sum 2.1 to 2.4 2 Increase in pension entitlements due to social contributions 600.12
2.1 Employer actual social contributions 108.942.2 Employer imputed social contributions2.3 Household actual social contributions 77.402.4 Household social contribution supplements 413.79
3 Other (actuarial) increase of pension entitlements -380.614 Reduction in pension entitlements due to payment of pension benefits 272.30
2 + 3 - 4 5 Change in pension entitlements due to social contributions and pension benefits -52.80
6 Transfers of entitlements between schemes 0.007 Changes in pension entitlements due to other transactions 0.00
8 Changes in entitlements due to revaluations 0.009 Changes in entitlements due to other changes in volume 0.00
10 Pension entitlements 8,249.32Pension entitlements (% of GDP 2006) 284.49
11 Output12 Assets held at the end of the period to meet pensions
Closing Balance Sheet
Non-core national accounts(figures in bn. SEK)
Changes in pension entitlements due to transactions
Changes in pension entitlements due to other economic flows
Opening Balance Sheet
The opening balance indicates pension entitlements of 8,302.12 bn. SEK. Actual
contributions to the amount of 108.84 bn. SEK (employer) and 77.40 bn. SEK (households)
and household social contribution supplements adding up to 413.79 bn. SEK lead to a total
of 600.12 bn. SEK of social contributions. The residual figure of other (actuarial) increase of
pension entitlements in row 3 turns out to be negative in this case (-380.61 bn. SEK). As
with the Netherlands in chapter 17, there are many possible explanations for this
phenomenon. It could for instance be traced back to the fact that the social security
pension scheme in Sweden is a NDC system which possesses a notional rate of return
lower than the applied rate of five per cent to estimate the household contribution
supplements in row 2.4. Another reason for the negative residual might be the absence of
subsidies in this autonomous scheme.
Pension benefits paid out in 2006 amount to 272.30 bn. SEK which cause a decline in
pension entitlements of 52.80 bn. SEK (row 5). Pension entitlements at the end of 2006
accrue to 8,249.32 bn. SEK which corresponds to 284.49 per cent of GDP in 2006.139
139 The pension entitlements of Sweden indicated here are considerably higher than the ones shown in the last survey (Heidler, Raffelhueschen and Weddige (2008)). The main reason for this is the fact that this time disability and survivor pensions have been taken into account which was not the case in the last survey.
149
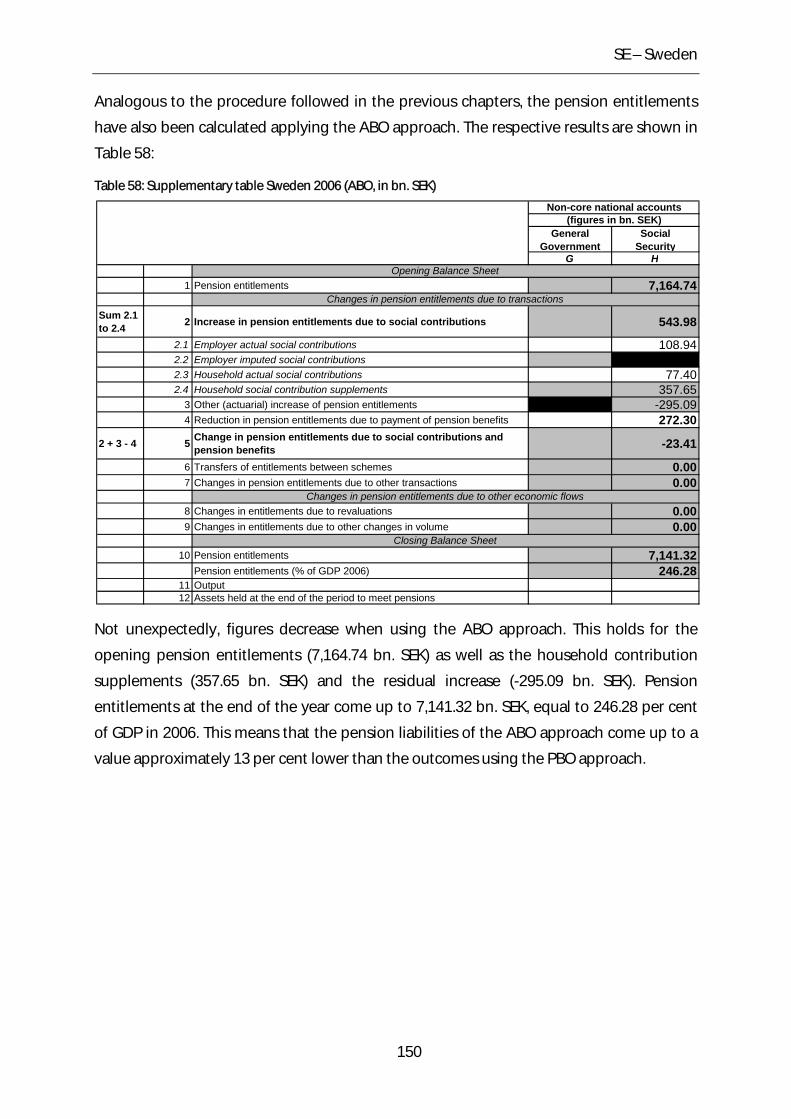
SE – Sweden
Analogous to the procedure followed in the previous chapters, the pension entitlements
have also been calculated applying the ABO approach. The respective results are shown in
Table 58:
Table 58: Supplementary table Sweden 2006 (ABO, in bn. SEK)
General Government
Social Security
G H
1 Pension entitlements 7,164.74
Sum 2.1 to 2.4 2 Increase in pension entitlements due to social contributions 543.98
2.1 Employer actual social contributions 108.942.2 Employer imputed social contributions2.3 Household actual social contributions 77.402.4 Household social contribution supplements 357.65
3 Other (actuarial) increase of pension entitlements -295.094 Reduction in pension entitlements due to payment of pension benefits 272.30
2 + 3 - 4 5 Change in pension entitlements due to social contributions and pension benefits -23.41
6 Transfers of entitlements between schemes 0.007 Changes in pension entitlements due to other transactions 0.00
8 Changes in entitlements due to revaluations 0.009 Changes in entitlements due to other changes in volume 0.00
10 Pension entitlements 7,141.32Pension entitlements (% of GDP 2006) 246.28
11 Output12 Assets held at the end of the period to meet pensions
Closing Balance Sheet
Non-core national accounts(figures in bn. SEK)
Changes in pension entitlements due to transactions
Changes in pension entitlements due to other economic flows
Opening Balance Sheet
Not unexpectedly, figures decrease when using the ABO approach. This holds for the
opening pension entitlements (7,164.74 bn. SEK) as well as the household contribution
supplements (357.65 bn. SEK) and the residual increase (-295.09 bn. SEK). Pension
entitlements at the end of the year come up to 7,141.32 bn. SEK, equal to 246.28 per cent
of GDP in 2006. This means that the pension liabilities of the ABO approach come up to a
value approximately 13 per cent lower than the outcomes using the PBO approach.
150
SK – Slovakia
21 SK – Slovakia140
Slovakia´s population amounted to 5.39 million inhabitants in 2006.141 After the fall of the
Iron Curtain it has undergone a profound transformation from a centrally planned to a
market based economy. Slovakia was in the first group of the Eastern European countries
to join the EU in 2004. A further integration-step into the European Union was taken in
2009 with the adoption of the Euro. Up to this point the official currency was the Slovakian
Koruna (SKK).142F Slovakia experienced considerable economic growth rates in the last
years, resulting in a GDP of 1,659.4 bn. SKK in 2006 which corresponds to 44.6 bn. EUR. The
resulting per capita GDP added up to about 8,300 EUR.
21.1 Demographic situation
As observed in all European countries the Slovakian population is steadily growing older.
However, the ageing process in Slovakia differs from that of most other EU countries. Total
fertility rates as the major factor behind this development have been extremely low and
amounted to 1.24 in 2006. Moreover, life expectancy has increased considerably in recent
years. While a female (male) born in 1980 could expect to live 74.4 (66.7) years, this number
increased until the year 2006 to 78.4 (70.4) for women (men). According to the estimations
of Eurostat life expectancy will rise further until the year 2050 to a value of 83.4 (77.7) years
for women (men). The age-specific population structure for Slovakia in 2006 is illustrated in
Figure 46.
140 We would like to thank Zuzana Durcenkova from Narodna banka Slovenska (National Bank of Slovakia) for valuable comments on this chapter. 141 Figure as at January 1st, 2006. We display country data for 2006 since this is a main base year for our calculations. 142 The exchange rate was 34.435 SKK to the Euro as at December 29th, 2006.
151
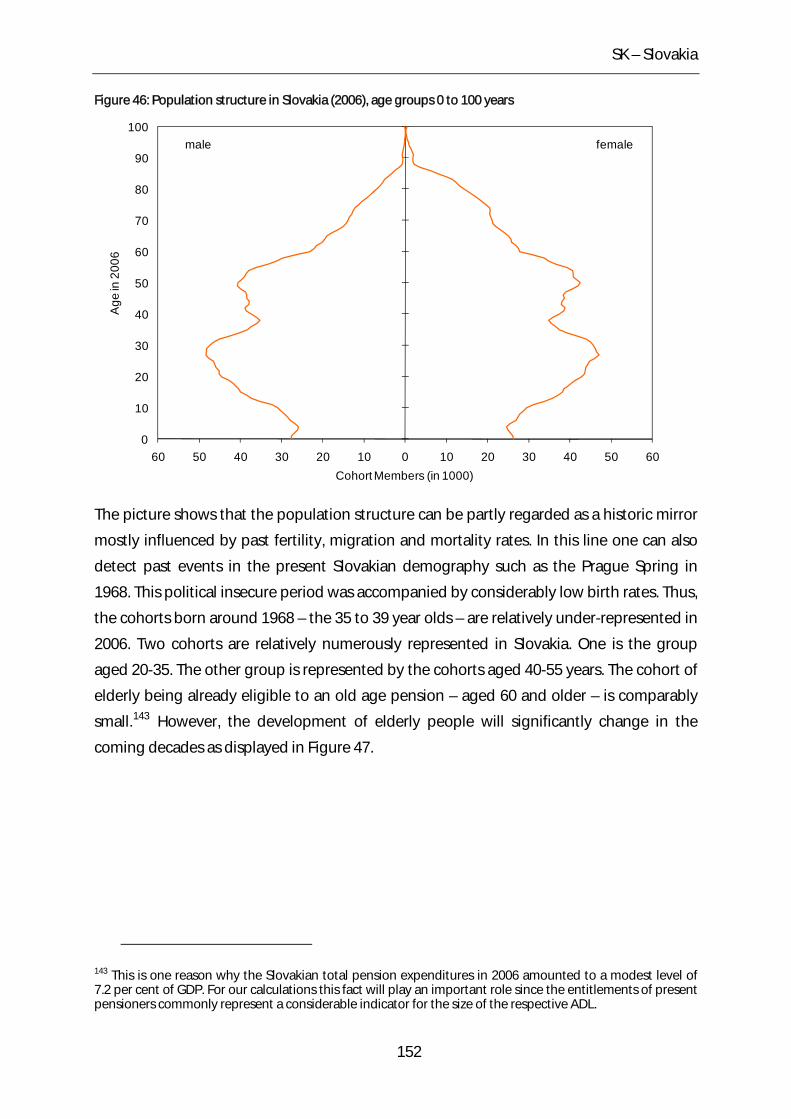
SK – Slovakia
Figure 46: Population structure in Slovakia (2006), age groups 0 to 100 years
0
10
20
30
40
50
60
70
80
90
100
60 50 40 30 20 10 0 10 20 30 40 50 60
Age
in 2
006
Cohort Members (in 1000)
femalemale
The picture shows that the population structure can be partly regarded as a historic mirror
mostly influenced by past fertility, migration and mortality rates. In this line one can also
detect past events in the present Slovakian demography such as the Prague Spring in
1968. This political insecure period was accompanied by considerably low birth rates. Thus,
the cohorts born around 1968 – the 35 to 39 year olds – are relatively under-represented in
2006. Two cohorts are relatively numerously represented in Slovakia. One is the group
aged 20-35. The other group is represented by the cohorts aged 40-55 years. The cohort of
elderly being already eligible to an old age pension – aged 60 and older – is comparably
small.143 However, the development of elderly people will significantly change in the
coming decades as displayed in Figure 47.
143 This is one reason why the Slovakian total pension expenditures in 2006 amounted to a modest level of 7.2 per cent of GDP. For our calculations this fact will play an important role since the entitlements of present pensioners commonly represent a considerable indicator for the size of the respective ADL.
152
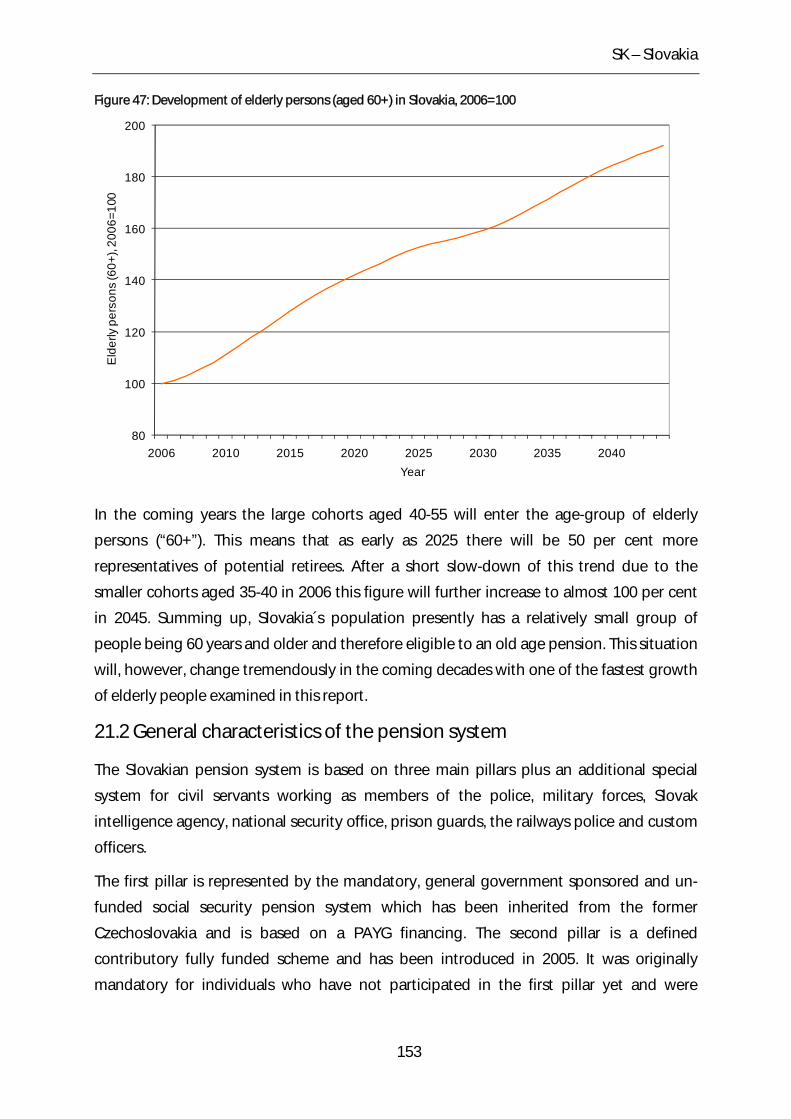
SK – Slovakia
Figure 47: Development of elderly persons (aged 60+) in Slovakia, 2006=100
80
100
120
140
160
180
200
2006 2010 2015 2020 2025 2030 2035 2040
Eld
erly
per
sons
(60+
), 20
06=1
00
Year
In the coming years the large cohorts aged 40-55 will enter the age-group of elderly
persons (“60+”). This means that as early as 2025 there will be 50 per cent more
representatives of potential retirees. After a short slow-down of this trend due to the
smaller cohorts aged 35-40 in 2006 this figure will further increase to almost 100 per cent
in 2045. Summing up, Slovakia´s population presently has a relatively small group of
people being 60 years and older and therefore eligible to an old age pension. This situation
will, however, change tremendously in the coming decades with one of the fastest growth
of elderly people examined in this report.
21.2 General characteristics of the pension system
The Slovakian pension system is based on three main pillars plus an additional special
system for civil servants working as members of the police, military forces, Slovak
intelligence agency, national security office, prison guards, the railways police and custom
officers.
The first pillar is represented by the mandatory, general government sponsored and un-
funded social security pension system which has been inherited from the former
Czechoslovakia and is based on a PAYG financing. The second pillar is a defined
contributory fully funded scheme and has been introduced in 2005. It was originally
mandatory for individuals who have not participated in the first pillar yet and were
153
SK – Slovakia
entering the labour market for the first time after the year 2004, and self-employed people.
In 2007 the government decided to eliminate its mandatory character and introduced the
element of voluntariness for entering the second pension pillar. The supplementary
pension scheme and other financial products form the third pillar of the Slovakian pension
system. It is voluntary and also fully funded. The special pension system for civil servants is
sponsored by general government, based on a PAYG principle. The system is obligatory for
all civil servants.
21.3 Recent reforms of the pension system
In the course of the transition of the Slovakian economy its pension system went under
severe financial pressure. With high unemployment rates and low motivation of the
economically active population to contribute to the pension system, expenditures
exceeded revenues in years prior to the first major reform in 2003. Furthermore, it became
clear in recent years that the financial sustainability of the Slovakian pension system would
be considerably challenged by a fast ageing society, as illustrated above. For these reasons
the Slovak Republic embraced major reform steps adopted in 2003, 2004 and 2007 and
implemented them in the respective following years 2004, 2005 and 2008.
Until the reform of 2004, the retirement age was set to 57 (60) years for women (men).
According to the old legislation this age was further reduced by one year for each child
raised, down to a minimum of 53 years (for women). With the reform of 2004 statutory
retirement ages have been gradually increased by nine months per year to 62 years for
both sexes equally – with taking no regard to the number of raised children any more.
Furthermore, reduced retirement ages which depended on the type of occupation have
been abolished with the reform of 2004. In order to increase revenues of the pension
system the maximum payment base has been changed to three multiples of the average
salary in the economy with the reform of 2003.144 Besides that, new elements have been
introduced which allow pensioners to retire before (after) the retirement age. In such cases
old age pensions have been reduced (increased) by six per cent per year. Furthermore, the
option to work while drawing a pension has been implemented. Another main element of
the reform 2004 was the introduction of a new pension formula. While the old system
consisted of different elements of redistribution the new point system creates a more
direct link between contributions and benefits. Similar to the German pension system,
contributors who earn the average wage receive one point per year of insurance. For the
144 Due to a lack of data about the distribution of salaries in Slovakia we were not able to consider the change of the payment base in our calculations.
154
SK – Slovakia
benefit calculation one point stands for the equivalent of providing workers with
1.16 per cent of their average lifetime wage. Last but not least the reform of 2004
implemented a new indexation of pensions. According to these new rule pensions are
adjusted annually by one half of the growth in CPI and one half to the growth of the
average salary in the economy.145
The main cornerstone of the reform implemented in 2005 was the introduction of a
mandatory funded second pillar. According to this new legislation contributions by both
employees and employers to the old age pension insurance are split. Half is transferred to
the first pillar and the other half to the funded second pillar on individual accounts. While
current contributors were free to switch to this mixed system for a limited time period, all
new entrants to the labour market are automatically obliged to pay contributions
according to these new rules. With the reform of 2005 unfunded pension entitlements in
Slovakia will decrease significantly in the long run. However, for the calculation of the
present ADL – which consider only contributions up to the base year – this recent reform
has only a minor impact. Taking the year 2006 as the base year we assume that the ADL
will be reduced by about three per cent of GDP (2006) due to the reform of 2005.146
After the reform of 2005 further changes of the pension system have been adopted in 2007
and implemented in 2008. These include the tightening of rules for early retirement,
increase of minimum time of contributions entitling for a pension from ten to 15 years as
well as a further increase of the payment base for contributions to four multiples of
average salary while maintaining the old restrictions for calculation of pension benefits.
Furthermore the second pillar has been temporarily opened for the first half of the year
2008 for people to switch back to the first pillar or enter the second pillar, and the element
of optionality has been introduced for those entering the labor market for the first time
after the year 2007. In September 2008 the government decided to reopen the second
pillar for the period from November 15th, 2008 till the end of June 2009. These second pillar
reform measures have been adopted to increase the revenues of the first pillar. They
represent a reversal of recent approaches to strengthen the second pillar.
145 The indexation of pensions of the military which are increased according to the growth of an average service salary of professional soldiers is an exception of this rule. Due to a lack of information we did not consider this specific indexation rule. 146 For this comparison we presume that all Slovakian contributors younger than 40 years have chosen to take part in the new second pillar. This seems quite reasonable since about 1.5 million of all insured persons (roughly 2.6 million) in Slovakia have had contributed to the second pillar at the end of 2006.
155
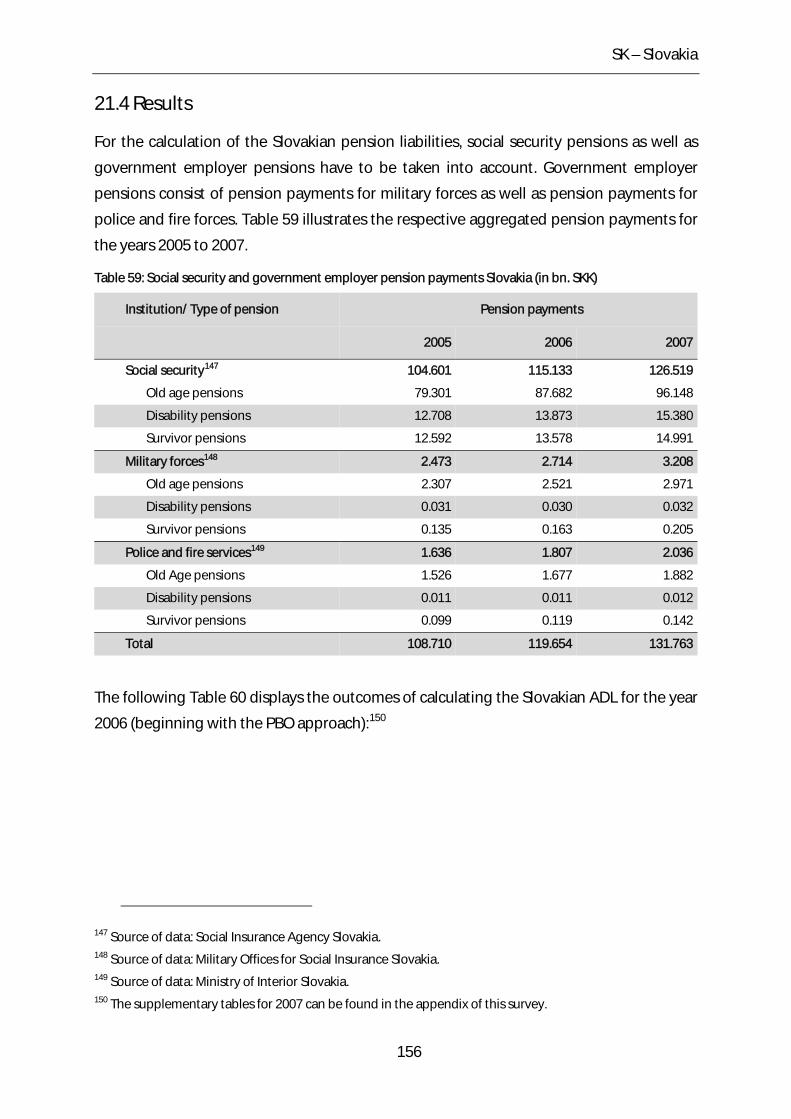
SK – Slovakia
21.4 Results
For the calculation of the Slovakian pension liabilities, social security pensions as well as
government employer pensions have to be taken into account. Government employer
pensions consist of pension payments for military forces as well as pension payments for
police and fire forces. Table 59 illustrates the respective aggregated pension payments for
the years 2005 to 2007.
Table 59: Social security and government employer pension payments Slovakia (in bn. SKK)
Institution/ Type of pension Pension payments
2005 2006 2007
Social security147 104.601 115.133 126.519
Old age pensions 79.301 87.682 96.148
Disability pensions 12.708 13.873 15.380
Survivor pensions 12.592 13.578 14.991
Military forces148 2.473 2.714 3.208
Old age pensions 2.307 2.521 2.971
Disability pensions 0.031 0.030 0.032
Survivor pensions 0.135 0.163 0.205
Police and fire services149 1.636 1.807 2.036
Old Age pensions 1.526 1.677 1.882
Disability pensions 0.011 0.011 0.012
Survivor pensions 0.099 0.119 0.142
Total 108.710 119.654 131.763
The following Table 60 displays the outcomes of calculating the Slovakian ADL for the year
2006 (beginning with the PBO approach):150
147 Source of data: Social Insurance Agency Slovakia. 148 Source of data: Military Offices for Social Insurance Slovakia. 149 Source of data: Ministry of Interior Slovakia. 150 The supplementary tables for 2007 can be found in the appendix of this survey.
156
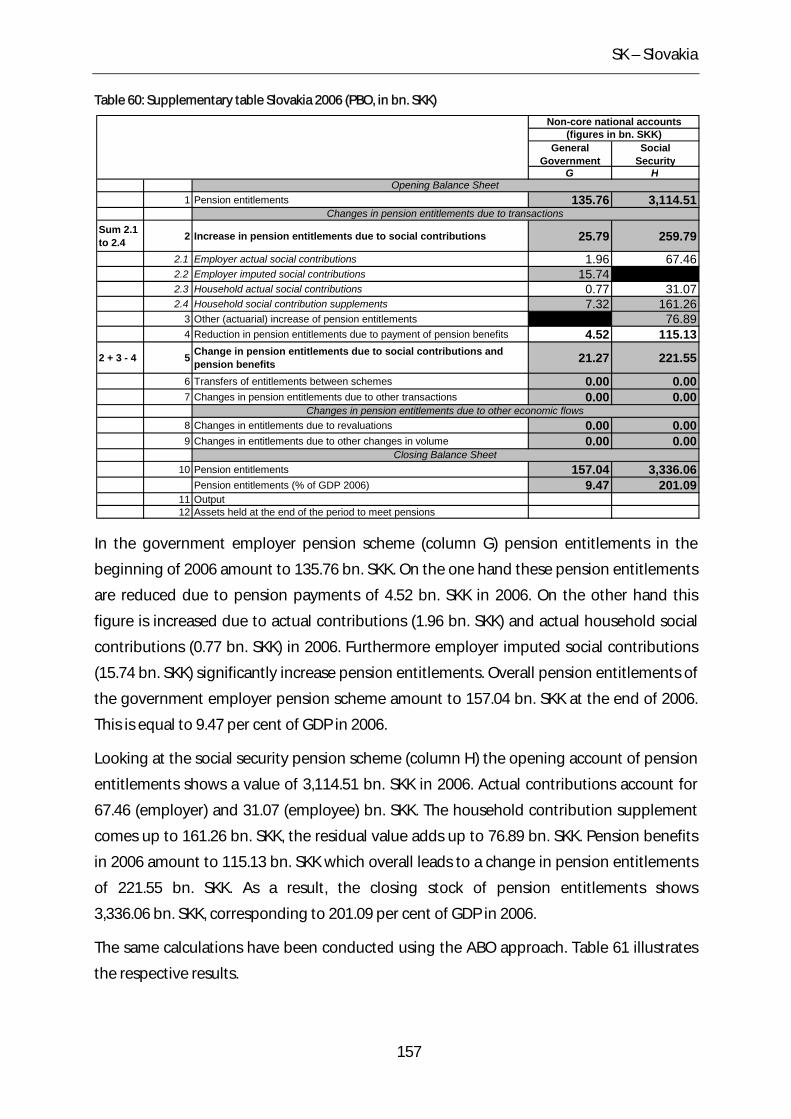
SK – Slovakia
Table 60: Supplementary table Slovakia 2006 (PBO, in bn. SKK)
General Government
Social Security
G H
1 Pension entitlements 135.76 3,114.51
Sum 2.1 to 2.4 2 Increase in pension entitlements due to social contributions 25.79 259.79
2.1 Employer actual social contributions 1.96 67.462.2 Employer imputed social contributions 15.742.3 Household actual social contributions 0.77 31.072.4 Household social contribution supplements 7.32 161.26
3 Other (actuarial) increase of pension entitlements 76.894 Reduction in pension entitlements due to payment of pension benefits 4.52 115.13
2 + 3 - 4 5 Change in pension entitlements due to social contributions and pension benefits 21.27 221.55
6 Transfers of entitlements between schemes 0.00 0.007 Changes in pension entitlements due to other transactions 0.00 0.00
8 Changes in entitlements due to revaluations 0.00 0.009 Changes in entitlements due to other changes in volume 0.00 0.00
10 Pension entitlements 157.04 3,336.06Pension entitlements (% of GDP 2006) 9.47 201.09
11 Output12 Assets held at the end of the period to meet pensions
Closing Balance Sheet
Non-core national accounts(figures in bn. SKK)
Changes in pension entitlements due to transactions
Changes in pension entitlements due to other economic flows
Opening Balance Sheet
In the government employer pension scheme (column G) pension entitlements in the
beginning of 2006 amount to 135.76 bn. SKK. On the one hand these pension entitlements
are reduced due to pension payments of 4.52 bn. SKK in 2006. On the other hand this
figure is increased due to actual contributions (1.96 bn. SKK) and actual household social
contributions (0.77 bn. SKK) in 2006. Furthermore employer imputed social contributions
(15.74 bn. SKK) significantly increase pension entitlements. Overall pension entitlements of
the government employer pension scheme amount to 157.04 bn. SKK at the end of 2006.
This is equal to 9.47 per cent of GDP in 2006.
Looking at the social security pension scheme (column H) the opening account of pension
entitlements shows a value of 3,114.51 bn. SKK in 2006. Actual contributions account for
67.46 (employer) and 31.07 (employee) bn. SKK. The household contribution supplement
comes up to 161.26 bn. SKK, the residual value adds up to 76.89 bn. SKK. Pension benefits
in 2006 amount to 115.13 bn. SKK which overall leads to a change in pension entitlements
of 221.55 bn. SKK. As a result, the closing stock of pension entitlements shows
3,336.06 bn. SKK, corresponding to 201.09 per cent of GDP in 2006.
The same calculations have been conducted using the ABO approach. Table 61 illustrates
the respective results.
157
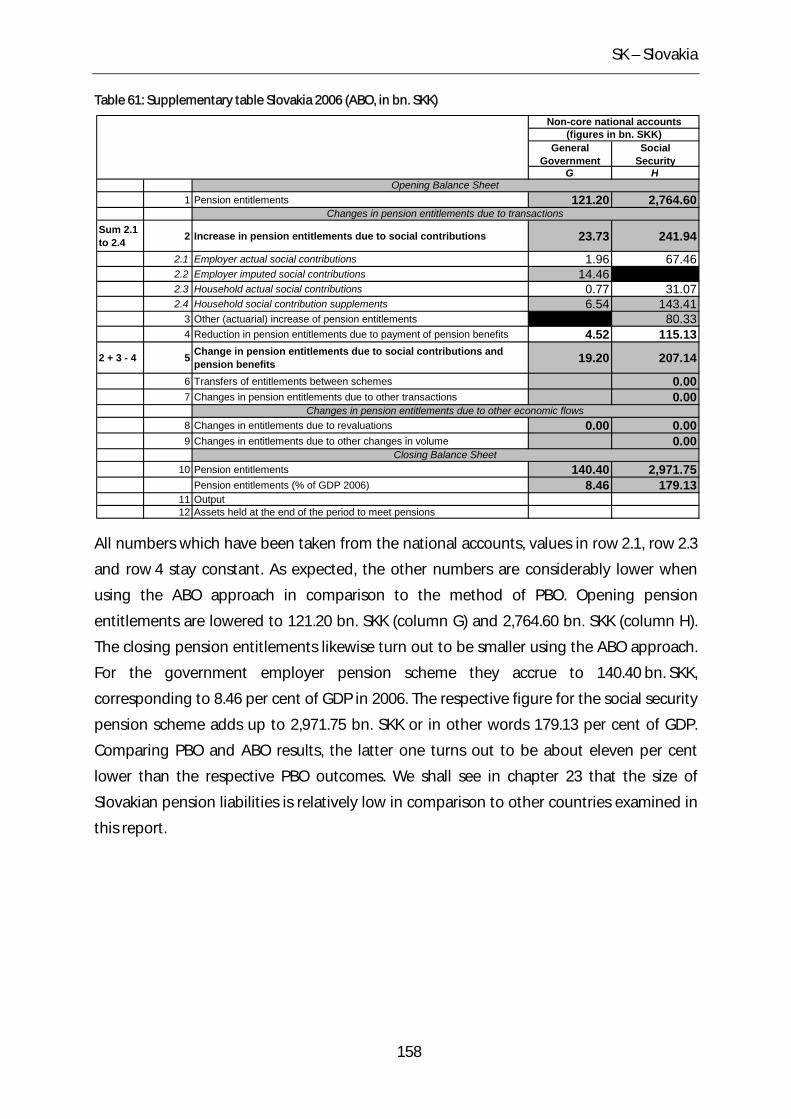
SK – Slovakia
Table 61: Supplementary table Slovakia 2006 (ABO, in bn. SKK)
General Government
Social Security
G H
1 Pension entitlements 121.20 2,764.60
Sum 2.1 to 2.4 2 Increase in pension entitlements due to social contributions 23.73 241.94
2.1 Employer actual social contributions 1.96 67.462.2 Employer imputed social contributions 14.462.3 Household actual social contributions 0.77 31.072.4 Household social contribution supplements 6.54 143.41
3 Other (actuarial) increase of pension entitlements 80.334 Reduction in pension entitlements due to payment of pension benefits 4.52 115.13
2 + 3 - 4 5 Change in pension entitlements due to social contributions and pension benefits 19.20 207.14
6 Transfers of entitlements between schemes 0.007 Changes in pension entitlements due to other transactions 0.00
8 Changes in entitlements due to revaluations 0.00 0.009 Changes in entitlements due to other changes in volume 0.00
10 Pension entitlements 140.40 2,971.75Pension entitlements (% of GDP 2006) 8.46 179.13
11 Output12 Assets held at the end of the period to meet pensions
Closing Balance Sheet
Non-core national accounts(figures in bn. SKK)
Changes in pension entitlements due to transactions
Changes in pension entitlements due to other economic flows
Opening Balance Sheet
All numbers which have been taken from the national accounts, values in row 2.1, row 2.3
and row 4 stay constant. As expected, the other numbers are considerably lower when
using the ABO approach in comparison to the method of PBO. Opening pension
entitlements are lowered to 121.20 bn. SKK (column G) and 2,764.60 bn. SKK (column H).
The closing pension entitlements likewise turn out to be smaller using the ABO approach.
For the government employer pension scheme they accrue to 140.40 bn. SKK,
corresponding to 8.46 per cent of GDP in 2006. The respective figure for the social security
pension scheme adds up to 2,971.75 bn. SKK or in other words 179.13 per cent of GDP.
Comparing PBO and ABO results, the latter one turns out to be about eleven per cent
lower than the respective PBO outcomes. We shall see in chapter 23 that the size of
Slovakian pension liabilities is relatively low in comparison to other countries examined in
this report.
158
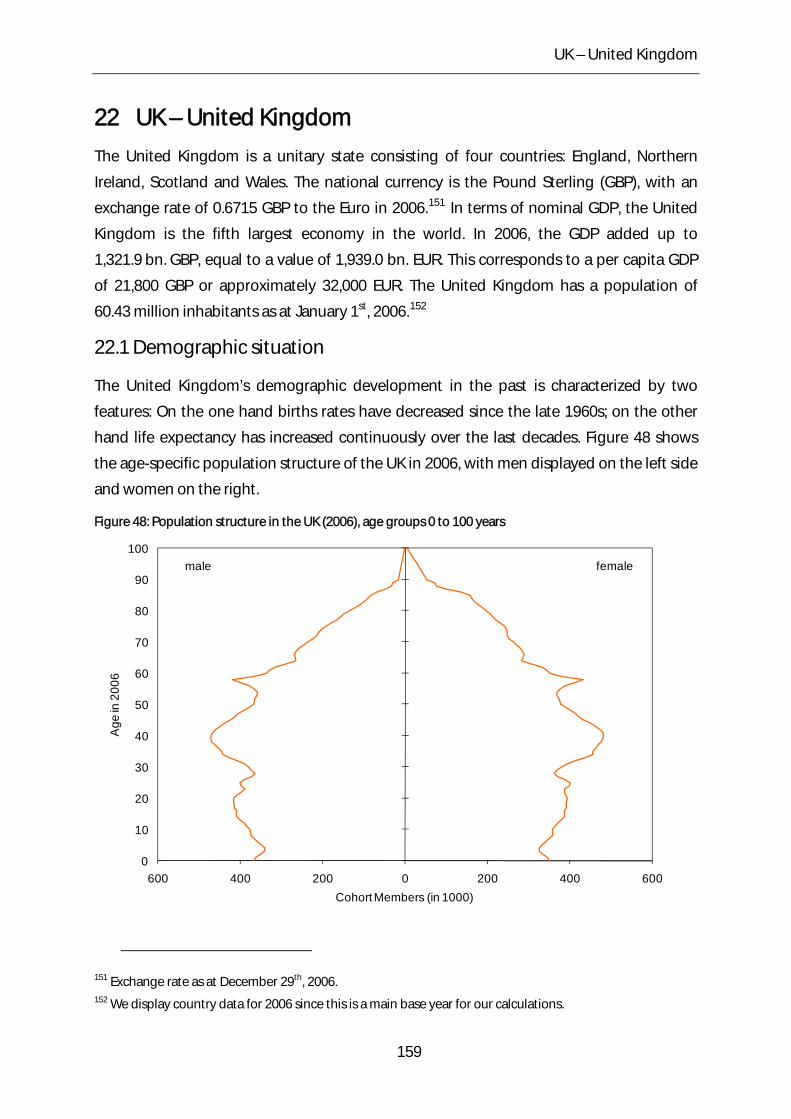
UK – United Kingdom
22 UK – United Kingdom
The United Kingdom is a unitary state consisting of four countries: England, Northern
Ireland, Scotland and Wales. The national currency is the Pound Sterling (GBP), with an
exchange rate of 0.6715 GBP to the Euro in 2006.151 In terms of nominal GDP, the United
Kingdom is the fifth largest economy in the world. In 2006, the GDP added up to
1,321.9 bn. GBP, equal to a value of 1,939.0 bn. EUR. This corresponds to a per capita GDP
of 21,800 GBP or approximately 32,000 EUR. The United Kingdom has a population of
60.43 million inhabitants as at January 1st, 2006.152
22.1 Demographic situation
The United Kingdom’s demographic development in the past is characterized by two
features: On the one hand births rates have decreased since the late 1960s; on the other
hand life expectancy has increased continuously over the last decades. Figure 48 shows
the age-specific population structure of the UK in 2006, with men displayed on the left side
and women on the right.
Figure 48: Population structure in the UK (2006), age groups 0 to 100 years
0
10
20
30
40
50
60
70
80
90
100
600 400 200 0 200 400 600
Age
in 2
006
Cohort Members (in 1000)
femalemale
151 Exchange rate as at December 29th, 2006. 152 We display country data for 2006 since this is a main base year for our calculations.
159
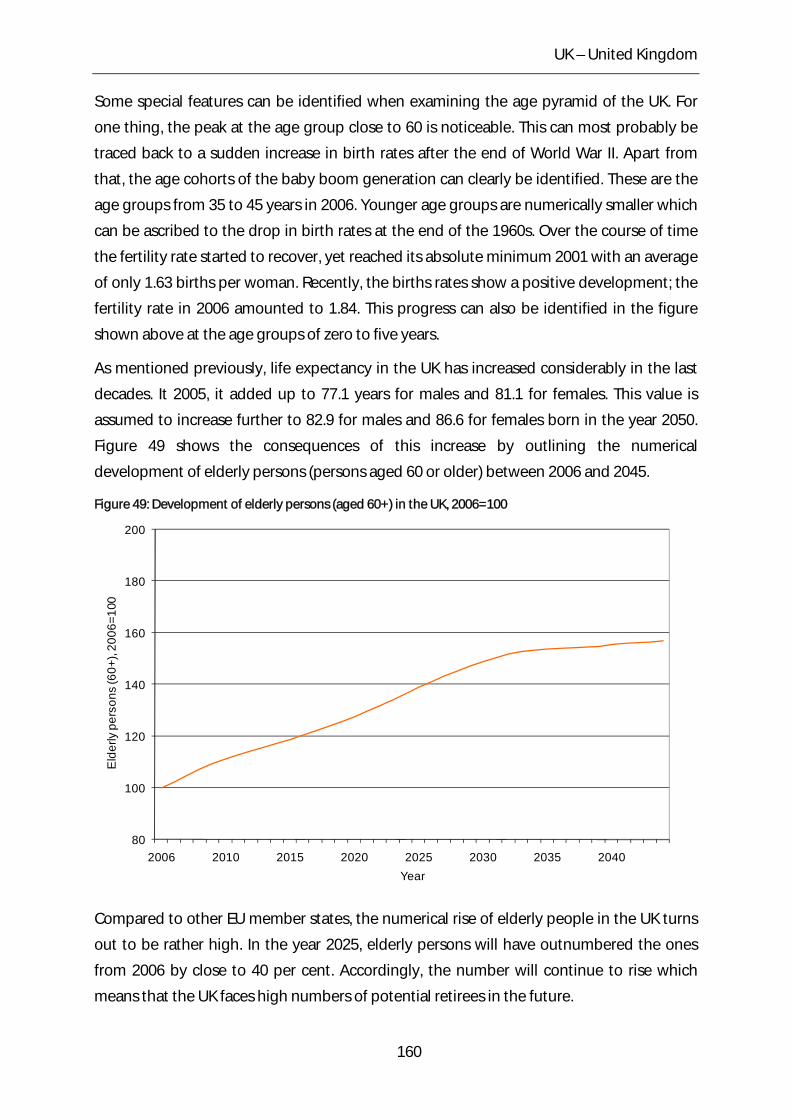
UK – United Kingdom
Some special features can be identified when examining the age pyramid of the UK. For
one thing, the peak at the age group close to 60 is noticeable. This can most probably be
traced back to a sudden increase in birth rates after the end of World War II. Apart from
that, the age cohorts of the baby boom generation can clearly be identified. These are the
age groups from 35 to 45 years in 2006. Younger age groups are numerically smaller which
can be ascribed to the drop in birth rates at the end of the 1960s. Over the course of time
the fertility rate started to recover, yet reached its absolute minimum 2001 with an average
of only 1.63 births per woman. Recently, the births rates show a positive development; the
fertility rate in 2006 amounted to 1.84. This progress can also be identified in the figure
shown above at the age groups of zero to five years.
As mentioned previously, life expectancy in the UK has increased considerably in the last
decades. It 2005, it added up to 77.1 years for males and 81.1 for females. This value is
assumed to increase further to 82.9 for males and 86.6 for females born in the year 2050.
Figure 49 shows the consequences of this increase by outlining the numerical
development of elderly persons (persons aged 60 or older) between 2006 and 2045.
Figure 49: Development of elderly persons (aged 60+) in the UK, 2006=100
80
100
120
140
160
180
200
2006 2010 2015 2020 2025 2030 2035 2040
Eld
erly
per
sons
(60+
), 20
06=1
00
Year
Compared to other EU member states, the numerical rise of elderly people in the UK turns
out to be rather high. In the year 2025, elderly persons will have outnumbered the ones
from 2006 by close to 40 per cent. Accordingly, the number will continue to rise which
means that the UK faces high numbers of potential retirees in the future.
160
UK – United Kingdom
22.2 General characteristics of the pension system
Britain features a rather complex pension system with elements of public and private
provision. The public scheme consists of two tiers, a flat-rate basic pension and an
earnings-related additional pension. It is possible to “contract out” of the earnings-related
pension into private pensions of different types.
To qualify for the basic state pensions, people need to pay social security contributions or
have credits for nine-tenths of their potential working lives (44 years). Persons who do not
meet these requirements will receive a reduced pension. The benefit value for the
earnings-related pension is calculated applying the average lifetime salary; earlier salaries
are uprated in line with general average earnings. After retirement, the pensions are price-
indexed. In 2003, the pension credit was introduced. Its target is to guarantee a pension
level above the basic state pension. Unlike the basic state pension, it is means-tested. 153
22.3 Recent reforms of the pension system
The UK pension system underwent various modifications in the last years. In 2003, the
pension credit was introduced which is an entitlement for people aged 60 and over,
replacing the former Minimum Income Guarantee (MIG). It guarantees everyone aged 60
and over a minimum pension. The last pension reform took place in 2007 when some
changes to the basic state pension were decided including:
• reducing the number of qualifying years needed for a full basic state pension to 30
for people who will reach state pension age on or after April 6th, 2010,
• any number of qualifying years will give entitlement to at least some basic state
pension,
• people who have fewer than 30 qualifying years will get 1/30 of full basic state
pension for each qualifying year they have,
• increasing basic state pension in line with earnings, rather than prices, which means
it should rise more quickly each year than it does now (not before 2012).
Furthermore, some changes to the earnings-related pension have been conducted and the
state pension age for women will increase from 60 to 65 so that it will be the same for both
men and women by 2020. This change will be phased in from 2010. For both men and
women retirement age is to rise further from 65 to 68 in stages between 2024 and 2046.
153 For a short summary of the UK pension system see OECD (2007), p. 198-201. European Commission (2007) contains a more detailed description (p. 361 et sqq.).
161
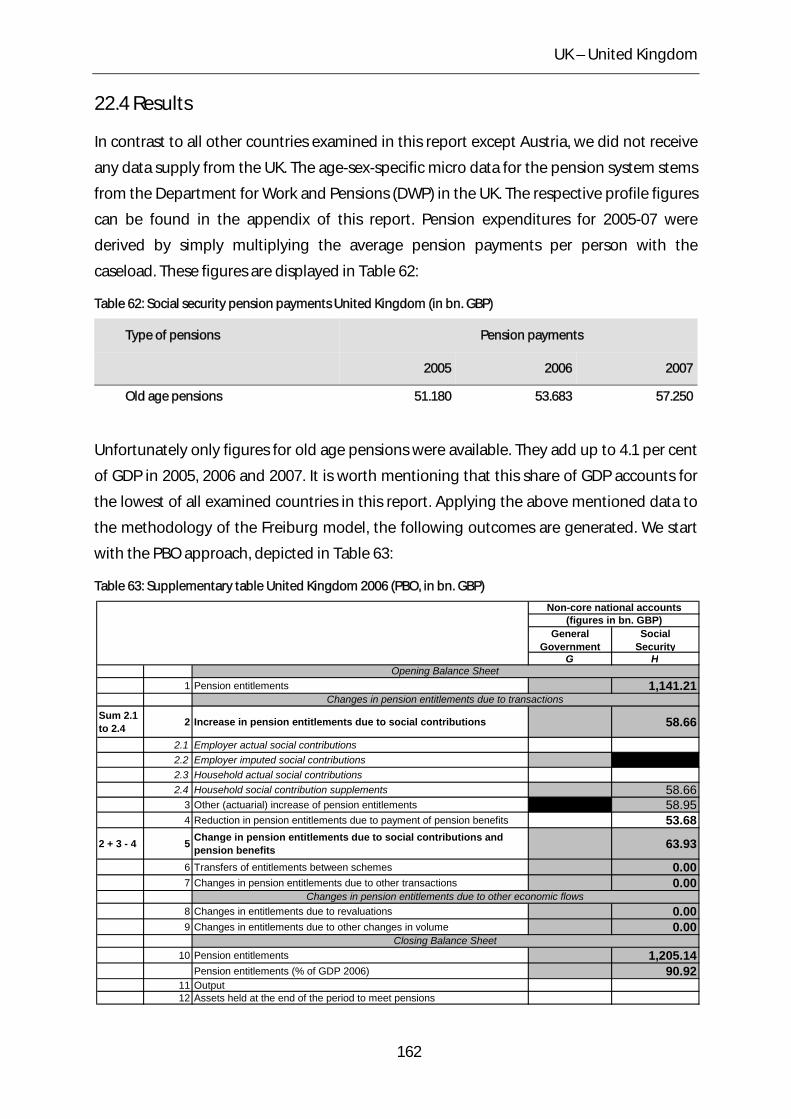
UK – United Kingdom
22.4 Results
In contrast to all other countries examined in this report except Austria, we did not receive
any data supply from the UK. The age-sex-specific micro data for the pension system stems
from the Department for Work and Pensions (DWP) in the UK. The respective profile figures
can be found in the appendix of this report. Pension expenditures for 2005-07 were
derived by simply multiplying the average pension payments per person with the
caseload. These figures are displayed in Table 62:
Table 62: Social security pension payments United Kingdom (in bn. GBP)
Type of pensions Pension payments
2005 2006 2007
Old age pensions 51.180 53.683 57.250
Unfortunately only figures for old age pensions were available. They add up to 4.1 per cent
of GDP in 2005, 2006 and 2007. It is worth mentioning that this share of GDP accounts for
the lowest of all examined countries in this report. Applying the above mentioned data to
the methodology of the Freiburg model, the following outcomes are generated. We start
with the PBO approach, depicted in Table 63:
Table 63: Supplementary table United Kingdom 2006 (PBO, in bn. GBP)
General Government
Social Security
G H
1 Pension entitlements 1,141.21
Sum 2.1 to 2.4 2 Increase in pension entitlements due to social contributions 58.66
2.1 Employer actual social contributions2.2 Employer imputed social contributions2.3 Household actual social contributions2.4 Household social contribution supplements 58.66
3 Other (actuarial) increase of pension entitlements 58.954 Reduction in pension entitlements due to payment of pension benefits 53.68
2 + 3 - 4 5 Change in pension entitlements due to social contributions and pension benefits 63.93
6 Transfers of entitlements between schemes 0.007 Changes in pension entitlements due to other transactions 0.00
8 Changes in entitlements due to revaluations 0.009 Changes in entitlements due to other changes in volume 0.00
10 Pension entitlements 1,205.14Pension entitlements (% of GDP 2006) 90.92
11 Output12 Assets held at the end of the period to meet pensions
Closing Balance Sheet
Non-core national accounts(figures in bn. GBP)
Changes in pension entitlements due to transactions
Changes in pension entitlements due to other economic flows
Opening Balance Sheet
162

UK – United Kingdom
163
Due to the fact that no actual social contributions were supplied, the supplementary table
does not show a complete picture of the social security pension. However, the opening
balance adds up to pension entitlements of 1,141.21 bn. GBP which are reduced by
pension benefits in 2006 to the amount of 53.68 bn. GBP. Entitlements at the end of 2006
add up to 1,205.14 bn. GBP, corresponding to 90.92 per cent of the GDP. As expected, this
value is the lowest of all examined countries due to the minor size of pension benefits. Due
to lack of data regarding age-sex-specific earnings during lifetime, it was not possible to
compute the ABO pension liabilities in an adequate way in the case of the UK. Therefore
the supplementary table for the ABO approach is not displayed here.
Cross-country comparison
23 Cross-country comparison
This chapter gives an overview of the pension liabilities of the 19 countries examined in
this report. The sum of liabilities accrued from the government employer pension scheme
(column G of the supplementary table) and the social security pension scheme (column H)
at the end of 2006 will be taken as a basis. To allow meaningful comparisons across the
countries examined, liabilities are related to countries’ respective GDP in 2006.
Furthermore, the main factors determining the level of pension liabilities will be indicated.
It must be emphasized in advance that the ranking of a certain country is not necessarily
connected to the financial shape of the country’s pension scheme. In other words: The
level of pension liabilities is not related to the sustainability of the pension scheme.154 Even
if a pension scheme features considerable high liabilities, these could possibly be
compensated by future contributors. But as future contributions are not taken into
account when estimating ADL, no statement can be made concerning sustainability or
necessary reforms of the pension system.
To assure comparability, all pension liabilities shown in this chapter have been calculated
on the same basis, which is PBO in our case. Figure 50 displays a cross-country comparison
of pension liabilities in 2006 related to the respective countries’ GDP. In case the country
features a government employer pension scheme and a social security pension scheme,
both schemes are added to a total of pension liabilities.
154 In general, a pension scheme is considered sustainable, if neither future contributions nor benefits have to be adjusted to generate financial balance, taking into account future demographic and economic circumstances. For a detailed description of fiscal sustainability, see Bonin (2001).
164
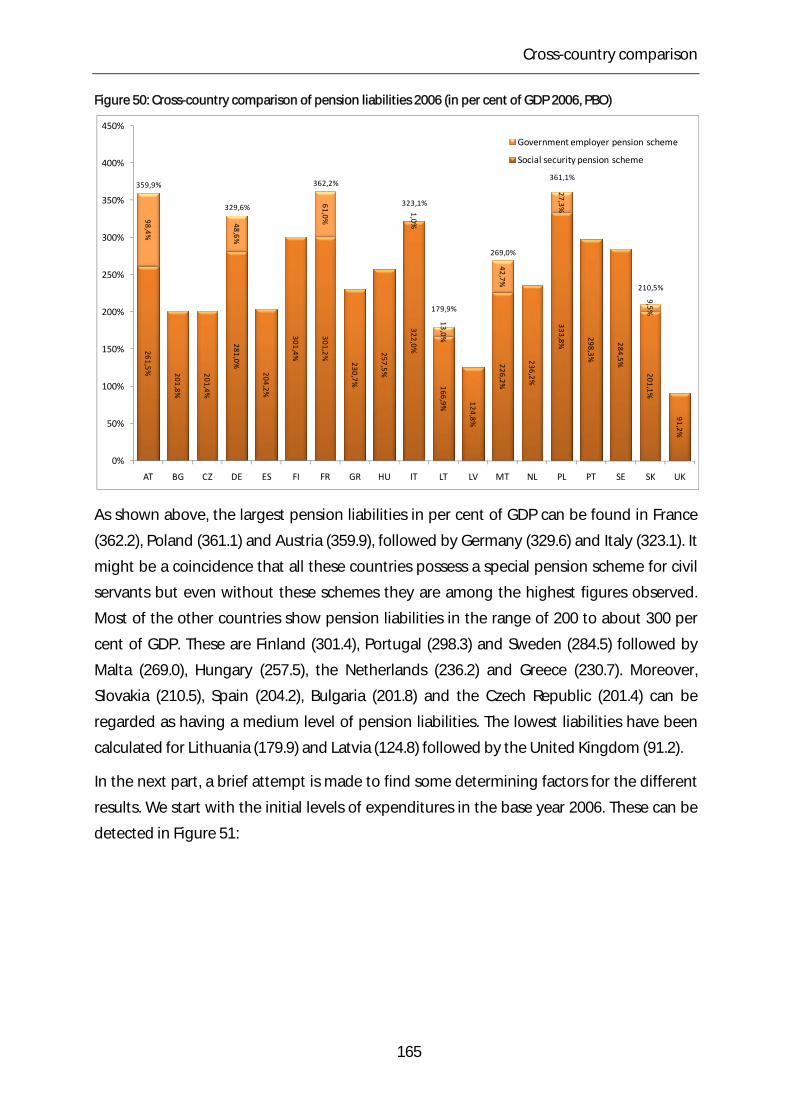
Cross-country comparison
Figure 50: Cross-country comparison of pension liabilities 2006 (in per cent of GDP 2006, PBO)
261,5% 201,8%
201,4%
281,0%
204,2%
301,4%
301,2%
230,7%
257,5%
322,0%
166,9% 124,8%
226,2%
236,2%
333,8%
298,3%
284,5%
201,1%
91,2%
98,4%
48,6%
61,0%
1,0%
13,0%
42,7%
27,3%
9,5%
359,9%
329,6%
362,2%
323,1%
179,9%
269,0%
361,1%
210,5%
0%
50%
100%
150%
200%
250%
300%
350%
400%
450%
AT BG CZ DE ES FI FR GR HU IT LT LV MT NL PL PT SE SK UK
Government employer pension scheme
Social security pension scheme
As shown above, the largest pension liabilities in per cent of GDP can be found in France
(362.2), Poland (361.1) and Austria (359.9), followed by Germany (329.6) and Italy (323.1). It
might be a coincidence that all these countries possess a special pension scheme for civil
servants but even without these schemes they are among the highest figures observed.
Most of the other countries show pension liabilities in the range of 200 to about 300 per
cent of GDP. These are Finland (301.4), Portugal (298.3) and Sweden (284.5) followed by
Malta (269.0), Hungary (257.5), the Netherlands (236.2) and Greece (230.7). Moreover,
Slovakia (210.5), Spain (204.2), Bulgaria (201.8) and the Czech Republic (201.4) can be
regarded as having a medium level of pension liabilities. The lowest liabilities have been
calculated for Lithuania (179.9) and Latvia (124.8) followed by the United Kingdom (91.2).
In the next part, a brief attempt is made to find some determining factors for the different
results. We start with the initial levels of expenditures in the base year 2006. These can be
detected in Figure 51:
165
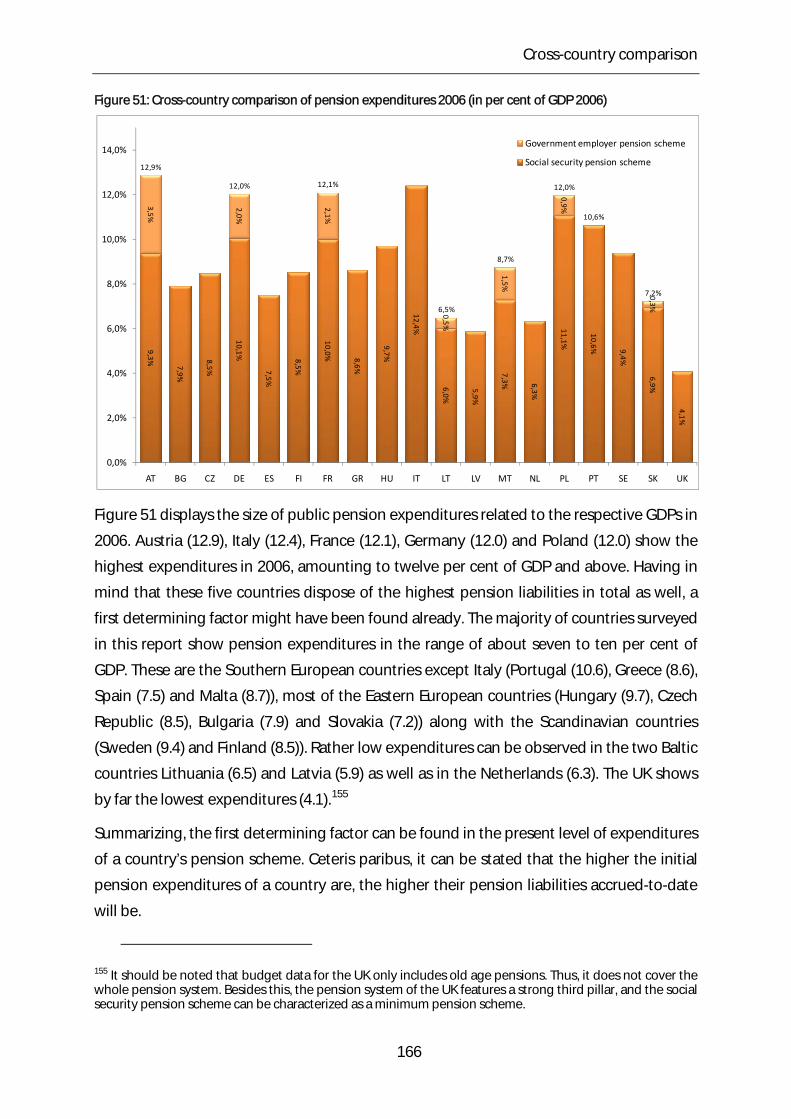
Cross-country comparison
Figure 51: Cross-country comparison of pension expenditures 2006 (in per cent of GDP 2006)
9,3%
7,9%
8,5%
10,1%
7,5%
8,5%
10,0% 8,6%
9,7%
12,4%
6,0%
5,9%
7,3% 6,3%
11,1%
10,6% 9,4%
6,9%
4,1%
3,5%
2,0%
2,1%
0,5%
1,5%
0,9%
0,3%
12,9%
12,0% 12,1%
6,5%
8,7%
12,0%
10,6%
7,2%
0,0%
2,0%
4,0%
6,0%
8,0%
10,0%
12,0%
14,0%
AT BG CZ DE ES FI FR GR HU IT LT LV MT NL PL PT SE SK UK
Government employer pension scheme
Social security pension scheme
Figure 51 displays the size of public pension expenditures related to the respective GDPs in
2006. Austria (12.9), Italy (12.4), France (12.1), Germany (12.0) and Poland (12.0) show the
highest expenditures in 2006, amounting to twelve per cent of GDP and above. Having in
mind that these five countries dispose of the highest pension liabilities in total as well, a
first determining factor might have been found already. The majority of countries surveyed
in this report show pension expenditures in the range of about seven to ten per cent of
GDP. These are the Southern European countries except Italy (Portugal (10.6), Greece (8.6),
Spain (7.5) and Malta (8.7)), most of the Eastern European countries (Hungary (9.7), Czech
Republic (8.5), Bulgaria (7.9) and Slovakia (7.2)) along with the Scandinavian countries
(Sweden (9.4) and Finland (8.5)). Rather low expenditures can be observed in the two Baltic
countries Lithuania (6.5) and Latvia (5.9) as well as in the Netherlands (6.3). The UK shows
by far the lowest expenditures (4.1).155
Summarizing, the first determining factor can be found in the present level of expenditures
of a country’s pension scheme. Ceteris paribus, it can be stated that the higher the initial
pension expenditures of a country are, the higher their pension liabilities accrued-to-date
will be.
155 It should be noted that budget data for the UK only includes old age pensions. Thus, it does not cover the whole pension system. Besides this, the pension system of the UK features a strong third pillar, and the social security pension scheme can be characterized as a minimum pension scheme.
166
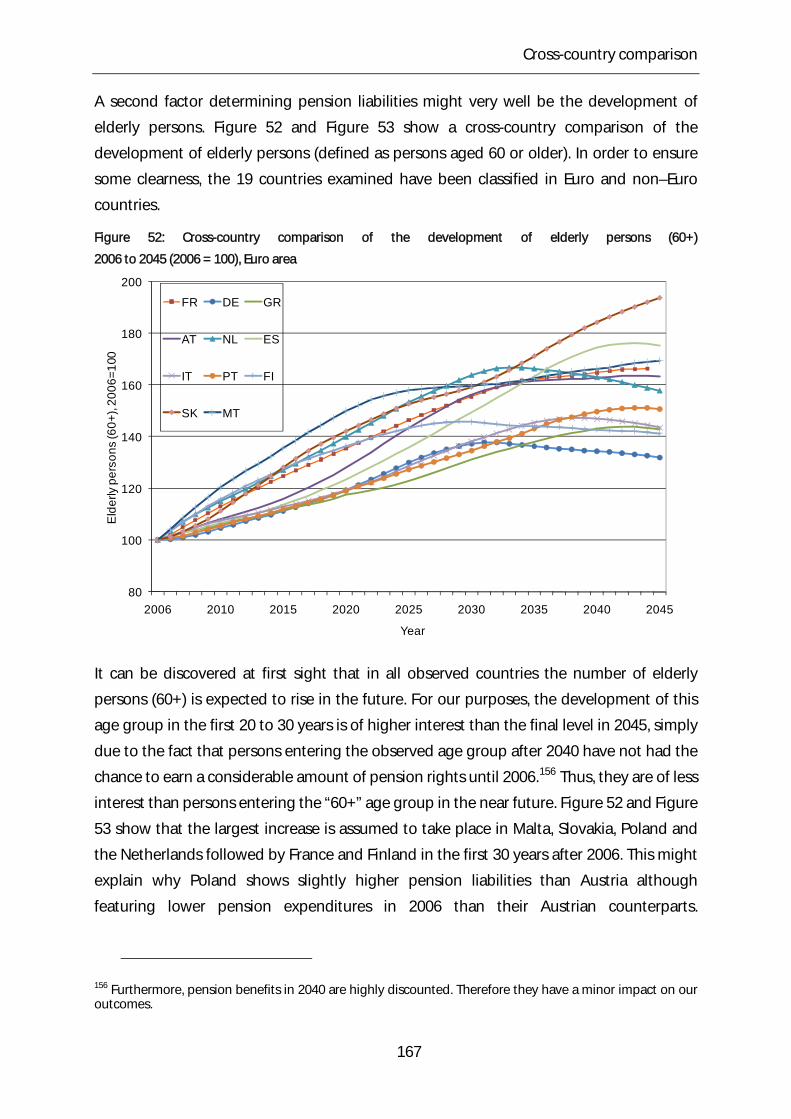
Cross-country comparison
A second factor determining pension liabilities might very well be the development of
elderly persons. Figure 52 and Figure 53 show a cross-country comparison of the
development of elderly persons (defined as persons aged 60 or older). In order to ensure
some clearness, the 19 countries examined have been classified in Euro and non–Euro
countries.
Figure 52: Cross-country comparison of the development of elderly persons (60+)
2006 to 2045 (2006 = 100), Euro area
80
100
120
140
160
180
200
2006 2010 2015 2020 2025 2030 2035 2040 2045
Eld
erly
per
sons
(60+
), 20
06=1
00
Year
FR DE GR
AT NL ES
IT PT FI
SK MT
It can be discovered at first sight that in all observed countries the number of elderly
persons (60+) is expected to rise in the future. For our purposes, the development of this
age group in the first 20 to 30 years is of higher interest than the final level in 2045, simply
due to the fact that persons entering the observed age group after 2040 have not had the
chance to earn a considerable amount of pension rights until 2006.156 Thus, they are of less
interest than persons entering the “60+” age group in the near future. Figure 52 and Figure
53 show that the largest increase is assumed to take place in Malta, Slovakia, Poland and
the Netherlands followed by France and Finland in the first 30 years after 2006. This might
explain why Poland shows slightly higher pension liabilities than Austria although
featuring lower pension expenditures in 2006 than their Austrian counterparts.
156 Furthermore, pension benefits in 2040 are highly discounted. Therefore they have a minor impact on our outcomes.
167
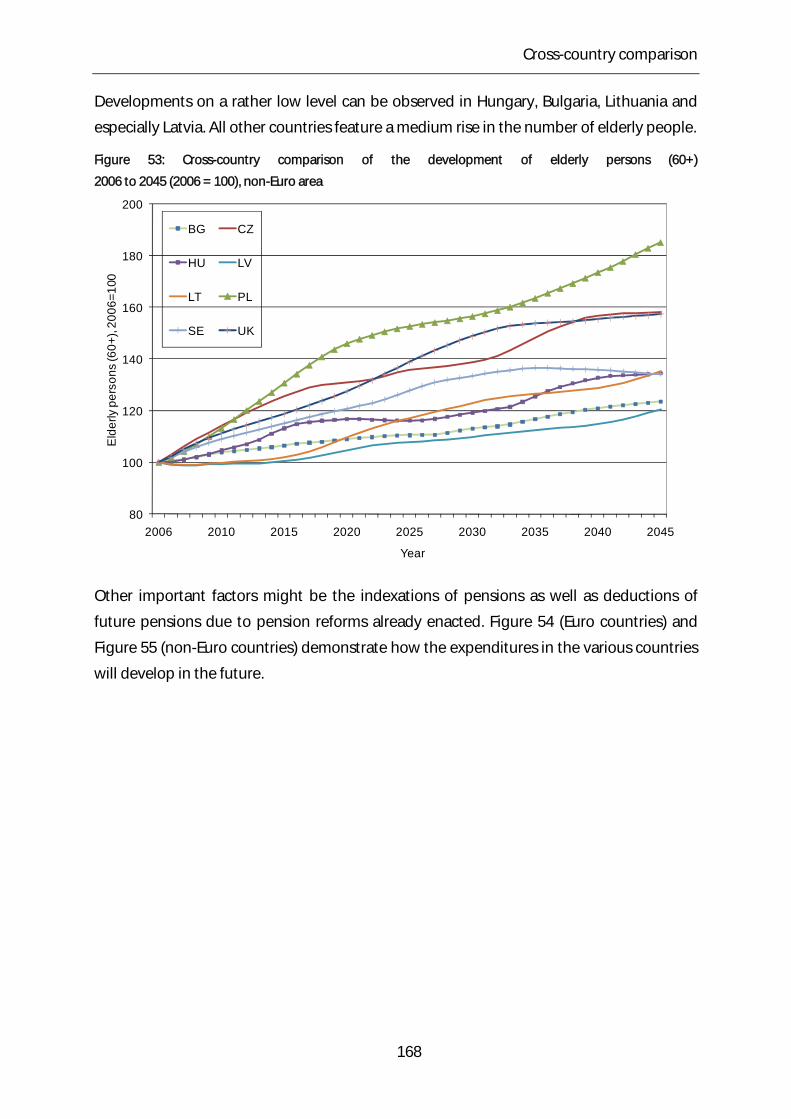
Cross-country comparison
Developments on a rather low level can be observed in Hungary, Bulgaria, Lithuania and
especially Latvia. All other countries feature a medium rise in the number of elderly people.
Figure 53: Cross-country comparison of the development of elderly persons (60+)
2006 to 2045 (2006 = 100), non-Euro area
80
100
120
140
160
180
200
2006 2010 2015 2020 2025 2030 2035 2040 2045
Eld
erly
per
sons
(60+
), 20
06=1
00
Year
BG CZ
HU LV
LT PL
SE UK
Other important factors might be the indexations of pensions as well as deductions of
future pensions due to pension reforms already enacted. Figure 54 (Euro countries) and
Figure 55 (non-Euro countries) demonstrate how the expenditures in the various countries
will develop in the future.
168
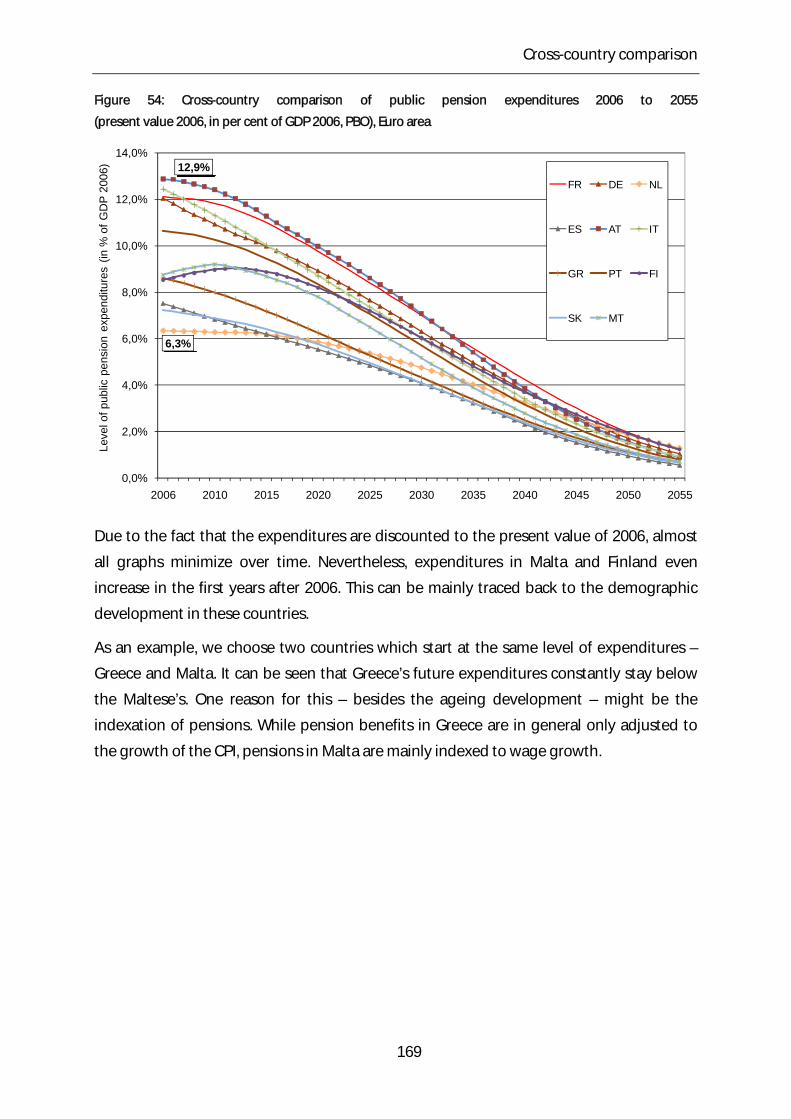
Cross-country comparison
Figure 54: Cross-country comparison of public pension expenditures 2006 to 2055
(present value 2006, in per cent of GDP 2006, PBO), Euro area
12,9%
6,3%
0,0%
2,0%
4,0%
6,0%
8,0%
10,0%
12,0%
14,0%
2006 2010 2015 2020 2025 2030 2035 2040 2045 2050 2055
Leve
l of p
ublic
pen
sion
exp
endi
ture
s (in
% o
f GD
P 20
06)
ddd
FR DE NL
ES AT IT
GR PT FI
SK MT
Due to the fact that the expenditures are discounted to the present value of 2006, almost
all graphs minimize over time. Nevertheless, expenditures in Malta and Finland even
increase in the first years after 2006. This can be mainly traced back to the demographic
development in these countries.
As an example, we choose two countries which start at the same level of expenditures –
Greece and Malta. It can be seen that Greece’s future expenditures constantly stay below
the Maltese’s. One reason for this – besides the ageing development – might be the
indexation of pensions. While pension benefits in Greece are in general only adjusted to
the growth of the CPI, pensions in Malta are mainly indexed to wage growth.
169
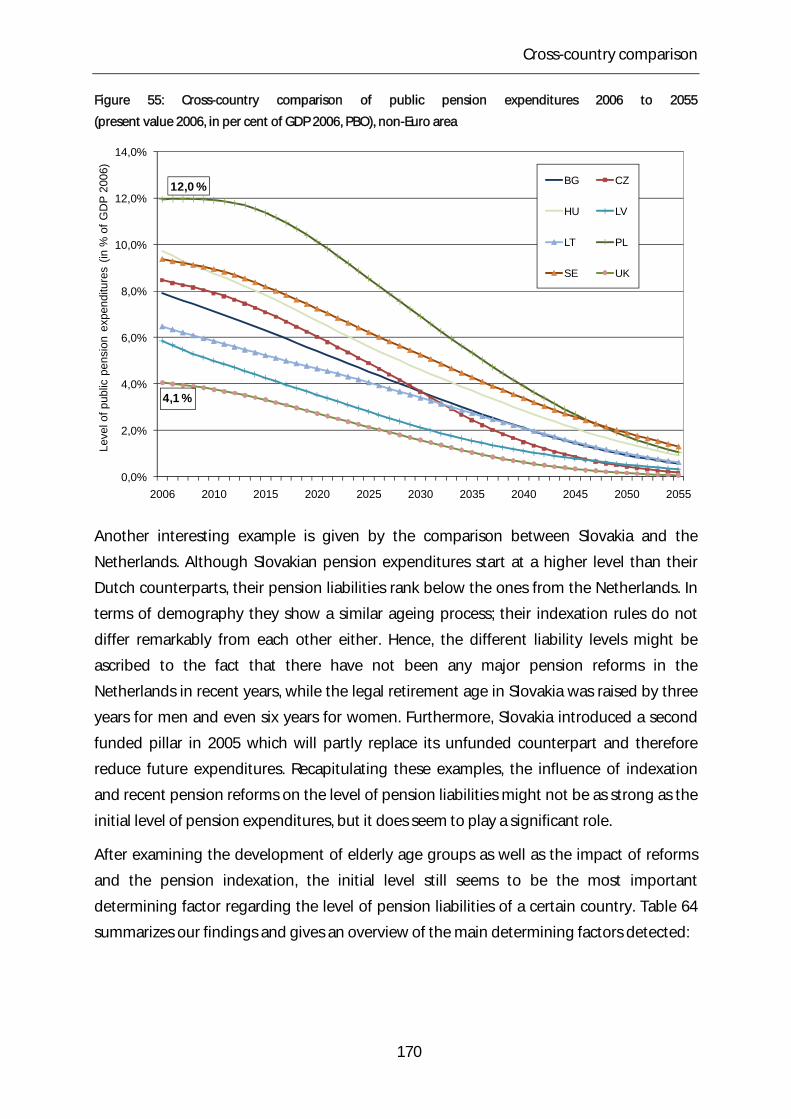
Cross-country comparison
Figure 55: Cross-country comparison of public pension expenditures 2006 to 2055
(present value 2006, in per cent of GDP 2006, PBO), non-Euro area
0,0%
2,0%
4,0%
6,0%
8,0%
10,0%
12,0%
14,0%
2006 2010 2015 2020 2025 2030 2035 2040 2045 2050 2055
Leve
l of p
ublic
pen
sion
exp
endi
ture
s (in
% o
f GD
P 20
06)
ddd
BG CZ
HU LV
LT PL
SE UK
12,0 %
4,1 %
Another interesting example is given by the comparison between Slovakia and the
Netherlands. Although Slovakian pension expenditures start at a higher level than their
Dutch counterparts, their pension liabilities rank below the ones from the Netherlands. In
terms of demography they show a similar ageing process; their indexation rules do not
differ remarkably from each other either. Hence, the different liability levels might be
ascribed to the fact that there have not been any major pension reforms in the
Netherlands in recent years, while the legal retirement age in Slovakia was raised by three
years for men and even six years for women. Furthermore, Slovakia introduced a second
funded pillar in 2005 which will partly replace its unfunded counterpart and therefore
reduce future expenditures. Recapitulating these examples, the influence of indexation
and recent pension reforms on the level of pension liabilities might not be as strong as the
initial level of pension expenditures, but it does seem to play a significant role.
After examining the development of elderly age groups as well as the impact of reforms
and the pension indexation, the initial level still seems to be the most important
determining factor regarding the level of pension liabilities of a certain country. Table 64
summarizes our findings and gives an overview of the main determining factors detected:
170
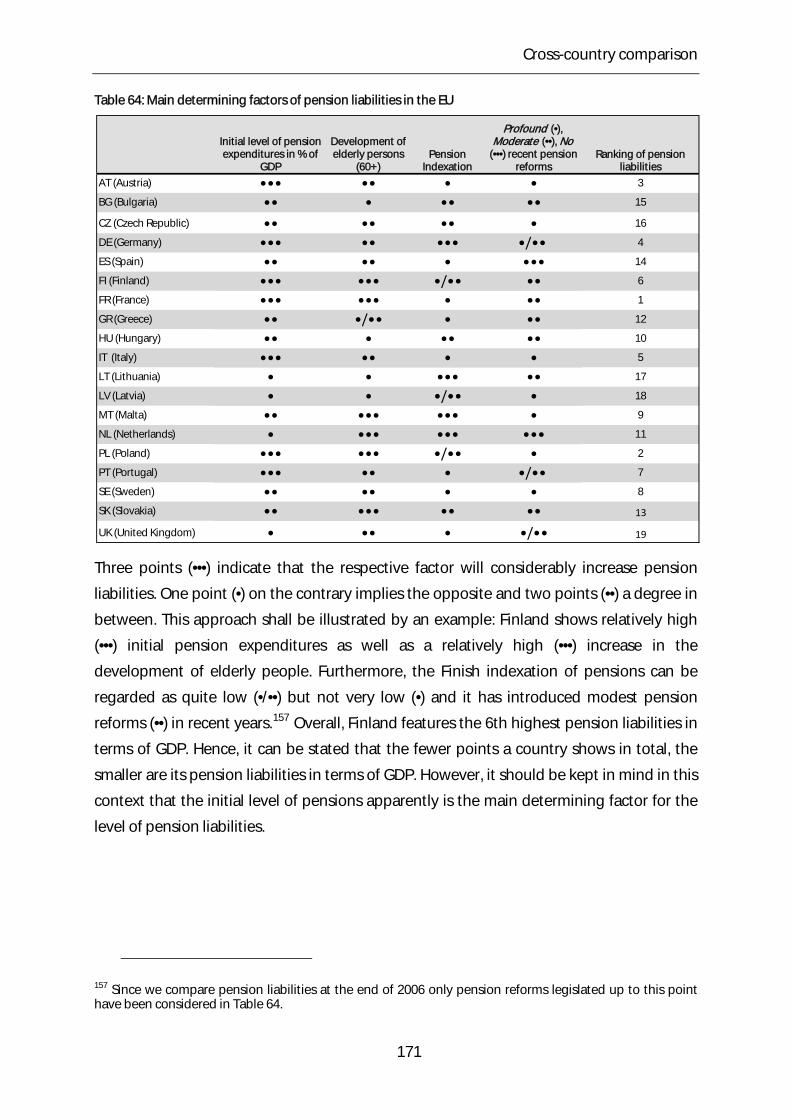
Cross-country comparison
Table 64: Main determining factors of pension liabilities in the EU
AT (Austria) ••• •• • • 3
BG (Bulgaria) •• • •• •• 15
CZ (Czech Republic) •• •• •• • 16
DE (Germany) ••• •• ••• •/•• 4
ES (Spain) •• •• • ••• 14
FI (Finland) ••• ••• •/•• •• 6
FR (France) ••• ••• • •• 1
GR (Greece) •• •/•• • •• 12
HU (Hungary) •• • •• •• 10
IT (Italy) ••• •• • • 5
LT (Lithuania) • • ••• •• 17
LV (Latvia) • • •/•• • 18
MT (Malta) •• ••• ••• • 9
NL (Netherlands) • ••• ••• ••• 11
PL (Poland) ••• ••• •/•• • 2
PT (Portugal) ••• •• • •/•• 7
SE (Sweden) •• •• • • 8
SK (Slovakia) •• ••• •• •• 13
UK (United Kingdom) • •• • •/•• 19
Development of elderly persons
(60+)Ranking of pension
liabilities
Initial level of pension expenditures in % of
GDP
Profound (•), Moderate (••), No
(•••) recent pension reforms
Pension Indexation
Three points (•••) indicate that the respective factor will considerably increase pension
liabilities. One point (•) on the contrary implies the opposite and two points (••) a degree in
between. This approach shall be illustrated by an example: Finland shows relatively high
(•••) initial pension expenditures as well as a relatively high (•••) increase in the
development of elderly people. Furthermore, the Finish indexation of pensions can be
regarded as quite low (•/••) but not very low (•) and it has introduced modest pension
reforms (••) in recent years.157 Overall, Finland features the 6th highest pension liabilities in
terms of GDP. Hence, it can be stated that the fewer points a country shows in total, the
smaller are its pension liabilities in terms of GDP. However, it should be kept in mind in this
context that the initial level of pensions apparently is the main determining factor for the
level of pension liabilities.
171
157 Since we compare pension liabilities at the end of 2006 only pension reforms legislated up to this point have been considered in Table 64.
Conclusion and Outlook
24 Conclusion and outlook
The aim of this study was to calculate pension liabilities of 19 EU member countries. Eleven
of these belong to the Euro area and the remaining eight do not (yet).
After a short introduction, in chapter 2 we provided a definition of implicit pension debt
and explained the methodology which was developed at the RCG in Freiburg to calculate
the accrued-to-date liabilities of a pension scheme (referred to as the Freiburg model).
Chapter 3 gave an overview of the general assumptions used in this report. Furthermore,
the data regarding population and age-sex-specific pension benefits was described,
showing pension profiles for existing and new male retirees in France as an example.158
In the following chapters 4 to 22 our findings for the 19 countries examined in this report
were presented. Certain countries feature a general government employer pension
scheme as well as a social security pension scheme (e.g. France, Germany or Poland),
others only show a social security pension scheme – in some cases civil servants are
integrated in the general social security (e.g. Czech Republic, Hungary or Sweden); in other
cases pension schemes may not be classified in non-core national accounts (e.g.
Netherlands or Spain). However, it must be stressed that in any case we had to rely to some
degree on the information and data given by the members of the Contact Group.
The country chapters are all structured in the same way; first the demographic features
were described, afterwards the characteristics of the pension system and recent reforms
were specified. Each chapter finished with a presentation of our findings, shown in the
supplementary table which had been developed by the Task Force (see Box 1). Some cells
of the supplementary table were not completed, mainly because we assumed wage
growth and discount rate to be constant over time. However, we did not change the
format of the table due to recognition issues.
In chapter 23 we compared our findings from the particular country chapters. It turned out
that the main determining factor for the level of public pension liabilities is the initial level
of pension expenditures in the base year. However, there are certainly more factors which
have an impact on the level of pension liabilities. One important determinant is the
development of elderly persons which defines the number of potential future retirees. This
figure varies considerably between the countries examined. Other relevant factors are
given by the level of pension indexation and the dimension of recent pension reforms. In
158 The pension profiles of all countries examined can be found in the appendix of this report.
172
Conclusion and Outlook
173
summary it can be said that the ranking of pension liabilities of the various countries
follows the ranking of pension expenditures quite closely. Thus, it can be stated that the
initial level of pension expenditures has a strong impact on the size of pension liabilities.
At this point we would like to draw the reader’s attention once more to an important item:
The reader shall not judge either the need for reforming a certain pension scheme or the
impact of a pension reform already enacted by the level of its accrued-to-date liabilities.
Thus, the extent of public pension liabilities of a certain country is not connected to some
kind of good or bad state of affairs. This is due to two aspects: The first one is the fact that
only those pension rights are taken into account which have been earned up to today.
Using a broader concept of liabilities, one could for instance choose to estimate open
system liabilities which include the future pension rights earned by current and future
workers as well.159 Secondly, the absence of contributions makes it impossible to offer a
statement regarding the sustainability of a pension scheme. Imagine for instance a country
like Ireland with high fertility rates. Although it might possibly feature a pension scheme
showing considerable accrued-to date liabilities, it does not mean at all that these cannot
be balanced by future contributions. In general, accrued-to-date liabilities only take into
account a fraction of the future demographic development which is the numerical change
of retirees; the evolution of future contributors is fully ignored. Generational accounting is
a concept which is able to calculate open system liabilities, and confront them with future
contributions. In fact, it has been applied to this purpose for several times.160 Therefore,
applying this methodology to measure fiscal sustainability of the countries’ pension
schemes examined would expand the perspective considerably.
However, the authors are fully aware of the fact that in this report the focus did not lie on
the sustainability of the various pension schemes but rather on a statistical approach to
measure pension entitlements of households up to now. This report showed that the
Freiburg model developed by the RCG represents a valuable instrument to calculate these
entitlements for various countries on a relatively small data base.
159 See chapter 2.1 of this survey. 160 See for instance Ehrentraut and Heidler (2008), European Commission (1999) or Heidler (2008).
References
References
Auerbach, A., J. Gokhale and L. Kotlikoff (1994), Generational accounts: a meaningful way
to evaluate fiscal policy, The Journal of Economic Perspectives, 8 (1), 73-94.
Auerbach, A., J. Gokhale and L. Kotlikoff (1992), Social security and medicare policy from
the perspective of generational accounting, Tax policy and the economy, 6, 129-145.
Auerbach, A., J. Gokhale and L. Kotlikoff (1991), Generational accounts: a meaningful
alternative to deficit accounting, Tax policy and the economy, 5, 55-110.
Bank of Italy (2006), Survey on household income and wealth (SHIW) 2006.
Blake, D. (2006), Pension economics, Wiley, Chichester.
Bonin, H. (2001), Generational accounting: Theory and application, Berlin.
Campos M. M. and M. C. Pereira (2008), Impact of the recent reform of the Portuguese
public employees’ pension system, Economic Bulletin, Banco de Portugal, 14(2).
Chlón-Dominczak, A. and M. Góra (2006), The NDC system in Poland: Assessment after five
years; Holzmann, R. and E. Palmer (eds.), Pension reform – issues and prospects for non-
financial defined contribution (NDC) schemes, World Bank, Washington, D.C., 425-447.
Department for Work and Pensions (2008), DWPs tabulation tool,
http://83.244.183.180/100pc/sp/tabtool_sp.html, December 16th, 2008.
Ehrentraut, O. and M. Heidler (2008), Zur nachhaltigen Finanzierung der GRV: Der Beitrag
der Altersgrenzenanhebung im Rentenreformprozess, Perspektiven der Wirtschaftspolitik,
9(4), 424-445.
European Central Bank/Eurostat Task Force (2008), Final report of the Eurostat/ECB Task
Force on the statistical measurement of the assets and liabilities of pension schemes in
general government to the CMFB, Luxembourg.
European Commission (1999), Generational accounting in Europe, European Economy,
Reports and Studies, 6.
European Commission (2007), Pension schemes and projection models in EU-25 member
states, European Economy, Occasional Papers, 35.
Franco, D. (1995), Pension liabilities – their use and misuse in the assessment of fiscal
policies, Economic Papers, European Commission, 110.
174
References
Franco, D. and N. Sartor (2006), NDCs in Italy: Unsatisfactory present, uncertain future;
Holzmann, R. and E. Palmer (eds.), Pension reform – issues and prospects for non-financial
defined contribution (NDC) schemes, World Bank, Washington, D.C., 467-492.
Hauptverband der österreichischen Sozialversicherungsträger (2008),
Pensionsversicherung – Jahresstatistik 2006, Vienna.
Heidler, M., B. Raffelhueschen and O. Weddige (2008), Final report of the statistical
measurement of the liabilities of pension schemes in general government, survey by order
of the European Central Bank (ECB), Freiburg.
Heidler, M. (2008), Reformen der Gesetzlichen Rentenversicherung: Politisches Risiko und
intergenerative Umverteilung, mimeo.
Holzmann, R., R. Palacios and A. Zviniene (2004), Implicit pension debt: issues,
measurement and scope in international perspective, Social Protection Discussion Paper
Series, No. 0403.
Könberg, B., E. Palmer and A. Sundén (2006), The NDC reform in Sweden: The 1994
legislation to the present; Holzmann, R. and E. Palmer (eds.), Pension reform – issues and
prospects for non-financial defined contribution (NDC) schemes, World Bank, Washington,
D.C., 449-466.
Lassila, J. and T. Valkonen (2006), The Finnish pension reform of 2005, The Research
Institute of the Finnish Economy, Discussion Paper No. 1000.
Ministry of Labour and Social Affairs (2008), Update of the Spanish pensions reform – new
law on social security measures (December 2007),
http://ec.europa.eu/employment_social/spsi/docs/social_inclusion/2006/nap/spain_updat
e_en.pdf.
OECD (2007), Pensions at a glance: Public policies across OECD countries, OECD
Publications, Paris.
Palmer, E., S. Stabina, I. Svensson and I. Vanovska (2006), NDC strategy in Latvia:
Implementation and prospects for the future; Holzmann, R. and E. Palmer (eds.), Pension
reform – issues and prospects for non-financial defined contribution (NDC) schemes, World
Bank, Washington, D.C., 397-424.
Pflaumer, P. (1988), Methoden der Bevölkerungsvorausschätzung unter besonderer
Berücksichtigung der Unsicherheit, Volkswirtschaftliche Schriften, Vol. 377, Berlin.
175

References
176
Raffelhueschen, B. (1999), Generational accounting in Europe, The American Economic
Review, Papers and Proceedings, 89(2), 167-170.

Appendix
Appendix
Supplementary tables 2007
177
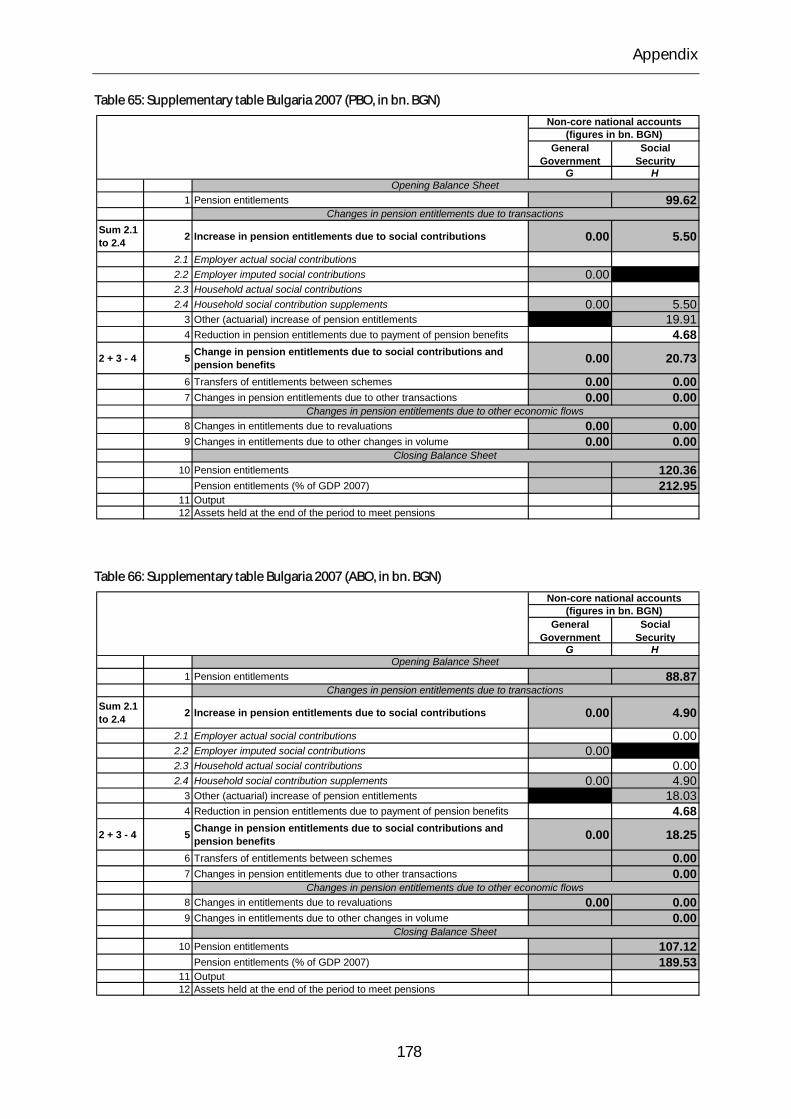
Appendix
Table 65: Supplementary table Bulgaria 2007 (PBO, in bn. BGN)
General Government
Social Security
G H
1 Pension entitlements 99.62
Sum 2.1 to 2.4 2 Increase in pension entitlements due to social contributions 0.00 5.50
2.1 Employer actual social contributions2.2 Employer imputed social contributions 0.002.3 Household actual social contributions2.4 Household social contribution supplements 0.00 5.50
3 Other (actuarial) increase of pension entitlements 19.914 Reduction in pension entitlements due to payment of pension benefits 4.68
2 + 3 - 4 5 Change in pension entitlements due to social contributions and pension benefits 0.00 20.73
6 Transfers of entitlements between schemes 0.00 0.007 Changes in pension entitlements due to other transactions 0.00 0.00
8 Changes in entitlements due to revaluations 0.00 0.009 Changes in entitlements due to other changes in volume 0.00 0.00
10 Pension entitlements 120.36Pension entitlements (% of GDP 2007) 212.95
11 Output12 Assets held at the end of the period to meet pensions
Closing Balance Sheet
Non-core national accounts(figures in bn. BGN)
Changes in pension entitlements due to transactions
Changes in pension entitlements due to other economic flows
Opening Balance Sheet
Table 66: Supplementary table Bulgaria 2007 (ABO, in bn. BGN)
General Government
Social Security
G H
1 Pension entitlements 88.87
Sum 2.1 to 2.4 2 Increase in pension entitlements due to social contributions 0.00 4.90
2.1 Employer actual social contributions 0.002.2 Employer imputed social contributions 0.002.3 Household actual social contributions 0.002.4 Household social contribution supplements 0.00 4.90
3 Other (actuarial) increase of pension entitlements 18.034 Reduction in pension entitlements due to payment of pension benefits 4.68
2 + 3 - 4 5 Change in pension entitlements due to social contributions and pension benefits 0.00 18.25
6 Transfers of entitlements between schemes 0.007 Changes in pension entitlements due to other transactions 0.00
8 Changes in entitlements due to revaluations 0.00 0.009 Changes in entitlements due to other changes in volume 0.00
10 Pension entitlements 107.12Pension entitlements (% of GDP 2007) 189.53
11 Output12 Assets held at the end of the period to meet pensions
Closing Balance Sheet
Non-core national accounts(figures in bn. BGN)
Changes in pension entitlements due to transactions
Changes in pension entitlements due to other economic flows
Opening Balance Sheet
178

Appendix
Table 67: Supplementary table Germany 2007 (PBO, in bn. EUR)
General Government
Social Security
G H
1 Pension entitlements 1,129.18 6,522.94
Sum 2.1 to 2.4 2 Increase in pension entitlements due to social contributions 51.17 489.27
2.1 Employer actual social contributions 0.00 78.212.2 Employer imputed social contributions -5.412.3 Household actual social contributions 0.00 84.892.4 Household social contribution supplements 56.58 326.17
3 Other (actuarial) increase of pension entitlements -75.234 Reduction in pension entitlements due to payment of pension benefits 46.52 234.87
2 + 3 - 4 5 Change in pension entitlements due to social contributions and pension benefits 4.65 179.17
6 Transfers of entitlements between schemes 0.00 0.007 Changes in pension entitlements due to other transactions 0.00 -178.19
8 Changes in entitlements due to revaluations 0.00 0.009 Changes in entitlements due to other changes in volume 0.00 0.00
10 Pension entitlements 1,133.83 6,523.92Pension entitlements (% of GDP 2007) 46.80 269.20
11 Output12 Assets held at the end of the period to meet pensions
Closing Balance Sheet
Non-core national accounts(figures in bn. EUR)
Changes in pension entitlements due to transactions
Changes in pension entitlements due to other economic flows
Opening Balance Sheet
Table 68: Supplementary table Germany 2007 (ABO, in bn. EUR)
General Government
Social Security
G H
1 Pension entitlements 1012.54 5,907.65
Sum 2.1 to 2.4 2 Increase in pension entitlements due to social contributions 51.69 458.93
2.1 Employer actual social contributions 0.00 78.212.2 Employer imputed social contributions 0.942.3 Household actual social contributions 0.00 84.892.4 Household social contribution supplements 50.76 295.83
3 Other (actuarial) increase of pension entitlements -68.174 Reduction in pension entitlements due to payment of pension benefits 46.52 234.87
2 + 3 - 4 5 Change in pension entitlements due to social contributions and pension benefits 5.17 155.89
6 Transfers of entitlements between schemes 0.00 0.007 Changes in pension entitlements due to other transactions 0.00 -138.16
8 Changes in entitlements due to revaluations 0.00 0.009 Changes in entitlements due to other changes in volume 0.00 0.00
10 Pension entitlements 1017.72 5,925.38Pension entitlements (% of GDP 2007) 42.00 244.60
11 Output12 Assets held at the end of the period to meet pensions
Closing Balance Sheet
Non-core national accounts(figures in bn. EUR)
Changes in pension entitlements due to transactions
Changes in pension entitlements due to other economic flows
Opening Balance Sheet
179

Appendix
Table 69: Supplementary table Spain 2007 (PBO, in bn. EUR)
General Government
Social Security
G H
1 Pension entitlements 2,006.01
Sum 2.1 to 2.4 2 Increase in pension entitlements due to social contributions 104.53
2.1 Employer actual social contributions2.2 Employer imputed social contributions2.3 Household actual social contributions2.4 Household social contribution supplements 104.53
3 Other (actuarial) increase of pension entitlements 144.534 Reduction in pension entitlements due to payment of pension benefits 79.81
2 + 3 - 4 5 Change in pension entitlements due to social contributions and pension benefits 169.26
6 Transfers of entitlements between schemes 0.007 Changes in pension entitlements due to other transactions 0.00
8 Changes in entitlements due to revaluations 0.009 Changes in entitlements due to other changes in volume 0.00
10 Pension entitlements 2,175.28Pension entitlements (% of GDP 2007) 207.05
11 Output12 Assets held at the end of the period to meet pensions
Closing Balance Sheet
Non-core national accounts(figures in bn. EUR)
Changes in pension entitlements due to transactions
Changes in pension entitlements due to other economic flows
Opening Balance Sheet
Table 70: Supplementary table Spain 2007 (ABO, in bn. EUR)
General Government
Social Security
G H
1 Pension entitlements 1,739.40
Sum 2.1 to 2.4 2 Increase in pension entitlements due to social contributions 90.63
2.1 Employer actual social contributions 0.002.2 Employer imputed social contributions2.3 Household actual social contributions 0.002.4 Household social contribution supplements 90.63
3 Other (actuarial) increase of pension entitlements 135.484 Reduction in pension entitlements due to payment of pension benefits 79.81
2 + 3 - 4 5 Change in pension entitlements due to social contributions and pension benefits 146.31
6 Transfers of entitlements between schemes 0.007 Changes in pension entitlements due to other transactions 0.00
8 Changes in entitlements due to revaluations 0.009 Changes in entitlements due to other changes in volume 0.00
10 Pension entitlements 1,885.70Pension entitlements (% of GDP 2007) 179.49
11 Output12 Assets held at the end of the period to meet pensions
Closing Balance Sheet
Non-core national accounts(figures in bn. EUR)
Changes in pension entitlements due to transactions
Changes in pension entitlements due to other economic flows
Opening Balance Sheet
180
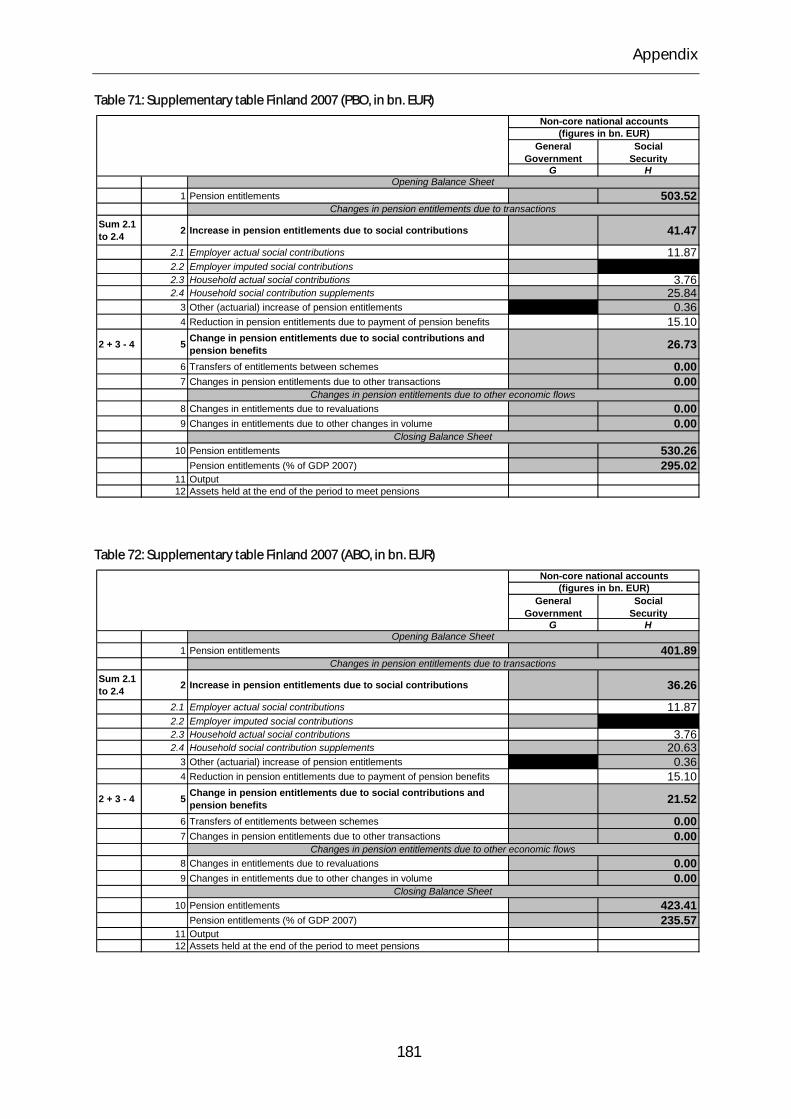
Appendix
Table 71: Supplementary table Finland 2007 (PBO, in bn. EUR)
General Government
Social Security
G H
1 Pension entitlements 503.52
Sum 2.1 to 2.4 2 Increase in pension entitlements due to social contributions 41.47
2.1 Employer actual social contributions 11.872.2 Employer imputed social contributions2.3 Household actual social contributions 3.762.4 Household social contribution supplements 25.84
3 Other (actuarial) increase of pension entitlements 0.364 Reduction in pension entitlements due to payment of pension benefits 15.10
2 + 3 - 4 5 Change in pension entitlements due to social contributions and pension benefits 26.73
6 Transfers of entitlements between schemes 0.007 Changes in pension entitlements due to other transactions 0.00
8 Changes in entitlements due to revaluations 0.009 Changes in entitlements due to other changes in volume 0.00
10 Pension entitlements 530.26Pension entitlements (% of GDP 2007) 295.02
11 Output12 Assets held at the end of the period to meet pensions
Closing Balance Sheet
Non-core national accounts(figures in bn. EUR)
Opening Balance Sheet
Changes in pension entitlements due to transactions
Changes in pension entitlements due to other economic flows
Table 72: Supplementary table Finland 2007 (ABO, in bn. EUR)
General Government
Social Security
G H
1 Pension entitlements 401.89
Sum 2.1 to 2.4 2 Increase in pension entitlements due to social contributions 36.26
2.1 Employer actual social contributions 11.872.2 Employer imputed social contributions2.3 Household actual social contributions 3.762.4 Household social contribution supplements 20.63
3 Other (actuarial) increase of pension entitlements 0.364 Reduction in pension entitlements due to payment of pension benefits 15.10
2 + 3 - 4 5 Change in pension entitlements due to social contributions and pension benefits 21.52
6 Transfers of entitlements between schemes 0.007 Changes in pension entitlements due to other transactions 0.00
8 Changes in entitlements due to revaluations 0.009 Changes in entitlements due to other changes in volume 0.00
10 Pension entitlements 423.41Pension entitlements (% of GDP 2007) 235.57
11 Output12 Assets held at the end of the period to meet pensions
Closing Balance Sheet
Non-core national accounts(figures in bn. EUR)
Opening Balance Sheet
Changes in pension entitlements due to transactions
Changes in pension entitlements due to other economic flows
181
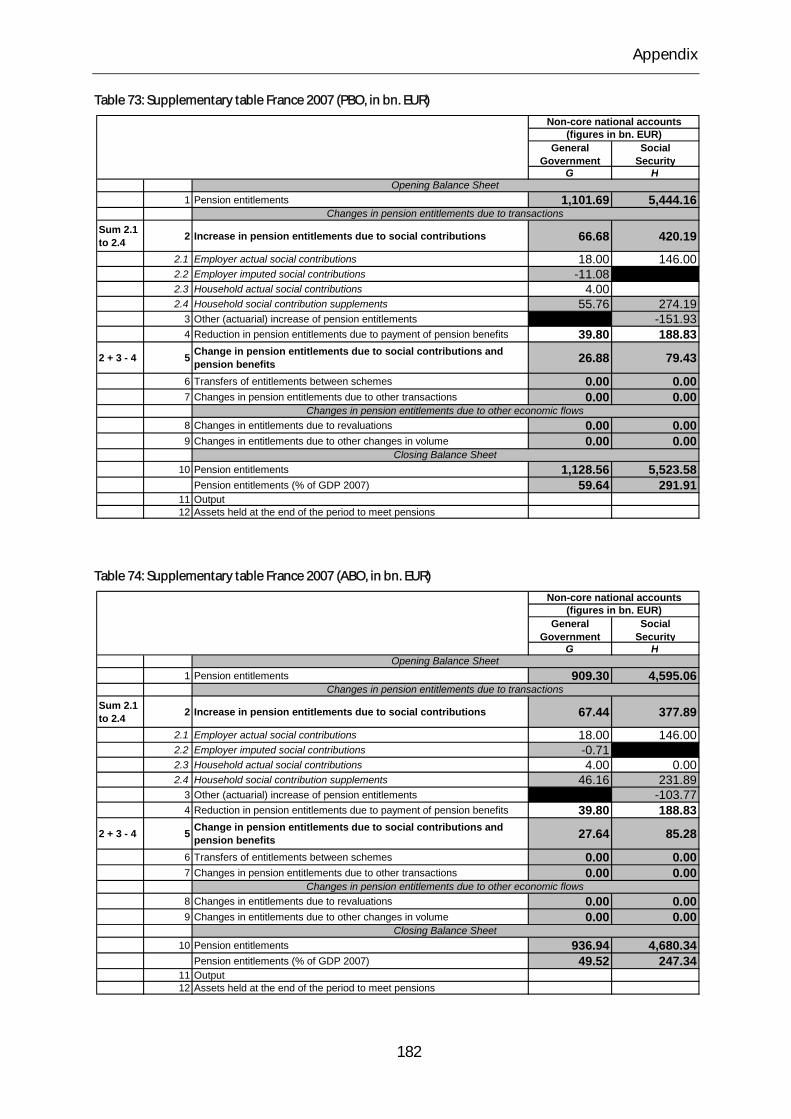
Appendix
Table 73: Supplementary table France 2007 (PBO, in bn. EUR)
General Government
Social Security
G H
1 Pension entitlements 1,101.69 5,444.16
Sum 2.1 to 2.4 2 Increase in pension entitlements due to social contributions 66.68 420.19
2.1 Employer actual social contributions 18.00 146.002.2 Employer imputed social contributions -11.082.3 Household actual social contributions 4.002.4 Household social contribution supplements 55.76 274.19
3 Other (actuarial) increase of pension entitlements -151.934 Reduction in pension entitlements due to payment of pension benefits 39.80 188.83
2 + 3 - 4 5 Change in pension entitlements due to social contributions and pension benefits 26.88 79.43
6 Transfers of entitlements between schemes 0.00 0.007 Changes in pension entitlements due to other transactions 0.00 0.00
8 Changes in entitlements due to revaluations 0.00 0.009 Changes in entitlements due to other changes in volume 0.00 0.00
10 Pension entitlements 1,128.56 5,523.58Pension entitlements (% of GDP 2007) 59.64 291.91
11 Output12 Assets held at the end of the period to meet pensions
Closing Balance Sheet
Non-core national accounts(figures in bn. EUR)
Changes in pension entitlements due to transactions
Changes in pension entitlements due to other economic flows
Opening Balance Sheet
Table 74: Supplementary table France 2007 (ABO, in bn. EUR)
General Government
Social Security
G H
1 Pension entitlements 909.30 4,595.06
Sum 2.1 to 2.4 2 Increase in pension entitlements due to social contributions 67.44 377.89
2.1 Employer actual social contributions 18.00 146.002.2 Employer imputed social contributions -0.712.3 Household actual social contributions 4.00 0.002.4 Household social contribution supplements 46.16 231.89
3 Other (actuarial) increase of pension entitlements -103.774 Reduction in pension entitlements due to payment of pension benefits 39.80 188.83
2 + 3 - 4 5 Change in pension entitlements due to social contributions and pension benefits 27.64 85.28
6 Transfers of entitlements between schemes 0.00 0.007 Changes in pension entitlements due to other transactions 0.00 0.00
8 Changes in entitlements due to revaluations 0.00 0.009 Changes in entitlements due to other changes in volume 0.00 0.00
10 Pension entitlements 936.94 4,680.34Pension entitlements (% of GDP 2007) 49.52 247.34
11 Output12 Assets held at the end of the period to meet pensions
Closing Balance Sheet
Non-core national accounts(figures in bn. EUR)
Changes in pension entitlements due to transactions
Changes in pension entitlements due to other economic flows
Opening Balance Sheet
182
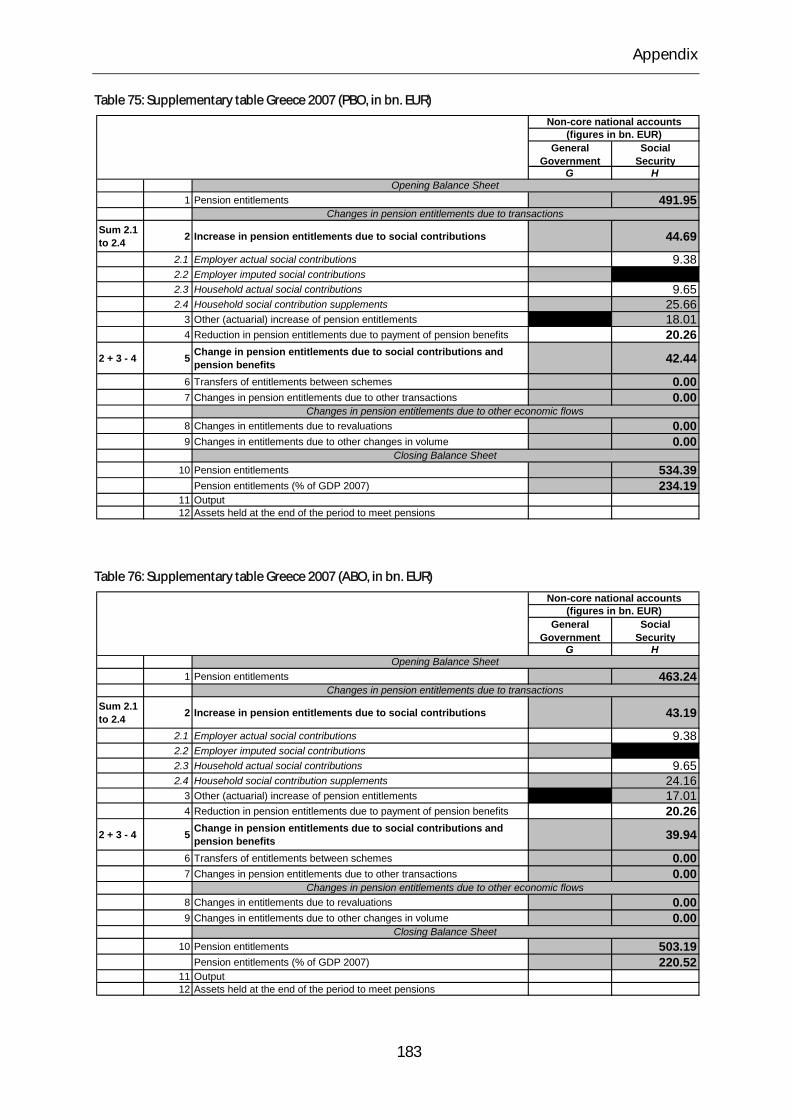
Appendix
Table 75: Supplementary table Greece 2007 (PBO, in bn. EUR)
General Government
Social Security
G H
1 Pension entitlements 491.95
Sum 2.1 to 2.4 2 Increase in pension entitlements due to social contributions 44.69
2.1 Employer actual social contributions 9.382.2 Employer imputed social contributions2.3 Household actual social contributions 9.652.4 Household social contribution supplements 25.66
3 Other (actuarial) increase of pension entitlements 18.014 Reduction in pension entitlements due to payment of pension benefits 20.26
2 + 3 - 4 5 Change in pension entitlements due to social contributions and pension benefits 42.44
6 Transfers of entitlements between schemes 0.007 Changes in pension entitlements due to other transactions 0.00
8 Changes in entitlements due to revaluations 0.009 Changes in entitlements due to other changes in volume 0.00
10 Pension entitlements 534.39Pension entitlements (% of GDP 2007) 234.19
11 Output12 Assets held at the end of the period to meet pensions
Closing Balance Sheet
Non-core national accounts(figures in bn. EUR)
Changes in pension entitlements due to transactions
Changes in pension entitlements due to other economic flows
Opening Balance Sheet
Table 76: Supplementary table Greece 2007 (ABO, in bn. EUR)
General Government
Social Security
G H
1 Pension entitlements 463.24
Sum 2.1 to 2.4 2 Increase in pension entitlements due to social contributions 43.19
2.1 Employer actual social contributions 9.382.2 Employer imputed social contributions2.3 Household actual social contributions 9.652.4 Household social contribution supplements 24.16
3 Other (actuarial) increase of pension entitlements 17.014 Reduction in pension entitlements due to payment of pension benefits 20.26
2 + 3 - 4 5 Change in pension entitlements due to social contributions and pension benefits 39.94
6 Transfers of entitlements between schemes 0.007 Changes in pension entitlements due to other transactions 0.00
8 Changes in entitlements due to revaluations 0.009 Changes in entitlements due to other changes in volume 0.00
10 Pension entitlements 503.19Pension entitlements (% of GDP 2007) 220.52
11 Output 12 Assets held at the end of the period to meet pensions
Closing Balance Sheet
Non-core national accounts(figures in bn. EUR)
Changes in pension entitlements due to transactions
Changes in pension entitlements due to other economic flows
Opening Balance Sheet
183
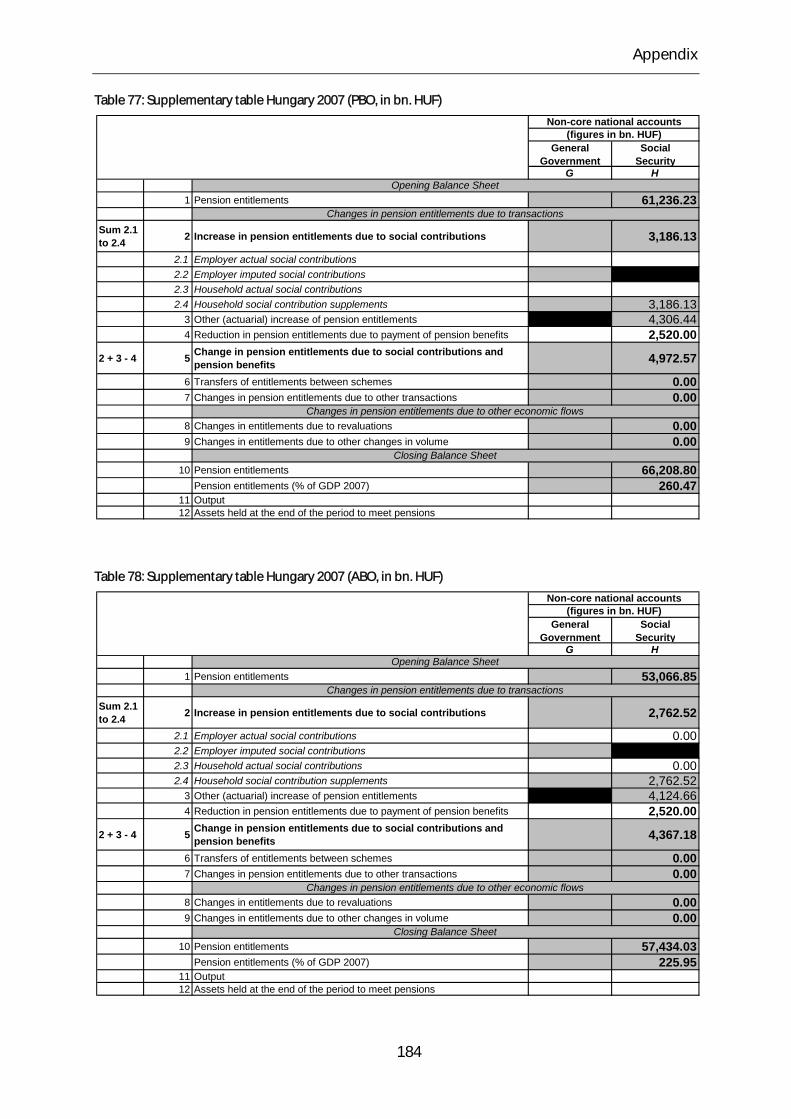
Appendix
Table 77: Supplementary table Hungary 2007 (PBO, in bn. HUF)
General Government
Social Security
G H
1 Pension entitlements 61,236.23
Sum 2.1 to 2.4 2 Increase in pension entitlements due to social contributions 3,186.13
2.1 Employer actual social contributions2.2 Employer imputed social contributions2.3 Household actual social contributions2.4 Household social contribution supplements 3,186.13
3 Other (actuarial) increase of pension entitlements 4,306.444 Reduction in pension entitlements due to payment of pension benefits 2,520.00
2 + 3 - 4 5 Change in pension entitlements due to social contributions and pension benefits 4,972.57
6 Transfers of entitlements between schemes 0.007 Changes in pension entitlements due to other transactions 0.00
8 Changes in entitlements due to revaluations 0.009 Changes in entitlements due to other changes in volume 0.00
10 Pension entitlements 66,208.80Pension entitlements (% of GDP 2007) 260.47
11 Output12 Assets held at the end of the period to meet pensions
Closing Balance Sheet
Non-core national accounts(figures in bn. HUF)
Changes in pension entitlements due to transactions
Changes in pension entitlements due to other economic flows
Opening Balance Sheet
Table 78: Supplementary table Hungary 2007 (ABO, in bn. HUF)
General Government
Social Security
G H
1 Pension entitlements 53,066.85
Sum 2.1 to 2.4 2 Increase in pension entitlements due to social contributions 2,762.52
2.1 Employer actual social contributions 0.002.2 Employer imputed social contributions2.3 Household actual social contributions 0.002.4 Household social contribution supplements 2,762.52
3 Other (actuarial) increase of pension entitlements 4,124.664 Reduction in pension entitlements due to payment of pension benefits 2,520.00
2 + 3 - 4 5 Change in pension entitlements due to social contributions and pension benefits 4,367.18
6 Transfers of entitlements between schemes 0.007 Changes in pension entitlements due to other transactions 0.00
8 Changes in entitlements due to revaluations 0.009 Changes in entitlements due to other changes in volume 0.00
10 Pension entitlements 57,434.03Pension entitlements (% of GDP 2007) 225.95
11 Output12 Assets held at the end of the period to meet pensions
Closing Balance Sheet
Non-core national accounts(figures in bn. HUF)
Changes in pension entitlements due to transactions
Changes in pension entitlements due to other economic flows
Opening Balance Sheet
184
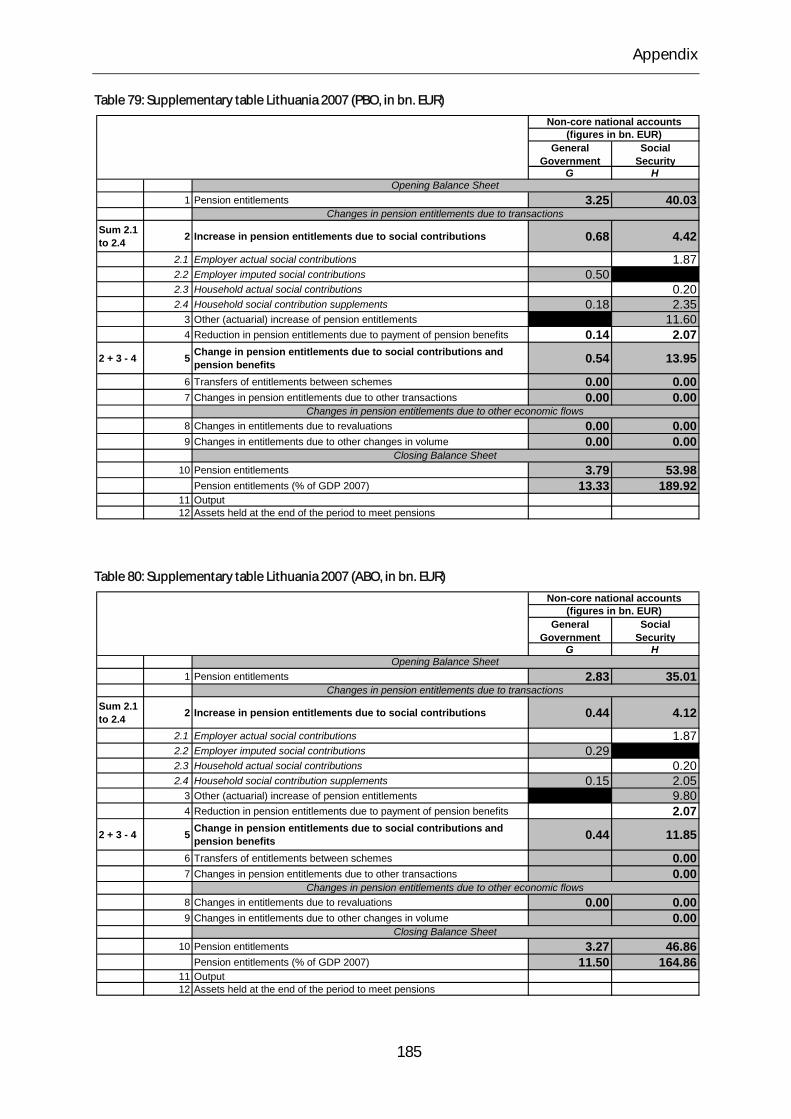
Appendix
Table 79: Supplementary table Lithuania 2007 (PBO, in bn. EUR)
General Government
Social Security
G H
1 Pension entitlements 3.25 40.03
Sum 2.1 to 2.4 2 Increase in pension entitlements due to social contributions 0.68 4.42
2.1 Employer actual social contributions 1.872.2 Employer imputed social contributions 0.502.3 Household actual social contributions 0.202.4 Household social contribution supplements 0.18 2.35
3 Other (actuarial) increase of pension entitlements 11.604 Reduction in pension entitlements due to payment of pension benefits 0.14 2.07
2 + 3 - 4 5 Change in pension entitlements due to social contributions and pension benefits 0.54 13.95
6 Transfers of entitlements between schemes 0.00 0.007 Changes in pension entitlements due to other transactions 0.00 0.00
8 Changes in entitlements due to revaluations 0.00 0.009 Changes in entitlements due to other changes in volume 0.00 0.00
10 Pension entitlements 3.79 53.98Pension entitlements (% of GDP 2007) 13.33 189.92
11 Output12 Assets held at the end of the period to meet pensions
Closing Balance Sheet
Non-core national accounts(figures in bn. EUR)
Changes in pension entitlements due to transactions
Changes in pension entitlements due to other economic flows
Opening Balance Sheet
Table 80: Supplementary table Lithuania 2007 (ABO, in bn. EUR)
General Government
Social Security
G H
1 Pension entitlements 2.83 35.01
Sum 2.1 to 2.4 2 Increase in pension entitlements due to social contributions 0.44 4.12
2.1 Employer actual social contributions 1.872.2 Employer imputed social contributions 0.292.3 Household actual social contributions 0.202.4 Household social contribution supplements 0.15 2.05
3 Other (actuarial) increase of pension entitlements 9.804 Reduction in pension entitlements due to payment of pension benefits 2.07
2 + 3 - 4 5 Change in pension entitlements due to social contributions and pension benefits 0.44 11.85
6 Transfers of entitlements between schemes 0.007 Changes in pension entitlements due to other transactions 0.00
8 Changes in entitlements due to revaluations 0.00 0.009 Changes in entitlements due to other changes in volume 0.00
10 Pension entitlements 3.27 46.86Pension entitlements (% of GDP 2007) 11.50 164.86
11 Output12 Assets held at the end of the period to meet pensions
Closing Balance Sheet
Non-core national accounts(figures in bn. EUR)
Changes in pension entitlements due to transactions
Changes in pension entitlements due to other economic flows
Opening Balance Sheet
185

Appendix
Table 81: Supplementary table Latvia 2007 (PBO, in bn. LVL)
General Government
Social Security
G H
1 Pension entitlements 13.95
Sum 2.1 to 2.4 2 Increase in pension entitlements due to social contributions 2.83
2.1 Employer actual social contributions 2.082.2 Employer imputed social contributions2.3 Household actual social contributions2.4 Household social contribution supplements 0.75
3 Other (actuarial) increase of pension entitlements -0.024 Reduction in pension entitlements due to payment of pension benefits 0.75
2 + 3 - 4 5 Change in pension entitlements due to social contributions and pension benefits 2.06
6 Transfers of entitlements between schemes 0.007 Changes in pension entitlements due to other transactions 0.00
8 Changes in entitlements due to revaluations 0.009 Changes in entitlements due to other changes in volume 0.00
10 Pension entitlements 16.01Pension entitlements (% of GDP 2007) 114.69
11 Output12 Assets held at the end of the period to meet pensions
Closing Balance Sheet
Non-core national accounts(figures in bn. LVL)
Changes in pension entitlements due to transactions
Changes in pension entitlements due to other economic flows
Opening Balance Sheet
Table 82: Supplementary table Latvia 2007 (ABO, in bn. LVL)
General Government
Social Security
G H
1 Pension entitlements 11.99
Sum 2.1 to 2.4 2 Increase in pension entitlements due to social contributions 2.72
2.1 Employer actual social contributions 2.082.2 Employer imputed social contributions2.3 Household actual social contributions 0.002.4 Household social contribution supplements 0.64
3 Other (actuarial) increase of pension entitlements -0.244 Reduction in pension entitlements due to payment of pension benefits 0.75
2 + 3 - 4 5 Change in pension entitlements due to social contributions and pension benefits 1.73
6 Transfers of entitlements between schemes 0.007 Changes in pension entitlements due to other transactions 0.00
8 Changes in entitlements due to revaluations 0.009 Changes in entitlements due to other changes in volume 0.00
10 Pension entitlements 13.72Pension entitlements (% of GDP 2007) 98.30
11 Output12 Assets held at the end of the period to meet pensions
Closing Balance Sheet
Non-core national accounts(figures in bn. LVL)
Changes in pension entitlements due to transactions
Changes in pension entitlements due to other economic flows
Opening Balance Sheet
186

Appendix
Table 83: Supplementary table Malta 2007 (PBO, in bn. EUR)
General Government
Social Security
G H
1 Pension entitlements 2.18 11.53
Sum 2.1 to 2.4 2 Increase in pension entitlements due to social contributions 0.07 0.88
2.1 Employer actual social contributions 0.142.2 Employer imputed social contributions -0.042.3 Household actual social contributions 0.142.4 Household social contribution supplements 0.11 0.59
3 Other (actuarial) increase of pension entitlements 0.124 Reduction in pension entitlements due to payment of pension benefits 0.08 0.39
2 + 3 - 4 5 Change in pension entitlements due to social contributions and pension benefits -0.01 0.61
6 Transfers of entitlements between schemes 0.00 0.007 Changes in pension entitlements due to other transactions 0.00 0.00
8 Changes in entitlements due to revaluations 0.00 0.009 Changes in entitlements due to other changes in volume 0.00 0.00
10 Pension entitlements 2.17 12.14Pension entitlements (% of GDP 2007) 40.07 224.17
11 Output12 Assets held at the end of the period to meet pensions
Closing Balance Sheet
Non-core national accounts(figures in bn. EUR)
Changes in pension entitlements due to transactions
Changes in pension entitlements due to other economic flows
Opening Balance Sheet
Table 84: Supplementary table Malta 2007 (ABO, in bn. EUR)
General Government
Social Security
G H
1 Pension entitlements 2.10 10.37
Sum 2.1 to 2.4 2 Increase in pension entitlements due to social contributions 0.07 0.82
2.1 Employer actual social contributions 0.142.2 Employer imputed social contributions -0.042.3 Household actual social contributions 0.142.4 Household social contribution supplements 0.10 0.53
3 Other (actuarial) increase of pension entitlements 0.124 Reduction in pension entitlements due to payment of pension benefits 0.08 0.39
2 + 3 - 4 5 Change in pension entitlements due to social contributions and pension benefits -0.01 0.55
6 Transfers of entitlements between schemes 0.007 Changes in pension entitlements due to other transactions 0.00
8 Changes in entitlements due to revaluations 0.00 0.009 Changes in entitlements due to other changes in volume 0.00
10 Pension entitlements 2.09 10.92Pension entitlements (% of GDP 2007) 38.59 201.60
11 Output12 Assets held at the end of the period to meet pensions
Closing Balance Sheet
Non-core national accounts(figures in bn. EUR)
Changes in pension entitlements due to transactions
Changes in pension entitlements due to other economic flows
Opening Balance Sheet
187
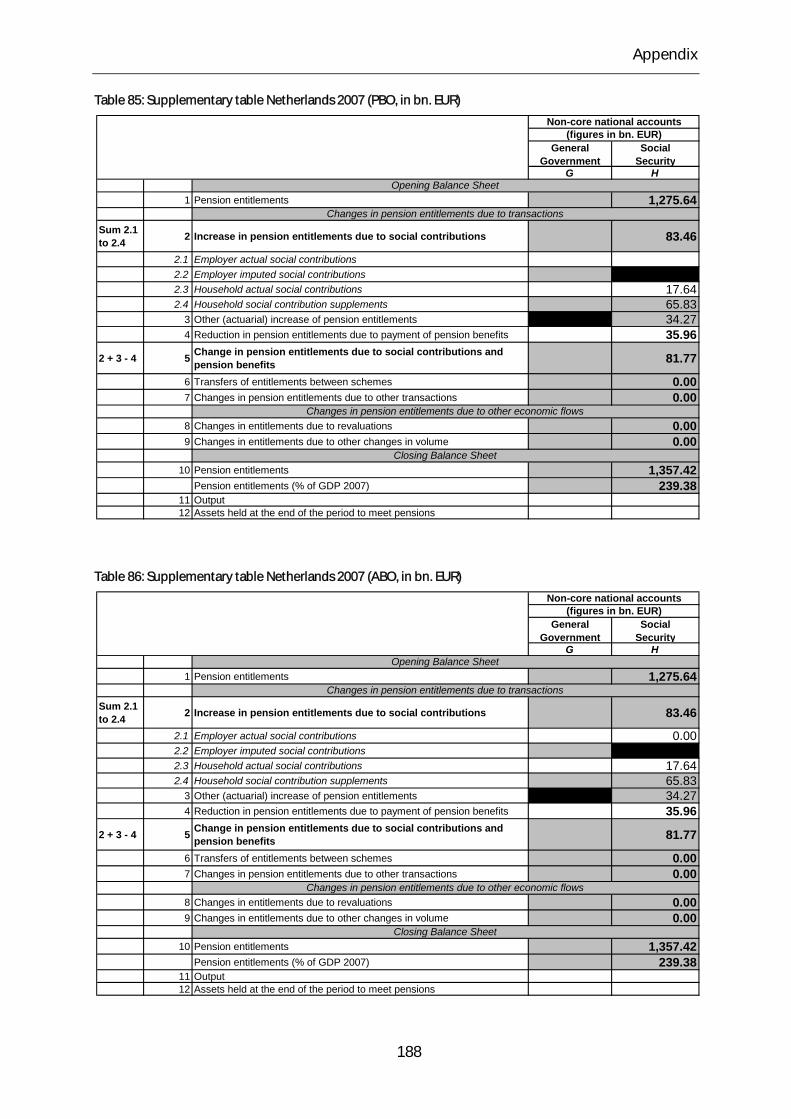
Appendix
Table 85: Supplementary table Netherlands 2007 (PBO, in bn. EUR)
General Government
Social Security
G H
1 Pension entitlements 1,275.64
Sum 2.1 to 2.4 2 Increase in pension entitlements due to social contributions 83.46
2.1 Employer actual social contributions2.2 Employer imputed social contributions2.3 Household actual social contributions 17.642.4 Household social contribution supplements 65.83
3 Other (actuarial) increase of pension entitlements 34.274 Reduction in pension entitlements due to payment of pension benefits 35.96
2 + 3 - 4 5 Change in pension entitlements due to social contributions and pension benefits 81.77
6 Transfers of entitlements between schemes 0.007 Changes in pension entitlements due to other transactions 0.00
8 Changes in entitlements due to revaluations 0.009 Changes in entitlements due to other changes in volume 0.00
10 Pension entitlements 1,357.42Pension entitlements (% of GDP 2007) 239.38
11 Output12 Assets held at the end of the period to meet pensions
Closing Balance Sheet
Non-core national accounts(figures in bn. EUR)
Changes in pension entitlements due to transactions
Changes in pension entitlements due to other economic flows
Opening Balance Sheet
Table 86: Supplementary table Netherlands 2007 (ABO, in bn. EUR)
General Government
Social Security
G H
1 Pension entitlements 1,275.64
Sum 2.1 to 2.4 2 Increase in pension entitlements due to social contributions 83.46
2.1 Employer actual social contributions 0.002.2 Employer imputed social contributions2.3 Household actual social contributions 17.642.4 Household social contribution supplements 65.83
3 Other (actuarial) increase of pension entitlements 34.274 Reduction in pension entitlements due to payment of pension benefits 35.96
2 + 3 - 4 5 Change in pension entitlements due to social contributions and pension benefits 81.77
6 Transfers of entitlements between schemes 0.007 Changes in pension entitlements due to other transactions 0.00
8 Changes in entitlements due to revaluations 0.009 Changes in entitlements due to other changes in volume 0.00
10 Pension entitlements 1,357.42Pension entitlements (% of GDP 2007) 239.38
11 Output12 Assets held at the end of the period to meet pensions
Closing Balance Sheet
Non-core national accounts(figures in bn. EUR)
Changes in pension entitlements due to transactions
Changes in pension entitlements due to other economic flows
Opening Balance Sheet
188
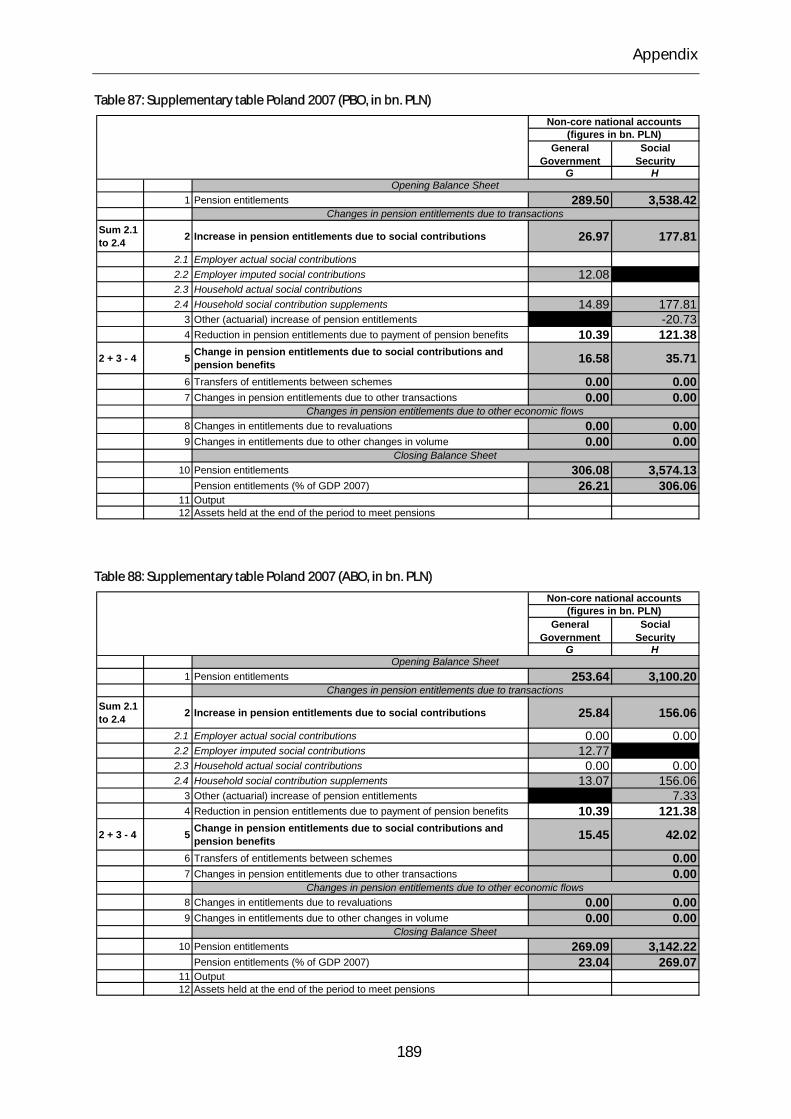
Appendix
Table 87: Supplementary table Poland 2007 (PBO, in bn. PLN)
General Government
Social Security
G H
1 Pension entitlements 289.50 3,538.42
Sum 2.1 to 2.4 2 Increase in pension entitlements due to social contributions 26.97 177.81
2.1 Employer actual social contributions2.2 Employer imputed social contributions 12.082.3 Household actual social contributions2.4 Household social contribution supplements 14.89 177.81
3 Other (actuarial) increase of pension entitlements -20.734 Reduction in pension entitlements due to payment of pension benefits 10.39 121.38
2 + 3 - 4 5 Change in pension entitlements due to social contributions and pension benefits 16.58 35.71
6 Transfers of entitlements between schemes 0.00 0.007 Changes in pension entitlements due to other transactions 0.00 0.00
8 Changes in entitlements due to revaluations 0.00 0.009 Changes in entitlements due to other changes in volume 0.00 0.00
10 Pension entitlements 306.08 3,574.13Pension entitlements (% of GDP 2007) 26.21 306.06
11 Output12 Assets held at the end of the period to meet pensions
Closing Balance Sheet
Non-core national accounts(figures in bn. PLN)
Changes in pension entitlements due to transactions
Changes in pension entitlements due to other economic flows
Opening Balance Sheet
Table 88: Supplementary table Poland 2007 (ABO, in bn. PLN)
General Government
Social Security
G H
1 Pension entitlements 253.64 3,100.20
Sum 2.1 to 2.4 2 Increase in pension entitlements due to social contributions 25.84 156.06
2.1 Employer actual social contributions 0.00 0.002.2 Employer imputed social contributions 12.772.3 Household actual social contributions 0.00 0.002.4 Household social contribution supplements 13.07 156.06
3 Other (actuarial) increase of pension entitlements 7.334 Reduction in pension entitlements due to payment of pension benefits 10.39 121.38
2 + 3 - 4 5 Change in pension entitlements due to social contributions and pension benefits 15.45 42.02
6 Transfers of entitlements between schemes 0.007 Changes in pension entitlements due to other transactions 0.00
8 Changes in entitlements due to revaluations 0.00 0.009 Changes in entitlements due to other changes in volume 0.00 0.00
10 Pension entitlements 269.09 3,142.22Pension entitlements (% of GDP 2007) 23.04 269.07
11 Output12 Assets held at the end of the period to meet pensions
Closing Balance Sheet
Non-core national accounts(figures in bn. PLN)
Changes in pension entitlements due to transactions
Changes in pension entitlements due to other economic flows
Opening Balance Sheet
189
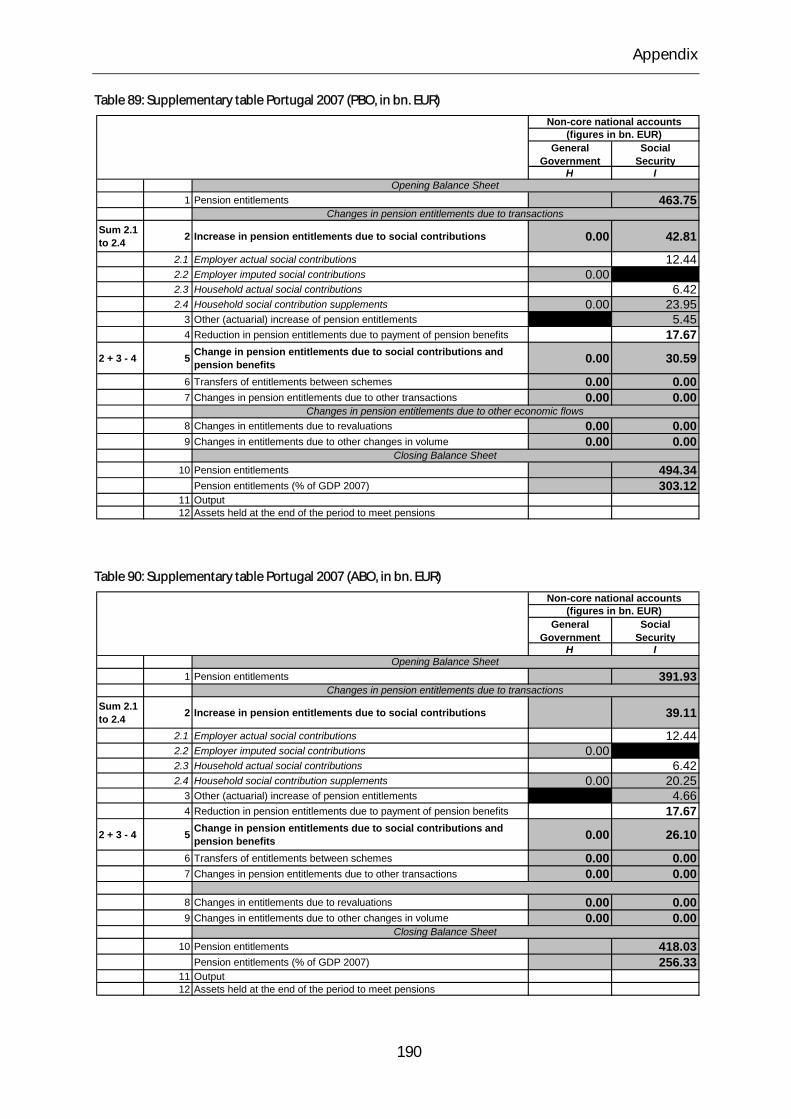
Appendix
Table 89: Supplementary table Portugal 2007 (PBO, in bn. EUR)
General Government
Social Security
H I
1 Pension entitlements 463.75
Sum 2.1 to 2.4 2 Increase in pension entitlements due to social contributions 0.00 42.81
2.1 Employer actual social contributions 12.442.2 Employer imputed social contributions 0.002.3 Household actual social contributions 6.422.4 Household social contribution supplements 0.00 23.95
3 Other (actuarial) increase of pension entitlements 5.454 Reduction in pension entitlements due to payment of pension benefits 17.67
2 + 3 - 4 5 Change in pension entitlements due to social contributions and pension benefits 0.00 30.59
6 Transfers of entitlements between schemes 0.00 0.007 Changes in pension entitlements due to other transactions 0.00 0.00
8 Changes in entitlements due to revaluations 0.00 0.009 Changes in entitlements due to other changes in volume 0.00 0.00
10 Pension entitlements 494.34Pension entitlements (% of GDP 2007) 303.12
11 Output12 Assets held at the end of the period to meet pensions
Closing Balance Sheet
Non-core national accounts(figures in bn. EUR)
Changes in pension entitlements due to transactions
Changes in pension entitlements due to other economic flows
Opening Balance Sheet
Table 90: Supplementary table Portugal 2007 (ABO, in bn. EUR)
General Government
Social Security
H I
1 Pension entitlements 391.93
Sum 2.1 to 2.4 2 Increase in pension entitlements due to social contributions 39.11
2.1 Employer actual social contributions 12.442.2 Employer imputed social contributions 0.002.3 Household actual social contributions 6.422.4 Household social contribution supplements 0.00 20.25
3 Other (actuarial) increase of pension entitlements 4.664 Reduction in pension entitlements due to payment of pension benefits 17.67
2 + 3 - 4 5 Change in pension entitlements due to social contributions and pension benefits 0.00 26.10
6 Transfers of entitlements between schemes 0.00 0.007 Changes in pension entitlements due to other transactions 0.00 0.00
8 Changes in entitlements due to revaluations 0.00 0.009 Changes in entitlements due to other changes in volume 0.00 0.00
10 Pension entitlements 418.03Pension entitlements (% of GDP 2007) 256.33
11 Output12 Assets held at the end of the period to meet pensions
Closing Balance Sheet
Non-core national accounts(figures in bn. EUR)
Changes in pension entitlements due to transactions
Opening Balance Sheet
190
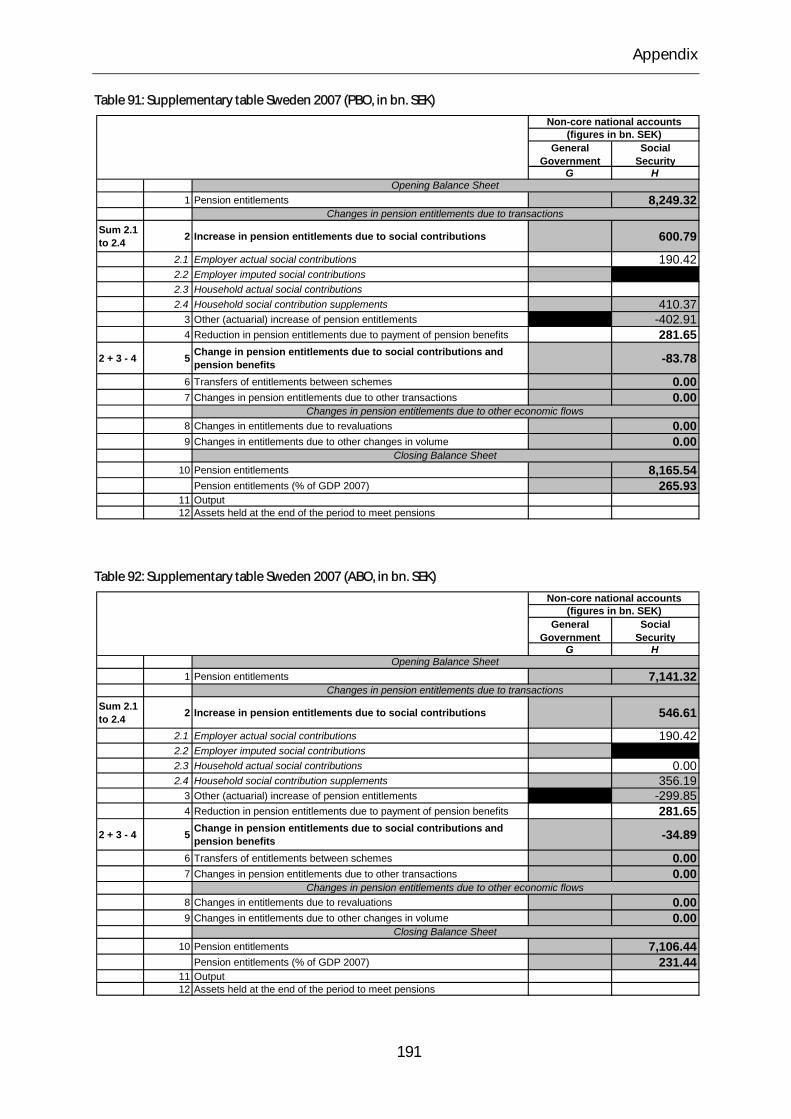
Appendix
Table 91: Supplementary table Sweden 2007 (PBO, in bn. SEK)
General Government
Social Security
G H
1 Pension entitlements 8,249.32
Sum 2.1 to 2.4 2 Increase in pension entitlements due to social contributions 600.79
2.1 Employer actual social contributions 190.422.2 Employer imputed social contributions2.3 Household actual social contributions2.4 Household social contribution supplements 410.37
3 Other (actuarial) increase of pension entitlements -402.914 Reduction in pension entitlements due to payment of pension benefits 281.65
2 + 3 - 4 5 Change in pension entitlements due to social contributions and pension benefits -83.78
6 Transfers of entitlements between schemes 0.007 Changes in pension entitlements due to other transactions 0.00
8 Changes in entitlements due to revaluations 0.009 Changes in entitlements due to other changes in volume 0.00
10 Pension entitlements 8,165.54Pension entitlements (% of GDP 2007) 265.93
11 Output12 Assets held at the end of the period to meet pensions
Closing Balance Sheet
Non-core national accounts(figures in bn. SEK)
Changes in pension entitlements due to transactions
Changes in pension entitlements due to other economic flows
Opening Balance Sheet
Table 92: Supplementary table Sweden 2007 (ABO, in bn. SEK)
General Government
Social Security
G H
1 Pension entitlements 7,141.32
Sum 2.1 to 2.4 2 Increase in pension entitlements due to social contributions 546.61
2.1 Employer actual social contributions 190.422.2 Employer imputed social contributions2.3 Household actual social contributions 0.002.4 Household social contribution supplements 356.19
3 Other (actuarial) increase of pension entitlements -299.854 Reduction in pension entitlements due to payment of pension benefits 281.65
2 + 3 - 4 5 Change in pension entitlements due to social contributions and pension benefits -34.89
6 Transfers of entitlements between schemes 0.007 Changes in pension entitlements due to other transactions 0.00
8 Changes in entitlements due to revaluations 0.009 Changes in entitlements due to other changes in volume 0.00
10 Pension entitlements 7,106.44Pension entitlements (% of GDP 2007) 231.44
11 Output12 Assets held at the end of the period to meet pensions
Closing Balance Sheet
Non-core national accounts(figures in bn. SEK)
Changes in pension entitlements due to transactions
Changes in pension entitlements due to other economic flows
Opening Balance Sheet
191

Appendix
Table 93: Supplementary table Slovakia 2007 (PBO, in bn. SKK)
General Government
Social Security
G H
1 Pension entitlements 157.04 3,336.06
Sum 2.1 to 2.4 2 Increase in pension entitlements due to social contributions 16.15 338.92
2.1 Employer actual social contributions 2.08 114.522.2 Employer imputed social contributions 5.142.3 Household actual social contributions 0.80 50.312.4 Household social contribution supplements 8.12 174.09
3 Other (actuarial) increase of pension entitlements 79.044 Reduction in pension entitlements due to payment of pension benefits 5.24 126.52
2 + 3 - 4 5 Change in pension entitlements due to social contributions and pension benefits 10.91 291.43
6 Transfers of entitlements between schemes 0.00 0.007 Changes in pension entitlements due to other transactions 0.00 0.00
8 Changes in entitlements due to revaluations 0.00 0.009 Changes in entitlements due to other changes in volume 0.00 0.00
10 Pension entitlements 167.94 3,627.49Pension entitlements (% of GDP 2007) 9.06 195.76
11 Output12 Assets held at the end of the period to meet pensions
Closing Balance Sheet
Non-core national accounts(figures in bn. SKK)
Changes in pension entitlements due to transactions
Changes in pension entitlements due to other economic flows
Opening Balance Sheet
Table 94: Supplementary table Slovakia 2007 (ABO, in bn. SKK)
General Government
Social Security
G H
1 Pension entitlements 140.40 2,971.75
Sum 2.1 to 2.4 2 Increase in pension entitlements due to social contributions 15.51 319.99
2.1 Employer actual social contributions 2.08 114.522.2 Employer imputed social contributions 5.362.3 Household actual social contributions 0.80 50.312.4 Household social contribution supplements 7.28 155.16
3 Other (actuarial) increase of pension entitlements 69.274 Reduction in pension entitlements due to payment of pension benefits 5.24 126.52
2 + 3 - 4 5 Change in pension entitlements due to social contributions and pension benefits 10.27 262.73
6 Transfers of entitlements between schemes 0.007 Changes in pension entitlements due to other transactions 0.00
8 Changes in entitlements due to revaluations 0.00 0.009 Changes in entitlements due to other changes in volume 0.00
10 Pension entitlements 150.67 3,234.48Pension entitlements (% of GDP 2007) 8.13 174.55
11 Output12 Assets held at the end of the period to meet pensions
Closing Balance Sheet
Non-core national accounts(figures in bn. SKK)
Changes in pension entitlements due to transactions
Changes in pension entitlements due to other economic flows
Opening Balance Sheet
192
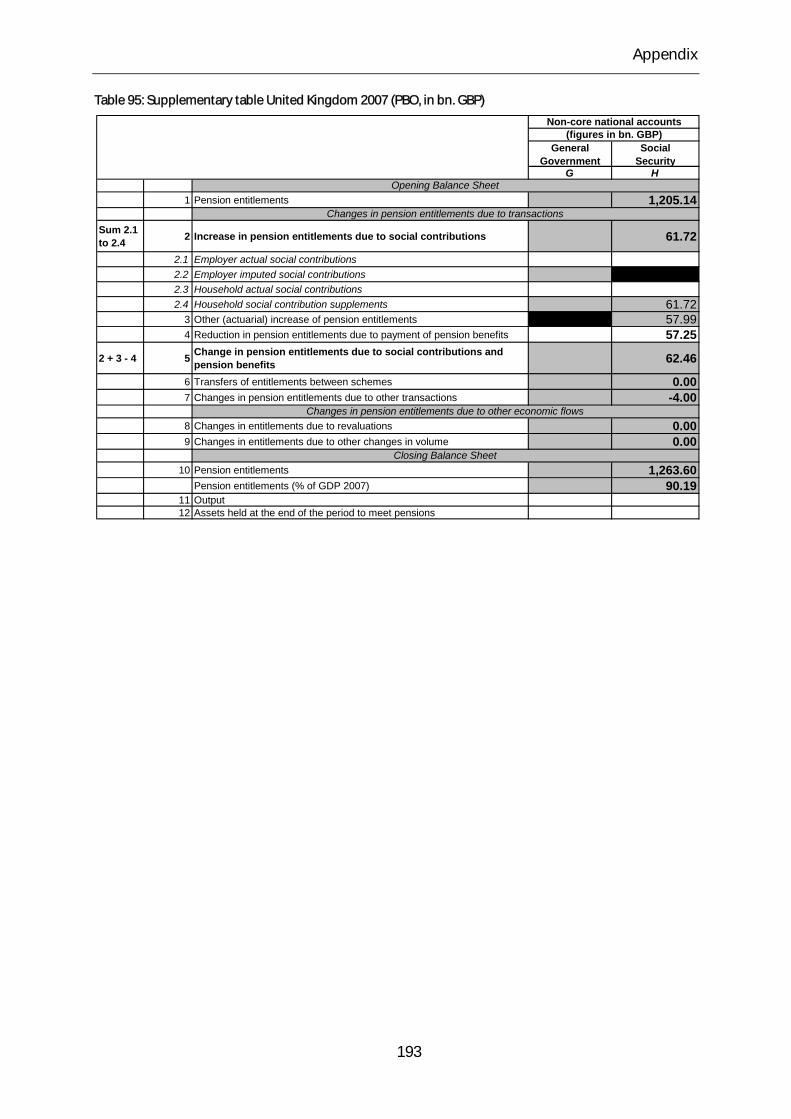
Appendix
Table 95: Supplementary table United Kingdom 2007 (PBO, in bn. GBP)
General Government
Social Security
G H
1 Pension entitlements 1,205.14
Sum 2.1 to 2.4 2 Increase in pension entitlements due to social contributions 61.72
2.1 Employer actual social contributions2.2 Employer imputed social contributions2.3 Household actual social contributions2.4 Household social contribution supplements 61.72
3 Other (actuarial) increase of pension entitlements 57.994 Reduction in pension entitlements due to payment of pension benefits 57.25
2 + 3 - 4 5 Change in pension entitlements due to social contributions and pension benefits 62.46
6 Transfers of entitlements between schemes 0.007 Changes in pension entitlements due to other transactions -4.00
8 Changes in entitlements due to revaluations 0.009 Changes in entitlements due to other changes in volume 0.00
10 Pension entitlements 1,263.60Pension entitlements (% of GDP 2007) 90.19
11 Output12 Assets held at the end of the period to meet pensions
Closing Balance Sheet
Non-core national accounts(figures in bn. GBP)
Changes in pension entitlements due to transactions
Changes in pension entitlements due to other economic flows
Opening Balance Sheet
193
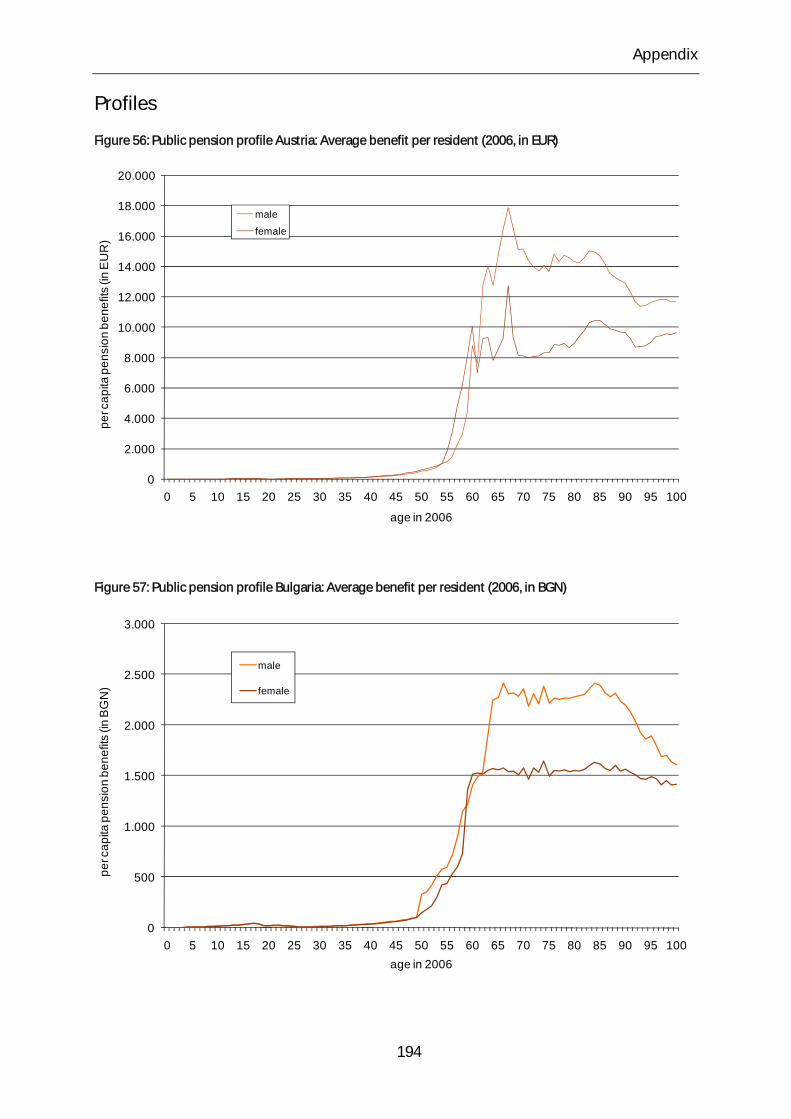
Appendix
Profiles
Figure 56: Public pension profile Austria: Average benefit per resident (2006, in EUR)
0
2.000
4.000
6.000
8.000
10.000
12.000
14.000
16.000
18.000
20.000
0 5 10 15 20 25 30 35 40 45 50 55 60 65 70 75 80 85 90 95 100
per c
apita
pen
sion
ben
efits
(in
EU
R)f
ff
age in 2006
male
female
Figure 57: Public pension profile Bulgaria: Average benefit per resident (2006, in BGN)
0
500
1.000
1.500
2.000
2.500
3.000
0 5 10 15 20 25 30 35 40 45 50 55 60 65 70 75 80 85 90 95 100
per c
apita
pen
sion
ben
efits
(in
BG
N)f
ff
age in 2006
male
female
194
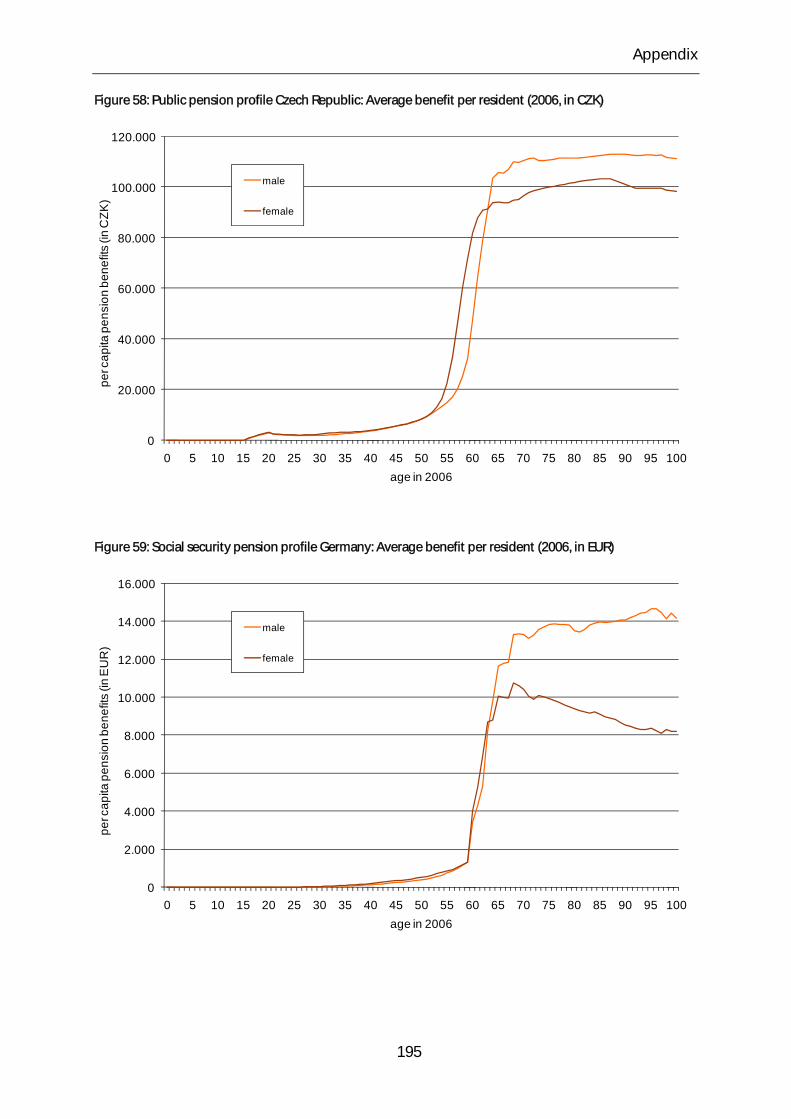
Appendix
Figure 58: Public pension profile Czech Republic: Average benefit per resident (2006, in CZK)
0
20.000
40.000
60.000
80.000
100.000
120.000
0 5 10 15 20 25 30 35 40 45 50 55 60 65 70 75 80 85 90 95 100
per c
apita
pen
sion
ben
efits
(in
CZK
)fff
age in 2006
male
female
Figure 59: Social security pension profile Germany: Average benefit per resident (2006, in EUR)
0
2.000
4.000
6.000
8.000
10.000
12.000
14.000
16.000
0 5 10 15 20 25 30 35 40 45 50 55 60 65 70 75 80 85 90 95 100
per c
apita
pen
sion
ben
efits
(in
EU
R)f
ff
age in 2006
male
female
195
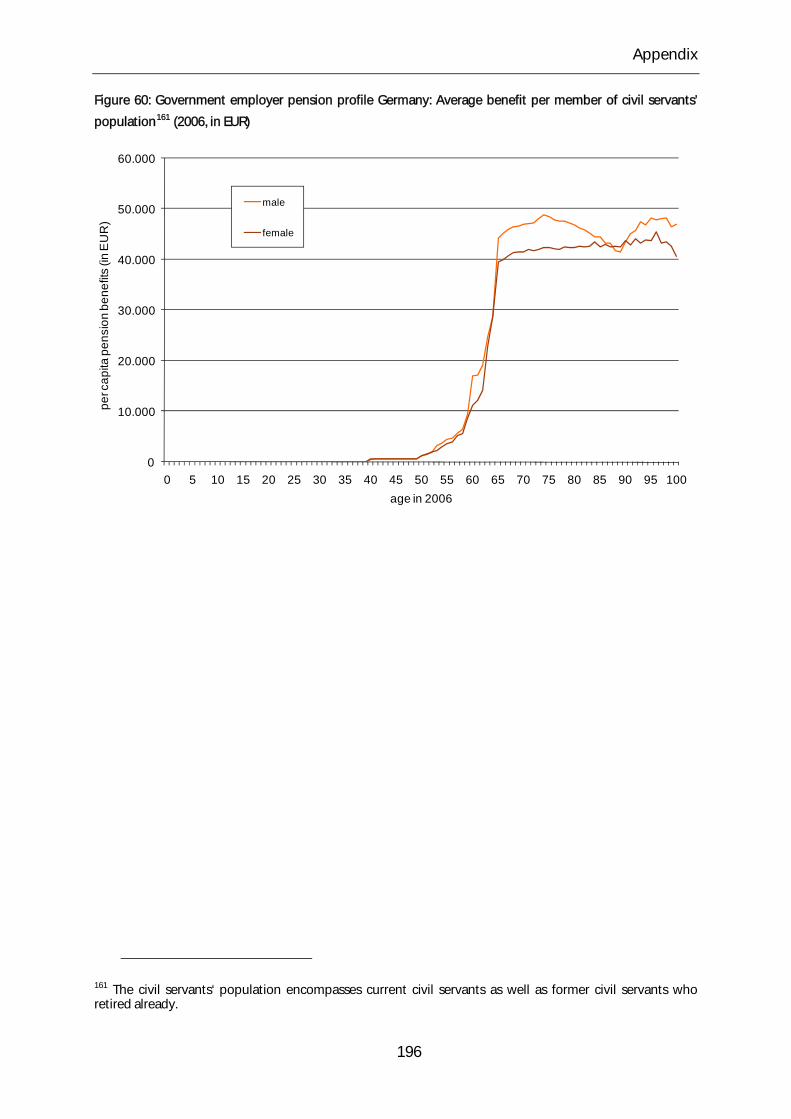
Appendix
Figure 60: Government employer pension profile Germany: Average benefit per member of civil servants’
population161 (2006, in EUR)
0
10.000
20.000
30.000
40.000
50.000
60.000
0 5 10 15 20 25 30 35 40 45 50 55 60 65 70 75 80 85 90 95 100
per c
apita
pen
sion
ben
efits
(in
EU
R)f
ff
age in 2006
male
female
161 The civil servants‘ population encompasses current civil servants as well as former civil servants who retired already.
196
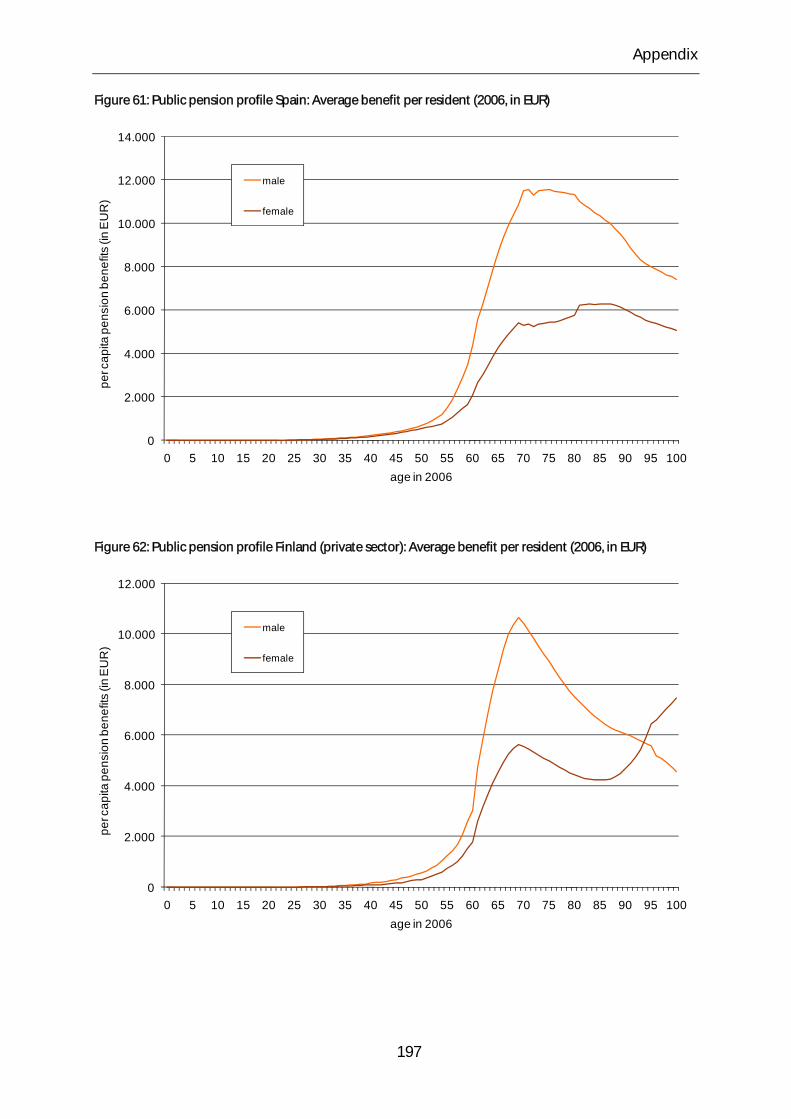
Appendix
Figure 61: Public pension profile Spain: Average benefit per resident (2006, in EUR)
0
2.000
4.000
6.000
8.000
10.000
12.000
14.000
0 5 10 15 20 25 30 35 40 45 50 55 60 65 70 75 80 85 90 95 100
per c
apita
pen
sion
ben
efits
(in
EU
R)f
ff
age in 2006
male
female
Figure 62: Public pension profile Finland (private sector): Average benefit per resident (2006, in EUR)
0
2.000
4.000
6.000
8.000
10.000
12.000
0 5 10 15 20 25 30 35 40 45 50 55 60 65 70 75 80 85 90 95 100
per c
apita
pen
sion
ben
efits
(in
EU
R)f
ff
age in 2006
male
female
197
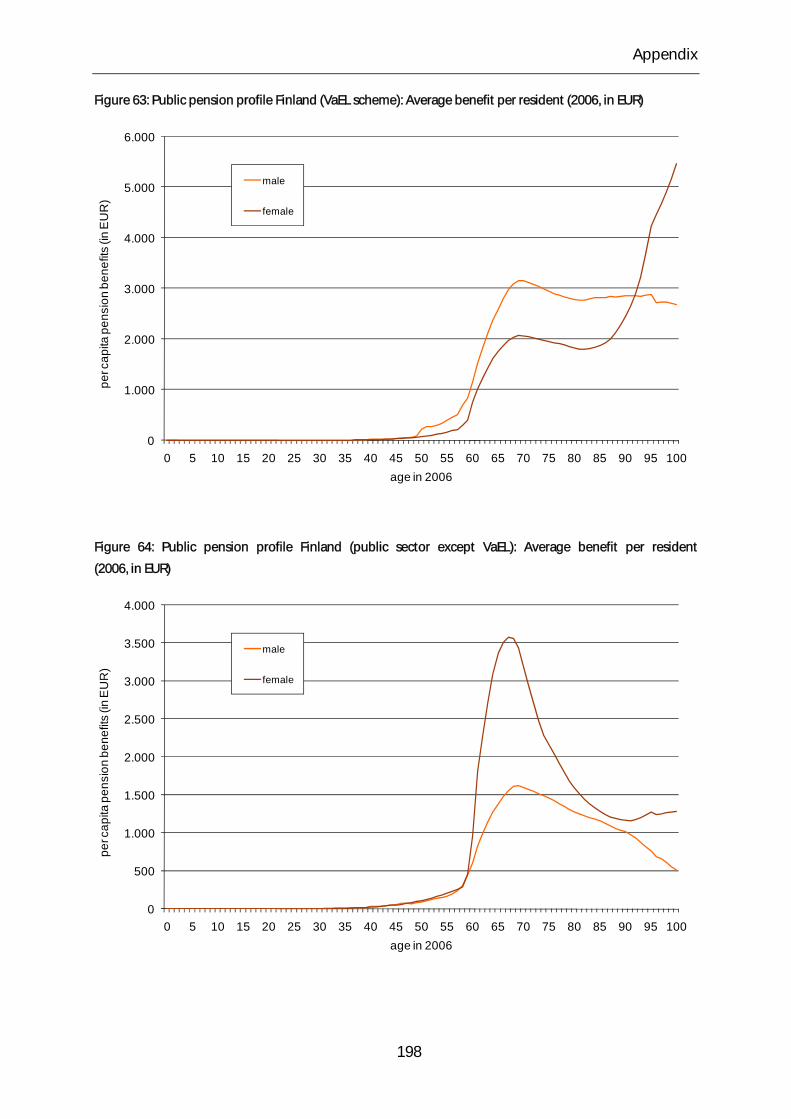
Appendix
Figure 63: Public pension profile Finland (VaEL scheme): Average benefit per resident (2006, in EUR)
0
1.000
2.000
3.000
4.000
5.000
6.000
0 5 10 15 20 25 30 35 40 45 50 55 60 65 70 75 80 85 90 95 100
per c
apita
pen
sion
ben
efits
(in
EU
R)f
ff
age in 2006
male
female
Figure 64: Public pension profile Finland (public sector except VaEL): Average benefit per resident
(2006, in EUR)
0
500
1.000
1.500
2.000
2.500
3.000
3.500
4.000
0 5 10 15 20 25 30 35 40 45 50 55 60 65 70 75 80 85 90 95 100
per c
apita
pen
sion
ben
efits
(in
EU
R)f
ff
age in 2006
male
female
198
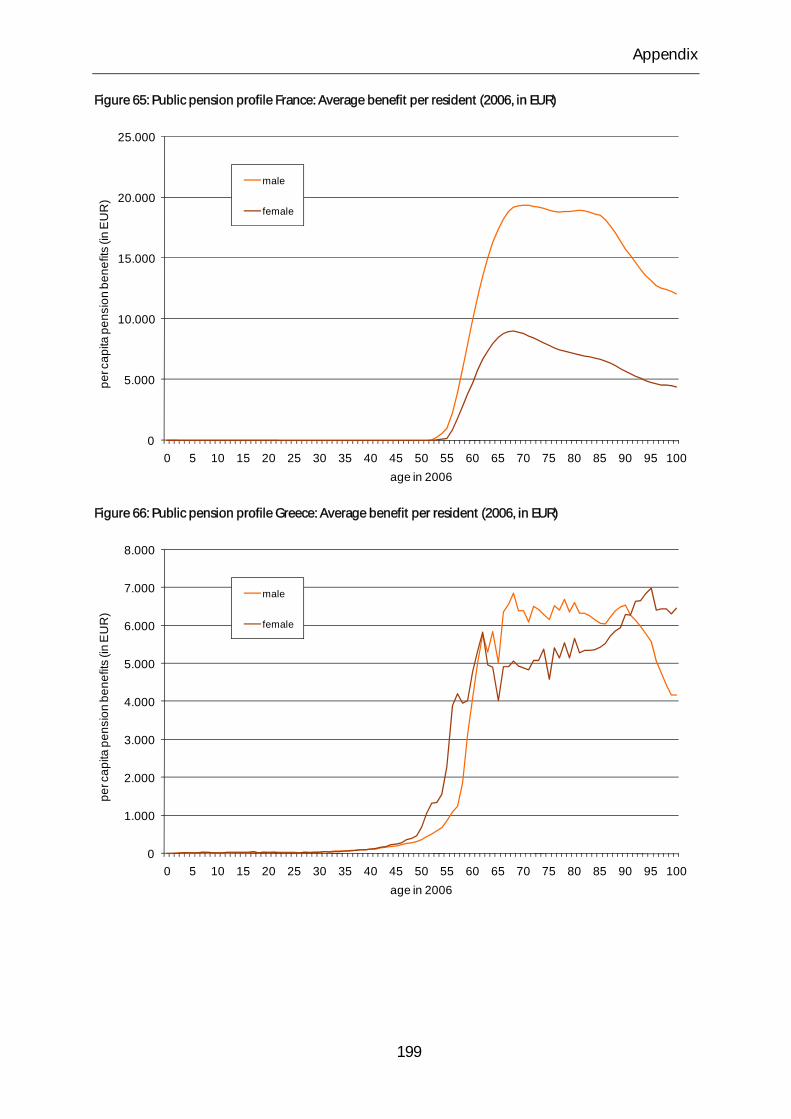
Appendix
Figure 65: Public pension profile France: Average benefit per resident (2006, in EUR)
0
5.000
10.000
15.000
20.000
25.000
0 5 10 15 20 25 30 35 40 45 50 55 60 65 70 75 80 85 90 95 100
per c
apita
pen
sion
ben
efits
(in
EU
R)f
ff
age in 2006
male
female
Figure 66: Public pension profile Greece: Average benefit per resident (2006, in EUR)
0
1.000
2.000
3.000
4.000
5.000
6.000
7.000
8.000
0 5 10 15 20 25 30 35 40 45 50 55 60 65 70 75 80 85 90 95 100
per c
apita
pen
sion
ben
efits
(in
EU
R)f
ff
age in 2006
male
female
199
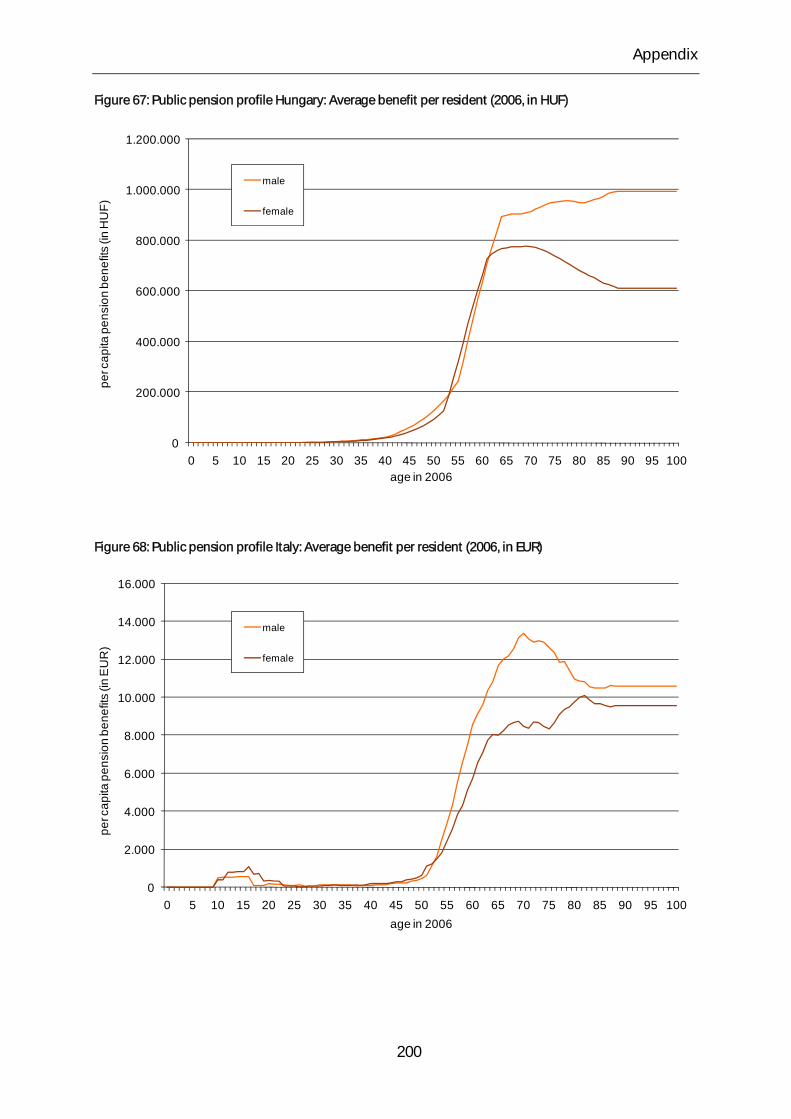
Appendix
Figure 67: Public pension profile Hungary: Average benefit per resident (2006, in HUF)
0
200.000
400.000
600.000
800.000
1.000.000
1.200.000
0 5 10 15 20 25 30 35 40 45 50 55 60 65 70 75 80 85 90 95 100
per c
apita
pen
sion
ben
efits
(in
HU
F)fff
age in 2006
male
female
Figure 68: Public pension profile Italy: Average benefit per resident (2006, in EUR)
0
2.000
4.000
6.000
8.000
10.000
12.000
14.000
16.000
0 5 10 15 20 25 30 35 40 45 50 55 60 65 70 75 80 85 90 95 100
per c
apita
pen
sion
ben
efits
(in
EU
R)f
ff
age in 2006
male
female
200
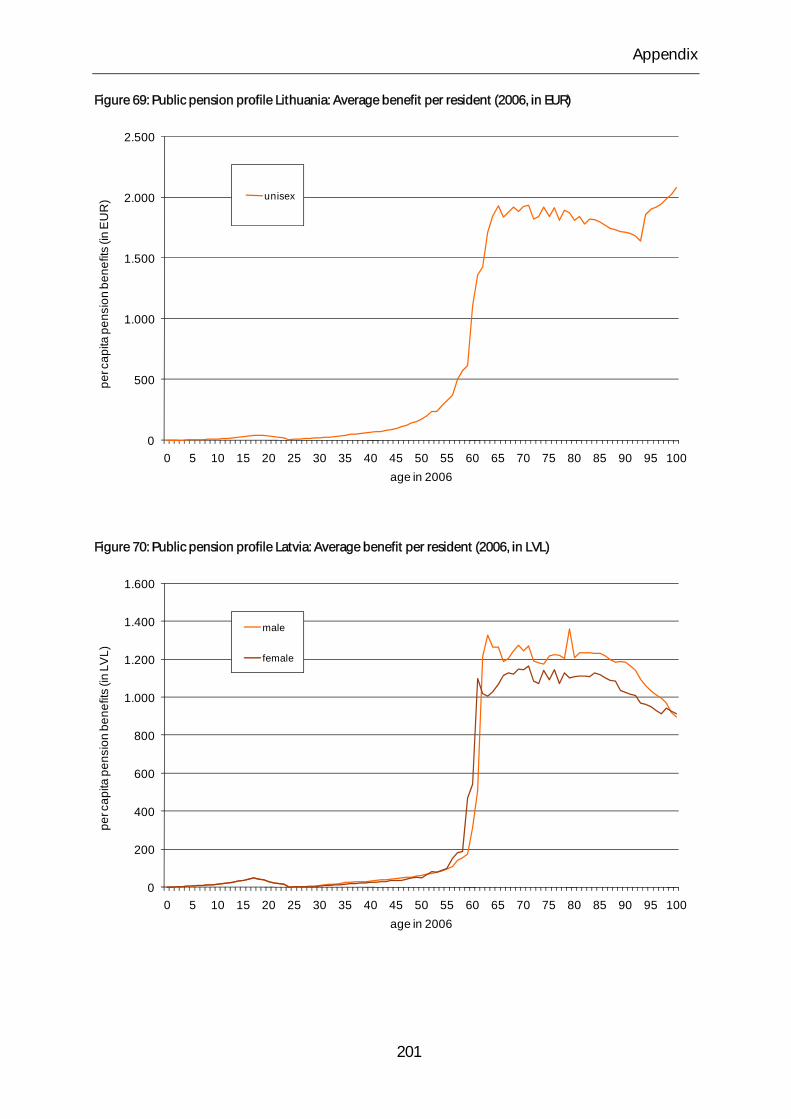
Appendix
Figure 69: Public pension profile Lithuania: Average benefit per resident (2006, in EUR)
0
500
1.000
1.500
2.000
2.500
0 5 10 15 20 25 30 35 40 45 50 55 60 65 70 75 80 85 90 95 100
per c
apita
pen
sion
ben
efits
(in
EU
R)f
ff
age in 2006
unisex
Figure 70: Public pension profile Latvia: Average benefit per resident (2006, in LVL)
0
200
400
600
800
1.000
1.200
1.400
1.600
0 5 10 15 20 25 30 35 40 45 50 55 60 65 70 75 80 85 90 95 100
per c
apita
pen
sion
ben
efits
(in
LVL)
fff
age in 2006
male
female
201
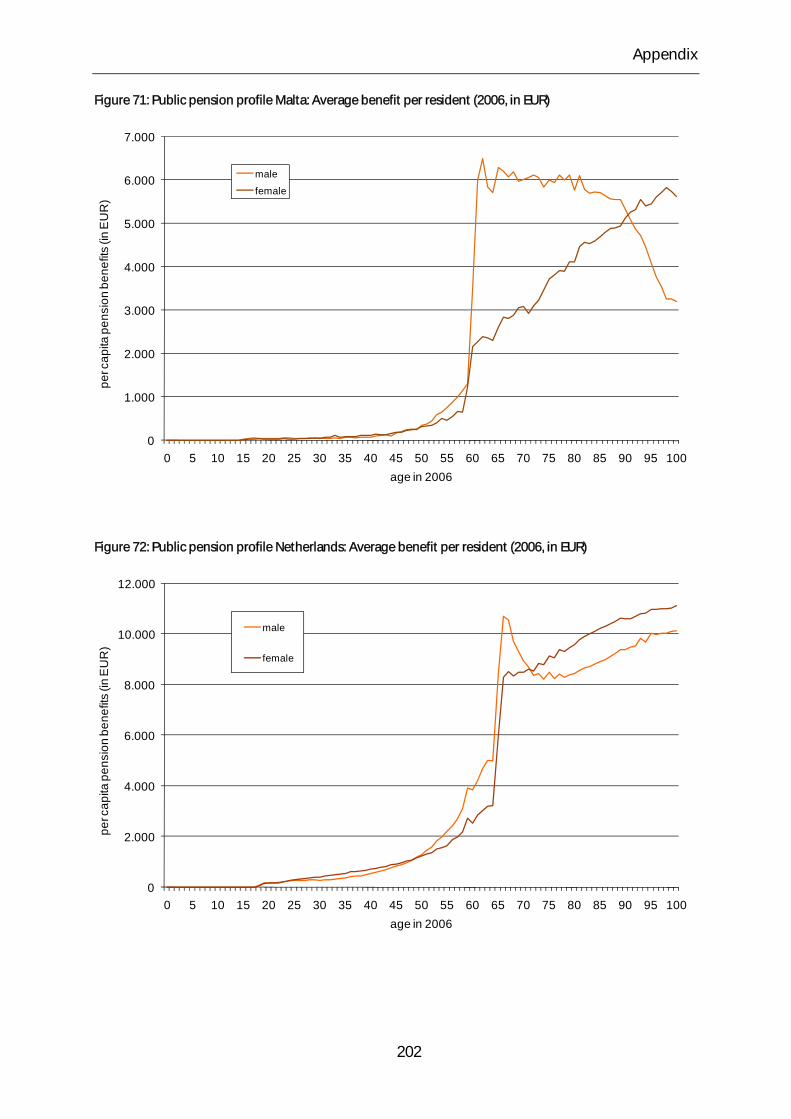
Appendix
Figure 71: Public pension profile Malta: Average benefit per resident (2006, in EUR)
0
1.000
2.000
3.000
4.000
5.000
6.000
7.000
0 5 10 15 20 25 30 35 40 45 50 55 60 65 70 75 80 85 90 95 100
per c
apita
pen
sion
ben
efits
(in
EU
R)f
ff
age in 2006
male
female
Figure 72: Public pension profile Netherlands: Average benefit per resident (2006, in EUR)
0
2.000
4.000
6.000
8.000
10.000
12.000
0 5 10 15 20 25 30 35 40 45 50 55 60 65 70 75 80 85 90 95 100
per c
apita
pen
sion
ben
efits
(in
EU
R)f
ff
age in 2006
male
female
202
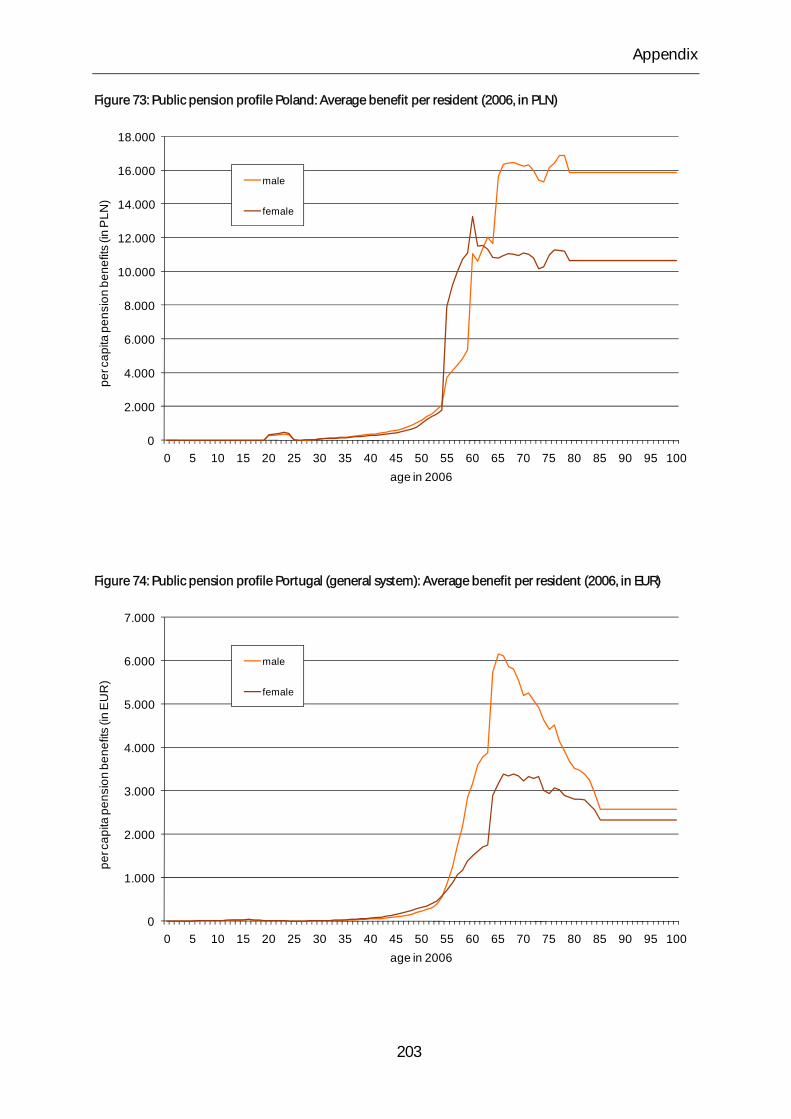
Appendix
Figure 73: Public pension profile Poland: Average benefit per resident (2006, in PLN)
0
2.000
4.000
6.000
8.000
10.000
12.000
14.000
16.000
18.000
0 5 10 15 20 25 30 35 40 45 50 55 60 65 70 75 80 85 90 95 100
per c
apita
pen
sion
ben
efits
(in
PLN
)fff
age in 2006
male
female
Figure 74: Public pension profile Portugal (general system): Average benefit per resident (2006, in EUR)
0
1.000
2.000
3.000
4.000
5.000
6.000
7.000
0 5 10 15 20 25 30 35 40 45 50 55 60 65 70 75 80 85 90 95 100
per c
apita
pen
sion
ben
efits
(in
EU
R)f
ff
age in 2006
male
female
203
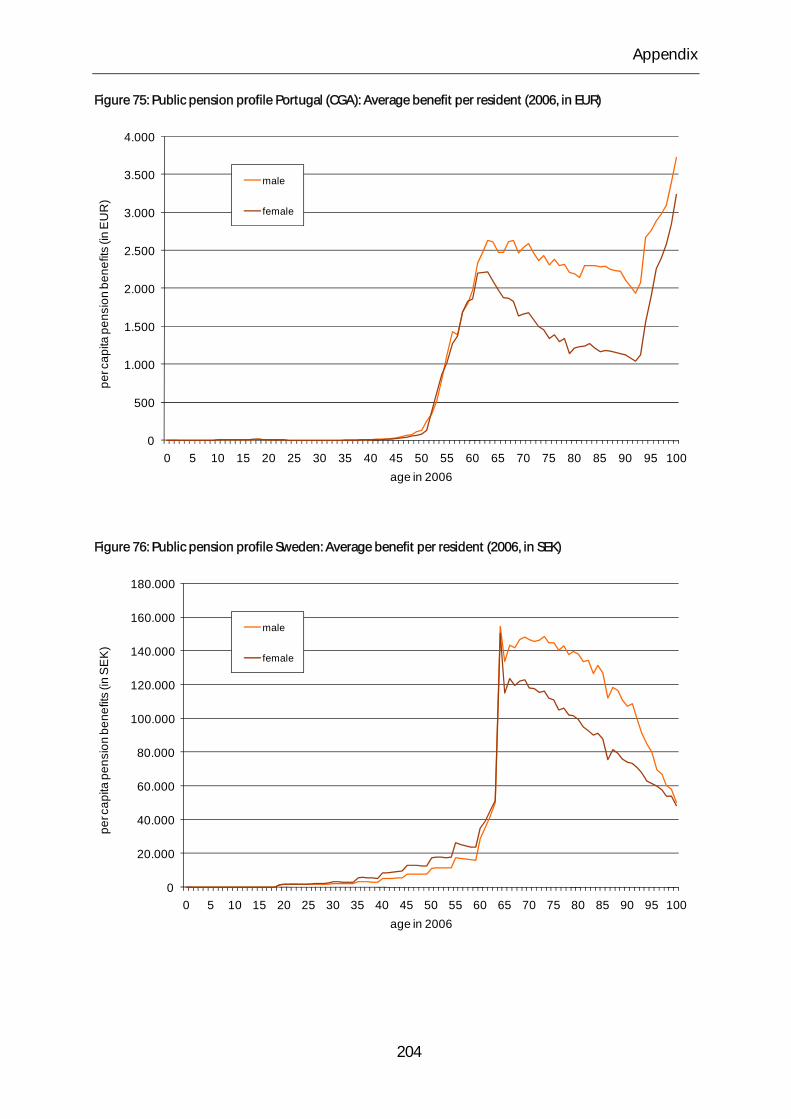
Appendix
Figure 75: Public pension profile Portugal (CGA): Average benefit per resident (2006, in EUR)
0
500
1.000
1.500
2.000
2.500
3.000
3.500
4.000
0 5 10 15 20 25 30 35 40 45 50 55 60 65 70 75 80 85 90 95 100
per c
apita
pen
sion
ben
efits
(in
EU
R)f
ff
age in 2006
male
female
Figure 76: Public pension profile Sweden: Average benefit per resident (2006, in SEK)
0
20.000
40.000
60.000
80.000
100.000
120.000
140.000
160.000
180.000
0 5 10 15 20 25 30 35 40 45 50 55 60 65 70 75 80 85 90 95 100
per c
apita
pen
sion
ben
efits
(in
SE
K)f
ff
age in 2006
male
female
204
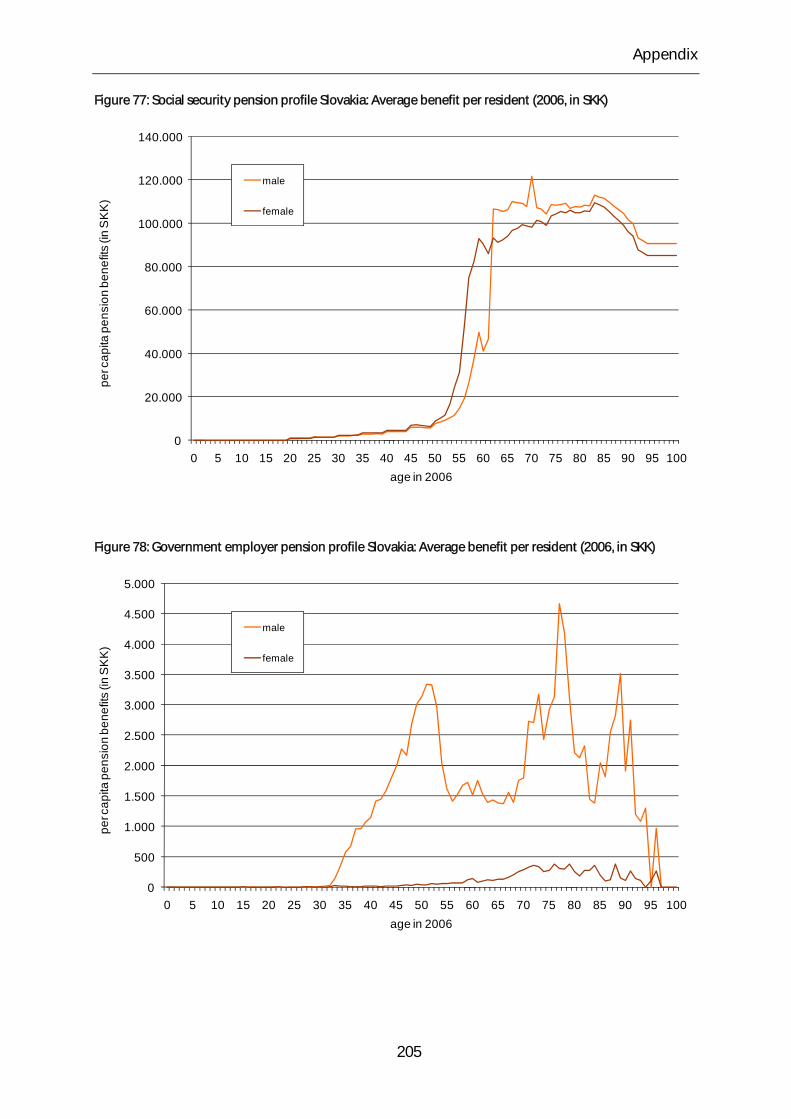
Appendix
Figure 77: Social security pension profile Slovakia: Average benefit per resident (2006, in SKK)
0
20.000
40.000
60.000
80.000
100.000
120.000
140.000
0 5 10 15 20 25 30 35 40 45 50 55 60 65 70 75 80 85 90 95 100
per c
apita
pen
sion
ben
efits
(in
SK
K)f
ff
age in 2006
male
female
Figure 78: Government employer pension profile Slovakia: Average benefit per resident (2006, in SKK)
0
500
1.000
1.500
2.000
2.500
3.000
3.500
4.000
4.500
5.000
0 5 10 15 20 25 30 35 40 45 50 55 60 65 70 75 80 85 90 95 100
per c
apita
pen
sion
ben
efits
(in
SK
K)f
ff
age in 2006
male
female
205
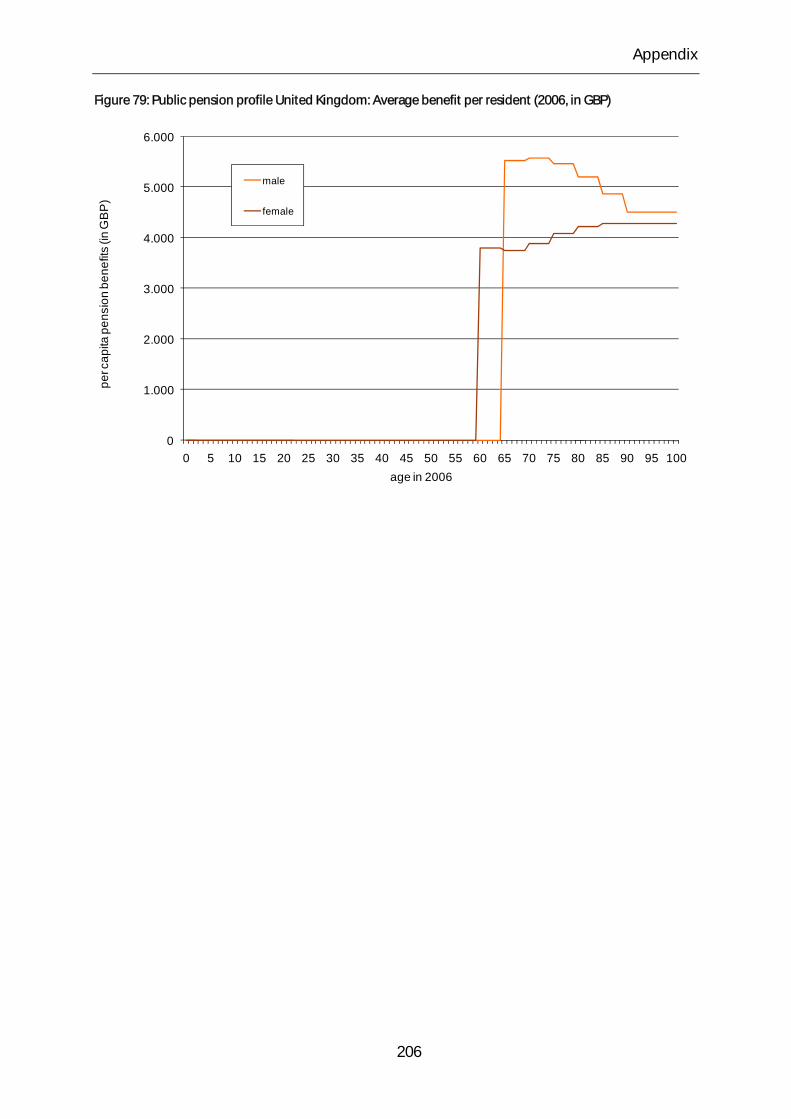
Appendix
Figure 79: Public pension profile United Kingdom: Average benefit per resident (2006, in GBP)
0
1.000
2.000
3.000
4.000
5.000
6.000
0 5 10 15 20 25 30 35 40 45 50 55 60 65 70 75 80 85 90 95 100
per c
apita
pen
sion
ben
efits
(in
GB
P)f
ff
age in 2006
male
female
206

Research Center for Generational Contracts
Freiburg University
Bertoldstraße 17
79098 Freiburg
Germany
Phone +49(0)761 . 203 23 54
Fax +49(0)761 . 203 22 90
www.generationenvertraege.de