Embed Size (px)
Citation preview

Rapid Ferritin Iron Release Using FMN Reductase
Mei I Lai1, 2*, Lim Wai Feng1, Boon Kar Yap3, Elizabeth George1, 2, Maha Abdullah1
1 Department of Pathology, Faculty of Medicine and Health Sciences, Universiti Putra Malaysia, UPM Serdang, Selangor, Malaysia. 2 Genetics and Regenerative Medicine Research Centre, Universiti Putra Malaysia. 3 College of Engineering, Universiti Tenaga Nasional. * Corresponding author. Tel: 03-8947 2494; email: [email protected] Manuscript submitted December 23, 2014; accepted February 24, 2015. doi: 10.17706/ijbbb.2015.5.2.111-119
Abstract: Iron deficiency anaemia is very common in developing countries and affects approximately two
billion people worldwide. To test for iron deficiency, the common practice is to detect the body’s ferritin
level using an automated machine. However, ferritin level can be confounded by inflammation which does
not affect the iron level that is available in the ferritin cage. Therefore, we designed a novel assay to achieve
rapid ferritin iron release for the detection of iron deficiency anaemia using various biochemical
compounds including reducing agents, oxygen scavenger compounds and chaotropic agents.
Key words: Iron deficiency anaemia, ferritin iron, ferritin, rapid assay.
1. Introduction
Iron deficiency anaemia is the most common cause of anaemia worldwide that affects almost two billion
people in many developing countries including Malaysia [1], [2]. The clinical symptoms of iron deficiency
anaemia and thalassaemia are very similar, thus misdiagnosis is easy [3]. In thalassaemia, there are either a
reduced or absent production of haemoglobins but a normal or increased absorption of iron [4]. In areas
without proper medical access, many anaemic individuals were misdiagnosed and treated with iron
because they were thought to have iron deficiency anaemia due to low haemoglobin content, but iron in
excess is toxic to the body. Excess iron is stored safely in ferritin protein and is readily available when our
body needs [5].
Serum/plasma ferritin is commonly used to assess the body’s iron status [6]. Serum/plasma ferritin is an
acute phase protein which is elevated with any inflammatory state [7], [8]. However, studies have shown
that iron available in the ferritin could clearly distinguish those with an iron overload from those with
elevated ferritin due to inflammation as the iron level is not affected by inflammation [9]. Many efforts have
been done to mobilize the iron from ferritin cage in vitro, either by direct chelation of iron(III) or by indirect
reductive mobilization in the presence of iron(II) chelating agents. However, studies showed that iron
mobilization by chelators such as desferrroxamine is rather slow compared to indirect mobilization using
various reducing agents [10]. Some studies showed that ferritin iron could be released by manipulating the
ferritin cage using chelating agents and forming coloured complex using a chromophore for
spectrophotometry detection [11]. Therefore, a thorough optimisation and quantification of iron release
from the ferritin cage would allow for the detection of the body’s iron status without interference from
inflammation.
International Journal of Bioscience, Biochemistry and Bioinformatics
111 Volume 5, Number 2, March 2015

2. Materials and Methods
Commercially available lyophilized human liver ferritin was purchased from Lee Biosolutions (Saint Louis,
MO, USA). Chromophores, reducing agents and other chemicals were obtained from Sigma-Aldrich(Saint
Louis, MO, USA) or Merck& Co. (Kenilworth, NJ, USA), and were of analytical reagent grade. The
spectrophotometric analysis was performed in Lambda 25 UV/Vis Spectrophotometer, PerkinElmer
(Waltham, MA, USA), VersaMax ELISAMicroplateReader, Molecular Devices (Sunnyvale, CA, USA) and
MultiskanTM GO Microplate Spectrophotometer, Thermo Fisher Scientific Inc. (Waltham, MA, USA). All
reactions were conducted at room temperature.
2.1. Standard Calibration Curve
Iron(II) substrate was added to the reactant (chromophore) in buffer pH 7.0. Spectrophotometric analysis
between 400-700 nm was carried out immediately. A calibration curve of iron(II) constructed to optimize
the optimum chromophore concentration needed to achieve spontaneous reaction. The amount of iron(II)
was calculated using Beer-Lambert Law.
A= -lg(I/I0) = εcl
The above equation is based on the Beer-Lambert law, which is widely used in quantitative analysis. The
absorbance, A, is directly proportionate to the concentration, c, of the compound measured, the path length
of the sample, l, and the molar absorption coefficient, ε, a wavelength-dependent constant characteristics of
the compound. I0, is the incident light intensity and I, is the transmitted light intensity. All compounds do
absorb some of the light that falls upon them giving them the energy to excite the electrons of the
compound to a higher energy level. The photometer was calibrated using a standard compound and
background noise was taken into account.
2.2. Iron Release from Human Liver Ferritin
In this section, the iron content of human liver ferritin was determined by inductive-coupled
plasma-mass spectrometry (ICP-MS). Iron(III) compound was used to construct the calibration curve in
order to determine the optimized concentration of reducing agents. Iron release of human liver ferritin was
induced and facilitated by the addition of FMN reductase at various concentrations according to previous
studies and oxygen scavenger system in the presence of the chromophore for detection purposes [12]-[14].
The recovery of ferritin iron release was compared with results from elementary analysis by ICP-MS.
3. Results and Discussion
3.1. Standard Calibration Curve
By spectrophotometric analysis, the concentration of colourediron(II)-chromophore complexes in
solution can be easily determined by correlating the absorbance readings with a standard curve [15].
Therefore, a standard curve was constructed as a reference to determine the iron(II) level in an unknown
sample. Fig. 1 shows the absorption spectra curve of the iron(II)-chromophore system at zero time, with 10
mM chromophore. The spectra curve of iron(II)-chromophore complex showed maximum absorbance at
562 nm with concentration in the range of 5-200 μg/L iron(II). At wavelength of 562 nm, the molar
absorption coefficient is 27,900 L mol-1 cm-1 according to Stookey [16]. As the concentration increased, the
absorbance peak was higher, indicating the proportional relationship between iron(II) concentration and
the absorbance readings. Fig. 2 shows the calibration curve of serial dilution with a range of 5-200 μg/L of
iron(II). For the calibration curve, it was a straight-lined graph, obeying the Beer Lambert Law. This was
International Journal of Bioscience, Biochemistry and Bioinformatics
112 Volume 5, Number 2, March 2015

used for downstream quantification of iron release from ferritin.
3.2. Optimization of Chromophore Concentration
Concentration of chromophore was determined using iron(II) compound in order to attain the optimum
concentration that is sufficient to form colourediron(II)-chromophore complexes with available iron(II) in a
solution. In order to facilitate the optimization purposes, microplate well was used to perform each assay in
triplicates using Multiskan GO microplate reader. Iron(II) in a range of 50-1000 μg/L was used to optimize
the optimum concentration of chromophore at pH 7.4, in a range of 10-500 μM. Fig. 3 shows the stability
ofiron(II)-chromophore complex within a 30 minutes time period; Fig. 3 shows the iron(II) amount ranging
from 5-1000 μg/L. The recovery of each iron amount of each chromophore concentration can be seen on Fig.
4.
Fig. 1. Absorption spectra curve of iron(II)-chromophore complex in buffer, pH 7.0, room temperature, 10
mM chromophore, with 5-200 μg/L of iron(II), 10 mm path-light cuvette.
Fig. 2. Calibration curve of iron(II)-chromophore complex in buffer, pH 7.0, room temperature, 10 mM
chromophore, with 5-200 μg/L of iron(II).
Fig. 3. The stability of iron(II)-chromophore complex in buffer, pH 7.4 room temperature at different
concentration of chromophore, at 5-1000 ug/L iron(II) within 30 minutes.
International Journal of Bioscience, Biochemistry and Bioinformatics
113 Volume 5, Number 2, March 2015

Fig. 4. Recovery of iron(II) in buffer, pH 7.4 room temperature at different concentrations of chromophore,
at 5-1000 ug/L iron(II).
At 10 μM chromophore, there was significantly lowered absorbance readings as compared with others
while the recovery of iron(II) was poor, suggesting insufficient chromophore concentration to complex with
iron(II). At 50 μM chromophore, iron at 500 μg/L and 1000 μg/L required a few minutes to plateau and only
achieved 80% Fe(II) recovery in 1000 μg/L iron(II), suggesting inadequate chromophore available for
iron(II) coupling at 1000 μg/L of iron(II). On the contrary, the reaction is spontaneous at 100, 250 and 500
μM chromophore for iron(II) concentration up to 1000 μg/L of iron(II) (Fig. 3). However, for the 5 μg/L
iron(II), the recovery was inconsistent within a 30 minute period, suggesting that the low iron(II) amount
readings might hampered by background noise.
3.3. Reduction Effectiveness
Studies have showed that FMN reductase is effective enough to liberate iron(II) from insoluble iron(III)
inside the ferritin cage, whereby FMN reductase reduces both NADH and FMN simultaneously. Therefore,
the effectiveness of FMN reductase can be confirmed by examining the changes of the maximum absorption
peaks, respectively [17]. Shorter path-light cuvette was used to resolve higher concentrations of the specific
compound. Fig. 5 shows the changes of the absorbance readings of maximum absorption peaksin NADH and
FMN, respectively. Concentrations of both NADH and FMN decreased over time indicating the production of
reducing agents. Optimum concentration of both NADH and FMN was used to induce ferritin iron release.
Fig. 5. Absorption spectra curve of NADH (2 mM) and FMN (0.2 mM) in buffer, pH 7.4, room temperature.
NADH
FMN
International Journal of Bioscience, Biochemistry and Bioinformatics
114 Volume 5, Number 2, March 2015

3.4. Optimization of FMN Reductase Concentration
Concentration of FMN reductase was determined using iron(III) compound and optimized chromophore
concentration in order to attain the optimum concentration that is sufficient to induce the liberation of
soluble iron(II) from insoluble iron(III) inside the ferritin cage. Iron(III) in a range of 50-3000 μg/L was
used to optimize the optimum concentration of the reducing agents at pH 7.4. Fig. 6 shows the stability of
iron(II)-chromophore complex within 30 minutes after iron(III) was converted to iron(II) by the reducing
agents followed by the formation of iron(II)-chromophore complex in the presence of 1.0 mM chromophore.
Lower iron(III) amount might require relatively lower concentration of reducing agents to attain the
stability of the complex formed. However, in higher reducing agents concentration as in 500 μg/L of
iron(III), the absorbance fluctuated, suggesting that the complex was not stable, probably due to the
excessive unused reducing agents in the assay, which may be detrimental to the iron(II)-chromophore
complex formed.
Fig. 6. The stability of iron(II)-chromophore complex in buffer, pH 7.4, room temperature at different
concentration of FMN reductase over 30 minutes.
3.5. Effects of Oxygen Scavenger System
Iron(II) is readily converted back to iron(III) in the presence of oxygen [18]. To avoid this complication,
oxygen scavenger was added to each assay to minimize the oxidization of iron(II) to iron(III). Additionally,
the oxygen scavenger also played a crucial role to avoid FMN reductase from being oxidized in this
experiment setup. Therefore, oxygen scavenger was added to remove dissolved oxygen that was introduced
unintentionally during the buffer preparation and experiment setup. Iron(III) in the range of 50-3000 μg/L
was used. Fig. 7 shows the stability of iron(II)-chromophore complex within 30 minutes after iron(III) was
converted to iron(II) by the reducing agents followed by the formation of the iron(II)-chromophore complex
in the presence of the chromophore and the oxygen scavenger. As compared to Fig. 6 (without the oxygen
scavenger), Fig. 6 shows improvement in the stability of the iron(II)-chromophore complex in 50 μg/L and
500 μg/L iron(III) respectively. Also, improvement in the stability of the iron(II)-chromophore complex was
found in both 2000 μg/L and 3000 μg/L iron(III), but not in 0.5 mM FMN reductase concentrations that
probably overwhelmed the reaction system as time elapsed.
International Journal of Bioscience, Biochemistry and Bioinformatics
115 Volume 5, Number 2, March 2015
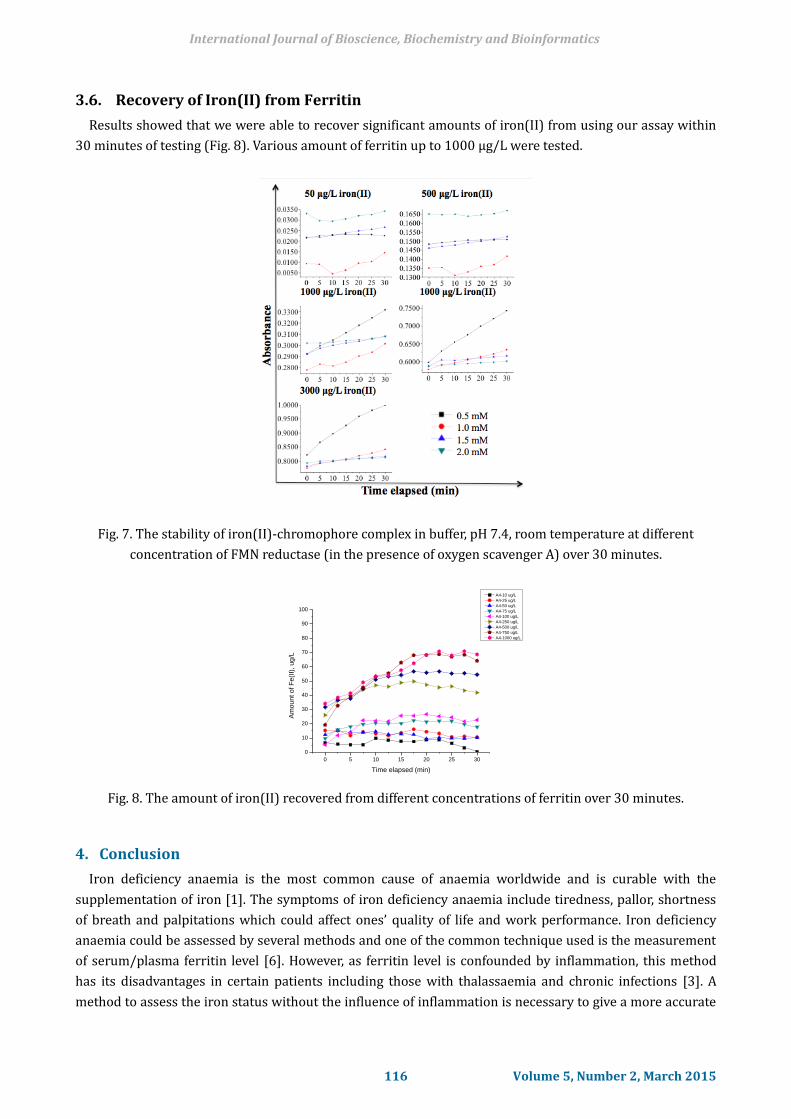
3.6. Recovery of Iron(II) from Ferritin
Results showed that we were able to recover significant amounts of iron(II) from using our assay within
30 minutes of testing (Fig. 8). Various amount of ferritin up to 1000 µg/L were tested.
Fig. 7. The stability of iron(II)-chromophore complex in buffer, pH 7.4, room temperature at different
concentration of FMN reductase (in the presence of oxygen scavenger A) over 30 minutes.
Fig. 8. The amount of iron(II) recovered from different concentrations of ferritin over 30 minutes.
4. Conclusion
Iron deficiency anaemia is the most common cause of anaemia worldwide and is curable with the
supplementation of iron [1]. The symptoms of iron deficiency anaemia include tiredness, pallor, shortness
of breath and palpitations which could affect ones’ quality of life and work performance. Iron deficiency
anaemia could be assessed by several methods and one of the common technique used is the measurement
of serum/plasma ferritin level [6]. However, as ferritin level is confounded by inflammation, this method
has its disadvantages in certain patients including those with thalassaemia and chronic infections [3]. A
method to assess the iron status without the influence of inflammation is necessary to give a more accurate
0 5 10 15 20 25 30
0
10
20
30
40
50
60
70
80
90
100
Am
ou
nt o
f F
e(I
I), u
g/L
Time elapsed (min)
A4-10 ug/L
A4-25 ug/L
A4-50 ug/L
A4-75 ug/L
A4-100 ug/L
A4-250 ug/L
A4-500 ug/L
A4-750 ug/L
A4-1000 ug/L
International Journal of Bioscience, Biochemistry and Bioinformatics
116 Volume 5, Number 2, March 2015

account of the iron status level.
We have used FMN reductase to reduce the iron(III) to iron(II) in ferritin, which complexes with the
chromophore to form iron(II)-chromophore complex to be detected by a spectrophotometer assisted by the
oxygen scavenger system to remove any dissolved oxygen in order to avoid oxidation of both reducing
agents and iron(III) in this experiment setup. We believe that this procedure would lead to a novel rapid
assay that will be beneficial in quantifying the total iron levels in the ferritin without being confounded by
inflammation.
Acknowledgments
The authors wish to thank George E, Yap BK and Abdullah M for providing expert consultation. Lim WF
designed the experiments. Lai MI is the project leader.
References
[1] Miller, J. L. (2013). Iron deficiency anemia: A common and curable disease. Cold Spring Harbor
Perspectives in Medicine, 3(7), a011866.
[2] WHO (2007). Assessing the Iron Status of Populations: Report of a Joint World Health
Organization/Center for Disease Control and Prevention Technical Consultation on the Assessment of Iron
Status at the Population Level (2nd ed.). Geneva: World Health Organization.
[3] Arthur, C. K., & Isbister, J. P. (1987). Iron deficiency, misunderstood, misdiagnosed and mistreated.
Drugs, 33(2), 171-182.
[4] Pasricha, S. S., Flecknoe-Brown, S. C., Allen, K. J., Gibson, P. R., Mc Mahon, L. P., Olynyk, J. K., et al. (2010).
Diagnosis and management of iron deficiency anaemia: A clinical update. The Medical Journal of
Australia, 139(9), 525-532.
[5] Theil (2013). Ferritin: The protein nanocage and iron biomineral in health and in disease. Inorganic
Chemistry, 52(21), 12223-12233.
[6] Haskins, D., Stevens, A. R., Finch, S., & Finch, C. A. (1952). Iron metabolism, iron stores in man as
measured by phlebotomy. The Journal of Clinical Investigation, 31(6), 543-547.
[7] Nielsen, P., Gunther, U., Durken, M., Fischer, R., & Dullmann, J. (2000). Serum ferritin iron in iron
overload and liver damage: Correlation to body iron stores and diagnostic relevance. Journal of
Laboratory and Clinical Medicine, 135(5), 413-418.
[8] Nielsen, P., Engelhardt, R., Düllmann, J., & Fischer, R. (2002). Non-invasive liver iron quantification by
SQUID-Biosusceptometry and serum ferritin iron as new diagnostic parameters in hereditary
hemochromatosis. Blood Cells, Molecules, and Diseases, 29(3), 451-458.
[9] Herbert, V., Jayatilleke, E., Shaw, S., Rosman, A. S., Giardina, P., Grady, R. W., et al. (1997). Serum ferritin
iron, a new test, measures human body iron stores unconfounded by inflammation. Stem Cells, 15(4),
291-296.
[10] Arosio, P., Ingrassia, R., & Cavadini, P. (2009). Ferritins: A family of molecules for iron storage
antioxidation and more. Biochimica et Biophysica Acta, 1790(7), 589-599.
[11] Jones, T., Spencer, R., & Walsh, C. (1978). Mechanism and kinetics of iron release from ferritin by
dihydroflavins and dihydroflavin analogues. American Chemical Society, 17(19), 4011-4017.
[12] Liu, X., & Theil, E. (2003). Opening protein pores with chaotropes enhances Fe reduction and chelation
of Fe from the ferritin biomineral, Proceedings of the National Academy of Sciences of the United States
of America, 100(7), 3653-3658.
[13] Kidane, T. Z., Sauble, E., & Linder, M. C. (2006). Release of iron from ferritin requires lysosomal activity.
American Journal of Physiology – Cell Physiology, 291(3), C445-C455.
International Journal of Bioscience, Biochemistry and Bioinformatics
117 Volume 5, Number 2, March 2015

[14] Domenico, I. D., Vaughn, M. B., Li, L., Bagley, D., Musci, G., Ward, D. M., & Kaplan, J. (2006).
Ferroportin-mediated mobilization of ferritin iron precedes ferritin degradation by the proteasome.
European Molecular Biology Organization, 25(22), 5396-5404.
[15] Ahmed & Roy (2009). A simple spectrophotometric method for the determination of iron(II) aqueous
solutions. Turkish Journal of Chemistry, 33(5), 709-726.
[16] Stookey (1970). Ferrozine – A new spectrophotometric reagent for iron. Analytical Chemistry, 42(7),
779-781.
[17] Melman, G., Bou-Abdallah, F., Vane, E., Maura, P., Arosio, P., & Melman, A. (2013). Iron release from
ferritin by flavin nucleotides. Biochimica et Biophysica Acta, 1830(10), 4669-4674.
[18] Stumm, W., & Lee, G. F. (1961). Oxygenation of ferrous iron. Industrial and Engineering Chemistry, 53(2),
143-146.
Mei I Lai graduated with BSc. in biomedical Science from Universiti Putra Malaysia in 2002
and pursued her PhD in molecular haematology at King’s College London from the year
2003-2007. She then returned to Universiti Putra Malaysia to a position as a senior lecturer
in the Haematology Unit, Department of Pathology, Faculty of Medicine and Health
Scicences.
Her current research interest is the modifiers of beta-thalassaemia. In particular, she studied the roles
played by several tertiary modifiers including alpha-haemoglobin stabilising as well as Bach1. Currently she
is investigating ferritin iron release for rapid testing. She has published in various international journals
including Blood, British Journal of Haematology and Twin Research and Human Genetics.
She is affiliated to the Genetics and Regenerative Medicine Research Center in Universiti Putra Malaysia
and a member of the Malaysian Society of Haematology.
Lim Wai Feng graduated with BSc. in biochemistry from Universiti Putra Malaysia in 2008
and pursued her MSc. in haematology at Universiti Putra Malaysia in 2011. She is currently
pursuing her PhD in molecular biology at Universiti Putra Malaysia.
Her MSc. research elucidates the roles of alpha-haemoglobin stabilising protein and foetal
haemoglobin in modulating the severity of beta-thalassaemia intermedia. Currently, she is
investigating ferritin iron release for rapid testing. She was a field application specialist in
2011. She was the recipient of a fellowship supported by Takeda Scientific Foundation, Japan in 2012 and
was attached to Kyushu University, Japan. She has published in various international journals including
Blood Cells, Molecules, and Diseases, Stem Cell Research & Therapy and Hematology.
She was awarded with best paper award in 2014 IEEE EMBS International Student Conference and is
currently a member of Toastmaster International.
Boon Kar Yap graduated with bachelor of electrical and electronic engineering from
Universiti Tenaga Nasional in 2002 and graduated her MSc. in optics and photonics and PhD
in experimental solid state physics at Imperial College London in 2003 and 2007,
respectively. She then returned to Universiti Tenaga Nasional to a position as a senior
lecturer in Department of Electronics and Communication Engineering, College of
Engineering.
International Journal of Bioscience, Biochemistry and Bioinformatics
118 Volume 5, Number 2, March 2015
Her current research interests are organic electronic, wire bonding and advanced material in IC
packaging, LED lighting system for biomedical engineering and agricultural purposes. She was a Product
Development Engineer in 2002 and a post-doctoral researcher in 2007-2008. She has published in various
international journals including Advanced Materials Research, Advances in Environmental Biology and
Australian Journal of Basic and Applied Sciences.
She is a member of the Society of Information, Institute of Physics, Malaysia and Institute of Physics, UK.
Elizabeth George graduated with M.B.B.S from Universiti Malaya in 1971. She received her
F.R.C.P.A and F.R.C.P.E in 1987 and 1995, respectively. In 1993, she graduated with M.D
higher doctorate in National University of Singapore. She then worked as a lecturer,
associate professor and professor from 1981-2001 in Universiti Kebangsaan Malaysia. She is
currently a professor in the Haematology Unit, Department of Pathology, Faculty of Medicine
and Health Sciences, Universiti Putra Malaysia.
Her current research interests are the development and assessment of thalassaemia
screening protocols and the screening of thalassaemia in umbilical cord blood samples in Malaysia. She was
instrumental in setting up the haematological services at the Department of Pathology, Universiti
Kebangsaan Malaysia in 1977 and has expertise in the clinical management of patients with thalassaemia
and haemoglobinopathies. She was the recipient of a fellowship in haematology from the Royal College of
Pathologists (Australasia). Her specialisation in the field of thalassaemia has made her a widely published
author.
She is affiliated to the Genetics and Regenerative Medicine Research Center in Universiti Putra Malaysia
and a member of the Malaysian Society of Haematology.
Maha Abdullah is an associate professor with the Immunology Unit, Department of
Pathology, Faculty of Medicine and Health Sciences, Universiti Putra Malaysia. She obtained
her Ph.D. in immunology from Universiti Putra Malaysia, M.Sc. in immunology and molecular
biology from University Malaya and B.Sc. in microbiology from Universiti Kebangsaan
Malaysia. Her research interests are in immunomodulatory effects of food, cancer immunity
and drug resistance in acute leukemias. She has published in various international journals
including Cellular Immunology, Hematology and Molecular Nutrition and Food Research.
International Journal of Bioscience, Biochemistry and Bioinformatics
119 Volume 5, Number 2, March 2015