Embed Size (px)
Citation preview
1
Iron overload coordinately promotes ferritin expression and fat 1
accumulation in Caenorhabditis elegans 2
Haizhen Wang1,3
, Xue Jiang1,3
, Jieyu Wu1,3
, Linqiang Zhang1,3
, Jingfei Huang4, Yuru 3
Zhang1, Xiaoju Zou
2*, Bin Liang
1* 4
5
1, Key Laboratory of Animal Models and Human Disease Mechanisms of the Chinese 6
Academy of Sciences & Yunnan Province, Kunming Institute of Zoology, Chinese 7
Academy of Sciences. Kunming 650223, China 8
2, Department of Life Science and Biotechnology, Key Laboratory of Special 9
Biological Resource Development and Utilization of University in Yunnan Province, 10
Kunming University, Kunming 650214, China 11
3, Kunming College of Life Science, University of Chinese Academy of Sciences, 12
Kunming, Yunnan 650204, China 13
4, State Key Laboratory of Genetic Resources and Evolution, Kunming Institute of 14
Zoology, Chinese Academy of Sciences. Kunming 650223, China 15
16
¶These authors contributed equally to this work 17
18
*Corresponding authors: 19
[email protected] and [email protected] 20
Genetics: Early Online, published on March 26, 2016 as 10.1534/genetics.116.186742
Copyright 2016.

2
Abstract 21
The trace element iron is crucial for living organisms since it plays essential roles 22
in numerous cellular functions. Systemic iron overload and the elevated level of 23
ferritin, a ubiquitous intracellular protein that stores and releases iron to maintain the 24
iron homeostasis in cell, has long been epidemiologically associated with obesity and 25
obesity related diseases. However, the underlying mechanisms of this association 26
remain unclear. Here, using C. elegans, we show that iron overload induces the 27
expression of sgk-1, encoding the serum and glucocorticoid inducible kinase, to 28
promote the level of ferritin and fat accumulation. Mutation of cyp-23A1, encoding a 29
homolog of human cytochrome P450 CYP7B1 that is related to neonatal 30
hemochromatosis, further enhances the elevated expression of ftn-1, sgk-1, and fat 31
accumulation. sgk-1 positively regulates the expression of acs-20 and vit-2, genes 32
encoding homologs of the mammalian FATP1/4 fatty acid transport proteins and yolk 33
lipoproteins, respectively, to facilitate lipid uptake and translocation for storage under 34
iron overload. This study reveals a completely novel pathway in which sgk-1 plays a 35
central role to synergistically regulate iron and lipid homeostasis, offering not only 36
experimental evidence supporting a previously unverified link between iron and 37
obesity, but also novel insights into the pathogenesis of iron and obesity related 38
human metabolic diseases. 39
40
Keywords: Iron; the serum and glucocorticoid inducible kinase SGK-1; Lipid uptake; 41
Obesity; C. elegans. 42
3
43
Introduction 44
Due to its essential roles in numerous cellular functions across nearly all living 45
organisms, including oxygen transport, electron transport, DNA synthesis, and 46
enzyme catalysis, exploring how iron is stored and regulated has been a growing 47
focus in numerous fields. Dietary iron is absorbed primarily by duodenal enterocytes 48
via the divalent metal-ion transporter 1 (DMT1) after it is reduced at the apical 49
membrane. Subsequently, it is either stored in ferritin, which dynamically regulates 50
iron sequestration, storage, and release; or it is transported from enterocytes into the 51
blood stream via the basolateral transporter ferroportin(FLEMING and PONKA 2012). 52
Consequently, the total amount of iron in the body is determined by its intake 53
andstorage, which are all finely regulated by many factors and signaling pathways at 54
various levels(FLEMING and PONKA 2012; HUBLER et al. 2015), many of which are 55
not entirely understood. 56
Human epidemiology studies revealed that elevated levels of ferritin may be an 57
indication of systemic iron overload(COOK et al. 1974; ZIMMERMANN 2008), are 58
positively associated with obesity(WENZEL et al. 1962; GILLUM 2001; IWASAKI et al. 59
2005) and obesity related diseases such as diabetes, hypertension, dyslipidaemia, or 60
nonalcoholic fatty liver disease(JEHN et al. 2004; BOZZINI et al. 2005; MASCITELLI et 61
al. 2009; DONGIOVANNI et al. 2011; KIM et al. 2011) ((ZAFON et al. 2010) for review). 62
Precisely why elevations in ferritin levels or systemic iron overload are associated 63
with these conditions is not entirely clear, with potential explanations ranging from 64
4
excess iron causing oxidative stress, endoplasmic reticulum (ER) stress, inflammation, 65
and dysfunction of adipose tissue(HUBLER et al. 2015; NIKONOROV et al. 2015). 66
When including other environmental or dietary factors, the relationship between 67
obesity, its comorbidities and iron becomes more complex. The 3T3-L1 preadipocytes 68
require iron for adipogenesis(MORENO-NAVARRETE et al. 2014a), and iron increase in 69
the rate of adipocyte lipolysis(RUMBERGER et al. 2004). In the mouse liver, iron 70
significantly up-regulates the transcripts of seven enzymes in the cholesterol 71
biosynthesis pathway, resulting into cholesterol accumulation. This occurs 72
independently of the conserved lipogenic regulator SREBP2(GRAHAM et al. 2010). 73
The combination of iron and lipid rich diet may exacerbate this situation because 74
lipids also cause oxidative and ER stress, as well as inflammation. Collectively, this 75
helps explain why dietary iron supplementation concurrent with a high-fat diet (HFD) 76
greatly increases adiposity in rats(TINKOV et al. 2013), as well as hepatic fat 77
accumulation in the liver of mice(CHOI et al. 2013). The association seems to also 78
hold true in reverse. Several studies found that reduction of iron by several different 79
methods led to amelioration of adiposity and improvement of obesity and obesity 80
related diseases(ZHANG et al. 2005; FLEMING and PONKA 2012; TAJIMA et al. 2012; 81
MORENO-NAVARRETE et al. 2014a; MORENO-NAVARRETE et al. 2014b). Unfortunately, 82
the mechanisms of this association between iron and lipid accumulation or obesity 83
remain largely unclear. 84
Though human clinical studies would likely shed a great deal of light on this 85
relationship, such studies are not always practical or even possible. Alternatively, C. 86
5
elegans may offer an ideal model due to the highly conserved nature of many proteins 87
involved in iron homeostasis including iron uptake (SMF-3, a homolog of DMT1), 88
storage (FTN-1 and FTN-2, encoding ferritin) and export (FPN-1.1, FPN-1.2, 89
FPN-1.3, encoding ferroportin), as well as potential orthologues for DCYTB 90
ferrireductase and hephaestin multicopper oxidase(ANDERSON and LEIBOLD 2014). 91
Moreover, C. elegans FTN-1 and FTN-2 are more similar to human FTH than to FTL, 92
and both FTN-1 and FTN-2 contain ferroxidase active-site residues(GOURLEY et al. 93
2003). Under iron overload, the expression of ftn-1 gene and protein, and to a lesser 94
extent ftn-2, are induced; in contrast, the expression of SMF-3 is suppressed to reduce 95
iron uptake(GOURLEY et al. 2003; KIM et al. 2004). ftn-1RNAi(KIM et al. 2004) or 96
ftn-1(ok3625) deletion mutant(VALENTINI et al. 2012) are iron sensitive and have 97
reduced lifespans when exposed to high iron. 98
While these studies have investigated how iron affects growth, development, and 99
longevity in C. elegans, whether or not it also coordinately regulates lipid metabolism 100
is entirely unclear. In this study we used C. elegans to identify novel genes and 101
unravel complex pathways involved in iron metabolism and lipid metabolism. Our 102
results show that iron overload by the established dietary supplementation with 103
ammonium ferric citrate (FAC)(GOURLEY et al. 2003) coordinately promotes the 104
expression of ferritin and fat accumulation in C. elegans. Specifically, iron overload 105
induces the serum and glucocorticoid inducible kinase sgk-1 to positively regulate 106
acs-20 and vit-2, facilitating lipid uptake and accumulation. 107
108
6
Materials and Methods 109
C. elegans strains 110
C. elegans strains were maintained under standard culture conditions on NGM agar 111
with E. coli OP50, unless otherwise specified. The wild type strain was N2. The 112
strains used in this study were as follows: acs-20(tm3232)IV, age-1(hx546)II, 113
akt-1(ok525)V, cyp-23A1(gk253)II, daf-2(e1370)III, ftn-1::GFP{XA6900, pha-1 114
(e2123ts)III;qaEx01[ftn-1::△pes-10::GFP-his,pha-1(+)]}(ROMNEY et al. 2008)), 115
cyp-23A1(gk253)II;ftn-1::GFP{XA6900, pha-1(e2123ts)III;qaEx01[ftn-1:: 116
△pes-10 ::GFP-his,pha-1(+)]}, sgk-1(ft15)X, sgk-1(ok538)X, sgk-1(ok538)X; 117
cyp-23A1(gk253), sgk-1::gfp(MQD862,N2;Psgk-1::sgk-1::gfp) (HERTWECK et al. 118
2004; ZHU et al. 2015), rsks-1(ok1255)III,vit-2(ok3211)X, vit-3(ok2348)X, 119
vit-2::gfp{RT130,unc-199(ed3);pwIs23[Pvit-2::vit-2::gfp, unc119(+)]}(VAN ROMPAY 120
et al. 2015), cyp-23A1(gk253);vit-2::gfp {RT130, unc-199(ed3);pwIs23 121
[Pvit-2::vit-2::gfp,unc119(+)]}, acs-20(tm3232);vit-2::gfp {RT130,unc-199(ed3); 122
pwIs23[Pvit-2::vit-2::gfp,unc119(+)]}. 123
124
Construction of Psgk-1::gfp extrachromosomal transgenic 125
strain 126
The Psgk-1::gfp transgenes was created using methods as previously described by 127
Frokjaer-Jensen et al. (FROKJAER-JENSEN et al. 2008), and the transgenic strain was 128
created by microinjection. Briefly, an extrachromosomal transgenic strain was made 129
by injection into the EG4322 (ttTi5605;unc-119(ed3). The injection mix consisted of 130

7
50 ng/μl pCFJ151 inserted with target DNA fragment, pJL43.1 (Pglh-2::transposase), 131
5 ng/μl pCFJ104 (Pmyo-3::mCherry) and 2.5 ng/μl pCFJ90 (Pmyo-2::mCherry). 132
DNA mixtures were injected into the gonads of young adult C. elegans. The 133
extrachromosomal transgenic strain was assigned kunEx126[unc-119(ed3); 134
Psgk-1::gfp+unc-119(+)]. The primers are used for amplification of Psgk-1::gfp are 135
Psgk-1F: GGATATCTGGATCCACGAA CTCCGGTAACTTACTCATTTTC, 136
Psgk-1R2: GTCGACCTGCAGGCATGCAACC TCACCATTCTCGACTCTG, 137
GFP+unc-54 3’UTR-F: TTGCATGCCTGCAGGTCG AC, GFP+unc-54 3’UTR--R: 138
CCAGAGCTCACCTAGGTATCTGCCGACTAGTAG GAAACAGT. 139
140
Supplementation of ammonium ferric citrate (FAC) 141
FAC supplementation was performed as the described previously(ROMNEY et al. 142
2008). In brief, synchronized L1 worms were placed and cultivated on NGM plates 143
supplied with 2.5 mg/ml or 5 mg/ml FAC. pH value of FAC medium was adjusted to 144
7.0. L4 worms or young adults were harvested for further analysis. 145
146
RNAi screen regulators of ftn-1::GFP 147
Synchronized ftn-1::GFP(XA6900) L1 worms were seeded on NGM plates 148
supplemented with FAC (5 mg/ml) or not. The performance of RNAi by feeding was 149
followed as we described previously(ZHANG et al. 2013). Worms were collected 150
around 60 hours at young adult stage, and GFP fluorescence was visualized under a 151
fluorescence microscopy (BX53, Olympus, Japan). RNAi of a specific gene displayed 152
8
changed expression of FTN-1::GFP was considered as potential regulator of 153
ftn-1::GFP. 154
155
Visualization of GFP fluorescence 156
At least 20 GFP worms were picked and mounted on an agarose pad and anesthetized 157
using 10 mM sodium azide. GFP fluorescence was visualized under an OLYMPUS 158
BX53 fluorescence microscope (Olympus, Japan). 159
160
Quantitative PCR (QPCR) analysis 161
Total RNA and cDNA preparation and QPCR performance was followed as the 162
described previously(DING et al. 2015). 163
164
Nile Red staining of fixed nematodes 165
L4s or young adults nematodes were washed off of growth plates, then fixed and 166
stained with Nile Red as done previously(BROOKS et al. 2009; LIANG et al. 2010). 167
Images were captured using identical settings and exposure time for each image, 168
unless specifically noted. 169
170
Lipid extraction and analysis 171
Lipid extraction and analysis of young adult nematodes was determined as described 172
previously(WATTS and BROWSE 2006; SHI et al. 2013). To determine the 173
triacylglycerol and phospholipids, lipid extraction and thin-layer chromatography 174
9
(TLC) and gas chromatography (GC) was performed as described in by(WATTS and 175
BROWSE 2006; SHI et al. 2013). 176
177
Dietary supplementation of oleic acid (OA, C18:1(n-9)) 178
Fatty acid supplementation was carried out by adding sodium oleic acid (OA) 179
(NuChek Prep, USA) at a final concentration of 0.2 mM to NGM media as we 180
previously described(SHI et al. 2013). Synchronized L1 worms were cultivated on 181
NGM agar plates supplied with OA. Young adults were washed off the plates, and 182
fatty acid composition of adult nematodes was determined as previously 183
described(WATTS and BROWSE 2002; LIANG et al. 2010). 184
185
Fluorescent fatty acid probe analysis 186
Analysis of fluorescent fatty acid probe was modified from Spanier, et.al(SPANIER et 187
al. 2009). 4,4-difluoro-5-methyl-4-bora-3a,4a-diaza-3-indacene-dodecanoic acid 188
(BODIPY 500/510 C1, C12, Sigma, USA) was dissolved in DMSO to a final 189
concentration of 2.4 uM and then attenuated to 20 nM by M9 buffer. Briefly, 190
synchronized L1 worms were cultivated on NGM plates, and were harvested at L4 191
stage, which were immediately incubated in 20 nM BODIPY-12 solution for 10 min, 192
and then visualized under a fluorescent microscope OLYMPUS BX53 (OLYMPUS, 193
Japan). 194
195
Quantification of lipid droplet size 196
10
Quantification of the diameter of lipid droplets (LDs) was followed as the described 197
by(SHI et al. 2013). In brief, young adult worms were fixed and stained by Nile Red 198
and photographed. A 50×50 um square was selected in the mid of the intestine for 199
each worm and all of the LDs in this square were measured by the software CellSens 200
Standard (OLYMPUS, Japan). Roughly 10 worms were measured for each worm 201
strain or treatment. 202
203
Lipid droplet purification 204
Lipid droplets (LD) of C. elegans were isolated as described by Zhang(ZHANG et al. 205
2012). In brief, 4 X 10⁵ worms were harvested and washed by M9 buffer 3 times, and 206
by buffer A. Next, worms were homogenized by a Homogenizer (Cole-Parmer 207
LabGENR700), centrifuged at 1000 X g 30 s. The supernatants were homogenized 208
again by a nitrogen cell disruption vessel (4639 45 ml cell disruption vessel, Parr 209
Instrument, Moline, IL, USA) at 500 psi for 30 min on ice. A 9 ml supernatant was 210
loaded into a sw40 tube with 3 ml buffer B on the top, centrifuged at 10000 X g for 1 211
hr at 4℃. LD fraction was transfer to another 1.5 ml tube and was washed with 200 ul 212
buffer B 3 times. 213
214
Western blot analysis 215
Young adults with 1-3 eggs were harvested, and their tissues ground and homogenized 216
at 4°C with an extraction buffer. The tissue homogenates were then centrifuged, and 217
the supernatants were used for western blot analysis. The LD-protein and lipid sample 218
11
were prepared as previously(ZHANG et al. 2012). Proteins were separated by 12% 219
SDS gel (Bio Rad) and then transferred to polyvinylidene difluoride membranes. The 220
Primary antibodies were sc8334 (Santa Cruz Biotechnology, USA) rabbit anti-GFP 221
antibody at 1:200 dilution, O00141 (Enzo, USA) rabbit anti-SGK-1 antibody at 222
1:1000 dilution. Anti-DHS-3, anti-CAV-1, and anti-BIP antibodies were used as 223
previously described by Zhang et al.(ZHANG et al. 2012). The secondary antibody was 224
goat anti rabbit IgG from Beyotime (Beyotime, China) at 1:5000 dilution. The 225
membrane was exposed to chemiluminescent sbusrate (PIERCE), and the film 226
(Carestream, Xiamen, China) was then developed. 227
228
Statistical analysis 229
Data are presented as mean ± SEM, except when specifically indicated. Statistical 230
analysis performed included t-test or analysis of variance (ANOVA) followed by LSD 231
multiple comparisons using SPSS20.0 (IBM SPSS Statistics, Armonk, NY, USA). All 232
Figures were made using GraphPad Prism 5 (GraphPad Software, La Jolla, CA, 233
USA). 234
235
Results 236
Iron induces sgk-1 expression to upregulate ferritin 237
expression and fat accumulation 238
To determine whether iron overload promotes fat accumulation in C. elegans, we 239
applied ammonium ferric citrate (FAC) to NGM plates. Consistent with previous 240
12
reports(GOURLEY et al. 2003; ROMNEY et al. 2008), FAC induced the expression of 241
FTN-1::GFP (Fig.. 1A) and ftn-1 mRNA (Fig.. 1B) in wild type N2. Concurrently, 242
FAC promoted fat accumulation, as indicated by an increase size of lipid droplets 243
(LDs) and increased abundance of large sized LDs (Fig.. 1C, Fig.. S1A and S1B, Fig.. 244
S2). Consistently, isolated LDs from N2 as well as two reported LD markers 245
DHS-3::GFP(ZHANG et al. 2012) and mRuby::DGAT-2(XU et al. 2012) further 246
confirmed that FAC indeed increases LD size (Fig.. 1D). Furthermore, lipid 247
quantitation by thin-layer chromatography and gas chromatography (TLC/GC) show 248
that the relative percentage of triacylglycerol (TAG/total lipids, %) significantly 249
increased in N2 worms under FAC treatment (5.0 mg/ml) compared to no FAC (0 250
mg/ml) (Fig.. 1E). Since FAC at 5.0 mg/ml resulted in obvious changes of both gene 251
expression and fat accumulation, we used this concentration in most of the subsequent 252
experiments. The increased fat accumulation induced by FAC is not likely to be a 253
result of citrate supplementation, since dietary supplementation of ammonium ferric 254
sulfate (FAS) also promotes expression of FTN-1::GFP as well as fat accumulation 255
(Fig.. S3). Altogether, these findings suggest that iron overload indeed concurrently 256
promotes ferritin expression and fat accumulation. 257
To investigate the underlying genetic mechanisms and signaling pathways required 258
for this synergetic effect, we performed a selective genetic screen using RNAi 259
knockdowns as well as mutant strains corresponding to approximately 2000 genes, 260
including transcription factors, kinases, cytochrome P450 family, and lipid metabolic 261
genes. We screened RNAi knockdowns or mutations that led to changes in green 262
13
fluorescent protein (GFP) fluorescence of the ftn-1::GFP(XA6900) strain after iron 263
(FAC) exposure. We chose ftn-1, rather than ftn-2, because it shows the greatest 264
response to iron in C. elegans(GOURLEY et al. 2003; KIM et al. 2004). In strains that 265
failed to induce ftn-1::GFP after iron exposure, we further screened with Nile Red 266
staining of fixed nematodes to determine if fat accumulation was also affected. We 267
found that the elevated expression of FTN-1::GFP (Fig.. 1A) as well as ftn-1 mRNA 268
(Fig.. 1B) induced by FAC was suppressed in the sgk-1(ok538) mutant strain. The 269
sgk-1 gene encodes an orthologue of the serum and glucocorticoid induced kinase in 270
mammals(HERTWECK et al. 2004). Furthermore, in the absence of FAC, compared to 271
N2, the expression of ftn-1 mRNA was decreased in sgk-1(ok538) mutant, but was 272
increased in an integrated sgk-1::gfp (MQD862, N2;Psgk-1::sgk-1::gfp) strain (Fig.. 273
1B)(HERTWECK et al. 2004; ZHU et al. 2015). In the presence of FAC, like in N2, the 274
expression of ftn-1 mRNA was increased in both gain-of-function mutant sgk-1(ft15) 275
(JONES et al. 2009) and sgk-1::gfp (MQD862, N2;Psgk-1::sgk-1::gfp) worms (Fig.. 276
1B). These results indicate that sgk-1 regulates the expression of ftn-1. 277
Interestingly, we found that both the sgk-1(ok538) deletion mutants as well as the 278
sgk-1(ft15) gain of function mutants had slightly increased fat content than N2 in the 279
absence of iron (Fig.. 1E), consistent with previous reports(JONES et al. 2009; SOUKAS 280
et al. 2009). However, when grown on FAC, only the sgk-1(ft15) gain of function 281
mutants showed increased fat content (Fig.. 1E) and LD size (Fig.. 1C, Fig.. S1A and 282
S1C, Fig.. S2), indicating that SGK-1 activity is necessary for the induction of fat 283
accumulation. 284
14
Since the sgk-1(ok538) deletion mutant was able to suppress the elevated 285
expression of ftn-1 as well as the increase in fat content under iron overload, we asked 286
whether the upregulation of ftn-1, as well as increased fat accumulation, were due to 287
the induced expression of sgk-1. We found that FAC induced the level of sgk-1 mRNA 288
in N2 worms by two fold (Fig.. 1F) and also led to increased intensity of GFP 289
fluoresence in sgk-1::gfp and Psgk-1::gfp worms (Fig.. 1G). The increased GFP 290
fluorescence was observed using the integrated sgk-1::gfp (MQD862, 291
N2;Psgk-1::sgk-1::gfp) translational fusion strain(HERTWECK et al. 2004; ZHU et al. 292
2015) (Fig.. 1G, left panels), as well as with a transcriptional reporter containing 2.2 293
kb of upstream sgk-1 promoter sequence fused to gfp, Psgk-1::gfp {kunEx126, 294
[unc-119(ed3);Psgk-1::gfp+ unc-119(+)]} (Fig.. 1G, right panels). Interestingly, the 295
two reporter strains showed different tissue expression. The translational SGK-1::GFP 296
expresses in some head and tail neurons, with diffuse expression in the 297
intestine(HERTWECK et al. 2004), but the promoter-only fusion shows expresses only 298
in the intestine (Fig.. 1G, Fig.. S4), implying that the coding region of sgk-1 may 299
contain regulatory sequences necessary for neuronal expression. Nevertheless, FAC 300
led to increased expression of sgk-1 mRNA as well as increased fluorescence intensity 301
in both strains (Fig.. 1F and 1G), suggesting that FAC induces the transcriptional 302
expression of sgk-1. Conversely, restriction of iron by BP (2,2’-Bipyridyl, 0.1 mM), 303
an iron chelator(BREUER et al. 1995; ROMNEY et al. 2008; ROMNEY et al. 2011), also 304
represses the expression of SGK-1::GFP (MQD862, N2;Psgk1::sgk-1::gfp) (Fig.. S5). 305
Altogether, these studies show that iron overload induces the expression of sgk-1, 306
15
which promotes the expression of ftn-1 and fat accumulation. 307
308
cyp-23A1 represses sgk-1 to regulate ferritin expression and 309
fat accumulation 310
We identified a mutant strain, cyp-23A1(gk253), predicted to carry a 311
loss-of-function mutation in a gene encoding a member of cytochrome P450 family, 312
that greatly enhanced the expression of FTN-1::GFP (Fig.. 2A) and ftn-1 mRNA (up 313
to 13.6 fold) (Fig.. 2B) compared to N2 under FAC treatment, suggesting that 314
CYP-23A1 activity represses ferritin expression. Since iron overload induced the 315
expression of sgk-1, we asked whether the exacerbated effects in the cyp-23A1(gk253) 316
mutant strain could be due to mis-regulation of sgk-1. We found that the expression of 317
sgk-1 mRNA (Fig.. 2C), as well as the intensity of the SGK-1::GFP (MQD862, 318
N2;Psgk1::sgk-1::gfp) (Fig.. 2D), was higher in cyp-23A1(gk253) mutants than in N2 319
in both the absence and presence of FAC. In addition, western blot analysis using 320
anti-SGK-1 antibody also showed that the level of SGK-1 protein was significantly 321
higher in cyp-23A1(gk253) mutants than in N2, both in the presence and absence of 322
FAC (Fig.. 2E and 2F). Remarkably, the highly induced expression of ftn-1 mRNA 323
(Fig.. 2B) as well as the increased intensity of FTN-1::GFP (Fig.. 2A) in the 324
cyp-23A1(gk253) mutant was abolished in sgk-1(ok538) background. Therefore, these 325
findings indicate that CYP-23A1 represses sgk-1 expression, which eventually leads 326
to decreased ftn-1 expression. 327
Next, we asked whether cyp-23A1 also affects fat accumulation. In the absence of 328
16
FAC, the cyp-23A1(gk253) mutant displayed normal lipid droplet size similar to N2 329
(Fig.. 2G, Fig.. S1A and S1F, S2 Fig..), although TLC/GC analysis revealed slightly 330
higher fat content compared to N2 (Fig. 2H). Similar to N2, iron overload increased 331
fat accumulation (Fig. 2H) and lipid droplet size (Fig. 2G, Fig. S1A and S1F, S2 Fig.) 332
in cyp-23A1(gk253) mutants, but was dependent on sgk-1 since both lipid droplet size 333
and fat content did not increase in the sgk-1(ok538);cyp-23A1(gk253) double mutant 334
strain (Fig. 2G and 2H, Fig. S1A and S1G, S2 Fig.). Collectively, these data show that 335
CYP-23A1 appears to repress sgk-1 to regulate the level of ferritin and fat 336
accumulation under iron overload. 337
The insulin/IGF-1 signaling pathway was previously reported to work with 338
hypoxia signaling to regulate iron homeostasis in C. elegans(ACKERMAN and GEMS 339
2012). However, RNAi knockdown of two reported transcriptional factors daf-16, 340
encoding the FOXO homologue in the insulin/IGF-1 signaling pathway, and hif-1, 341
encoding hypoxia-inducible factor-1(ROMNEY et al. 2011; ACKERMAN and GEMS 342
2012), did not suppress the expression of ftn-1 mRNA in cyp-23A1(gk253) mutant 343
background under FAC treatment, even though cyp-23A1(gk253) mutant successfully 344
reversed the highly expression of ftn-1 mRNA in hif-1RNAi worms under no FAC 345
(Fig. S6A). Additionally, the repression of sgk-1 expression by CYP-23A1 also 346
appears to be independent of the transcription factors DAF-16 and HIF-1 (Fig. S6B). 347
348
Iron facilitates lipid uptake via sgk-1 349
The capacity of lipid accumulation ultimately depends on the homeostasis of lipid 350
17
synthesis, lipolysis, uptake, and transport. Previous studies contend that SGK-1 may 351
participate in insulin/IGF-1 or target of rapamycin (TOR) signaling pathways to 352
regulate lipid metabolism(JONES et al. 2009; SOUKAS et al. 2009; LANG and 353
STOURNARAS 2013). However, we found that several mutants of genes in both 354
pathways, e.g. daf-2(e1370), age-1(hx546), akt-1(ok525), daf-16(mu86) and 355
rsks-1(ok1255) (Fig. S7A), are responsive to iron promoted fat accumulation, 356
implying that they may not be directly involved in iron-induced fat accumulation. 357
Furthermore, our analysis shows that FAC treatment has both positive and negative 358
effects on gene expression of both lipid synthesis and lipid degradation genes, thus it 359
is not clear from this analysis to what extent the balance of de novo lipid synthesis and 360
degradation is disrupted by FAC (Fig. S8A-C). 361
To test the hypothesis that iron may enhance the production of reactive oxygen 362
species (ROS) and induce oxidative damage that may impair the function of 363
mitochondria and lipid oxidation(LEVI and ROVIDA 2009), we examined the 364
expression of genes encoding superoxide dismustases, sod-1, sod-2, sod-3, and sod-4, 365
but found no significant gene expression changes (Fig. S8D). We performed 366
dihydroethidium (DHE) staining, which is widely used to evaluate reactive oxygen 367
species production, and observed no significant changes after FAC treatment (Fig. 368
S8E). Finally, the relative oxygen consumption rate did not differ in N2, sgk-1(ok538), 369
cyp-23A1(gk253), sgk-1(ok538);cyp-23A1(gk253) worms between FAC treatment and 370
no FAC (Fig. S8F). Taken together, these results do not support the hypothesis that 371
iron overload is inducing oxidative stress or increased oxygen consumption in C. 372
18
elegans. 373
The yeast Ypk1, the orthologue of human sgk-1, was previously found to be 374
required for efficient fatty-acid uptake(JACQUIER and SCHNEITER 2010). Since 375
increased lipid accumulation by iron overload is dependent on sgk-1, we posited that 376
iron-induced lipid accumulation may due to increased lipid uptake under regulation of 377
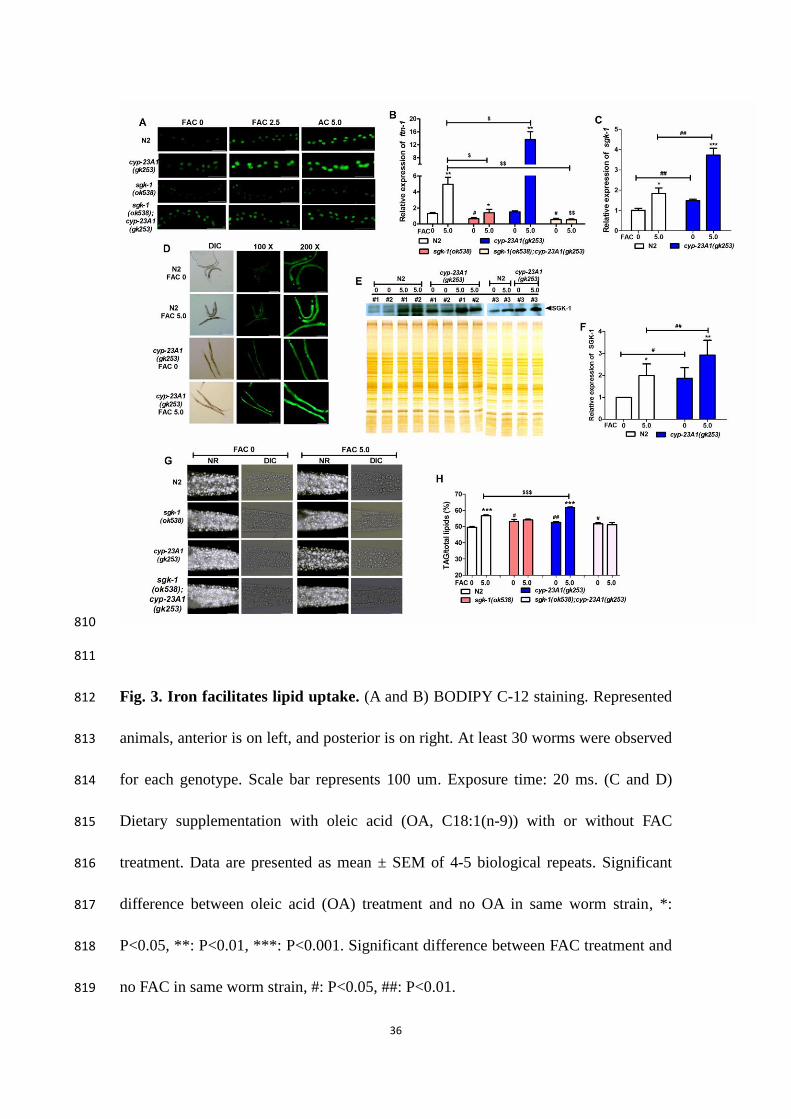
SGK-1. After conducting staining of BODIPY-C12 fatty acid to indicate lipid uptake 378
in C. elegans(SPANIER et al. 2009), we found that iron indeed promoted lipid uptake 379
as more fluorescence accumulated in the whole intestine of N2, cyp-23A1(gk253), 380
sgk-1(ft15) worms at FAC 5.0 mg/ml compared to control (FAC 0 mg/ml) (Fig. 3A 381
and 3B). However, in the sgk-1(ok538) and sgk-1(ok538);cyp-23A1(gk253) worms, 382
fluorescence of BODIPY-C12 did not increase with FAC concentration (Fig. 3A), 383
which was mostly aggregated in the intestinal lumen, suggesting that iron promoted 384
lipid uptake depends on SGK-1. 385
To confirm these results, we further supplemented the C. elegans diet with oleic 386
acid (OA, C18:1(n-9), 0.2 mM). Consistent with our previously report(SHI et al. 387
2013), C. elegans incorporated C18:1(n-9) in all six tested strains in the absence of 388
iron (Fig. 3C and 3D). Additionally, iron overload enhanced even higher level of 389
C18:1(n-9) in N2, sgk-1::gfp (MQD862, N2;Psgk-1::sgk-1::gfp), and sgk-1(ft15) 390
worms than under no FAC (Fig. 3C and 3D), further confirming that iron facilitates 391
lipid uptake. Consistent with the results of dietary BODIPY-C12, under iron overload 392
the level of C18:1(n-9) dramatically increased in cyp-23A1(gk253) worms, but 393
remained unchanged in the sgk-1(ok538) mutant background (Fig. 3C). Thus, dietary 394
19
supplementation of BODIPY-C12 fatty acid and uptake of oleic acid support our 395
hypothesis that SGK-1 is required for lipid uptake under iron overload. 396
397
The fatty acid transporter ACS-20 is required for 398
iron-induced lipid uptake 399
The observation that iron overload facilitates lipid uptake to promote lipid 400
accumulation raised the question of which gene products are responsible for lipid 401
uptake in response to FAC. Generally, dietary lipids are taken up by cells by lipid 402
transporters. The C. elegans genome contains a number genes with homology to 403
known lipid transporters that may display similar or distinct functions(ZHANG et al. 404
2013). We tested several strains with mutations in putative lipid transporter genes 405
including the acs-20(tm3232) strain, which carries a deletion in the acs-20 gene that 406
encodes an orthologue of mammalian fatty acid transport proteins 407
FATP1/4(KAGE-NAKADAI et al. 2010a) (www.wormbase.org). We found that the lipid 408
droplet size (Fig. S1A and S1H), fat storage indicated by postfix Nile Red staining 409
(Fig. 4A) and LipidTox Red staining (Fig. S2), as well as quantitated by TLC/GC (Fig. 410
4B), were unchanged in the acs-20(tm3232) mutants compared to N2 after iron 411
overload. Thus, acs-20 is necessary for iron-promoted fat accumulation. 412
We next investigated whether the increased fat accumulation was due to activated 413
acs-20. The expression of acs-20 mRNA was slightly, but significantly, increased in 414
N2 at FAC 2.5 mg/ml (Fig. 4C). However, at FAC 5.0 mg/ml, the relative expression 415
of acs-20 mRNA was significantly increased to 3.9 fold in cyp-23A1(gk253) mutants 416
20
compared to N2 (Fig. 4C). Meanwhile, the increased expression of acs-20 in both N2 417
and cyp-23A1(gk253) mutant was significantly reduced in sgk-1(ok538) mutant 418
background (Fig. 4C), while the acs-20(tm3232);cyp-23A1(gk253) double mutants 419
showed no response to iron induced fat accumulation (Fig. 4A and 4D, Fig. S2) and 420
increased LD size (Fig. S1A and S1I). These findings suggest that sgk-1 upregulates 421
acs-20 to promote fat accumulation under iron overload. 422
We then tested whether ACS-20 accounts for fatty acid transport under iron 423
overload. Dietary supplement with BODIPY-C12 fatty acid showed that the 424
fluorescence did not obviously increase with FAC concentration at 5.0 mg/ml in 425
acs-20(tm3232) single and acs-20(tm3232);cyp-23A1(gk253) double mutants, unlike 426
in N2 and the cyp-23A1(gk253) mutants (Fig. 4E). Consistent with this, dietary 427
supplementation of C18:1(n-9) further confirmed that unlike N2 and cyp-23A1(gk253) 428
mutants, both acs-20(tm3232) and acs-20(tm3232);cyp-23A1(gk253) worms did not 429
displayed increased levels of C18:1(n-9) in response to iron overload (Fig. 4F), 430
suggesting that the acs-20 mutants significantly suppressed the increased fatty acid 431
uptake in both N2 and cyp-23A1(gk253) mutants. These results further confirmed that 432
the fatty acid transporter ACS-20 accounts for iron facilitated lipid uptake under 433
SGK-1 regulation. 434
435
VIT-2 translocates dietary lipids to lipid droplets 436
When taken up into cells, lipids are translocated into intracellular organelles for 437
further utilization or storage in lipid droplets. As mentioned above, iron overload 438

21
promotes lipid uptake for storage. We hypothesized that intracellular lipid transporters 439
may be necessary to translocate lipids to lipid droplets for storage, so we searched for 440
such an intracellular lipid transporter under iron overload. C. elegans genome 441
contains 6 genes, vit-1, vit-2, vit-3, vit-4, vit-5 and vit-6, predicted to encode 442
vitollogenins, which are homologous to the protein moieties of mammalian 443
lipoproteins such LDL(BAKER 1988), that may have intracellular as well as 444
intercellular lipid transport activity(SPIETH and BLUMENTHAL 1985; MACMORRIS et al. 445
1994; GRANT and HIRSH 1999). We found that the relative mRNA expression of vit-2 446
and vit-3 transcripts was almost undetectable in sgk-1(ok538) mutant compared to in 447
N2, even under iron overload (Fig. 5A). Meanwhile, we crossed vit-2::gfp (RT130, 448
pwIs23) transgenic strain into sgk-1(ok538) mutant, and found that VIT-2::GFP was 449
undetectable by fluorescent microscopy. These results indicate that sgk-1 positively 450
regulates the expression of vit-2 and vit-3. 451
Next, we treated vit-2::gfp (RT130, pwIs23) worms with FAC, and found that the 452
fluorescent intensity of VIT-2::GFP (Fig. 5B) and the expression level of VIT-2 453
protein (Fig. 5C) was markedly increased at FAC 5.0 mg/ml as compared to the 454
control. The expression of VIT-2::GFP is also brighter in cyp-23A1(gk253) mutant, 455
but not in acs-20(tm3232) mutant compared to N2 under both FAC treatment and no 456
FAC (Fig. S9). VIT-2 is a yolk lipoprotein, but it has also been reported to be a C. 457
elegans lipid droplet-associated protein(ZHANG et al. 2012; VRABLIK et al. 2015). 458
After isolating lipid droplets and other cellular fractions of vit-2::gfp worms treated 459
with FAC 0 and 5.0 mg/ml, western blot analysis using anti-GFP antibody showed 460

22
that the level of VIT-2 protein was significantly increased in LD, total membrane (TM) 461
and postnuclear supernatant (PNS) under FAC 5.0 mg/ml compared to FAC 0 mg/ml 462
(Fig. 5D and 5E). Taken together, these results demonstrated that iron overload 463
activates the expression of VIT-2, and this may promote lipid translocation to lipid 464
droplets. 465
Since iron overload was able to activate the SGK-1-dependent expression of vit-2 466
and vit-3 (Fig. 5A), we consequently hypothesized that worms depleted of vit-2 or 467
vit-3 might be resistant to iron overload, similar to sgk-1(ok538) mutants. Indeed, 468
compared to N2, lipid abundance did not increase in vit-2(ok3211) or vit-3(ok2348) 469
mutants (Fig. 5F and 5G, Fig. S2) in response to iron overload. Additionally, unlike 470
N2, the lipid droplet size of vit-2(ok3211) did not change under iron overload (Fig. 5H, 471
Fig. S1A and S1J). However, both vit-2(ok3211) and vit-3(ok2348) mutant still 472
displayed increased level of oleic acid (C18:1(n-9)) (Fig. 5I). Taken together, these 473
results suggest that VIT-2/3 may function to transport dietary lipids to lipid droplets 474
for storage in response to iron. 475
476
Discussion 477
The correlation between iron-overload and obesity is not mechanistically 478
understood. Using a genetic screen to reveal genes required for the induction of 479
ferritin as well as changes in lipid metabolism upon exposure to iron overload, we 480
found that the serum and glucocorticoid inducible kinase SGK-1 plays a central role 481
to synergistically regulate iron and lipid homeostasis. 482

23
SGK1 belongs to the family of AGC kinases, is regulated by numerous different 483
factors, and participates in a variety of cellular and physiological processes(LANG et 484
al. 2009; LANG and STOURNARAS 2013). The transcriptional expression of SGK-1 has 485
been previously reported to be down-regulated by iron restriction in rat 486
intestine(MARZULLO et al. 2004) and kidney of a chronic kidney disease of a rat 487
model(NAITO et al. 2012). Here, we consistently observed that iron restriction by the 488
iron cheater BP in C. elegans represses the expression of SGK-1::GFP (MQD862, 489
N2;Psgk1::sgk-1::gfp) (Fig. S5). Meanwhile, iron overload induces expression of 490
both the transcriptional and translational SGK-1::GFP reporters (Fig. 1G), as well as 491
the level of sgk-1 mRNA (Fig. 1F, Fig. 2C) and protein (Fig. 2E and 2F) in N2 and in 492
cyp-23A1 mutants. Additionally, the sgk-1(ok538) mutation successfully suppressed 493
the induced expression of ferritin in both N2 and in the cyp-23A1(gk253) mutants. 494
Our present findings, along with work by others, offer consistent evidence of an 495
evolutionarily conserved function of SGK-1 in response to iron to regulate iron 496
homeostasis. 497
In mammals, SGK-1 has been implicated into glucose and lipid metabolism, as well 498
as several metabolic diseases(LANG et al. 2009; LANG and STOURNARAS 2013). A 499
common SGK1 gene variant is associated with increased blood pressure, obesity and 500
type 2 diabetes(SCHWAB et al. 2008). Up-regulation of intestinal SGK1 expression 501
may partially stimulate the Na+ coupled glucose transporter SGLT1, consequently 502
leading to fat deposition and obesity(FUJITA et al. 1998; DIETER et al. 2004; LANG and 503
STOURNARAS 2013). SGK1 is expressed in white adipose tissue and its levels are 504

24
induced during the conversion of preadipocytes into fat cells by direct 505
phosphorylation of Foxo1(DI PIETRO et al. 2010). In C. elegans, several reports 506
showed that SGK-1 regulates development, stress response, longevity, lipid 507
metabolism(HERTWECK et al. 2004; JONES et al. 2009; SOUKAS et al. 2009), and more 508
recently, membrane trafficking(ZHU et al. 2015). Here we show that the 509
gain-of-function mutant sgk-1(ft15) (Fig. 1F), sgk-1::gfp (MQD862, 510
N2;Psgk-1::sgk-1::gfp) (Fig. 1F), and cyp-23A1(gk253) mutants (Fig. 2C) displayed 511
increased expression of sgk-1 and correspondingly higher fat content than wild type 512
N2 in both the absence and the presence of iron. These findings provide strong 513
evidences supporting that SGK-1 plays a crucial role in regulating lipid metabolism 514
from C. elegans to mammals, which in turn further support the usefulness of C. 515
elegans to serve as a model to investigate the role of sgk-1 in lipid metabolism. 516
Lipid uptake and translocation are known to require lipid transporters. The C. 517
elegans genome contains 22 genes are known to encode acyl-CoA synthetase/fatty 518
acid transporter(ZHANG et al. 2013), of which ACS-20 is required for incorporation of 519
exogenous very long chain fatty acids into sphingomyelin(KAGE-NAKADAI et al. 520
2010b). While ACS-22 may functionally overlap with ACS-20(KAGE-NAKADAI et al. 521
2010b), we found that only ACS-20 is required for the increased fat accumulation 522
under iron overload, suggesting that ACS-20, like SGK-1, regulates lipid hemostasis 523
under iron overload. Our results also showed that iron has ability to induce the 524
transcriptional expression of acs-20, especially in cyp-23A1(gk253) mutants (Fig. 4C). 525
Interestingly, the increased expression of acs-20 mRNA in N2 and cyp-23A1(gk253) 526

25
mutants was positively correlated to the high absorption of BODIPY-C12 fatty acid 527
and oleic acid (C18:1(n-9)) (Fig. 4F). In contrast, the acs-20(tm3232) mutants 528
dramatically repressed the highly increased fat accumulation (Fig. 4B and 4D) as well 529
as lipid uptake (Fig. 4F) of both N2 and the cyp-23A1(gk253) mutant. These findings 530
strongly suggest that ACS-20 may function as fatty acid transport to uptake lipid to 531
store under iron overload. Since the increased expression of acs-20 in both N2 and 532
cyp-23A1(gk253) mutant relied on sgk-1, we further propose that iron induces the 533
expression of sgk-1, which in turn further activates acs-20 expression to uptake lipid 534
into intestine for storage (Fig. 6). This process may also explain the uncharacterized 535
function of yeast Ypk1 in the regulation of fatty acid uptake, though clearly more 536
follow-up is needed for confirmation. 537
C. elegans vit-1 to vit-6 belong to the family of vitellogenin genes which encode 538
the protein moiety of yolk lipoproteins(SPIETH and BLUMENTHAL 1985; MACMORRIS 539
et al. 1994; GRANT and HIRSH 1999). While previous work has shown that yolk 540
lipoproteins are synthesized in the intestine and transferred to developing oocytes 541
using receptor mediated endocytosis(GRANT and HIRSH 1999), the roles of 542
lipoproteins in intracellular lipid transfer have not previously been characterized. In 543
our study, we found that vit-2 and vit-3 expression were dramatically repressed in the 544
sgk-1(ok538) mutants (Fig. 5A), indicating that SGK-1 is required for normal 545
expression of vitellogenin genes. Furthermore, we found that vit-2(ok3211) and 546
vit-3(ok2348) mutants were not responsive to iron-induced fat accumulation (Fig. 5F 547
and 5G, Fig. S2). Although the reduced fat accumulation may be due to reduced yolk 548

26
production, an alternative interpretation is that vitellogenins play a role in intracellular 549
lipid transport. VIT-2 was recently identified as lipid droplet-associated 550
proteins(ZHANG et al. 2012; VRABLIK et al. 2015), and here we found that iron 551
promoted the accumulation of VIT-2 protein in LDs (Fig. 5D and 5E). Meanwhile, the 552
expression of VIT-2::GFP is also brighter in cyp-23A1(gk253) mutant, but not in 553
acs-20(tm3232) mutants compared to N2 regardless of treatment with FAC (Fig. S9). 554
However, unlike the sgk-1(ok538) and acs-20(tm3232) mutants, the vit-2(ok3211) 555
mutants still responded to iron promoted oleic acid uptake (Fig. 5I), suggesting that 556
VIT-2 may function as a lipid transporter to facilitate intracellular lipid translocation 557
to lipid droplets for storage under conditions of iron overload. 558
Cytochromes P450 are hemoproteins containing a heme cofactor, and are known 559
to be involved in numerous processes, such as lipid metabolism and 560
detoxification(PIKULEVA and WATERMAN 2013). Within 77 of 81 tested cytochrome 561
P450 genes, we found that only cyp-23A1, like sgk-1, synergistically, but oppositely, 562
regulated iron and lipid metabolism. CYP-23A1 is a homologue of the human gene 563
CYP7B1(KUWABARA and O'NEIL 2001), which hydroxylates carbons 6 and 7 of the B 564
ring of oxysterols and steroids(STILES et al. 2009). Mutations in CYP7B1 gene are a 565
cause of neonatal hemochromatosis (OMIM:231100) (JIMENEZ-SANCHEZ et al. 2001), 566
characterized by hepatic failure in the newborn period and heavy iron staining in the 567
liver. Remarkably, the C. elegans cyp-23A1(gk253) mutant also consistently displayed 568
high expression of FTN-1::GFP and ftn-1 mRNA under iron overload, indicating 569
CYP23A1, like CYP7B1, has an evolutionally conserved role regulating iron 570
27
homeostasis. Interestingly, sgk-1(ok538) mutants successfully suppressed the highly 571
elevated expression of FTN-1::GFP and ftn-1 mRNA, as well as fat accumulation in 572
the cyp-23A1(gk253) mutants under iron overload, which may offer a new approach 573
to investigate CYP7B1-related diseases. 574
In summary, this study indicates that iron overload has the capacity to 575
synergistically upregulate the level of ferritin and fat accumulation in an intact 576
organism C. elegans, thereby offering experimental evidence supporting a previously 577
unverified link between iron and obesity. Although more research is necessary to 578
elucidate all of the molecular mechanisms that participate in this complex process, by 579
taking the advantage of genetics in C. elegans, we were able to characterize a novel 580
response to iron overload, which induces the expression of sgk-1 to facilitate lipid 581
uptake via fatty acid transporter ACS-20, and to translocate fats to lipid droplets for 582
storage via VIT-2/3 (Fig. 6). In this pathway, SGK-1 plays a central role to 583
coordinately regulate ferritin levels and lipid accumulation in response to iron 584
overload. Since SGK1 knockout mice display no obvious physiological 585
defects(WULFF et al. 2002), targeting of SGK1 may hold promise to treat diseases 586
related to iron and lipid metabolism. 587
588
Competing interests 589
The authors declare that they have no competing interests. 590
28
591
Author Contributions 592
Conceived and designed the experiments: B L, HZ W, XJ Z, and X J. Performed the 593
experiments: HZ W, X J, XJ Z, JY W, LQ Z, and YR Z. Analyzed the data: B L, HZ 594
W, X J, and XJ Z. Contributed reagents/materials/analysis tools: HZ W, X J, LQ Z, 595
XJ Z, JF H, and B L. Wrote the paper: B L, HZ W, and XJ Z. 596
597
Acknowledgments 598
We would like to express our deep gratitude to Dr. Jennifer L. Watts for helpful 599
comments on the manuscript, Dr. Mengqiu Dong for kindly providing the sgk-1::gfp 600
(MQD862, N2;Psgk1::sgk-1::gfp) worm strain, and Dr. Shouhong Guang for EG4322, 601
pCFJ151, pJL43.1, pCFJ104 and pCFJ90 constructs. Some strains were provided by 602
the CGC, which is funded by NIH Office of Research Infrastructure Programs (P40 603
OD010440). This work was supported by the Strategic Priority Research Program of 604
the Chinese Academy of Sciences (XDB13030600), National Natural Science 605
Foundation of China (31460268, 31160216, 31171134, U1202223), Yunnan Natural 606
Science Foundation (2013FA042 and 2011FZ179), and Yunnan Provincial Science 607
and Technology Department (2014HB022), Yunnan Oversea High-level Talents 608
Program (2015HA040 to BL), and State Key Laboratory of Genetic Resources and 609
Evolution (GREKF13-03). 610
611
References 612
29
Ackerman, D., and D. Gems, 2012 Insulin/IGF-1 and hypoxia signaling act in concert to regulate iron 613
homeostasis in Caenorhabditis elegans. PLoS Genet 8: e1002498. 614
Anderson, C. P., and E. A. Leibold, 2014 Mechanisms of iron metabolism in Caenorhabditis elegans. 615
Front Pharmacol 5: 113. 616
Baker, M. E., 1988 Is vitellogenin an ancestor of apolipoprotein B-100 of human low-density 617
lipoprotein and human lipoprotein lipase? Biochem J 255: 1057-1060. 618
Bozzini, C., D. Girelli, O. Olivieri, N. Martinelli, A. Bassi et al., 2005 Prevalence of body iron excess in 619
the metabolic syndrome. Diabetes Care 28: 2061-2063. 620
Breuer, W., S. Epsztejn and Z. I. Cabantchik, 1995 Iron acquired from transferrin by K562 cells is 621
delivered into a cytoplasmic pool of chelatable iron(II). J Biol Chem 270: 24209-24215. 622
Brooks, K. K., B. Liang and J. L. Watts, 2009 The influence of bacterial diet on fat storage in C. elegans. 623
PLoS One 4: e7545. 624
Choi, J. S., I. U. Koh, H. J. Lee, W. H. Kim and J. Song, 2013 Effects of excess dietary iron and fat on 625
glucose and lipid metabolism. J Nutr Biochem 24: 1634-1644. 626
Cook, J. D., D. A. Lipschitz, L. E. Miles and C. A. Finch, 1974 Serum ferritin as a measure of iron stores in 627
normal subjects. Am J Clin Nutr 27: 681-687. 628
Di Pietro, N., V. Panel, S. Hayes, A. Bagattin, S. Meruvu et al., 2010 Serum- and glucocorticoid-inducible 629
kinase 1 (SGK1) regulates adipocyte differentiation via forkhead box O1. Mol Endocrinol 24: 630
370-380. 631
Dieter, M., M. Palmada, J. Rajamanickam, A. Aydin, A. Busjahn et al., 2004 Regulation of glucose 632
transporter SGLT1 by ubiquitin ligase Nedd4-2 and kinases SGK1, SGK3, and PKB. Obes Res 12: 633
862-870. 634
Ding, Y., X. Zou, X. Jiang, J. Wu, Y. Zhang et al., 2015 Pu-erh tea down-regulates sterol regulatory 635
element-binding protein and stearyol-CoA desaturase to reduce fat storage in Caenorhaditis 636
elegans. PLoS One 10: e0113815. 637
Dongiovanni, P., A. L. Fracanzani, S. Fargion and L. Valenti, 2011 Iron in fatty liver and in the metabolic 638
syndrome: a promising therapeutic target. J Hepatol 55: 920-932. 639
Fleming, R. E., and P. Ponka, 2012 Iron overload in human disease. N Engl J Med 366: 348-359. 640
Frokjaer-Jensen, C., M. W. Davis, C. E. Hopkins, B. J. Newman, J. M. Thummel et al., 2008 Single-copy 641
insertion of transgenes in Caenorhabditis elegans. Nat Genet 40: 1375-1383. 642
Fujita, Y., H. Kojima, H. Hidaka, M. Fujimiya, A. Kashiwagi et al., 1998 Increased intestinal glucose 643
absorption and postprandial hyperglycaemia at the early step of glucose intolerance in 644
Otsuka Long-Evans Tokushima Fatty rats. Diabetologia 41: 1459-1466. 645
Gillum, R. F., 2001 Association of serum ferritin and indices of body fat distribution and obesity in 646
Mexican American men--the Third National Health and Nutrition Examination Survey. Int J 647
Obes Relat Metab Disord 25: 639-645. 648
Gourley, B. L., S. B. Parker, B. J. Jones, K. B. Zumbrennen and E. A. Leibold, 2003 Cytosolic aconitase 649
and ferritin are regulated by iron in Caenorhabditis elegans. J Biol Chem 278: 3227-3234. 650
Graham, R. M., A. C. Chua, K. W. Carter, R. D. Delima, D. Johnstone et al., 2010 Hepatic iron loading in 651
mice increases cholesterol biosynthesis. Hepatology 52: 462-471. 652
Grant, B., and D. Hirsh, 1999 Receptor-mediated endocytosis in the Caenorhabditis elegans oocyte. 653
Mol Biol Cell 10: 4311-4326. 654
Hertweck, M., C. Gobel and R. Baumeister, 2004 C. elegans SGK-1 is the critical component in the 655
Akt/PKB kinase complex to control stress response and life span. Dev Cell 6: 577-588. 656
30
Hubler, M. J., K. R. Peterson and A. H. Hasty, 2015 Iron homeostasis: a new job for macrophages in 657
adipose tissue? Trends Endocrinol Metab 26: 101-109. 658
Iwasaki, T., A. Nakajima, M. Yoneda, Y. Yamada, K. Mukasa et al., 2005 Serum ferritin is associated with 659
visceral fat area and subcutaneous fat area. Diabetes Care 28: 2486-2491. 660
Jacquier, N., and R. Schneiter, 2010 Ypk1, the yeast orthologue of the human serum- and 661
glucocorticoid-induced kinase, is required for efficient uptake of fatty acids. J Cell Sci 123: 662
2218-2227. 663
Jehn, M., J. M. Clark and E. Guallar, 2004 Serum ferritin and risk of the metabolic syndrome in U.S. 664
adults. Diabetes Care 27: 2422-2428. 665
Jimenez-Sanchez, G., B. Childs and D. Valle, 2001 Human disease genes. Nature 409: 853-855. 666
Jones, K. T., E. R. Greer, D. Pearce and K. Ashrafi, 2009 Rictor/TORC2 regulates Caenorhabditis elegans 667
fat storage, body size, and development through sgk-1. PLoS Biol 7: e60. 668
Kage-Nakadai, E., H. Kobuna, M. Kimura, K. Gengyo-Ando, T. Inoue et al., 2010a Two Very Long Chain 669
Fatty Acid Acyl-CoA Synthetase Genes, acs-20 and acs-22, Have Roles in the Cuticle Surface 670
Barrier in Caenorhabditis elegans. Plos One 5. 671
Kage-Nakadai, E., H. Kobuna, M. Kimura, K. Gengyo-Ando, T. Inoue et al., 2010b Two very long chain 672
fatty acid acyl-CoA synthetase genes, acs-20 and acs-22, have roles in the cuticle surface 673
barrier in Caenorhabditis elegans. PLoS One 5: e8857. 674
Kim, C. H., H. K. Kim, S. J. Bae, J. Y. Park and K. U. Lee, 2011 Association of elevated serum ferritin 675
concentration with insulin resistance and impaired glucose metabolism in Korean men and 676
women. Metabolism 60: 414-420. 677
Kim, Y. I., J. H. Cho, O. J. Yoo and J. Ahnn, 2004 Transcriptional regulation and life-span modulation of 678
cytosolic aconitase and ferritin genes in C.elegans. J Mol Biol 342: 421-433. 679
Kuwabara, P. E., and N. O'Neil, 2001 The use of functional genomics in C. elegans for studying human 680
development and disease. J Inherit Metab Dis 24: 127-138. 681
Lang, F., A. Gorlach and V. Vallon, 2009 Targeting SGK1 in diabetes. Expert Opin Ther Targets 13: 682
1303-1311. 683
Lang, F., and C. Stournaras, 2013 Serum and glucocorticoid inducible kinase, metabolic syndrome, 684
inflammation, and tumor growth. Hormones (Athens) 12: 160-171. 685
Levi, S., and E. Rovida, 2009 The role of iron in mitochondrial function. Biochim Biophys Acta 1790: 686
629-636. 687
Liang, B., K. Ferguson, L. Kadyk and J. L. Watts, 2010 The role of nuclear receptor NHR-64 in fat storage 688
regulation in Caenorhabditis elegans. PLoS One 5: e9869. 689
MacMorris, M., J. Spieth, C. Madej, K. Lea and T. Blumenthal, 1994 Analysis of the VPE sequences in 690
the Caenorhabditis elegans vit-2 promoter with extrachromosomal tandem array-containing 691
transgenic strains. Mol Cell Biol 14: 484-491. 692
Marzullo, L., A. Tosco, R. Capone, H. S. Andersen, A. Capasso et al., 2004 Identification of dietary 693
copper- and iron-regulated genes in rat intestine. Gene 338: 225-233. 694
Mascitelli, L., F. Pezzetta and M. R. Goldstein, 2009 Iron, metabolic syndrome, nonalcoholic fatty liver 695
disease and carotid atherosclerosis. Atherosclerosis 205: 39-40. 696
Moreno-Navarrete, J. M., F. Ortega, M. Moreno, W. Ricart and J. M. Fernandez-Real, 2014a Fine-tuned 697
iron availability is essential to achieve optimal adipocyte differentiation and mitochondrial 698
biogenesis. Diabetologia 57: 1957-1967. 699
Moreno-Navarrete, J. M., F. Ortega, M. Moreno, M. Serrano, W. Ricart et al., 2014b Lactoferrin gene 700
31
knockdown leads to similar effects to iron chelation in human adipocytes. J Cell Mol Med 18: 701
391-395. 702
Naito, Y., A. Fujii, H. Sawada, S. Hirotani, T. Iwasaku et al., 2012 Effect of iron restriction on renal 703
damage and mineralocorticoid receptor signaling in a rat model of chronic kidney disease. J 704
Hypertens 30: 2192-2201. 705
Nikonorov, A. A., M. G. Skalnaya, A. A. Tinkov and A. V. Skalny, 2015 Mutual interaction between iron 706
homeostasis and obesity pathogenesis. J Trace Elem Med Biol 30C: 207-214. 707
Pikuleva, I. A., and M. R. Waterman, 2013 Cytochromes p450: roles in diseases. J Biol Chem 288: 708
17091-17098. 709
Romney, S. J., B. S. Newman, C. Thacker and E. A. Leibold, 2011 HIF-1 regulates iron homeostasis in 710
Caenorhabditis elegans by activation and inhibition of genes involved in iron uptake and 711
storage. PLoS Genet 7: e1002394. 712
Romney, S. J., C. Thacker and E. A. Leibold, 2008 An iron enhancer element in the FTN-1 gene directs 713
iron-dependent expression in Caenorhabditis elegans intestine. J Biol Chem 283: 716-725. 714
Rumberger, J. M., T. Peters, Jr., C. Burrington and A. Green, 2004 Transferrin and iron contribute to the 715
lipolytic effect of serum in isolated adipocytes. Diabetes 53: 2535-2541. 716
Schwab, M., A. Lupescu, M. Mota, E. Mota, A. Frey et al., 2008 Association of SGK1 gene 717
polymorphisms with type 2 diabetes. Cell Physiol Biochem 21: 151-160. 718
Shi, X., J. Li, X. Zou, J. Greggain, S. V. Rodkaer et al., 2013 Regulation of lipid droplet size and 719
phospholipid composition by stearoyl-CoA desaturase. J Lipid Res 54: 2504-2514. 720
Soukas, A. A., E. A. Kane, C. E. Carr, J. A. Melo and G. Ruvkun, 2009 Rictor/TORC2 regulates fat 721
metabolism, feeding, growth, and life span in Caenorhabditis elegans. Genes Dev 23: 722
496-511. 723
Spanier, B., K. Lasch, S. Marsch, J. Benner, W. Liao et al., 2009 How the intestinal peptide transporter 724
PEPT-1 contributes to an obesity phenotype in Caenorhabditits elegans. PLoS One 4: e6279. 725
Spieth, J., and T. Blumenthal, 1985 The Caenorhabditis elegans vitellogenin gene family includes a 726
gene encoding a distantly related protein. Mol Cell Biol 5: 2495-2501. 727
Stiles, A. R., J. G. McDonald, D. R. Bauman and D. W. Russell, 2009 CYP7B1: one cytochrome P450, two 728
human genetic diseases, and multiple physiological functions. J Biol Chem 284: 28485-28489. 729
Tajima, S., Y. Ikeda, K. Sawada, N. Yamano, Y. Horinouchi et al., 2012 Iron reduction by deferoxamine 730
leads to amelioration of adiposity via the regulation of oxidative stress and inflammation in 731
obese and type 2 diabetes KKAy mice. Am J Physiol Endocrinol Metab 302: E77-86. 732
Tinkov, A. A., V. S. Polyakova and A. A. Nikonorov, 2013 Chronic administration of iron and copper 733
potentiates adipogenic effect of high fat diet in Wistar rats. Biometals 26: 447-463. 734
Valentini, S., F. Cabreiro, D. Ackerman, M. M. Alam, M. B. Kunze et al., 2012 Manipulation of in vivo 735
iron levels can alter resistance to oxidative stress without affecting ageing in the nematode C. 736
elegans. Mech Ageing Dev 133: 282-290. 737
Van Rompay, L., C. Borghgraef, I. Beets, J. Caers and L. Temmerman, 2015 New genetic regulators 738
question relevance of abundant yolk protein production in C. elegans. Sci Rep 5: 16381. 739
Vrablik, T. L., V. A. Petyuk, E. M. Larson, R. D. Smith and J. L. Watts, 2015 Lipidomic and proteomic 740
analysis of Caenorhabditis elegans lipid droplets and identification of ACS-4 as a lipid 741
droplet-associated protein. Biochim Biophys Acta 1851: 1337-1345. 742
Watts, J. L., and J. Browse, 2002 Genetic dissection of polyunsaturated fatty acid synthesis in 743
Caenorhabditis elegans. Proc Natl Acad Sci U S A 99: 5854-5859. 744

32
Watts, J. L., and J. Browse, 2006 Dietary manipulation implicates lipid signaling in the regulation of 745
germ cell maintenance in C. elegans. Dev Biol 292: 381-392. 746
Wenzel, B. J., H. B. Stults and J. Mayer, 1962 Hypoferraemia in obese adolescents. Lancet 2: 327-328. 747
Wulff, P., V. Vallon, D. Y. Huang, H. Volkl, F. Yu et al., 2002 Impaired renal Na(+) retention in the 748
sgk1-knockout mouse. J Clin Invest 110: 1263-1268. 749
Xu, N., S. O. Zhang, R. A. Cole, S. A. McKinney, F. Guo et al., 2012 The FATP1-DGAT2 complex facilitates 750
lipid droplet expansion at the ER-lipid droplet interface. J Cell Biol 198: 895-911. 751
Zafon, C., A. Lecube and R. Simo, 2010 Iron in obesity. An ancient micronutrient for a modern disease. 752
Obes Rev 11: 322-328. 753
Zhang, J., R. M. Lewis, C. Wang, N. Hales and C. D. Byrne, 2005 Maternal dietary iron restriction 754
modulates hepatic lipid metabolism in the fetuses. Am J Physiol Regul Integr Comp Physiol 755
288: R104-111. 756
Zhang, P., H. Na, Z. Liu, S. Zhang, P. Xue et al., 2012 Proteomic study and marker protein identification 757
of Caenorhabditis elegans lipid droplets. Mol Cell Proteomics 11: 317-328. 758
Zhang, Y., X. Zou, Y. Ding, H. Wang, X. Wu et al., 2013 Comparative genomics and functional study of 759
lipid metabolic genes in Caenorhabditis elegans. BMC Genomics 14: 164. 760
Zhu, M., G. Wu, Y. X. Li, J. K. Stevens, C. X. Fan et al., 2015 Serum- and Glucocorticoid-Inducible 761
Kinase-1 (SGK-1) Plays a Role in Membrane Trafficking in Caenorhabditis elegans. PLoS One 762
10: e0130778. 763
Zimmermann, M. B., 2008 Methods to assess iron and iodine status. Br J Nutr 99 Suppl 3: S2-9. 764
765

33
Figure Legends 766
Fig. 1. Iron overload induces sgk-1 expression to upregulate ferritin expression 767
and fat accumulation. (A) Expression of FTN-1::GFP [XA6900(ftn-1::GFP)]. 768
Represented animals, anterior is on left, and posterior is on right. Scale bar represents 769
50 um. Exposure time: 140 ms. (B) Relative expression of ftn-1 mRNA by QPCR. 770
Data are presented as mean ± SEM of 4 biological repeats. (C) Nile Red staining of 771
fixed worms. NR: Nile Red staining; DIC: Differential interference contrast (DIC) 772
microscopy. Represented animals, anterior is on left, and posterior is on right. Scale 773
bar represents 20 um. Exposure time: 25 ms. (D) Left panels: the expression of lipid 774
droplets markers DHS-3::GFP (Top) and mRuby::DGAT-2 (Bottom). Scale bar 775
represents 20 um. Exposure time: 87 ms for DHS-3::GFP; 114 ms for 776
mRuby::DGAT-2. Right panels: isolated lipid droplets of N2 worms stained with Nile 777
Red. Scale bar represents 20 um. Exposure time: 46 ms. (E) Percentage of 778
triacylglycerol (TAG) in total lipids (TAG+PL, phospholipids) quantitated by 779
TLC/GC. Data are presented as mean ± SEM of 3 biological repeats. (F) The relative 780
expression of sgk-1 mRNA. Data are presented as mean ± SEM of 4 biological 781
repeats. (G) The expression of SGK-1::GFP. Scale bar represents 100 um. Exposure 782
time: 87 ms. The selected area of a represented worm was enlarged for clear view. 783
Significant difference between FAC treatment and no FAC in same worm strain, *: 784
P<0.05, **: P<0.01. Significant difference between N2 and a specific worm strain 785
under no FAC, #: P<0.05, ##: P<0.01, ###: P<0.001. Significant difference between 786
N2 and a specific worm strain under FAC treatment, $$: P<0.01. 787
34
788
789
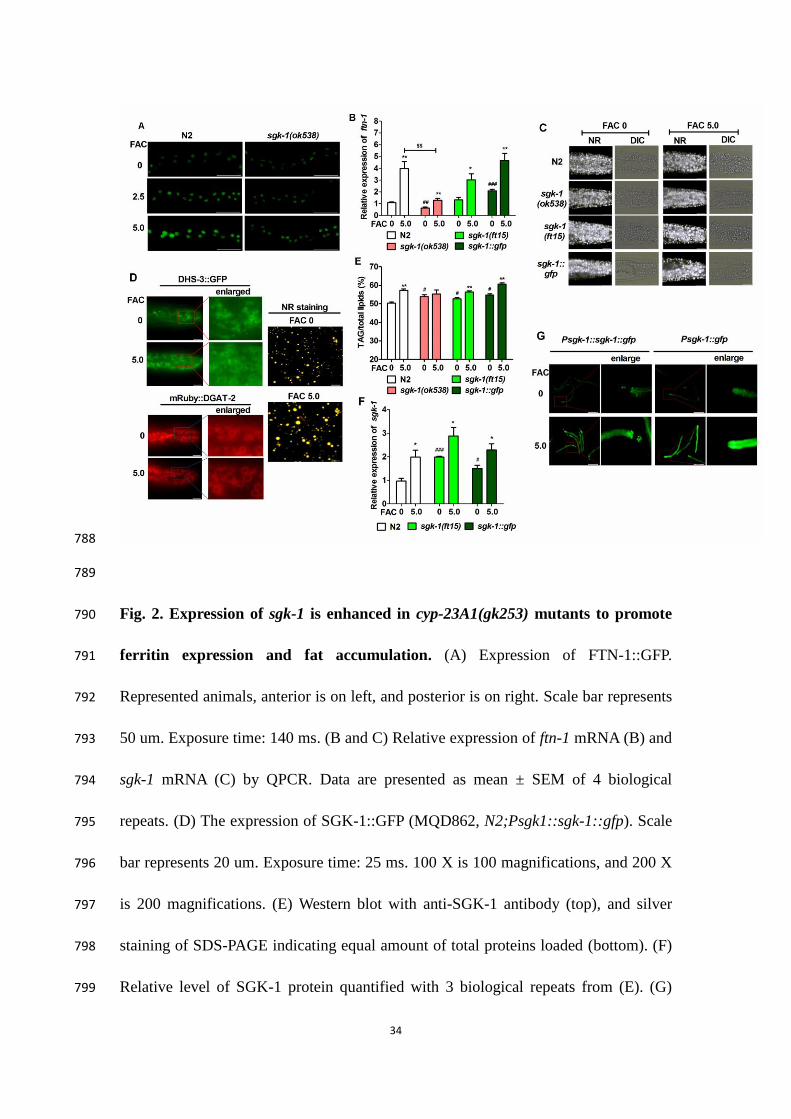
Fig. 2. Expression of sgk-1 is enhanced in cyp-23A1(gk253) mutants to promote 790
ferritin expression and fat accumulation. (A) Expression of FTN-1::GFP. 791
Represented animals, anterior is on left, and posterior is on right. Scale bar represents 792
50 um. Exposure time: 140 ms. (B and C) Relative expression of ftn-1 mRNA (B) and 793
sgk-1 mRNA (C) by QPCR. Data are presented as mean ± SEM of 4 biological 794
repeats. (D) The expression of SGK-1::GFP (MQD862, N2;Psgk1::sgk-1::gfp). Scale 795
bar represents 20 um. Exposure time: 25 ms. 100 X is 100 magnifications, and 200 X 796
is 200 magnifications. (E) Western blot with anti-SGK-1 antibody (top), and silver 797
staining of SDS-PAGE indicating equal amount of total proteins loaded (bottom). (F) 798
Relative level of SGK-1 protein quantified with 3 biological repeats from (E). (G) 799
35
Nile Red staining of fixed worms. NR: Nile Red staining; DIC: Differential 800
interference contrast (DIC) microscopy. Represented animals, anterior is on left, and 801
posterior is on right. Scale bar represents 20 um. Exposure time: 25 ms. (H) 802
Percentage of triacylglycerol (TAG) in total lipids (TAG+PL, phospholipids) 803
quantitated by TLC/GC. Data are presented as mean ± SEM of 3 or 5 biological 804
repeats. Significant difference between FAC treatment and no FAC in same worm 805
strain, *: P<0.05, **: P<0.01, ***: P<0.001. Significant difference between N2 and a 806
specific worm strain under no FAC, #: P<0.05, ##: P<0.01. Significant difference 807
between N2 and a specific worm strain under FAC treatment, $: P<0.01, $$: P<0.05, 808
$$$: P<0.001. 809
36
810
811
Fig. 3. Iron facilitates lipid uptake. (A and B) BODIPY C-12 staining. Represented 812
animals, anterior is on left, and posterior is on right. At least 30 worms were observed 813
for each genotype. Scale bar represents 100 um. Exposure time: 20 ms. (C and D) 814
Dietary supplementation with oleic acid (OA, C18:1(n-9)) with or without FAC 815
treatment. Data are presented as mean ± SEM of 4-5 biological repeats. Significant 816
difference between oleic acid (OA) treatment and no OA in same worm strain, *: 817
P<0.05, **: P<0.01, ***: P<0.001. Significant difference between FAC treatment and 818
no FAC in same worm strain, #: P<0.05, ##: P<0.01. 819

37
820
821
Fig. 4. ACS-20 is required for iron-induced lipid uptake. (A) Nile Red staining of 822
fixed worms. NR: Nile Red staining; DIC: Differential interference contrast (DIC) 823
microscopy. Represented animals, anterior is on left, and posterior is on right. Scale 824
bar represents 20 um. Exposure time: 25 ms. (B and D) Percentage of triacylglycerol 825
(TAG) in total lipids (TAG+PL, phospholipids) quantitated by TLC/GC. Data are 826
presented as mean ± SEM of 3 biological repeats. (C) Relative expression of acs-20 827
mRNA by QPCR. Data are presented as mean ± SEM of 3 biological repeats. (E) 828
BODIPY C-12 staining. Represented animals, anterior is on left, and posterior is on 829
right. Scale bar represents 100 um. Exposure time: 20 ms. (F) Dietary 830
supplementation with oleic acid (OA, C18:1(n-9)). Data are presented as mean ± SEM 831
of 4-6 biological repeats. Significant difference between treatment (FAC/OA) and no 832
treatment (FAC 0) in same worm strain, *: P<0.05, **: P<0.01, ***: P<0.001. 833

38
Significant difference between N2 and a specific worm strain under same treatment, $: 834
P<0.05, $$: P<0.01. Significant difference between FAC treatment and no FAC 835
treatment in same worm strain, &: P<0.05, &&: P<0.01. n.s, no significance. 836
837
838
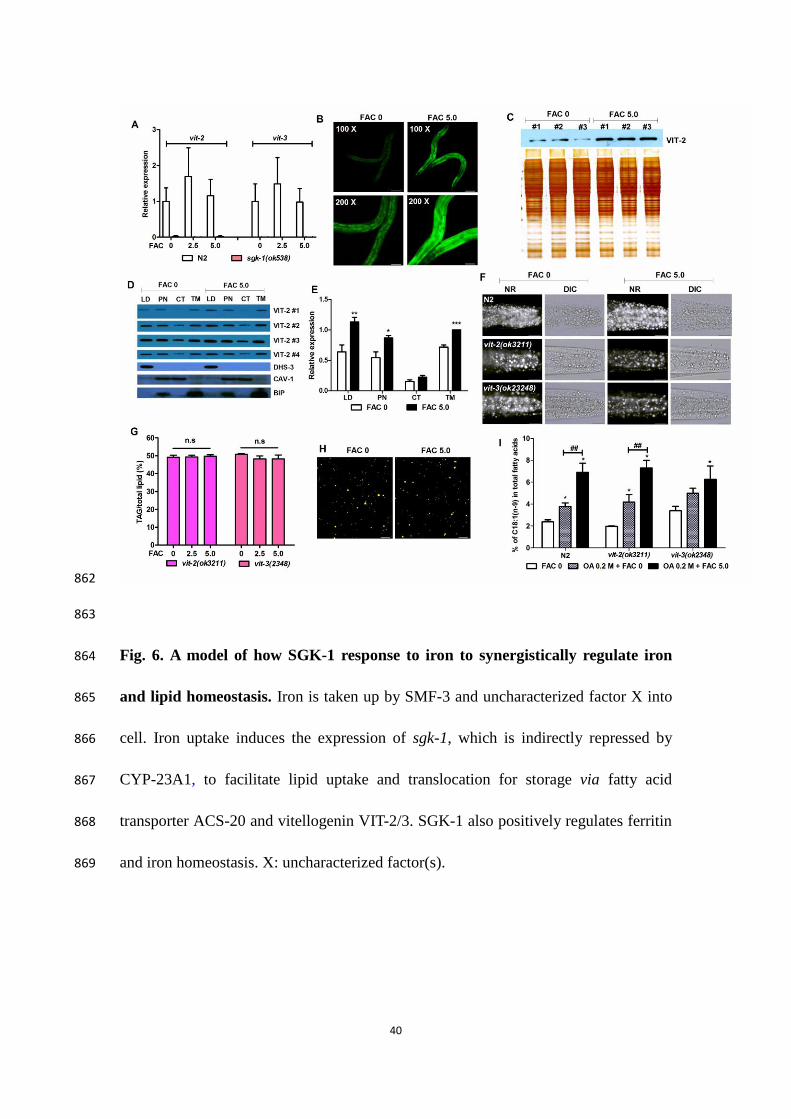
Fig. 5. Iron overload induces VIT-2 expression to transport lipids for storage. (A) 839
Relative expression of vit-2 and vit-3 mRNA. Data are presented as mean ± SEM of 3 840
biological repeats. (B) Expression of VIT-2::GFP. Represented animals. Scale bar 841
represents 100 um. Exposure time: 334 ms. 100 X is 100 magnifications, and 200 X is 842
200 magnifications. (C-D) The expression level of VIT-2 in total proteins (C) and in 843
different fractions (D). (C) Western blot analysis of vit-2::gfp (RT130, pwIs23) 844
worms with anti-GFP antibody (top), and silver staining of SDS-PAGE indicating 845
equal amount of total proteins loaded (bottom). #1-4, 4 biological repeats. (D) LD 846
proteins and proteins from other cellular fractions (Lipid droplets, LD; total 847
membrane, TM; cytosol, CT; PNS, postnuclear supernatant) were confirmed by 848
39
cellular organelle markers: LD marker, DHS-3; PN and TM marker, CAV-1; 849
endoplasmic reticulum (ER) marker, Bip/GRP78. (E) Relative level of VIT-2 protein 850
quantified with 3 biological repeats from (D). The level of VIT-2 protein in TM under 851
FAC 5.0 was used as standard. (F) Nile red staining of fixed worms. Represented 852
animals, anterior is on left, and posterior is on right. NR: Nile Red staining; DIC: 853
Differential interference contrast (DIC) microscopy. Scale bar represents 20 um. 854
Exposure time: 25 ms. (G) Percentage of triacylglycerol (TAG) in total lipids 855
(TAG+PL, phospholipids) quantitated by TLC/GC. (H) Isolate lipid droplets of 856
vit-2(ok3211) worms on FAC 0 and 5.0 mg/ml. (I) Dietary supplementation with oleic 857
acid (OA, C18:1(n-9)). All data are presented as mean ± SEM of 3 biological repeats. 858
Significant difference between FAC/OA treatment and no treatment in same worm 859
strain, *: P<0.05, **: P<0.01. Significant difference between FAC treatment and no 860
FAC in same worm strain, ##: P<0.01. n.s, no significance. 861
40
862
863
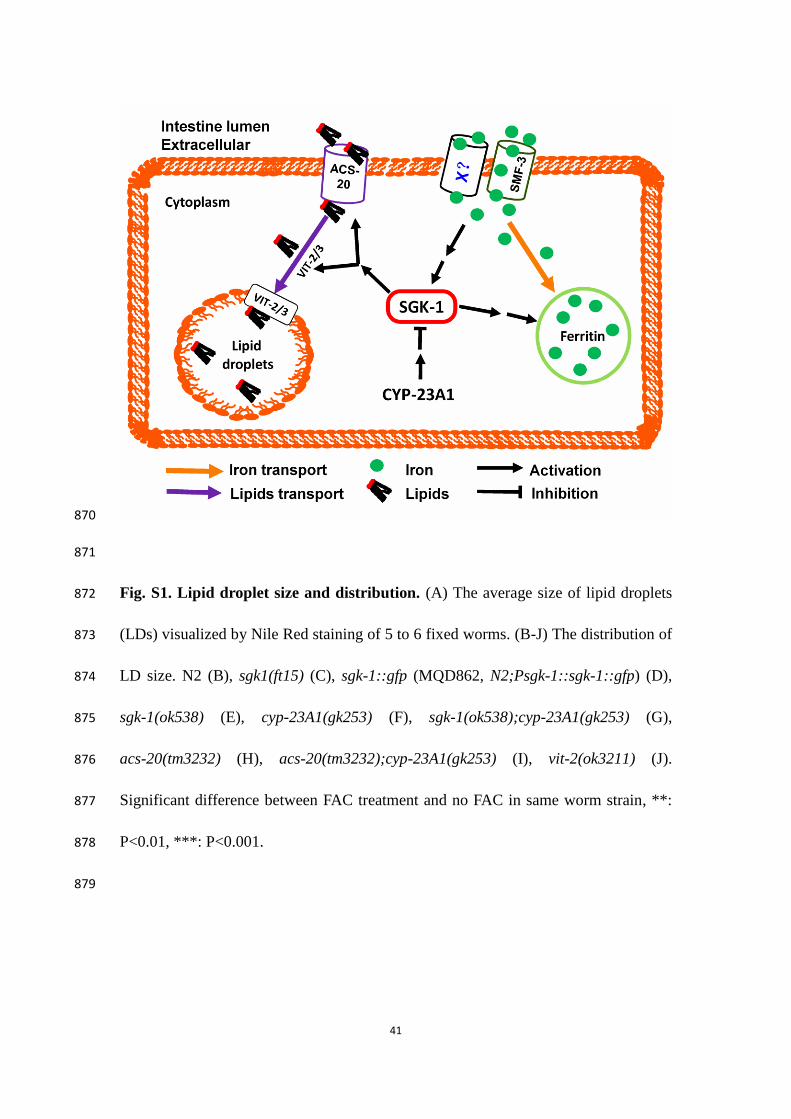
Fig. 6. A model of how SGK-1 response to iron to synergistically regulate iron 864
and lipid homeostasis. Iron is taken up by SMF-3 and uncharacterized factor X into 865
cell. Iron uptake induces the expression of sgk-1, which is indirectly repressed by 866
CYP-23A1, to facilitate lipid uptake and translocation for storage via fatty acid 867
transporter ACS-20 and vitellogenin VIT-2/3. SGK-1 also positively regulates ferritin 868
and iron homeostasis. X: uncharacterized factor(s). 869
41
870
871
Fig. S1. Lipid droplet size and distribution. (A) The average size of lipid droplets 872
(LDs) visualized by Nile Red staining of 5 to 6 fixed worms. (B-J) The distribution of 873
LD size. N2 (B), sgk1(ft15) (C), sgk-1::gfp (MQD862, N2;Psgk-1::sgk-1::gfp) (D), 874
sgk-1(ok538) (E), cyp-23A1(gk253) (F), sgk-1(ok538);cyp-23A1(gk253) (G), 875
acs-20(tm3232) (H), acs-20(tm3232);cyp-23A1(gk253) (I), vit-2(ok3211) (J). 876
Significant difference between FAC treatment and no FAC in same worm strain, **: 877
P<0.01, ***: P<0.001. 878
879

42
880
881
Fig. S2. LipidTox Red staining of fixed worms. Represented animals, anterior is on 882
left, and posterior is on right. Scale bar represents 20 um. Exposure time: 120 ms. N2, 883
sgk-1(ft15), sgk-1::gfp (MQD862, N2;Psgk-1::sgk-1::gfp), sgk-1(ok538), 884
cyp-23A1(gk253), sgk-1(ok538);cyp-23A1(gk253), acs-20(tm3232), 885
acs-20(tm3232);cyp-23A1(gk253), vit-2(ok3211), vit-3(ok2348). 886
887
43
888
889
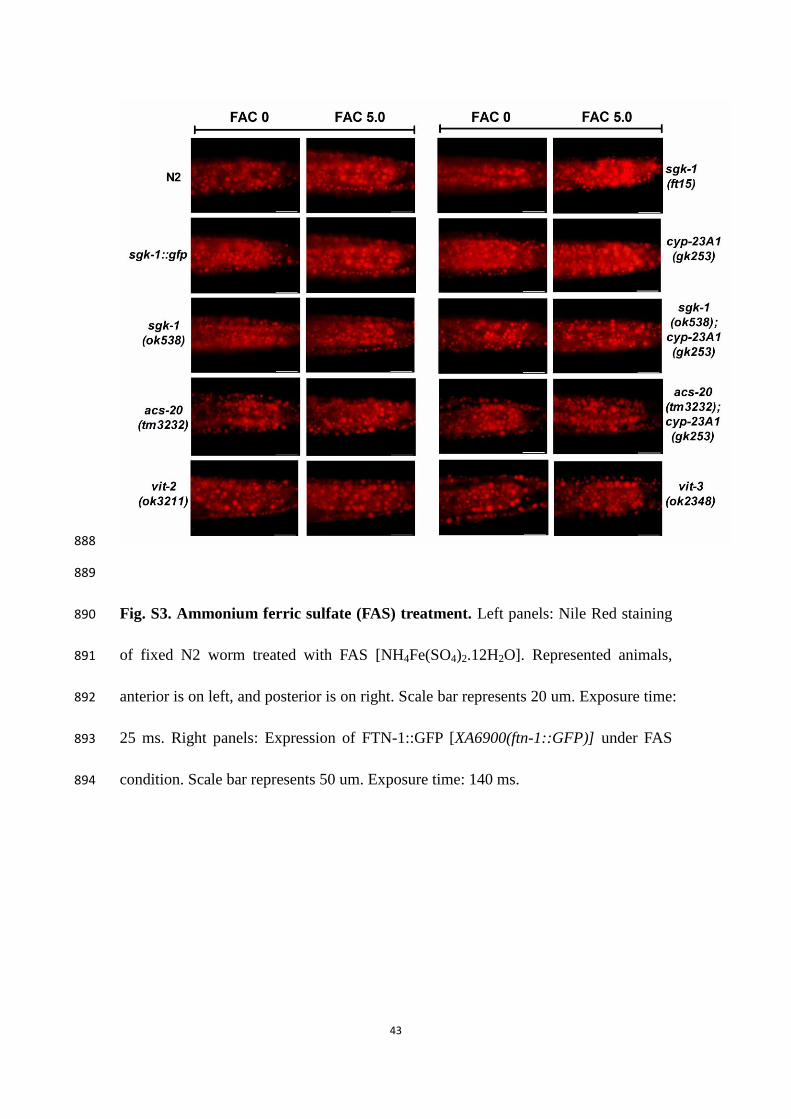
Fig. S3. Ammonium ferric sulfate (FAS) treatment. Left panels: Nile Red staining 890
of fixed N2 worm treated with FAS [NH4Fe(SO4)2.12H2O]. Represented animals, 891
anterior is on left, and posterior is on right. Scale bar represents 20 um. Exposure time: 892
25 ms. Right panels: Expression of FTN-1::GFP [XA6900(ftn-1::GFP)] under FAS 893
condition. Scale bar represents 50 um. Exposure time: 140 ms. 894

44
895
896
Fig. S4. The SGK-1::GFP expression patterns in sgk-1::gfp (MQD862, 897
N2;Psgk-1::sgk-1::gfp) and Psgk-1::gfp {kunEx126, [unc-119(ed3);Psgk-1::gfp+ 898
unc-119(+)]} strains. Left panel: scale bar represents 100 um, exposure time was 90 899
ms for sgk-1::gfp worms (top) and 50 ms for Psgk-1::gfp worms (bottom). Right 900
panel: scale bar represents 20 um. White arrows indicate head and tail neurons in 901
sgk-1::gfp worm, red arrows indicate the transgenic maker mCherry in Psgk-1::gfp 902
worm. 903
45
904
905
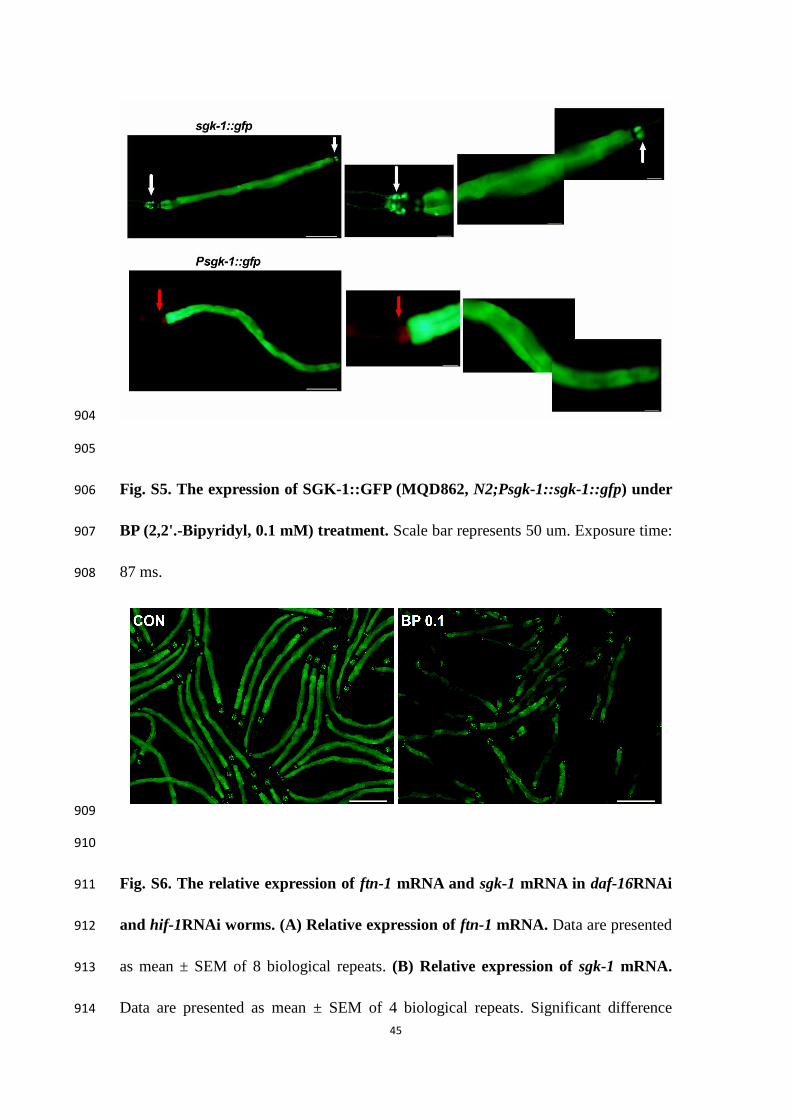
Fig. S5. The expression of SGK-1::GFP (MQD862, N2;Psgk-1::sgk-1::gfp) under 906
BP (2,2'.-Bipyridyl, 0.1 mM) treatment. Scale bar represents 50 um. Exposure time: 907
87 ms. 908
909
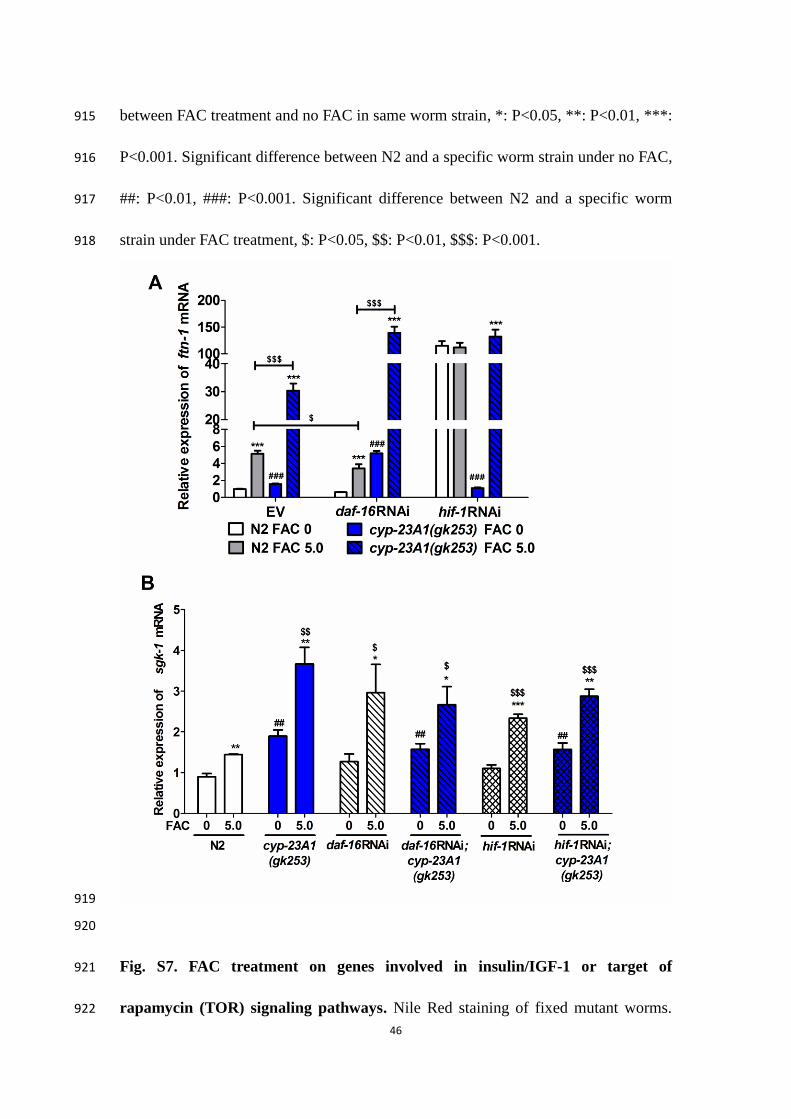
910
Fig. S6. The relative expression of ftn-1 mRNA and sgk-1 mRNA in daf-16RNAi 911
and hif-1RNAi worms. (A) Relative expression of ftn-1 mRNA. Data are presented 912
as mean ± SEM of 8 biological repeats. (B) Relative expression of sgk-1 mRNA. 913
Data are presented as mean ± SEM of 4 biological repeats. Significant difference 914
46
between FAC treatment and no FAC in same worm strain, *: P<0.05, **: P<0.01, ***: 915
P<0.001. Significant difference between N2 and a specific worm strain under no FAC, 916
##: P<0.01, ###: P<0.001. Significant difference between N2 and a specific worm 917
strain under FAC treatment, $: P<0.05, $$: P<0.01, $$$: P<0.001. 918
919
920
Fig. S7. FAC treatment on genes involved in insulin/IGF-1 or target of 921
rapamycin (TOR) signaling pathways. Nile Red staining of fixed mutant worms. 922

47
Represented animals, anterior is on left, and posterior is on right. Scale bar represents 923
20 um. Exposure time: 25 ms. 924
925
926
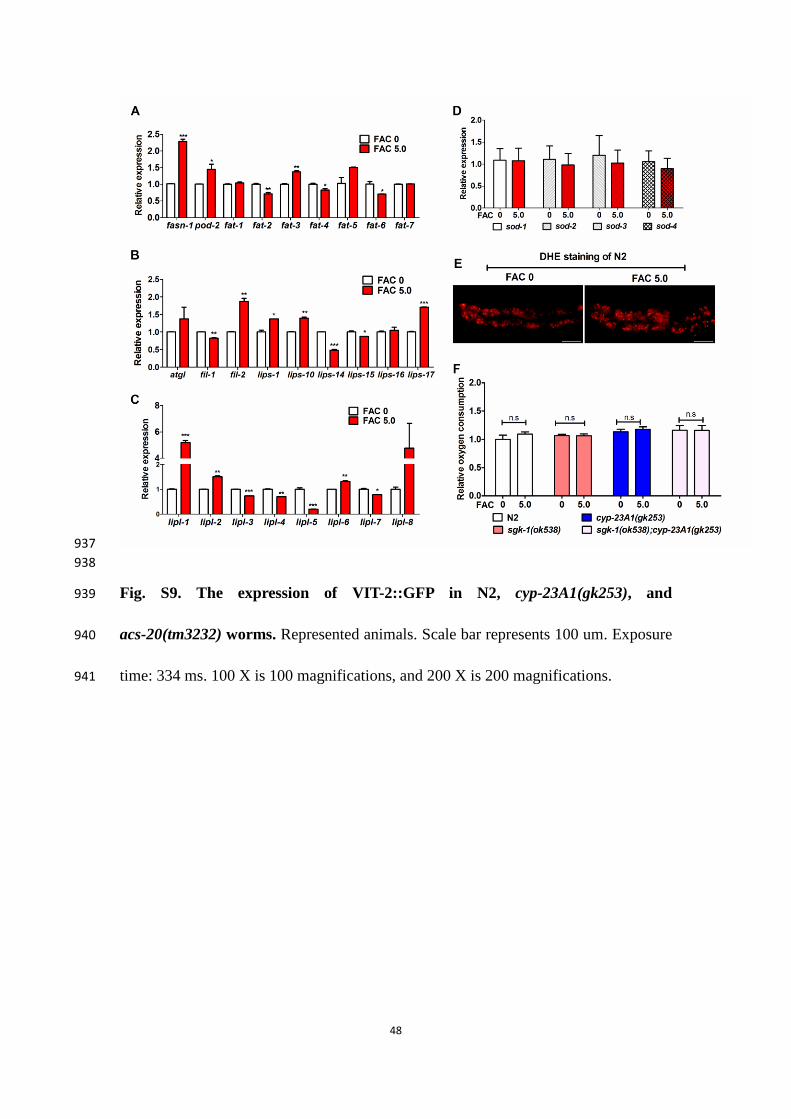
Fig. S8. The expression of lipid metabolic genes and mitochondria function. The 927
relative expression of genes involve into fatty acids synthesis (A) and lipolysis (B and 928
C) in N2 worms under iron overload condition. (D) The relative expression of sod-1, 929
sod-2, sod-3 and sod-4 in N2 worms under FAC treatments. (E) Dihydroethidium 930
(DHE) staining of N2 worms under FAC treatments. Represented animals, anterior is 931
on left, and posterior is on right. Scale bar represents 20 um. Exposure time: 150 ms. 932
(F) Relative oxygen consumption in N2, sgk-1(ok538), cyp-23A1(gk253), 933
sgk-1(ok538);cyp-23A1(gk253) worms. Data are presented as mean ± SEM of 3 934
biological repeats. Significant difference between FAC 5.0 mg/ml and FAC 0 mg/ml 935
in same worm strain, *: P<0.05, **: P<0.01, ***: P<0.001. n.s, no significance. 936
48
937
938
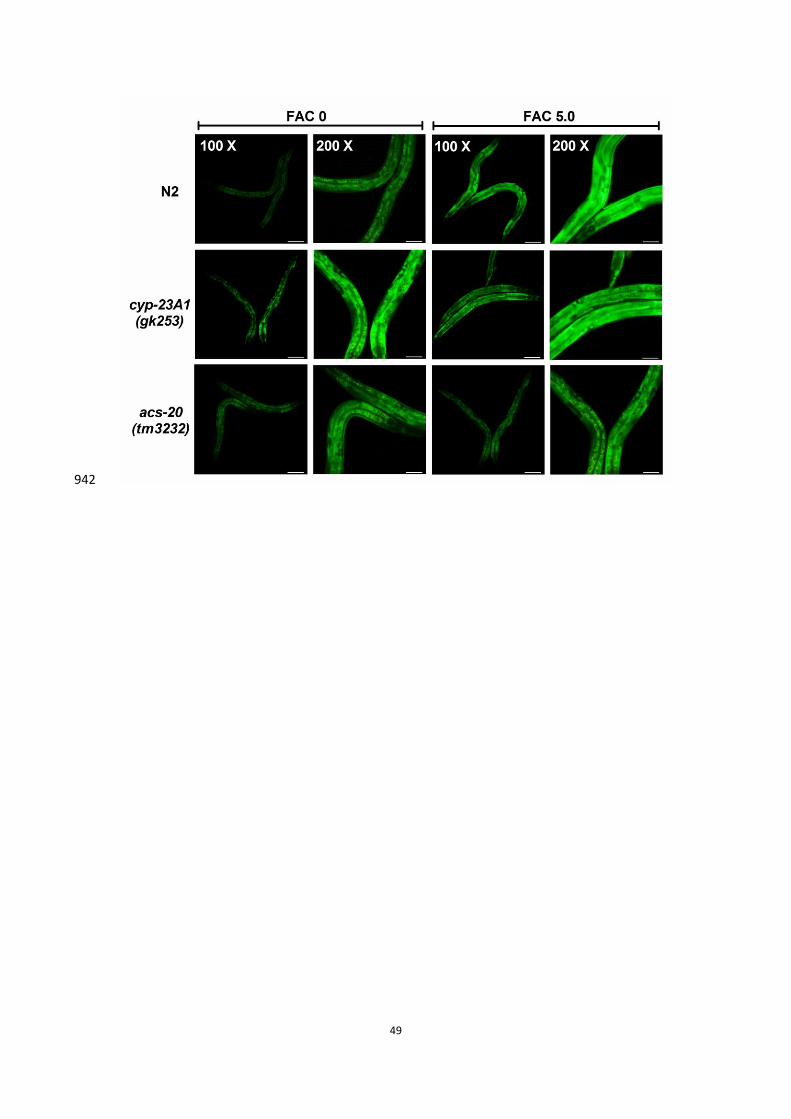
Fig. S9. The expression of VIT-2::GFP in N2, cyp-23A1(gk253), and 939
acs-20(tm3232) worms. Represented animals. Scale bar represents 100 um. Exposure 940
time: 334 ms. 100 X is 100 magnifications, and 200 X is 200 magnifications. 941
49
942