Embed Size (px)
Citation preview
Railway Handbook 2013
Energy Consumption and CO2 Emissions- Focus on Energy Mix -
INTERNATIONAL ENERGY AGENCY
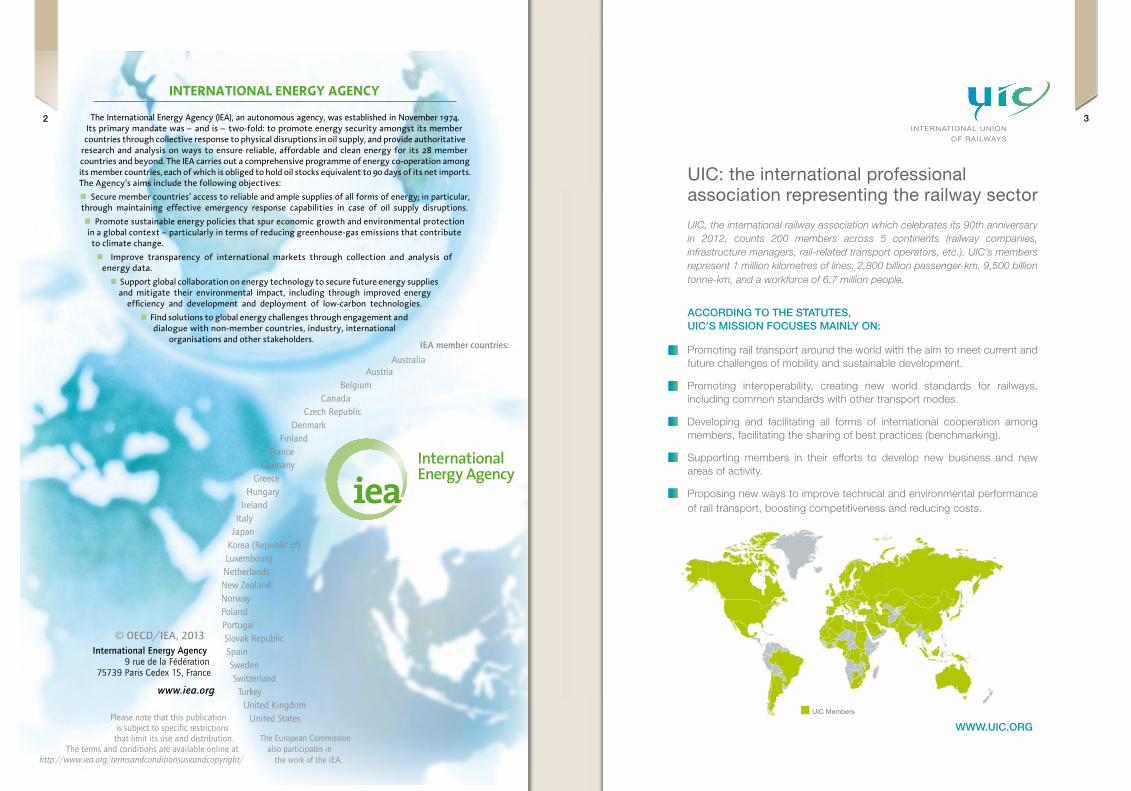
The International Energy Agency (IEA), an autonomous agency, was established in November 1974. Its primary mandate was – and is – two-fold: to promote energy security amongst its member countries through collective response to physical disruptions in oil supply, and provide authoritative
research and analysis on ways to ensure reliable, affordable and clean energy for its 28 member countries and beyond. The IEA carries out a comprehensive programme of energy co-operation among its member countries, each of which is obliged to hold oil stocks equivalent to 90 days of its net imports. The Agency’s aims include the following objectives:
n Secure member countries’ access to reliable and ample supplies of all forms of energy; in particular, through maintaining effective emergency response capabilities in case of oil supply disruptions.
n Promote sustainable energy policies that spur economic growth and environmental protection in a global context – particularly in terms of reducing greenhouse-gas emissions that contribute
to climate change.
n Improve transparency of international markets through collection and analysis of energy data.
n Support global collaboration on energy technology to secure future energy supplies and mitigate their environmental impact, including through improved energy
efficiency and development and deployment of low-carbon technologies.
n Find solutions to global energy challenges through engagement and dialogue with non-member countries, industry, international
organisations and other stakeholders.IEA member countries:
Australia Austria
Belgium Canada
Czech RepublicDenmark
FinlandFrance
GermanyGreece
HungaryIreland
ItalyJapan
Korea (Republic of)LuxembourgNetherlandsNew Zealand NorwayPolandPortugalSlovak RepublicSpainSwedenSwitzerland
TurkeyUnited Kingdom
United States
The European Commission also participates in
the work of the IEA.
© OECD/IEA, 2013International Energy Agency
9 rue de la Fédération 75739 Paris Cedex 15, France
www.iea.org
Please note that this publication is subject to specific restrictions that limit its use and distribution.
The terms and conditions are available online at http://www.iea.org/termsandconditionsuseandcopyright/
UIC: the international professional association representing the railway sector
UIC, the international railway association which celebrates its 90th anniversary in 2012, counts 200 members across 5 continents (railway companies, infrastructure managers, rail-related transport operators, etc.). UIC’s members represent 1 million kilometres of lines, 2,800 billion passenger-km, 9,500 billion tonne-km, and a workforce of 6.7 million people.
ACCORDING TO THE STATUTES, UIC’S MISSION FOCUSES MAINLY ON:
Promoting rail transport around the world with the aim to meet current and future challenges of mobility and sustainable development.
Promoting interoperability, creating new world standards for railways, including common standards with other transport modes.
Developing and facilitating all forms of international cooperation among members, facilitating the sharing of best practices (benchmarking).
Supporting members in their efforts to develop new business and new areas of activity.
Proposing new ways to improve technical and environmental performance of rail transport, boosting competitiveness and reducing costs.
UIC Members
WWW.UIC.ORG
32
Foreword
The International Energy Agency and the International Union of Railways are pleased to launch the second edition of the IEA/UIC data handbook on “Energy Consumption and CO2 Emissions of World Railway Sector”.
The first edition was successful in providing valuable information on rail energy use and emissions to actors in the energy field and broader transport sector.
Expanding on the regional energy and emissions data presented in last year’s handbook, this second edition goes deeper into rail energy and emissions statistics and, for the first time, presents aggregate data on worldwide rail activity and energy use.
Since the last edition, rail and energy data has improved considerably as UIC and the IEA have worked closely together.
Though the reliability and quality of rail data can still be improved, we hope this annual publication will help railway operators to implement a more systematic data collection process. Assessing the efficiency of railway operations is a strategic move that will allow railways to evolve over time while keeping their environmental advantage for the coming decades.
Railways are at the core of electro-mobility, which will be a focus of the IEA’s Energy Technology Perspectives publication in 2014.
This edition of the “Energy Consumption and CO2 Emissions of World Railway Sector” looks closely at railway electricity mixes in Europe as well as options to provide renewable electricity to railway operators.
Moving towards sustainable mobility requires both integrated and efficient transport systems as well as secure and clean energy. Modal shifts to rail can be a major driver for decarbonisation of the transport sector, and the set of data presented in this new edition illustrates this potential.
The IEA and UIC continue to work hand-in-hand to encourage policy makers and railway operators to move toward a sustainable and efficient energy future.
Jean-Pierre Loubinoux
International Union of Railways Director General
Maria van der Hoeven
International Energy Agency Executive Director
5
Railway Handbook 2013
Energy Consumption and CO2 Emissions
Acknowledgments
This publication has been made possible thanks to UIC railway members, who have contributed to UIC statistics on railway activity, energy consumption and CO2 emissions since 2005, and to the IEA Statistics Department, which has collected and managed energy balances and CO2 emissions data from fuel combustion.
The Handbook has been coordinated by François Cuenot, John Dulac (IEA) and Veronica Aneris (UIC).
A special mention goes to the cooperation of UIC and IEA staff, and inparticular to Elodie Arlaud (IEA), Nicholas Craven, Andrea Braschi and Snejana Markovic-Chenais (UIC).
A special thanks to the Sustainable Development Foundation for its technical support, especially to Daniele Arena, Raimondo Orsini, Andrea Barbabella and Valeria Gentili.
Infographic design: Laboratorio Linfawww.laboratoriolinfa.com
Printed on Revive Natural Offset, 100% Recycled Paper
6
Index
Index of Figures
Index of Tables
Introduction
Part I: The Railway Sector Main data
World
Europe
USA
Japan
Brazil
Russian Federation
India
People’s Republic of China
South Africa
Part II: Focus on Energy Mix
Energy Mix in Transport and Railways
Electricity Mixes in EU27
Comparison: Production/Consumption/Railway electricity mix in selected countries
Inter - modal comparison of specific emissions: baseline 2010 and sectoral targets
Methodology Notes
Glossary
References
10
13
15
18
31
41
46
53
58
64
69
76
81
82
85
92
98
100
101
103
17
9
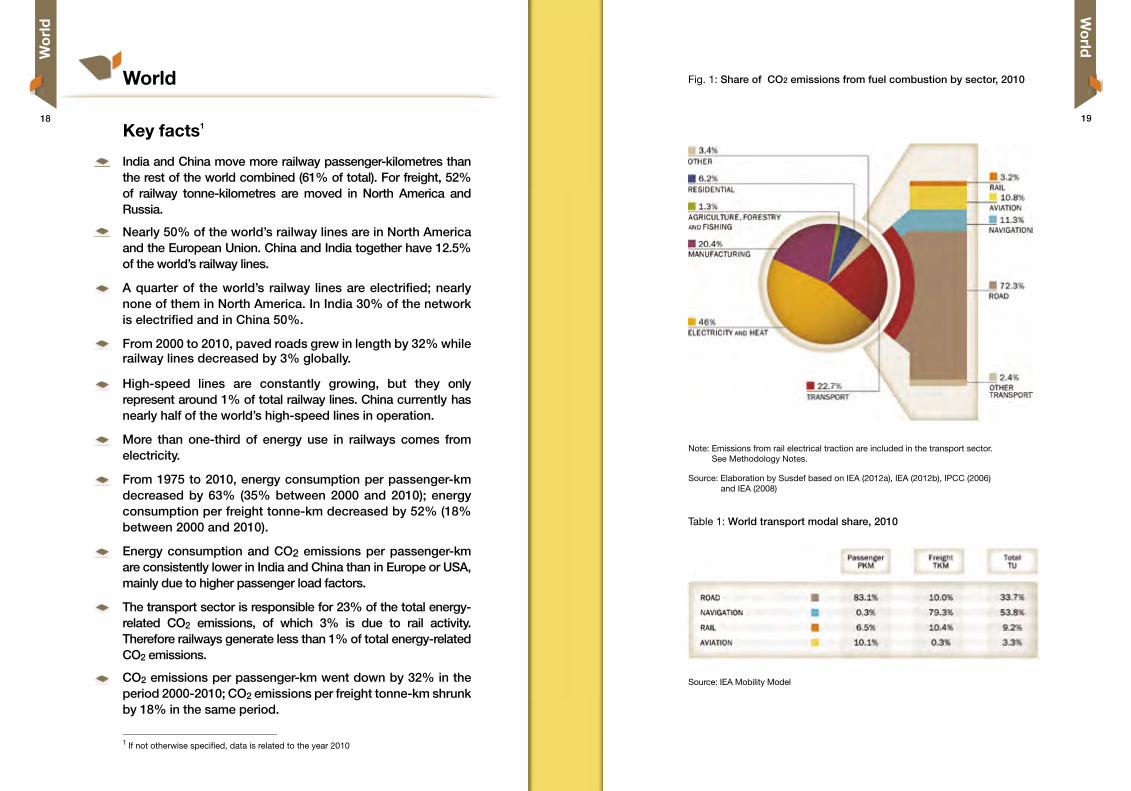
Fig. 1: Share of CO2 emissions from fuel combustion by sector, 2010
Fig. 2: Passenger and freight railway activity, 1975-2010
Fig. 3: Railway passenger transport activity, 1975-2010
Fig. 4: Railway passenger transport activity by geographic area, 1975-2010
Fig. 5: Railway passenger transport activity by geographic area, 1975-2010
Fig. 6: Railway freight transport activity, 1975-2010
Fig. 7: Railway freight transport activity by geographic area, 1975-2010
Fig. 8: Railway freight transport activity by geographic area, 1975-2010
Fig. 9: Length of railway lines in operation by geographic area & total passenger and freight train-km, 1975-2010
Fig. 10: Length and share of electrified versus non-electrified railway lines, 1975-2010
Fig. 11: Share of electrified railway lines in selected countries and geographic areas, 1975-2010
Fig. 12: High-speed lines in operation and forecasted, 1981-2020
Fig. 13: High-speed lines in operation by country, 1981-2012
Fig. 14: High-speed lines in operation by country and share of world total, 2012
Fig. 15: Evolution of paved roads and railway lines, 2000-2010
Fig. 16: Railway energy consumption by fuel, 1990-2010
Fig. 17: Railway specific energy consumption, 1975-2010
Fig. 18: Railway passenger specific energy consumption in selected countries, 1975-2010
Fig. 19: Railway freight specific energy consumption in selected countries, 1975-2010
Fig. 20: World electricity mix evolution, 2010 outside – 2005 inside
Fig. 21: Railway specific CO2 emissions, 1995-2010
Fig. 22: Railway passenger passenger specific CO2 emissions in selected countries, 1995-2010
Fig. 23: Railway freight specific CO2 emissions in selected countries, 1995-2010
Fig. 24: Passenger and freight transport activity, 2000-2010
Fig. 25: Passenger transport activity by mode, 2000-2010
Fig. 26: Modal evolution of passenger traffic activity, 2000-2010
Fig. 27: Freight transport activity by mode, 2000-2010
Fig. 28: Modal evolution of freight traffic activity, 2000-2010
Fig. 29: Share of CO2 emissions from fuel combustion by sector, 2010
Fig. 30: Transport sector energy consumption by mode, 1990-2010
Fig. 31: Transport sector CO2 emissions by mode, 1990-2010
Fig. 32: Railway passenger transport activity, 2000-2010
Fig. 33: Railway passenger transport activity by service type, 2000-2010
Fig. 34: Railway freight transport activity, 2000-2010
Fig. 35: Length and share of electrified versus non-electrified railway lines, 1975-2010
Fig. 36: Evolution of paved roads and railway lines, 2000-2010
38
39
39
40
41
41
42
42
43
43
44
44
45
45
46
47
47
48
48
49
49
50
50
51
51
52
52
53
53
54
54
55
55
56
56
57
57
58
59
59
60
60
61
61
Index of Figures
19
20
20
21
21
22
22
23
23
24
24
25
25
26
26
27
27
28
28
29
29
30
30
32
32
33
33
34
34
35
35
36
36
37
37
38
Fig. 37: Railway energy consumption by fuel, 1990-2010
Fig. 38: Railway specific energy consumption, 1990-2010
Fig. 39: Railway specific CO2 emissions, 1990-2010
Fig. 40: Share of passenger transport CO2 emissions by distance of trip, Italy 2010
Fig. 41: Share of CO2 emissions from fuel combustion by sector, 2010
Fig. 42: Transport sector CO2 emissions by mode, 1990-2010
Fig. 43: Passenger and freight railway activity, 1990-2010
Fig. 44: Length of railway line, 1990-2010
Fig. 45: Evolution of paved roads and railway lines, 2000-2010
Fig. 46: Railway energy consumption by fuel, 1990-2010
Fig. 47: Railway specific energy consumption, 1975-2010
Fig. 48: National electricity production mix evolution, 2011 outside – 2006 inside
Fig. 49: National CO2 emission factor from electricity production mix, 1990-2010
Fig. 50: Railway specific CO2 emissions, 1995-2010
Fig. 51: Share of CO2 emissions from fuel combustion by sector, 2010
Fig. 52: Passenger and freight transport activity, 1990-2010
Fig. 53: Modal evolution of passenger traffic activity, 1995-2010
Fig. 54: Modal evolution of freight traffic activity, 1995-2010
Fig. 55: Transport sector CO2 emissions by mode, 1990-2010
Fig. 56: Passenger and freight railway activity, 1975-2010
Fig. 57: Length and share of electrified versus non-electrified railway lines, 1990-2010
Fig. 58: Evolution of paved roads and railway lines, 2000-2010
Fig. 59: Railway energy consumption by fuel, 1990-2010
Fig. 60: Railway specific energy consumption, 1975-2010
Fig. 61: National electricity production mix evolution, 2011 outside – 2006 inside
Fig. 62: National CO2 emission factor from electricity production mix, 1990-2010
Fig. 63: Railway specific CO2 emissions, 1995-2010
Fig. 64: Share of CO2 emissions from fuel combustion by sector, 2010
Fig. 65: Transport sector CO2 emissions by mode, 1990-2010
Fig. 66: Passenger and freight railway activity, 2002-2010
Fig. 67: Length of railway line, 1990-2010 (thousand km)
Fig. 68: Evolution of paved roads and railway lines, 2000-2010 (km)
Fig. 69: Railway energy consumption by fuel, 1990-2009
Fig. 70: Railway specific energy consumption, 1975-2010
Fig. 71: National electricity production mix evolution, 2010 outside – 2005 inside
Fig. 72: National CO2 emission factor from electricity production mix, 2002-2010
Fig. 73: Railway specific CO2 emissions, 1995-2010
Fig. 74: Share of CO2 emissions from fuel combustion by sector, 2010
Fig. 75: Passenger and freight transport activity, 2004-2010
Fig. 76: Transport sector CO2 emissions by mode, 1990-2010
Fig. 77: Passenger and freight railway activity, 1975-2010
Fig. 78: Length and share of electrified versus non-electrified railway lines, 1990-2010
Fig. 79: Evolution of paved roads and railway lines, 2000-2010
Fig. 80: Railway energy consumption by fuel, 1990-2010
EU27
USA
Russia
Japan
Brazil
World
1110
Fig. 81: Railway specific energy consumption, 1975-2010
Fig. 82: National electricity production mix evolution, 2010 outside – 2005 inside
Fig. 83: National CO2 emission factor from electricity production mix, 1990-2010
Fig. 84: Railway specific CO2 emissions, 1995-2010
Fig. 85: Share of CO2 emissions from fuel combustion by sector, 2010
Fig. 86: Transport sector CO2 emissions by mode, 1990-2010 (million tCO2)
Fig. 87: Passenger and freight railway activity, 1990-2010
Fig. 88: Length and share of electrified versus non-electrified railway lines, 1990-2010
Fig. 89: Evolution of paved roads and railway lines, 2000-2010 (km)
Fig. 90: Railway energy consumption by fuel, 1990-2010 (PJ)
Fig. 91: Railway specific energy consumption, 1975-2010
Fig. 92: National electricity production mix evolution, 2010 outside – 2005 inside
Fig. 93: National CO2 emission factor from electricity production mix, 1990-2010
Fig. 94: Railway specific CO2 emissions, 1995-2010
Fig. 95: Share of CO2 emissions from fuel combustion by sector, 2010
Fig. 96: Passenger and freight transport activity, 1990-2010 (billion pkm and tkm)
Fig. 97: Modal evolution of passenger traffic activity, 1995-2010 (pkm)
Fig. 98: Modal evolution of freight traffic activity, 1995-2010 (tkm)
Fig. 99: Transport sector CO2 emissions by mode, 1990-2010 (million tCO2)
Fig. 100: Passenger and freight railway activity, 1990-2010
Fig. 101: Length and share of electrified versus non-electrified railway lines, 1990-2010
Fig. 102: Evolution of paved roads and railway lines, 2000-2010 (km)
Fig. 103: Railway energy consumption by fuel, 1990-2010 (PJ)
Fig. 104: Railway specific energy consumption, 1975-2010
Fig. 105: National electricity production mix evolution, 2010 outside – 2005 inside
Fig. 106: National CO2 emission factor from electricity production mix, 1990-2010
Fig. 107: Railway specific CO2 emissions, 1995-2010
Fig. 108: Share of CO2 emissions from fuel combustion by sector, 2010
Fig. 109: Transport sector CO2 emissions by mode, 1990-2010 (million tCO2)
Fig. 110: Length and share of electrified versus non-electrified railway lines, 1990-2010
Fig. 111: Evolution of paved roads and railway lines, 2000-2010 (km)
Fig. 112: Railway energy consumption by fuel, 1990-2009 (PJ)
Fig. 113: Railway specific energy consumption, 1975-2010
Fig. 114: National electricity production mix evolution, 2010 outside – 2005 inside
Fig. 115: National CO2 emission factor from electricity production mix, 1990-2010
Fig. 116: Railway specific CO2 emissions, 1995-2010
Fig. 117: EU27 transport energy mix evolution, 2010 outside – 2005 inside
Fig. 118: EU27 railway energy mix evolution, 2010 outside – 2005 inside
Fig. 119: Forecast of the share of renewables in transport and in railways in EU27, 2005-2020
Fig. 120: National electricity production mix evolution in EU27, 2010 outside – 2006 middle - 1990 inside
Fig. 121: National Production Electricity Mix in selected EU and EFTA states, 2010
87
88
89
90
91
92
93
94
97
97
98
19
34
46
58
69
86
87
89
92
93
94
62
62
63
63
64
64
65
65
66
66
67
67
68
68
69
70
70
71
71
72
72
73
73
74
74
75
75
76
76
77
77
78
78
79
79
80
82
83
84
85
86
Fig. 122: National Consumption Electricity Mix in selected EU and EFTA states, 2010
Fig. 123: Physical energy flows in Europe, 2011
Fig. 124: Railway Electricity Mix in selected EU and EFTA states, 2010
Fig. 125: Railway electricity mix evolution in EU27, 2010 outside – 2005 inside
Fig. 126: Share of renewables in national production, national consumption and railway electricity mix for selected European countries, 2010
Fig. 127: National production, national consumption and railway electricity mix in Norway
Fig. 128: National production, national consumption and railway electricity mix in Austria
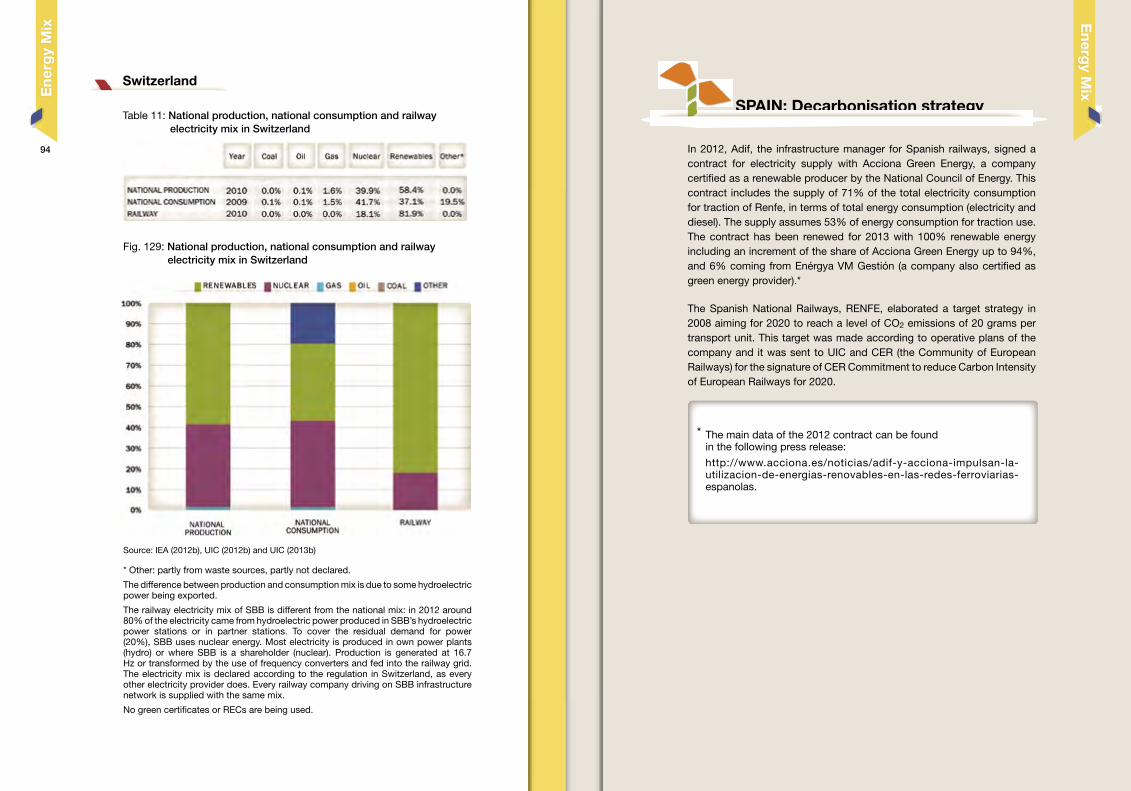
Fig. 129: National production, national consumption and railway electricity mix in Switzerland
Fig. 130: Gross installed power, 1996-2012 and national electricity production, 1990-2012 in Italy
Fig. 131: Specific emissions of electricity production in Italy
Fig. 132: Targets for specific emissions in 2020 and 2030 of railways, planes and conventional cars
Table 1: World transport modal share, 2010
Table 2: EU27 transport modal share, 2010
Table 3: Japan transport modal share, 2010
Table 4: Russia transport modal share, 2010
Table 5: China transport modal share, 2010
Table 6: National Production Electricity Mix in selected EU and EFTA states, 2010
Table 7: National Consumption Electricity Mix in selected EU and EFTA states, 2010
Table 8: Railway Electricity Mix in selected EU and EFTA states, 2010
Table 9: National production, national consumption and railway electricity mix in Norway
Table 10: National production, national consumption and railway electricity mix in Austria
Table 11: National production, national consumption and railway electricity mix in Switzerland
Index of tables
China
India
South Africa
Energy Mix
1312
Introduction
After the excellent reception of the Railway Handbook 2012 on Energy
Consumption and CO2 Emissions published last year, the International
Energy Agency and the International Union of Railways have decided to
strengthen their collaboration and publish a new Handbook every year.
In this edition, several significant improvements have been made, even
if the level of detail for energy and CO2 data of non-European operators
has not yet reached the standard of the European Database. Together
with updates of the most significant facts and figures from last year’s
Handbook, new insights have been added for several countries and
regions, including the USA, Japan and the countries known as BRICS
(Brazil, Russia, India, China and South Africa).
An entire new “World” section has also been introduced, with global trends
and statistics on railway transport activity, energy consumption and CO2
emissions. At the EU level, a high degree of data detail has permitted the
introduction of a special focus on Energy Mix, showing the sources of
energy used by railways in Europe.
This publication combines UIC and IEA data: UIC Statistics (UIC, 2012a)
and the UIC Energy and CO2 Database (UIC, 2012b) are pooled with
IEA World Energy Balances (IEA, 2012b) and CO2 Emissions from Fuel
Combustion (IEA, 2012a) to get a consolidated vision of the railway sector.
Further additions come from IEA infrastructure analysis (IEA, 2013) and the
IEA Mobility Model, which allows projections on energy and emissions for
the global transport sector.
The data collected in this year’s Handbook shows how shifting to rail
would benefit sustainable mobility: worldwide, railways generate only
3% of transport CO2 emissions, while sustaining more than 9% of total
transport activity. Rail energy efficiency and emissions are also constantly
improving: worldwide rail energy consumption and CO2 emissions per
passenger-kilometre shrank by more than 30% between 2000 and 2010,
according to the data released in this handbook.
This is partly due to the continued electrification of railways as more than
one-third of energy consumed by railways in the world is now electricity.
The special focus on Energy Mix in Europe allows the reader to look in
1514
Part I: The Railway Sector
Main data
more depth as to how much this increasing share of energy comes from
sustainable sources.
The good news is that the EU railway sector has already surpassed the
target set by EU directives, which requires 10% of renewable energy to
be used in transport by 2020. Railways in 2010 already used nearly 20%
of renewables in their energy mix. The Handbook shows how different
countries are dealing with renewables in their electricity use, together with
some case studies of electricity supply from national railway operators.
The IEA and the UIC are undertaking a significant effort to widen the
scope of their environmental data collection and to gather data from
railways all over the world. The ultimate goal is to provide policy makers
with continuously improved indicators on which to build choices towards
sustainable mobility – thanks to editions of the Handbook that will be more
accurate and comprehensive each year.
16
India and China move more railway passenger-kilometres than the rest of the world combined (61% of total). For freight, 52% of railway tonne-kilometres are moved in North America and Russia.
Nearly 50% of the world’s railway lines are in North America and the European Union. China and India together have 12.5% of the world’s railway lines.
A quarter of the world’s railway lines are electrified; nearly none of them in North America. In India 30% of the network is electrified and in China 50%.
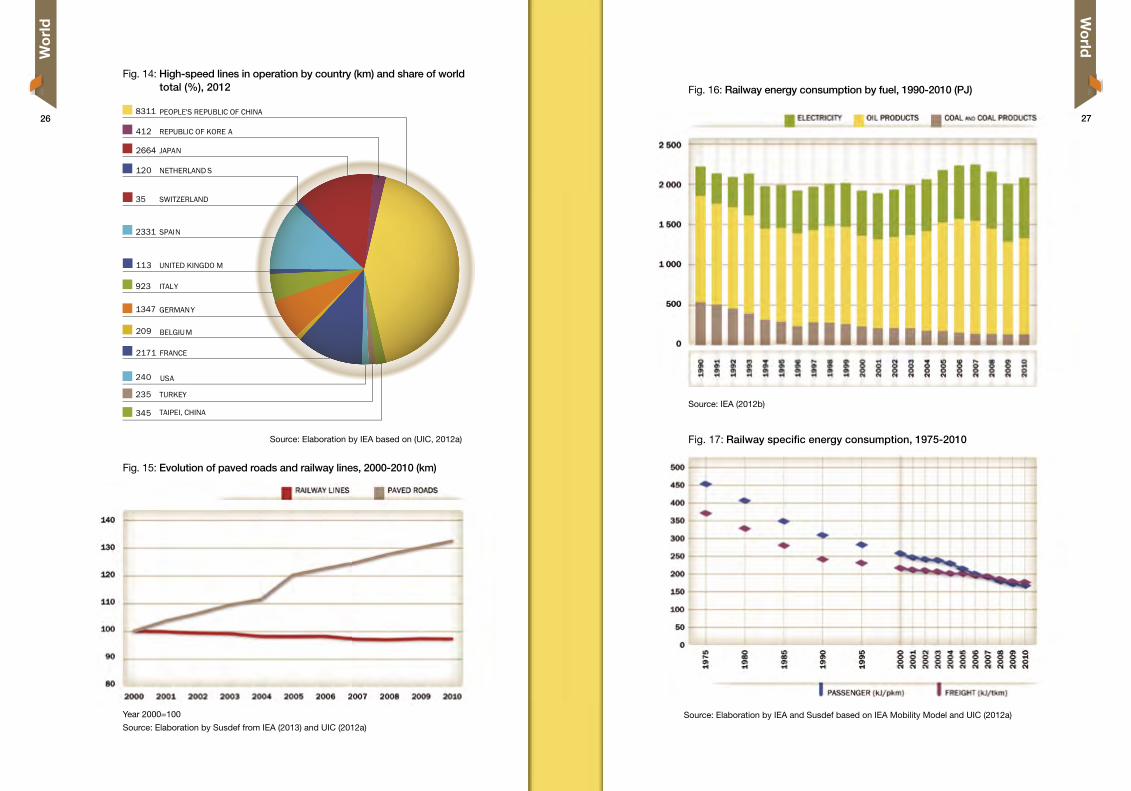
From 2000 to 2010, paved roads grew in length by 32% whilerailway lines decreased by 3% globally.
High-speed lines are constantly growing, but they only represent around 1% of total railway lines. China currently has nearly half of the world’s high-speed lines in operation.
More than one-third of energy use in railways comes from electricity.
From 1975 to 2010, energy consumption per passenger-km decreased by 63% (35% between 2000 and 2010); energy consumption per freight tonne-km decreased by 52% (18% between 2000 and 2010).
Energy consumption and CO2 emissions per passenger-km are consistently lower in India and China than in Europe or USA, mainly due to higher passenger load factors.
The transport sector is responsible for 23% of the total energy- related CO2 emissions, of which 3% is due to rail activity. Therefore railways generate less than 1% of total energy-related CO2 emissions.
CO2 emissions per passenger-km went down by 32% in the period 2000-2010; CO2 emissions per freight tonne-km shrunk by 18% in the same period.
1 If not otherwise specified, data is related to the year 2010
Fig. 1: Share of CO2 emissions from fuel combustion by sector, 2010
Table 1: World transport modal share, 2010
Note: Emissions from rail electrical traction are included in the transport sector. See Methodology Notes.
Source: Elaboration by Susdef based on IEA (2012a), IEA (2012b), IPCC (2006) and IEA (2008)
Source: IEA Mobility Model
World
Key facts11918
Wo
rldW
orl
d
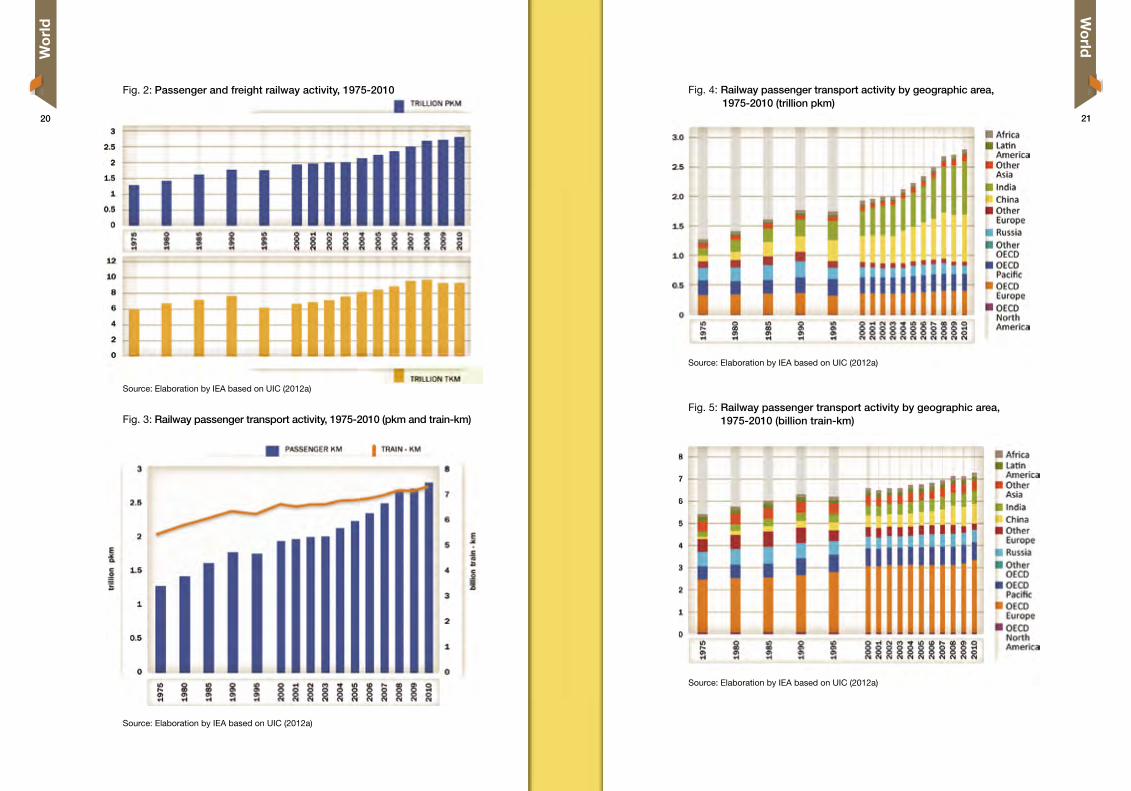
Fig. 5: Railway passenger transport activity by geographic area, 1975-2010 (billion train-km)
Source: Elaboration by IEA based on UIC (2012a)
Fig. 3: Railway passenger transport activity, 1975-2010 (pkm and train-km)
Source: Elaboration by IEA based on UIC (2012a)
Fig. 2: Passenger and freight railway activity, 1975-2010
Source: Elaboration by IEA based on UIC (2012a)
Fig. 4: Railway passenger transport activity by geographic area, 1975-2010 (trillion pkm)
Source: Elaboration by IEA based on UIC (2012a)
2120
Wo
rldW
orl
d
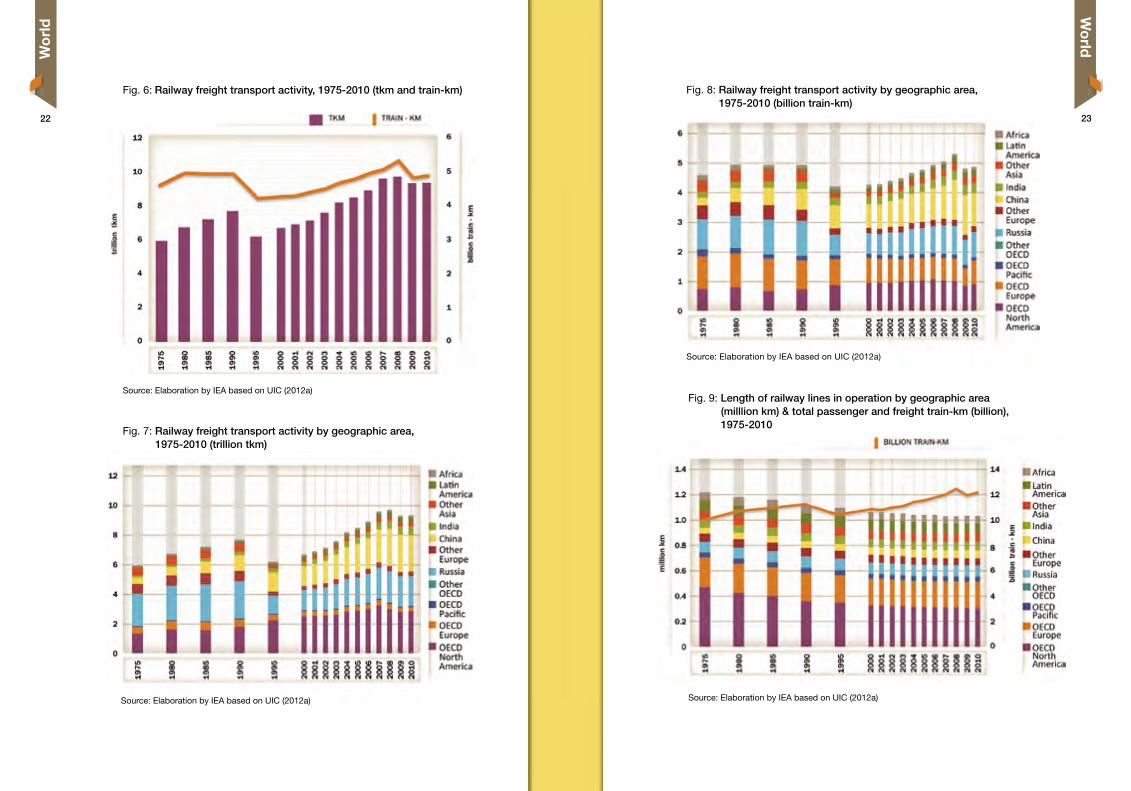
Fig. 9: Length of railway lines in operation by geographic area (milllion km) & total passenger and freight train-km (billion), 1975-2010
Source: Elaboration by IEA based on UIC (2012a) Source: Elaboration by IEA based on UIC (2012a)
Source: Elaboration by IEA based on UIC (2012a)
Fig. 7: Railway freight transport activity by geographic area, 1975-2010 (trillion tkm)
Fig. 8: Railway freight transport activity by geographic area, 1975-2010 (billion train-km)
Source: Elaboration by IEA based on UIC (2012a)
Fig. 6: Railway freight transport activity, 1975-2010 (tkm and train-km)
2322
Wo
rldW
orl
d
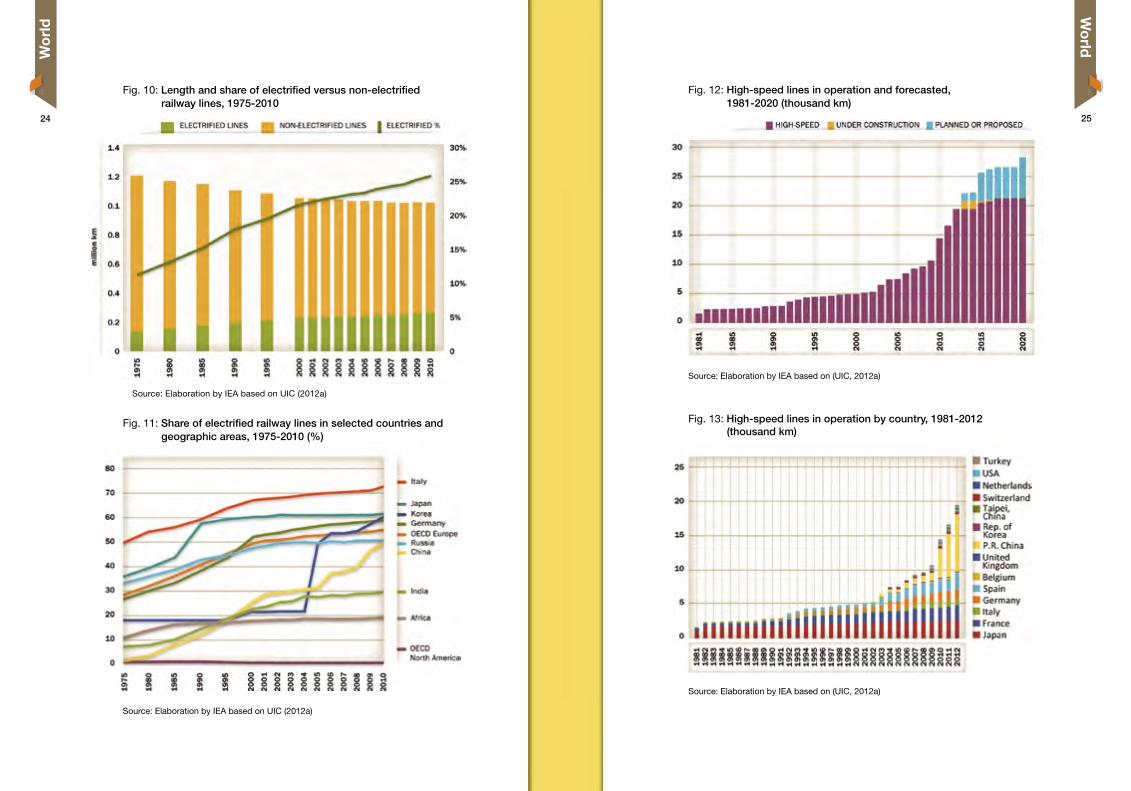
Fig. 13: High-speed lines in operation by country, 1981-2012 (thousand km)
Source: Elaboration by IEA based on UIC (2012a)
Fig. 11: Share of electrified railway lines in selected countries and geographic areas, 1975-2010 (%)
Fig. 12: High-speed lines in operation and forecasted, 1981-2020 (thousand km)
Source: Elaboration by IEA based on (UIC, 2012a)
Source: Elaboration by IEA based on (UIC, 2012a)
Fig. 10: Length and share of electrified versus non-electrified railway lines, 1975-2010
Source: Elaboration by IEA based on UIC (2012a)
2524
Wo
rldW
orl
d
Source: IEA (2012b)
Fig. 17: Railway specific energy consumption, 1975-2010
Source: Elaboration by IEA and Susdef based on IEA Mobility Model and UIC (2012a)
Fig. 14: High-speed lines in operation by country (km) and share of world total (%), 2012 Fig. 16: Railway energy consumption by fuel, 1990-2010 (PJ)
Fig. 15: Evolution of paved roads and railway lines, 2000-2010 (km)
Source: Elaboration by IEA based on (UIC, 2012a)
Year 2000=100
Source: Elaboration by Susdef from IEA (2013) and UIC (2012a)
2726
Wo
rldW
orl
d
PEOPLE'S REPUBLIC OF CHINA 8311
412
2664
SPAIN2331
SWITZERLAND35
NETHERLAND S
JAPAN
REPUBLIC OF KORE A
120
ITALY923
240
TURKEY235
TAIPEI, CHINA345
USA
209 BELGIUM
GERMANY1347
FRANCE2171
UNITED KINGDO M113
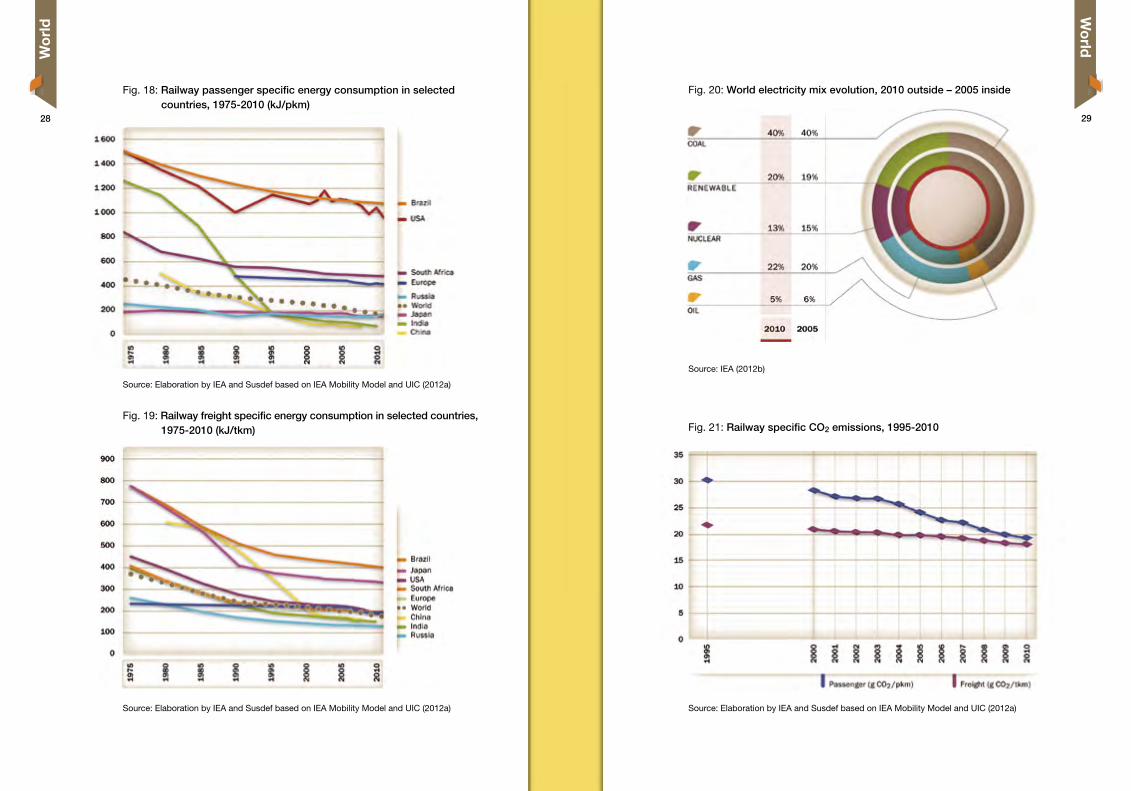
Fig. 18: Railway passenger specific energy consumption in selected countries, 1975-2010 (kJ/pkm)
Fig. 20: World electricity mix evolution, 2010 outside – 2005 inside
Fig. 19: Railway freight specific energy consumption in selected countries, 1975-2010 (kJ/tkm) Fig. 21: Railway specific CO2 emissions, 1995-2010
Source: Elaboration by IEA and Susdef based on IEA Mobility Model and UIC (2012a)
Source: IEA (2012b)
Source: Elaboration by IEA and Susdef based on IEA Mobility Model and UIC (2012a)Source: Elaboration by IEA and Susdef based on IEA Mobility Model and UIC (2012a)
2928
Wo
rldW
orl
d
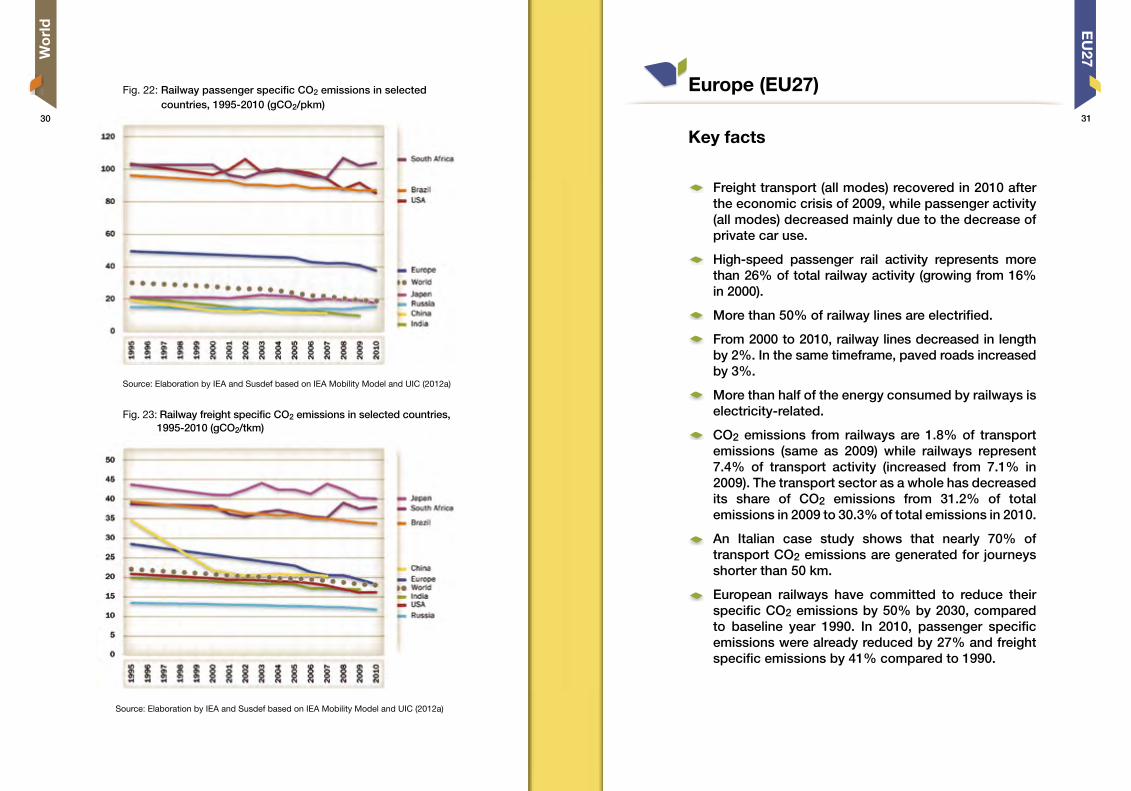
Source: Elaboration by IEA and Susdef based on IEA Mobility Model and UIC (2012a)
Source: Elaboration by IEA and Susdef based on IEA Mobility Model and UIC (2012a)
Fig. 23: Railway freight specific CO2 emissions in selected countries, 1995-2010 (gCO2/tkm)
Fig. 22: Railway passenger specific CO2 emissions in selected countries, 1995-2010 (gCO2/pkm)
Europe (EU27)
Key facts
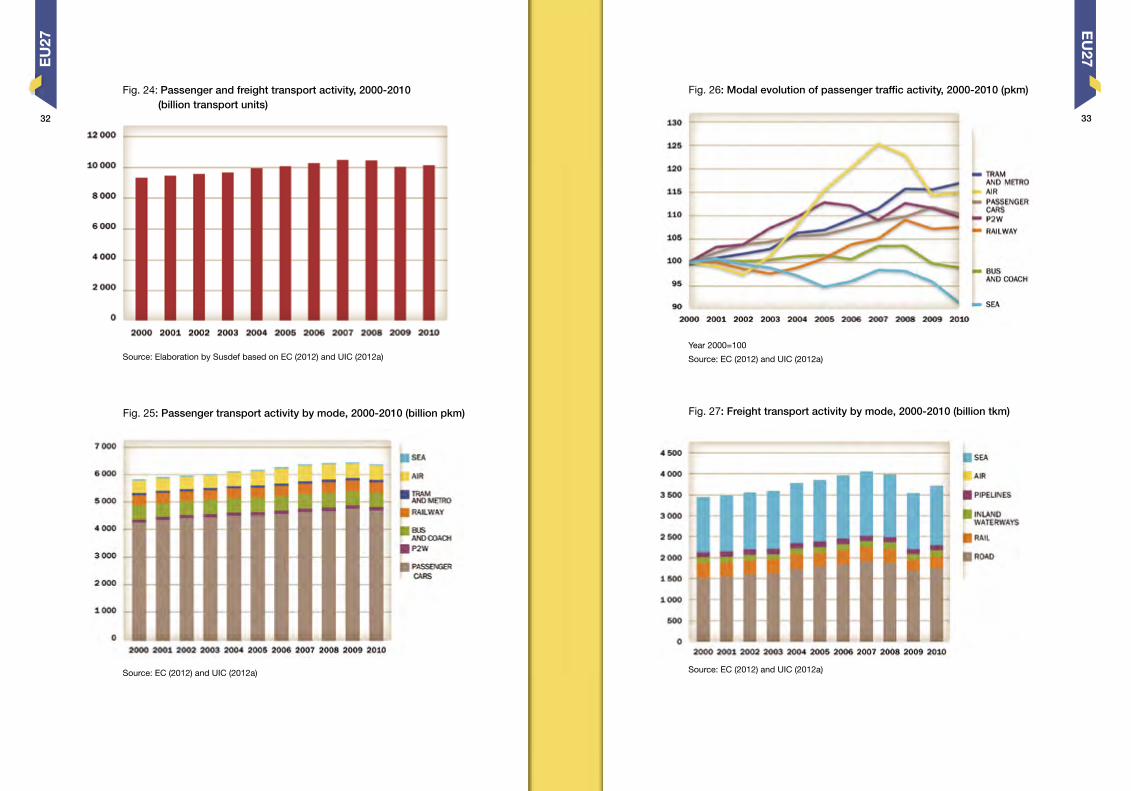
Freight transport (all modes) recovered in 2010 after the economic crisis of 2009, while passenger activity (all modes) decreased mainly due to the decrease of private car use.
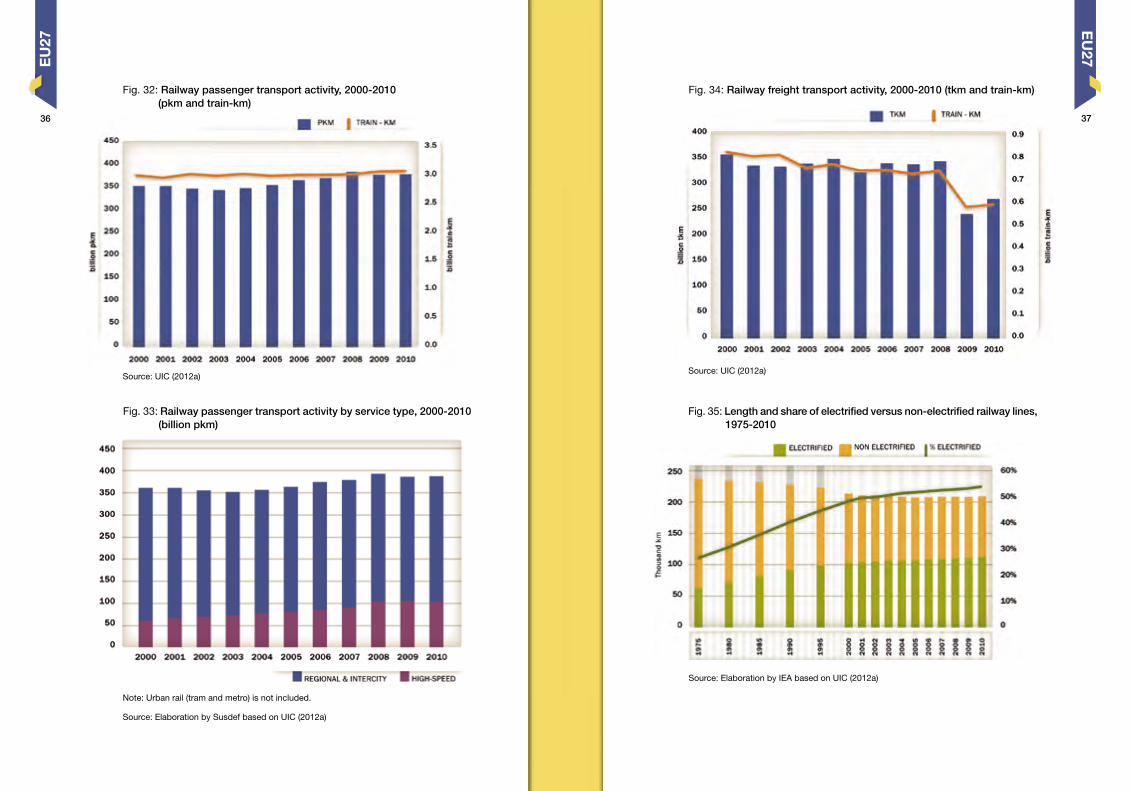
High-speed passenger rail activity represents more than 26% of total railway activity (growing from 16% in 2000).
More than 50% of railway lines are electrified.
From 2000 to 2010, railway lines decreased in length by 2%. In the same timeframe, paved roads increased by 3%.
More than half of the energy consumed by railways is electricity-related.
CO2 emissions from railways are 1.8% of transport emissions (same as 2009) while railways represent 7.4% of transport activity (increased from 7.1% in 2009). The transport sector as a whole has decreased its share of CO2 emissions from 31.2% of total emissions in 2009 to 30.3% of total emissions in 2010.
An Italian case study shows that nearly 70% of transport CO2 emissions are generated for journeys shorter than 50 km.
European railways have committed to reduce their specific CO2 emissions by 50% by 2030, compared to baseline year 1990. In 2010, passenger specific emissions were already reduced by 27% and freight specific emissions by 41% compared to 1990.
EU
27
3130
Wo
rld
Source: EC (2012) and UIC (2012a)
Source: EC (2012) and UIC (2012a)
Fig. 24: Passenger and freight transport activity, 2000-2010 (billion transport units)
Fig. 25: Passenger transport activity by mode, 2000-2010 (billion pkm)
Fig. 26: Modal evolution of passenger traffic activity, 2000-2010 (pkm)
Fig. 27: Freight transport activity by mode, 2000-2010 (billion tkm)
Source: Elaboration by Susdef based on EC (2012) and UIC (2012a)
Source: EC (2012) and UIC (2012a)
EU
27EU
27
Year 2000=100
3332
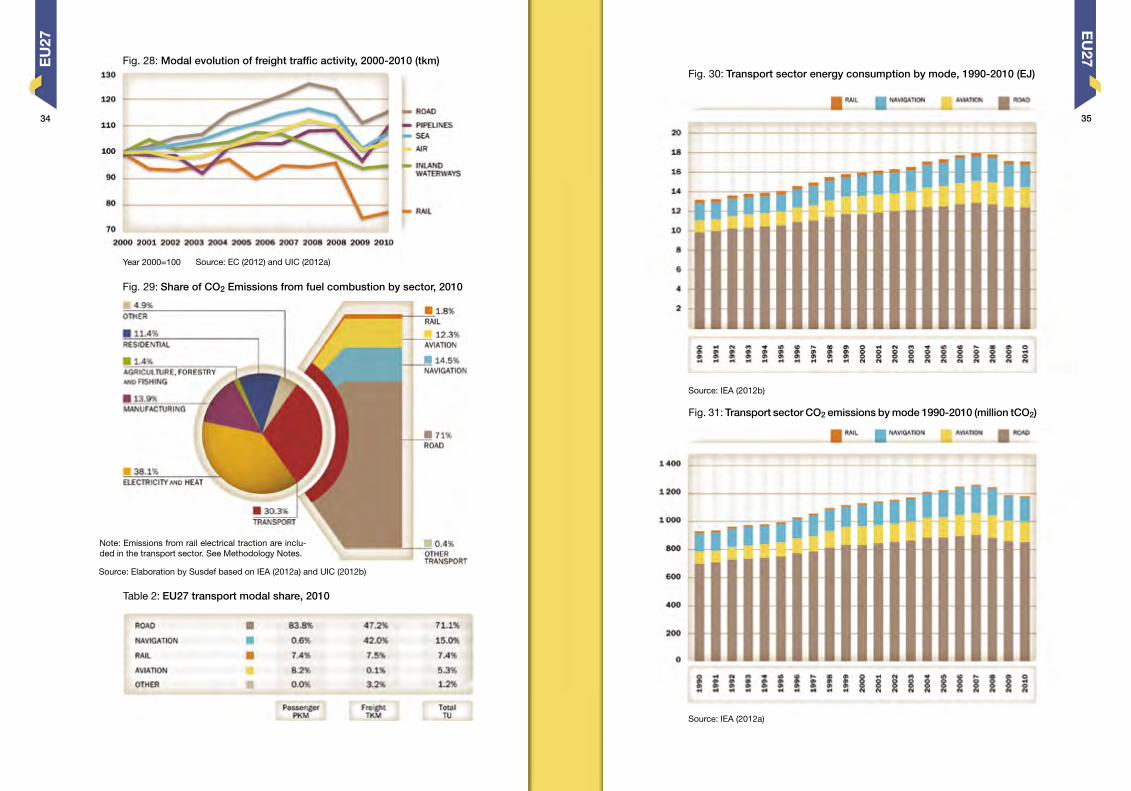
Fig. 29: Share of CO2 Emissions from fuel combustion by sector, 2010
Table 2: EU27 transport modal share, 2010
Fig. 30: Transport sector energy consumption by mode, 1990-2010 (EJ)
Fig. 31: Transport sector CO2 emissions by mode 1990-2010 (million tCO2)
Source: EC (2012) and UIC (2012a)
Note: Emissions from rail electrical traction are inclu-ded in the transport sector. See Methodology Notes.
Source: Elaboration by Susdef based on IEA (2012a) and UIC (2012b)
Source: IEA (2012b)
Source: IEA (2012a)
Fig. 28: Modal evolution of freight traffic activity, 2000-2010 (tkm)
EU
27EU
27
Year 2000=100
3534
Source: Elaboration by IEA based on UIC (2012a)
Fig. 35: Length and share of electrified versus non-electrified railway lines, 1975-2010
Fig. 34: Railway freight transport activity, 2000-2010 (tkm and train-km)Fig. 32: Railway passenger transport activity, 2000-2010 (pkm and train-km)
Fig. 33: Railway passenger transport activity by service type, 2000-2010 (billion pkm)
Source: UIC (2012a)
Note: Urban rail (tram and metro) is not included.
Source: Elaboration by Susdef based on UIC (2012a)
Source: UIC (2012a)
EU
27EU
27
3736
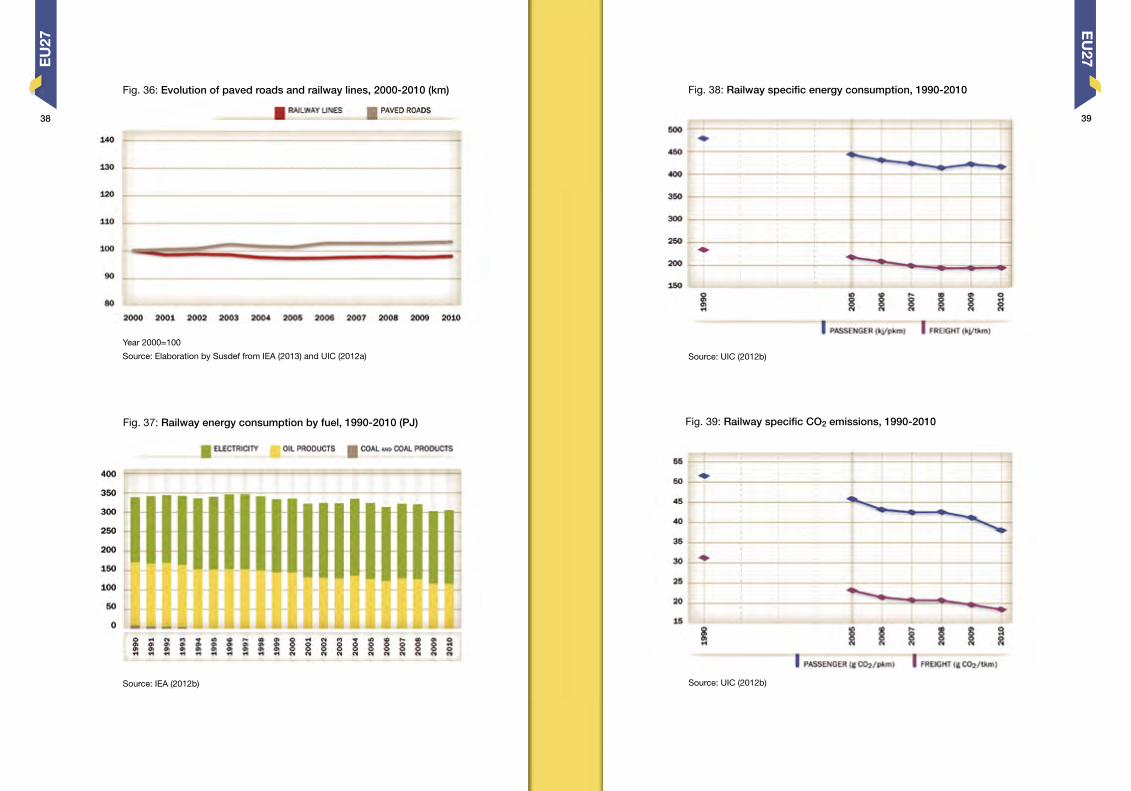
Fig. 38: Railway specific energy consumption, 1990-2010
Fig. 39: Railway specific CO2 emissions, 1990-2010
Source: UIC (2012b)
Source: UIC (2012b)
Source: Elaboration by Susdef from IEA (2013) and UIC (2012a)
Fig. 37: Railway energy consumption by fuel, 1990-2010 (PJ)
Fig. 36: Evolution of paved roads and railway lines, 2000-2010 (km)
Source: IEA (2012b)
Year 2000=100
EU
27EU
27
3938
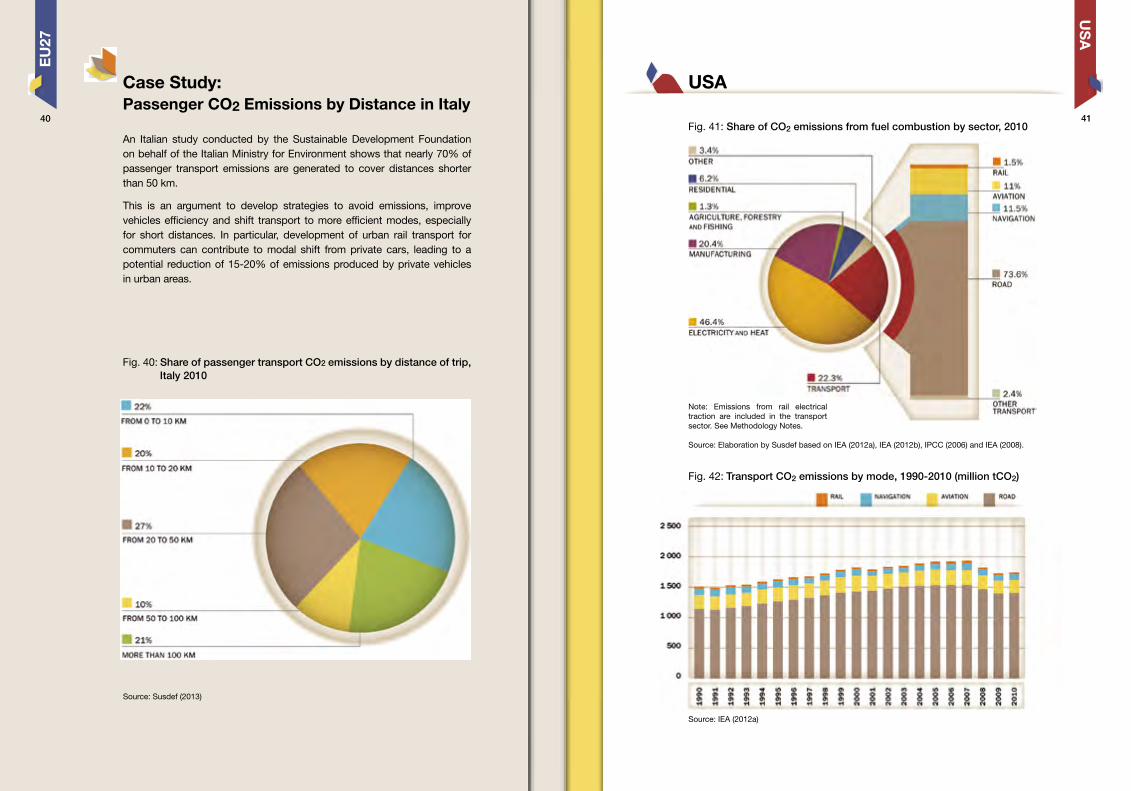
Case Study:Passenger CO2 Emissions by Distance in Italy
An Italian study conducted by the Sustainable Development Foundation on behalf of the Italian Ministry for Environment shows that nearly 70% of passenger transport emissions are generated to cover distances shorter than 50 km.
This is an argument to develop strategies to avoid emissions, improve vehicles efficiency and shift transport to more efficient modes, especially for short distances. In particular, development of urban rail transport for commuters can contribute to modal shift from private cars, leading to a potential reduction of 15-20% of emissions produced by private vehicles in urban areas.
Source: Susdef (2013)
Fig. 40: Share of passenger transport CO2 emissions by distance of trip, Italy 2010
USA
Fig. 41: Share of CO2 emissions from fuel combustion by sector, 2010
US
A
Note: Emissions from rail electrical traction are included in the transport sector. See Methodology Notes.
Source: Elaboration by Susdef based on IEA (2012a), IEA (2012b), IPCC (2006) and IEA (2008).
Fig. 42: Transport CO2 emissions by mode, 1990-2010 (million tCO2)
Source: IEA (2012a)
EU
27
4140
US
AU
SA
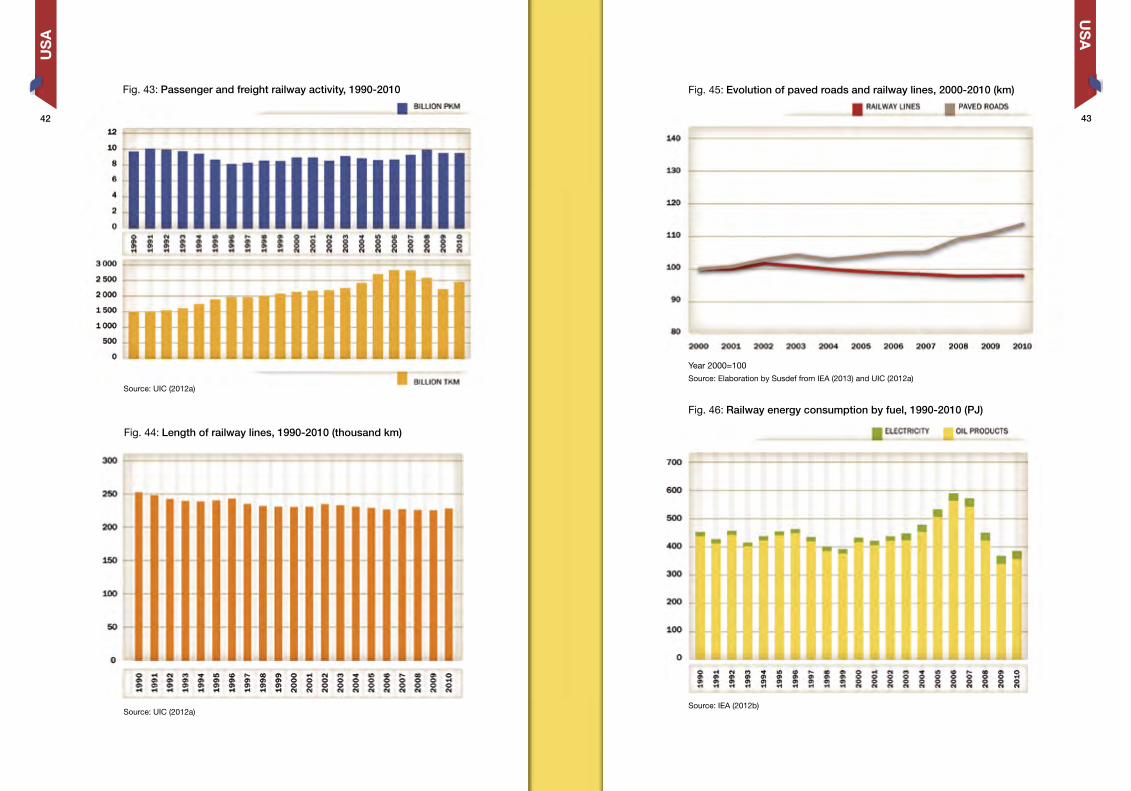
Fig. 43: Passenger and freight railway activity, 1990-2010
Fig. 44: Length of railway lines, 1990-2010 (thousand km)
Fig. 45: Evolution of paved roads and railway lines, 2000-2010 (km)
Source: UIC (2012a)
Source: UIC (2012a)Source: Elaboration by Susdef from IEA (2013) and UIC (2012a)
Fig. 46: Railway energy consumption by fuel, 1990-2010 (PJ)
Source: IEA (2012b)
Year 2000=100
4342
US
A
Source: Elaboration by IEA and Susdef based on IEA Mobility Model and UIC (2012a)
US
A
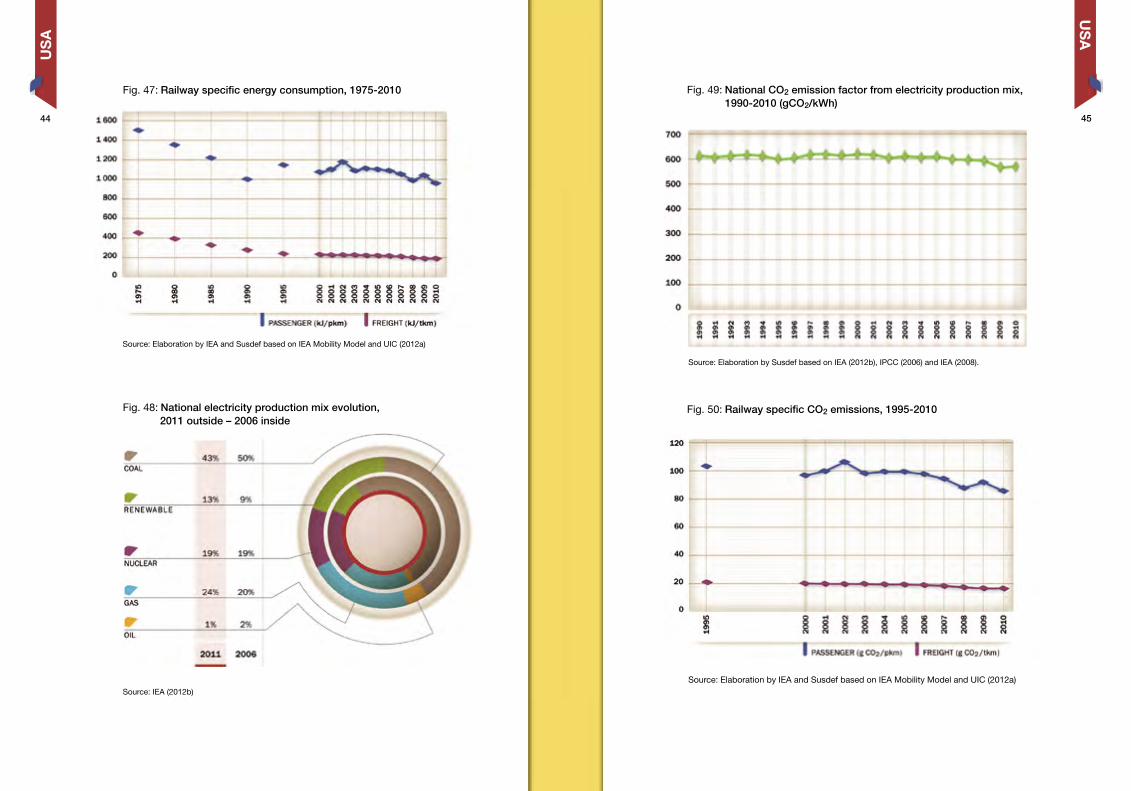
Fig. 47: Railway specific energy consumption, 1975-2010
Fig. 48: National electricity production mix evolution, 2011 outside – 2006 inside
Fig. 49: National CO2 emission factor from electricity production mix, 1990-2010 (gCO2/kWh)
Fig. 50: Railway specific CO2 emissions, 1995-2010
Source: IEA (2012b)
Source: Elaboration by IEA and Susdef based on IEA Mobility Model and UIC (2012a)
Source: Elaboration by Susdef based on IEA (2012b), IPCC (2006) and IEA (2008).
4544
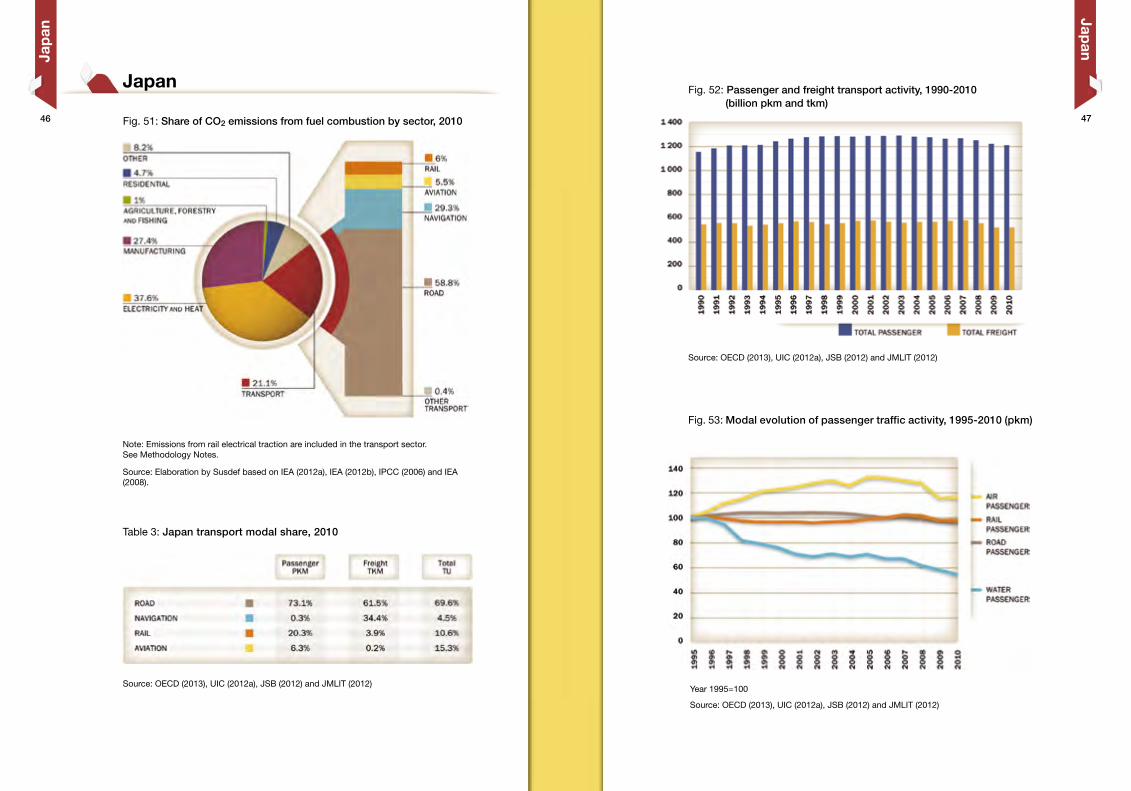
Fig. 52: Passenger and freight transport activity, 1990-2010 (billion pkm and tkm)
Fig. 53: Modal evolution of passenger traffic activity, 1995-2010 (pkm)
Source: OECD (2013), UIC (2012a), JSB (2012) and JMLIT (2012)
Year 1995=100
Source: OECD (2013), UIC (2012a), JSB (2012) and JMLIT (2012)
Table 3: Japan transport modal share, 2010
Note: Emissions from rail electrical traction are included in the transport sector. See Methodology Notes.
Source: Elaboration by Susdef based on IEA (2012a), IEA (2012b), IPCC (2006) and IEA (2008).
Source: OECD (2013), UIC (2012a), JSB (2012) and JMLIT (2012)
Japan
Japan
Fig. 51: Share of CO2 emissions from fuel combustion by sector, 2010
Jap
an
4746
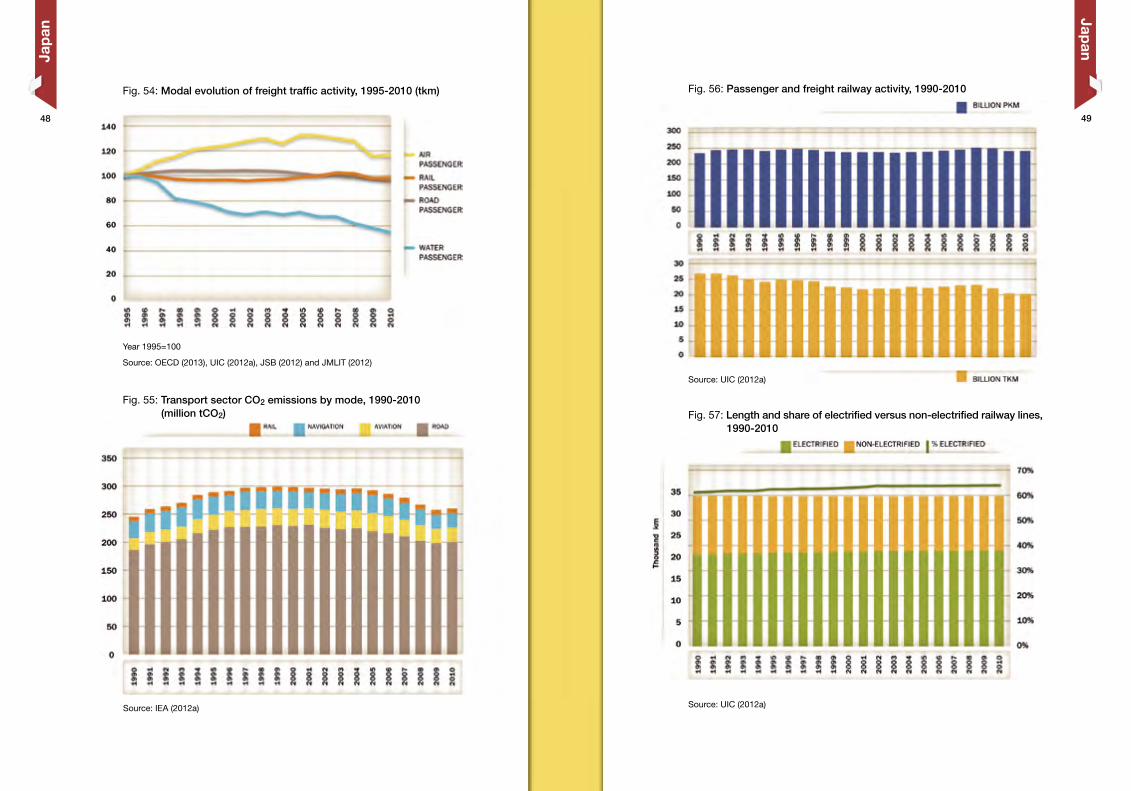
Fig. 56: Passenger and freight railway activity, 1990-2010
Fig. 57: Length and share of electrified versus non-electrified railway lines, 1990-2010
Source: UIC (2012a)
Source: UIC (2012a)
Fig. 54: Modal evolution of freight traffic activity, 1995-2010 (tkm)
Year 1995=100
Source: OECD (2013), UIC (2012a), JSB (2012) and JMLIT (2012)
Source: IEA (2012a)
Japan
Jap
an
Fig. 55: Transport sector CO2 emissions by mode, 1990-2010 (million tCO2)
4948
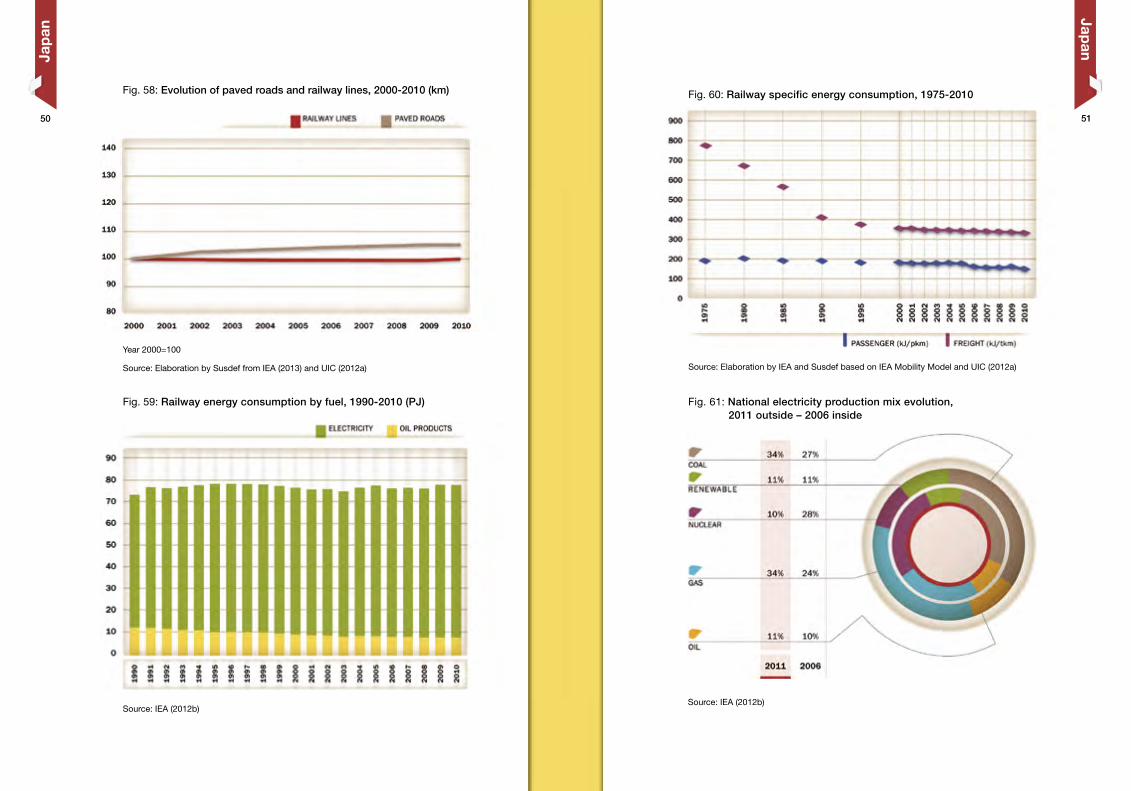
Fig. 60: Railway specific energy consumption, 1975-2010
Fig. 61: National electricity production mix evolution, 2011 outside – 2006 inside
Source: Elaboration by IEA and Susdef based on IEA Mobility Model and UIC (2012a)
Source: IEA (2012b)
Fig. 59: Railway energy consumption by fuel, 1990-2010 (PJ)
Source: Elaboration by Susdef from IEA (2013) and UIC (2012a)
Source: IEA (2012b)
Japan
Jap
an
Fig. 58: Evolution of paved roads and railway lines, 2000-2010 (km)
Year 2000=100
5150
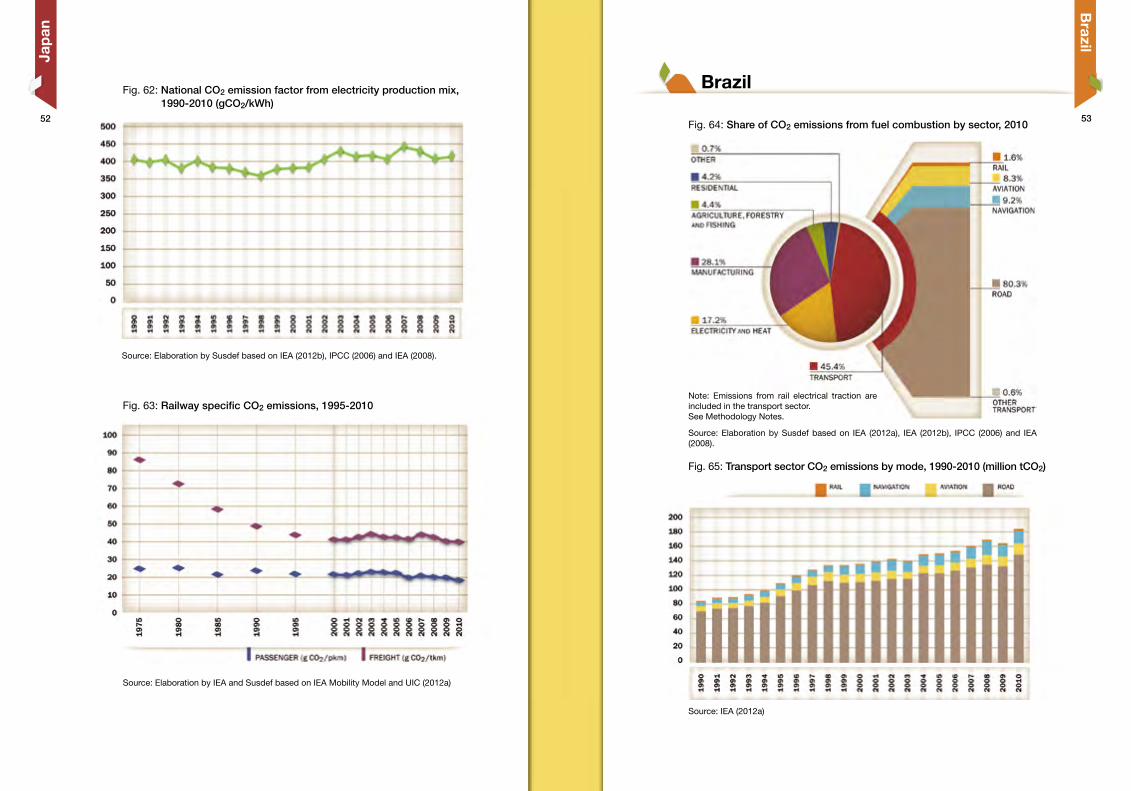
Source: Elaboration by Susdef based on IEA (2012b), IPCC (2006) and IEA (2008).
Source: IEA (2012a)
Source: Elaboration by IEA and Susdef based on IEA Mobility Model and UIC (2012a)
Fig. 62: National CO2 emission factor from electricity production mix, 1990-2010 (gCO2/kWh)
Fig. 63: Railway specific CO2 emissions, 1995-2010
Fig. 64: Share of CO2 emissions from fuel combustion by sector, 2010
Fig. 65: Transport sector CO2 emissions by mode, 1990-2010 (million tCO2)
Jap
anB
razil
Brazil
Note: Emissions from rail electrical traction are included in the transport sector. See Methodology Notes.
Source: Elaboration by Susdef based on IEA (2012a), IEA (2012b), IPCC (2006) and IEA (2008).
5352
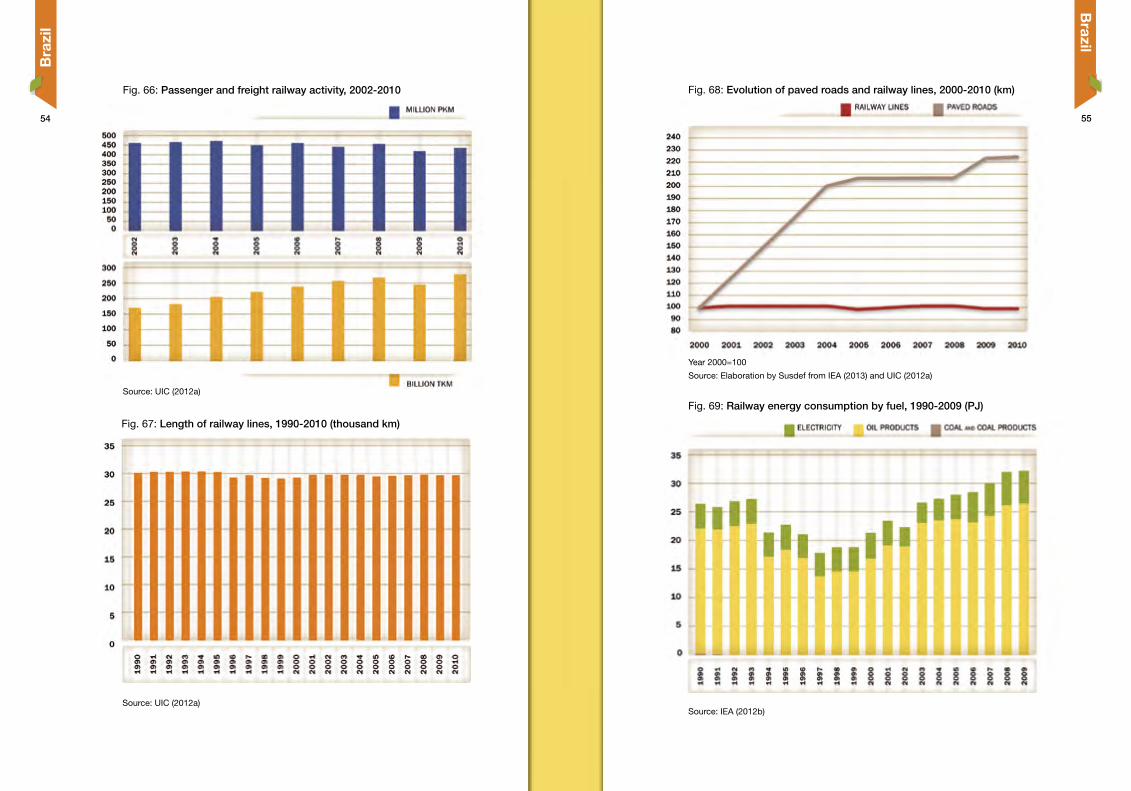
Fig. 68: Evolution of paved roads and railway lines, 2000-2010 (km)
Fig. 69: Railway energy consumption by fuel, 1990-2009 (PJ)
Source: IEA (2012b)
Brazil
Fig. 66: Passenger and freight railway activity, 2002-2010
Fig. 67: Length of railway lines, 1990-2010 (thousand km)
Bra
zil
Source: UIC (2012a)
Source: UIC (2012a)
Source: Elaboration by Susdef from IEA (2013) and UIC (2012a)
Year 2000=100
5554
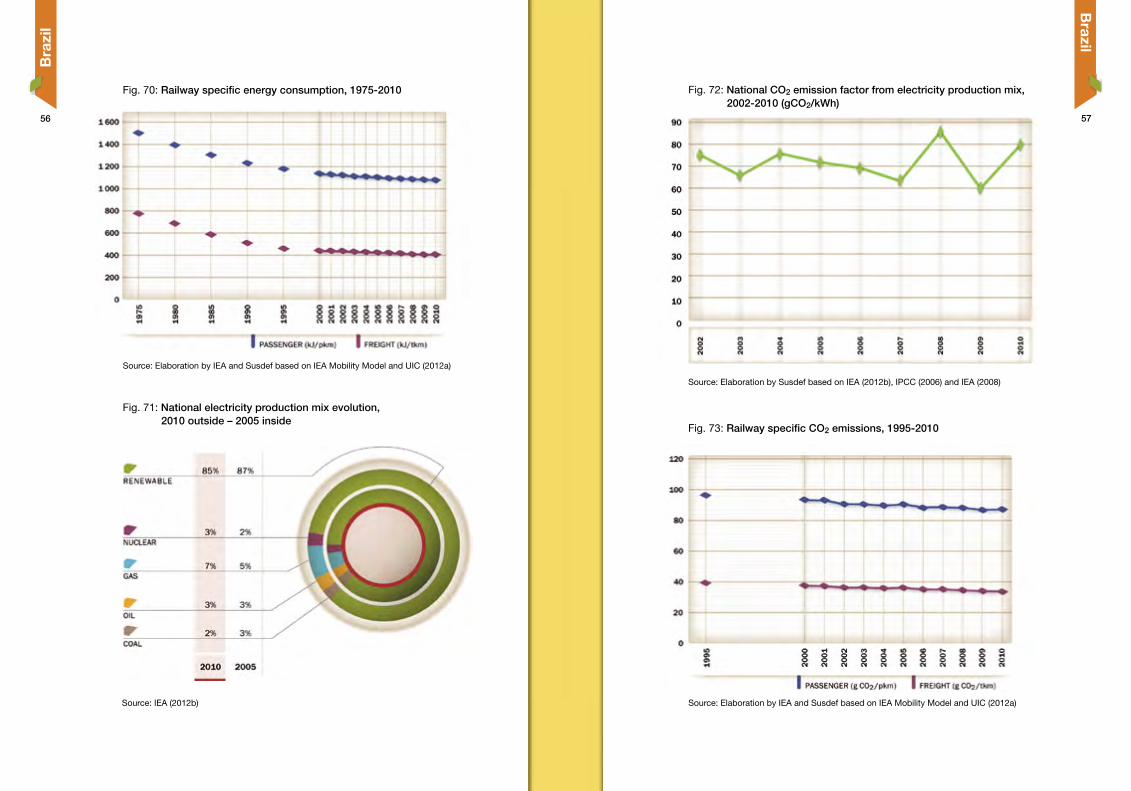
Fig. 72: National CO2 emission factor from electricity production mix, 2002-2010 (gCO2/kWh)
Fig. 73: Railway specific CO2 emissions, 1995-2010
Source: Elaboration by Susdef based on IEA (2012b), IPCC (2006) and IEA (2008)
Source: Elaboration by IEA and Susdef based on IEA Mobility Model and UIC (2012a)
Fig. 70: Railway specific energy consumption, 1975-2010
Fig. 71: National electricity production mix evolution, 2010 outside – 2005 inside
Source: Elaboration by IEA and Susdef based on IEA Mobility Model and UIC (2012a)
Source: IEA (2012b)
Brazil
Bra
zil
5756
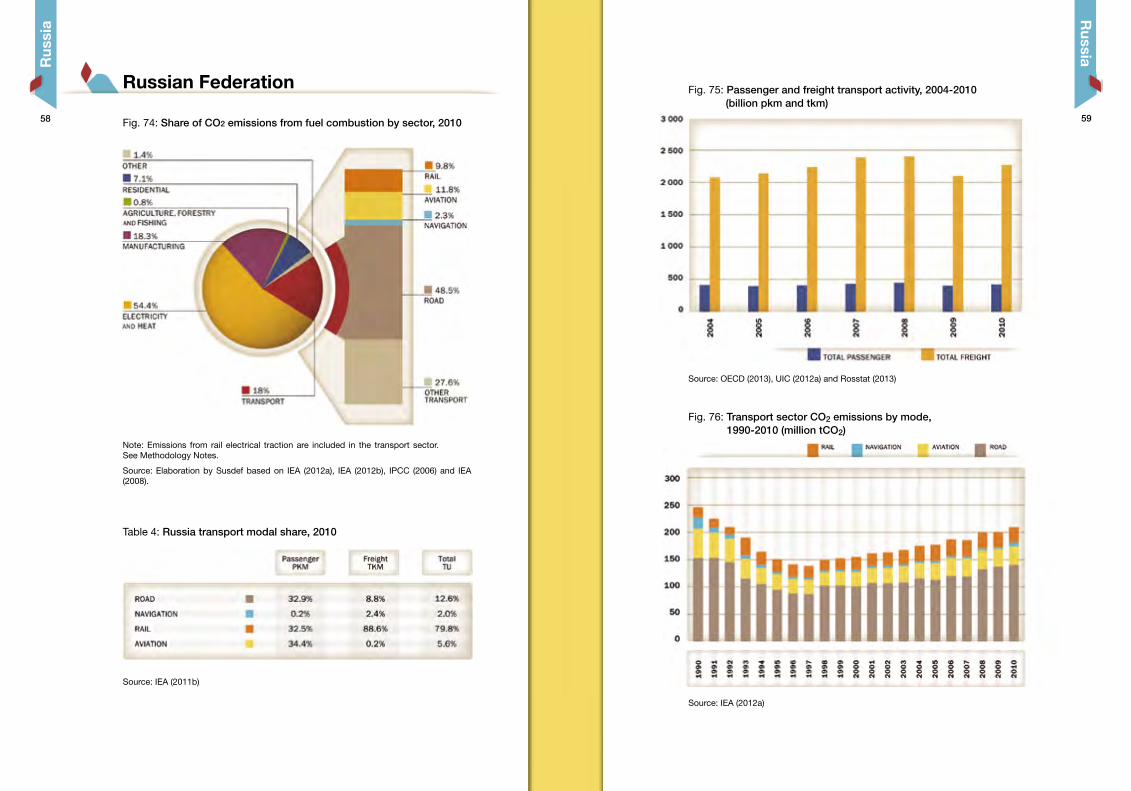
Fig. 75: Passenger and freight transport activity, 2004-2010 (billion pkm and tkm)
Fig. 76: Transport sector CO2 emissions by mode, 1990-2010 (million tCO2)
Source: OECD (2013), UIC (2012a) and Rosstat (2013)
Source: IEA (2012a)
Fig. 74: Share of CO2 emissions from fuel combustion by sector, 2010
Table 4: Russia transport modal share, 2010
Note: Emissions from rail electrical traction are included in the transport sector. See Methodology Notes.
Source: IEA (2011b)
Russian Federation
Rus
sia
Russia
Source: Elaboration by Susdef based on IEA (2012a), IEA (2012b), IPCC (2006) and IEA (2008).
5958
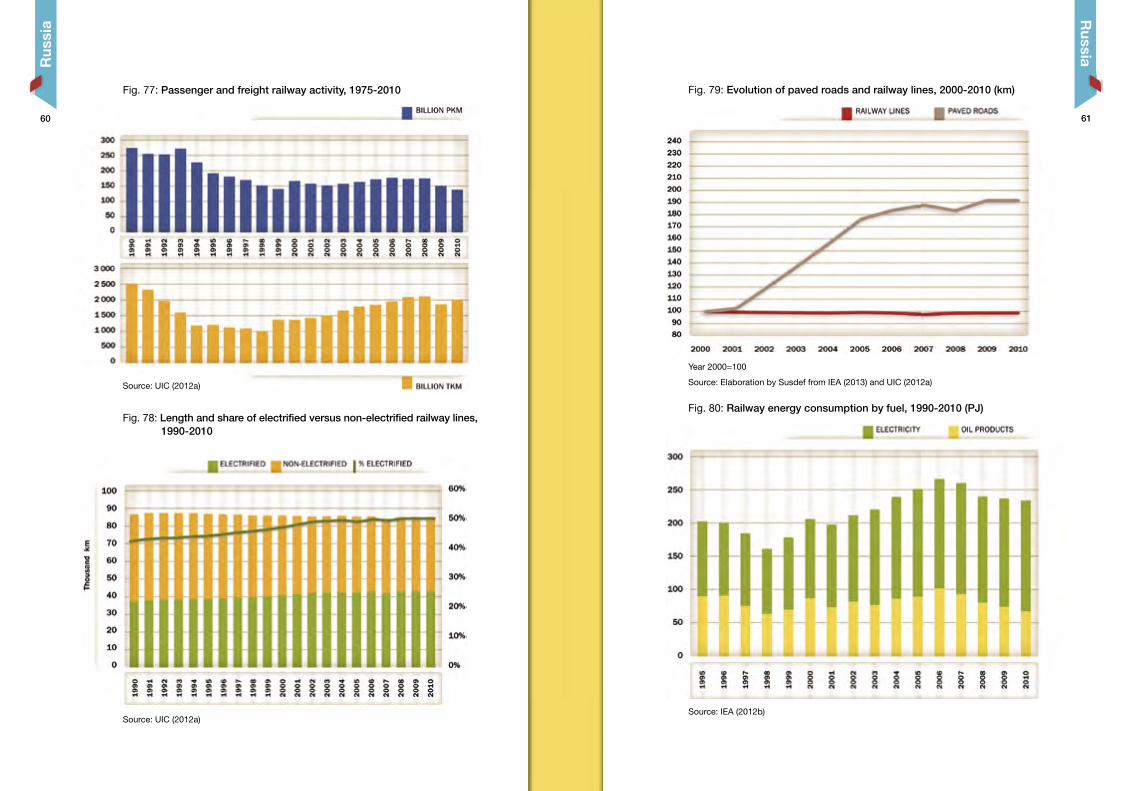
Fig. 79: Evolution of paved roads and railway lines, 2000-2010 (km)
Fig. 80: Railway energy consumption by fuel, 1990-2010 (PJ)
Source: Elaboration by Susdef from IEA (2013) and UIC (2012a)
Fig. 77: Passenger and freight railway activity, 1975-2010
Source: UIC (2012a)
Fig. 78: Length and share of electrified versus non-electrified railway lines, 1990-2010
Source: UIC (2012a)Source: IEA (2012b)
Rus
sia
Russia
Year 2000=100
6160
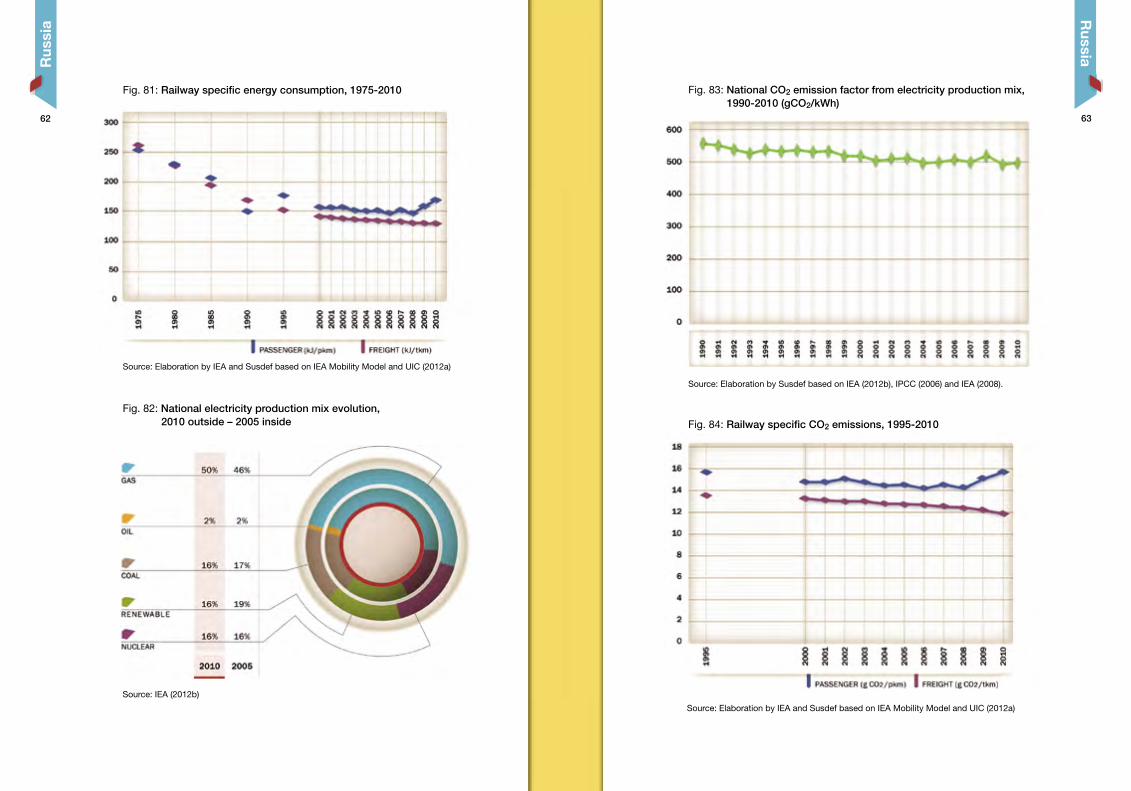
Fig. 83: National CO2 emission factor from electricity production mix, 1990-2010 (gCO2/kWh)
Fig. 84: Railway specific CO2 emissions, 1995-2010
Source: Elaboration by Susdef based on IEA (2012b), IPCC (2006) and IEA (2008).
Source: Elaboration by IEA and Susdef based on IEA Mobility Model and UIC (2012a)
Fig. 81: Railway specific energy consumption, 1975-2010
Fig. 82: National electricity production mix evolution, 2010 outside – 2005 inside
Source: Elaboration by IEA and Susdef based on IEA Mobility Model and UIC (2012a)
Source: IEA (2012b)
Rus
sia
Russia
6362
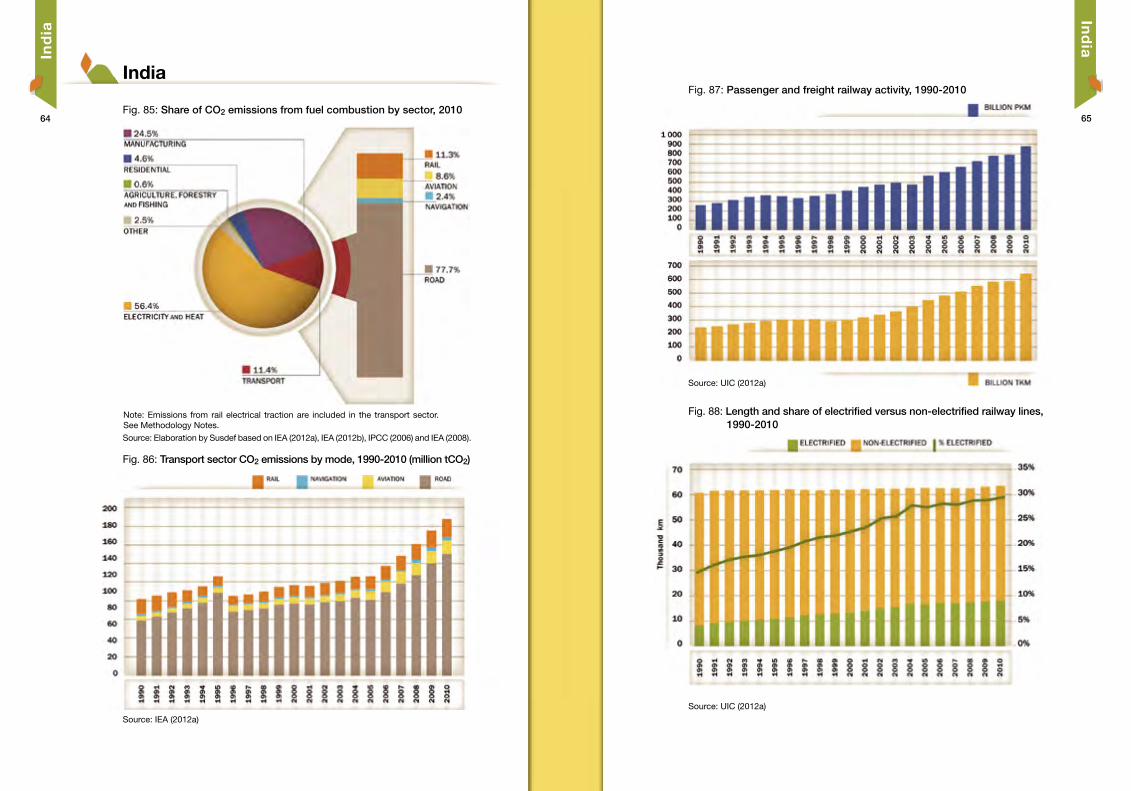
Fig. 87: Passenger and freight railway activity, 1990-2010
Fig. 88: Length and share of electrified versus non-electrified railway lines, 1990-2010
Source: UIC (2012a)
Source: UIC (2012a)
Source: IEA (2012a)
Note: Emissions from rail electrical traction are included in the transport sector. See Methodology Notes.
India
Ind
iaIn
dia
Fig. 85: Share of CO2 emissions from fuel combustion by sector, 2010
Fig. 86: Transport sector CO2 emissions by mode, 1990-2010 (million tCO2)
Source: Elaboration by Susdef based on IEA (2012a), IEA (2012b), IPCC (2006) and IEA (2008).
6564
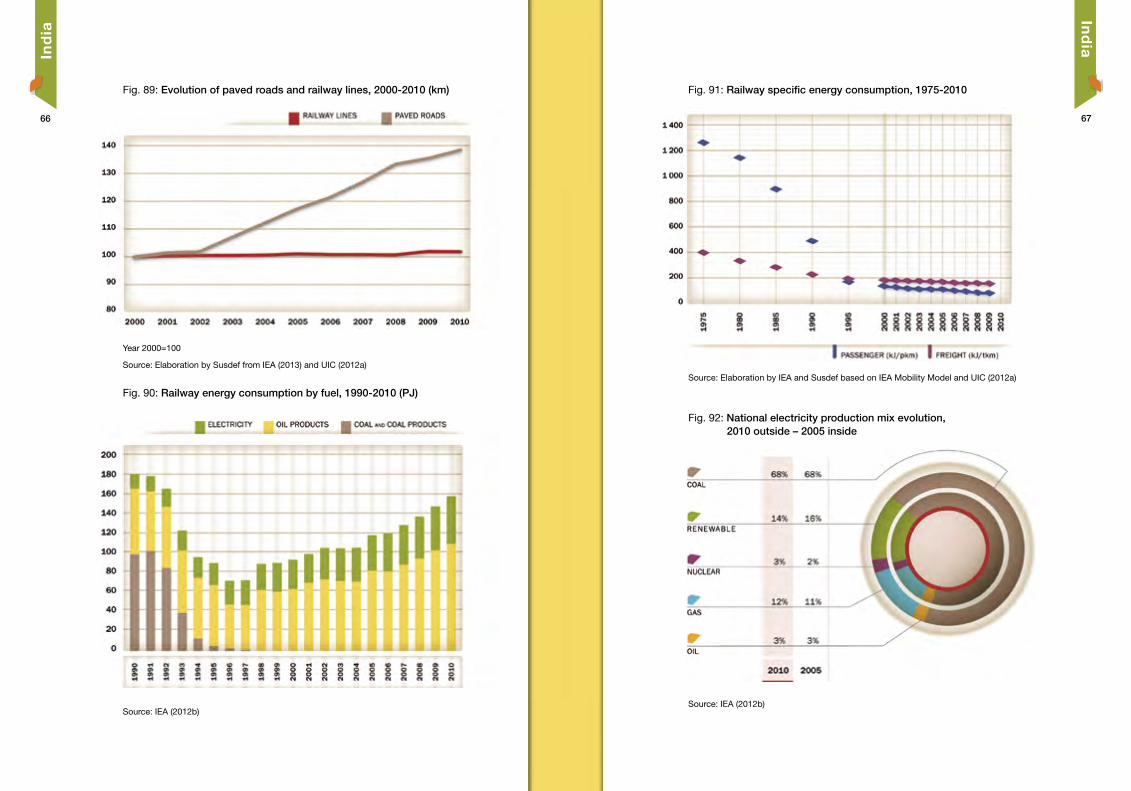
Fig. 91: Railway specific energy consumption, 1975-2010
Fig. 92: National electricity production mix evolution, 2010 outside – 2005 inside
Source: Elaboration by IEA and Susdef based on IEA Mobility Model and UIC (2012a)
Source: IEA (2012b)
Fig. 89: Evolution of paved roads and railway lines, 2000-2010 (km)
Source: Elaboration by Susdef from IEA (2013) and UIC (2012a)
Fig. 90: Railway energy consumption by fuel, 1990-2010 (PJ)
Source: IEA (2012b)
Ind
iaIn
dia
Year 2000=100
6766
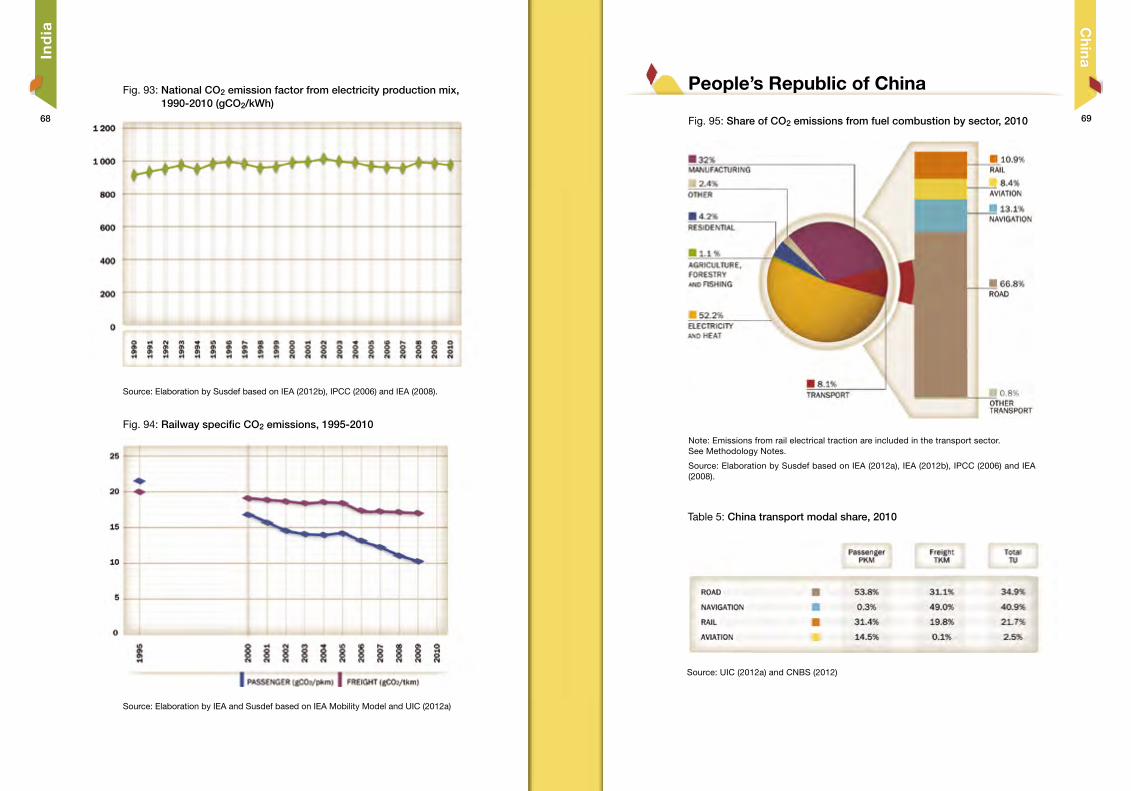
Fig. 95: Share of CO2 emissions from fuel combustion by sector, 2010
Table 5: China transport modal share, 2010
Note: Emissions from rail electrical traction are included in the transport sector. See Methodology Notes.
Source: Elaboration by Susdef based on IEA (2012a), IEA (2012b), IPCC (2006) and IEA (2008).
Source: UIC (2012a) and CNBS (2012)
Fig. 93: National CO2 emission factor from electricity production mix, 1990-2010 (gCO2/kWh)
Fig. 94: Railway specific CO2 emissions, 1995-2010
Source: Elaboration by Susdef based on IEA (2012b), IPCC (2006) and IEA (2008).
Source: Elaboration by IEA and Susdef based on IEA Mobility Model and UIC (2012a)
People’s Republic of China
Ind
ia China
6968
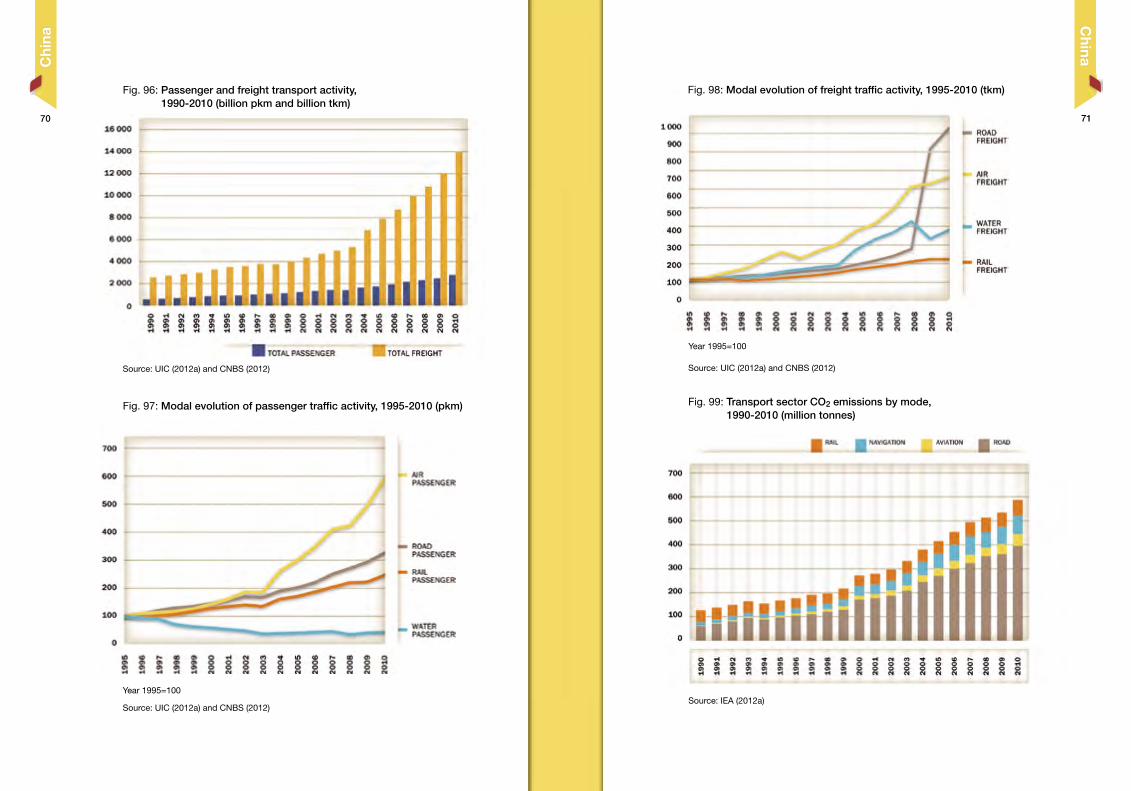
Fig. 98: Modal evolution of freight traffic activity, 1995-2010 (tkm)
Fig. 99: Transport sector CO2 emissions by mode, 1990-2010 (million tonnes)
Source: UIC (2012a) and CNBS (2012)
Source: IEA (2012a)
Fig. 96: Passenger and freight transport activity, 1990-2010 (billion pkm and billion tkm)
Fig. 97: Modal evolution of passenger traffic activity, 1995-2010 (pkm)
Source: UIC (2012a) and CNBS (2012)
Source: UIC (2012a) and CNBS (2012)
Year 1995=100
Year 1995=100
China
Chi
na
7170
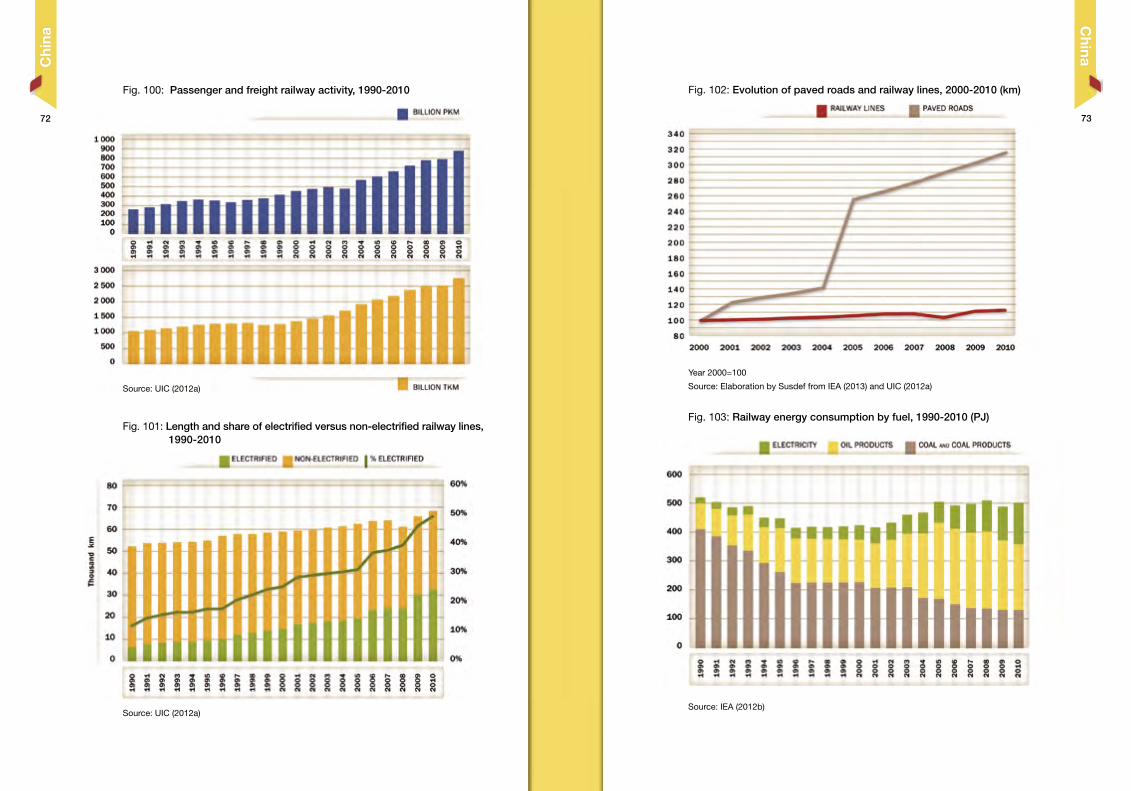
Fig. 102: Evolution of paved roads and railway lines, 2000-2010 (km)
Fig. 103: Railway energy consumption by fuel, 1990-2010 (PJ)
Source: Elaboration by Susdef from IEA (2013) and UIC (2012a)
Source: IEA (2012b)
Fig. 100: Passenger and freight railway activity, 1990-2010
Fig. 101: Length and share of electrified versus non-electrified railway lines, 1990-2010
Source: UIC (2012a)
Source: UIC (2012a)
China
Chi
na
Year 2000=100
7372
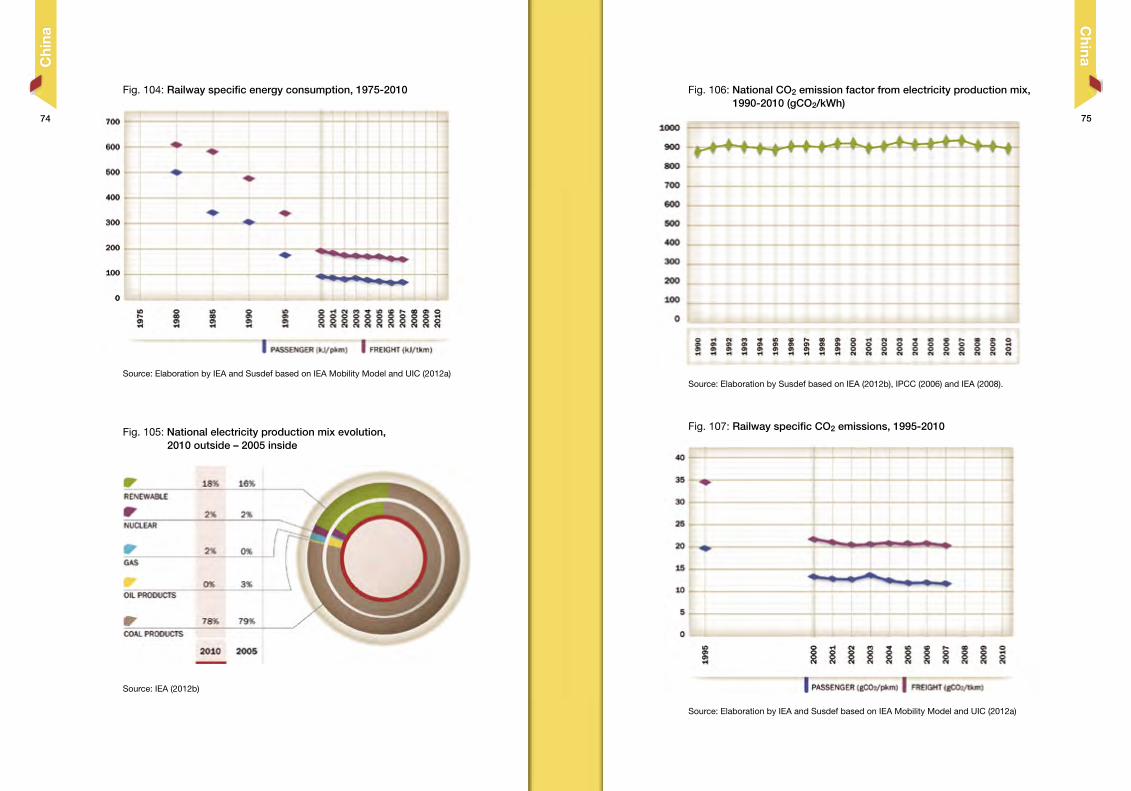
Fig. 107: Railway specific CO2 emissions, 1995-2010
Fig. 106: National CO2 emission factor from electricity production mix, 1990-2010 (gCO2/kWh)
Source: Elaboration by Susdef based on IEA (2012b), IPCC (2006) and IEA (2008).
Source: Elaboration by IEA and Susdef based on IEA Mobility Model and UIC (2012a)
Fig. 104: Railway specific energy consumption, 1975-2010
Fig. 105: National electricity production mix evolution, 2010 outside – 2005 inside
Source: Elaboration by IEA and Susdef based on IEA Mobility Model and UIC (2012a)
Source: IEA (2012b)
China
Chi
na
7574
7776
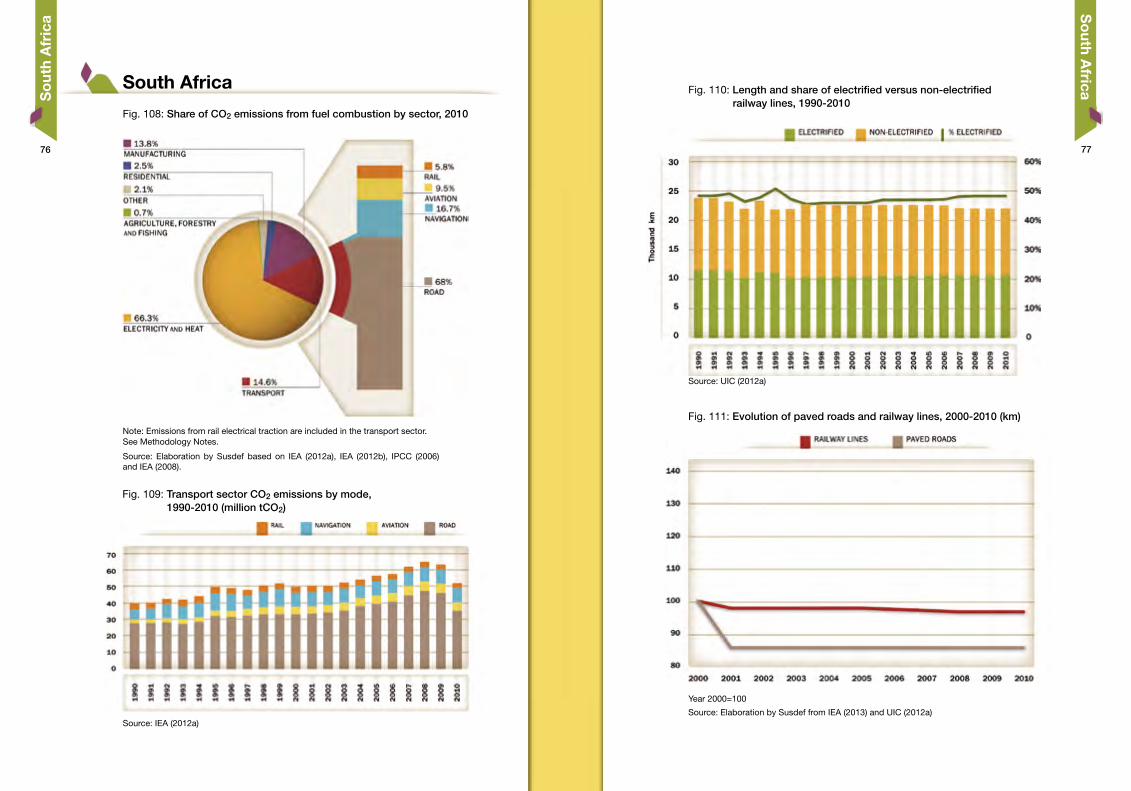
Fig. 110: Length and share of electrified versus non-electrified railway lines, 1990-2010
Fig. 108: Share of CO2 emissions from fuel combustion by sector, 2010
Fig. 111: Evolution of paved roads and railway lines, 2000-2010 (km)
Source: Elaboration by Susdef from IEA (2013) and UIC (2012a)
Source: UIC (2012a)
Fig. 109: Transport sector CO2 emissions by mode, 1990-2010 (million tCO2)
Note: Emissions from rail electrical traction are included in the transport sector. See Methodology Notes.
Source: Elaboration by Susdef based on IEA (2012a), IEA (2012b), IPCC (2006) and IEA (2008).
Source: IEA (2012a)
South Africa
So
uth Africa
So
uth
Afr
ica
Year 2000=100
7978
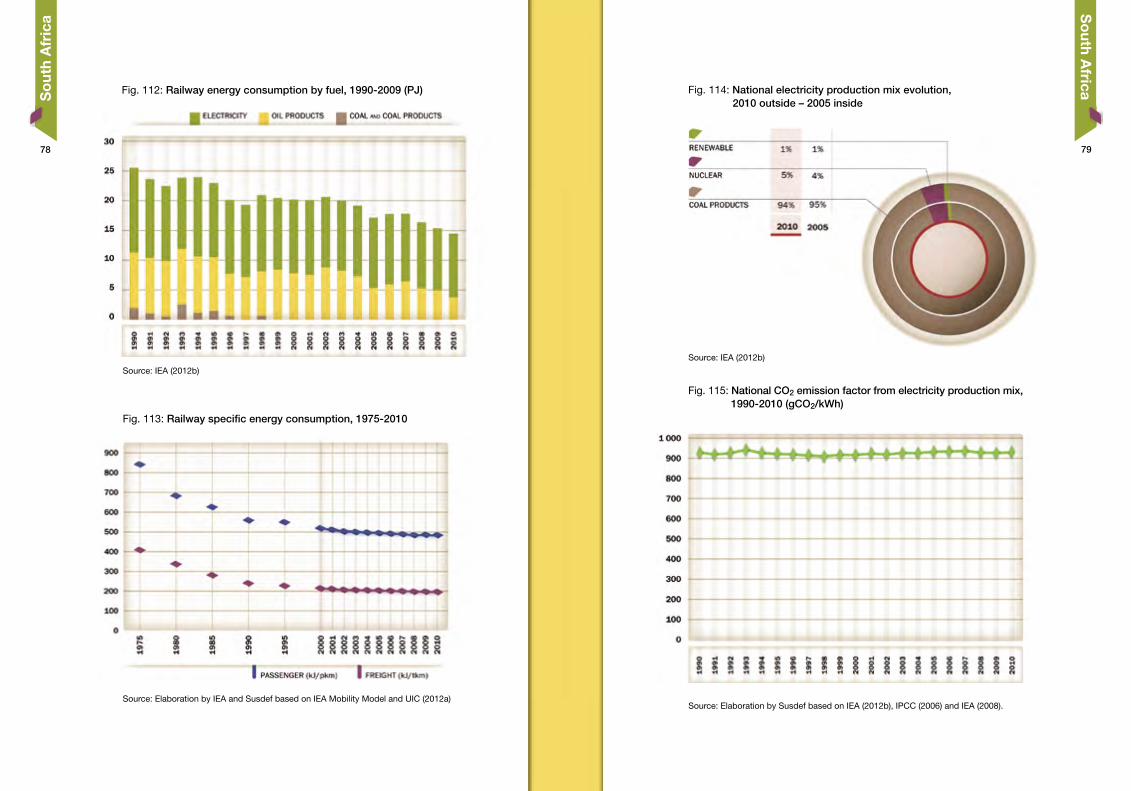
Fig. 115: National CO2 emission factor from electricity production mix, 1990-2010 (gCO2/kWh)
Fig. 114: National electricity production mix evolution, 2010 outside – 2005 inside
Source: Elaboration by Susdef based on IEA (2012b), IPCC (2006) and IEA (2008).
Source: IEA (2012b)
Source: IEA (2012b)
Fig. 113: Railway specific energy consumption, 1975-2010
Fig. 112: Railway energy consumption by fuel, 1990-2009 (PJ)
Source: Elaboration by IEA and Susdef based on IEA Mobility Model and UIC (2012a)
So
uth Africa
So
uth
Afr
ica
80
Part II: Focus on Energy Mix
So
uth
Afr
ica
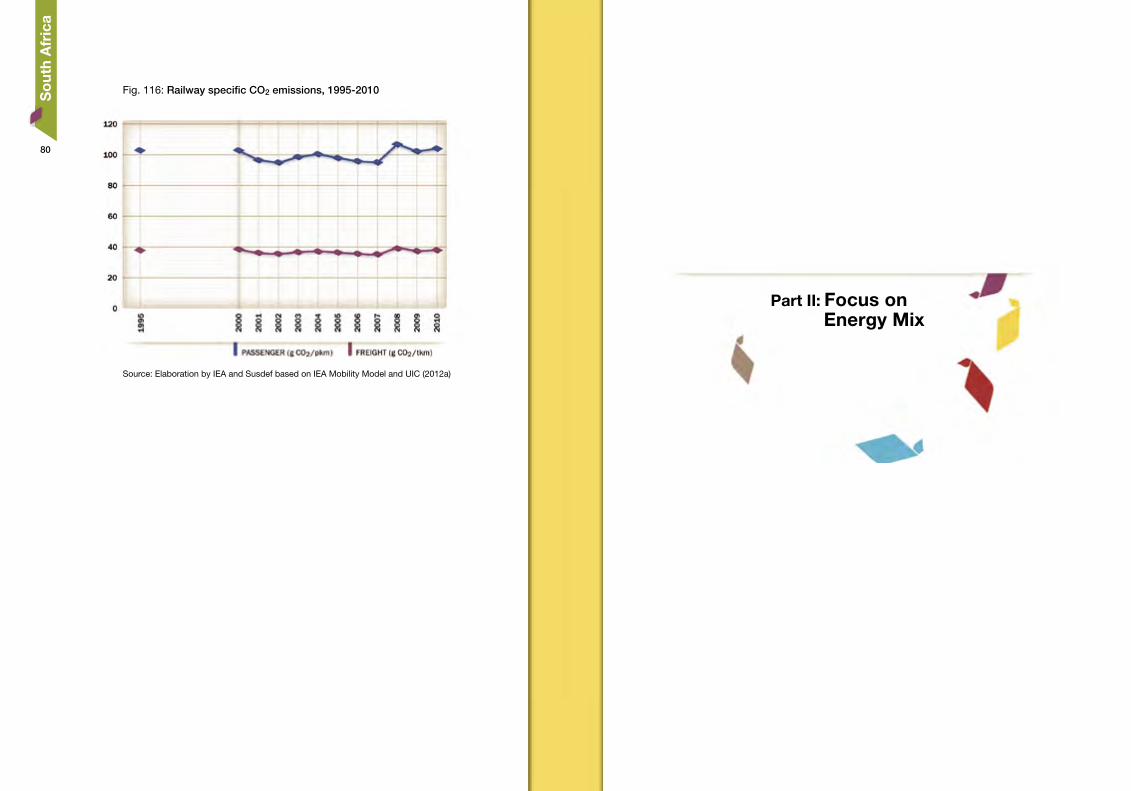
Fig. 116: Railway specific CO2 emissions, 1995-2010
Source: Elaboration by IEA and Susdef based on IEA Mobility Model and UIC (2012a)
8382
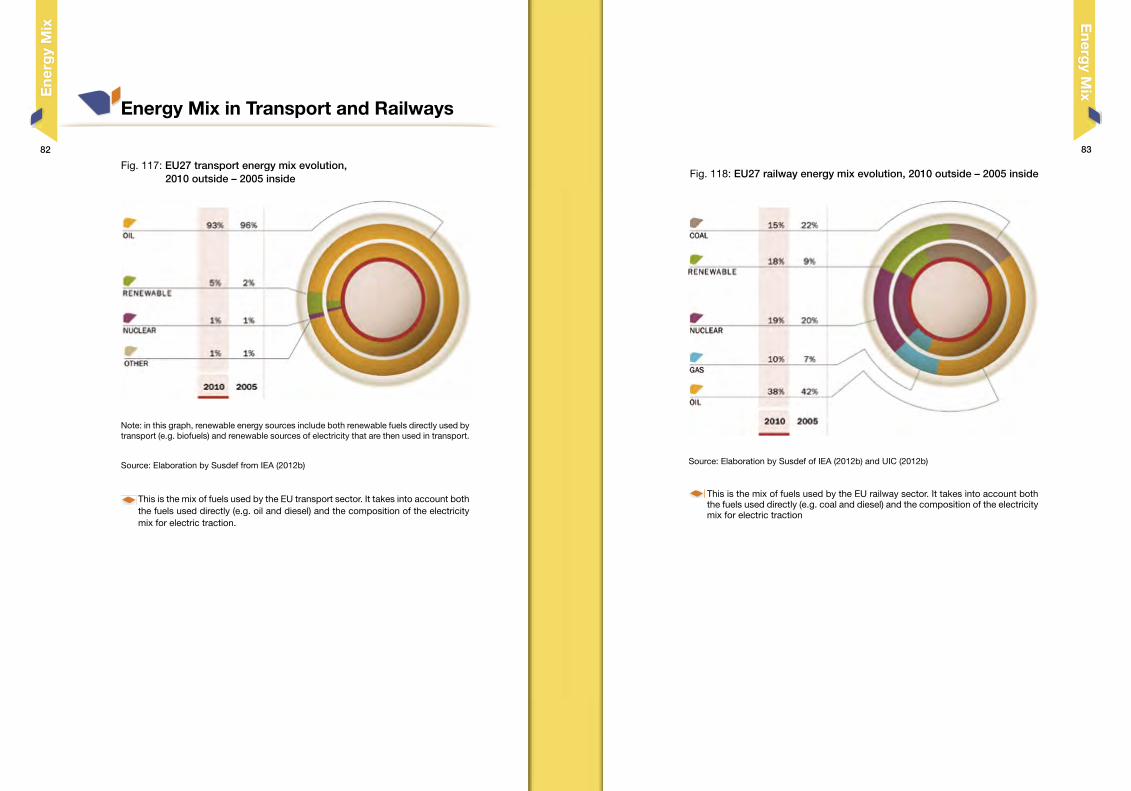
This is the mix of fuels used by the EU transport sector. It takes into account both the fuels used directly (e.g. oil and diesel) and the composition of the electricity mix for electric traction.
Fig. 117: EU27 transport energy mix evolution, 2010 outside – 2005 inside
Source: Elaboration by Susdef from IEA (2012b)
Note: in this graph, renewable energy sources include both renewable fuels directly used by transport (e.g. biofuels) and renewable sources of electricity that are then used in transport.
Energy Mix in Transport and Railways
Energ
y MixE
nerg
y M
ix
Source: Elaboration by Susdef of IEA (2012b) and UIC (2012b)
Fig. 118: EU27 railway energy mix evolution, 2010 outside – 2005 inside
This is the mix of fuels used by the EU railway sector. It takes into account both the fuels used directly (e.g. coal and diesel) and the composition of the electricity mix for electric traction
8584
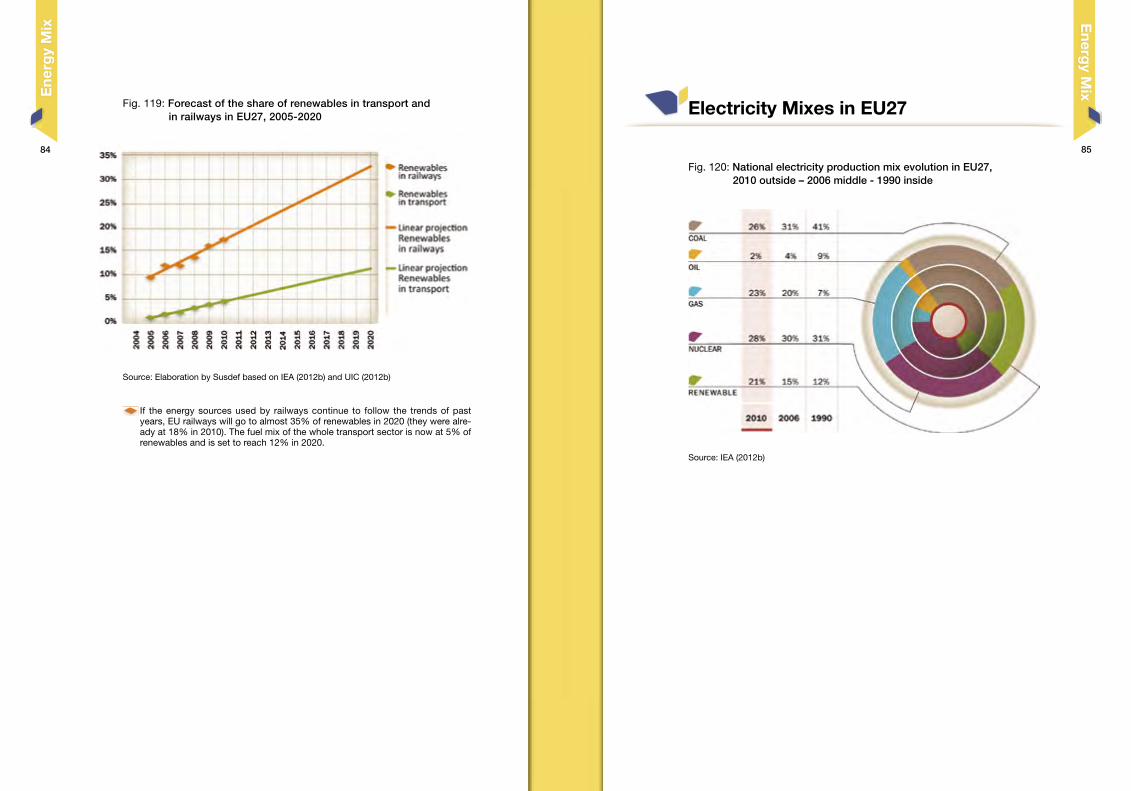
Source: IEA (2012b)
Fig. 119: Forecast of the share of renewables in transport and in railways in EU27, 2005-2020
If the energy sources used by railways continue to follow the trends of past years, EU railways will go to almost 35% of renewables in 2020 (they were alre-ady at 18% in 2010). The fuel mix of the whole transport sector is now at 5% of renewables and is set to reach 12% in 2020.
Source: Elaboration by Susdef based on IEA (2012b) and UIC (2012b)
Fig. 120: National electricity production mix evolution in EU27, 2010 outside – 2006 middle - 1990 inside
Electricity Mixes in EU27
Ene
rgy
Mix E
nergy M
ix
8786
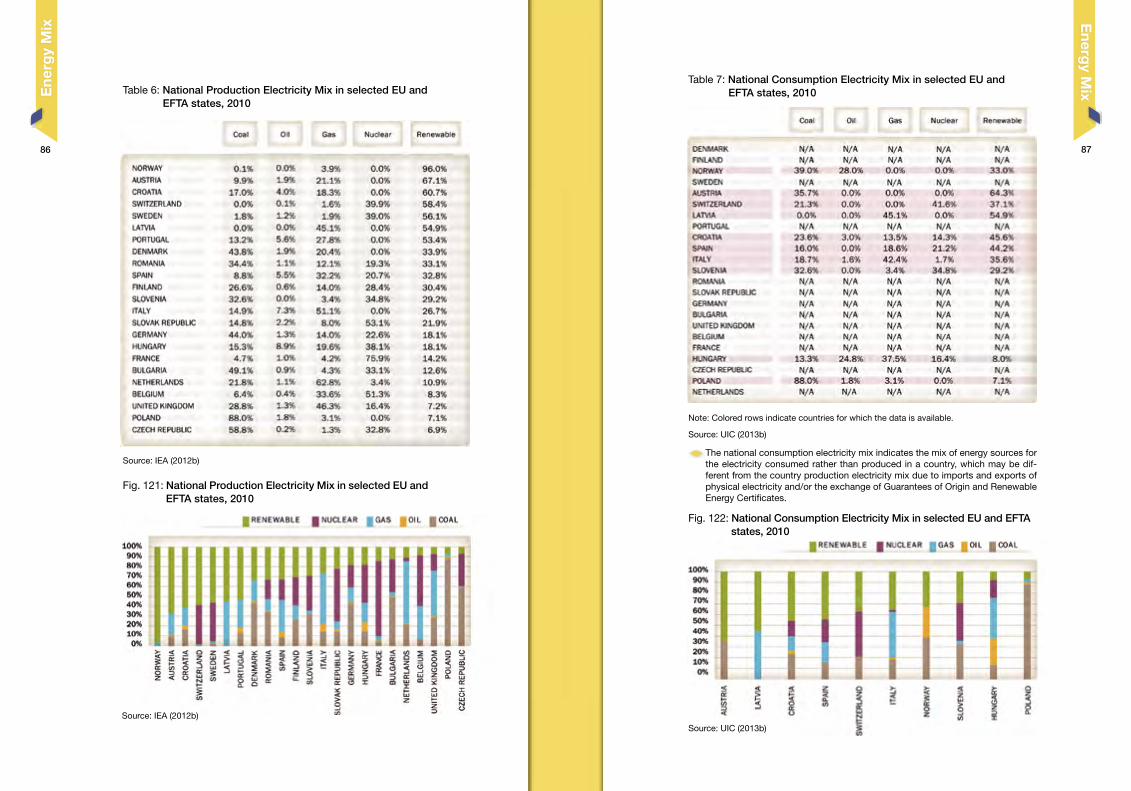
Table 7: National Consumption Electricity Mix in selected EU and EFTA states, 2010
Fig. 122: National Consumption Electricity Mix in selected EU and EFTA states, 2010
Source: UIC (2013b)
Note: Colored rows indicate countries for which the data is available.
Source: UIC (2013b)
Table 6: National Production Electricity Mix in selected EU and EFTA states, 2010
Source: IEA (2012b)
Fig. 121: National Production Electricity Mix in selected EU and EFTA states, 2010
The national consumption electricity mix indicates the mix of energy sources for the electricity consumed rather than produced in a country, which may be dif-ferent from the country production electricity mix due to imports and exports of physical electricity and/or the exchange of Guarantees of Origin and Renewable Energy Certificates.
Ene
rgy
Mix E
nergy M
ix
Source: IEA (2012b)
8988
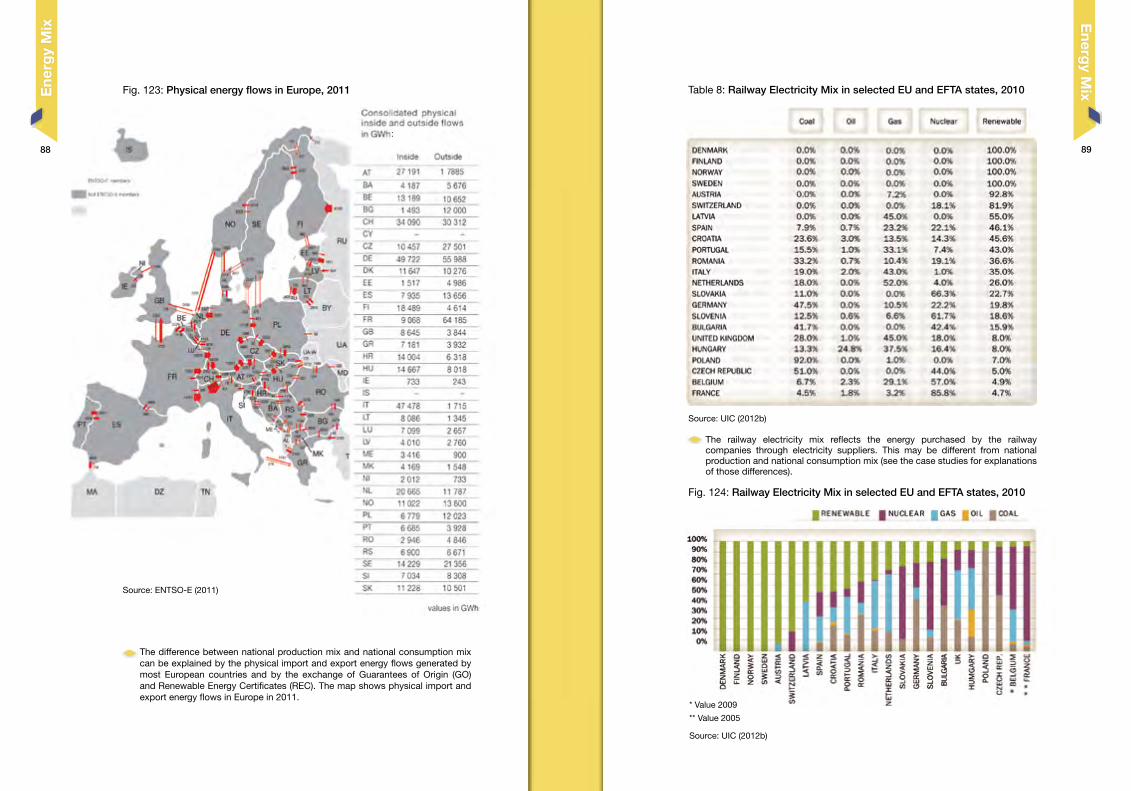
Table 8: Railway Electricity Mix in selected EU and EFTA states, 2010
Source: UIC (2012b)
* Value 2009
** Value 2005
Source: UIC (2012b)
Fig. 123: Physical energy flows in Europe, 2011
Fig. 124: Railway Electricity Mix in selected EU and EFTA states, 2010
Source: ENTSO-E (2011)
The difference between national production mix and national consumption mix can be explained by the physical import and export energy flows generated by most European countries and by the exchange of Guarantees of Origin (GO) and Renewable Energy Certificates (REC). The map shows physical import and export energy flows in Europe in 2011.
The railway electricity mix reflects the energy purchased by the railway companies through electricity suppliers. This may be different from national production and national consumption mix (see the case studies for explanations of those differences).
Ene
rgy
Mix E
nergy M
ix
:
9190
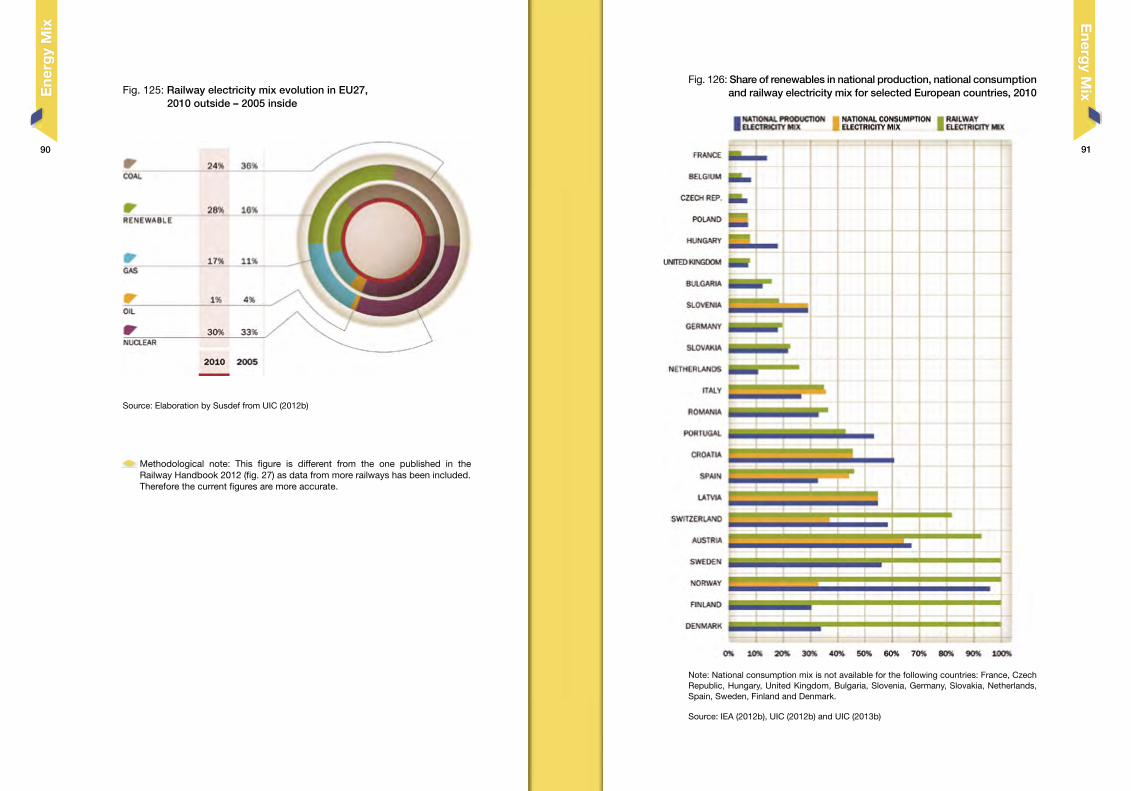
Fig. 126: Share of renewables in national production, national consumption and railway electricity mix for selected European countries, 2010
Source: IEA (2012b), UIC (2012b) and UIC (2013b)
Note: National consumption mix is not available for the following countries: France, Czech Republic, Hungary, United Kingdom, Bulgaria, Slovenia, Germany, Slovakia, Netherlands, Spain, Sweden, Finland and Denmark.
Fig. 125: Railway electricity mix evolution in EU27, 2010 outside – 2005 inside
Source: Elaboration by Susdef from UIC (2012b)
Methodological note: This figure is different from the one published in the Railway Handbook 2012 (fig. 27) as data from more railways has been included.Therefore the current figures are more accurate.
Ene
rgy
Mix E
nergy M
ix
9392
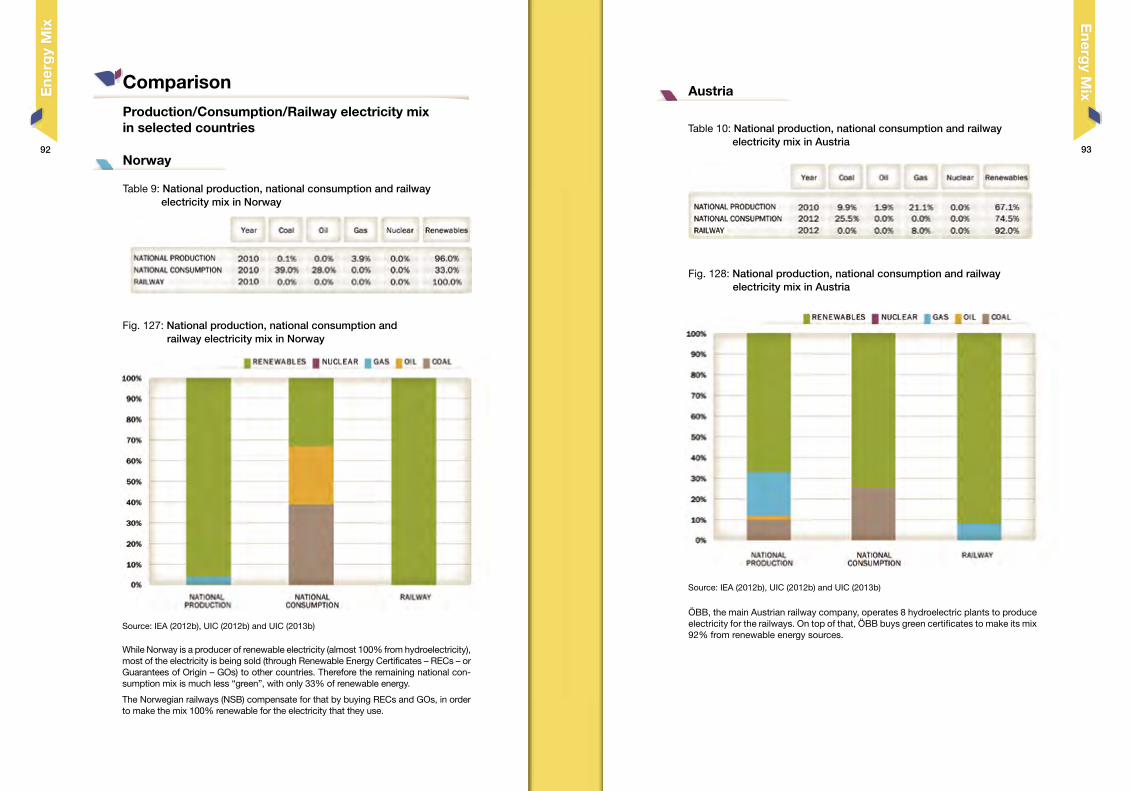
Table 10: National production, national consumption and railway electricity mix in Austria
Source: IEA (2012b), UIC (2012b) and UIC (2013b)
Fig. 128: National production, national consumption and railway electricity mix in Austria
Fig. 127: National production, national consumption and railway electricity mix in Norway
Table 9: National production, national consumption and railway electricity mix in Norway
Source: IEA (2012b), UIC (2012b) and UIC (2013b)
While Norway is a producer of renewable electricity (almost 100% from hydroelectricity), most of the electricity is being sold (through Renewable Energy Certificates – RECs – or Guarantees of Origin – GOs) to other countries. Therefore the remaining national con-sumption mix is much less “green”, with only 33% of renewable energy.
The Norwegian railways (NSB) compensate for that by buying RECs and GOs, in order to make the mix 100% renewable for the electricity that they use.
ÖBB, the main Austrian railway company, operates 8 hydroelectric plants to produce electricity for the railways. On top of that, ÖBB buys green certificates to make its mix 92% from renewable energy sources.
Comparison
Production/Consumption/Railway electricity mix in selected countries
Norway
AustriaEne
rgy
Mix E
nergy M
ix
9594
Table 11: National production, national consumption and railway electricity mix in Switzerland
Source: IEA (2012b), UIC (2012b) and UIC (2013b)
Fig. 129: National production, national consumption and railway electricity mix in Switzerland
* Other: partly from waste sources, partly not declared.
The difference between production and consumption mix is due to some hydroelectric power being exported.
The railway electricity mix of SBB is different from the national mix: in 2012 around 80% of the electricity came from hydroelectric power produced in SBB’s hydroelectric power stations or in partner stations. To cover the residual demand for power (20%), SBB uses nuclear energy. Most electricity is produced in own power plants (hydro) or where SBB is a shareholder (nuclear). Production is generated at 16.7 Hz or transformed by the use of frequency converters and fed into the railway grid. The electricity mix is declared according to the regulation in Switzerland, as every other electricity provider does. Every railway company driving on SBB infrastructure network is supplied with the same mix.
No green certificates or RECs are being used.
SPAIN: Decarbonisation strategy
In 2012, Adif, the infrastructure manager for Spanish railways, signed a contract for electricity supply with Acciona Green Energy, a company certified as a renewable producer by the National Council of Energy. This contract includes the supply of 71% of the total electricity consumption for traction of Renfe, in terms of total energy consumption (electricity and diesel). The supply assumes 53% of energy consumption for traction use. The contract has been renewed for 2013 with 100% renewable energy including an increment of the share of Acciona Green Energy up to 94%, and 6% coming from Enérgya VM Gestión (a company also certified as green energy provider).*
The Spanish National Railways, RENFE, elaborated a target strategy in 2008 aiming for 2020 to reach a level of CO2 emissions of 20 grams per transport unit. This target was made according to operative plans of the company and it was sent to UIC and CER (the Community of European Railways) for the signature of CER Commitment to reduce Carbon Intensity of European Railways for 2020.
Switzerland
The main data of the 2012 contract can be found in the following press release:
http://www.acciona.es/noticias/adif-y-acciona-impulsan-la-utilizacion-de-energias-renovables-en-las-redes-ferroviarias-espanolas.
*
Ene
rgy
Mix E
nergy M
ix
9796
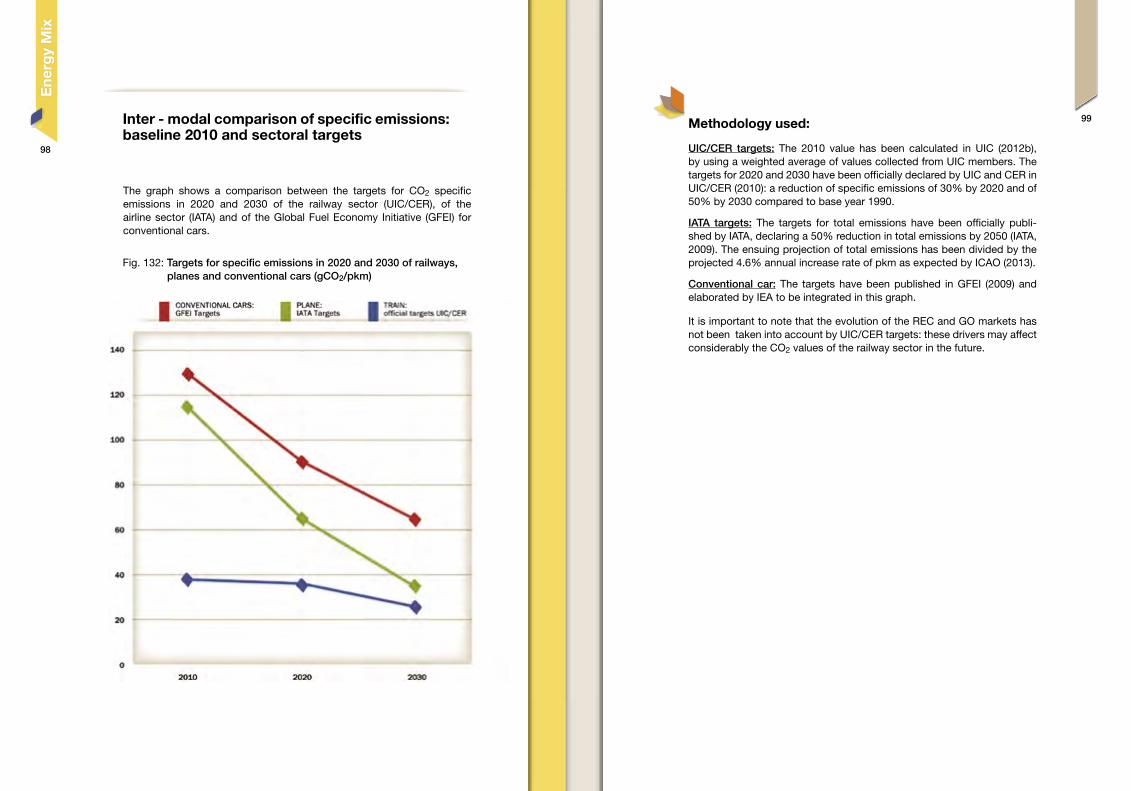
Fig. 131: Specific emissions of electricity production in Italy (gCO2/kWh)
Fig. 130: Italy: Gross installed power (MW), 1996-2012 (left) and national electricity production (GWh), 1990-2012 (right)
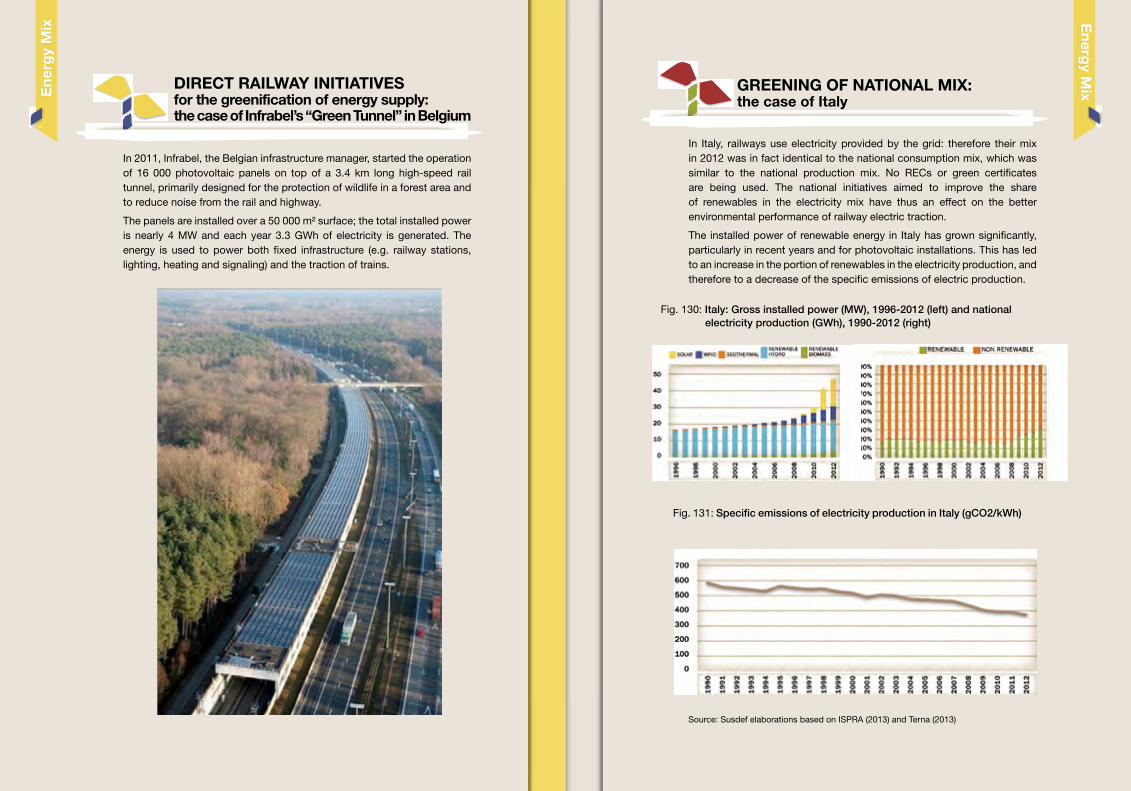
In 2011, Infrabel, the Belgian infrastructure manager, started the operation of 16 000 photovoltaic panels on top of a 3.4 km long high-speed rail tunnel, primarily designed for the protection of wildlife in a forest area and to reduce noise from the rail and highway.
The panels are installed over a 50 000 m² surface; the total installed power is nearly 4 MW and each year 3.3 GWh of electricity is generated. The energy is used to power both fixed infrastructure (e.g. railway stations, lighting, heating and signaling) and the traction of trains.
In Italy, railways use electricity provided by the grid: therefore their mix in 2012 was in fact identical to the national consumption mix, which was similar to the national production mix. No RECs or green certificates are being used. The national initiatives aimed to improve the share of renewables in the electricity mix have thus an effect on the better environmental performance of railway electric traction.
The installed power of renewable energy in Italy has grown significantly, particularly in recent years and for photovoltaic installations. This has led to an increase in the portion of renewables in the electricity production, and therefore to a decrease of the specific emissions of electric production.
DIRECT RAILWAY INITIATIVES for the greenification of energy supply: the case of Infrabel’s “Green Tunnel” in Belgium
GREENING OF NATIONAL MIX: the case of Italy
Ene
rgy
Mix E
nergy M
ix
Source: Susdef elaborations based on ISPRA (2013) and Terna (2013)
98
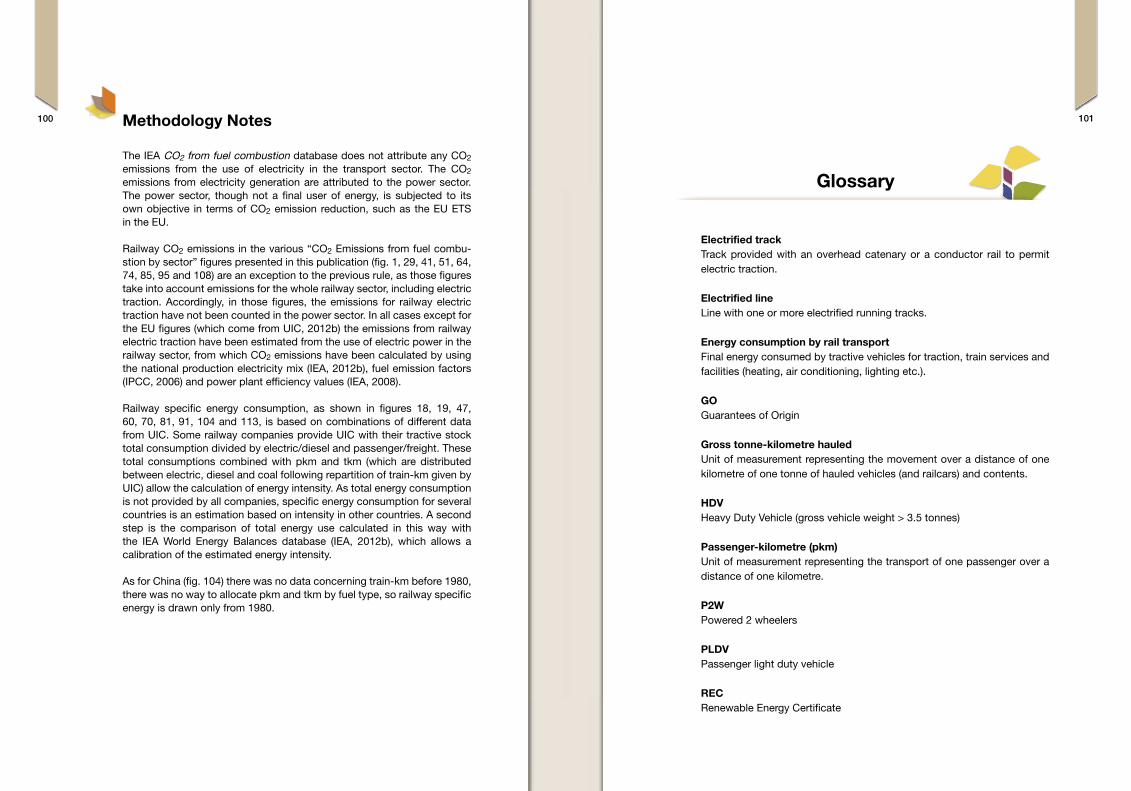
Fig. 132: Targets for specific emissions in 2020 and 2030 of railways, planes and conventional cars (gCO2/pkm)
Methodology used:
UIC/CER targets: The 2010 value has been calculated in UIC (2012b), by using a weighted average of values collected from UIC members. The targets for 2020 and 2030 have been officially declared by UIC and CER in UIC/CER (2010): a reduction of specific emissions of 30% by 2020 and of 50% by 2030 compared to base year 1990.
IATA targets: The targets for total emissions have been officially publi-shed by IATA, declaring a 50% reduction in total emissions by 2050 (IATA, 2009). The ensuing projection of total emissions has been divided by the projected 4.6% annual increase rate of pkm as expected by ICAO (2013).
Conventional car: The targets have been published in GFEI (2009) and elaborated by IEA to be integrated in this graph.
It is important to note that the evolution of the REC and GO markets has not been taken into account by UIC/CER targets: these drivers may affect considerably the CO2 values of the railway sector in the future.
Inter - modal comparison of specific emissions: baseline 2010 and sectoral targets
The graph shows a comparison between the targets for CO2 specific emissions in 2020 and 2030 of the railway sector (UIC/CER), of the airline sector (IATA) and of the Global Fuel Economy Initiative (GFEI) for conventional cars.
Ene
rgy
Mix
99
Glossary
Electrified trackTrack provided with an overhead catenary or a conductor rail to permit electric traction.
Electrified lineLine with one or more electrified running tracks.
Energy consumption by rail transportFinal energy consumed by tractive vehicles for traction, train services and facilities (heating, air conditioning, lighting etc.).
GOGuarantees of Origin
Gross tonne-kilometre hauledUnit of measurement representing the movement over a distance of one kilometre of one tonne of hauled vehicles (and railcars) and contents.
HDVHeavy Duty Vehicle (gross vehicle weight > 3.5 tonnes)
Passenger-kilometre (pkm)Unit of measurement representing the transport of one passenger over a distance of one kilometre.
P2WPowered 2 wheelers
PLDVPassenger light duty vehicle
RECRenewable Energy Certificate
Methodology Notes
The IEA CO2 from fuel combustion database does not attribute any CO2 emissions from the use of electricity in the transport sector. The CO2 emissions from electricity generation are attributed to the power sector. The power sector, though not a final user of energy, is subjected to its own objective in terms of CO2 emission reduction, such as the EU ETS in the EU.
Railway CO2 emissions in the various “CO2 Emissions from fuel combu-stion by sector” figures presented in this publication (fig. 1, 29, 41, 51, 64, 74, 85, 95 and 108) are an exception to the previous rule, as those figures take into account emissions for the whole railway sector, including electric traction. Accordingly, in those figures, the emissions for railway electric traction have not been counted in the power sector. In all cases except for the EU figures (which come from UIC, 2012b) the emissions from railway electric traction have been estimated from the use of electric power in the railway sector, from which CO2 emissions have been calculated by using the national production electricity mix (IEA, 2012b), fuel emission factors (IPCC, 2006) and power plant efficiency values (IEA, 2008).
Railway specific energy consumption, as shown in figures 18, 19, 47, 60, 70, 81, 91, 104 and 113, is based on combinations of different data from UIC. Some railway companies provide UIC with their tractive stock total consumption divided by electric/diesel and passenger/freight. These total consumptions combined with pkm and tkm (which are distributed between electric, diesel and coal following repartition of train-km given by UIC) allow the calculation of energy intensity. As total energy consumption is not provided by all companies, specific energy consumption for several countries is an estimation based on intensity in other countries. A second step is the comparison of total energy use calculated in this way with the IEA World Energy Balances database (IEA, 2012b), which allows a calibration of the estimated energy intensity.
As for China (fig. 104) there was no data concerning train-km before 1980, there was no way to allocate pkm and tkm by fuel type, so railway specific energy is drawn only from 1980.
101100

References
CNBS 2012, China Statistical Yearbook 2012. China Statistics Press, Na-tional Bureau of Statistics of China, Beijing.
EC 2012, EU transport in figures – Statistical pocketbook 2012. Publi-cations Office of the European Union, Luxembourg. Internet: http://ec.europa.eu/transport/publications/statistics/doc/2011/pocketbo-ok2011.pdf. Accessed 27 February 2012.
EEA 2010, Occupancy rates of passenger vehicles (TERM 029). July 2010. Internet: http://www.eea.europa.eu/data-and-maps/indicators/occupancy-rates-of-passenger-vehicles/occupancy-rates-of-passenger-vehicles-1. Accessed July 1, 2013.
ENTSO-E 2011, Statistical Yearbook 2011. European Network of Transmis-sion System Operators for Electricity. Brussels, 2011.
EU 2009, REGULATION (EC) No 443/2009 OF THE EUROPEAN PARLIA-MENT AND OF THE COUNCIL of 23 April 2009 setting emission perfor-mance standards for new passenger cars as part of the Community’s inte-grated approach to reduce CO2 emissions from light-duty vehicles. Official Journal of the European Union. Brussels, 2009.
Eurostat 2013, Eurostat Database, indicator tsdcc30. Internet: http://epp.eurostat.ec.europa.eu/tgm/table.do?tab=table&init=1&plugin=1&language=en&pcode=tsdcc330. Accessed 25 April 2013.
GFEI 2009, Making Cars 50% More Fuel Efficient by 2050 Worldwide. Glo-bal Fuel Economy Initiative. 2009.
IATA 2009, Halving Emissions by 2050 - Aviation Brings its Targets to Co-penhagen. Press release, 8 December 2009. Internet: http://www.iata.org/pressroom/pr/Pages/2009-12-08-01.aspx. Accessed 25 April 2013.
ICAO 2013, Forecasts of Scheduled Passenger Traffic – Long-term Traffic and Aircraft Movement Forecasts. Internet: http://www.icao.int/sustaina-bility/pages/eap_fp_forecast_longterm.aspx. Accessed 7 June 2013.
IEA 2008, Energy Efficiency Indicators for Public Electricity Production from Fossil Fuels. International Energy Agency (IEA). Paris, 2008.
IEA 2012a, CO2 Emissions from Fuel Combustion. On-line data service. Internet: http://data.iea.org/. Accessed 25 March 2013.
IEA 2012b, World Energy Balances. On-line data service. Internet: http://data.iea.org/. Accessed 25 March 2013.
IEA 2012c, Energy Technology Perspectives 2012. IEA/OECD, Paris.
Tonne-kilometre (tkm)Unit of measurement of goods transport which represents the transport of one tonne of goods over a distanceof one kilometre.
Tonne of oil equivalent (toe)Unit of measurement of energy consumption: 1 TOE = 41.868 GJ
Train-kilometre (train-km)Unit of measurement representing the movement of a train over one kilometre.
Transport Unit (tu)The sum of passenger kilometre and tonne-kilometre
TTWTank to wheel
WTTWell to tank
WTWWell to wheel
103102
This report is the result of a collaborative effort between the International Energy Agency (IEA) and the International Union of Railways (UIC). Users of this report shall take their own independent business decisions at their own risk and, in particular, without undue reliance on this report. Nothing in this report shall constitute professional advice, and no representation or warranty, express or implied, is made in respect to the completeness or accuracy of the contents of this report. Neither the IEA nor the UIC accepts any liability whatsoever for any direct or indirect damages resulting from any use of this report or its contents. A wide range of experts reviewed drafts. However, the views expressed do not necessarily represent the views or policy of either the UIC, or its member companies, or of the IEA, or its individual Member countries.
Copyright © 2013the OECD/International Energy Agency and
the International Union of Railways
IEA 2013, Global Land Transport Infrastructure Requirements. Estimating road and railway infrastructure capacity and costs to 2050. IEA/OECD, Paris.
IPCC 2006, Eggleston H.S., Buendia L., Miwa K., Ngara T. and Tanabe K. (eds), 2006 IPCC Guidelines for National Greenhouse Gas Inventories, Prepared by the National Greenhouse Gas Inventories Programme. IGES, Japan, 2006.
ISPRA 2013, Italian Greenhouse Gas Inventory 1990-2011. National In-ventory Report 2013. Istituto Superiore per la Protezione e la Ricerca Am-bientale. Rome, 2013.
JMLIT 2012, Summary of Transportation Statistics. Japan Ministry of Land, Infrastructure and Tourism. Internet: http://www.mlit.go.jp/k-toukei/transportation_statistics.html. Accessed 11 February 2013.
JSB 2012, Japan Statistical Yearbook 2012. Japan Statistics Bureau, Tokyo.
OECD 2013, OECD.Stat Extracts. On-line data service. Internet: http://stats.oecd.org/. Accessed 15 March 2013.
Rosstat 2013, Russia in figures. Russian Federal Statistics Service. Inter-net: http://www.gks.ru/wps/wcm/connect/rosstat_main/rosstat/en/figures/transport/. Accessed 20 January 2013.
Susdef 2012, Genoa-Rotterdam: a Sustainable Corridor. Fondazione Svi-luppo Sostenibile. Rome, 2013.
Susdef 2013, La riduzione della CO2 nel settore trasporti. Fondazione Svi-luppo Sostenibile, Ministero dell’Ambiente. Rome, 2013.
Terna 2013, Dati Statistici sull’Energia Elettrica in Italia - 2012. Gruppo Terna. Rome, 2013.
UIC 2012a, International Railway Statistics 2012, Statistics Centre of the International Union of Railways, Paris. Terna 2013, Dati Statistici sull’Ener-gia Elettrica in Italia - 2012. Gruppo Terna. Rome, 2013.
UIC 2012b, UIC Energy and CO2 Database 2012. International Union of Railways, Paris.
UIC 2013a, High Speed Lines in the World. International Union of Railways, Paris.
UIC 2013b, Survey conducted on electricity mix among UIC members’ energy managers.
UIC/CER 2010, Moving towards Sustainable Mobility: European Rail Sec-tor Strategy 2030 and beyond. International Union of Railways / Commu-nity of European Railways. Paris, 2010.
105104
with the technical support of
This publication can be downloaded at:http://www.uic.org/