Embed Size (px)
Citation preview
NRSP: Peri-Urban Interface
R6880 ZE0050
Development of Methods of peri-urban
natural resource information collection,
storage, access and management:
Interim Report
GIS-based village level planning system
Jane and Giles D’Souza
Geographic Data Support Limited
2 The Birches
Ampthill Road
Flitwick
Bedfordshire MK45 1BA, UK
Tel/Fax: 01525-717967
Email: [email protected]
January 2000
R6880 ZE0050 Methods of peri-urban NR information collection, storage, access and management
2
Village Level Planning
Case Study: Swedru
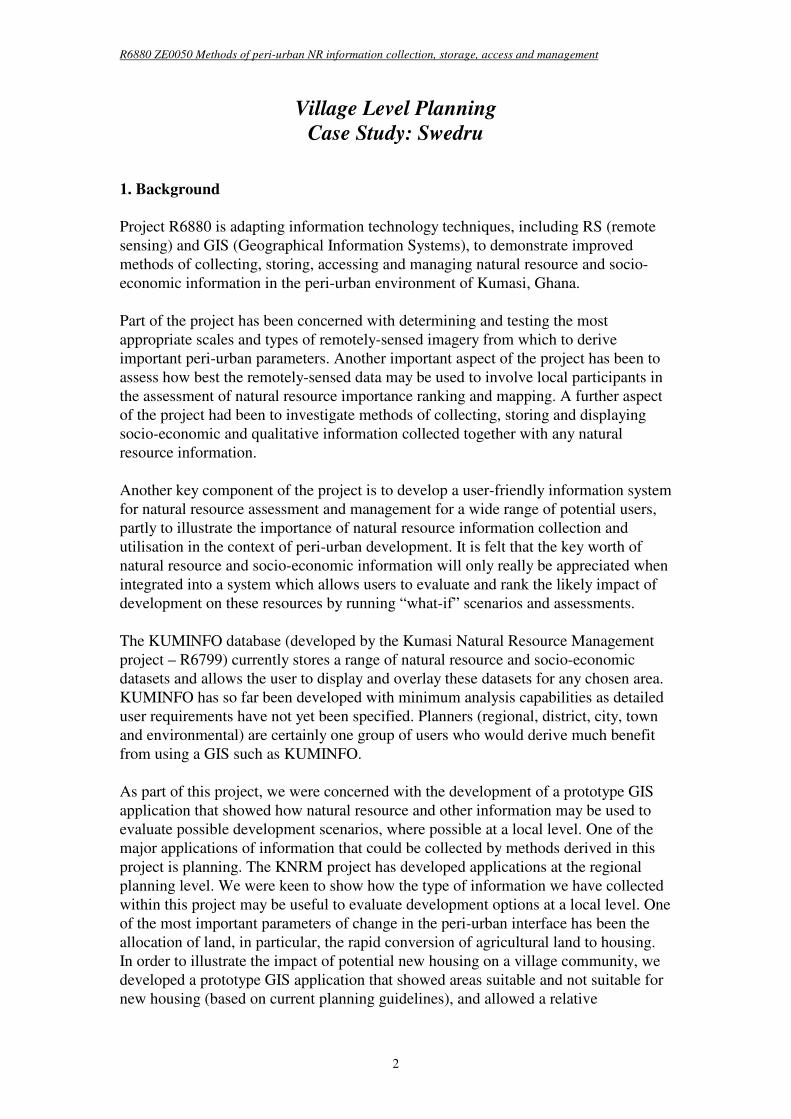
1. Background
Project R6880 is adapting information technology techniques, including RS (remote
sensing) and GIS (Geographical Information Systems), to demonstrate improved
methods of collecting, storing, accessing and managing natural resource and socio-
economic information in the peri-urban environment of Kumasi, Ghana.
Part of the project has been concerned with determining and testing the most
appropriate scales and types of remotely-sensed imagery from which to derive
important peri-urban parameters. Another important aspect of the project has been to
assess how best the remotely-sensed data may be used to involve local participants in
the assessment of natural resource importance ranking and mapping. A further aspect
of the project had been to investigate methods of collecting, storing and displaying
socio-economic and qualitative information collected together with any natural
resource information.
Another key component of the project is to develop a user-friendly information system
for natural resource assessment and management for a wide range of potential users,
partly to illustrate the importance of natural resource information collection and
utilisation in the context of peri-urban development. It is felt that the key worth of
natural resource and socio-economic information will only really be appreciated when
integrated into a system which allows users to evaluate and rank the likely impact of
development on these resources by running “what-if” scenarios and assessments.
The KUMINFO database (developed by the Kumasi Natural Resource Management
project – R6799) currently stores a range of natural resource and socio-economic
datasets and allows the user to display and overlay these datasets for any chosen area.
KUMINFO has so far been developed with minimum analysis capabilities as detailed
user requirements have not yet been specified. Planners (regional, district, city, town
and environmental) are certainly one group of users who would derive much benefit
from using a GIS such as KUMINFO.
As part of this project, we were concerned with the development of a prototype GIS
application that showed how natural resource and other information may be used to
evaluate possible development scenarios, where possible at a local level. One of the
major applications of information that could be collected by methods derived in this
project is planning. The KNRM project has developed applications at the regional
planning level. We were keen to show how the type of information we have collected
within this project may be useful to evaluate development options at a local level. One
of the most important parameters of change in the peri-urban interface has been the
allocation of land, in particular, the rapid conversion of agricultural land to housing.
In order to illustrate the impact of potential new housing on a village community, we
developed a prototype GIS application that showed areas suitable and not suitable for
new housing (based on current planning guidelines), and allowed a relative
R6880 ZE0050 Methods of peri-urban NR information collection, storage, access and management
3
comparison of alternative new housing areas. We developed and applied it over the
village of Swedru where a certain amount of research had already taken place, and for
which a number of datasets had already been collated. The application is illustrative of
the sort of system that may be available if data for other villages are analysed. The
interface has been developed in such a way that ultimately, after testing and further
refinement, it could be integrated into the main KUMINFO system, and used in other
areas where the data could be collated.
This planning application was designed after discussion and consultation with other
projects within the RNRRS Programme, in particular the Kumasi Natural Resource
Management Project which included a large component of planning (by Keith
Williams, Nottingham University). Although a specific user requirement study was
not carried out with village planners in Ghana, both teams on the above projects
contributed their knowledge and experience of the planning process to help design a
prototype system. The detailed nature of the text in this report and its appendices and
figures enables it to be used as a manual and training guide for the prototype
application as well as an interim report.
2. Village-Level Planning
A workshop on Information Needs for Planning was held in Kumasi on 28 September
1998. This workshop, attended by development planners, town and planning officers,
and a number of academics from UST, had the following objectives:
1. disseminate material on planning and aspects of the Village Characterisation
Survey (VCS) likely to be of value to planners;
2. publicise KUMINFO;
3. invite feedback on planners’ information needs; and
4. determine planners’ willingness to become active suppliers and users of
KUMINFO.
The main priority for village-level planning addressed during this meeting was the
need for a detailed base map at 1:2,500 scale showing individual buildings and land
use information. These base maps could indeed be prepared from the Aerial Digital
Photographic (ADP) images flown over Kumasi in December 1997 by Bath Spa
University College (Koh and Edwards, 1997). This survey covered a total area of 290
sq.km., consisting of 1360 images at a nominal resolution of 23 cm. When these
images are geo-corrected and resampled to 1m resolution they are at a scale suitable
for the preparation of village layouts and for surveying natural resources and
agricultural land.
It is important for town planners to have detailed contours overlain onto the 1:2,500
base map in order to know where steep slopes are and to highlight areas prone to
flooding. The ideal contour interval is 5-10 feet. The slope maps which are used in
this planning application have been derived from a 1:50,000 contour coverage with a
50 feet interval. This level of detail is clearly not sufficient for actual village planning
and layout preparation but is adequate for illustration purposes.
R6880 ZE0050 Methods of peri-urban NR information collection, storage, access and management
4
Other data required for village level planning include:
1. land use plots and ownership;
2. some indication of land value and land pressure (perhaps in terms of soil fertility
and fallow/non-fallow period);
3. the extent of the village boundary;
4. the distribution of resources such as woodland, sand winning sites and water
supplies;
5. population density; and
6. up-to-date roads, tracks and footpaths.
Town and country planners currently should adhere to two documents detailing
planning standards in Ghana:
• Evolution of Planning Standards, this contains a section on Standards for Planning
within a Rural Setting (i.e. villages with populations of 2,000 to 10,000)
• Planning Standards for all Settlements in Ghana. The Housing Section refers to
designated residential neighbourhood areas with a catchment population of
between 5,000 and 15,000 persons. According to this document, “settlements
with populations below 5,000 persons each will be grouped together where
distances between villages are less than 5 km, and regarded as a neighbourhood
and provided, at a central location, with all the basic community services”.
Although Swedru’s population is currently less than 2,000 we have assumed that it is
a Rural Setting rather than being amalgamated with other villages to create a
residential neighbourhood. The planning criteria used in the planning application
(Section 5) i.e. that a house should be a minimum distance of 150 ft and a maximum
distance of 0.25 miles from a public toilet, is therefore applicable only to a Rural
Setting.
3. Case Study: Swedru
Swedru was chosen to demonstrate this planning application for a number of reasons:
1. ADP imagery had already been processed to mosaic form;
2. Swedru had been used as one of the PRA (Participatory Rural Appraisal) villages
undertaken by the Kumasi Lead Research Team;
3. Cranfield University (Silsoe College) had already collected data during their field
visit in March 1998.
One aim of the Cranfield University (Silsoe College) field visit was to test, in the
field, the application of large-scale ADP derived image maps for collecting natural
resource and socio-economic data in the context of a Village Characterisation Survey
(VCS). Various groups of villagers (the Chief and village development committee,
women, and young men) were asked to interpret this false colour image and try to
R6880 ZE0050 Methods of peri-urban NR information collection, storage, access and management
5
locate notable features and landmarks around the village. This they achieved with
varying degrees of success (Thomas et al., 1999).
Swedru is located in Kwabre district and lies approximately 14 km north of Kumasi
city. The current population is estimated around 1500 (Blake et al., 1997.) with the
majority of inhabitants engaged in farming or farm-related activities. More than 90%
of the farmers have farms in the village. Major crops grown are food crops such as
cassava, tomatoes, okra and maize. Vegetable crops are becoming very popular due to
the proximity of the Kumasi market and recent improvements in the road network.
The major change in the village over the past decade has been the expansion of new
housing. Figure 1 shows the large area of new housing, which has more than doubled
the village extent over the last five years and encroached on lands suitable for food
crops. Backyard gardens (mainly planted with plantain) are common around these new
houses, often as areas “staked out” by people planning to build on them.
A village layout plan is still being developed by the regional Town and Country
Planning Department. The chief has the right to allocate land for development so any
prospective housing developer must first inform him.
4. Datasets
Many of the datasets used in this application were derived by interpreting the ADP
image map for Swedru, using local knowledge from the villagers during the field trip
in March 1998, and described more fully in Thomas et al (1999).
4.1 ADP Image Mosaic
The ADP image is shown in Figure 2. It is a false colour composite of several ADP
images overlaid on a SPOT panchromatic image. Although each ADP image has a
nominal resolution of 23cm, the composite was made at a resolution of 1m. Its
characteristics are more fully described in Thomas et al (1999).
4.2 Built Environment
A map showing the “built environment” of Swedru (Figure 3) was created prior to
visiting Swedru by tracing over a 1:3,500 scale image hardcopy. This was later
amended and improved by using the villagers’ local knowledge during a walk around
the village. Features such as boreholes, churches, schools, cemeteries, sacred groves
and houses were identified and labelled. Villagers also contributed the approximate
period of housing thus allowing the age of the housing and therefore the growth of
the village to be mapped (Figure 1). The image interpretations which were initially
made on hard copies were then digitised into ArcView. The actual datasets produced
are in ArcView shapefile format and are named as follows:
houses.shp
R6880 ZE0050 Methods of peri-urban NR information collection, storage, access and management
6
Polygon theme categorising the houses within Swedru according to age. The classes
are as follows:
ID Description
__________________________________________
1 Houses built in the last 5 years
2 Houses built 1920-42
3 Houses built 1920-63
4 Oldest house 1920
5 Chief Mawere Poku’s house
6 Houses being rebuilt
schools.shp
Polygon theme describing type of school and comprising five polygons as follows:
ID Description
__________________________________________
1 Middle level
2 New middle level-being constructed
3 Upper primary
4 Lower primary
5 Kindergarten
refuse.shp
Polygon theme showing the location of the village refuse tip.
sacred.shp
Polygon theme showing the location of the sacred grove.
townfeat.shp
Polygon theme describing various town features. There are five polygons as follows:
ID Description
__________________________________________
1 Originally used as a playing field- current use uncertain.
2 Christian cemetery
3 Toilets
4 True Faith Church
5 Methodist Church
borehole.shp
Point theme showing the distribution of the three village boreholes .
These datasets may be displayed using the Display menu on the village planning
interface (see Appendix A).
4.3 Land Use
The land use datasets used in this planning application and shown in Figure 4 were
also interpreted from the ADP mosaic. Although these datasets have not been fully
R6880 ZE0050 Methods of peri-urban NR information collection, storage, access and management
7
verified in the field they nonetheless demonstrate the value of land use data for the
planning process and show how such data may be integrated into the GIS application.
Because of the way that the interpretations were made and digitised, there is a separate
shapefile for each land use class as shown in the table below.
Shapefile Name Description
bushfall.shp Bush Fallow
year1agr.shp Year 1 Crops
year2agr.shp Year 2 Crops
wood.shp Woodland
riv_veg.shp Riverine Vegetation
villbound.shp Village Boundary
sacred.shp Sacred Grove
roads.shp Roads
These datasets may be displayed using the Display menu on the village planning
interface (see Appendix A). In more conventional image interpretation exercises, a
single layer of several land use classes may be expected.
4.4 Slope
The slope theme was derived from a digital elevation model (DEM) of the Swedru
area, which in turn was generated from contours taken from the 1:50,000 topographic
basemap. The resolution of the elevation model is only 50 feet. The DEM and derived
slope map are shown in Figure 5. For real planning applications, more precise
elevation data would be essential.
4.5 Rivers and Drainage
The stream and river network was taken directly from the existing 1:50,000
topographic base maps. Those streams and rivers within the Swedru village boundary
were then edited and updated by referring to the underlying ADP image . The
resulting shapefile is used to generate a buffer zone around rivers within which no
development should take place (according to the planning guidelines).
The value of this dataset, in the planning assessment scenarios, could be improved
further by using local knowledge to label streams according to whether they are
seasonal or perennial and to note their importance as a source of water supply to the
village.
4.6 Other Datasets
Other datasets collected during the field survey, although not used directly in the
planning application, have also been incorporated into the Swedru case study. These
are mainly qualitative in nature and are not georeferenced in the same manner as a
traditional map or image map. Examples include the PRA sketch map drawn up by the
villagers, photographs taken in the field, and diagrams. These datasets are integrated
R6880 ZE0050 Methods of peri-urban NR information collection, storage, access and management
8
into the GIS by a technique known as hotlinking which basically attaches any scanned
maps and photographs to a spatial feature i.e. a point, line, or polygon. When the user
clicks on that feature then the attached map or photo is opened up for display in a
separate window. The inclusion of these serves to illustrate how qualitative
information in different formats (sketches, photos, textual files, etc), may be attached
to areas they concern so that the user (planner) may access them and assess their
importance as appropriate.
Several digital photos were taken of key features in the built environment around
Swedru but only nine are included here for reference. Four of these are shown in
Figure 6 linked to the points they were taken from on the Swedru map.
5. Overview of Village Level Planning Procedure using the GIS
This application takes the planner through the various steps necessary to assess the
effects of siting one or more new housing developments in the village. The procedure
is as follows:
• show constraints to development;
• define polygon(s) for new development area;
• generate a report;
• assess and compare new development options.
The first stage, then, is to show all constraints to development. The constraints have
been included from the planning guidelines, but their parameters are largely user-
defined. For example, the planning guidelines state that building should not be carried
out in too steep slopes, so the application includes the ability to shade in the areas
above a certain slope, with a possibility for the user to enter the value of slope that he
wishes to view. Similarly the application allows the user to mask out areas within a
certain distance of a stream or river, and the user can enter the particular distance (in
feet or metres). The user can then combine constratints. As an example, Figure 7
shows the amalgamation of three constraints: (i) slopes of more than 6 degrees; (ii)
areas within 50 ft of a river or stream, and (iii) areas within 100 feet of a sacred grove.
Once the constraints have been calculated and displayed, the next stage is to define an
area on the screen corresponding to the proposed new development. The user does this
by digitising the outline of the polygon using the mouse. The polygon is given a
system-defined ID and the user may also add a short description which is useful for
labelling purposes. More than one new development polygon may be defined at this
stage. Figure 8 shows four hypothetical new development areas which have been
defined for Swedru.
Having digitised several options for development the system can calculate and let the
user compare the impact of each of the new development areas on such issues as loss
of agricultural land, distance to nearest facilties, etc. A report is produced for each
new development area which gives:
• total area (sq.ft) ,
R6880 ZE0050 Methods of peri-urban NR information collection, storage, access and management
9
• composition of current land uses,
• average elevation,
• distance to nearest feature such as roads or rivers, and
• minimum and maximum distances to nearest water supply, toilet facility, and
various categories of school.
The latter is compared with planning guidelines laid down by town and country
planners for villages in a Rural Setting (see Section 2). By comparing these distances
to those in the recommended planning guidelines it will be obvious when a proposed
new site fails to meet the minimum and/or maximum distance criteria.
Appendix B contains the reports produced for the four new development areas shown
in Figure 8.
The final stage then is to show, in chart format, the land use composition for each of
the new development areas (Figure 9).
A more detailed guide to using this planning application is given in Appendix A.
6. Conclusions and Recommendations
This application has been designed as an illustrative first-stage example of how the
planning procedure at village level may benefit from using a simple GIS interface to
assess, plan and monitor village growth and development. The procedure should be
presented to potential users in Ghana and feedback invited. The application may then
be further refined through addition of relevant datasets and/or modifications to the
interface design and analysis procedures.
Conclusions/Recommendations:
• The ADP imagery is a valuable resource for the generation of village-level base
maps at a variety of scales. Up-to-date village layouts, required for the planning
process, could be created for villages in the Kumasi peri-urban area using this
imagery.
• We have shown only three development constraints in order to illustrate the
procedure. These could be refined further or additional constraints added. For
example, the KMA use 100-200 ft to define the stream flood plain, depending on
slope. There is certainly a need for more detailed slope data.
• A more detailed land use map could be derived from the ADP imagery, given
adequate field work and local knowledge.
• Locally derived estimates of crop production, when combined with field areas,
would allow yield estimates, and possibly an economic value to be derived. These
could then be incorporated into the report, thus showing not only loss of crop area
but also loss in terms of yield and monetary value.

R6880 ZE0050 Methods of peri-urban NR information collection, storage, access and management
10
• Techniques should be developed to enable the estimation of population density
from the ADP images. This could be based on average number of persons
occupying a dwelling of type a and x number of storeys. This information would
be very valuable to the village planning process.
• The application currently uses shortest path distances when calculating minimum
and maximum distances to features and facilities, such as roads and schools. It
would clearly be more realistic to measure distance in terms of time taken to travel
along the road and footpath network. This would involve generating a detailed
track/footpath map by interpreting the ADP image and verifying this with local
knowledge. It would also involve using the Network module of ArcView to
measure these distances along the network.
R6880 ZE0050 Methods of peri-urban NR information collection, storage, access and management
11
7. Refernces
Koh, A. and Edwards, E., 1997. Color Infrared Aerial Digital Photographic System
Survey of Kumasi, Ghana, 17 December 1997, Bath Spa University College, June
1998, Interim report, 10pp + associated CD’s.
Thomas, G., Taylor, J.C. and Marshall, D.C., 1999. Application of Aerial Digital
Photography to Rapid Rural Mapping, Cranfield University (Silsoe College), January
99, Interim Report, 24pp + 15 figures.
Blake, B., Kasanga,K., Adam,M., Nsiah-Gyabaah,K., Pender,J., Quashie-Sam,J.,
Warburton,H., and Williams, K. 1997. Kumasi Natural Resource Management
Research Project Inception Report: Volume 2: Report of Component Studies, October
97 (project R6799).
R6880 ZE0050 Methods of peri-urban NR information collection, storage, access and management
12
Appendix A
Detailed User Guide
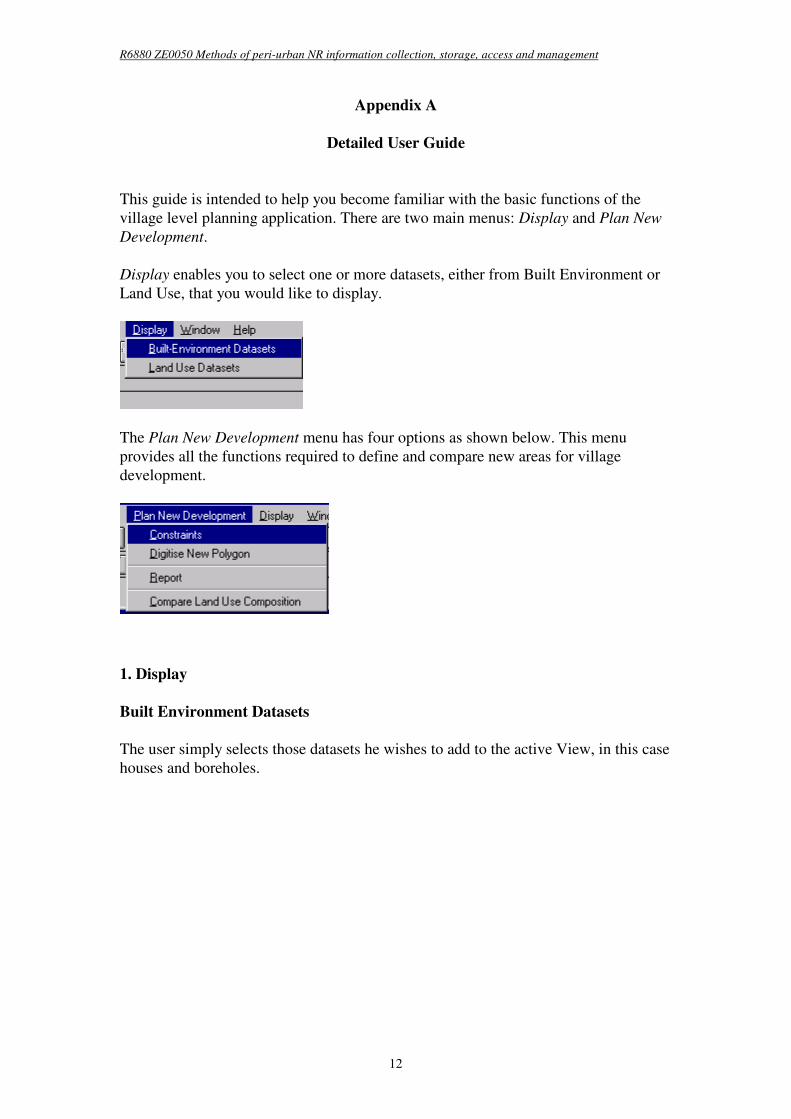
This guide is intended to help you become familiar with the basic functions of the
village level planning application. There are two main menus: Display and Plan New
Development.
Display enables you to select one or more datasets, either from Built Environment or
Land Use, that you would like to display.
The Plan New Development menu has four options as shown below. This menu
provides all the functions required to define and compare new areas for village
development.
1. Display
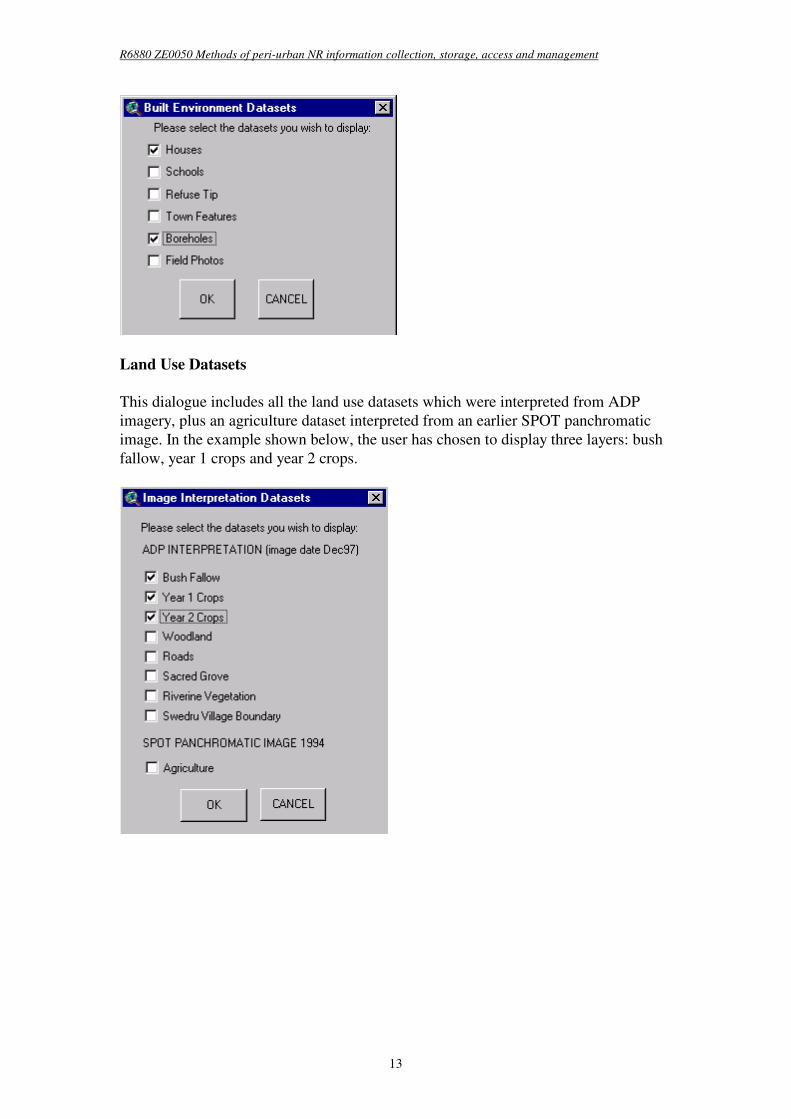
Built Environment Datasets
The user simply selects those datasets he wishes to add to the active View, in this case
houses and boreholes.
R6880 ZE0050 Methods of peri-urban NR information collection, storage, access and management
13
Land Use Datasets
This dialogue includes all the land use datasets which were interpreted from ADP
imagery, plus an agriculture dataset interpreted from an earlier SPOT panchromatic
image. In the example shown below, the user has chosen to display three layers: bush
fallow, year 1 crops and year 2 crops.
R6880 ZE0050 Methods of peri-urban NR information collection, storage, access and management
14
2. Plan New Development
2.1 Show Planning Constraints
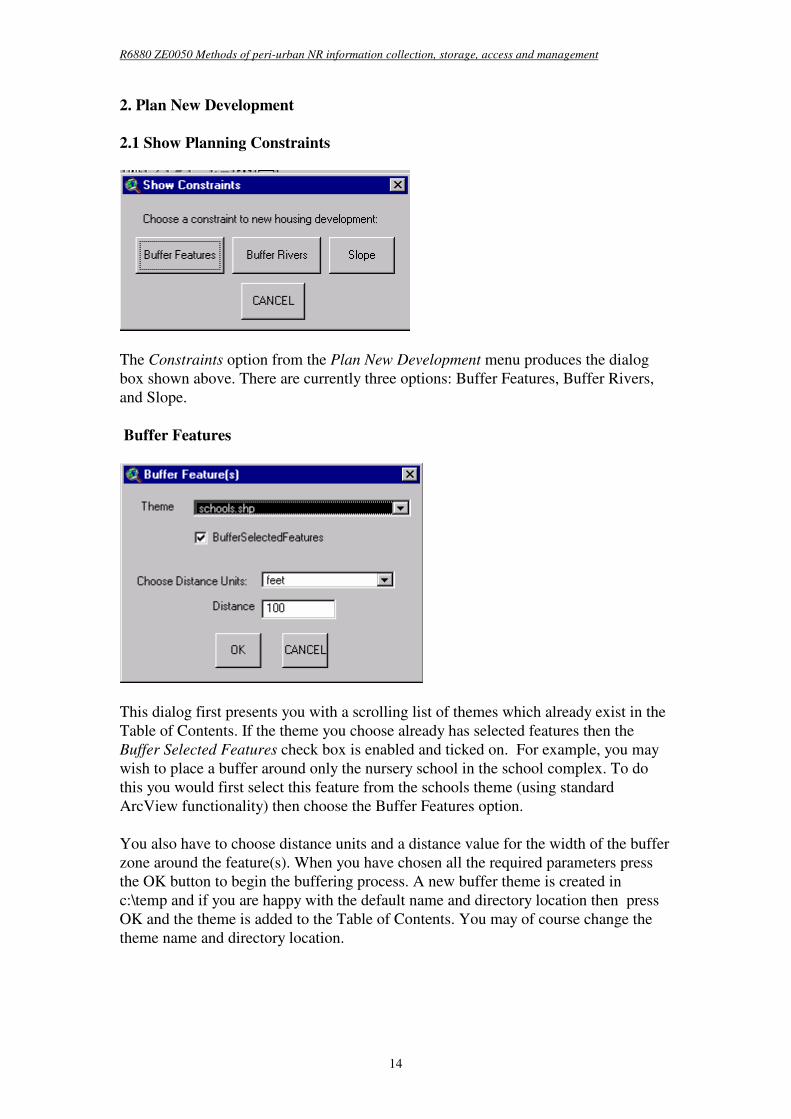
The Constraints option from the Plan New Development menu produces the dialog
box shown above. There are currently three options: Buffer Features, Buffer Rivers,
and Slope.
Buffer Features
This dialog first presents you with a scrolling list of themes which already exist in the
Table of Contents. If the theme you choose already has selected features then the
Buffer Selected Features check box is enabled and ticked on. For example, you may
wish to place a buffer around only the nursery school in the school complex. To do
this you would first select this feature from the schools theme (using standard
ArcView functionality) then choose the Buffer Features option.
You also have to choose distance units and a distance value for the width of the buffer
zone around the feature(s). When you have chosen all the required parameters press
the OK button to begin the buffering process. A new buffer theme is created in
c:\temp and if you are happy with the default name and directory location then press
OK and the theme is added to the Table of Contents. You may of course change the
theme name and directory location.
R6880 ZE0050 Methods of peri-urban NR information collection, storage, access and management
15
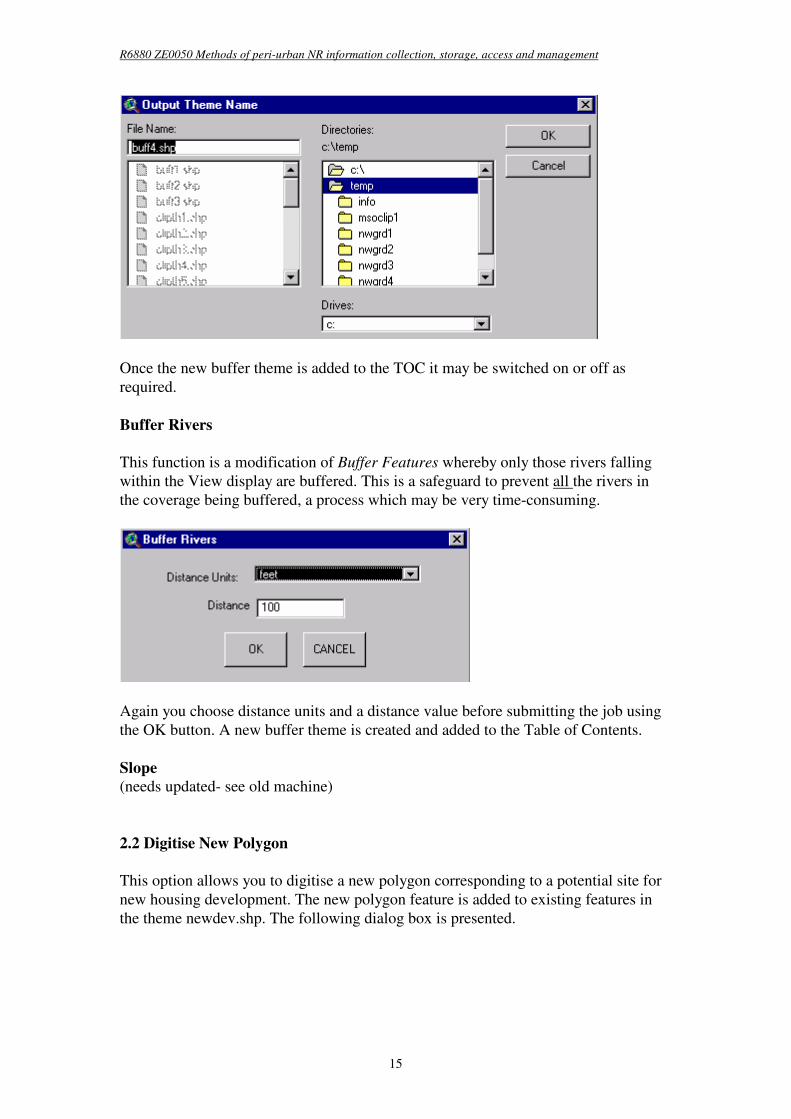
Once the new buffer theme is added to the TOC it may be switched on or off as
required.
Buffer Rivers
This function is a modification of Buffer Features whereby only those rivers falling
within the View display are buffered. This is a safeguard to prevent all the rivers in
the coverage being buffered, a process which may be very time-consuming.
Again you choose distance units and a distance value before submitting the job using
the OK button. A new buffer theme is created and added to the Table of Contents.
Slope
(needs updated- see old machine)
2.2 Digitise New Polygon
This option allows you to digitise a new polygon corresponding to a potential site for
new housing development. The new polygon feature is added to existing features in
the theme newdev.shp. The following dialog box is presented.
R6880 ZE0050 Methods of peri-urban NR information collection, storage, access and management
16
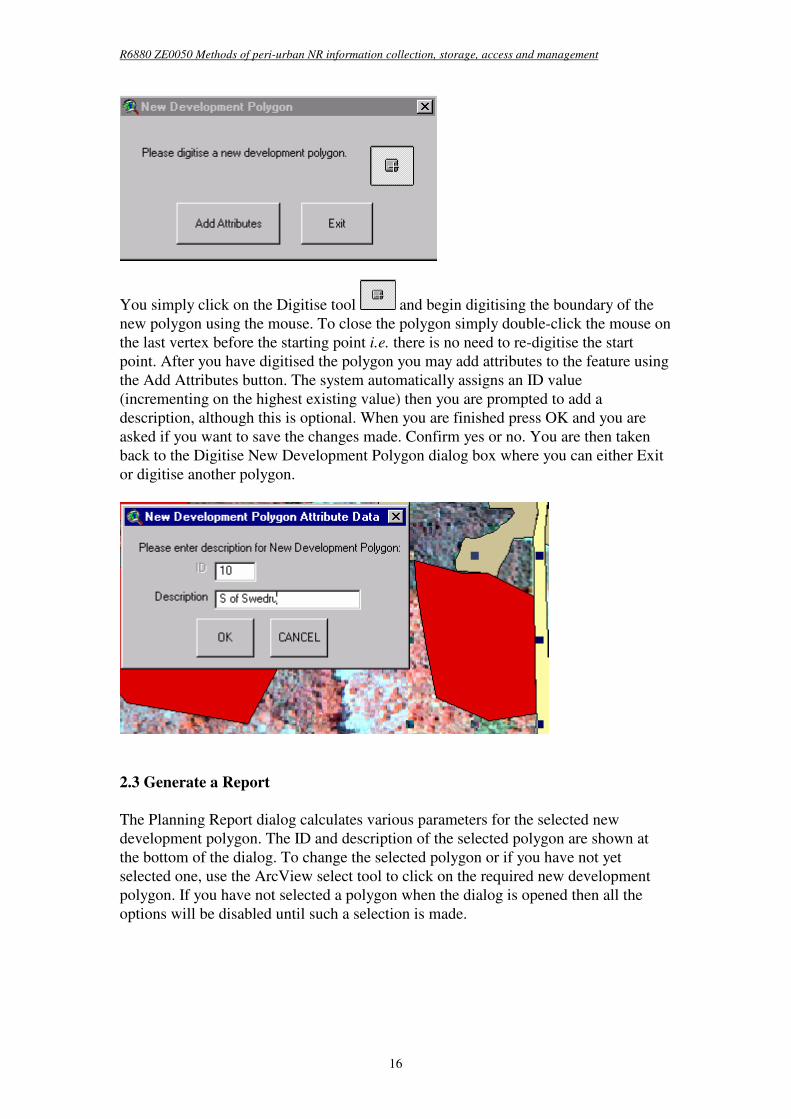
You simply click on the Digitise tool and begin digitising the boundary of the
new polygon using the mouse. To close the polygon simply double-click the mouse on
the last vertex before the starting point i.e. there is no need to re-digitise the start
point. After you have digitised the polygon you may add attributes to the feature using
the Add Attributes button. The system automatically assigns an ID value
(incrementing on the highest existing value) then you are prompted to add a
description, although this is optional. When you are finished press OK and you are
asked if you want to save the changes made. Confirm yes or no. You are then taken
back to the Digitise New Development Polygon dialog box where you can either Exit
or digitise another polygon.
2.3 Generate a Report
The Planning Report dialog calculates various parameters for the selected new
development polygon. The ID and description of the selected polygon are shown at
the bottom of the dialog. To change the selected polygon or if you have not yet
selected one, use the ArcView select tool to click on the required new development
polygon. If you have not selected a polygon when the dialog is opened then all the
options will be disabled until such a selection is made.
R6880 ZE0050 Methods of peri-urban NR information collection, storage, access and management
17
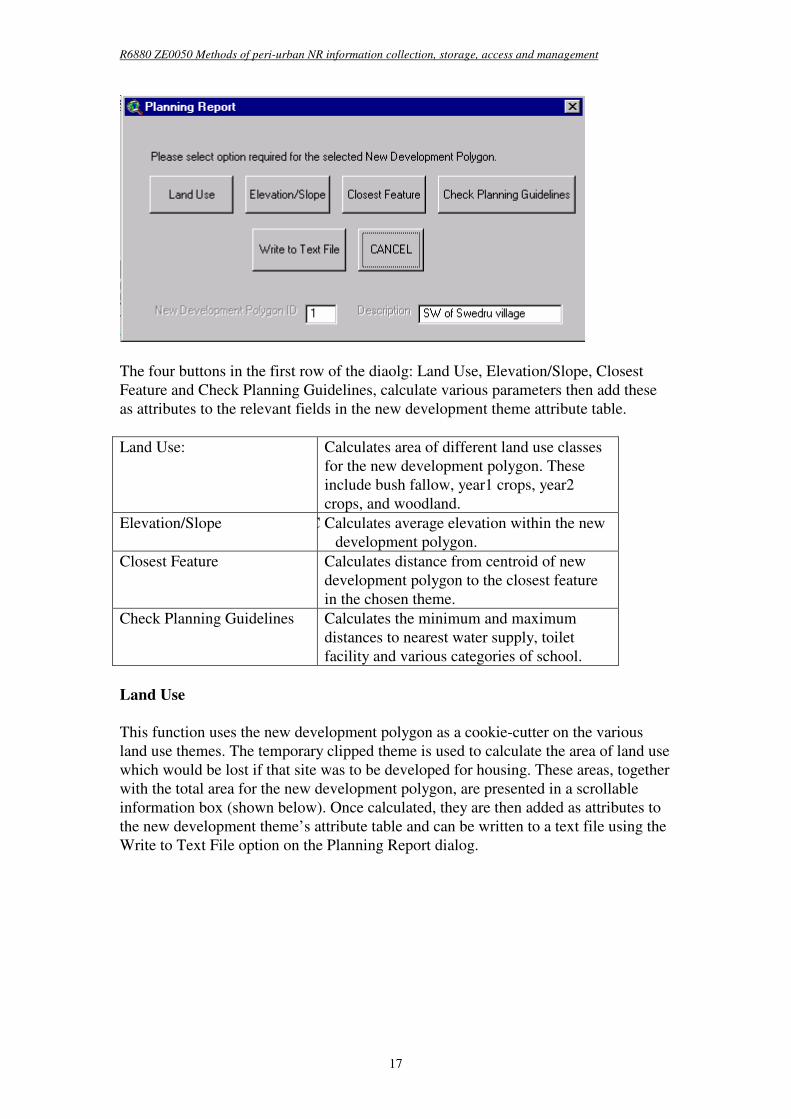
The four buttons in the first row of the diaolg: Land Use, Elevation/Slope, Closest
Feature and Check Planning Guidelines, calculate various parameters then add these
as attributes to the relevant fields in the new development theme attribute table.
Land Use: Calculates area of different land use classes
for the new development polygon. These
include bush fallow, year1 crops, year2
crops, and woodland.
Elevation/Slope Calculates C Calculates average elevation within the new
development polygon.
Closest Feature Calculates distance from centroid of new
development polygon to the closest feature
in the chosen theme.
Check Planning Guidelines Calculates the minimum and maximum
distances to nearest water supply, toilet
facility and various categories of school.
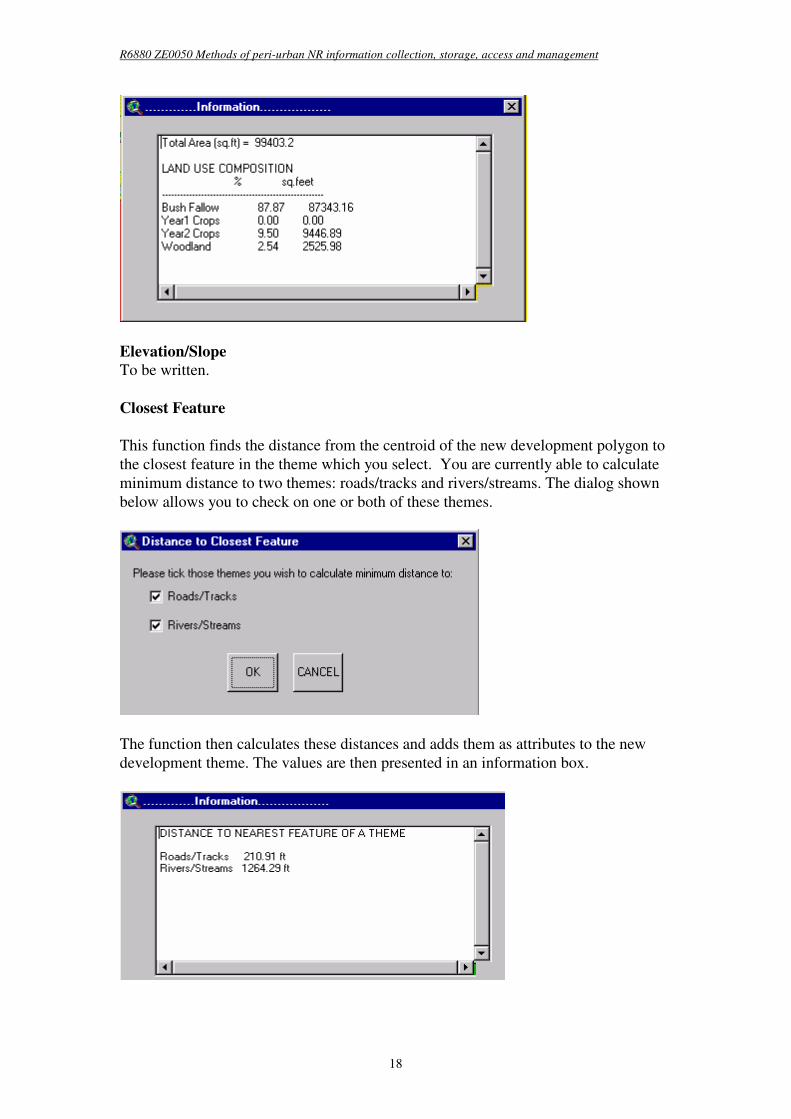
Land Use
This function uses the new development polygon as a cookie-cutter on the various
land use themes. The temporary clipped theme is used to calculate the area of land use
which would be lost if that site was to be developed for housing. These areas, together
with the total area for the new development polygon, are presented in a scrollable
information box (shown below). Once calculated, they are then added as attributes to
the new development theme’s attribute table and can be written to a text file using the
Write to Text File option on the Planning Report dialog.
R6880 ZE0050 Methods of peri-urban NR information collection, storage, access and management
18
Elevation/Slope
To be written.
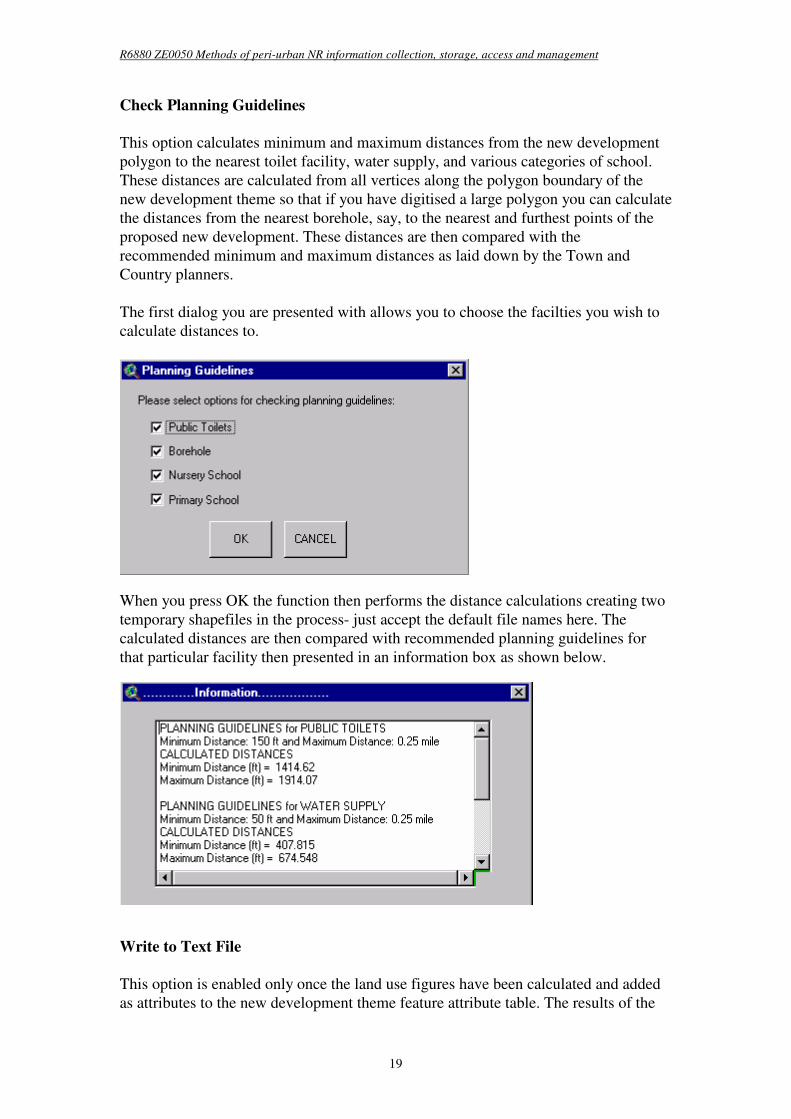
Closest Feature
This function finds the distance from the centroid of the new development polygon to
the closest feature in the theme which you select. You are currently able to calculate
minimum distance to two themes: roads/tracks and rivers/streams. The dialog shown
below allows you to check on one or both of these themes.
The function then calculates these distances and adds them as attributes to the new
development theme. The values are then presented in an information box.
R6880 ZE0050 Methods of peri-urban NR information collection, storage, access and management
19
Check Planning Guidelines
This option calculates minimum and maximum distances from the new development
polygon to the nearest toilet facility, water supply, and various categories of school.
These distances are calculated from all vertices along the polygon boundary of the
new development theme so that if you have digitised a large polygon you can calculate
the distances from the nearest borehole, say, to the nearest and furthest points of the
proposed new development. These distances are then compared with the
recommended minimum and maximum distances as laid down by the Town and
Country planners.
The first dialog you are presented with allows you to choose the facilties you wish to
calculate distances to.
When you press OK the function then performs the distance calculations creating two
temporary shapefiles in the process- just accept the default file names here. The
calculated distances are then compared with recommended planning guidelines for
that particular facility then presented in an information box as shown below.
Write to Text File
This option is enabled only once the land use figures have been calculated and added
as attributes to the new development theme feature attribute table. The results of the
R6880 ZE0050 Methods of peri-urban NR information collection, storage, access and management
20
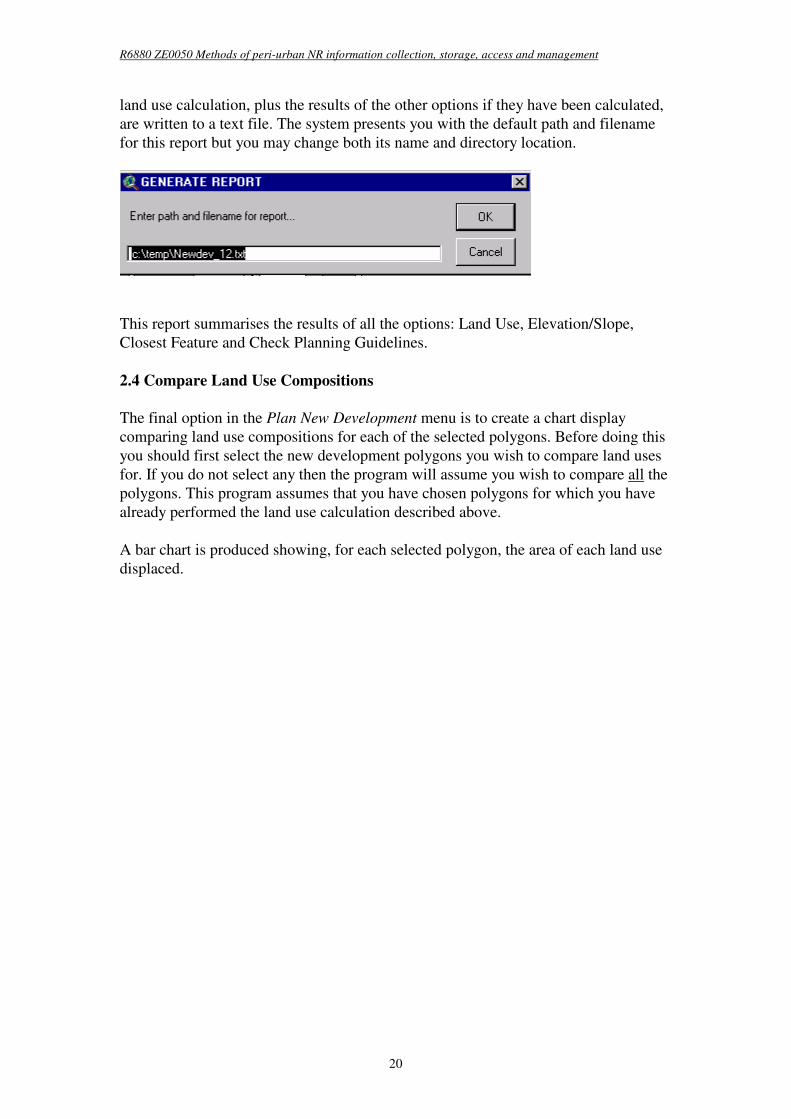
land use calculation, plus the results of the other options if they have been calculated,
are written to a text file. The system presents you with the default path and filename
for this report but you may change both its name and directory location.
This report summarises the results of all the options: Land Use, Elevation/Slope,
Closest Feature and Check Planning Guidelines.
2.4 Compare Land Use Compositions
The final option in the Plan New Development menu is to create a chart display
comparing land use compositions for each of the selected polygons. Before doing this
you should first select the new development polygons you wish to compare land uses
for. If you do not select any then the program will assume you wish to compare all the
polygons. This program assumes that you have chosen polygons for which you have
already performed the land use calculation described above.
A bar chart is produced showing, for each selected polygon, the area of each land use
displaced.
R6880 ZE0050 Methods of peri-urban NR information collection, storage, access and management
21
Appendix B
Reports for Proposed New Development Areas
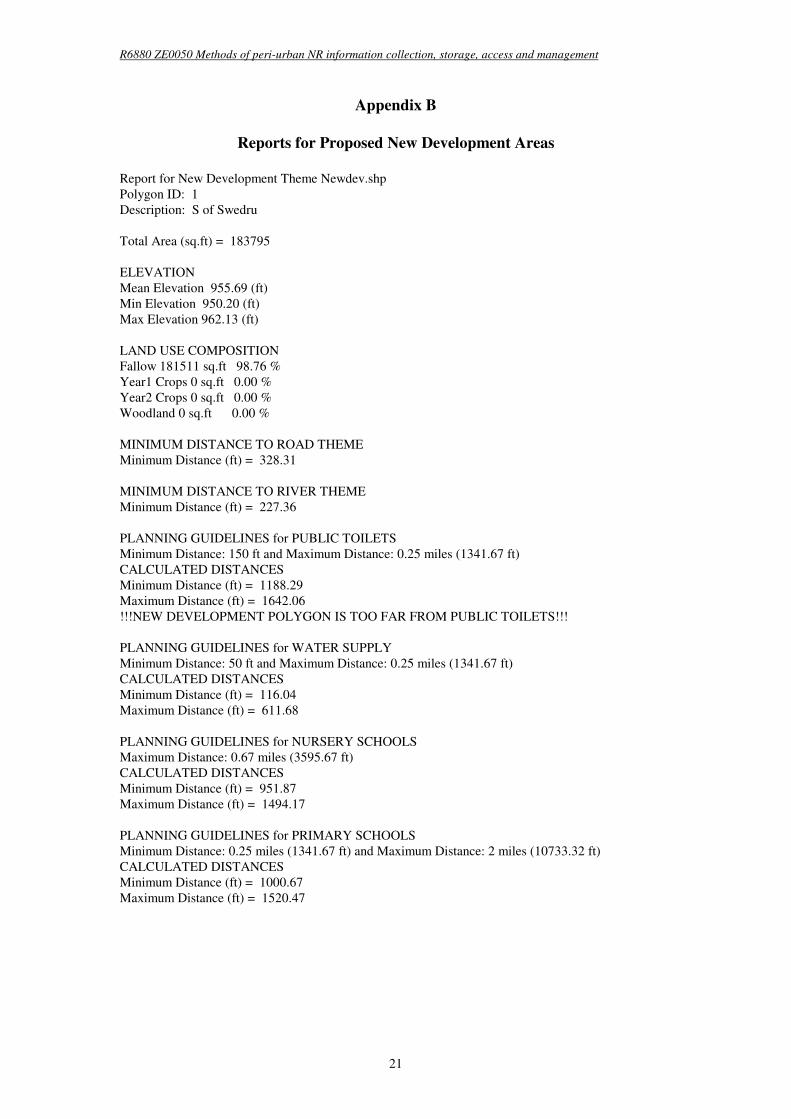
Report for New Development Theme Newdev.shp
Polygon ID: 1
Description: S of Swedru
Total Area (sq.ft) = 183795
ELEVATION
Mean Elevation 955.69 (ft)
Min Elevation 950.20 (ft)
Max Elevation 962.13 (ft)
LAND USE COMPOSITION
Fallow 181511 sq.ft 98.76 %
Year1 Crops 0 sq.ft 0.00 %
Year2 Crops 0 sq.ft 0.00 %
Woodland 0 sq.ft 0.00 %
MINIMUM DISTANCE TO ROAD THEME
Minimum Distance (ft) = 328.31
MINIMUM DISTANCE TO RIVER THEME
Minimum Distance (ft) = 227.36
PLANNING GUIDELINES for PUBLIC TOILETS
Minimum Distance: 150 ft and Maximum Distance: 0.25 miles (1341.67 ft)
CALCULATED DISTANCES
Minimum Distance (ft) = 1188.29
Maximum Distance (ft) = 1642.06
!!!NEW DEVELOPMENT POLYGON IS TOO FAR FROM PUBLIC TOILETS!!!
PLANNING GUIDELINES for WATER SUPPLY
Minimum Distance: 50 ft and Maximum Distance: 0.25 miles (1341.67 ft)
CALCULATED DISTANCES
Minimum Distance (ft) = 116.04
Maximum Distance (ft) = 611.68
PLANNING GUIDELINES for NURSERY SCHOOLS
Maximum Distance: 0.67 miles (3595.67 ft)
CALCULATED DISTANCES
Minimum Distance (ft) = 951.87
Maximum Distance (ft) = 1494.17
PLANNING GUIDELINES for PRIMARY SCHOOLS
Minimum Distance: 0.25 miles (1341.67 ft) and Maximum Distance: 2 miles (10733.32 ft)
CALCULATED DISTANCES
Minimum Distance (ft) = 1000.67
Maximum Distance (ft) = 1520.47
R6880 ZE0050 Methods of peri-urban NR information collection, storage, access and management
22
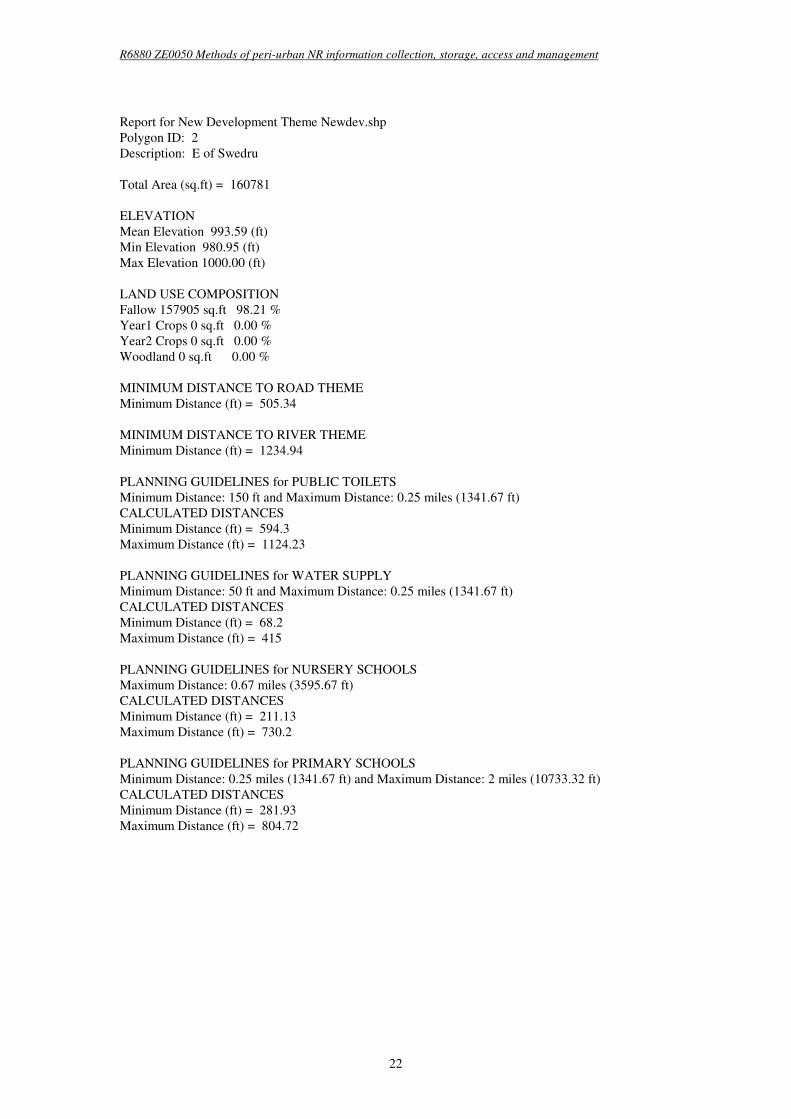
Report for New Development Theme Newdev.shp
Polygon ID: 2
Description: E of Swedru
Total Area (sq.ft) = 160781
ELEVATION
Mean Elevation 993.59 (ft)
Min Elevation 980.95 (ft)
Max Elevation 1000.00 (ft)
LAND USE COMPOSITION
Fallow 157905 sq.ft 98.21 %
Year1 Crops 0 sq.ft 0.00 %
Year2 Crops 0 sq.ft 0.00 %
Woodland 0 sq.ft 0.00 %
MINIMUM DISTANCE TO ROAD THEME
Minimum Distance (ft) = 505.34
MINIMUM DISTANCE TO RIVER THEME
Minimum Distance (ft) = 1234.94
PLANNING GUIDELINES for PUBLIC TOILETS
Minimum Distance: 150 ft and Maximum Distance: 0.25 miles (1341.67 ft)
CALCULATED DISTANCES
Minimum Distance (ft) = 594.3
Maximum Distance (ft) = 1124.23
PLANNING GUIDELINES for WATER SUPPLY
Minimum Distance: 50 ft and Maximum Distance: 0.25 miles (1341.67 ft)
CALCULATED DISTANCES
Minimum Distance (ft) = 68.2
Maximum Distance (ft) = 415
PLANNING GUIDELINES for NURSERY SCHOOLS
Maximum Distance: 0.67 miles (3595.67 ft)
CALCULATED DISTANCES
Minimum Distance (ft) = 211.13
Maximum Distance (ft) = 730.2
PLANNING GUIDELINES for PRIMARY SCHOOLS
Minimum Distance: 0.25 miles (1341.67 ft) and Maximum Distance: 2 miles (10733.32 ft)
CALCULATED DISTANCES
Minimum Distance (ft) = 281.93
Maximum Distance (ft) = 804.72

R6880 ZE0050 Methods of peri-urban NR information collection, storage, access and management
23
Report for New Development Theme Newdev.shp
Polygon ID: 3
Description: N of Swedru
Total Area (sq.ft) = 202771
ELEVATION
Mean Elevation 1000.00 (ft)
Min Elevation 1000.00 (ft)
Max Elevation 1000.00 (ft)
LAND USE COMPOSITION
Fallow 148861 sq.ft 73.41 %
Year1 Crops 4994.92 sq.ft 2.46 %
Year2 Crops 45968.9 sq.ft 22.67 %
Woodland 0 sq.ft 0.00 %
MINIMUM DISTANCE TO ROAD THEME
Minimum Distance (ft) = 204.63
MINIMUM DISTANCE TO RIVER THEME
Minimum Distance (ft) = 1583.71
PLANNING GUIDELINES for PUBLIC TOILETS
Minimum Distance: 150 ft and Maximum Distance: 0.25 miles (1341.67 ft)
CALCULATED DISTANCES
Minimum Distance (ft) = 0
Maximum Distance (ft) = 574.22
!!!NEW DEVELOPMENT POLYGON IS TOO CLOSE TO PUBLIC TOILETS!!!
PLANNING GUIDELINES for WATER SUPPLY
Minimum Distance: 50 ft and Maximum Distance: 0.25 miles (1341.67 ft)
CALCULATED DISTANCES
Minimum Distance (ft) = 372.13
Maximum Distance (ft) = 1157.6
PLANNING GUIDELINES for NURSERY SCHOOLS
Maximum Distance: 0.67 miles (3595.67 ft)
CALCULATED DISTANCES
Minimum Distance (ft) = 342.48
Maximum Distance (ft) = 889.88
PLANNING GUIDELINES for PRIMARY SCHOOLS
Minimum Distance: 0.25 miles (1341.67 ft) and Maximum Distance: 2 miles (10733.32 ft)
CALCULATED DISTANCES
Minimum Distance (ft) = 230.56
Maximum Distance (ft) = 808.45
R6880 ZE0050 Methods of peri-urban NR information collection, storage, access and management
24
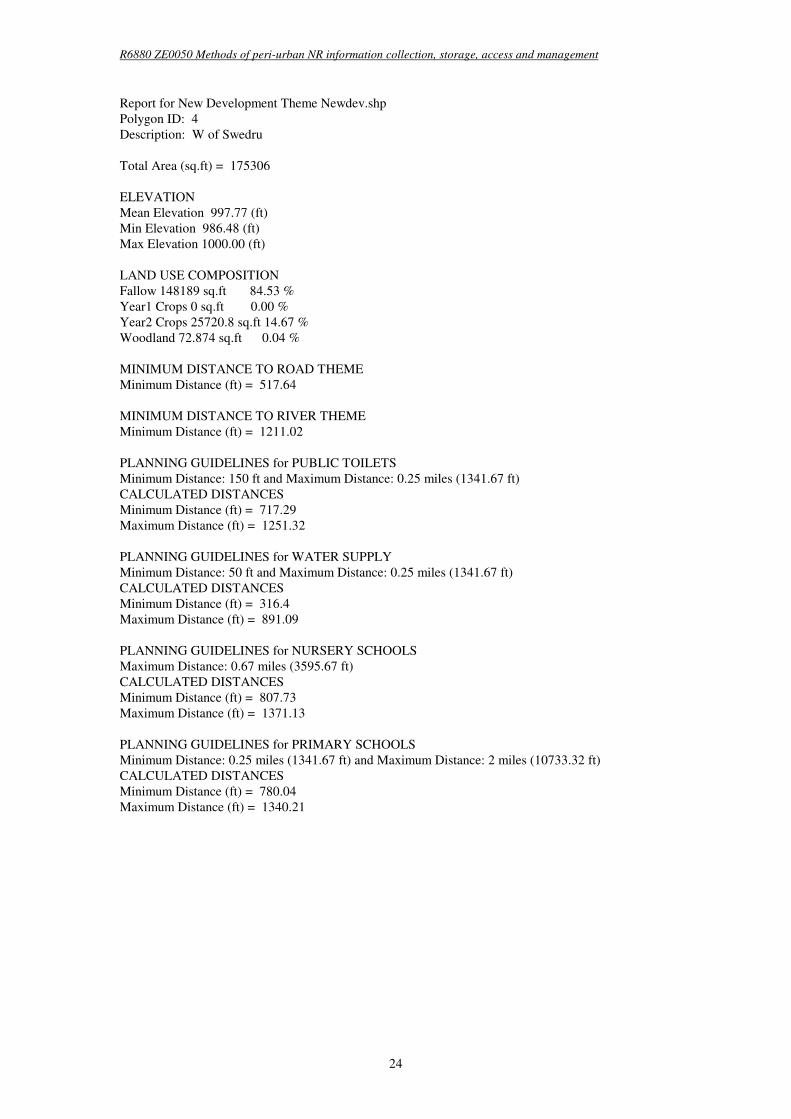
Report for New Development Theme Newdev.shp
Polygon ID: 4
Description: W of Swedru
Total Area (sq.ft) = 175306
ELEVATION
Mean Elevation 997.77 (ft)
Min Elevation 986.48 (ft)
Max Elevation 1000.00 (ft)
LAND USE COMPOSITION
Fallow 148189 sq.ft 84.53 %
Year1 Crops 0 sq.ft 0.00 %
Year2 Crops 25720.8 sq.ft 14.67 %
Woodland 72.874 sq.ft 0.04 %
MINIMUM DISTANCE TO ROAD THEME
Minimum Distance (ft) = 517.64
MINIMUM DISTANCE TO RIVER THEME
Minimum Distance (ft) = 1211.02
PLANNING GUIDELINES for PUBLIC TOILETS
Minimum Distance: 150 ft and Maximum Distance: 0.25 miles (1341.67 ft)
CALCULATED DISTANCES
Minimum Distance (ft) = 717.29
Maximum Distance (ft) = 1251.32
PLANNING GUIDELINES for WATER SUPPLY
Minimum Distance: 50 ft and Maximum Distance: 0.25 miles (1341.67 ft)
CALCULATED DISTANCES
Minimum Distance (ft) = 316.4
Maximum Distance (ft) = 891.09
PLANNING GUIDELINES for NURSERY SCHOOLS
Maximum Distance: 0.67 miles (3595.67 ft)
CALCULATED DISTANCES
Minimum Distance (ft) = 807.73
Maximum Distance (ft) = 1371.13
PLANNING GUIDELINES for PRIMARY SCHOOLS
Minimum Distance: 0.25 miles (1341.67 ft) and Maximum Distance: 2 miles (10733.32 ft)
CALCULATED DISTANCES
Minimum Distance (ft) = 780.04
Maximum Distance (ft) = 1340.21