Embed Size (px)
Citation preview

https://ntrs.nasa.gov/search.jsp?R=19740003190 2018-07-19T15:49:52+00:00Z

NASA CR-132318
FINAL REPORT
SINK-FLOAT FERROFLUID SEPARATOR
APPLICABLE TO
FULL SCALE NONFERROUS SCRAP SEPARATION
Contract No. NAS 1-11793
Prepared for
National Aeronautics and Space AdministrationLangley Research Center
Langley StationHampton, Virginia 23365
Prepared by
Avco Systems DivisionLowell Industrial Park
Lowell, Massachusetts 01851
/

TABLE OF CONTENTS
Section Title Page No.
SUMMARY... ...... . .. .. ..... . S-1
I INTRODUCTION ................. 1
A. Ferrofluid Levitation ............ . 1
B. Structure of the Car Scrapping Industry .. .. 6
1. Sources of Automobiles for Recycling . . 6
2. Processing of Scrap Automobiles . . . . . 8
3. Automobile Shredding Process. ... . . . . 10
4. Nonferrous Metal Recovery from ShreddedAutomobiles ... ....... ... 10
a. Hand-Picking .............. 14
b. Heavy Media Plants . . . . . . . . . . . 14
c. Sweat Separation . . . . .. ..... . 15
5. Economics of Nonferrous Metal Recovery. . . 15
C. Program Plan ...... ...... . . . . 17
II RESULTS ................... . 20
A. Magnet Construction and Evaluation. . . . . . 20
B. Materials Handling System (Separator) . . . .. 21
C. Behavior of Single Objects and Model Mixture . . 35
1. Single Objects .. .... . . .. . .... 35
2. Model Mixture Separations ......... . 39
D. Separation of Car Scrap . . ... . ... . 44
1. Scrap Properties. ............ . 44
2. Scrap Pretreatment ... ....... . 46
-ii-

TABLE OF CONTENTS (Continued)
Section Title Page No.
3. Scrap Separations . .. . . . .. . . 46
a. Procedures ..... . .. . . .. . 46
b. Aluminum-Zinc Separation (Stage A) . . . 47
c. Zinc-Copper Separation (Stage B) . .. 47
d. Non-Metal-Aluminum Separation (Stage C). 51
e. Copper-Steel Separation (Stage D) . . . 51
E. Ferrofluid Recovery . . . . . . . . . . . . 56
III PROCESS DESIGN . . . . . . .. . . . . . . 57
A. Basis for the Plant Design . . . . . . . . . . 57
1. Scrap Supply .... ....... .. .. 57
2. Feed Preparation . . . . . . . . . 58
a. Reshredder . . . . . . .. . . .. . . 61
b. Air Classifier .... .. ...... . 61
c. Magnetic Separators . . . . . . . 62
3. Separations to be Made. . . . . . . . . . . 62
4. Separator . . ........... .. . . . . . . 64
5. Ferrofluid Recovery. . . . . . . . . . . . 64
B. Basis for the Cost Estimates . . . . . . . . . 67
1. CapitalCost . . . . . .. . . . . . . . . 67
a. Magnet Costs . . . . . . . . . . . . 67
b. Conveyor Costs . . . . . . . . . . . . 67
c. Feed Bins . . . . . . . . . . . . . . . 69
d. Ferrofluid Recovery Module . . . . . 69
-iii-

TABLE OF CONTENTS (Concluded)
Section Title Page No.
2. Operating Costs ......... . . . 75
a. Operating Labor . . . . . . . . . . . 75
b. Maintenance ... ...... .. . . . . 75
c. Supplies . . . ... .. ... . . . . 75
d. Utilities . . . . .. . .. . . . . . . 75
e. Insurance . . . . .. . . . . . . . . 76
3. Profitability . .... . . . . . . . . . . 76
C. Plant Design ... ..... . . ..... 76
1. Batch Plant ................ 76
2. Continuous Plant ... ..... ..... 85
D. Discussion. ....... .......... 85
E. Ecological Considerations ... . . . . . . 91
IV CONCLUSIONS AND RECOMMENDATIONS ..... 93
V REFERENCES .................. 95
APPENDIX A THEORETICAL ESTIMATE OF SEPARATION RATEIN FERROFLUID SINK-FLOAT SEPARATOR . . .. A-i
APPENDIX B MAGNET DESIGN . . . . . ........... B-1
APPENDIX C FACTORS FOR ESTIMATING PLANT CAPITALCOSTS . .. . .. .. . .. . . .. . . . . . . C-I
-iv-

LIST OF ILLUSTRATIONS
Figure Title Page No.
1 Magnetization Curve of a Kerosene Base Ferrofluid . 2
2 Forces on a Non-Magnetic Solid Body Immersed in aFerrofluid . . . . . . . . . . .. . . . . . .. . 4
3 Ball of Copper Floating in Ferrofluid Suspended in theGap of a Magnet .. ........ ......... 5
4 Flow Diagram for Ferrofluid Sink/Float SolidSeparation Process .... ...... ..... 7
5 Typical Flow of Discarded Automobiles throughAutomobile Scrap Industry ... . . . . . . . . . 9
6 Typical Process Flow at Automobile Shredder Plant. . 11
7 Automobile Shredder Plant and Ferrous Metal OutputSystem . . . .. . . . . . . . . . . .. . . . . . 12
8 Automobile Shredder Plant and Nonferrous MetalOutput System. .. ................ 13
9 Projected Metal Supply from Automobile Shreddingin 1975 . . . . . . . . . . . . . . . . . . . .. . . . 18
10 Variation of H with Distance from Mirror Plate . . . . 22x
11 Variation of H with Distance from Axis . . . . . . . . 23y
12 Magnetic Field on Vertical Axis of Symmetry of Gap . 24
13 Vertical Magnetic Gradient on Vertical Axis ofSymmetry of Gap .. ..... ... .... 25
14 Model Separator with Cover Plate Removed. . . . . . . 26
15 Model Separator in Laboratory Magnet. . . . . . . . . 27
16 Sketch of Separator . ............... 29
17 Top View of Separator ................ 30
18 Product Removal Conveyors ............. 31
19 Feed Conveyor . . . . . . . . . . . . . . . . . . 32
20 Ferrofluid Separator during Assembly . . . . ... 33
-v-

LIST OF ILLUSTRATIONS (Concluded)
Figure Title Page No.
21 Modified Floats Conveyor ... . . . . . . . . . . . 34
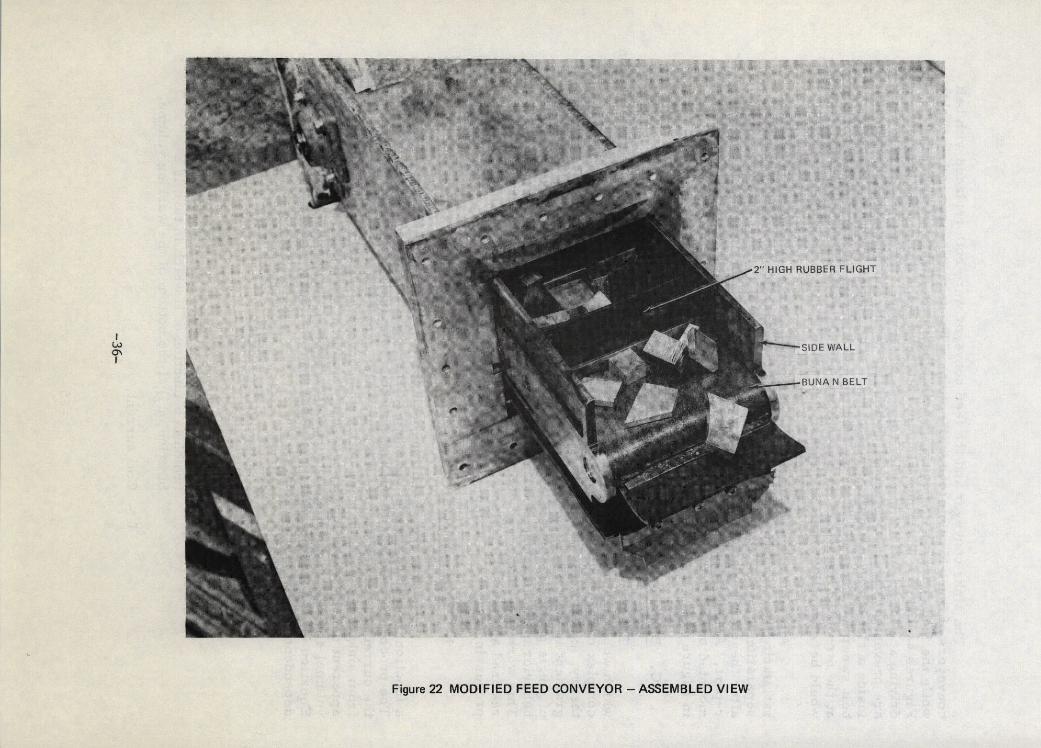
22 Modified Feed Conveyor - Assembled View .. . . . . . 36
23 Modified Feed Conveyor - PartlyDisassembled .. . ............ .... 37
24 Separation System ................. 38
25 Magnetization of Ferrofluid FF 1135 . . . . . . . . . . 40
26 Release Points for Scrap Pieces . . . . . . . . . . . . 42
27 Feed Preparation Sequence . . . . . . . . . . . . . . 60
28 Nonferrous Metal Separation System Material Balance . . 63
29 Ferrofluid Recovery System . . . . . . . . . . . . . 66
30 Estimated Price of Vibratory Conveyors . . . . . . 68
31 Feed Bin Configuration .. ............ . 70
32 Estimated Price of Feed Hoppers .. . . . . . . . 71
33 Estimated Price of Solvent Recovery Stills . . . . . . . 73
34 Estimated Price of Entire Ferrofluid Recovery Module . 74
35 Eight Hour Material Balance - Batch Plant . . . . . . . 77
36 Equipment Layout - Batch Plant . . . . . .. . . . . .. 78
37 One Hour Material Balance - Continuous Plant . . . . 86
38 Equipment Layout - Continuous Plant . . . . . . . . . . 87
A-1 Schematic of Separator . . . . . . . . . . . . . . . . A-4
B-1 Hyperbolic Poles .................. B-2
B-2 Constant Gradient Poles (Front View). . . . . . . . . . B-3
B-3 Constant Gradient Poles (Side View) . . . . . . . . . . B-4
B-4 Constant Gradient Magnet (Front View) . . . . . . . . . B-6
B-5 Constant Gradient Magnet (Side View Along Section A-A) . B-7
B-6 Power Requirements of Magnets . . . . . . . . . B-10
-vi-
LIST OF TABLES
Table Title Page No.
S-1 Materials in Nonferrous Portion of Car Scrap . . . . S-3
I Nonferrous Metals Present in Average Automobile asManufactured and as Processed by Shredder, andPotential Scrap Value . . .. ..... . . . . 16
II Effect of Shape .. . . . ....... . . . . . 41
III Effect of Size . . . . . . . . . . . . . . .. . . . 43
IV Effect of Release Point ............... 43
V Separation of Zinc Alloy and Brass . . . . . .. 44
VI Materials in Nonferrous Portion of Car Scrap . . . . . 45
VII Effect of Apparent Density on Zinc Separation ..... 48
VIII Effect of Fluid Magnetization on Zinc Recovery .... 49
IX Effect of Processing Rate on Zinc Purity . . . .... 50
X Effect of Processing Rate on Aluminum Purity . . . . 52
XI Effect of Apparent Density on Copper Alloy/Steel
Separation ..... ...... ........ . 53
XII Effect of Fluid Magnetization on Copper Alloy/Steel
Separation ..... .. ...... ..... . 54
XIII Separation of "Non-Magnetic" Copper and Steel Alloys . 55
XIV Composition of Non-Magnetic Residue of AutomobileShredding . . . . . . . . . . . . . . . . . . . . . 57
XV Nonferrous Metal Content of Average ShreddedAutomobile ... . .. ........... .. 58
XVI Nominal Composition of Mixed Nonferrous Metals . 61
XVII Basis for Process Design-Experimentally ObtainedSeparation Results .. ............ . 62
XVIII Capacities of Separators .. .. ... . . . . . 65
-vii-

LIST OF TABLES (Concluded)
Table Title Page No.
XIX Size of System Components-Solvent Recovery . . . . . . 65
XX Costs of Piano Hinge Conveyors . . . . . . . . . . 69
XXI Ferrofluid Recovery Module-Cost of Pumps and Tanks. . 72
XXII Ferrofluid Recovery Module-Cost of Stills .. . .. 72
XXIII List of Feed Bins - Batch Plant . . . .. . . . . 79
XXIV List of Conveyors - Batch Plant . . . . . . . . . 80
XXV Capital Costs - Batch Plant . . . . . . . . . . 81
XXVI Operating Costs - Batch Plant One Shift Per Day . . . . 82
XXVII Operating Costs - Batch Plant Two Shifts Per Day . . . 83
XXVIII Operating Costs - Batch Plant Three Shifts Per Day . . . 84
XXIX List of Conveyors - Continuous Plant . . . . . . . . 88
XXX Capital Costs - Continuous Plant ...... . . . . . 89
XXXI Operating Costs - Continuous Plant . . . . . . . . . 90
XXXII Potential Energy Savings in 1975 Due to Recovery ofNonferrous Metals ...... ....... ... 92
B-I Magnetic Characteristics . . . . . . . . . . . . B-8
C-I Direct Cost Elements . . . . . . . .. . . . . . . . C-2
C-II Indirect Cost Elements ............. ... C-3
C-III Plant Building Costs ......... .. . . . . C-4
C-IV Comparison of Cost Ratios Derived by Two CostEstimating Methods ..... .. ........ . C-5
-viii-

Symbols Used in Text*
M - magnetization - emu
Msf - saturation magnetization of ferrofluid - emu
M - magnetization of object immersed in ferrofluid - emu
M': - saturation magnetization of colloidal particles -emu
Mf - magnetization of ferrofluid - emu
F' - magnetic body force per volume of ferrofluidM
FM - magnetic body force per volume of immersed object
H - magnetic field strength - oersted
F - gravitational force per volume on object immersed in ferrofluid
x - horizontal component of magnetic field strength
H - vertical component of magnetic field strengthy
G - magnetic field gradient
g - acceleration of gravity
S - volume fraction of dispersed phase
Ps - density of object immersed in ferrofluid
p - density of ferrofluid
P af - apparent density of ferrofluid
P as - apparent density of object immersed in ferrofluid
r - magnetic field gradient on vertical axis of symmetry of interpole volume
*Symbols used in Appendices are defined where used.
-ix-

SUMMARY
This report describes the work carried out by Avco under NASA Contract
No. NAS 1-11793 to build a ferrofluid levitation separator for recoveringnonferrous metals from shredded automobiles, to evaluate the separator and to
project the economics of this separation process to industrial scale. Thisprogram demonstrates the application of aerospace technology, ferrofluids, to
an important problem in solid waste management.
The scrap separator consists of:
1. An electromagnet designed to generate a region of constant apparentdensity within a pool of ferrofluid held between the magnet poles,over a working volume of 20 cm x 20 cm x 20 cm. A kerosene baseferrofluid, with 500 gauss saturation magnetization, will have an
apparent density of nearly 12 g/cm 3 when the magnet is operated at amaximum power input 63 KW which generates a field gradient of250 oe/cm. This density level is sufficient to float all commonindustrial metals of interest.
2. Conveyors for introducing into the ferrofluid the scrap to be separated.Objects less dense than the apparent density of the ferrofluid float to
the top of the ferrofluid pool where they are removed by an upperconveyor while those more dense sink and are removed by a lowerconveyor. The separation process is thus continuous. Since magneticforces also retain the ferrofluid in the gap of the magnet, conveyorscan be introduced directly into the pool without fluid leakage orsealing problems. The conveyors of the materials handling system havebeen found capable of moving typical automobile scrap at rates over5000 lb/hr.
The behavior of the non-magnetic objects within the separator has been found
to be essentially a function of density and independent of the size or shape of the
objects. There was close agreement (better than 10%) between the density of an
object and the apparent density of the ferrofluid required to float it, for objectsranging in size from 5 cm to 0.6 cm on a side, and of widely different shapes.
The separation of well characterized scrap mixtures was evaluated in the
separator in order to obtain information on the effects of operating parameters or3
the purity of the recovered fractions. Mixed pieces of a zinc alloy ( P = 6. 6 g/cmand of brass ( P = 8.5 g/cm 3 ) fed, at a rate of 370S lbs/hr, into a ferrofluid
pool with an average apparent density of 7. 9 g/cm were completely separated
into two pure metal fractions. An increase in feed rate to 5100 lbs/hr resulted
in only a slight decrease in product purity. These test results demonstrate
conclusively that very high separation rates are achievable by ferrofluid sink-float
separation. With optimal adjustment of operating parameters, the separation is
virtually error free.
S-1

The principal materials present in the "nonferrous" portion of car scrap,and their physical properties are listed in Table I which also lists the rangeof potential values for the pure recovered nonferrous metals. Zinc has thehighest potential total value, followed by copper and aluminum, and stainlesssteel has the lowest total value. In this program most emphasis was accordinglyplaced on zinc separation and least on the separation of stainless steel.
Mixed nonferrous scrap, reshredded to a size of 3 inches or less, andcontaining less than 10% non-metals and magnetic metals, as typically producedby an air classifier or by water elutriation, was found to be a suitable feedfor the ferrofluid separator. The most effective method of processing thisscrap by the ferrofluid method is first to separate aluminum and non-metals fromzinc and heavier metals. Zinc is then removed from the heavier metals (copperand stainless steel) and aluminum from the non-metals.
It was possible to recover a high yield of essentially pure aluminum and zincalloys from mixed, reshredded automobile scrap. When the separator wasoperated at its nominal design capacity of 1 ton/hour, over 91% of the zinc wasrecovered as a product that contained 99. 7% zinc alloy and over 95% of thealuminum was recovered as a product that contained 99. 7% aluminum alloy. Ineach instance, the major impurity was copper wire which is not harmful. Samplesof these materials have been sent to smelters for analysis, and each fractionhas been reported to be well within specification limits and of a purity whichcan command a premium price on the secondary metals market.
The recycling of solid wastes, in general, is a formidable problem largelybecause of the low intrinsic value of the discarded material, which makes itsprocessing economically unattractive. Junk automobiles, however, are highvalue solid waste because of their high metals content. The 8 million carsdiscarded annually contain about 650, 000 tons of nonferrous metals which arenot now being fully recovered and recycled, for lack of an efficient processto do so. The potential worth of the discarded nonferrous metals ranges for$6 to $11 per car, depending on the market price of the metals.
Based upon the separation test data obtained during the experimental phaseof the program, as well as the successful recycling of ferrofluid recovered fromscrap, the recovery of nonferrous metals from automobile scrap promises to bea profitable process. The effect of the method of operation (batch versuscontinuous) and plant capacity on capital and operating costs was analyzed. Asmall batch plant capable of processing 2, 000 tons of scrap per year (equivalentto 300 cars/day), would require a capital investment of about $360, 000 and payouttime of 2.8 years, assuming a conservative added value of $150/ton to the processedmaterial. A continuous plant capable of processing 25, 000 tons/yr of scrap peryear would require a capital investment of $925, 000, but would have an extremelyattractive payout time of only 0. 6 years.
The ferrofluid separation process for nonferrous metal scrap described abovehas important ecological impact. There would be greater economic incentive torecover abandoned automobiles. Recycling of the recovered metals would resultin a net reduction in the electrical energy requirements of the Nation by over fivebillion kwh/yr. The process should also be applicable to the recovery of nonferrousmetals from municipal waste and should be able to defray in part the costs of theoverall process.
S-2

TABLE S-1
MATERIALS IN NONFERROUS PORTION OF CAR SCRAP*-
Approximate Range of Potential ValuePhysical Densities Estimated Content of Per Car
Material g/cm 3 Avg Shredded Auto (lbs) Min Max
Non-metals 1. 00 to 2. 60 6 - -
Aluminum Alloys 2. 65 to 2. 75 10 1.00 1.40
Zinc Alloys 6.60 to 6.70 40 2.80 7.20
Copper Alloys 8. 30 to 8. 90 5 1.50 2. 00
Stainless Steel 7. 80 to 8. 00 2 0.20 0. 36
Total 63 lbs $5.50 $10.96
Weighed average value of mixed metals $0.096 to $0. 192 - per lb$192 to $384 - per ton
*Data summarized from Table I.

I. INTRODUCTION
This report describes the work carried out by Avco under NASA Contract
No. NAS 1-11793 to build a ferrofluid levitation separator for recoveringnonferrous metals from shredded automobiles, to evaluate the separator and to
project the economics of this separation process to industrial scale. This
project was carried out in the period June 28, 1972 to June 28, 1973 by the
Avco Systems Division at Lowell, Massachusetts.
A. Ferrofluid Levitation
The separation of nonferrous metals by the ferrofluid levitation process
uses these magnetic liquids in a suitable magnetic field to float or levitate non-
magnetic objects having a higher density than the ferrofluid. By opposing the
normal gravitational force on an object with this levitating force, it is possible
to separate objects of different densities; the less dense objects float in the
ferrofluid pool while the denser objects sink. By this method it is possible to
separate nonferrous metals of different densities from each other.
In search of a simple means of simulating the effect of reduced gravity
on nucleate boiling of a liquid, Papell of NASA Lewis Research Center observed
that he could suspend an oleic acid stabilized dispersion of subdomain magnetite
in the gap of an electromagnet. While colloidal magnetic materials have been
known for a long time, this was the first time that these colloidal suspensions
were considered as an apparently magnetically responsive liquid continuum( 1 , 2)- .
The impact of Papell's work is that while it is theoretically possible to consider
the existence of a homogeneous ferromagnetic liquid(3 ), nouch liquid is known
to exist in spite of extensive attempts at its preparation4,' 5 . These colloidal
dispersions also known as ferrofluids are, therefore, a unique class of liquids
in which it is possible to induce substantial magnetic forces resulting in liquidmotion(6).
Ferrofluids are very stable suspensions of single domain magnetic
particles. The suspended particles are so small (typically less than 150 a) that
they do not settle under gravity or interact even in the presence of a strong
magnetic field. The magnetic response of a ferrofluid results from the couplingof individual particles with a substantial volume of the bulk liquid. This
coupling is facilitated by a stabilizing agent which absorbs on the particle surface
and is also solvated by the surrounding liquid.
The magnetic properties of a ferrofluid can best be described byconsidering the particles in a ferrofluid to behave as an assembly of non-interacting
magnets( 7 ). In the absence of a magnetic field their moments are randomly
oriented and the ferrofluid has no net magnetization. In a magnetic field, the
particle moments tend to align with the field resulting in a net induced fluid
magnetization, M. The magnetization increases with increasing field until a
saturation value is observed as shown in Figure 1. Under these conditions the
particle moments are all aligned in the direction of this applied field. The
saturation magnetization of the ferrofluid, Msf, is given by
Msf = M* (1)
*Superscripts refer to References listed on page 95.
-1-

600
eM-
500
400
z
300N
.Uz
200
100
00 1 2 3 4 5 6 7 8
82-4011 MAGNETIC FIELD (K gauss)
Figure 1 MAGNETIZATION CURVE OF A FERROFLUID
-2-

where E is the volumetric concentration of magnetic colloid and M* is theeffective saturation magnetization of the colloidal particles. As soon as themagnetic field is removed, the particle moments become randomly orientedagain because of thermal motion. The ferrofluid, therefore, has no residualmagnetization and does not exhibit hysteresis.
Because the particles do not interact, a ferrofluid remains a liquidin a magnetic field. A minor increase in viscosity (which can be made assmall as desired) is noted because of the interaction of the particles with thefield. It is to be emphasized that ferrofluids are very different from classicalmagnetic clutch fluids which become solid in a magnetic field, because theyare composed of micron size particles which do interact wnen aligned by thefield.
A ferrofluid placed in a non-homogeneous magnetic field experiencesa net magnetic force wnich tends to drive it, like all magnetizable objects,towards regions of highest magnetic field intensity. The magnetic body force,
FpM, per unit volume of fluid, V, is proportional to the induced magnetic dipolemoment, M, and to the applied field gradient v H(6):
F' = MY H dynes/cm 3 (2)
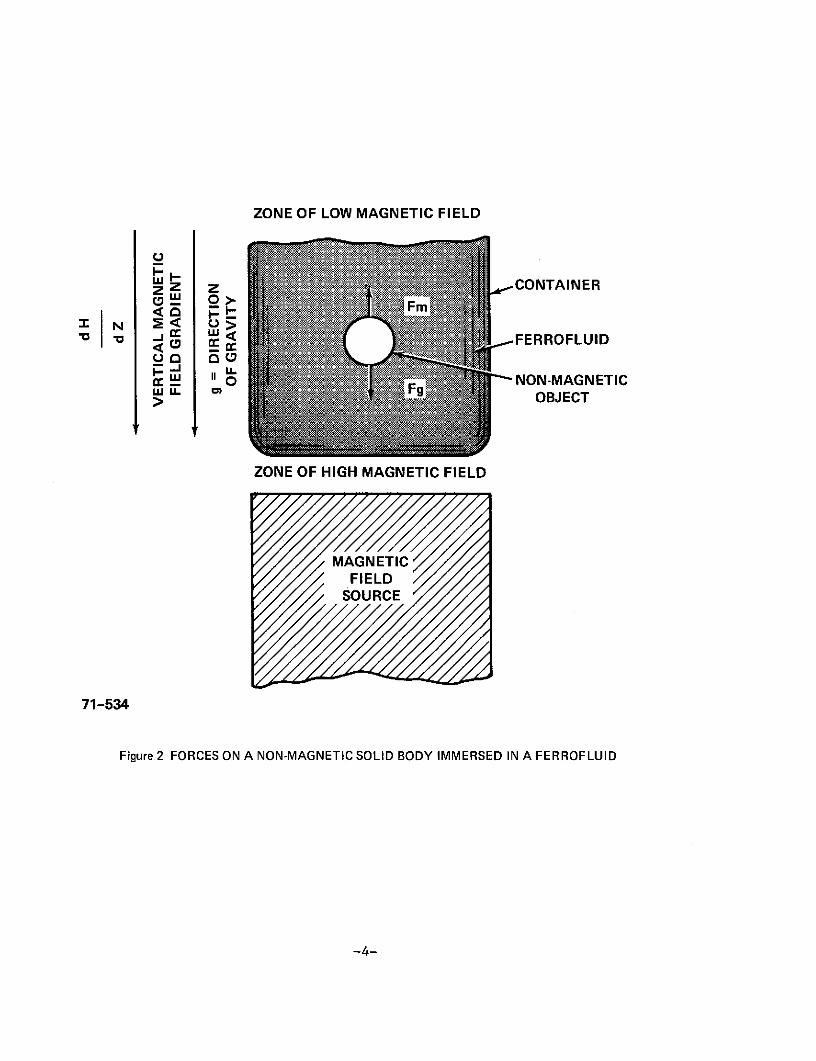
When a non-magnetic object is immersed in a ferrofluid in thepresence of a magnetic field gradient, as shown in Figure 2, there is amagnetic force, FM, on the object which tends to expel it to a region of minimumfield. This magnetic body force is equal to, but opposite in sign to F, definedabove( 8 ). If the magnetic field gradient is parallel to the direction of gravity,the magnetic body force can be used to cancel the gravitational body force, Fg,on a non-magnetic object immersed in a ferrofluid. Consequently an objectof high density can float in a ferrofluid of low density when Fm> Fg. Fg isgiven by Archimedes' Law:
F = (P - f) g (3)
This effect is shown in Figure 3 where a copper ball with a density, P of8.90 gr/cm3 , floats on a ferrofluid with a density Pf of 1.14 gr/cm3 , placedin a gradient field of 1500 oe/cm, established by the tapered poles of a permanentmagnet. The fluid magnetization, 417 M, is 200 gauss. In this case, the productM V H (24, 000 dynes/cm 3 ) is high enough to float even the densest metal,osmium, which has a density of 22. 48 gr/cm3 .
When the object immersed in the ferrofluid is not totally non-magneticthe above treatment needs to be modified somewhat. The details of thismodification are discussed in Appendix A. If the magnetic dipole moment ofthis object is smaller than that of the ferrofluid, it is still forced from the regionof high field to the region of low field. The magnitude of the force is smaller,however, than it would have been, had the object been completely non-magnetic.If the magnitude of the objects' magnetic dipole moment is greater than thatof the ferrofluid, it will move to the region of high magnetic field and force theferrofluid to the region of low field.
-3-
ZONE OF LOW MAGNETIC FIELD
2 zW CONTAINER
F * -1 w q FERROFLUID
u I, 0 NON-MAGNETIC> OBJECT
ZONE OF HIGH MAGNETIC FIELD
MAGNETICFIELDSOURCE
71-534
Figure 2 FORCES ON A NON-MAGNETIC SOLID BODY IMMERSED IN A FERROFLUID
-4-

Figure 3 BALL OF COPPER FLOATING IN FERROFLUID SUSPENDED IN THE GAP OF A MAGNET
-5-

A pool of ferrofluid in the gap of a regulated electromagnet thus becomes
a liquid whose apparent density can be continuously varied at will, by controllingthe current supply to a suitably designed field source. Thus, solid objects ofdifferent densities can be made to float or sink simply by varying the electricalcurrent to the magnet. In this context it is useful to define a ferrofluid's apparentdensity, P af' as:
P = + M H (4)af = f g
From Equations 2 and 3 it can be seen that objects having a density lower thanP af, will float in the ferrofluid, while those having a density greater than Paf,
will sink in it. By controlling the magnetic field and thus M and v H, P af canbe set to a value intermediate between the densities of the objects immersedin the pool, and their separation thus accomplished.
The ferrofluids which Avco anticipates will be used for the separationof scrap metals have a kerosene base. They are made by a continuous processinvolving precipitation of magnetic iron oxide particles and their dispersion intothe base liquid. Economic studies indicate that the cost of ferrofluid made bythis process will be about $30 per gallon when demand rises to several thousandgallons per year.
Because the major component of these ferrofluids is kerosene, theirflammability characteristics will be similar to kerosene and accordingly theprecautions used when dealing with kerosene must also be applied to the sefe rrofluid s.
This separation technique is coupled to a means of removing theferrofluid from the separated objects. Since the ferrofluid is too valuable todiscard and the scrap must be oil free to be readily saleable. For kerosenebased ferrofluids this can be accomplished by washing the objects with achlorinated hydrocarbon solvent or a hydrocarbon solvent which has a lowerboiling point than the kerosene. The ferrofluid is recoverable by boiling awaythe solvent. A schematic of such a complete process is shown in Figure 4.
B. Structure of the Car Scrapping Industry
1. Sources of Automobiles for Recycling
The automobile recycling process starts when someone decides thata particular vehicle is no longer economical to repair, and that it cannot besold as a workable machine. Currently it is estimated that 8 million cars arebeing discarded yearly, with 10 million expected by 1975. The average automobilein use today is about 6 years old. Although the discard rate in any year isperhaps more closely related to the rate of manufacturing 6 years prior, it hasbeen found that the rate for any year falls quite consistently between 7% and 10%of the total registrations for that year( 9 , lG). Thus, the availability of discardedcars can be estimated for any year quite accurately.
-6-

FLOATS iCLEANDEGREASER SEPARATED
FLOATSAVCO
MIXEDSOLID FERROFLUID _
FEED SINK-FLOATSEPARATOR
SINKS CLEANDEGREASER SEPARATED
SINKS
ME STLLL
w w
WASH LIQUID FERROFLUIDMAKE-UP RECOVERY
MAKE-UP STI LL
FERROFLUID RECYCLE FERROFLUID
Figure 4 FLOW DIAGRAM FOR FERROFLUID SINK/FLOATSOLID SEPARATION PROCESS
-7-

Currently, about 7 million discarded automobiles enter the recyclingprocess, and the great bulk of them, around 5 to 6 million at present, eventuallyend up as shredded metals. The remaining 1 million are simply abandoned bytheir owners in their backyards, in the country, or on city streets, creating amajor disposal problem for the communities. They not only represent a largewastage of needed metal resources but also spoil the appearance of the landscapefor the public as a whole. It has been variously estimated that there are between5 and 20 million such abandoned automobiles around the countryside, with about9 million appearing the most probable value(11).
2. Processing of Scrap Automobiles
The typical flow of scrap automobiles through the recycling processis shown in Figure 5. Normally the cycle starts at an auto wrecker or dismantler,to which the automobile is driven towed or trucked. There are an estimated7, 000 to 10, 000 such concerns(ll), most of which are small operations, andmany constitute spare-time occupations of their owners. The wrecker will removevaluable parts himself for sale directly to users or rebuilders, or leave thehulk in his yard for customers to scavenge. Almost always the wrecker willremove the radiators and batteries, which he will collect and ultimately sell bythe truckload to established scrap metal dealers. Most also remove the enginesand transmissions, which they may break apart themselves for sale as scrap, orthey may sell by the truckload to a scrap specialist. For safety, most alsoremove the gasoline tank.
Ultimately the wrecker must dispose of the old hulks in order tobring in new ones. Most wreckers sell their hulks to a shredder plant eitherdirectly or through an intermediary. A few still cut up the hulks with torches andsell the resulting steel to a dealer. Some have large shears in which they cutup the hulks for sale as sheared stock. Some sell the hulk to dealers who havesuch large shears, or have equipment for pressing the hulk into the dense blockcommonly called the "No. 2 Bundle". The latter application requires that thehulk first be burned to rid it of combustible material. The No. 2 bundle isdisappearing as a means of recycling automobiles both because open burning isno longer acceptable to most communities and because technology changes inthe steelmaking process have made this relatively contaminated form of steel
scrap less desirable. It is being replaced by the shredded product.
Shredder operators pay for the hulks on the basis of their net weightas offloaded at their plant. Thus, the wrecker or his intermediary must pay thecosts of transportation. Wreckers located 100 miles or less from a shreddermay simply load four to ten hulks onto an old truck or automobile carrier andtake the load to the shredder. For longer distance this is uneconomical, andmore hulks must be taken at a time. For this purpose, the hulks are flattenedto a thickness of 18 to 24 inches. Twenty to thirty such hulks can be stackedon a flatbed trailer, and larger wreckers may ship 40 to 50 in a railroad flatcar.
Flattened hulks can now be brought in economically from distances
up to 400 miles away from a shredder. Even a small increase in the amount ashredder could pay for the hulk would extend this range substantially further,since additional mileage is relatively inexpensive compared to the fixed costsof preparation, loading and offloading. The Avco ferrofluid nonferrous metalsseparation system promises to increase the yield a shredder operator receives for
his processed scrap, and thereby permit an increase in the price he pays for hulks.
Hulks now too far away, then should begin to appear at the shredders, with beneficialresults accruing to the nation's economy, its countryside, and its people.
-8-

AUTOMATTERIESBILES
AUTOMOBILE RADIATORS METALSWRECKER ENGINE BLOCKS,
STRIPPED yHULKS STRIPPED
r HULKS
f DUMPNON-FLATTENED FLATTENER
HULKSOPEN-BURNING I
AREA OR LINCINERATOR FLATTENED
HULKS
INCINERATEDHULKS
HAULERIN-HOUSE
SHEAR SEPARATOR
ORBALER
SHREDDEDSHEARED& SHREDDER NONFERROUSBUNDLED STEEL PLANT METALSAND PURCHASER
OR NON-METALSNO. 2 BUNDLES
SHREDDEDFERROUSMETALS DUMP
STEELINDUSTRY
82-4025
Figure 5 TYPICAL FLOW OF DISCARDED AUTOMOBILES THROUGHAUTOMOBILE SCRAP INDUSTRY
-9-

3. Automobile Shredding Process
A landmark development in the recycling of automobiles was the
advent of the automobile shredder in the late 1950's. In this process, the entire
automobile, stripped of its valuable parts and often the engine and transmission,
is broken up into fist-sized pieces in giant hammermills. The automobile enters
the shredder as a recognizable hulk; it leaves the shredder as a mixture of
fist-size pieces of steel, iron, dirt, rubber, fabric, and the nonferrous metals --
copper, zinc, aluminum, etc., -- on a conveyor belt. As of 1970, there were
in the United States nearly 100 such plants, with capacities ranging from 12, 000
cars/year to up to 300,000 cars/year, processing an estimated 5.4 million
discarded automobiles per year(12). It has been projected that by 1980 there
may be up to 200 such plants, processing 10 million automobiles/year?
As shown in Figure 6, the scrap metal from the shredders first
undergoes magnetic separation, which diverts most of the ferromagnetic material
into a separate stream where it is collected for shipment directly to the smelters
without further processing. The residual stream, commonly called the "dirt
stream" contains a mixture of dirt, fabrics, rubber, plastics, and, of interest
to this work most of the nonferrous metals. The processes now used for
separation and recovery of these metals, and the application of the Avco process
to this task, will be described in later sections.
Shredding plants are large capital-intensive operations, with
installed costs ranging from around $300, 000 for the smallest plants to several
million dollars for the largest(10). Because of the high fixed costs of plant
ownership, the operator is under great pressure to keep the plant working
steadily, and to recover every possible dollar from its products. When runningnear to capacity, however, such plants offer a lower total cost per pound of metal
produced than the older technique, while delivering a more saleable product ( 1 0 ).
The economies from their operation, coupled with a product price equal to or
greater than that of the older forms of scrap, means that they can support a
higher price for the hulks delivered to them.
A typical automobile shredding plant, that of Tewksbury Metals Company,
Tewksbury, Mass., is shown in Figures 7 and 8. This plant shreds 250-300 hulks
per day. In Figure 7 a hulk is shown being lifted into the input hopper of the
shredder. In Figure 7 is shown the ferrous metal system, with a magnetic separator
picking up only ferrous metals which are then transported by a series of conveyorsto rail cars waiting in the background. In Figure 8, the "dirt" and nonferrous
metals are diverted to a side stream at the magnetic separator. After an air
classifier which removes most of the dirt and fluff, the mixed nonferrous metals
are stored awaiting sale or further processing.
4. Nonferrous Metal Recovery From Shredded Automobiles
The principal product of the shredder plant is shredded steel, of
which there is approximately a ton for each hulk processed. The secondary product,
recovered in part by some operators, and potentially recoverable in its entirety
by all operators, is the nonferrous metal -- zinc, aluminum, copper and stainless
steel -- of which there is 50-60 lbs in each hulk as it is processed by a shredder.
-10-

INCOMINGAUTOMOBILE
HULKS
RECEIVING&
WEIGHINGSTATION
INVENTORY
TIRES &INSPECTION GAS TANKS DUMP
STATION (IF PRESENT)
SHREDDER
DIRT, NON-METALS,SHREDDED FERROUS&NONFERROUS METALS
ON CONVEYOR
SHREDDED SHREDDED MAGNETICFERROUS METAL FERROUS SEPARATORINVENTORY METAL
DIRT, NON-METALS, SHREDDEDNONFERROUS METALS ON CONVEYOR
HAND SHREDDEDHANI IDENTIFIABLE
PICKING IDENTIFIABLE COPPERSTATION COPPER PIECINVEN
TORY
DIRT, NON-METALS, SHREDDED NONFERROUS METALS(LESS SOME COPPER) ON CONVEYOR
DIRT, AIRDUMP NON-METALS CLASSIFIER
MIXEDSHREDDEDNONFERROUS METALS
MIXEDSMIXED NONFERROUS METALS
NONFERROUS METALS FOR FURTHER
824027FOR SALE IN-HOUSE SEPARATION82-4027
Figure 6 TYPICAL PROCESS FLOW AT AUTOMOBILE SHREDDER PLANT
-11-

r,
Figure 7 AUTOMOBILE SHREDDER PLANT AND FERROUS METAL OUTPUT SYSTEM
Photo courtesy ofTewksbury Metals Co.Tewksbury, Mass.

Figure 8 AUTOMOBILE SHREDDER PLANT AND NONFERROUS METAL OUTPUT SYSTEM
Photo courtesy of
Tewksbury Metals Co.Tewksbury, Mass.

None of the existing commercial techniques, nor a combinationof them, is a fully satisfactory solution to the problem. Ferrofluid nonferrousmetals separation system promises to be less costly than combination of
presently available processes, to be far more versatile, and to produce separatedproducts of greater purity and sales value. By increasing the profitability ofautomobile shredding operations, it will ultimately lead to the processing ofstill larger quantities of abandoned automobiles with the resultant added yieldof needed metals and concomitant clearing of the landscape.
The nonferrous metals are being recovered to some extent byshredder operators now, but there remains much room for improvement. Almost
all, station one or more men on the "dirt stream" conveyors to pick out the
recognizable nonferrous metal parts -- in particular, parts of copper heaterand air conditioner cores. Many operators then dump the residual material,considering its value to be less than the cost of further recovery. Others attemptto remove much of the non-metallic material by air or water classification then
sell the residual mixed metals to a central processor, of which there are twoor three in the country. The most advanced shredder operators, and the central
processors, attempt to separate the mixed metals by a variety of techniques,including further hand-picking, heavy media separation, and selective melting.
a. Hand-Picking
Hand-picking as described above, is used to some extent bynearly all shredder operators. However, it permits the recovery of only 25%or less of the available metals due to the difficulty of telling one metal from
another visually at high flow rates. It is, of course, highly labor-intensive,and therefore unsuitable for large-scale operations.
b. Heavy Media Plants
Heavy media plants are an application of long standing mineral
beneficiation technology to the scrap industry, in which a slurry of finely ground
material, typically silicon-iron or magnetite in water, comprises a fluidmedium of a density well above that of water, permitting a sink-float separation
based on density. Normally such slurries are limited to a maximum specific
gravity of about 3. With these systems it is possible to separate most non-
metallics, such as plastics and rubber, from a dirt stream, and to separate
aluminum (specific gravity 2. 7) from the other metals. However, zinc (s. g. 7. 1),stainless steel (s. g. 7. 9), brass and copper (s. g. 8. 3-8. 9) remain as mixed
metals in the sink product. The major drawback, of course, is that the process
can remove only the aluminum, while leaving all other metals mixed. Furthermore,
the process is troublesome to run, and all its products, both "sinks" and
"floats", are coated with the medium, which is difficult to remove and affects
the purity of the metals if left on. Therefore, an additional cleaning process
is required. A typical plant purchased new today would have an installed cost
in excess of $300, 000.
-14-

c. Sweat Separation
Sweat separation, or selective melting, permits the separationof the metals on the basis of their different melting points. It is used by someshredder operators and central processors to recover zinc from the mixedmetals, and at least one operator is known to be using this technique to separatealuminum as well. In a typical case, the sink product from a heavy mediaoplant ,is run through a furnace just hot enough to melt the zinc (melting point 420 C)but not the residual aluminum (m. p. 660 oC); copper (m. p. 1083 C). The zincpours out and is cast into ingots, while the "non-meltables" are collected andeither disposed of or subjected to further manual separation.
The major problem with this process is the cross-contaminationof one metal with the others, adversely affecting the value of all. For instance,some lead (m.p. 3270C) from body fillers, if not also from batteries, will bepresent in the mixtures and will melt into the zinc, seriously affecting its purity.Temperature control is imperfect, and therefore some copper or aluminum fromhot spots is likely to melt into the zinc, again affecting its purity. Zamac, apremium grade of zinc alloy commonly used in automobile die castings, costssignificantly more than most "pure" zinc grades. Once it has gone through thesweat separation process it is degraded to a secondary zinc value whereas if itcould be recovered intact, it would still command a premium price. The residualnon-melting meitals -- aluminum, if present, copper, and stainless steel -- arecoated with zinc, making further visual separation virtually impossible anddegrading their values even if they could be separated.
There is yet another potential by-product of the sweat separationprocess, albeit quite undesirable -- smoke and air pollution. The metalsprocessed in the ovens are likely to be somewhat dirty, and they may be oil-contaminated. Modern installations of such ovens must have elaborate stack-cleaning systems, further adding to their costs and operating difficulties. Atypical plant purchased new today would have an installed cost, including the air-pollution equipment, in excess of $100, 000, and would be capable of performingone metal separation at a time.
The ferrofluid levitation process by contrast, is capable ofseparating all the nonferrous metals, and producing each of them in a morepure form. In the process, it contributes no environmental pollution of its own.
5. Economics of Nonferrous Metal Recovery
The nonferrous metal content of scrapped automobiles and its valueis given in Table I. The price ranges for the various metals reflect fluctuationsin the market demand for these metals. The historical trend in recent yearshas been for scrap metal prices to rise, it is therefore probable that the uppervalues rather than the lower one will prevail in the future. The value of thesteel recovered from a typical automobile has ranged in recent years from about$35 to $60 per ton. Although the value of the recoverable nonferrous metals ismuch smaller than the value of the steel, the profitability of nonferrous metalrecovery promises to be much higher. The recovery of these metals should thereforehave a significant impact on the profitability of automobile scrapping, and thusprovide additional incentives for procuring abandoned cars.
-15-

TABLE I
NONFERROUS METALS PRESENT IN AVERAGE AUTOMOBILE
AS MANUFACTURED AND AS PROCESSED BY SHREDDER,
AND POTENTIAL SCRAP VALUE
Potential
Average Average Price Range as Scrap ValueContent/Car Content/Hulk Separated Scrap(2 ) Per Hulk
Metal as Manufactured(l) as Shredded( 2 ) Min. Max. Min. Max.
Zinc 54 Ib 40 Ib $.07/lb $.18/lb $2. 80 $ 7.20
Aluminum 51 lb 10 lb $. 10/lb $.14/lb 1.00 1.40
Copper 32 lb 5 lb $.30/1b $.40/lb 1.50 2. 00
Stainless Steel 2 lb 2 lb $. 10/lb $. 18/lb .20 .36
TOTAL 1391b 57 lb $5. 50 $10. 96
Weighted Average Value of Mix: Per lb - $.096 $.192
Per ton - $192 $384
Conservative Nominal Value as Separated $250/ton
Maximum Value as Mixed Metals(2 ) $100/ton
Minimum Probable Increment from Separation $150/ton
Sources:
(1) Zinc, Copper, Aluminum per Karl Dean, Bureau of Mines, "Dismantling a TypicalJunk Automobile to Produce Quality Scrap", RI No. 7350, December, 1969.Stainless Steel, Avco Conservative Estimate.
(2) Avco Estimates based upon interviews with personnel from four leading automobile
shredding plants.
-16-
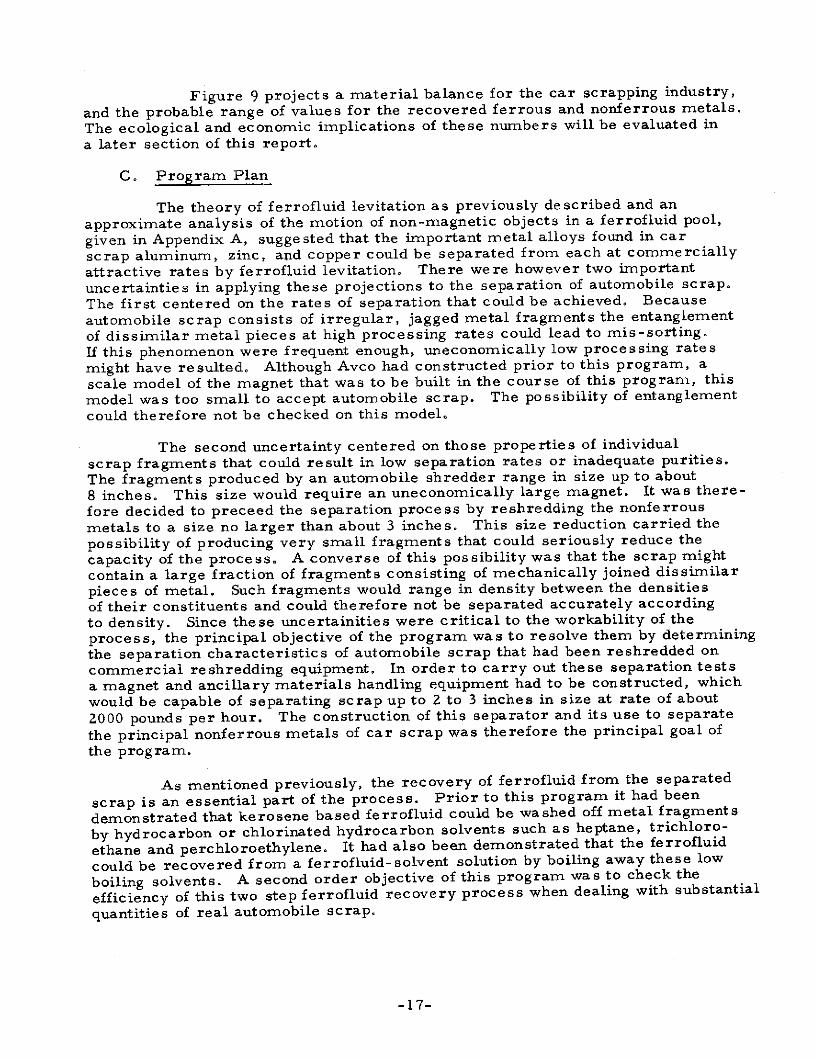
Figure 9 projects a material balance for the car scrapping industry,
and the probable range of values for the recovered ferrous and nonferrous metals.
The ecological and economic implications of these numbers will be evaluated in
a later section of this report.
C. Program Plan
The theory of ferrofluid levitation as previously described and an
approximate analysis of the motion of non-magnetic objects in a ferrofluid pool,
given in Appendix A, sugge sted that the important metal alloys found in car
scrap aluminum, zinc, and copper could be separated from each at commerciallyattractive rates by ferrofluid levitation. There were however two important
uncertainties in applying these projections to the separation of automobile scrap.
The first centered on the rates of separation that could be achieved. Because
automobile scrap consists of irregular, jagged metal fragments the entanglement
of dissimilar metal pieces at high processing rates could lead to mis-sorting.
If this phenomenon were frequent enough, uneconomically low processing rates
might have resulted. Although Avco had constructed prior to this program, a
scale model of the magnet that was to be built in the course of this program, this
model was too small to accept automobile scrap. The possibility of entanglement
could therefore not be checked on this model.
The second uncertainty centered on those properties of individual
scrap fragments that could result in low separation rates or inadequate purities.
The fragments produced by an automobile shredder range in size up to about
8 inches. This size would require an uneconomically large magnet. It was there-
fore decided to preceed the separation process by reshredding the nonferrous
metals to a size no larger than about 3 inches. This size reduction carried the
possibility of producing very small fragments that could seriously reduce the
capacity of the process. A converse of this possibility was that the scrap might
contain a large fraction of fragments consisting of mechanically joined dissimilar
pieces of metal. Such fragments would range in density between the densities
of their constituents and could therefore not be separated accurately according
to density. Since these uncertainities were critical to the workability of the
process, the principal objective of the program was to resolve them by determining
the separation characteristics of automobile scrap that had been reshredded on
commercial reshredding equipment. In order to carry out these separation tests
a magnet and ancillary materials handling equipment had to be constructed, which
would be capable of separating scrap up to 2 to 3 inches in size at rate of about
2000 pounds per hour. The construction of this separator and its use to separate
the principal nonferrous metals of car scrap was therefore the principal goal of
the program.
As mentioned previously, the recovery of ferrofluid from the separated
scrap is an essential part of the process. Prior to this program it had been
demonstrated that kerosene based ferrofluid could be washed off metal fragments
by hydrocarbon or chlorinated hydrocarbon solvents such as heptane, trichloro-
ethane and perchloroethylene. It had also been demonstrated that the ferrofluid
could be recovered from a ferrofluid-solvent solution by boiling away these low
boiling solvents. A second order objective of this program was to check the
efficiency of this two step ferrofluid recovery process when dealing with substantial
quantities of real automobile scrap.
-17-

INPUT10,000,000 CARSI
100- 150SHREDDERS
MAGNETICSEPARATION
STEEL MIXED NONFERROUS METALS10,000,000 TONS 280,000 TONS
VALUE VALUE$350,000,000 TO $750,000,000 $17,000,000 TO $27,000,000
SEPARATION
ALUMINUM ZINC COPPER AND49,000 TONS 196,000 TONS STAINLESS STEEL
34,000 TONS
VALUE$54,000,000 TO $110,000,000
Figure 9 PROJECTED METAL SUPPLY FROM AUTOMOBILE SHREDDING IN 1975
-18-

The information on permissible processing rates, the purities of thevarious metal fractions and the extent of ferrofluid recovery was to providethe data base for an economic analysis of commercial recovery of thesemetals. The preliminary design of a ferrofluid levitation process and itseconomic analysis was the second major goal of the program.
The program was structured into three major tasks.
Task 1
The goal of this task was to design, develop and construct themagnet and its ancillary scrap handling equipment.
Task 2
The goal of this task was to verify the accuracy of the magnet designand to carry out the various separations of interest. Although it was fullyexpected from ferrofluid theory that this separator could separate individualmetal pieces differing in density by 10%, with essentially 100% accuracy, it wasdecided to incorporate as a sub-task the separation of metal fragments differingwidely in size and shape in order to prove conclusively the independence of theseparation on these factors and thus its dependence only on density. Likewisea sub-task to separate model mixture of non-entangling scrap was incorporated,to verify the expected high separation rates in the absence of entanglement.Having verified the separability of individual scrap pieces and the separability ofnon-entangling mixtures, any deviations observed with actual car scrap couldthen be safely attributed to peculiarities of the scrap rather than to deviationsfrom the expected accuracy of the process. The final and most importantobjective of this task was to study the separation of nonferrous reshredded scrapfrom automobiles to determine processing rate, degrees of separation, andferrofluid removal.
Task 3
Based on the results of Task 2, the preliminary design of a completeplant for separating the nonferrous metals of car scrap, was to be carried out.An economic and ecological analysis of the plant was a part of this design.
-19-

II. RESULTS
A. Magnet Construction and Evaluation
The general objective of this task was to design and construct a magnetwhich could accommodate and magnetize a body of ferrofluid sufficiently large,to carry out the separation of 2-3 inch scrap fragments. The design goalsrequired to meet this objective were to construct a magnet that could magnetizea cubic region of space (the working volume) no less than 6" on a side, with aconstant magnetic field gradient sufficiently large to produce an apparent densityin a ferrofluid of up to 8 g/cm 3 . In order to provide a margin of safety, the"working volume" was actually designed to be 8" on a side. Part of this extraspace, as will be seen later, was used to accommodate the scrap handlingmechanisms. Equation (4) shows that for ferrofluids approaching saturation, theapparent density of a ferrofluid varies linearly with the imposed magnetic fieldgradient. In order to sort objects accurately, the apparent density variations ina ferrofluid pool must be considerably smaller than the density differences amongthe objects. For separating the nonferrous metals of car scrap this implied thatthe imposed magnetic field gradient throughout the ferrofluid pool would have tobe constant to within 10%. With available ferrofluids a gradient of 250 oe/cmwould be large enough to create an apparent density of 8 g/cm 3 in the ferrofluidpool. These were the specific objectives of the design.
The design of the magnet was based on hyperbolic pole pieces describedin detail in Appendix B. The magnet was constructed by Industrial Coils, Inc.and the blueprints of its constituent parts are being supplied as Attachment 1 tothis report. The design of the pole pieces of this magnet (Attachment 1, drawing3132) was a direct scale up of pole pieces that Avco had constructed and testedprior to the initiation of this program. Based on these tests it was expectedthat the large magnet constructed for this program would have a cubic region8 inches on a side in which the vertical magnetic field gradient was constant to 10%.Figure B-2 shows a front view of the magnet and the region of constant gradient,the working volume. The width of this square region, K, is 8".
Figure B-3 shows a side view of the pole with the central region ofconstant gradient marked by the "10%" lines. The distance between these linesis also 8".
To demonstrate the constancy of the magnetic field gradient in this region,it is sufficient to show that the field in this region satisfies Equation (1) ofAppendix B. The theory developed in Appendix B shows that this can bedemonstrated by proving that in the working volume, the x component of thefield, Hx, varies linearly with y, and that the y component, Hy, varies linearlywith x; and that the proportionality constant, r , is the same in both cases. Thegap of this magnet has a planes of symmetry at x = 0 cm and at z = 20 cm as canbe seen from Figures B-2 and B-3. It is therefore sufficient to verify thecorrectness of the above relations in only one quadrant of the working volumebecause the working volume is centered on the intersection of these planes ofsymmetry. A suitable quadrant could be 0 - x < 10, 19 < y < 39, 10 < z < 20.As will seem however, these relations were verified over almost all of the workingvolume, to provide checks.
-20-

This was demonstrated by measuring Hx and H by means of a Hallprobe gaussmeter. Figures 10 and 11 show that this relation indeed holds tobetter than 5%. The practical implication of having met the constancy ofgradient design criterion in this working volume, is that the constancy of theapparent density of a ferrofluid pool occupying this volume would not beimpaired by non-constant gradients.
In addition to these magnetic field measurements, the magnetic fieldwas measured as a function of the coil energyzing current, at the top of theworking volume (19 cm, 7. 5 inches below the mirror plate), and at the bottomof the working volume (39 cm, 15.5 inches below the mirror plate). The gradientwas calculated from these values as a function of current. These data, shownin Figures 12 and 13, will be used in conjunction with measured propertiesof the ferrofluid to calculate the apparent density of the ferrofluid pool as afunction of the energyzing current. It will be shown in a later section of thisreport that with the maximum measured gradient of 250 oersted/cm at 690 amperes,and the ferrofluid used throughout most of the program, an apparent density ofabout 10 g/cm 3 could be generated. With a higher magnetization ferrosluid usedin the course of some of the work an apparent density of about 15 g/cm couldbe generated.
In summary the magnet design was successful both in terms of theconstancy of the gradients, and in terms of the rraximum apparent density of theferrofluid that could be generated.
B. Materials Handling System (Separator)
For the sake of shortness the materials handling subsystem will bereferred to as the "separator" in this section. In later sections, the combinationof magnet and materials handling system will however be called the separator.
The function of the separator is to confine the ferrofluid pool and toprovide means for introducing the mixed solids and for removing the separatedproducts. The design of the separator to accomplish these objectives was basedon a model that had been used with the small laboratory magnet Avco hadconstructed to verify the pole design. Figure 14 shows an uncovered top viewof this model separator (inch scale superimposed) and identifies its key features.Figure 15 shows the separator in position between the poles of the laboratorymagnet. Several features of this design deserve comment. The central "well"is centered on the region of constant gradient, and in entirely within the workingvolume of the magnet. Most of the ferrofluid is confined to this region, althoughsome penetrates into the feed and product removal channels. These channelsextend well beyond the poles in order to prevent the ferrofluid which penetratesinto them from running out of the apparatus onto the poles themselves. Objectswere introduced into the ferrofluid by pushing them in with a rake through thecentral channel (the feed channel), which is half way between the top and bottomof the working volume. The floats were removed by raking the portion of theferrofluid pool which extended above the floor of the upper channel. The top offerrofluid is somewhat above the working volume.
-21-

I Ix (cm) z (cm)
8-0 0 20
O 10 30X -7 10
7
F = 195
5
4
3
HEIGHT OF2
WORKING VOLUME
19 cm 39 cm
00 10 20 30 40 50
83-1497 y (cm)
Figure 10 VARIATION OF Hx WITH DISTANCE FROMMIRROR PLATE
-22-

I I I I Iy (cm) z (cm)
0 25 20
l 15 10-30
X 35 10-30
2.0
Hy (K Oe) 1 = 2001.0
-1.0
-2.0 -
-WIDTH OF WORKING VOLUME
10 8 6 4 2 0 2 4 6 8 10
83-1498 x (cm)
Figure 11 VARIATION OF Hy WITH DISTANCE FROM AXIS
-23-

10,000 I(x=0; z 10 cm)
9,000 Y = 39 cm
8,000
7,000
6,000
a 5,000
4,000
3,000
2,000
1,000
00 100 200 300 400 300 200 100
83-1499 ENERGIZING CURRENT, amperes
Figure 12 MAGNETIC FIELD ON AXIS OF GAP
-24-
300(x = 0; z= 10cm)
280
260
240
220
200E
D 180
8
160
w0 140
120
100
80
60
40
20
00 100 200 300 400 500 600 700
83-1500 ENERGIZING CURRENT, amperes
Figure 13 VERTICAL MAGNETIC GRADIENT ON AXIS OF GAP
-25-

CAN CON FORVN ILOACN
Figure 14 MODEL SEPARATOR WITH COVER PLATE REMOVED

Figure 15 MODEL SEPARATOR IN LABORATORY MAGNET
-27-

The only important change required to adapt this design to the magnetconstructed for this program were to replace the manual raking process bysuitable conveyors and to increase the scale by about a factor of 4. Anillustrator's sketch of this separator based on blueprints and a partly assembledportion is shown in Figure 16. The close similarity to the model separator isobvious. The conveyors were designed to carry scrap fragments up to about2-3 inches in largest dimension at rates of over a ton an hour.
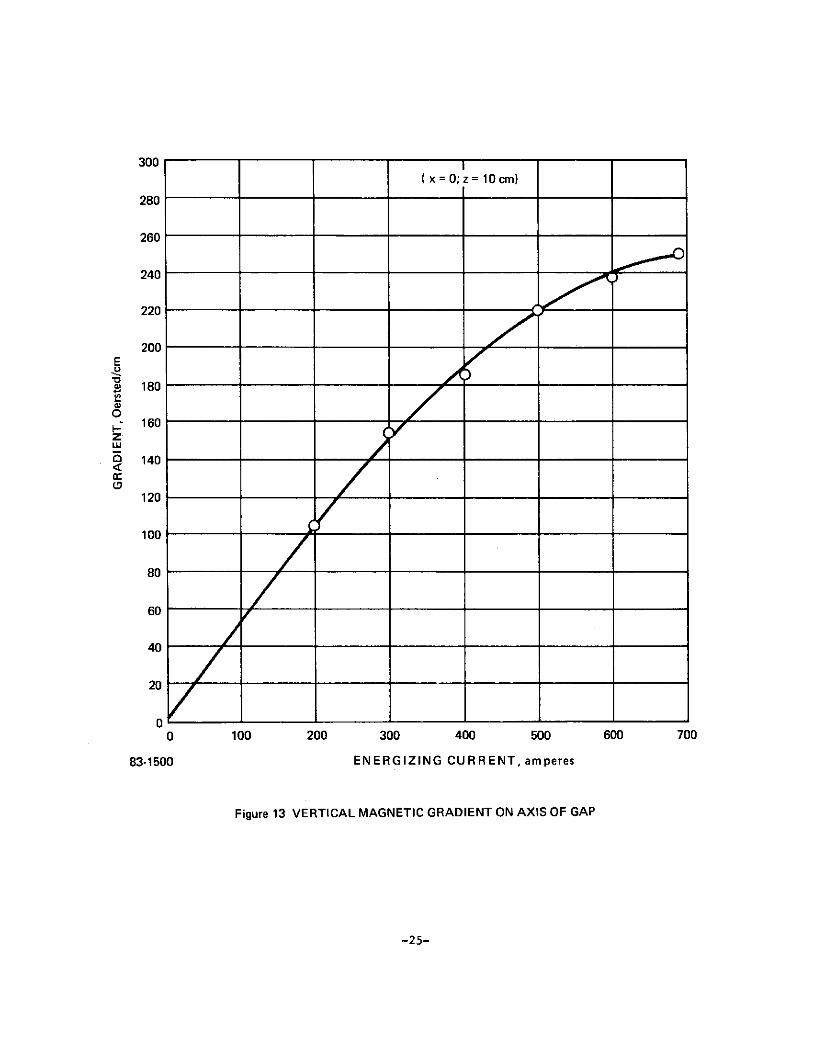
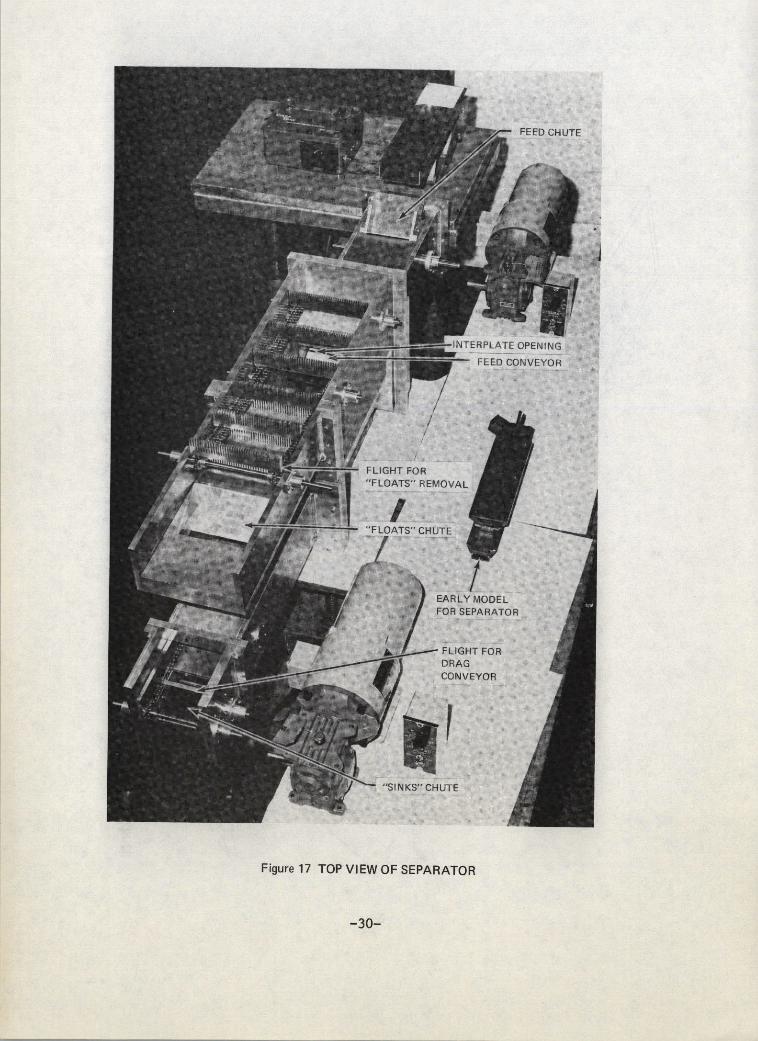
Figure 17 is a photograph of the assembled separator, identifying thekey components. Figure 18 shows a close up view of the product removalconveyors, and Figure 19 shows the feed conveyor. Figure 20 shows theseparator positioned between the poles of the electromagnet during the assemblyof the system.
The floor onto which the sinks fall coincides with the bottom of theworking volume. The top of the feed conveyor is slightly below the mid pointof the working volume, so that scrap pieces carried by it enter at about themidpoint of the working volume. This entry point equalizes the transit timesof sinks and floats to the bottom and top of the ferrofluid pool, and is thusconducive to high separation rates, (Appendix A, Section 2). The rakes of theupper (floats) conveyor protrude about 1 inch below the upper plane of the workingvolume, and since the top of the ferrofluid pool extends slightly above this plane,the rakes sweep through a little more than 1 inch of the ferrofluid to removethe floats.
After the system was assembled, filled with ferrofluid and tested withscrap, a number of difficulties with conveyor operation showed up, which requiredcorrection.
The most serious difficulty showed up in the operation of the feedconveyor. In Figures 17 and 19 it can be seen that a gap develops between theinterlocking plates that comprise the feed conveyor, when they round the drivingand idling prockets. Pieces of scrap got through these gaps and prevented propermeshing of the sprockets with the driving chain. It was found that the flightsattached to the plates were not high enough to force scrap pieces effectively intothe ferrofluid pool. This resulted in pile up of scrap at the interface of theferrofluid within the feed channel, and occasional jamming of the feed conveyor.
Similar, although far less severe problems were encountered with theproduct removal conveyors. The rakes or flights of the floats removal conveyoroccasionally jammed thin pieces of scrap against the floor of the floats outletchannel. On somewhat rarer occasions very small pieces of scrap got into thelinks of the chain carrying the flights of the drag conveyor that removed the sinks.
The floats conveyor problem was overcome by replacing the aluminumrakes with rubber flaps. These flaps had enough rigidity to remove floating scrappieces from tlhe ferrofluid and to drag them along the floor of the channel, yetthey were sufficiently flexible to pass over any scrap pieces caught temporarilyagainst the channel floor. A view of this modified conveyor is shown in Figure 21.
-28-

SINKS
FEEDER
IN MAGNETIC GAP
FERROFLUI D -
83-1270Figure 16 SKETCH OF SEPARATOR
"F LOATSD CHUTE
4---
FEED SCONVETOR
FLLIGHT FOR
DRAG
CONVEYOR
"S I IN KS- CH UT E
Figure 17 TOP VIEW OF SEPARATOR
-30-
DRAG CONVEYOR
Figure 18 PRODUCT REMOVAL CONVEYORS

Fiure 19 FEED CONVEYOR
Figure 19 FEED CONVEYOR

MAGNET f.;OLINGWAT[Fi MANIFOLDS
FEED CONVEYO
161NCHES_
Figure 20 FERROFLUID SEPARATOR DURING ASSEMBLY

Figure 21 MODIFIED FLOATS CONVEYOR
-34-

The sinks conveyor and the feed conveyor were both replaced with beltconveyors of Buna-N reinforced with cotton. The sinks conveyor had no flightswhile the feed conveyor was equipped with 2 inch high flights as shown inFigures 22 and 23. The rough sides of both belts rides against the knurleddriving and idling pulleys in order to prevent slippage. Small pieces of scrapare prevented from getting under the belts by having the belt edges positionedinside a slot in the side wall of the channel. The rubber flights on the feedbelt sweep the entire height of the feed channel and thus prevents pile up of scrapat the ferrofluid interface. In commercial models of this separator these flightswould be vulcanized to the belt rather than being attached to it by metal bars.
After the above changes had been made the conveyor belts functionedsatisfactorily. Scrap metal could be fed to the separator and removed afterseparation at over 2 tons per hour. The blueprints of the separator's componentsafter these modifications had been made, are supplied as Attachment 2 to thisreport. An overall view of the separation system showing the driving motorsmounted on top of the magnet mirror plate and baskets for the scrap is shownin Figure 24.
C. Behavior of Single Objects and Model Mixtures
The principal objective of this work was to provide background informationwhich would aid in understanding the results that might be obtained with thecomplex metal mixtures encountered with car scrap. On the basis of ferrofluidtheory, experiments on the small laboratory magnet and the constancy of thegradient in the working volume of the large magnet it was felt that the behaviorof single particles would follow theoretical predictions with respect to sink-floatbehavior and that model mixtures at low feed rates would separate cleanly.This work was carried out with the expectation that these results would berealized and thus to enable us to attribute deviation from these results, whenprocessing actual car scrap, to the nature of car scrap itself.
1. Single Objects
In this experiment the behavior of metal fragments was studied asa function of density, shape, size and release point into the ferrofluid pool.The procedure used was to operate only the lower (sinks) conveyor while adjustingthe current to the coils to the minimum value required to prevent the test objectfrom sinking and being carried out by this conveyor. At this current value, theapparent density at the lower conveyor (which is at the bottom of the workingvolume) should just about equal or exceeds slightly the density of the test object.Equation (4) for the apparent density may be rewritten to show its explicitdependence on the coil current.
Pa P f + M [H(I)]B H(I) (5)
M [H(I)]B - Magnetic dipole moment per cm 3 of ferrofluid(which is a function of H which in turn is afunction of I) at the bottom of the working volume.
I - Coil current.
-35-
m' SIDE W LII Fur 2 MBELT FEED C - V
Figure 22 MODIFIED FEED CONVEYOR - ASSEMBLED VIEW

~'. : i ::::i :i:';::::-::-- :::: ::; -i-...; ;I: ~: : !~ :::: ' ::''---'''-:':'-REV : -
A " : ::'::-:'::: : ':'---:;:-: :: il::::::i: : --
SLOT FOR EDGE CHANNELFOR IDLING PULLEY::----i ; i:i ;OF BELT RETURN OF::: ::: ':: i:--:' '-'::-::':::'-:':'-:'::-:::::: '
FLIGHTS ::i:i:i-:~i:i:-: ;:-: : - :
Figure 23 MODIFIED FEED CONVEYOR - PARTLY DISASSEMBLED::-:--i::' :.;-- i:; : i -: ::

I'
Figure 24 SEPARATION SYSTEM

The upper curve in Figure 12 shows the dependence of H at the lowerconveyor on I, and Figure 13 shows the dependence of the magnetic fieldgradient on I. Figure 25 shows the dependence of M on H for the ferrofluid used.Therefore by knowing I, all factors on the right side of Equation (5) may beobtained, and P af the apparent density required to prevent the test object'ssinking may be calculated and compared with the object's physical density.This comparison is shown in Table II for shapes typically encountered in carscrap when the test objects were released at the "central release point"(Figure 26). These data show the expected close agreement between the apparentdensity of the pool and the physical density of the test object, and the lack ofdependence on object shape. The average deviation is less than 5%.
In view of this agreement with theory, the study of the effects of objectsize was limited to brass cubes. The results are summarized in Table III,and as expected show no dependence on size over an eightfold variation inlength and a 500 fold variation in volume.
The effects of the release point were studied for the three off centerrelease points shown in Figure 26. The results shown in Table IV show no
effect of release point. This was of course to be expected in view of the constancyof the magnetic field gradient over the working volume.
2. Model Mixture Separations
The scrap for these studies was prepared by cutting up plates and
bars into pieces between 2 inches and 1/4 inch in size. This size rangereflected the expected size range of reshredded nonferrous metals from
automobile scrap. The metals used were those to be found in largest amounts
in car scrap; various alloys of aluminum (density 2.65-2. 75), zinc die cast
(density 6.6), and brass (density 8. 5). Some preliminary experiments were
carried out on separating aluminum-brass mixtures. The separation at a feed
rate of about 3,600 lb/hr was 100% accurate. It was therefore decided to confine
the balance of these studies to the most difficult of the separations, zinc from
brass. The results of these tests are shown in Table V.
In the first test some zinc contaminated the brass fraction. This
was probably caused by large brass pieces resting on top of small zinc pieces.
When the combined density of such a "sandwich" is greater than 7.4, it sinks.
To alleviate this situation, test 2 was carried out at an apparent density of 8.4.
This density was too high and resulted in rather substantial contamination of the
zinc fraction by brass, probably by the inverse of the mechanism proposed explain
the results of test 1. In test 3 the apparent density was adjusted to an intermediate
value, 7. 9, and complete separation resulted. In test 4 the higher feed rate
resulted in minor contamination of the zinc fraction by brass.
In summary, the results of single object studies and the separations
of the model mixtures demonstrated good agreement with the predictions of
ferrofluid theory.
-39-

50
pf = 1.3 g/cm3
40
30
0 ; 20
10
00 1000 2000 3000 4000 5000 6000 7000 8000 9000
83-1501 FIELD, H (oe)
Figure 25 MAGNETIZATION OF FERROFLUID FF1135

TABLE II
EFFECT OF SHAPE
Object Measured Apparent Density ofMaterial Shape Density Ferrofluid Object
Brass Cube 8.5 8.3Plate 8.6 8.0Needle 8.6 7.9
Tin Cube 7.3 6.9Plate 7. 1 6.7Needle 7.4 6.6
Gallium Cube 6.0 5. 7Plate 6.7 6.2
Zinc Cube 6.8 6.0Plate 6. 7 6. 2
Lead-Tin Alloy Cube 10.5 10.5Plate 10.7 10.6Needle 10.8 10.6
Stainless Steel Plate 8.2 8.0Needle 8.2 7.8
Lead-Tin Alloy Plate 9.5 9.2Needle 9.5 9.3
Zinc-Aluminum Alloy Cube 4. 2 4.3Plate 4.2 3. 9Needle 4. 2 3. 9
Cubes: About 3 cm on a side.
Plates: About 6 cm by 3 cm by 0. 3 cm.
Needles: About 6 cm long and 0. 4 cm in diameter.
-41-

x=0AXIS OF FERROFLUIDVOLUME
OUTLINE OF UPPERFERROFLUIDSURFACE
CENTRAL
RELEASE POINT
"'RELEASE POINT
Q RELEASE POINT
RELEASE POINTC
10 CM
I SCALE
83-1502
Figure 26 RELEASE POINTS FOR SCRAP PIECES
-42-
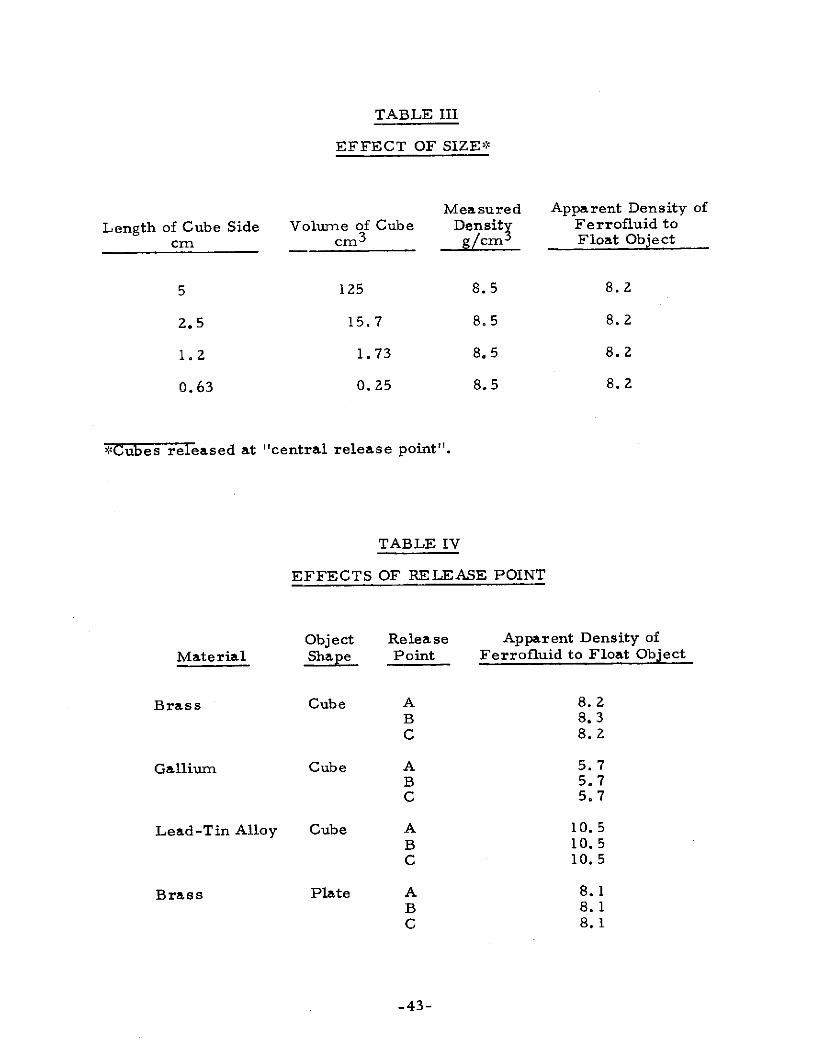
TABLE III
EFFECT OF SIZE*
Measured Apparent Density of
Length of Cube Side Volume of Cube Density Ferrofluid to
cm cm 3 g/cm Float Object
5 125 8.5 8.2
2.5 15.7 8.5 8.2
1.2 1.73 8.5 8.2
0.63 0.25 8.5 8.2
*Cubes released at "central release point".
TABLE IV
EFFECTS OF RELEASE POINT
Object Release Apparent Density of
Material Shape Point Ferrofluid to Float Object
Brass Cube A 8.2B 8.3C 8.2
Gallium Cube A 5.7B 5.7C 5.7
Lead-Tin Alloy Cube A 10.5B 10.5C 10.5
Brass Plate A 8.1B 8.1C 8.1
-43-

TABLE V
SEPARATION OF ZINC ALLOY AND BRASS
Feed Rate Average Apparentto Separator Density of Ferrofluid Purity of Purity of
Test No. lb/hr g/cm 3 Zinc Fraction Brass Fraction
1 2,600 7.4 100.0% 99.5%
2 3, 100 8.4 98.7% 100.0%
3 3,700 7.9 100.0% 100.0%
4 5, 100 7.9 99.6% 100.0%
D. Separation of Car Scrap
1. Scrap Properties
The principal materials present in the "nonferrous" portion ofcar scrap, and their physical properties are listed in Table VI. The detailedquantitative composition of car scrap is discussed in a later section of thisreport. In Table I the range of potential values for the pure recovered nonferrousmetals is shown. Zinc has the highest potential total value, followed by copperand aluminum, and stainless steel has the lowest total value. In this phase ofthe program most emphasis was accordingly placed on zinc separation and leaston the separation of stainless steel. The separation of the four valuable metalscan be carried out in twelve different sequences. The first step in the sequencechosen, in this work was the separation of aluminum and non-metals from zincand heavier. This is followed by the removal of zinc from the heavier metals, theseparation of copper from steel and the separation of non-metals from aluminum.This particular sequence was chosen because it first does the easiest separations,those having the widest density differences between sinks and floats. Thisreduces the amount of material to be treated in the subsequent more difficultseparations such as non-metals from aluminum and therefore minimizes thesize of the separator.
-44-

TABLE VI
MATERIALS IN NONFERROUS PORTION OF CAR SCRAP
Approximate Range ofMaterial Physical Densities Magnetic Properties
Non-Metals 1 to 2. 6 Non-Magnetic
Aluminum Alloys 2.65 to 2.75 Non-Magnetic
Zinc Alloys 6.6 to 6.7 Non-Magnetic to Slightly Magnetic
Copper Alloys 8.3 to 8.9 Non-Magnetic
Stainless Steels 7.8 to 8.0 Weakly Magnetic to Strongly Magnetic
Steel 7. 8 Strongly Magnetic
The materials in the nonferrous portion of car scrap have anumber of intrinsic and shape related properties that complicate the separationsinvolved. First, some of these metals have magnetic properties. The theoryof scrap behavior in a ferrofluid outlined in Appendix A shows that an objectthat has a magnetic dipole moment acts in the separator as though it had anapparent density higher than its true density (Equation (4b)). This has to be
taken into account when adjusting the apparent density of the ferrofluid to avalue intermediate between the densities of the materials to be separated. Table VIshows that zinc alloys and stainless steels can be magnetic. The magnetism of thezinc alloys is due to a nickel coating used beneath the outer chomium coating.The stainless steels usually found in car scrap are rendered magnetic by coldworking during manufacture or during the shredding process. The magnetismof these two classes of metals does not influence significantly the first step ofthe separation sequence; aluminum and non-metals from zinc and denser metals,because the rate of separation is controlled by the density difference between thedensest of the floats (aluminum) and the least dense of the sinks (non-magneticzinc). In the second step the magnetism of the zinc does however reduce thedensity difference between the densest of the floats (slightly magnetic zinc) andthe least dense of the sinks (brass). As a matter of fact, it will be seen thatthe apparent density of a small fraction of the zinc is higher than that of copperalloys, and it therefore contaminates the copper alloy fraction. The situation is
more serious when separating the copper alloys from stainless steel becausethe physical density difference between these classes of metals is quite small,and the magnetic dipole moment of stainless steel can easily raise its apparentdensity to a higher level than the density of some copper alloys. This couldmake the separation difficult or impossible.
-45-

The principal scrap properties with a potential for harming thecompleteness of separation are bimaterial fragments, closed shapes withtrapped air pockets and loose, non-compact, shapes with a propensity forentanglement. Bimaterial fragments have a density intermediate between thetwo components and may therefore wind up in either of the fractions involved,depending on the ratio of the two components in the fragment. A frequentbimaterial fragment is a piece of carburator body (zinc) with an imbedded brassfitting. Insulated copper wire is also frequently found. Nonferrous metalfragments with attached iron fasteners have very high apparent densitiesbecause of the iron, and generally wind up in the densest fraction.
Closed shapes with trapped air pockets have lower apparent densitiesthan the density of the material itself; the precise density depends of course onthe ratio of solid to gas. Typical fragments having this property are pieces oftubing with crimped ends and piece s of radiator or heater cores.
Fragments having a special propensity for entanglement arefrayed multibraid copper wire and fabric swatches.
In a very real sense the objective of the separation studies describedin the following sections was to determine to what extent these scrap propertieswould harm the quality of the separation expected on the basis of the resultsobtained with the model scrap separations.
2. Scrap Pretreatment
The scrap used in this study was largely obtained from TewksburyMetals, Inc. This company operates a shredding plant in Tewksbury, Massachusetts,with a separation system very similar to that given in Figure 5 for a "typical"plant. The nonferrous metals are cleaned of most of the accompanying non-metalsby air classification. A sample of this classified nonferrous metal stream wasreshredded by Tewksbury Metals for Avco's use on a small shredder. Beforebeing subjected to separation, fragments larger than 3 inches as well as largepieces of magnetic steel were removed. This was done in order to simulate moreclosely the properties of reshredded scrap that would be produced by a processspecifically designed to carry out nonferrous scrap pretreatment. This processis described in detail in a later section of this report.
3. Scrap Separations
a.. Procedures
In most of the experiments described in this section between100 and 200 pounds of scrap were separated. The amount of material separatedper run was limited by two factors; a) lack of automated ferrofluid recoveryequipment, which necessitated hand washing of the separated scrap fractions;a very time consuming process; b) need to hand pick impurities from the separatedfractions as one step in the analytical procedure. Handpicking much largerquantities of scrap is impractical.
-46-

The scrap was introduced into the separator by means of avibratory feeder (Figure 24). In the initial phase of the work a laboratoryvibratory feeder was used which had inadequate capacity and whose feed ratewas controllable to about 30%. Toward the end of the program an industrialvibratory feeder was procured; it had ample capacity and was controllable towithin about 15%.
The purity of the aluminum, zinc and copper fractions wasestimated by a two step procedure. The first step as mentioned above was topick out obvious impurities such as pieces of wire and rubber or brass fromthe "white" metals and "white" metals from the copper alloy fraction. Thiswas followed by measuring the density of the residual metal. Since the rangeof aluminum alloy and zinc alloy densities in car scrap is very small, the densityis a fairly sensitive measure of contamination. This density method does nothowever apply to the copper alloy fraction because the density range of copperalloys is large. The densities were determined on two pound samples of thescrap by the liquid displacement technique.
b. Aluminum-Zinc Separation (Stage A)
The first step in the separation procedure was the separationof aluminum and non-metals from zinc and the denser metals. This separationwas carried out with the apparent density of the ferrofluid (FF 1135, Figure 25)set at 4.5. The feed rate in various runs varied from 2000 to 3000 lb/hr. Sinceno pure fractions are produced in this separation, the goodness of the separationcould be most easily gauged by the purity of products produced in subsequent runs.For example; if rubber fragments showed up in the zinc fraction produced inthe course of the zinc-copper split, this would be a clear indication that the firststep was responsible for this contamination. Accordingly no attempt was madeto measure the purities of the fractions produced in the first step. Thesefractions were used as feed to the subsequent steps in the process.
c. Zinc-Copper Separation (Stage B)
As mentioned previously, the separation of the zinc alloys isthe most important of the separation to be made because these alloys are thelargest component of the scrap. In view of the previously noted effect of ferrofluidapparent density on the separation of the model zinc/brass mixture, the firststep in this study was to determine the affect of this operating variable. A lowfeed rate was used in order not to confound the effects of apparent density byvariations in the feed rate. The results are shown in Table VII. As expectedthe contamination of the zinc fraction (floats) increases with increasing apparentdensity of the ferrofluid. The level of contamination is however quite low. Thecontamination of the copper fraction (sinks) by zinc alloys is much greater. Allof the zinc alloy fragments found in the sinks were magnetic, either due to thenickel undercoat or due to attached iron screws. This made their apparentdensity much greater than their physical density and accounts for most of thiscontamination.
-47-

TABLE VII
EFFECT OF APPARENT DENSITY ON ZINC SEPARATION
Feed Material: Automobile scrap from whichaluminum and lighter componentshad been floated off.
Feed Rate: 300 lb/hr
Ferrofluid: FF 1135
Average Apparent Floats SinksDensity of Ferrofluid
g/cm 3 Percent of Output
7. 1 Zinc Alloys 85.80%o Zinc Alloys 3.34%
Copper Alloys 0.27% Copper Alloys 10. 64%& Denser
8. 1 Zinc Alloys 87. 20o Zinc Alloys 2. 72%
Copper Alloys 0.28%0 Copper Alloys 9. 92%& Denser
This effect can be minimized by using stronger ferrofluids and
a weaker gradient to maintain a constant apparent density level in the ferrofluid
pool. The rationale behind this approach can be seen from the following analysis.The apparent density of a slightly magnetic metal in the separator is given by
Equation (4b) of Appendix A.
MGP =p +as s g
Ms is nearly constant at the field strengths used in the zinc-copper split.
When the apparent density of the pool is constant while
changing the ferrofluid strength, Equation (4a) of Appendix A, shows that the
gradient, G, has to vary as shown below.
G =(P P )9
On substituting this equation into the first one, one obtains;
M (6)Pas = Ps + (Paf f) (6)
-48-

This equation shows that as themagnetic dipole moment (M )of the ferrofluid is increased while maintaining D af constant (by reducing G),the apparent density of a magnetic solid ( 0 as) approaches its physical density
(p s).
The effect of this operating change was tested by using aferrofluid (FF 1147) having a 40% higher magnetization than ferrofluid FF 1135.The results are shown in Table VIII, and are compared to runs at roughly equalfeed rates, using FF 1135, shown in Table IX. About 45% of the slightly magneticzinc fragments found in the copper fractions of runs P79A and P79B have beentransferred to the zinc fraction in runs P91 and P92. The untransferred zincfragments were largely pieces with attached iron screws, which have too high amagnetization to be overcome by this technique. These experiments demonstratethe technical validity of this technique. In commercial practice the benefits ofusing stronger ferrofluids will have to be weighed against their somewhat highercost. Since the economic incentives are not very large, direct operating experiencewill be required to choose the best fluid.
TABLE VIII
EFFECT OF FLUID MAGNETIZATION ON ZINC RECOVERY
Feed Material: Remixed sinks and floatsfrom Run P79A (Table IX)for Run P91.
Remixed sinks and floatsfrom Run P79B (Table IX)for Run P92.
Ferrofluid: FF 1147
Feed Rate: About 1000 lb/hr
Apparent Ferrofluid Density: 7. 1 + 0. 1 g/cm 3
Floats SinksRun No. Percent of Output
P91 Zinc Alloys 85.60% Zinc Alloys 2. 55%
Copper Alloys 0.40% Copper Alloys 11. 53%& Denser
P92 Zinc Alloys 85.70% Zinc Alloys 3. 91%
Copper Alloys 0.25% Copper Alloys 10.40%& Denser
-49-

TABLE IX
EFFECT OF PROCESSING RATE ON ZINC PURITY
Feed Material: Automobile scrap from whichaluminum and lighter componentshad been removed at about2000 lb/hr.
Ferrofluid: FF 135
Apparent Ferrofluid Density: 7. 1 + 0.1 g/cm 3
Feed Rate Floats Percent of Output SinksRun No. lb/hr Density
P79A 740 Zinc Alloys 84. 00% 6. 49 Zinc Alloys 5. 48%
Copper Alloys 0.24% Copper Alloys 10. 30%0& Denser
P79B 740 Zinc Alloys 83. 30% 6.48 Zinc Alloys 5. 89%
Copper Alloys 0. 15% Copper Alloys 10. 80%& Denser
P81 2600 Zinc Alloys 82. 50%0 6. 45 Zinc Alloys 8. 26%
Copper Alloys 0. 24%0 Copper Alloys 9. 20%& Denser
The runs in Table IX show the effects of processing rate onproduct purities. The copper alloy content of the zinc fraction is not significantlyaffected by the increase in feed rate. The higher zinc alloy content in the copperfraction of the high feed rate run was due to an unusually large number of zincfragments with attached iron screws. An attempt was made to characterize thecopper alloy fragments contaminating the zinc fractions of some of these runs.These copper alloy fragments were largely small pieces of partly insulated wireand pieces having trapped air bubbles such as sintered bearings, crimped tubingand carburator float bowls. It therefore appears that "mistakes" due to physicalentanglement are rare, most "mistakes" are caused by the presence of bimaterialpieces. This suggests that a somewhat greater degree of reshredding would bebeneficial.
-50-

The densities of the zinc alloys (after copper alloy removal)were somewhat lower than the expected density range (6.6-6. 7). This discrepancymay be due to air bubbles trapped between scrap fragments in the liquid displace-ment column used to measure the density, or it may be due to the presence ofaluminum. The latter would indicate that Stage A of the separation was at fault.If it is assumed that the density discrepancy is due to the presence of aluminum,then the aluminum alloy content would be about 10%. This amount of aluminum wouldnot detract from the value of the zinc fraction because the zinc die casting alloyscontain over 4% aluminum as a normal ingredient.
d. Non-Metal-Aluminum Separation (Stage C)
The "floats" fraction from the Stage A separation is separatedin Stage C into non-metals and the aluminum alloys. This separation was carriedout at an apparent density (2. 6) very close to that of aluminum in order tominimize the contamination of aluminum by glass fragments which can have densitiesvery close to that of aluminum. The results are shown in Table X. The purity ofthe aluminum fractions is well in excess of 99. 5% as gauged by the non-metals andcopper wire content. After these impurities were picked out, the density indicatedthat the residue was essentially pure aluminum alloy. Most of the non-metals thatwere picked out were pieces of rubber, glass was found infrequently. The copperwire was partly insulated, and its density was therefore probably close to that ofaluminum.
At the higher processing rate about 5% of the aluminum waslost to the non-metals fraction. This loss could be reduced by operating at asomewhat lower apparent density, at the expense of decreased purity of the aluminumfraction. The best strategy to use can only be found from full-scale plant operation,where sufficient material would be produced to determine its value to secondaryaluminum smelters as a function of purity.
e. Copper-Steel Separation (Stage D)
The sample of scrap was prepared for this study by floating offall components less dense than 7.8 g/cm 3 , which included zinc, aluminum and thenon-metals. The balance of the sample consisted of copper alloys, stainlesssteel alloys and minor amounts of lead and small pieces of iron attached to largenon-magnetic pieces of scrap.
The separation of stainless steel from the copper alloys ofautomobile scrap presents considerable difficulties. The physical density ofstainless steel ranges from about 7.8 to 8.0 g/cm 3 , while the density of copperalloys ranges from 8.9 down to about 8. 3 g/cm3 . The separation of the least densecopper alloys from the densest stainless steels is therefore reasonably difficult.An even greater source of difficulty was the magnetism of the stainless steels.Although most of the stainless steels used in automobiles are classified as "non-magnetic", they do become magnetic on being subjected to cold working during theirmanufacture and during shredding.
-51-

TABLE X
EFFECT OF PROCESSING RATE ON ALUMINUM PURITY
Feed Material: Aluminum and "lighter"fraction of automobilescrap from which zinc andheavier had been removedat about 2000 lb/hr.
Ferrofluid: FF 1135
Apparent Ferrofluid Density: 2. 6 + 0. 1 g/cm 3
Feed Rate Floats SinksRun No. lb/hr Percent of Output Density
P85 1800 Aluminum Alloys 5.24% Aluminum Alloys 91.1 0% 2.74
Non-Metals 3.41% Non-Metals 0.12%
Copper Wire 0.16%
P87 1300 Aluminum Alloys 2. 74% Aluminum Alloys 93. 20% 2.74
Non-Metals 3. 70% Non-Metals 0. 22%
Copper Wire 0.17%
The situation is therefore very similar to that encounteredwith the slightly magnetic zinc, and the use of a stronger ferrofluid wasaccordingly thought to be appropriate. As a preliminary step the separation wasstudied with the weaker ferrofluid, with the results shown in Table XI.
The stainless steel was divided into magnetic and non-magneticcategories by holding individual pieces near a magnet and determining theirresponse. This procedure while useful, clearly under estimates the amount ofmagnetic steel, because some of the steel may be too weakly magnetic for itsresponse to be felt.
-52-

TABLE XI
EFFECT OF APPARENT DENSITY ON
COPPER ALLOY/STEEL SEPARATION
Ferrofluid: FF 1135
Average Apparent Density: 8. 85 g/cm 3
Percent of Output
Floats Sinks
Copper Alloys 22.2 45.0
Stainless Steel
Non-Magnetic 8.9 3.3
Magnetic 0.0 20.6
31.1 68.9
Ferrofluid: FF 1135
Average Apparent Density: 8.55 g/cm 3
Percent of Output
Floats Sinks
Copper Alloys 15.8 49.6
Stainless Steel
Non-Magnetic 9. 1 13.3
Magnetic 0.0 12.1
24.9 75.0
-53-

It is apparent that only the non-magnetic steel could be floated,while the sinking stainless steel has a substantial amount of magnetic matter.At the 8.85 g/cm 3 density level, which is well above the physical density ofsteel, almost all of the steel in the sink fraction is magnetic. In an attempt toreduce the apparent density of stainless steel the separation was repeated, usingthe stronger ferrofluid, FF 1147. The results are presented in Table XII. Acomparison of these results with those obtained in the second run of Table XII,clearly demonstrates the effect of the higher magnetization. There is no longerany non-magnetic stainless steel in the sink fraction, suggesting that most ofthe non-magnetic steel was in fact slightly magnetic. Another interesting outcomeof this experiment was the increase in the fraction of copper in the floats. Thisimmediately suggested that the copper was slightly magnetic! When brought neara magnet a majority of the copper fragments did indeed exhibit a slight magneticresponse. Since these copper fragments were largely pieces of radiators andheater cores, we attribute this response to an internal coating of magnetic ironoxides picked up from the engine coolants.
TABLE XII
EFFECT OF FLUID MAGNETIZATION ON
COPPER ALLOY/STEEL SEPARATION
Ferrofluid: FF 1147
Average Apparent Density: 8.61 g/cm3
Percent of Output
Floats Sinks
Copper Alloys 43. 1 15.5
Stainless Steel
Non-Magnetic 11.6 0.0
Magnetic 15.5 14. 2
70. 2 29. 7
-54-

As a check on these hypotheses, the "non-magnetic" portions ofthe sinks and floats were handpicked and their separation was carried out under theconditions shown in Table XIII. The separation of the stainle'ss steel from thecopper alloys is virtually complete; the sinks contain only 2. 5% stainless steel.Unfortunately the stainless steel fraction (the floats) was heavily contaminated withcopper. The contaminating copper consisted almost entirely of pieces of radiator.Radiators are made of pure copper having a density of 8.9 g/cm3 , it was thereforehypothesized that the floating of these pieces was due to sealed off air voids, whichcaused them to have an apparent density considerably lower than 8. 9 g/cm 3 . Whenthese pieces were cut open, these air voids were found.
TABLE XIII
SEPARATION OF "NON-MAGNETIC"
COPPER AND STEEL ALLOYS
Ferrofluid: FF 1135
Average Apparent Density: 8.35 g/cm3
Percent of Output
Floats Sinks
Copper Alloys 13.8 71.5
Stainless Steel 12.9 1.8
26.7 72.3
On the basis of these results it is apparent that the separation ofthe copper alloys from stainless steel in automobile scrap presents formidabledifficulties. The magnetism of the steels makes their apparent densities overlapthat of the copper alloys, and the closed air voids in some of the copper fragmentswhich makes their densities overlap that of the stainless steels. It is thereforenot possible to recover a pure copper alloy or a pure stainless steel fraction. Itmay be possible to recover some of the strongly magnetic stainless steels by usinglow magnetization ferrofluids and high gradients, in order to float the copper andlow magnetization steels while sinking the strongly magnetic steels. Perhapsre shredding this fraction to a smaller size may open up the air voids of the radiatorfragments to access by ferrofluid. In view however of the small amount of stainlesssteel in the "non-magnetic" fraction of car scrap ( < 2%), and the low economicincentive for its recovery, no further work was carried out on this separation.
-55-

E. Ferrofluid Recovery
The recovery of ferrofluid that coats scrap leaving the separator consistsof two steps; washing the scrap with a suitable solvent and boiling away the solvent,to recover the ferrofluid. In the course of this program, more attention waspaid to the second step than to the first, because it was felt that commercialdegreasing equipment would be reasonably well suited for the first step. In thelaboratory, heptane was used as the solvent because it was more compatible withthe ventilation facilities. In commercial practice, a solvent such as trichloroethanewould be used because it presents no fire hazard. The actual washing of the scrapwas carried out by placing it in 5 gallon, perforated bottom, pails and pouring roomtemperature heptane onto the top of the scrap. This procedure required about 2 to3 gallons of heptane to clean 4 to 5 gallons of scrap. This is about equivalent to83 gallons per ton.
The amount of ferrofluid coating the scrap was difficult to estimateaccurately from these studies because only about 100 pounds of scrap could bewashed at a time. A rough estimate obtained from these experiments is that2. 5 pounds of ferrofluid were removed from the separator per 100 pounds of scrap.
The second step of ferrofluid recovery, boiling the solvent from theferrofluid- solvent solution was carried out in a batch 12 liter glass still. Theevaporation of the solvent was continued until the vapor temperature reached 140 0 C.At this point the ferrofluid was effectively reconcentrated to its initial magnetization.If trichloroethane (B. P. 740C) were used as the solvent rather than heptane(B. P. 980C) a final temperature of 1200C would probably suffice to reconcentratethe fluid. The most careful record of ferrofluid recovery was kept from lateFebruary to late March. During this period about 1500 pounds of scrap wereseparated, about 100 pounds of ferrofluid were recovered and recycled and 6.0 poundsof ferrofluid had to be added to the ferrofluid reservoir to make up for ferrofluidlosses. The reason that 100 pounds of ferrofluid had to be recovered for only1500 pounds of scrap (6. 67 lb ferrofluid per 100 lb scrap), is that the separatorwas washed with solvent at the conclusion of each day, and no attempt was madeto segregate these washings from the scrap washings. The average magnetizationof the recycled ferrofluid was 434 gauss at 3.5 kilo oersted, whereas, the initialmagnetization of the ferrofluid was 416 gauss at the same field level. The higheraverage magnetization of the recovered ferrofluid was due to overheating of twobatches and evaporation of a portion of the kerosene which is the base of thisferrofluid. The ferrofluid loss experienced during this monitoring period, 6 pounds,or 8 pounds per ton, was due largely to accidental spills. There was no indicationof ferrofluid decomposition in the solvent recovery still; during the entire periodno buildup of sludge or caking on the inside of the still pot occurred. Likewise,the amount of ferrofluid left on the scrap after washing was insignificant.
-56-

III. PROCESS DESIGN
A. Basis for the Plant De sign
1. Scrap Supply
The objective of automobile shredding is the recovery of uncontaminatedsteel fragments of a high bulk density. The shredders achieve this objective whenoperated to produce fragments no larger than about 8 inches. This degree offragmentation effectively frees the steel from contaminants such as copper. Thefreed steel is separated from the non-magnetic material by magnetic separatorssuspended over the conveyor that carries the shredded material.
The residual "non-magnetic" material is, however, contaminatedwith some small iron pieces, because the objective of the steel recovery is to obtainrelatively clean steel even if it does result in minor losses of magnetic material.A Bureau of Mines study of the non-magnetic residue from three shredders foundtheir material to be of the average composition shown in Table XIV. The combustiblefraction consisted largely of rubber and the non-metallic non-combustibles consistedlargely of glass and dirt.
TABLE XIV
COMPOSITION OF NON-MAGNETIC RESIDUE
OF AUTOMOBILE SHREDDING
Component Percent
Nonferrous 21. 4
Ferrous Metals 11.9
Combustibles 24.4
Non-metallic Non-combustibles 42. 3
100. 0
Source: Bureau of Mines Technical Progress Report
TPR 31
Recovery of the Nonferrous Metals fromAuto Shredder Rejects by Air Classificationby C.J. Chingren, K.C. Dean and LeRoy Peterson.
-57-

The same Bureau of Mines study also estimates the distribution ofmetals in the nonferrous metals fraction. A comparison of this estimate withAvco's estimate is shown in Table XV. Avco's estimate is based on interviewswith shredder operators as well as Bureau of Mines studies. Neither estimateis complete, but the agreement for the important metals, zinc,aluminum and copperis satisfactory.
TABLE XV
NONFERROUS METAL CONTENT OF AVERAGE SHREDDED AUTOMOBILE
Bureau of Mines AvcoMetal Estimate (lb) Estimate (lb)
Zinc 45 40
Aluminum 9 10
Copper 5 5
Stainless Steel - 2
Lead 2 -
2. Feed Preparation
In order to transform this material into an economically attractivefeed to the ferrofluid nonferrous metal separation process, it must be subjectedto three processing steps:
* size reduction
a removal of non-metallic material
* removal of magnetic or ferrous material
The chief objective of further size reduction is to reduce the size ofthe scrap pieces to a size no larger than 2 to 3 inches. This is required in orderto process the material in a magnetic separator having a gap of about 8 inches. Itis possible to build separators having a larger gap, and thus to process largerscrap pieces. However, the weight of the magnet is proportional to the gap widthcubed and the electrical power to run it is proportional to the gap width to thefourth power. Because these relations imply very rapid increases in capital andoperating costs with increasing gap width, the overall cost of the separationsystem is lowest when using magnets of about an 8 inch gap and reshredding thescrap to a size separable in such a magnet.
-58-

The reshredding step has certain ancillary benefits. It freesmechanically linked fragments of dissimilar metals, iron screws attached topieces of zinc trim for example, and thus makes the subsequent separationsteps more accurate. The size reduction step also minimizes the size rangeof the material and thus makes the subsequent air classification step for removalof non-metallics more efficient. The size reduction also increases the bulkdensity of the metals; a high bulk density is desirable for shipping economies.
Removal of most of the non-metals prior to ferrofluid separation isdesirable for two reasons. The non-metals such as upholstery and foam rubberabsorb ferrofluid readily and its recovery by a degreasing solvent is difficult.Prior removal of these absorptive materials is therefore desirable in order toreduce ferrofluid losses. A Bureau of Mines study has shown that about 80% ofthe non-metals can be removed by a simple air classification step. It appears thatthis method of removing the bulk of the non-metals is more economical thanferrofluid levitation. It is therefore proposed to use it as part of the feedpretreatment sequence.
The removal of the residual magnetic material is required in order toprotect the re shredder from damage by relatively large iron pieces thatoccasionally slip through the steel recovery magnetic separator, and to reducethe volume of metal that is separated by ferrofluid levitation.
A feed preparation sequence meeting these requirements is shownin Figure 27. In addition to the primary magnetic separator ahead of the reshredder,a second magnetic separator is placed after the air classifier to recover smallmagnetic fragments freed during the reshredding process. This step is extremelyinexpensive and increases the purity of the copper alloys recovered in the subsequentsteps.
In this feed preparation process the air classifier for removal ofnon-metals is placed after the reshredder. This relative placement of these twounits is expected to have two important advantages over the reverse placement. Thefirst is that the reshredding step will free mechanically linked metal-non-metalfragments. The second is that reshredding reduces the size range of the materialfed to the air classifier, thus making the air classification step more accurate.The reason for this is that air classification depends both on the size of the objectsto be separated and on their density. Consequently a reduction in size variation,makes the separation more dependent on density difference. Since the objective ofthis air classification is to separate low density non-metals from high densitymetals, a decrease in size variance makes the separation more accurate. It isexpected that this increased accuracy will reduce the non-metal content of themetals fraction to about 10% from the 25% value obtained by the Bureau of Minesinvestigators when using unreshredded scrap.
Based on this assumption and the estimate of nonferrous metalcomposition shown in Table XV, an estimate of the overall composition of the feedto the ferrofluid separation portion of the plant is shown in Table XVI. It is tobe emphasized that this is an estimate of an average composition. In actualpractice the composition will vary considerably, depending on the operation of thecar shredder and the efficiency of the feed preparation equipment.
-59-

LARGE MAGNETICFRAGMENTS
NON-METALS
SMALL MAGNETIC
"NON-MAGNETIC" PRIMARY FRAGMENTS
STREAM FROM MAGNETICAUTO SHREDDER SEPARATOR
AIRCLASSIFIER
RESHREDDER
SECONDARYMAGNETIC
SEPARATOR
FEED FORFERROFLUIDLEVITATION
83-1271 PROCESS
Figure 27 FEED PREPARATION SEQUENCE
-60-

TABLE XVI
NOMINAL COMPOSITION OF MIXED NONFERROUS METALS
Pounds Pounds PoundsWeight Per Per Per
Material Fraction Car Ton of Feed Ton of Metal
Zinc 0.635 40.0 1270 1403
Aluminum 0. 159 10.0 318 351
Copper 0.079 5.0 158 175
Stainless Steel 0.032 2.0 64 71
Non-Metals 0.095 6.0 190 210
1.000 63.0 2000 2210
It is the intent of this report to concentrate almost exclusively onthe ferrofluid separation portion of the separation process, because it is feltthat feed preparation involves established technology, and the equipment designwould be the responsibility of the shredder operator. It is neverthelessinteresting to analyze the important economic and technical trade offs made indesigning the feed preparation system.
a. Reshredder
The most important piece of equipment used in feed preparationis the shredder. For a nonferrous metal plant having a capacity of less than5 tons per hour the size of the shredder is controlled by the size of the scrap piecesto be reshredded rather than the weight of material. The minimum capacity of ashredder suited for this application is therefore about 5 tons per hour. The costof such a machine with the ancillaries is about $21, 000. Thus a small automobileshredding plant generating 8 tons of nonferrous metal scrap per day would operatethe secondary shredder for less than two hours per day. It is therefore apparentthat the reshredding process is less expensive in a large plant where the reshreddercan be used more hours each day.
b. Air Classifier
The air classifier removes most of the non-metals from thereshredded stream. Most commercially available equipment should be capable ofprocessing at least 5 tons per hour of this material. The same economics of scalethat hold for the reshredder also apply to this equipment. The air classifieractually consists of three subsystems. The separator is a vertical chamber withan upward moving air stream into which the reshredder scrap is dropped. Themetals fall out of the bottom of the chamber, while the non-metals are conveyedout through the top into a cyclone. In the cyclone the pieces of scrap aredisengaged from the air stream, which is drawn by a fan into the dust collectionsystem. The dust collection system is generally the bag house type. For a5 ton per hour processing rate, the purchased cost of the air classificationsystem is estimated to be about $7, 000.
-61-

c. Magnetic Separators
The primary magnetic separator must remove, with very highprobability, large iron pieces that could seriously damage the reshredder. Amagnetic belt separator hung over the conveyor which feeds the reshredderappears most suited for this purpose. The secondary magnetic separator, can bea simpler magnetic pulley type. The cost of both separators is about $12, 000.
On the basis of discussion with shredder operators, it isestimated that the cost of feed preparation at this 5 ton per hour rate will beabout $12 per ton.
3. Separations to be Made
In the course of the experimental portion of this program, it hasbeen shown that good quality aluminum and zinc fractions could be recovered fromreshredded automobile scrap at high processing rates. The separation of copperfrom stainless steel did not prove practical for reasons previously discussed.The experimental purities obtained will be assumed to apply also to the largerseparators that would be used industrially. Table XVII summarizes theseexperimental results. Again it must be realized that these processing rates areonly typical values. Higher rates are possible, with perhaps some loss in purity.Lower rates may be required with particularly entangled scrap. The same cautionmust be applied to the purities and recoveries.
TABLE XVII
BASIS FOR PROCESS DESIGN-EXPERIMENTALLY
OBTAINED SEPARATION RESULTS
Separation Feed Rate Results
Aluminum and lighter 2700 lb/hr The separated fractionsfrom zinc and heavier were used as feed to the
subsequent separationstages.
Aluminum from rubber 1800 lb/hr 94. 6% of the aluminumand lighter recovered in 99.8%
purity. 5.4% of thealuminum lo st withnon-metals.
Zinc from copper 2600 lb/hr 91% of the zinc recoveredand heavier in 99. 6%0 purity. 9%0 of
the zinc wound up incopper fraction.
Using the scrap composition of Table XVI and the separation resultsof Table XVII a material balance for a nonferrous metal separation system iscalculated and shown in Figure 28. This material balance will be assumed tohold for the plant design to be presented below.
-62-

NONMETAL IONMETALS 189,6 LBNONMETAL
ALUMINUM 17.1FRACTION
206.7
C
ALUMINUM ALUMINUM 300.8 LB.
& ALUMINUM NONMETALS 04
LIGHTER FRACTION COPPER WIRE 05301.7
2000 LB. FEED
ZINCFRACTION
ZINC ALLOYS 1155.7 LB.
ZINC COPPER ALLOYS 3.41159.1
HEAVIER
COPPER ALLOYS 154.1 LB.COPPER ZINC ALLOYS 114 3FRACTION STEEL 64.0
332.4
83-1503
Figure 28 NONFERROUS METAL SEPARATION SYSTEM MATER;AL BALANCE
-63-

4. Separator
The separation rates and purities obtained on the separator constructefor the current program are shown in Table XVII of the previous section. Thisseparator can process up to about 3000 pounds per hour of scrap. In commercialseparation of automobile scrap a separation rate about twice as high is desirable.The analysis of ferrofluid levitation presented in Appendix A predicts that theseparation rate is proportional to the horizontal cross- section of the ferrofluidpool. It is therefore possible to double the capacity by doubling the length of thepool. The analysis in Section 3 of Appendix A predicts that scrap can reach thisextra length from the inlet of the separator if the feed conveyor velocity is doubled.Doubling the velocity presents no technical problems. A magnet designed toaccommodate a ferrofluid pool 16 inches (40. 8 cm) long is presented in Appendix B.
In this design, only the central 16 inches of the "z" dimension areused to accommodate the ferrofluid pool, leaving 7 inches of unused interpoledistance between the working volume and the edge of the poles, whereas in thepresent magnet only 4 inches were left on either side of the ferrofluid pool. Itis probable that only 4 inches would also be required in the large magnet, but anextra 3 inches were allowed between the pole edge and the working volume, inorder to reduce the risk of having a varying magnetic field gradient at the edgeof the working volume.
In the pre sent separator the width of the working volume (dimension kof Figure B3) is 8 inches. The ferrofluid pool occupies, however, only the central6. 1 inches of this working volume. About 1 inch of working volume on each sideis taken up by the separator walls. This simplifies the design of the materialshandling system, at the expense of a 25% reduction in system capacity. In thelarger commercial separator, the materials handling system would be designed sothat the entire working volume width of 8 inches would be occupied by the ferrofluidpool. The resulting horizontal cross-section of the ferrofluid pool would be16 x 8 inches, compared to the present 8 x 6 inches; the capacity of this largeseparator would therefore be about 2. 6 times as large on the present one.
The comparison made in Appendix B between the present magnet andthe proposed large magnet shows very clearly the economics of scale obtainedwith the larger design. Although the large magnet is expected to have 2. 6 timesthe capacity of the small magnet it weighs only 1.8 times as much and consumesonly 1.33 times as much power.
Table XVIII lists the capacity of the present separator and the proposedlarger separator for the three separations to be made by this plant. Thesecapacities will be used as the basis for the plant design.
5. Ferrofluid Recovery
As previously discussed, ferrofluid losses under laboratory conditionswere about 8 pounds per ton of scrap. Most of this loss being apparently due tothe manual handling of the scrap and the solvent ferrofluid solutions.
-64-

TABLE XVIII
CAPACITIES OF SEPARATORS
Capacity (lb/hr)
Separation Present Separator Proposed Separator
Aluminum and lighter from 2,700 7, 100zinc and heavier
Zinc from copper and 2,600 6,800heavier
Aluminum from non-metals 1,800 4,700
It will therefore be assumed that in a commercial operation withscrap handled automatically, and long running periods between separator cleaning,that the ferrofluid losses will be considerably lower. The specific estimate offerrofluid loss that has been used up to now, one quart of about 2.7 pounds perton will continue to be used. The losses of solvent are estimated to be about1. 5 gallons per ton of scrap. This is however a very rough estimate.
Figure 29 shows a schematic diagram of a ferrofluid recovery systemproposed for commercial use, and its key operating parameters as a function ofscrap processing rates. Table XIX lists the capacities of the various pumps andthe storage tanks as a function of scrap degreasing rate.
TABLE XIX
SIZE OF SYSTEM COMPONENTS-SOLVENT RECOVERY
Pump Capacities
Scrap Processing Rate gm-) Tank Volumes (Gallons)(Tons/Hr.) P-1 P-2 P-3 P-4 Solvent Ferrofluid
1 1.54 1.46 0.08 0.08 500 100
2 3.08 2.92 0.16 0.16 1,000 200
5 7.70 7.30 0.40 0.40 2,500 500
The pumps were sized on the basis of using 88 gallons of solventper ton of scrap and a ferrofluid carryover from the separator of 50 pounds offluid per ton of scrap. The size of the solvent and ferrofluid tanks is somewhatarbitrary, but more than ample to supply the inventory of these fluids in thedegreaser and separator, as well as the operating losses.
-65-

CLEAN SOLVENT
<DEGREASER
SOLVENT AND FERROFLUID
COOLINGWATER
1SOLVENTTANK
SOLVENT ELECTRICSTILL POWER
P-2
P-3
FEERRRROFLUD TOFLUD
FERROFLUID TOSEPARATOR
P-4
TONS SCRAP ELECTRIC POWER COOLING WATERDEGREASED/HOUR REQUIRED, kw REQUIRED, gal/hr
1.0 42.7 427
2.0 85.4 854
5.0 213 2130
83-1504
Figure 29 FERROFLUID RECOVERY SYSTEM
-66-

B. Basis for the Cost Estimates
1. Capital Cost
The capital cost of the plant will be estimated from the purchased costof the major pieces of process equipment by multiplying the total purchased costby a factor which takes into account the expenditures required to transform thepurchased equipment into an operating plant. This is an accepted technique ofestimating plant costs at the budget planning stage, and is accurate to within 15-20%.The specific technique of estimation is one developed by K. M. Guthrie and describedin detail in the March 24, 1969 issue of Chemical Engineering. In this techniqueall cost elements of constructing the plant can be related to the purchased equipmentcosts, by multiplying the purchased equipment cost by different factors. Thesefactors vary in some cases with the magnitude of the project and mix of liquidand solid handling equipment. In Appendix C, these factors are listed for thedirect and indirect cost elements, assuming that the plant will cost less than $1,000, 000and will be predominantly of the solids handling type.
The final relation for estimating the erected cost of the plant, fromthe purchased cost of the equipment is:
Erected Cost = 2. 232 x Purchased Cost
In the following sections, methods for estimating the purchased costsor FOB costs of the principal plant components are developed.
a. Magnet Costs
Two sizes of magnets and associated material handling equipmentcan be used in some of the plant design to be presented. The small magnet wouldbe essentially identical to the magnet constructed under the present NASA contract.The larger magnet is designed to have 2. 6 times the scrap processing capacity ofthe present magnet. The magnets are contrasted in detail in Appendix B. Thepresent magnet was constructed under a sub-contract for $17, 500. It is estimatedthat duplicates of this magnet should be obtainable for $15, 000, reflecting asavings in engineering and other overhead costs which apply only to the first model.The large magnet would cost about $23,400. The materials handling systems, orseparators, would be essentially identical for the two magnets. The separatorfor the larger would be a stretched out version of the smaller one, with somewhatmore powerful conveyor motors. On the basis of the experience gained in buildingthe present separator we estimate that its duplicate should be obtainable for$5, 000, and that the larger version should be obtainable for $6, 000. Thus, thepurchased costs of the duplicate of the present magnet-separator will be $20, 000and that of the large magnet-separator $29, 400. The cost of rectifiers forpowering the magnets is estimated to be $50 per Kw.
b. Conveyor Costs
Two types of conveyors are used in the plant designs. Forpurely horizontal transport of scrap, vibratory conveyor are specified. Theapproximate costs of these conveyors were obtained from conveyor manufacturersand are plotted in Figure 30. These costs are accurate to about 10%. For non-horizontal transport of scrap, piano hinge conveyors are specified. These
-67-

10 1 1.18-
6
4
COST 17 INCHES WIDE$1,000 11 INCHES WIDE
2 -
1 2 4 6 8 10 100
83-1505 CONVEYOR LENGTH, ft
Figure 30 ESTIMATED PRICE OF VIBRATORY CONVEYORS

conveyors have 4 inch high cleats which enable them to elevate scrap at anangle of up to about 600. These conveyors typically consist of a horizontalsegment, followed by a rising section at an angle of 450, and concluding withanother horizontal segment. The cost of these conveyors is calculated fromtheir total length and the number of bends (two for the above conveyors). A costformula recommended by a manufacturer of such conveyors designed for scraphandling is presented in Table XX.
TABLE XX
COSTS OF PIANO HINGE CONVEYORS
Conveyor Width
Component 18 Inches 24 Inches 36 Inches
Drive and terminals $1,300 $1,500 $1, 730
Bend 300 350 400
Per Foot 109 125 144
The total purchased cost of a conveyor is obtained by adding thecost of the drive and terminals, the cost of the bends and the number of feetmultiplied by the cost per foot. Thus a 24" wide conveyor having a total lengthof 10 feet and two bends would cost $1,500 + 10 x $125 or $3, 450.
c. Feed Bins
For transfer of stored scrap onto a conveyor, bins having a45 conical bottom are used. In the experimental phase of the current program, asmall bin of this type was used to feed the separator via a vibrating feeder. Thesystem worked well and it is therefore proposed to employ it for the plant design.A typical configuration of two bins being filled by means of one elevating pianohinge conveyor and emptying onto a vibrating conveyor is illustrated in Figure 31.In order to save on conveyor costs one conveyor is positioned to fill these twobins by means of a rotating chute. This technique can be used to fill up to fourbins by means of one conveyor.
The vibrating feeder presently being used costs $300. It appearscapable of handling over 3 tons of scrap per hour, and good feed rate controlwas obtained down to less than 500 pounds per hour. This type of feeder istherefore proposed for use in the plant designs. The cost of the feed bins isestimated from a correlation for flat top tanks presented in the Guthrie costestimating paper, and updated to 1973. This correlation is shown in Figure 32.
d. Ferrofluid Recovery Module
The costs of the major pieces of equipment comprising theferrofluid recovery module shown in Figure 29, were estimated by three differenttechniques. The costs of the pumps and storage tanks were estimated frompublished correlation, and are listed in Table XXI. The cost of the solventrecovery stills was estimated from the vendor quotes shown in Figure 33. Each
-69-

PIANO HINGE CONVEYOR FOR FILLING BINS(END VIEW)
ROTATING FEED CHUTE - BIN ABEING FILLED
\ -ALTERNATE POSITION - BIN BBEING FILLED
BIN A BIN B
12.8'
VIBRATINGFEEDERS
83-1506 VIBRATING CONVEYOR FOR EMPTYINGTHE BINS (END VIEW)
Figure 31 FEED BIN CONFIGURATION
-70-
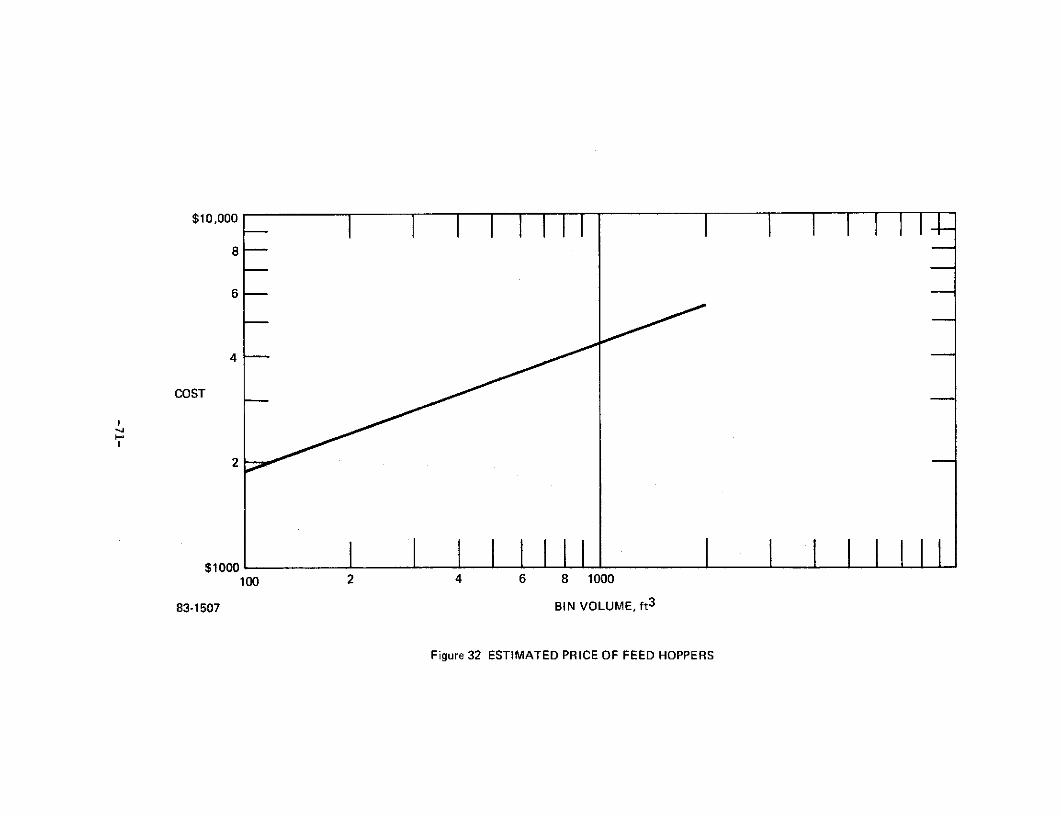
$10,0008
6
4
COST
2
$1000 I I I100 2 4 6 8 1000
83-1507 BIN VOLUME, ft 3
Figure 32 ESTIMATED PRICE OF FEED HOPPERS

datum point is a different quote. For estimation, the costs predicted by thecorrelation line shown in this figure were used. These costs are listed as a
function of scrap processing rate in Table XXII. The sum of the pumps, tank andstill costs which is the total equipment cost exclusive of the degreaser itself,are plotted in Figure 34. This figure will be used to estimate the cost of thisportion of the ferrofluid recovery module for the plant designs.
TABLE XXI
FERROFLUID RECOVERY MODULE-COST OF PUMPS AND TANKS
(See Figure 29)
Scrap Processing Rate Pump Costs* Tank Costs
(Tons/Hr.) P-I P-2 P-3 P-4 Solvent Ferrofluid
1.0 $390 $390 $200 $200 $ 850 $100
2.0 440 440 200 200 1,200 200
5.0 500 500 200 200 2,100 350
*Estimated From "How to estimate the costs of pilot plant equipment"Chemical Engineering, February 9, 1970 and updatedto 1973.
The cost of the degreaser itself is known less accurately.
Discussions with manufacturers indicate that a degreaser capable of processingup to about 2 tons of scrap per hour would cost $15, 000 after the prototypestage had been passed. The first prototype unit might cost somewhat more.
TABLE XXII
FERROFLUID RECOVERY MODULE-COST OF STILLS
Scrap Processing Rate Still Capacity(Tons/Hr.) gph Still Cost
1.0 88 $2,700
2.0 176 4,400
5.0 440 8,300
-72-

$10,000 I TI I I I I I I-8
6
4
COST
2
$1,000 I I I10 2 4 6 8 100 1000
83-1508 CAPACITY, gph
Figure 33 ESTIMATED PRICE OF SOLVENT RECOVERY STILLS

- I I I 1i1i 1 I I II 1-1-8
LU 4a
0
u 4LUU)0c-
CL
cn-O 2
F-
$1,000 2 4 6 8 $10,000
83-1509 COST OF PUMPS, TANKS AND STILL
Figure 34 ESTIMATED PRICE OF ENTIRE FERROFLUID RECOVERY MODULE

2. Operating Costs
The estimation of operating costs at this stage of process developmentis not as accurate as the estimation of capital costs, because of the lack of longterm operating experience. Such operating factors as labor requirements,maintenance practices and losses of ferrofluid and solvent can only be roughlyestimated. The following sections outline the assumptions made in estimatingthe principal operating costs.
a. Operating Labor
Three classes of operating labor are used at the followingannual rates:
Foreman - $12, 000
Operators - 9,000
Helpers - 7,000
These labor rates are burdened at 81% to take into account supervision, payrolloverhead and indirect costs. This labor burden is based on estimates made inan engineering feasibility study by the National Center for Resource Recovery ofrecovering aluminum and glass from municipal solid waste. It is felt thi.t themunicipal waste operation is sufficiently similar to auto scrap recovery for thelabor overheads to be comparable.
b. Maintenance
Maintenance costs including both labor and materials areestimated to be 6% of capital costs. This "6%" figure is widely used to e timatemaintenance costs in processing plants not subject to severe corrosion( 3 ) . Theuse of this technique to calculate maintenance costs in scrap processing plants isclearly a very rough estimate. More accurate maintenance costs require actualoperating experience.
c. Supplies
This category includes both ferrofluid and solvent makeup.Ferrofluid losses as previously mentioned are estimated to be 1 quart per ton ofscrap. Avco projects that at a production rate of about 3,000 gallons per year,the cost of ferrofluid will be $30 per gallon, corresponding to $7. 50 per t on ofscrap. The loss of degreasing solvent, probably trichloroethane, is estimated to
be 1.5 gallons per ton. This is a rough estimate, actual operating experience isrequired to generate more accurate values. At a cost of $1.60 per gallon in55 gallon drums, this amounts to $2. 50 per ton of scrap. If the solvent were boughtin tank car lots, the price would be about $1.30 per gallon, corresponding to$1. 95 per ton.
d. Utilities
It is assumed that the only energy source that will be availablein electricity, which is charged at $0. 015 per Kwh. Were steam available for thesolvent stills it would be a cheaper source of energy.
Cooling water for the magnets and the stills is charged at $. 10per 1,000 gallons.
-75-

Another charge in this category is the cost of disposing of thenon-metals,this cost is estimated to be $6. 00 per ton. If the shredder operatorhad ample land this cost would not apply. The unit costs for electricity, cooling waterand non-metals removal vary considerably from locality to locality. Since the total ofthese costs is a small fraction of the total operating costs, deviations from the aboveunit costs will not introduce large cost differences.
e. Insurance
The following insurance costs are included:
Fire and business liability at $1.80 per $1, 000 ofplant capital
Property tax at $15. 00 per $1,000 ofplant capital
Unemployment compensation $2. 50 per $1, 000 ofplant payroll
3. Profitability
The profitability of the plant is determined by the sales price ofthe separated metals, the price that could have been obtained for them in theunseparated form, and the cost of separating them according to the followingequations:
Plant Profits = Added Value - Operating Costs,
where
Added Value = Price of Separated Metals - Price ofUnseparated Metals
Table I presents the basis of Avco's estimate of the added valueobtainable for the separated metals.
The measure of profitability used in this analysis in the payout timeon invested capital. More sophisticated measures, reflecting more accuratelythe time value of money were felt to be inappropriate for a process at this stageof development.
C. Plant Design
1. Batch Plant
This plant is designed to process one ton of nonferrous metal per hourby using only one separator and one degreaser. This requires that intermediateproducts be stored for further processing. Consequently a rather large number offeed bins and conveyors is used. The cost of these bins and conveyors is however,lower than the cost of additional separators and degreasers required for continuousprocessing. In a later section a continuous plant which uses five separators andfour degreasers for continuous processing at 5 tons per hour will be presented.Figure 35 shows the plant material balance for the plant and a schedule of separatoroperation. This schedule requires three changes in the apparent density of theferrofluid pool per shift. There is, however, enough storage capacity in the systemto allow these changes to be made only once every two shifts. Figure 36 shows a
-76-

NONMETALS 1,830 LB.FRACTION
ICNONMETALS & ALUMINUM
4,480 LB. ALUMINUM 2,670 LB.FRACTION
FEED/17,680 LB.
ZINC & COPPER13,180 LB. ZINC 10,250
FRACTION
COPPER 2,940FRACTION
SEPARATOR: LARGE TYPE
STAGE OF SEPARATION SCHEDULE OPERATING RATE
A 3.0 HOURS 84% OF CAPACITY
B 3.0 HOURS 65% OF CAPACITY
C 1.5 HOURS 63% OF CAPACITY
83-1510
Figure 35 EIGHT HOUR MATERIAL BALANCE - BATCH PLANT
-77-

NOTES: VIBRATORY FEEDERS ARE NOT SHOWN
HORIZONTAL CONVEYORS - CG-ARROWS SHOW DIRECTION
ELEVATING CONVEYORS - CR_ OF MOTION
FEED BINS - B
ROTATING CHUTES AT END OF CONVEYORS SYMBOLIZED BY
SCALE k- 25 FEET- *
B-7
CG-1 I I POWER SUPPLY
- B-5 R-4w nSEPARATOR B-1
___ CR-2
CR-3 B-2
CG-3
B-4 -3 CG-2F------
NONMETALS COPPERI Ii
L E lI cR-5DEGREASER
ZINC ALUMINUM I
SI FERROFLUIDSI RECOVERYI EQUIPMENT
LPRODUCT ST ORAGE
Figure 36 EQUIPMENT LAYOUT - BATCH PLANT
-78-

plan view of the proposed plant layout. The flow of materials through the plant maybe understood with the aid of Tables XXIII and XXIV which describe the bins and theconveyors. The following description of material flow during Stage A of separation,which is the separation of the non-metals and aluminum from the denser metals,illustrates the functioning of the system.
TABLE XXIII
LIST OF FEED BINS - BATCH PLANT
Volume Height Above FloorBin Stored Material (ft 3 ) (ft) Cost
B-1 Non-metals wet with ferrofluid 100 12 $ 1,900
B-2 Zinc wet with ferrofluid 200 12 2, 400
B-3 Copper wet with ferrofluid 100 12 1,900
B-4 Aluminum wet with ferrofluid 200 12 2, 400
B-5 Aluminum and non-metals wet 150 10 2,000with ferrofluid
B-6 Zinc and copper wet with 200 12 2,400ferrofluid
B-7 Scrap feed to process 500 14 3,400
TOTAL $16, 400
The feed scrap is conveyed by CG-1 from B-7 to the separator.The floats, aluminum and non-metals are conveyed by CR-4 to B-5. The sinks,zinc and denser metals, are conveyed by CR-1 to B-6.
The degreasing of scrap is completely decoupled from the separations.The purified fractions contained in the in-process storage bins B-1, B-2, B-3and B-4 may be conveyed to the degreaser in any order and without any fixedrelation to the separations are going on concurrently.
The capital costs of the major pieces of equipment and the cost of theplant are given in Table XXV. The operating costs are listed in Table XXVI. Inthese economic analyses it is assumed that the plant is financed completely by equitycapital without any debt. The re sulting payout time on the invested capital is 2. 8 years.This payout time, although adequate in many circumstances, can be improved whenenough scrap is available to keep the plant operating for two or three shifts. Underthese circumstances the capital cost remains constant, while most of the operatingcosts rise in proportion to the operating hours. In order to be prudent it has beenassumed that the maintenance costs will also rise in proportion to the hours operated.The operating costs and profitability for 2 shift and 3 shift operation are given inTables XXVII and XXVIII. The improved profitability produced by more effectiveplant utilization decreases the payout from 2.8 years for one shift operation to1. 6 years for two shift and down to 1. 1 years for three shift operation.
-79-

TABLE XXIV
LIST OF CONVEYORS - BATCH PLANT
Lower Upper HorizontalPoint Point Length Rise
Conveyor Function ft ft ft ft Cost
CG-1 Convey scrap from B-5, B-6 2 4 19 2 $ 4, 300and B-7 to separator
CG-2 Convey scrap from B-I, B-2 2 2 23 0 2,400B-3 and B-4 to degreaser
CG-3 Convey scrap from B-3 and 2.5 2. 5 16 0 1,900B-4 to CG-2
CR-I Convey sinks (stage A) 2 14 13 12 3,600
from separator to B-6
CR-2 Convey floats (stage B 2 14 13 12 3,600
and C) from separator toB-1 and B-2
CR-3 Convey sinks (stage B and 2 14 13 12 3,600
C) from separator to B-3and B-4
CR-4 Convey floats (stage A) 2 10 10 8 3,000to B-5
CR-5 Convey degreased scrap 6 12 16 6 3,800
to storage hoppers$26, 200
Note: CG conveyors are 17" wideCR conveyors are 18" wide
-80-

TABLE XXV
CAPITAL COSTS - BATCH PLANT
Item Comments Cost Percent
Magnet Separator Large Type $ 29,400 8.22
Power Supply 60 Kw 3,000 0. 84
Conveyors Table XII 26,200 7.33
Feed Bins Table XI 16,400 4.59
Degreaser 2 Tons Per Hour 15,000 4.20
Still andAncillaries 5, 000 1. 40
Total FOB Cost $ 95,000 26.57
Plant Cost = 2. 232 x $95, 000 = $212, 000 59. 30
Electr. Substation $ 6,500 1.82
Building 4900 ft 2 $ 79,400 22. 21
TOTAL $297, 900 83.33
Contingency (20%) $ 59,600 16.67
Total Capital Requirements $357, 500 100. 00
-81-
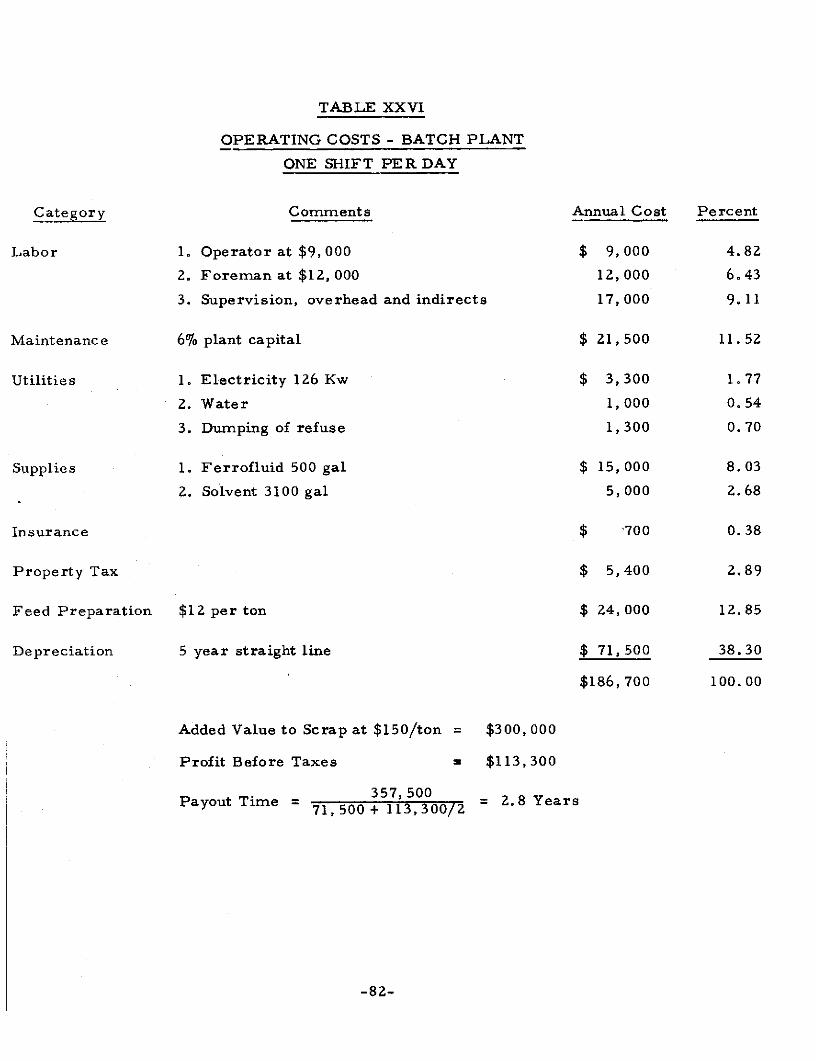
TABLE XXVI
OPERATING COSTS - BATCH PLANT
ONE SHIFT PER DAY
Category Comments Annual Cost Percent
Labor 1. Operator at $9, 000 $ 9,000 4.82
2. Foreman at $12, 000 12,000 6.43
3. Supervision, overhead and indirects 17, 000 9.11
Maintenance 6% plant capital $ 21,500 11. 52
Utilities 1. Electricity 126 Kw $ 3,300 1.77
2. Water 1,000 0.54
3. Dumping of refuse 1,300 0.70
Supplies 1. Ferrofluid 500 gal $ 15,000 8.03
2. Solvent 3100 gal 5,000 2.68
Insurance $ "700 0.38
Property Tax $ 5,400 2.89
Feed Preparation $12 per ton $ 24,000 12.85
Depreciation 5 year straight line $ 71,500 38.30
$186,700 100.00
Added Value to Scrap at $150/ton = $300,000
Profit Before Taxes = $113,300
357,500Payout Time = 71,500 + 113,300/2 = 2.8 Years
-82-

TABLE XXVII
OPERATING COSTS - BATCH PLANT
TWO SHIFTS PER DAY
Category Comments Annual Costs Percent
Labor 1. Operators (2) $ 18,000 6.08
2. Foreman (2) 24,000 8. 11
3. Supervision, etc. 34,000 11.49
Maintenance 12% of plant capital $ 43,000 14, 53
Utilities 1. Electricity $ 6,600 2.23
2. Water 2,000 0.68
3. Dumping of refuse 2,600 0, 88
Supplies 1. Ferrofluid $ 30,000 10.14
2. Solvent 10,000 3.38
Insurance $ 800 0.27
Property Tax $ 5,400 1.82
Feed Preparation $ 48,000 16.22
Depreciation $ 71,500 24.16
$295,900 100.00
Added Value at $150/Ton = $600, 000
Profit Before Taxes = $304, 100
357, 500Payout Time = 71,500 304,100/2 = 1.6 Years
-83-

TABLE XXVIII
OPERATING COSTS - BATCH PLANT
THREE SHIFTS PER DAY
Category Comments Annual Costs Perce
Labor 1. Operators (3) $ 27,000 6.2. Foreman (3) 36,000 8.3. Supervision, etc. 51,000 12.
Maintenance 18% of plant capital $ 64,500 15.
Utilities 1. Electricity $ 9,900 2.2. Water 3,000 0.3. Dumping of refuse 3,900 0.
Supplies 1. Ferrofluid $ 45,000 11.2. Solvent 15,000 3.
Insurance $ 900 0.
Property Tax $ 5,400 1.
Feed Preparation $ 72,000 17.
Depreciation $ 71,500 17.
$405,100 100.0
Added Value to Scrap at $150/Ton = $900, 000
Profit Before Taxes = $494,900
Payout Time = 357,00 11 Years71,500 + 494, 900/2
-84-

2. Continuous Plant
This plant is designed to process larger quantities of scrap than canbe conveniently processed by means of a batch plant. Specifically, 5 tons perhour, 20 hours per day for 250 days per year, or a total of 25, 000 tons per year.This quantity of material is most conveniently processed in a continuous system,separated products from Stage A are continuously fed to the separators ofStage B and Stage C. The four separated products from Stage B and C arecontinuously fed to four degreasers.
The operating schedule is based on three 6 2/3 hour operating shiftsper day. These short shifts are specified to allow time for maintenance betweenthe conclusion of one shift and the start of the next. If it should turn out thatless maintenance is required, then the plant could be run for more hours and itsproductivity would rise accordingly.
In order to reduce labor costs, no materials handling operator isused on one shift. This savings can be realized by having the operator on thepreceeding shift empty the product bins so that they can accommodate the entireoutput of the succeeding shift. Similarly, one shift is run without a foreman. Theforeman of the preceeding shift being available to start-up the succeeding shift.
A one hour material balance for this plant is shown in Figure 37, anda plan view of the plant layout is shown in Figure 38. The two large separatorsthat carry out the Stage A separation in parallel and the two that carry out theStage B separation are rather under-utilized. Some capital savings would beobtained by using a small and a large separator for each stage. It was felt thatthe additional complexity of adjusting feed rates to each separator was not worththe possible savings. The degreaser sizes are more closely matched to the sizeof the stream being treated in order to reduce these costs. The cost of thedegreasers was assumed to still be $7, 500 per ton per hour. The plant conveyorsare described in Table XXIX. The plant capital costs are given in Table XXX andthe operating costs are given in Table XXXI. As in the analysis of the batch plantit has been assumed that the plant is financed completely by equity capital. Theresulting payout time on the invested capital is 0.6 year.
The principal reason that this payout is better than for the batch plantis that the capital equipment is more thoroughly utilized and the labor requirementsper ton are lower. For example, the smallest sized commercially availableconveyors that can handle scrap 2-3 inches in size are oversized in capacity forthe batch plant, but of proper size for the continuous plant.
D. Discussion
The recovery of nonferrous metals from automobile scrap by ferrofluidlevitation promises to be a profitable process. The profitability as measured bypayout time on invested capital runs from 2. 8 years for a plant processing2000 tons of scrap per year to 0. 6 year for a plant processing 25, 000 tons per year.The former plant has sufficient capacity to process the nonferrous scrap from300 shredded automobiles per day. The latter plant can process the nonferrousmetals from 3, 750 cars per day.
-85-

NONMETALS FRACTION 1140 LB.
C 1 SEPARATORNONMETALS &ALUMINUM2,800 LB. 2 LALUMINUM FRACTION 1660 LB.
FEED A 2 SEPARATORS11,040 LB.
ZINC & COPPER ZINC FRACTION 6400 LB.8,240 LB.
B 2 SEPARATORS
COPPER FRACTION 1840 LB.
STAGE OF NO. OF SEPARATORS OPERATING RATE
SEPARATION (LARGE)
A 2 78% OF CAPACITY
B 2 61% OF CAPACITY
C 1 60% OF CAPACITY
83-1512Figure 37 ONE HOUR MATERIAL BALANCE - CONTINUOUS PLANT
-86-

FERROFLUIDRECOVERYEQUIPMENT
B-2 B-1
POWERSUPPLY
NONMETALSCR-2 CR-1 STORAGE
NONMETALSDEGREASER CR-3
STAGE A SEPARATORS CG-6
EBALUMINUME
I DEGREASERCG-1 CR-4
S T A G E C S E P A R A T O R
STAGE B SEPARATORS ZINC
SSTORAGE
- CG-2 ZINCDEGREASER CR-5
CG-5 CG-4
cT COPPERCG-3 DEGRA CR-6 S
NOTES: VIBRATORY FEEDERS NOT SHOWN
HORIZONTAL CONVEYORS - CG-L ARROWS SHOW DIRECTION
ELEVATING CONVEYORS - CRJ OF MOTION
FEED BINS - B
SCALE --- 25 FEET----
83-1513
Figure 38 EQUIPMENT LAYOUT - CONTINUOUS PLANT
-87-

TABLE ;ZXIX
LIST OF CONVEYORS - CONTINUOUS PLANT
Lower Upper HorizontalWidth Point Point Length Rise
Conveyor Function (In.) (Ft.) (Ft.) (Ft.) (Ft.) Cost
CR-1 Convey Scrap from Feed 18 2 6 10 4 $ 3,200
CR-2 Bins to Stage A Separators 18 2 6 10 4 3, 200
CR-3 Convey Non-metals from 18 2 12 14 10 3,400Degreaser to Storage
CR-4 Convey Aluminum from 18 2 12 14 10 3,400Degreaser to Storage
CR-5 Convey Zinc from 24 2 12 14 10 4,500Degreaser to Storage
CR-6 Convey Copper from 18 2 12 14 10 3,400Degreaser to Storage
CG-1 Convey Floats from 11 2. 5 2. 5 18 0 2,000Stage A to Stage CSeparator
CG-2 Convey Zinc from 17 2.5 2. 5 24 0 2,700Stage B Separator toDegreaser
CG-3 Convey Copper from 11 2 2 24 0 2,500CG-4 and 5 to Degreaser
CG-4 Convey Copper from 11 2. 5 2.5 6 0 1,000CG-5 Stage B Separators to CG-3 11 2.5 2. 5 6 0 1,000
CG-6 Convey Non-metals from 11 2. 5 2. 5 8 0 1,100Stage C Separator toDegreaser $31,400

TABLE XXX
CAPITAL COSTS - CONTINUOUS PLANT
Item Comments Cost Percent
Magnet-Separators Large Type $147,000 15. 90
Conveyors Table XVI 31,400 3.40
Feed Bins 2 Bins 1, 000 ft 3 each 8,600 9.30
Power Supply 140 Kw 7,000 0. 76
Degreasers 40,000 4.33
Still and Ancillaries 11,800 12.76
Total FOB Cost $245,800 26. 58
Plant Cost = 2. 232 x 245,800 = $548,600 59.26
Electrical $ 20,000 2.16Sub station
Building 12, 000 ft 2 $202,000 21.84
Total $770,600 83. 34
Contingency (20%) $154,800 16. 74
Total Capital Requirements $924, 700 100. 00
-89-
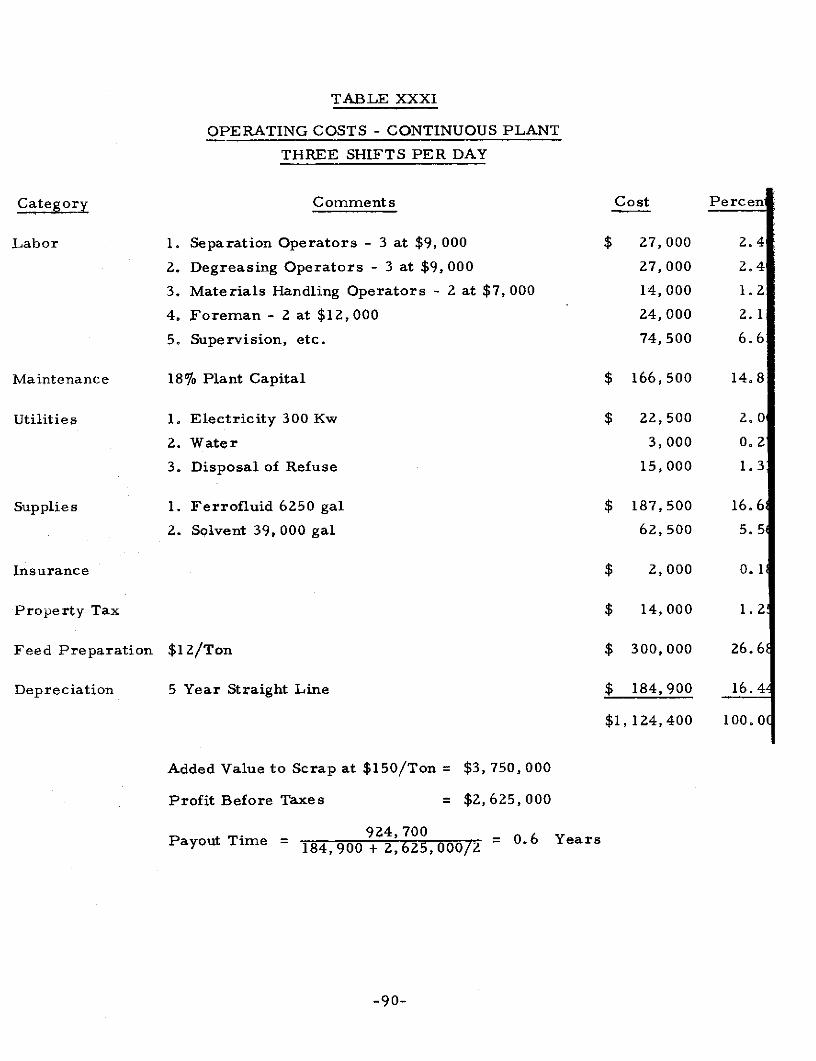
TABLE XXXI
OPERATING COSTS - CONTINUOUS PLANT
THREE SHIFTS PER DAY
Category Comments Cost Percen
Labor 1. Separation Operators - 3 at $9,000 $ 27,000 2.4
2. Degreasing Operators - 3 at $9, 000 27,000 2.4
3. Materials Handling Operators - 2 at $7,000 14,000 1. 2
4. Foreman - 2 at $12, 000 24,000 2.1
5. Supervision, etc. 74,500 6.6
Maintenance 18% Plant Capital $ 166,500 14.8
Utilities 1. Electricity 300 Kw $ 22,500 2.0
2. Water 3,000 0.2
3. Disposal of Refuse 15,000 1. 3
Supplies 1. Ferrofluid 6250 gal $ 187,500 16.6
2. Solvent 39, 000 gal 62,500 5.5
Insurance $ 2,000 0.1
Property Tax $ 14,000 1.2
Feed Preparation $12/Ton $ 300,000 26.61
Depreciation 5 Year Straight Line $ 184,900 16.4,
$1,124,400 100.0
Added Value to Scrap at $150/Ton = $3, 750, 000
Profit Before Taxes = $2, 625,000
924,700Payout Time = 184, 900 + 2, 625,000/2 = 06 Years
-90-

The largest automobile shredders currently operating can process about1, 200 cars per day. Accordingly this large plant could be a central processingplant for a number of shredders. Because the large plant is more profitablethan the smaller one, a tendency may develop for a number of small shredderplants to process their nonferrous metals in such a central plant. This tendencywould be particularly strong in densely populated areas with a concentration ofsmall shredders. Large plants, shredding about 1,000 cars per day, could processtheir nonferrous metals on a small, batch plant by operating it for three shiftsper day. The profitability of this operation, while not as good as that of a centralprocessing plant, is very high and promises to be attractive to operators of largeshredder plants.
The attractiveness of nonferrous metal separation for the shredderoperator who has only enough metal for one shift of operation (2, 000 tons per yearfrom 300 cars per day), might be increased if the plant were partly financed byborrowed capital. This assumes of course that the small shredder operator couldobtain this capital at a reasonable interest rate, probably no higher than about 10%.
The above considerations suggest that the ferrofluid levitation processfor nonferrous metal separation will be very attractive for large and medium shredderoperators who have between 4, 000 and 6, 000 tons of metal to process per year.Small shredder operators will probably find it more attractive to use a centralprocessing plant, or to finance the plant by borrowed capital.
E. Ecological Considerations
It is estimated that by 1975 about ten million automobiles will be shreddedannually in the United States. The resulting scrap will contain about 44, 000 tonsof aluminum alloys, 196, 000 tons of zinc alloys and 25, 000 tons of copper alloys.The recovery of this material and its recycle would have important ecologicalbenefits to the country. An important direct ecological benefit would be areduction in electrical energy requirements. The refining of metals from oresis an energy intensive process. -By replacing virgin metals with recycled ores,a substantial saving in the Nation's energy requirements results, with attendantreductions in the ecological side effects of electricity production. An estimateof these savings is shown in Table XXXII. The total energy savings of fivebillion Kwh are about equivalent to the energy consumption of a city of 900, 000 people.
By reducing the need for virgin metals the ecologically harmful sideeffects of mining and refining are reduced. The refining of zinc and copper oresis attended by troublesome sulfur dioxide emissions, and that of aluminum reductionby fluoride emissions. This is an indirect but important ecological benefit ofrecycling scrap metals.
The high potential profitability of this process has an important directecological benefit by encouraging the transportation of abandoned automobiles toshredder operators. Because the shredder operators will be able to recoverbetween $6 and $11 more per car, at a substantial profit, their demand for carswill rise. They will therefore pay more for junk cars, which will in turn be anincentive for auto wreckers to procure more cars. This will hopefully induce themto transport abandoned cars from locations, from which it has up to now beeneconomically impossible to do so.
-91-

TABLE XXXII
POTENTIAL ENERGY SAVINGS IN 1975
DUE TO RECOVERY OF NONFERROUS METALS
Energy to*Tons Win from Ores Energy Savings
Metal Recovered (Million Kwh) (Million Kwh)
Aluminum 49,000 2, 500 2, 400
Zinc 196,000 2,600 2,300
Copper 25, 000 340 300
5, 000
*Estimates based on ORNL-NSF Environmental Program ReportORNL-NSF-EP-24, "Energy Expenditures Associated with theProduction and Recycle of Metals"
The ferrofluid levitation process of scrap recovery and separation hasvirtually no harmful side effects on the environment. It of course uses electricalpower, but its operation as shown above, results on a large net decrease innational energy requirements. The modest water requirements of the processare solely for cooling, there is accordingly no by-product water pollution. Thereis of course a small amount of thermal pollution. In view however of the largeecological benefits of recycling scrap metals, this ecological disadvantage is almostinconsequential.
-92-

IV. CONCLUSIONS AND RECOMMENDATIONS
The results achieved in the execution of this program permit us to concludethat the recovery of relatively pure aluminum alloy and zinc alloy fractions fromshredded automobile scrap is technically feasible by the ferrofluid levitationprocess. In addition an enriched copper alloy fraction is also recoverable. Thespecific conclusion on which the economic analysis of the process were carriedout are:
1. The magnet design and construction met the objective of generatinga constant apparent density of at least 8 g/cm in a suitableferrofluid.
2. The removal of ferrofluid from separated scrap by solvent washingand the recovery of the ferrofluid by boiling away the solvent wasachieved with acceptable losses.
3. The present separator can carry out the various separation of nonferrousmetal recovery at rates of between 1800 and 3000 pounds per hour.
Based on these conclusions and engineering estimates, projections were madefor the economics of nonferrous metal recovery on an industrial scale. It wasconcluded that the process would be profitable for shredder operators handlingmore than about 300 cars per day. Payout time on invested capital ranged fromabout 3 years to less than a year, with increasing throughout. It thereforeappears that the process can be introduced into the automobile shredding industry.The public benefits of the widespread recovery of nonferrous metals by this processwould be:
1. Increased incentives for recovering abandoned cars, thus lesseningenvironmental pollution.
2. Increased recycling of metals with an attendant reduction in nationalenergy requirements.
3. Decreased needs to import nonferrous metals, which contributes tothe solution of the balance of payments problem.
Furthermore, the process would not produce any by-product pollution problems.In order to achieve these benefits the process must of course achieve a rapid andwide penetration of the industry. Because the car scrapping industry consists ofmany relatively small firms with limited risk capitol, the introduction requiresthe construction of a full scale plant to demonstrate unequivocably the profitabilityand the workability of the process under industrial constitution.
The first recommendation is therefore to construct and operate a demonstrationplant at an automobile shredder, as a means of introducing the process effectivelyto the industry.
-93-

The results achieved on automobile scrap appear applicable to the recovery
of nonferrous metals from municipal solid waste (MSW). The supply of nonferrous
metals in MSW waste is considerably larger than in car scrap, but it is present
in a much lower concentration. In order to determine what processing changesare required for this stream it is recommended that a program be undertaken to
study the recovery of nonferrous metals from MSW, using the separator constructed
under the current program.
-94-

V. REFERENCES
1. Papell, S.S. and Faber, O.C. Jr., "Zero and Reduced GravitySimulation on a Magnetic Colloid Pool Boiling System", NASA-TN-D-3288(February, 1966).
2. Papell, S. S. and Faber, O. C. Jr., "On the Influence of Non-UniformMagnetic Fields on Ferromagnetic Colloidal Sols", NASA-TN-D-4676,(August, 1968).
3. Braetner, H. and Grunner, R., "Conditions for the Appearance ofFerromagnetism in Real Gases", Z. Naturforsch, 23a, 648 (1968).
4. Nakagawa, Y., "Magnetic Susceptibility of Liquid Alloys", J. Phys.Soc. , Japan, 14, 1372 (1959).
5. Busch, G. and Guentherodt, H. J., "Ferromagnetic Behavior of LiquidAlloys", Phys. Letters, 27A, 110 (1968).
6. Neuringer, J.L. and Rosensweig, R.E., "Ferrohydrodynamics", ThePhysics of Fluids, 27, 1927-1937 (1964).
7. Kaiser, R. and Rosensweig, R.E., "Study of Ferromagnetic Liquid",NASA-CR-1407 (August, 1969).
8. Rosensweig, R.E., "Means for and Method of Moving Objects byFerrohydrodynamics", U.S. Patent 3,488,531 (January 6, 1970).
9. A Study to Identify Opportunities for Increased Solid Waste Utilization,Prepared for National Association of Secondary Material Industries, Inc.,by Battelle Columbus Laboratories, Columbus, Ohio, June, 1972.
10. Newell, Scott, "Technology and Economics of Large Shredding Machines",Proceedings of the Third Mineral Waste Utilization Symposium, ITTResearch Institute, Chicago, Illinois, March, 1972.
11. Automobile Disposal, A National Problem, U. S. Department of theInterior, Bureau of Mines, Washington, D.C., 1967.
12. Where Shredders are Located, Institute of Scrap Iron and Steel, Inc.,Washington, D.C., March, 1971.
13. Chemical Engineering Plant Design by Frank C. Vilbrandt andCharles E. Dryden, McGraw-Hill Book Company, 1959.
-95-

APPENDIX A
THEORETICAL ESTIMATE OF SEPARATION RATE IN
FERROFLUID SINK-FLOAT SEPARATOR
1. Motion of a Weakly-Magnetic Body in a Magnetized Ferrofluid
The purpose of this analysis is to develop approximate relations for predictingthe trajectory of weakly-magnetic bodies immersed in a ferrofluid, with theultimate objective of estimating separation rates in a scrap separator in which avertical magnetic field gradient acts in the direction of gravity. The equation ofmotion in the vertical direction is then given by:
dy d (dyAlsv dy + C D = F b (Al)
dt
v - volume of body
Os - density of body
y - distance in vertical direction
t - time
CD - drag coefficient
F b - body force
For the approximate results desired it is permisslbe to specialize theanalysis to spheres moving at Reynold's numbers low enough for Stokes Lawto apply. Under these conditions;
C D = 31 -d (AZ)
d - diameter of sphere
ii - viscosity of ferrofluid
The body force is given by:
F b = v( s - 0 f) g - v (Mf - Ms) G (A3)
g - acceleration of gravity
Of - physical density of ferrofluid
Mf - magnetic dipole moment per unit volume of the ferrofluid
A-1

M s - magnetic dipole moment per unit volume of the sphere
G - imposed vertical magnetic field gradient acting in thedirection of gravity
The "apparent" densities of the ferrofluid and the solids are defined as:
MfGaf = 0 + (A4a)
ag f
+ M -G (A4b)Oas Ps s g
The body force relation (3) may therefore be rewritten as:
F b = as af) g (A5)
For the initial conditions of interest;
y = 0, = 0 at t = 0;
the integral of Equation 1 is:
CDt
F b e -1 (A)Y = -C t + CD - (A6)
D D
b d (A7)
- = (O as - af) g (A7)D
D 18-- = (A8)ov P
CtFor small values of the variable , equation (6) reduces to:
as - 0 af t2y g - (A9)
A-2

This equation describes the motion of the sphere, for small values of time, wheneffects of viscosity are small. It shows, as expected, that for oaf < Pas, theobject will move downward, the positive direction; and for P af > 0 as it will move
upward. This equation can be simplified further, when p as is only slightlylarger than p s, to the following forms:
y = a(1 )tg (A9a)
as
The time required to traverse a distance y is obtained by invertingEquation (9a) as:
t - (Al 0)
(1 -af gas
This equation may be used to estimate the residence time of scrap in a ferrofluidseparator since the condition CD t/ p v < 1 obtains over most sets of operatingconditions.
For example, in a separator having a total height of 20 cm, with the scrapbeing introduced in the mid-plane, the largest value of y is 10 cm. The viscosityof the ferrofluid is about 0. 05 poise. For the separation of zinc from copper,
P as = 8. 9 and P af will be about 7. 9. Therefore, the value of CD t/ P v at theoutlet of the separator is obtained by combining Equations (8) and (10), as:
CDt 1.8x 0. 5 r 20 0.043
S 8.9 d2 0. Ix 980 d 2
Thus, for d greater than 4.7 mm (3/16"), the value of CDt / P v < 0.2, andequations (9) and (10) are useful approximations. Since scrap produced by hammer-milling shredded automobiles is generally larger than this, these equationsmay be used to calculate approximate times for this type of scrap in a separator.
2. Estimate of Separation Rates in a Levitation Separator
The ferrofluid volume in which separation takes place is illustrated schematicallyin Figure A-1. The feed is shown being introduced at the mid-plane, with theproducts being removed at the top and bottom. The volumetric transfer rate of
scrap from the mid-plane to the end Iplanes is given by:
Q = Ay E /t (All)
A - horizontal cross-sectional area of separator
E - volume fraction of separator occupied by scrap
t - transit time from mid-plane to top or bottom planes as given by
Equation 10
A- 3

"LIGHTS" Z = L
Z=O
GRAVITY 1"
-i
SEPARATOR HEIGHT
82-4015 "HEAVIES"
Figure A-1 SCHEMATIC OF SEPARATOR
A-4
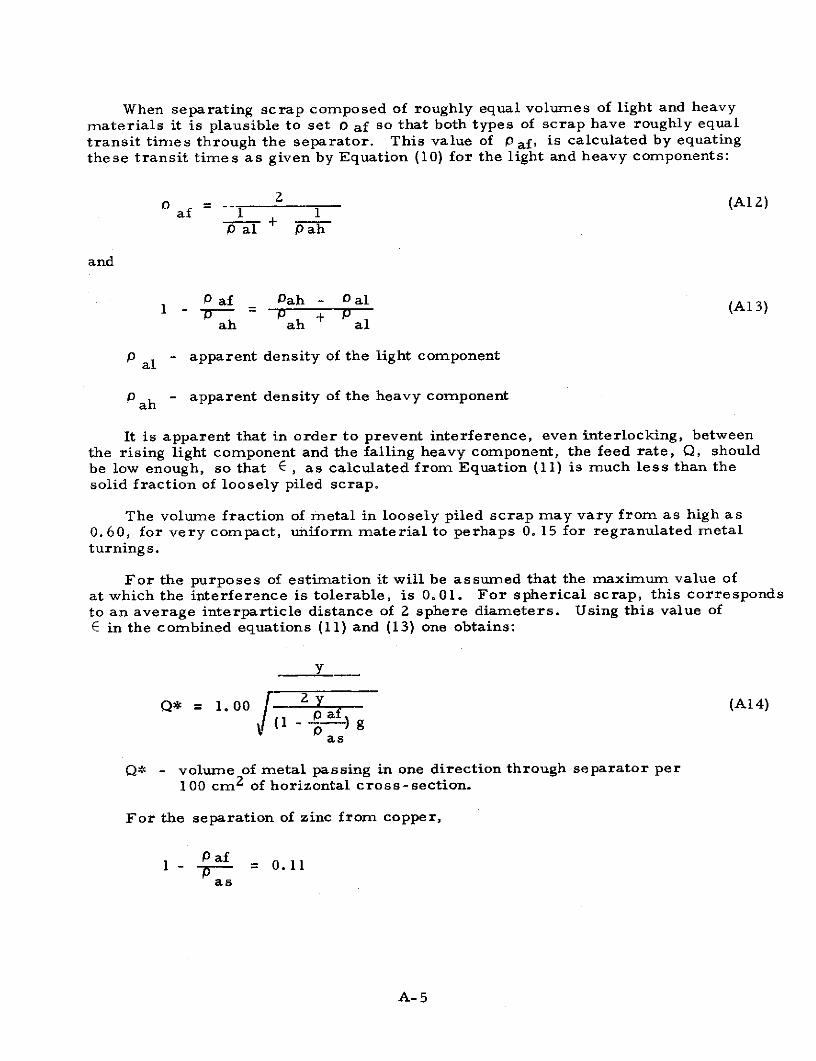
When separating scrap composed of roughly equal volumes of light and heavymaterials it is plausible to set 0 af so that both types of scrap have roughly equaltransit times through the separator. This value of Paf, is calculated by equatingthese transit times as given by Equation (10) for the light and heavy components:
2 (AL2)Iaf - 1 1
I a+ pah
and
P af oah - Oal1 (A13)1 - = P + P
ah ah al
P al - apparent density of the light component
P ah - apparent density of the heavy component
It is apparent that in order to prevent interference, even interlocking, betweenthe rising light component and the falling heavy component, the feed rate, Q, shouldbe low enough, so that E , as calculated from Equation (11) is much less than thesolid fraction of loosely piled scrap.
The volume fraction of metal in loosely piled scrap may vary from as high as0.60, for very compact, uniform material to perhaps 0. 15 for regranulated metalturnings.
For the purposes of estimation it will be assumed that the maximum value ofat which the interference is tolerable, is 0.01. For spherical scrap, this correspondsto an average interparticle distance of 2 sphere diameters. Using this value ofE in the combined equations (11) and (13) one obtains:
Y
Q* = 1. 00 g (A14)
(1 - - ) gas
Q* - volume of metal passing in one direction through separator per100 cm 2 of horizontal cross-section.
For the separation of zinc from copper,
P af1 - P - 0.11
_P_as
A-5

Using y = 10 cm
Q" = 23.4 cm2/sec
= 1650 lb/hr of copper
= 1320 Ib/hr of zinc
When more than two components are present in the mixture to be separatedequation (14) is still applicable to every component. If Paf is set to the valuegiven by equation (12), intermediate between Pah and P al, then all componentswith a density greater than P ah will sink more rapidly than component h, and allcomponents with a density lower than P al will float more rapidly than component i.Consequently, if the value of t corresponding to 1 is used in equation (11), thevalue of Q* so calculated will be a conservative estimate of the capacity of theseparator.
3. Scale-Up of Separator Length (Z)
In the previous analysis of separation rates it is assumed that the scrap piecesintroduced through the "feed" plane (Z = 0) are distributed along the mid-planeof the separator volume up to Z = L (Figure A-i). To achieve this distributionthe scrap pieces must be introduced into the ferrofluid volume with a horizontalvelocity component which is sufficiently high to overcome the viscous resistanceencountered in reaching Z = L.
This velocity (Vo) can be calculated by solving Equation (1) under the followingspecialized conditions:
F b = 0
At
dZt = 0; Z = 0 = Vodt
dZdZ= 0 when Z = L
The re sulting equation for Vo is:
Vo = 18-- L (A15)d Ps
For a ferrofluid having the following properties:
S= 0. 05 poise
S= 1. 2 g/cm 3
A-6

and for scrap pieces of density 2.7 (aluminum), larger than 5 mm, the minimumvelocity is:
Vo = 1. 33 L
In the present separator L is 20 cm, the required velocity is therefore27 cm/sec or 52 feet per minute. For scrap of higher density, the velocity wouldbe lower as predicted by Equation (15).
To construct a separator having twice the capacity of the present one, bydoubling its length to 40 cm, the velocity of feed introduction would have to becorrespondingly doubled to about 104 feet per minute. Such velocities can beroutinely obtained by introducing the scrap by means of a horizontal conveyor orby sliding it down an inclined chute.
A-7

APPENDIX B
MAGNET DESIGN
1. Pole Piece Shape
The design of poles to yield a constant gradient field in the direction ofgravity is based on a rectangular hyperboloid, shown in Figure B-I. The polesextend indefinitely in both the +Z and -Z directions.
The magnetic field between the poles and the mirror plate is given by:
H = rx + r y (B1)
r is the magnetic field gradient along the y axis. The y component of themagnetic field gradient is:
aH r (BZ)
This gradient component has its maximum value, r, along the y axis.It has lesser, constant values along straight lines passing through the origin.Three sets of these straight lines along which the gradient is lower by 5%, 10%and 15% than its value along the y axis, are shown in Figure B-1.
The construction of a magnet based on infinitely large poles is of courseimpractical. A modified finite pole design which maintains the gradient accuracyof the ideal pole, within the sector bounded by the 10% accuracy lines has beendeveloped by Avco. It is shown in Figures B-2 and B-3.
2. Motion of Objects Within the Working Volume
An object introduced into a ferrofluid pool within the working volume experiencesboth vertical and horizontal magnetic forces. The effect of the vertical magneticforces, which determine whether an object sinks or floats has been discussed inAppendix A. The horizontal forces are produced by a magnetic field gradientpointing from the axis of the working volume toward the poles. The magnitude ofthis gradient is
H r (B3)axB-
B-1

"MIRROR" PLATE4x
5% 5%
10% 10%
15% 15%
POLE POLE
+v
82-4016
Figure B-1 HYPERBOLIC POLES
B-2

STEEL PLATE
+Y10% 10%
WORKINGVOLUME
POLE POLE
82-4017
Figure 8-2 CONSTANT GRADIENT POLES (FRONT VIEW)
B-3

STEEL PLATE
10% 10%
82-4018
Figure B-3 CONSTANT GRADIENT POLE (SIDE VIEW)
B-4

These forces move non-magnetic objects from the periphery of the workingvolume (the poles) toward the axis. Equation (2) shows that the vertical gradientand consequently the ferrofluid's apparent density become more and more constantas the axis is approached. Therefore the movement of scrap toward the axisbrings it into a region where high accuracy separation is possible. For example,it is possible to separate metals differing in density by considerably less than 10%,even though the vertical gradient at the upper corners of the working volume isabout 10% lower than the vertical gradient on the axis.
3. Yoke and Coil Design
Since in auto scrap separation, very high magnetic fields are not required, a"C" yoke is adequate. A magnet design based on such a yoke is illustrated inFigures B-4 and B-5.
The approximate weight of steel required for this magnet is given by:
Ws = 2 PSt hz (g + 2h + 21) (B4)
P St - density of steel
The weight of copper in both coils is given by:
W = 4 pc x tl[z + 2t + h] (B4a)
X - volume fraction of coil occupied by copper, typically 0. 45
Pc - density of copper
The power dissipated in both coils (8) is given by:
j = Pe J Vc (B5)
pe - electrical resistivity of copper, 2 x 10 - 6
J - current density in conductor
Vc - volume of copper
The current density is related to the number of ampere turns (NI) in bothcoils by:
NIX 2 lt (B6)
On combining equations (4), (5), and (6), one obtains;
De 2z+2t+hSIt= (NI) t (B7)
B-5

A
PLATE
COIL
POLE
-4-
POLE SHAPE SHOWN SCHEMATICALLY L A82-4019
Figure B-4 CONSTANT GRADIENT MAGNET (FRONT VIEW)
B-6

COIL
POLE
Z82-4020
Figure B-5 CONSTANT GRADIENT MAGNET (SIDE VIEW ALONG SECTION A-A)
B-7

The number of ampere turns required to power the coils depends on thegradient desired, the shape of the pole pieces and the saturation of the yoke. Forthe pole pieces illustrated in Figure B-2, when the yoke is unsaturated thedependence is obtainable by the application of Ampere's Law, and, is approximately;
FkNI k= - (B8)
k - width of working volume (Figure B-2)
For the present separator this relation holds up to about a gradient of 150 gaussper centimeter. Above this value the empirically determined relation between Iand F is used (Figure 13).
4. Application to Specific Magnets
The pre sent magnet and a magnet designed to accommodate a ferrofluid pooltwice as long, are contrasted in Table B-1.
TABLE B-1
MAGNET CHARACTERISTICS
Physical Dimensions (Figures B-4 and B-5)
Present Magnet Proposed MagnetDimension Inches Centimeters Inches Centimeters
g 21 53.3 21 53.3
Z 16 40.6 30 76.2
h 16 40.6 16 40.6
t 5 12.7 5 12.7
10 25.4 10 25.4
Length (g + 2 + 2h) 73 185.0 73 185.0
Weights
Pounds Kilograms Pounds Kilograms
Steel 10,500 4,760 19,700 8,950
Copper 1,340 610 1,800 820
B-8

The power requirements of the present magnet can be calculated from
Equation (7) and the measured relation between current and gradient which was
referred to above. These power requirements are plotted in Figure B-6. It
is expected that the proposed larger magnet will start exhibiting saturation of
the yoke at higher values of the current than the small magnet, because the large
magnet has relatively less leakage flux. In order to obtain a conservative
estimate of the electrical power requirements it will be assumed however, that
the form of the F vs I curves for this magnet will be the same as for the small
magnet. The power requirements of the large magnet are also shown in Figure B-6.
This figure also shows a plot of the apparent density of the ferrofluid used in
the course of this work, against the magnetic field gradient, which makes it possible
to calculate the power requirements as a function of apparent density. This
relation depends however on the ferrofluid used; other ferrofluids require a
different curve.
B-9

100I I I I I I I I I I I80
60
O PRESENT MAGNET
o- PROPOSED MAGNET
40
-1 -0o
a-
0
20
Co
cr 8 8
2 2
10 20 40 60 80 100 1000
83-1514 GRADIENT, gauss/cm
Figure B-6 POWER REQUIREMENTS OF MAGNETS
B-10B-IO

APPENDIX C
FACTORS FOR ESTIMATING PLANT CAPITAL COSTS
These factors are derived from K. M. Guthrie's article, "Capital CostEstimating" in the March 24, 1969 issue of Chemical Engineering.
Symbols: F.O.B. Equipment Cost - E
Auxiliary Construction Materials - m
Construction Labor - L
Total Material (m&E) - M
The indirect cost factors in Guthrie's method must be corrected for the size ofthe project, the L/M ratio and mix of solid and liquid handling equipment, Inmaking these estimates, it has been assumed that the cost of the plant will beless than $1, 000, 000 and that it will be a predominantly solids handling type.
The total of the direct cost elements in Table C- I is 1. 613E, and the total ofthe indirect cost elements in Table C-II is 0. 619E. The total cost of a plant istherefore equal to the sum of these, or 2. 232 times the F 0. B. cost of the majorpieces of process equipment.
The cost of buildings to house a plant is not included in the above costs. InGuthrie's method it is calculated from the plant area, and a general classificationof the type of plant it is. Table C-III shows these cost elements per square footof plant, adjust to 1973 costs from Guthrie's 1968 cost base.
As a check on the general validity of applying this cost estimating method toscrap plants, a comparison was made of the ratio of certain cost elements aspredicted by Guthrie to the same ratios as calculated by a much more detailedengineering study of solid waste recycling. This study of the cost of recyclingvaluable components from shredded municipal solid waste was undertaken bythe National Center for Resource Recovery, Inc., and published as "MaterialsRecovery System - Engineering Feasibility Study" in December, 1972.
1 ,, The comparison of critical cost ratios is shown in Table C-IV. The closeagreement between the cost ratios gives credence to the validity of using Guthrie'scost estimating method for scrap processing plants.
C-I

TABLE C-I
DIRECT COST ELEMENTS
F. O. B, Equipment Cost (E) 1. 000E
Construction Labor (L) 0. 343E
Sub-Total 1. 343E
Auxiliary Construction Materials:
Concrete 0. 085E
Steel 0. 005E
Piping 0. 015E
Electricity and Instruments 0. 160E
Paint 0. 005E
Sub-Total ( rj 0. 270E
Total Direct Costs 1. 613E
L/M = 0. 267
C-2

TABLE C-II
INDIRECT COST ELEMIENTS
Freight and Taxes 0. 1020E
Construction Overheads
Fringe Benefits 0. 0306E
Labor Burden 0. 0454E
Field Supervision 0.0368E
Temporary Facilities 0.0184E
Construction Equipment 0. 0306E
Small Tools 0. 0071E
Miscellaneous 0. 0366E
Sub-Total 0. z060E
Engineering Costs
Project Engineering 0. 0236E
Process Engineering 0. 0079E
Design and Drafting 0. 0452E,
Procurement 0. 0049E
Home Office Construction 0.0029E
Office Indirects 0. 0865E
Sub- Total 0. 171OE
Engineering Fee 0.1400E
Total Indirect Costs 0.6190E
C-3

TABLE C-III
PLANT BUILDING COSTS
Element Cost ($/ft 2)
Direct Costs
Building Shell $ 5.01
Lights 2. 15
Heating and Ventilation 1. 84
Plumbing 2. 09
Fire Prevention 1.35
Sub-Total $12. 44
Indirect Costs $ 3. 73
Total $16. 17
C-4

TABLE C-IV
COMPARISON OF COST RATIOS DERIVED BY TWO COST ESTIMATING METHODS
Cost Ratio Guthrie Method NC RR Study
m/E 0.270 0.230
L/E 0.343 0.341
Engineering
M + L 0.109 0.100
Contractor Overhead
M + L 0. 178 0. 196
C-5