Embed Size (px)
Citation preview
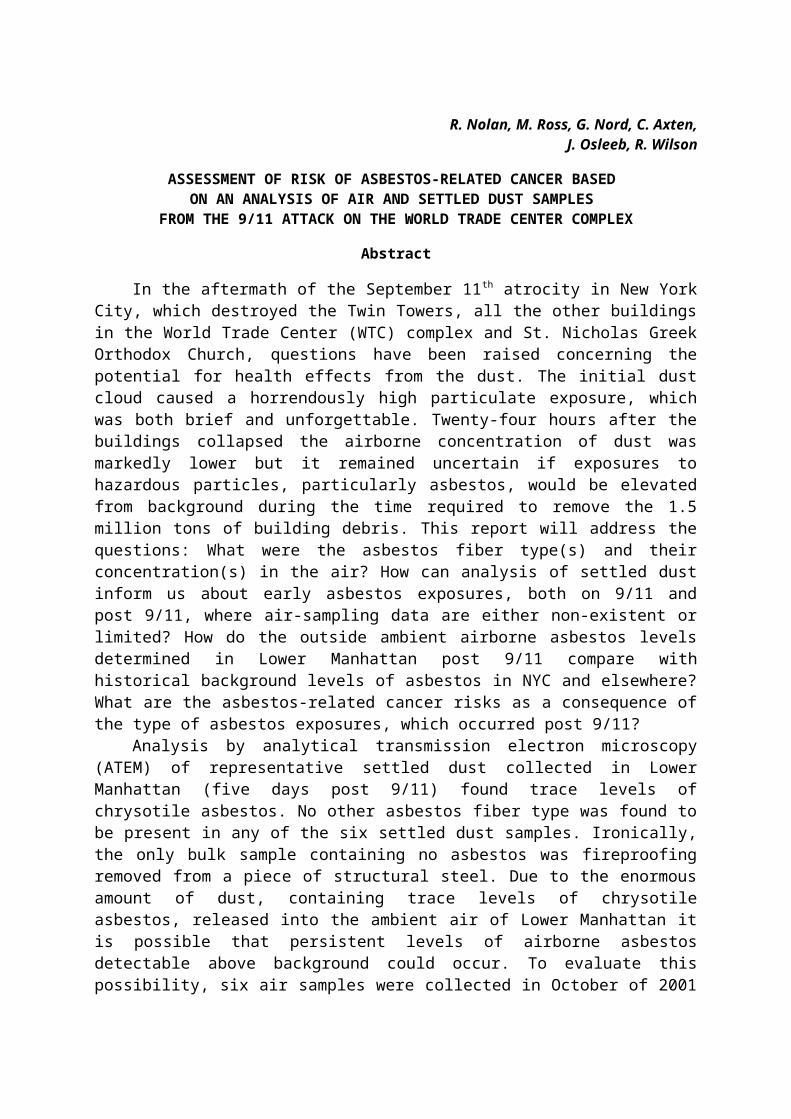
R. Nolan, M. Ross, G. Nord, C. Axten,J. Osleeb, R. Wilson
ASSESSMENT OF RISK OF ASBESTOS-RELATED CANCER BASED ON AN ANALYSIS OF AIR AND SETTLED DUST SAMPLES
FROM THE 9/11 ATTACK ON THE WORLD TRADE CENTER COMPLEX
Abstract
In the aftermath of the September 11th atrocity in New York City, which destroyed the Twin Towers, all the other buildings in the World Trade Center (WTC) complex and St. Nicholas Greek Orthodox Church, questions have been raised concerning the potential for health effects from the dust. The initial dust cloud caused a horrendously high particulate exposure, which was both brief and unforgettable. Twenty-four hours after the buildings collapsed the airborne concentration of dust was markedly lower but it remained uncertain if exposures to hazardous particles, particularly asbestos, would be elevated from background during the time required to remove the 1.5 million tons of building debris. This report will address the questions: What were the asbestos fiber type(s) and their concentration(s) in the air? How can analysis of settled dust inform us about early asbestos exposures, both on 9/11 and post 9/11, where air-sampling data are either non-existent or limited? How do the outside ambient airborne asbestos levels determined in Lower Manhattan post 9/11 compare with historical background levels of asbestos in NYC and elsewhere? What are the asbestos-related cancer risks as a consequence of the type of asbestos exposures, which occurred post 9/11?
Analysis by analytical transmission electron microscopy (ATEM) of representative settled dust collected in Lower Manhattan (five days post 9/11) found trace levels of chrysotile asbestos. No other asbestos fiber type was found to be present in any of the six settled dust samples. Ironically, the only bulk sample containing no asbestos was fireproofing removed from a piece of structural steel. Due to the enormous amount of dust, containing trace levels of chrysotile asbestos, released into the ambient air of Lower Manhattan it is possible that persistent levels of airborne asbestos detectable above background could occur. To evaluate this possibility, six air samples were collected in October of 2001 to characterize the particles in the ambient air in Lower Manhattan starting twenty-seven days post 9/11. The goal was to determine the non-occupational exposures to the general population, not those with occupational exposure related to performing demolition and debris removal. The collection methodology and the microscopy analysis protocol for the air samples allowed for the examination of all the asbestos fibers in at least 10,000 ml of ambient air. The type of asbestos and size distribution could be determined.
No asbestos fiber (of any fiber type or length) was found in any air sample one month post 9/11. The mean ambient airborne asbestos concentration in Lower Manhattan was below 0.00008 f/ml. That was a level consistent with the background pre 9/11 for more than a decade in NYC. The airborne concentration of asbestos in NYC starting a month post 9/11 is consistent with what the World Health Organization (WHO) considers the low end of the background for asbestos in ambient air worldwide. This was markedly lower than the level of 0.01 f/ml, that is usually regarded as safe. However, the initial exposures on 9/11 were undoubtedly high and probably remained elevated above background for some period of time during the next twenty-seven days. We will use risk assessment to determine the upper limit of any increased risk of the two principal asbestos-related cancers – mesothelioma and lung cancer – among the general population of Lower Manhattan, which might be associated with the asbestos released from the September 11th attack on the Twin Towers. The important variables determining these asbestos-related cancer risks are age at first exposure
(mesothelioma), smoking (lung cancer), asbestos fiber type and cumulative exposure (intensity and duration of exposure to airborne asbestos).
Introduction
The target of the terrorist attacks on September 11 th in New York City was the Twin Towers (WTC1 and WTC2) of the World Trade Center complex. Health concerns have been raised about the potential for asbestos-related cancer risk from the increase in airborne asbestos associated with the murderous 9/11 attacks. This report will describe the characteristics of representative samples of the settled dust released from the collapse of the Twin Towers and other buildings and ambient air samples. We collected the ambient air samples starting 27 days after the initial collapse, and during a time when there was still considerable public health concern about the risk of asbestos-related cancer in Lower Manhattan due to the 9/11 attacks. The type(s) and concentration(s) of airborne asbestos in the area surrounding the WTC site were determined and the cumulative exposures to the general population of Lower Manhattan due to the events of 9/11 were estimated; these are the important experimentally determined variables for the risk assessment.
As the removal of the debris took many months, any increase in the airborne asbestos concentration associated with the work could have conceivably led to a situation where the initial hygiene steps taken to control airborne asbestos exposures might prove to be inadequate. Possibly, allowing the general population, living near the WTC site in Lower Manhattan, to acquire a cumulative asbestos exposure (with an intensity and duration to a specific fiber type) that after a latency period of greater than 20 years, might lead to an increase in asbestos-related cancer among the area’s general population (Hodgson & Darnton, 2000, Nolan et al., 2001). On the basis of the specific asbestos fiber type(s) present and their post 9/11 concentrations in the ambient air, we will develop a risk assessment for asbestos-related mesothelioma and lung cancer.
Asbestos health hazards due to the events of 9/11 have been the focus of much media attention. However, little, if any, attention prior to this report has been given to undertaking the type of air sampling necessary to perform a modern asbestos-related cancer risk assessment specific for the cumulative exposure(s) and specific asbestos fiber type(s) caused by the 9/11 attacks.
History of the world trade center complex
The groundbreaking for North Tower (WTC1) was on April 4, 1966 followed by the erection of the structural steel starting in August of 1968. By the end of 1970 the first tenants had moved into the 110-story Tower (at 1,368-feet (ft) it was then the tallest building in the world) topped with a 360-ft transmitting antennae. By early 1972 the 110-story South Tower (WTC2) was completed with a height of 1362 ft. The ribbon cutting ceremony was held on April 4, 1973 (FEMA, 2002).
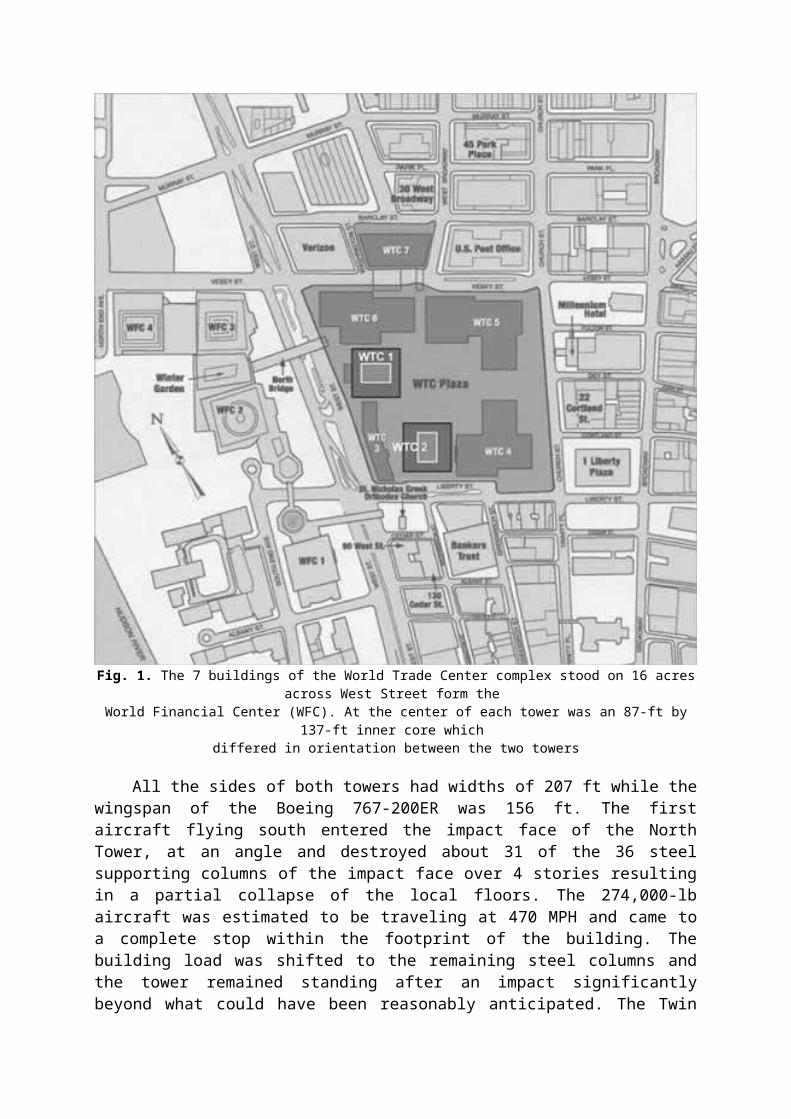
An additional five buildings would eventually be added to complete the complex – WTC3 a 22-story hotel to the west of the South Tower (WTC1), WTC4 and WTC5 were two nine-story office buildings, WTC6 an eight-story office building and the final building WTC7 a 47-story office building across the street from the main part of the 16 acre complex was completed in 1985. The WTC complex contained 12,000,000-ft2 of office space (Fig. 1).
Events of September 11, 2001
The first hijacked Boeing 767-200ER out of Boston’s Logan Airport crashed into the north face of the North Tower (WTC1) between the 94th and 98th floors at 8:46AM with a
second identical aircraft (also out of Logan) striking lower (between the 78 th and 84th floors) on the south face of the South Tower (WTC2) just 17 minutes later. None of the 157 people aboard the two aircrafts survived the impact. Of the 58,000 people estimated to be in the WTC complex that morning approximately 14,000 were thought to have been in the Twin Towers when the first aircraft struck. Approximately 6,000 were below the impact floors in the North Tower (WTC1) (see FEMA 2002, for details of the event summary which follows).
Both towers sustained considerable structural damage, and both were severely rocked by the impact of the aircraft. It has been reported that on impact, the South Tower (WTC2) swayed in one direction for 7-10 seconds before swaying back, although dramatic to the tower occupants, the structural strength required for this motion was within the design envelope of either Tower. Each of the Twin Towers weighed about 500,000 t (or 3,650 times the mass of the Boeing 767-200ER) and had flexibility in the wind and viscoelastic motion dampers to minimize their movement, thereby reducing the risk of motion sickness to those occupying the high floors of the towers on windy days. Each tower was designed to withstand hurricane force winds of 135 miles per hour (MPH) (or about 5,000 t of lateral load). The damage caused by the impact of the aircrafts on a relatively low wind day (10-20 MPH) was not sufficient to knock over or initiate a global collapse in either tower.
Fig. 1. The 7 buildings of the World Trade Center complex stood on 16 acres across West Street form the
World Financial Center (WFC). At the center of each tower was an 87-ft by 137-ft inner core which differed in orientation between the two towers
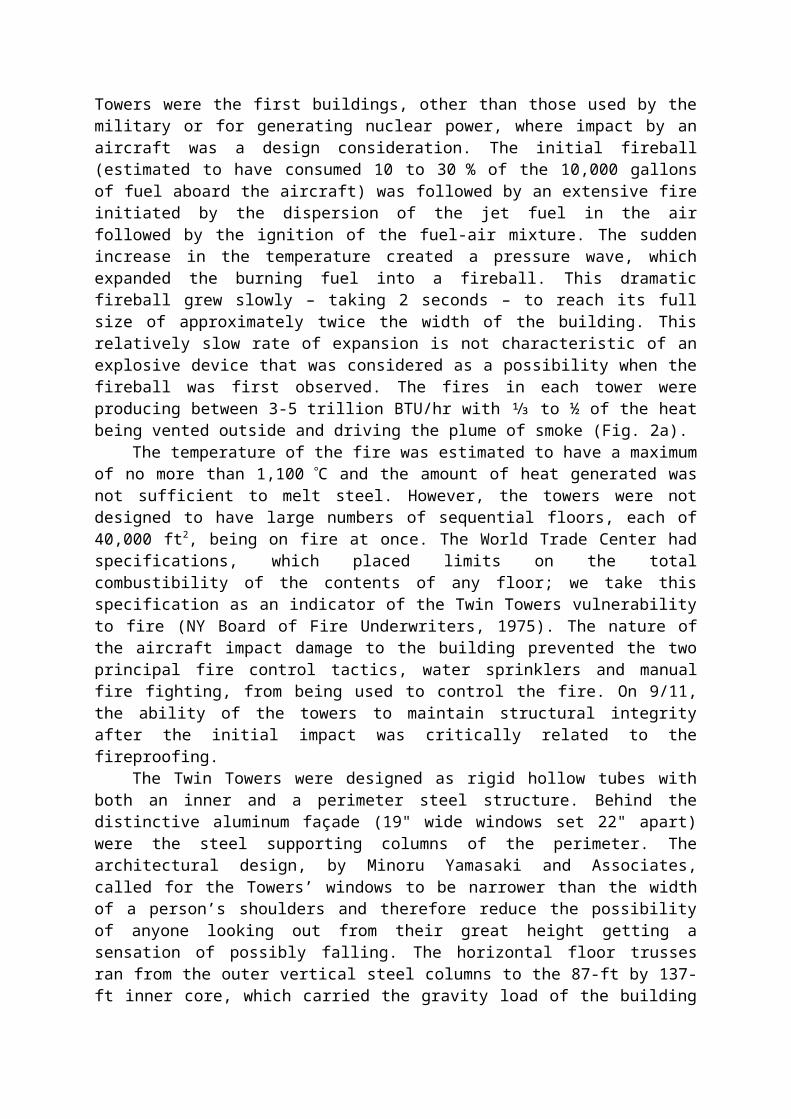
All the sides of both towers had widths of 207 ft while the wingspan of the Boeing 767-200ER was 156 ft. The first aircraft flying south entered the impact face of the North Tower, at an angle and destroyed about 31 of the 36 steel supporting columns of the impact face over 4 stories resulting in a partial collapse of the local floors. The 274,000-lb aircraft was estimated to be traveling at 470 MPH and came to a complete stop within the footprint of the building. The building load was shifted to the remaining steel columns and the tower remained standing after an impact significantly beyond what could have been reasonably anticipated. The Twin Towers were the first buildings, other than those used by the military or for generating nuclear power, where impact by an aircraft was a design consideration. The initial fireball (estimated to have consumed 10 to 30 % of the 10,000 gallons of fuel aboard the aircraft) was followed by an extensive fire initiated by the dispersion of the jet fuel in the air followed by the ignition of the fuel-air mixture. The sudden increase in the temperature created a pressure wave, which expanded the burning fuel into a fireball. This dramatic fireball grew slowly – taking 2 seconds – to reach its full size of approximately twice the width of the building. This relatively slow rate of expansion is not characteristic of an explosive device that was considered as a possibility when the fireball was first observed. The fires in each tower were producing between 3-5 trillion BTU/hr with ⅓ to ½ of the heat being vented outside and driving the plume of smoke (Fig. 2a).
The temperature of the fire was estimated to have a maximum of no more than 1,100 C and the amount of heat generated was not sufficient to melt steel. However, the towers were not designed to have large numbers of sequential floors, each of 40,000 ft2, being on fire at once. The World Trade Center had specifications, which placed limits on the total combustibility of the contents of any floor; we take this specification as an indicator of the Twin Towers vulnerability to fire (NY Board of Fire Underwriters, 1975). The nature of the aircraft impact damage to the building prevented the two principal fire control tactics, water sprinklers and manual fire fighting, from being used to control the fire. On 9/11, the ability of the towers to maintain structural integrity after the initial impact was critically related to the fireproofing.
The Twin Towers were designed as rigid hollow tubes with both an inner and a perimeter steel structure. Behind the distinctive aluminum façade (19" wide windows set 22" apart) were the steel supporting columns of the perimeter. The architectural design, by Minoru Yamasaki and Associates, called for the Towers’ windows to be narrower than the width of a person’s shoulders and therefore reduce the possibility of anyone looking out from their great height getting a sensation of possibly falling. The horizontal floor trusses ran from the outer vertical steel columns to the 87-ft by 137-ft inner core, which carried the gravity load of the building in addition to housing 99 elevators, 3 exit stairways and 16 escalators (Fig. 1). The core was a key design feature of the towers eliminating the historical need for columns every 30 ft or so that would have formed a dense supporting grid on each floor. The connection between the inner and outer steel structures via the trusses was critical to the structural strength of the towers and creating the hollow tube, which made the large open floors possible. This innovative design created open 30,000-ft2 floors, which were a highly desired feature of the Twin Towers.
Although it was struck second, the South Tower (WTC2) was the first to experience global collapse at 9:59AM having stood for only 56 minutes after impact, with the North Tower (WTC1) following about 30 minutes later. The aircraft struck the South Tower on an angle to the right; largely missing the north to south oriented inner core and pushing the office furniture and other debris into the northeast corner leading to an intense localized fire (Fig. 1).
A jet engine, landing gear and part of the fuselage of the doomed aircraft came out of that corner with some parts landing as far as seven blocks to the north of the South Tower (WTC2).
In addition to weakening the steel columns the heating may have caused the trusses to sag thereby placing a force on the four bolts securing the trusses to the steel columns for which their design provided little strength. Each tower’s structural stability was critically related to the floor trusses that strengthened the building by connecting the steel of the perimeter tube to the inner core, which was attached by four bolts on each end. The truss designs provided strength for shear forces and vertical load but not for the tension caused by the heated truss sagging. A second significant factor could have been the range in temperature along a piece of steel caused by the non-uniform fire. When a single piece of steel has temperature differences ranging up to 150 C or more at different points residual stress develops and weakens the steel. Although the photographic record, particularly of the South Tower (WTC2) provides much information, the nature of the damage will probably never be known in sufficient detail to provide definitive explanations for the global failure of both towers.
In the South Tower (WTC2) the most intense fire appeared to be on the 80 th floor along the north face. A stream of molten metal (possibly aluminum from the aircraft) was seen streaming from an impact opening just prior to the tower’s collapse. The trusses breaking away from the steel columns in the perimeter may have triggered the collapse of the floor. This suggestion is supported by the observed cloud of dust blowing out the side of the building prior to the collapse of the outer wall in the northeast corner.
Once one floor collapsed, whatever structural strength remained in the damaged tower was insufficient to prevent a rapid global failure. At the time of the aircraft impact, approximately 2,000 people were left in the South Tower (WTC2). Most (if not all) persons below the impact floors were evacuated safely while of the 500 estimated to be trapped above, only four survived.
Three factors are thought to be important with regard to the rapid collapse of the South Tower (WTC2): 1. The second aircraft was estimated to be traveling 120 MPH faster than the first plane (thereby increasing the kinetic energy of the faster aircraft by 50 % compared to the one striking the North Tower). 2. The damage occurred lower in the building making the overhead mass greater on the impact and fire damaged area. 3. The fire was particularly intense in the northeast corner, where the failure of the structural steel columns and trusses (weakened by a combination of both the heat and temperature ranges caused by the non-uniformity of the fire) may have initiated the global collapse.
The initiating event for the collapse of the North Tower (WTC1) is thought to be different from that of the South Tower. Here the damage to the inner core was more extensive due to the direct impact of the aircraft, which only traveled about 60-ft before striking into the inner core of the North Tower (WTC1). The damage to the inner core caused by the impact of the 274,000-lb aircraft traveling at 470 MPH was likely to have been extensive (Fig. 1). The collapse of the North Tower seems to have been related to the failure of the other end of the trusses from the South Tower (WTC2). Perhaps damage to the inner core, which had been severely impacted by the aircraft and was burdened with carrying the significant gravity load of the tower, explains the different initiating mechanism for the global collapse of the second tower. The evidence for this inner core failure in the North Tower (WTC1) rests in part on the observation that the transmitting antenna began to fall prior to the collapse of the outer walls. Based on this observation the structural engineers speculate that the collapse of the North Tower (WTC1) was triggered by an inner core failure. This inner core failure led to 1,400 deaths.
Both towers collapsed in approximately 11 seconds and the wreckage was traveling at
about 120 MPH when it hit the ground with impact magnitudes of just over 2 on the Richter Scale. An air pressure wave was created by the collapse of each tower sending dust clouds in all directions. As the material in the 110-story towers was mostly open space, the debris pile was hardly six stories high. It is estimated that 2,830 lives were lost – 2,270 building occupants, 157 airplane crew and passengers and 403 firefighters, police and emergency personnel (FEMA, 2002). Estimates made two months after 9/11 placed the loss of life at 3,900, by mid-August, 2002 the estimate had fallen to 2,819, slightly lower than what FEMA reports.
Sources of the cloud dust and the aftermath
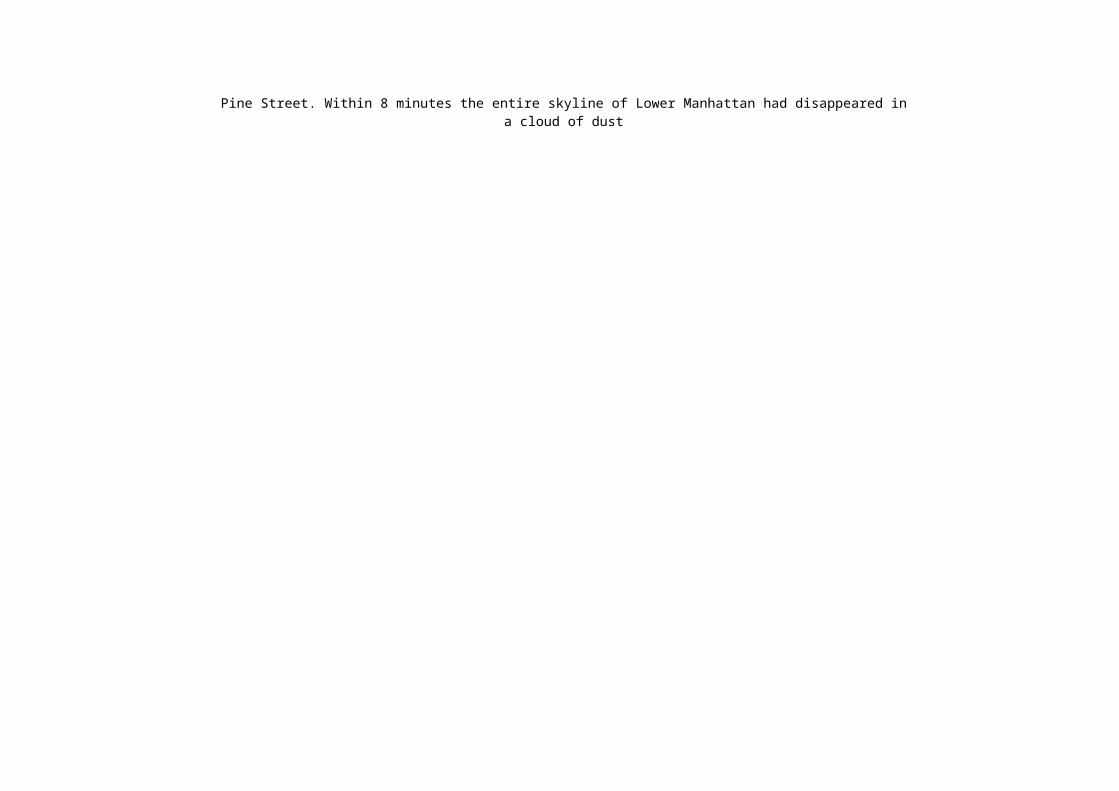
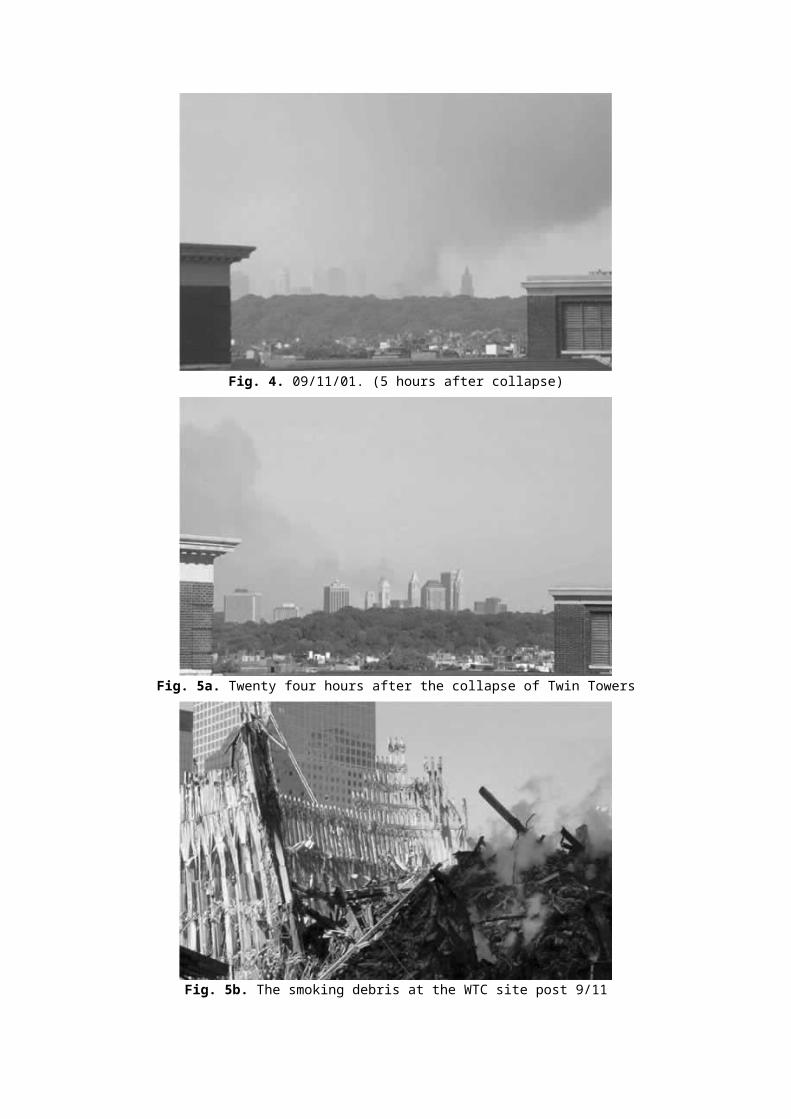
No masonry was used in the steel construction of the Twin Towers and therefore the mainly 4-inch light concrete floors (40,000 ft2 per floor), fireproofing (5,000 tons), insulation and interior dry walls were the main sources of the dust (Table 1). The initial dust cloud caused a horrendously high concentration of airborne particulate and combustion products, which was both extensive and unforgettable. Within minutes, the air pressure generated by the collapsing tower raised a dust cloud, which bellowed up over 1000 ft (see the American International Building, 70 Pine Street, with a tip height of 952 ft in Figure 2a). In a series of seven photographs taken from the Brooklyn College Campus (seven miles from Ground Zero) over the first eight minutes after the South Tower’s collapse the extent of the mixing and the size of the dust cloud are readily apparent (Fig. 2a-g). On a crystal clear day with low wind it rapidly expands, in 8 minutes, to a size sufficient to obliterate any view of Lower Manhattan (Fig. 2g). The dust cloud moved down the street like a wall of volcanic ash (Fig. 3), reaching such a height that no skyscraper (several over 800-ft in height) was visible in Lower Manhattan. After five hours the dust had cleared sufficiently (Fig. 4) for the skyline to be partially visible again, although missing the two tallest and largest buildings in NYC. The mixing indicates the settled dust collected for our study, five days later at several locations more than 8 blocks from the WTC, should be representative of the stable particulate matter in the dust cloud.
Table 1
Composition of common building materials, known to have been used, in the construction of the Twin Towers of the World Trade Center
Wall board 75-90 wt % gypsum (calcium sulfate), 10-25 wt % bentonite clay (aluminum silicate) and or similar clay fillers, <1 % paper facing and <0.1 % quartz
Portland cement 60-67 wt % lime (calcium oxide) 17-25 wt % quartz (SiO2), 3-8 wt % aluminum (Al2O3), 0.5-6.0 wt % iron oxide (Fe2O3), 0.1-4 % magnesium (MgO), alkalis (K2O,Na2O) and 1-3wt % SO3
Fireproofing Four different fireproofing materials were used during the construction of the World Trade Towers: 20 % chrysotile asbestos, 60-65 % mineral wool (specifically slagwool) and the remainder of a binder of gypsum and Portland cement 80-85 % of mineral wool (specifically slagwool) and binder lightweight gypsum plaster and vermiculite aggregate with about 13 % chrysotile asbestos a “hard coat” consisting of 80 % chrysotile asbestos set in a matrix of Portland cement
A day later, the airborne concentration of dust was markedly lower but visually elevated above the usual background level (Fig. 5a). If levels of airborne asbestos remained significantly increased above background for some period of time it could present a public health concern. The task of removing the 1.5 million tons of debris required 20,000-30,000 truckloads and was completed in June 2002 (Fig. 5b-d).
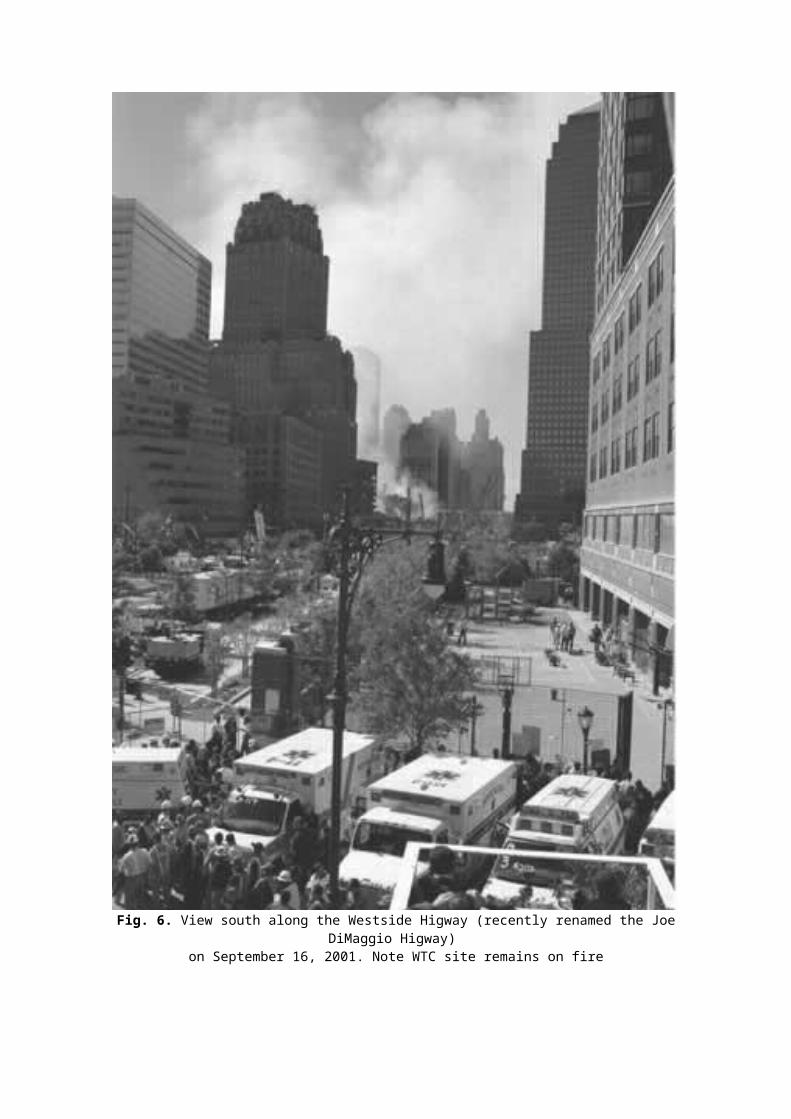
During the removal of the debris, the ongoing fires (occurring in the massive six sub story complex beneath the western part of the WTC site) continued to release additional air pollutants. The movement of heavy equipment and other vehicles could promote reentrainment of the settled dust known to contain traces of chrysotile asbestos; even allowing for efforts to suppress the dust by keeping the streets wet and the use of trucks capable of removing the dust by vacuuming (Fig. 5d). Five days after 9/11, smoke continued to billow from the WTC site as it would until early December when the underground fires were finally extinguished (Fig. 6). Airborne dust related to the event was widely distributed and would continue to settle out of the air for some period of time creating the potential for cumulative asbestos exposure to occur which might carry a significant increased risk of asbestos-related cancer.
Materials and methods
Collection of Representative Settled Dust Samples Post 9/1.1 Six bulk samples of the settled dust representative of the dust cloud released into Lower Manhattan from the collapse of the Twin Towers and one sample of intact fireproofing were collected. In total, seven bulk samples were collected: two settled dust samples from motor vehicles, one sample of fireproofing from a piece of structural steel, three settled dust samples from the elevated footbridge crossing the Westside Highway north of the WTC at Chambers Street (Table 2). The dust inside the enclosed footbridge was thought to be finer in size as it had diffused inside the bridge while the two settled dust samples on the motor vehicles settled directly out of the air. An additional random, directly settled, dust sample was collected at a similar distance southeast of the WTC (Table 2).
Table 2
Settled dust and bulk samples were collected the area of the collapsed Twin Towers
The following six samples were collected on September 16, 2001Sample No. 1 Fireproofing on a steel girder on a truckSample No. 2 Dust collected from an auto van parked on White StreetSample No. 6 Dust collected from a truck parked on Chambers Street between the Westside Highway and
Greenwich StreetSample No. 3 Dust collected from step railing inside footbridge across the Westside Highway from the
Borough of Manhattan Community College to Stuyvesant High SchoolSample No. 4 Dust collected on long railings inside footbridge across the Westside Highway from the
Borough of Manhattan Community College to Stuyvesant High SchoolSample No. 5 Dust collected inside footbridge across the Westside Highway from the Borough of
Manhattan Community College to Stuyvesant High SchoolThe following sample was collected on October 7, 2001
Sample No. 7 Dust collected from street 150 yards southeast of the site of the World Trade Center
Fig. 2 a-g. As the South Tower (WTC1) collapsed the lighter colored dust cloud associated with the construction material became more visible. The lighter colored cloud quickly reached higher then the tallest building in Lower Manhattan, 952 ft at 70 Pine
Street. Within 8 minutes the entire skyline of Lower Manhattan had disappeared in a cloud of dust
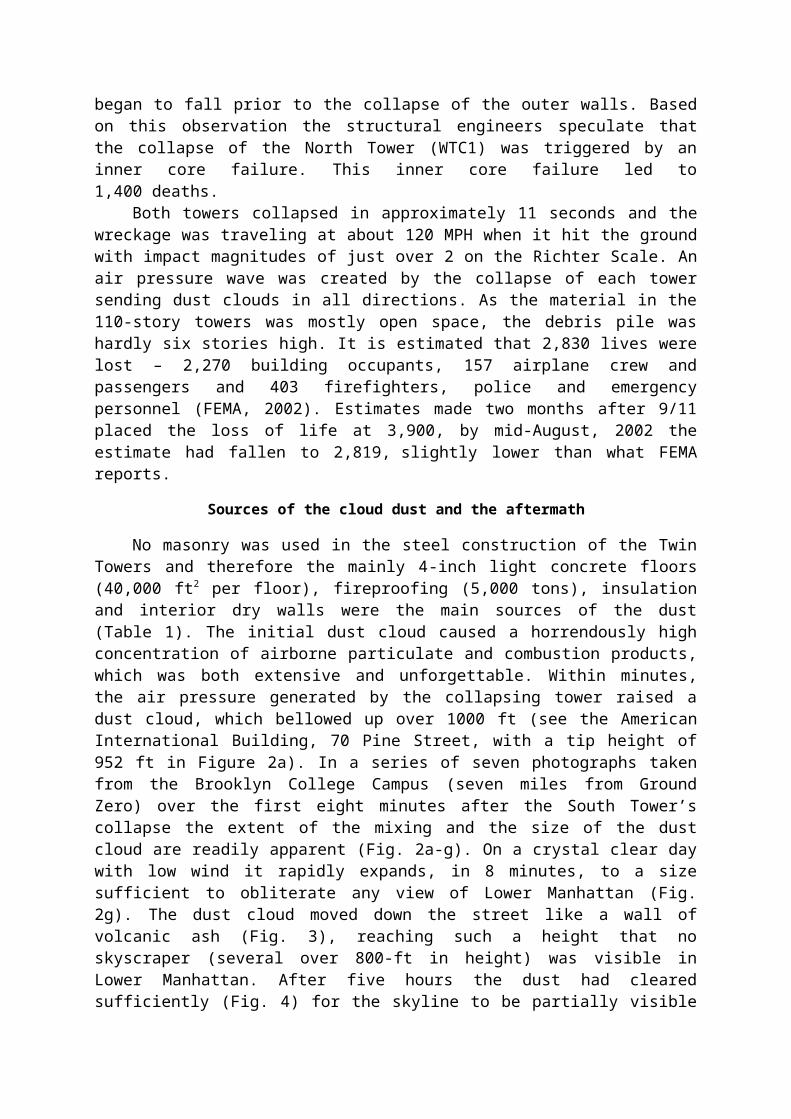
Fig. 3. The dust cloud moving south in very sharp zones on Trinity Place
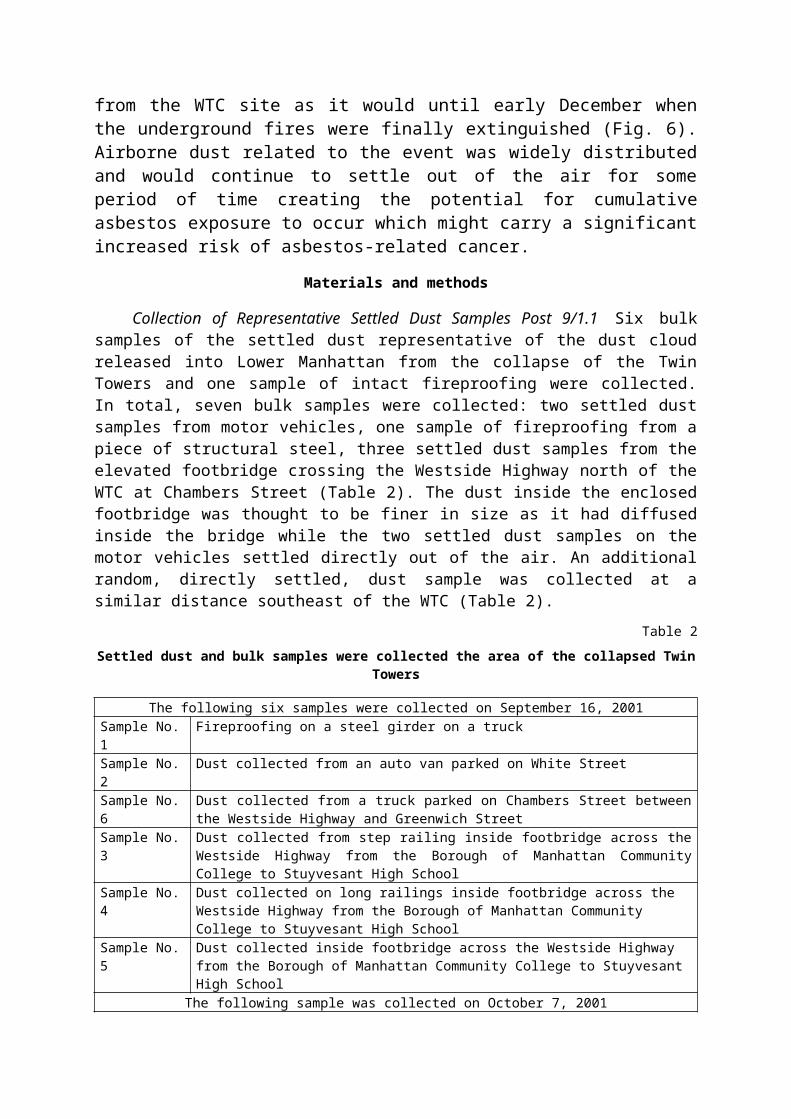
Fig. 4. 09/11/01. (5 hours after collapse)
Fig. 5a. Twenty four hours after the collapse of Twin Towers
Fig. 5b. The smoking debris at the WTC site post 9/11

Fig. 5c. Although the Twin Towers did not tip over the debris from their collapse caused considerable damage to the surrounding area
Fig. 5d. Trucks on Chambers Street waiting to pick up debris from World Trade Center during the first week in October, 2001. Note that the streets surrounding
the WTC were kept continuously wet to suppress the dust
Fig. 6. View south along the Westside Higway (recently renamed the Joe DiMaggio Higway) on September 16, 2001. Note WTC site remains on fire
Continuous Scan X-ray Powder Diffraction (XRD). The XRD analysis of the settled dust samples will allow the identification of the crystalline phases present at concentrations of approximately 1 % by mass or greater. Each sample was prepared for analysis by being dispersed in acetone with gentle grinding in an agate mortar and pestle. Once the dust sample was uniformly dispersed, the suspension was transferred using a disposal pipette to a low background silicon plate sample holder. The acetone was allowed to evaporate settling the suspended particles onto the plate. Additional aliquots of the suspension were transferred until the silicon plate had a thin layer of settled dust suitable for analysis. A Philips Analytical X-ray X’Pert MPD Diffractometer operating with the X’Pert software was used to collect the diffraction patterns. Each sample was continuously scanned from 5-85 2θ using variable slits, generator voltage of 45 kV and generator current of 40 mA, and a step size 0.02 2θ.
Preparation of the Bulk Samples by Analytical Transmission Electron Microscopy (ATEM.) Each of the seven bulk samples was suspended in distilled water. The particles were dispersed with the use of ultrasound to form a uniform dispersion. Initially, the particles were suspended at a fairly high particle concentration to obtain a suspension representative of the bulk sample. Once uniformly dispersed, it was diluted to a lower concentration and a 10 ml aliquot was taken using a pipette and transferred to a 200-mesh copper locator grid. Each grid contained a thin film of formvar coated with carbon to act as a support for the particles. Each sample preparation was examined using a JEOL-2010 ATEM. The water was allowed to evaporate and the grid was re-coated with a thin film of evaporated carbon to reduce charging by the electron beam.
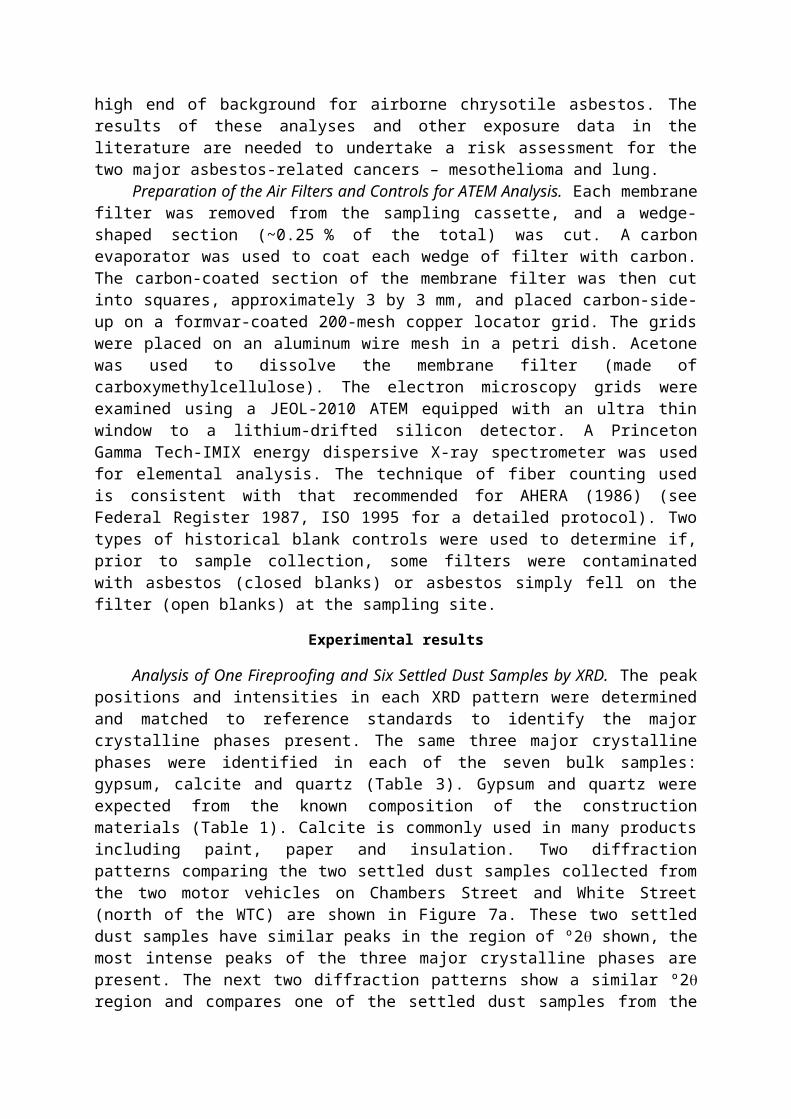
Collection of the Air Samples Pre and Post 9/1. During the month of October, high volume ambient air samples were collected at a site in Lower Manhattan. The air filters were prepared by direct-transfer and analysis of these air samples by ATEM determined the types and concentrations of asbestos to which the general population of Lower Manhattan was exposed. Historical air samples collected in NYC and in the chrysotile-mining town of Asbest City in the Sverdlovsk Region of the Russian Federation were used respectively as low and high background controls. The air samples collected in the chrysotile asbestos mining community was used to represent the high end of background for airborne chrysotile asbestos. The results of these analyses and other exposure data in the literature are needed to undertake a risk assessment for the two major asbestos-related cancers – mesothelioma and lung.
Preparation of the Air Filters and Controls for ATEM Analysis. Each membrane filter was removed from the sampling cassette, and a wedge-shaped section (~0.25 % of the total) was cut. A carbon evaporator was used to coat each wedge of filter with carbon. The carbon-coated section of the membrane filter was then cut into squares, approximately 3 by 3 mm, and placed carbon-side-up on a formvar-coated 200-mesh copper locator grid. The grids were placed on an aluminum wire mesh in a petri dish. Acetone was used to dissolve the membrane filter (made of carboxymethylcellulose). The electron microscopy grids were examined using a JEOL-2010 ATEM equipped with an ultra thin window to a lithium-drifted silicon detector. A Princeton Gamma Tech-IMIX energy dispersive X-ray spectrometer was used for elemental analysis. The technique of fiber counting used is consistent with that recommended for AHERA (1986) (see Federal Register 1987, ISO 1995 for a detailed protocol). Two types of historical blank controls were used to determine if, prior to sample collection, some filters were contaminated with asbestos (closed blanks) or asbestos simply fell on the filter (open blanks) at the sampling site.
Experimental results
Analysis of One Fireproofing and Six Settled Dust Samples by XRD. The peak positions and intensities in each XRD pattern were determined and matched to reference standards to identify the major crystalline phases present. The same three major crystalline phases were
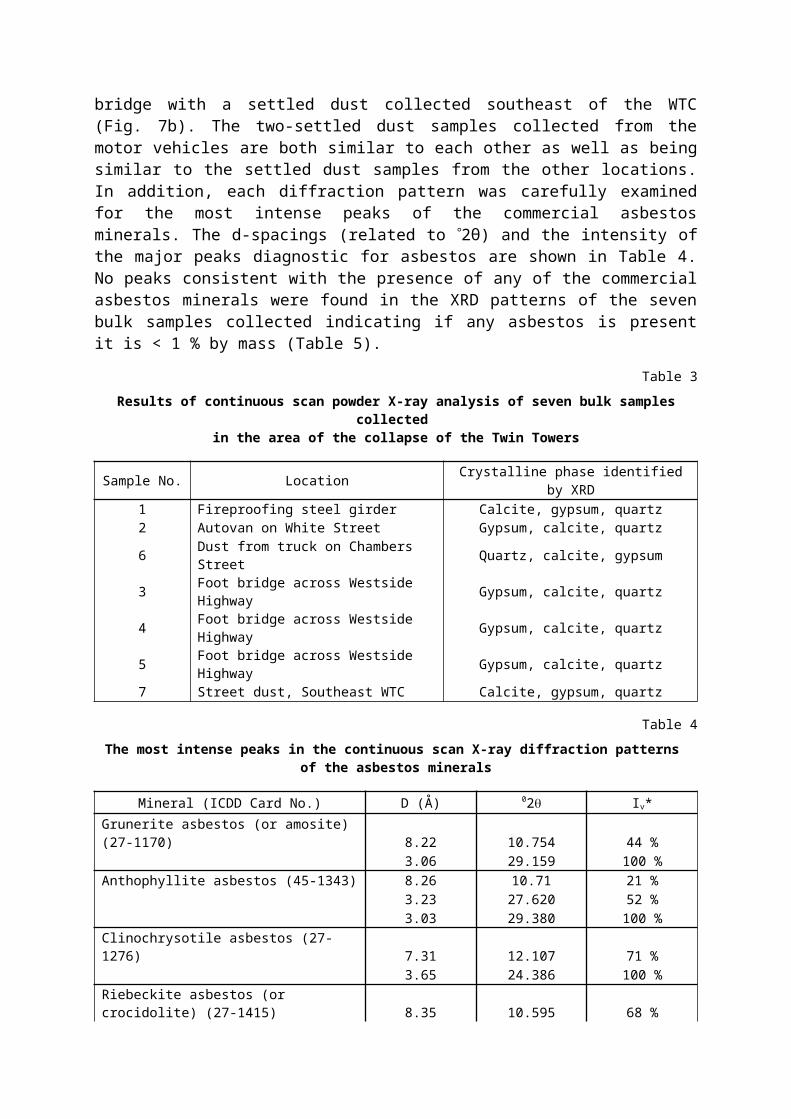
identified in each of the seven bulk samples: gypsum, calcite and quartz (Table 3). Gypsum and quartz were expected from the known composition of the construction materials (Table 1). Calcite is commonly used in many products including paint, paper and insulation. Two diffraction patterns comparing the two settled dust samples collected from the two motor vehicles on Chambers Street and White Street (north of the WTC) are shown in Figure 7a. These two settled dust samples have similar peaks in the region of º2 shown, the most intense peaks of the three major crystalline phases are present. The next two diffraction patterns show a similar º2 region and compares one of the settled dust samples from the bridge with a settled dust collected southeast of the WTC (Fig. 7b). The two-settled dust samples collected from the motor vehicles are both similar to each other as well as being similar to the settled dust samples from the other locations. In addition, each diffraction pattern was carefully examined for the most intense peaks of the commercial asbestos minerals. The d-spacings (related to 2θ) and the intensity of the major peaks diagnostic for asbestos are shown in Table 4. No peaks consistent with the presence of any of the commercial asbestos minerals were found in the XRD patterns of the seven bulk samples collected indicating if any asbestos is present it is < 1 % by mass (Table 5).
Table 3
Results of continuous scan powder X-ray analysis of seven bulk samples collected in the area of the collapse of the Twin Towers
Sample No. Location Crystalline phase identified by XRD1 Fireproofing steel girder Calcite, gypsum, quartz2 Autovan on White Street Gypsum, calcite, quartz6 Dust from truck on Chambers Street Quartz, calcite, gypsum3 Foot bridge across Westside Highway Gypsum, calcite, quartz4 Foot bridge across Westside Highway Gypsum, calcite, quartz5 Foot bridge across Westside Highway Gypsum, calcite, quartz7 Street dust, Southeast WTC Calcite, gypsum, quartz
Table 4
The most intense peaks in the continuous scan X-ray diffraction patterns of the asbestos minerals
Mineral (ICDD Card No.) D (Å) 02 Iv*
Grunerite asbestos (or amosite) (27-1170) 8.22 10.754 44 %3.06 29.159 100 %
Anthophyllite asbestos (45-1343) 8.26 10.71 21 %3.23 27.620 52 %3.03 29.380 100 %
Clinochrysotile asbestos (27-1276) 7.31 12.107 71 %3.65 24.386 100 %
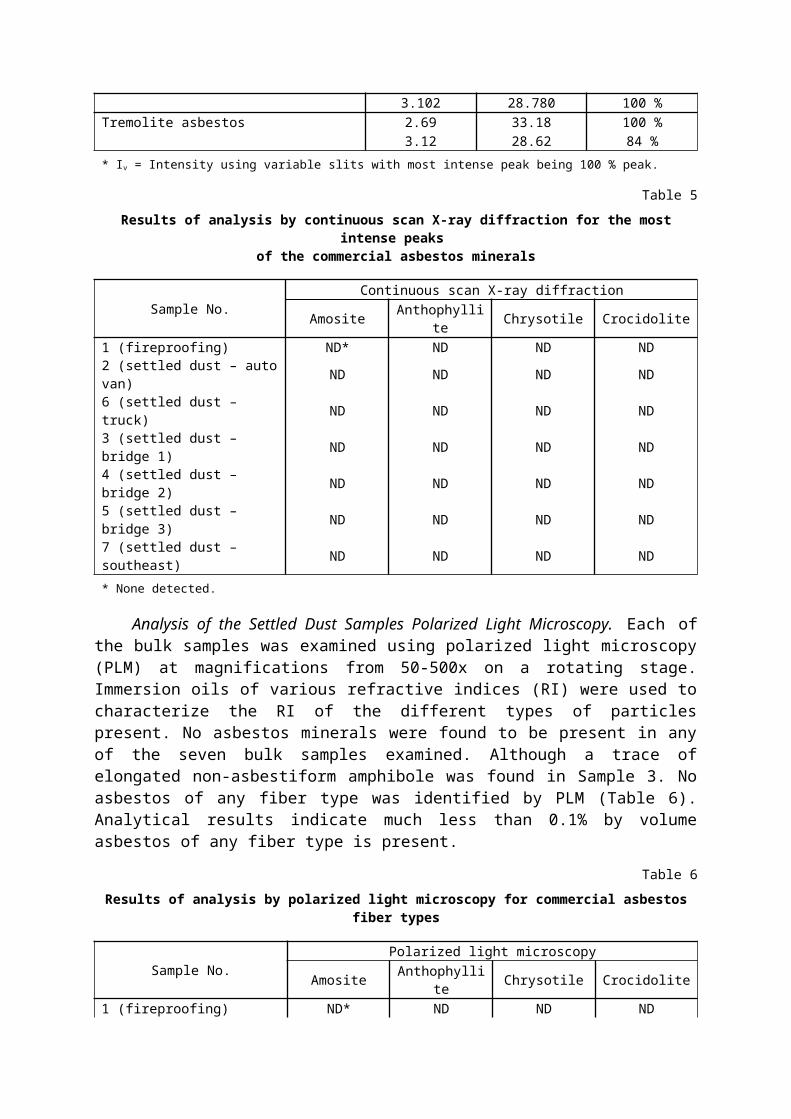
Riebeckite asbestos (or crocidolite) (27-1415) 8.35 10.595 68 %3.102 28.780 100 %
Tremolite asbestos 2.69 33.18 100 %3.12 28.62 84 %
* Iv = Intensity using variable slits with most intense peak being 100 % peak.
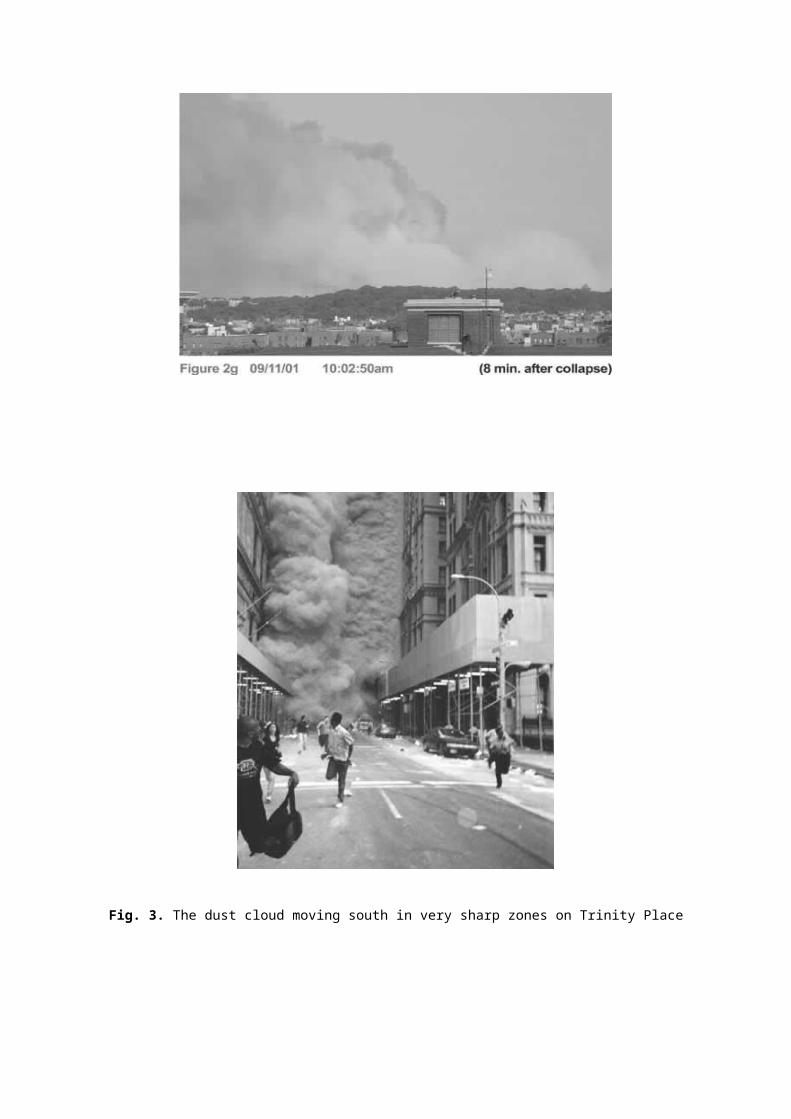
Table 5
Results of analysis by continuous scan X-ray diffraction for the most intense peaks of the commercial asbestos minerals
Sample No.Continuous scan X-ray diffraction
Amosite Anthophyllite Chrysotile Crocidolite1 (fireproofing) ND* ND ND ND2 (settled dust – auto van) ND ND ND ND6 (settled dust – truck) ND ND ND ND3 (settled dust – bridge 1) ND ND ND ND4 (settled dust – bridge 2) ND ND ND ND5 (settled dust – bridge 3) ND ND ND ND7 (settled dust – southeast) ND ND ND ND
* None detected.
Analysis of the Settled Dust Samples Polarized Light Microscopy. Each of the bulk samples was examined using polarized light microscopy (PLM) at magnifications from 50-500x on a rotating stage. Immersion oils of various refractive indices (RI) were used to characterize the RI of the different types of particles present. No asbestos minerals were found to be present in any of the seven bulk samples examined. Although a trace of elongated non-asbestiform amphibole was found in Sample 3. No asbestos of any fiber type was identified by PLM (Table 6). Analytical results indicate much less than 0.1% by volume asbestos of any fiber type is present.
Table 6
Results of analysis by polarized light microscopy for commercial asbestos fiber types
Sample No.Polarized light microscopy
Amosite Anthophyllite Chrysotile Crocidolite1 (fireproofing) ND* ND ND ND2 (settled dust – auto van) ND ND ND ND6 (settled dust – truck) ND ND ND ND3 (settled dust – bridge 1) ND ND ND ND4 (settled dust – bridge 2) ND ND ND ND5 (settled dust – bridge 3) ND ND ND ND7 (settled dust – southeast) ND ND ND ND
* None detected.
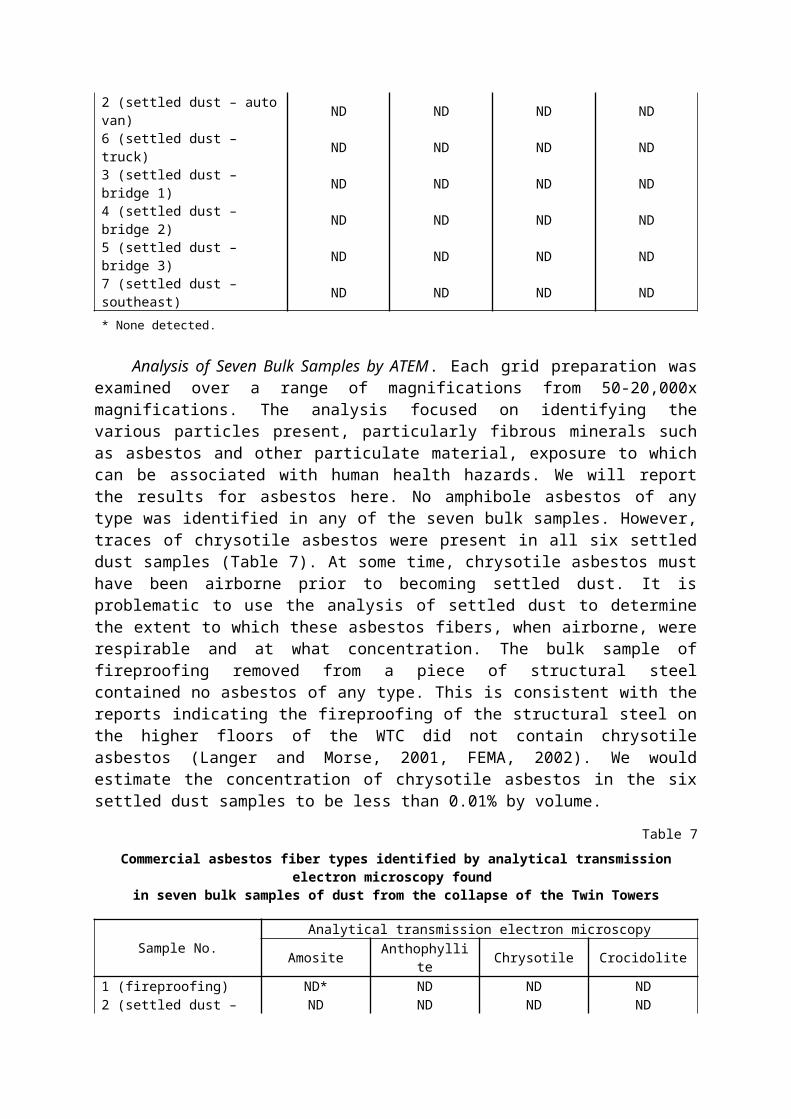
Analysis of Seven Bulk Samples by ATEM. Each grid preparation was examined over a range of magnifications from 50-20,000x magnifications. The analysis focused on identifying the various particles present, particularly fibrous minerals such as asbestos and other particulate material, exposure to which can be associated with human health hazards. We will report the results for asbestos here. No amphibole asbestos of any type was identified in any of the seven bulk samples. However, traces of chrysotile asbestos were present in all six settled dust samples (Table 7). At some time, chrysotile asbestos must have been airborne prior to becoming settled dust. It is problematic to use the analysis of settled dust to determine the extent to which these asbestos fibers, when airborne, were respirable and at what concentration. The bulk sample of fireproofing removed from a piece of structural steel contained no asbestos of any type. This is consistent with the reports indicating the fireproofing of the structural steel on the higher floors of the WTC did not contain chrysotile asbestos (Langer and Morse, 2001, FEMA, 2002). We would estimate the concentration of
chrysotile asbestos in the six settled dust samples to be less than 0.01% by volume.
Table 7
Commercial asbestos fiber types identified by analytical transmission electron microscopy found in seven bulk samples of dust from the collapse of the Twin Towers
Sample No.Analytical transmission electron microscopy
Amosite Anthophyllite Chrysotile Crocidolite1 (fireproofing) ND* ND ND ND2 (settled dust – auto van) ND ND ND ND6 (settled dust – truck) ND ND ND ND3 (settled dust – bridge 1) ND ND ND ND4 (settled dust – bridge 2) ND ND ND ND5 (settled dust – bridge 3) ND ND ND ND7 (settled dust – southeast) ND ND ND ND
* None detected.
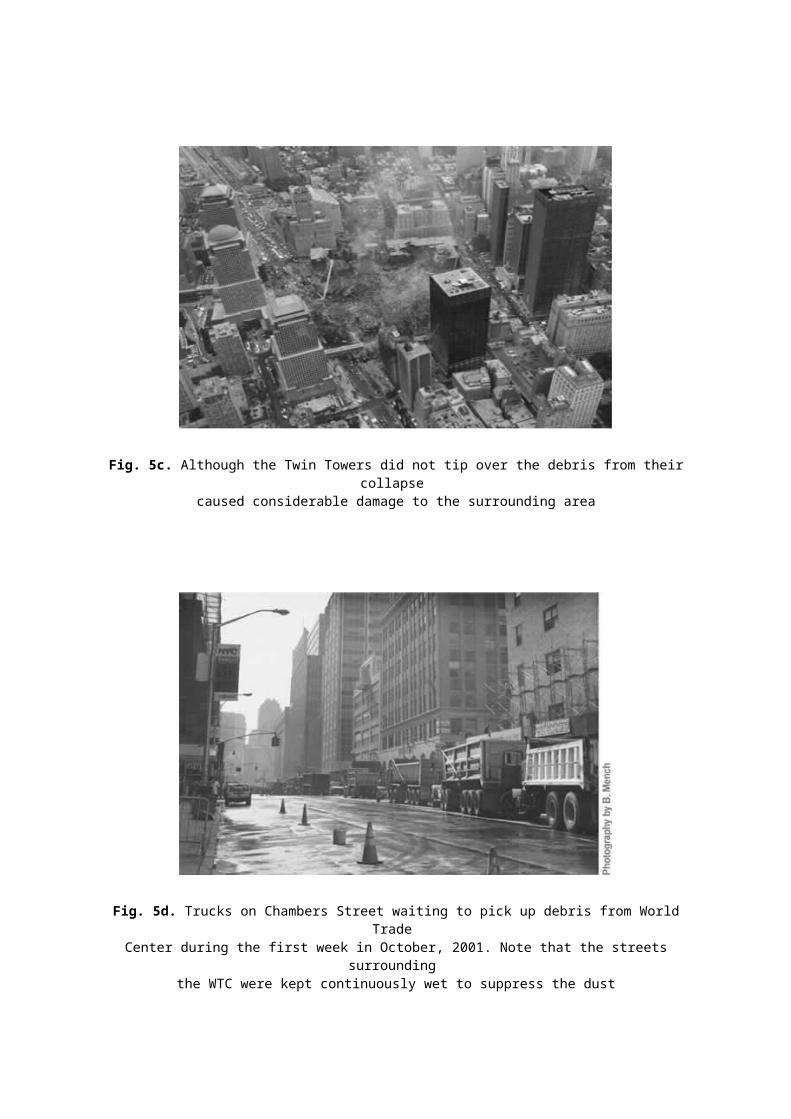
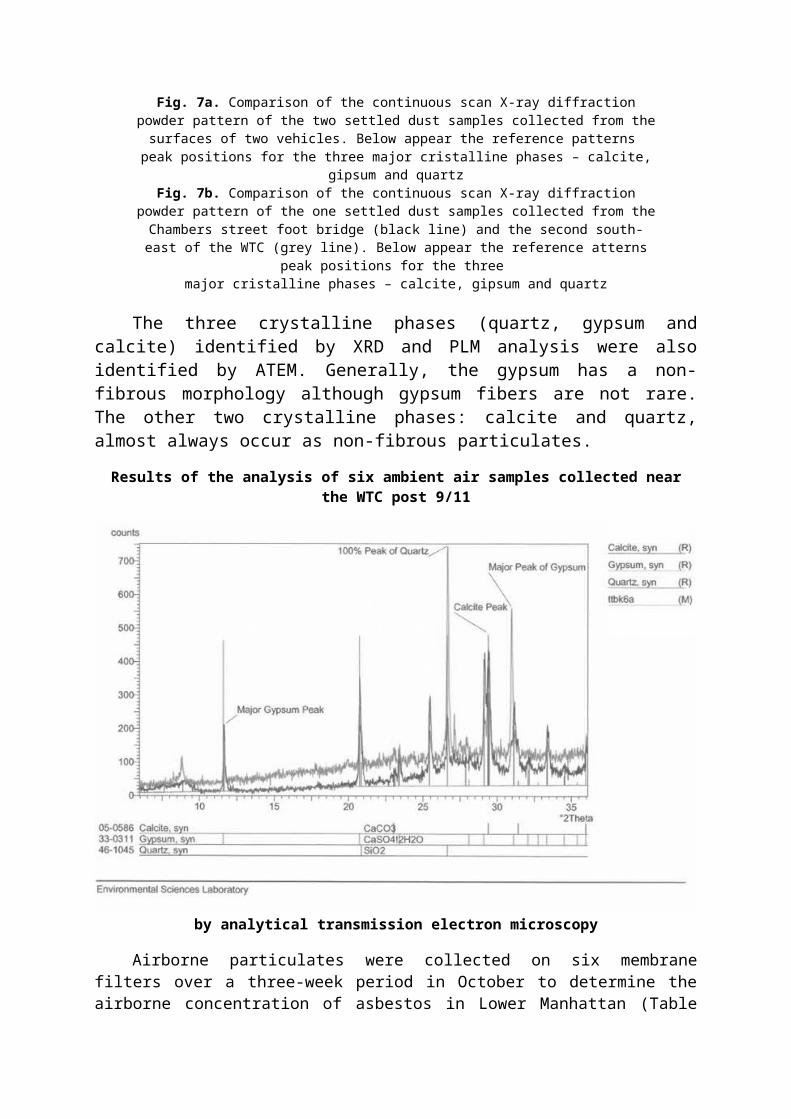
Fig. 7a. Comparison of the continuous scan X-ray diffraction powder pattern of the two settled dust samples collected from the surfaces of two vehicles. Below appear the reference patterns
peak positions for the three major cristalline phases – calcite, gipsum and quartzFig. 7b. Comparison of the continuous scan X-ray diffraction powder pattern of the one settled dust samples collected from the Chambers street foot bridge (black line) and the second south-
east of the WTC (grey line). Below appear the reference atterns peak positions for the three major cristalline phases – calcite, gipsum and quartz
The three crystalline phases (quartz, gypsum and calcite) identified by XRD and PLM analysis were also identified by ATEM. Generally, the gypsum has a non-fibrous morphology although gypsum fibers are not rare. The other two crystalline phases: calcite and quartz, almost always occur as non-fibrous particulates.
Results of the analysis of six ambient air samples collected near the WTC post 9/11by analytical transmission electron microscopy
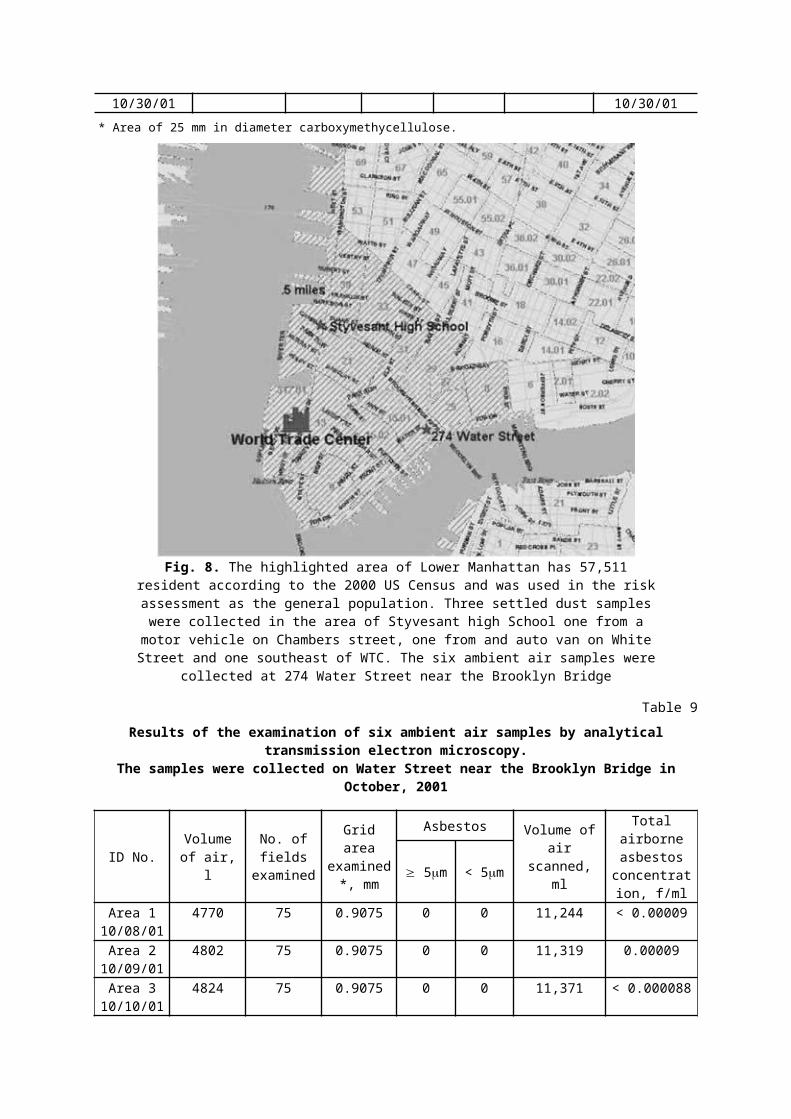
Airborne particulates were collected on six membrane filters over a three-week period in October to determine the airborne concentration of asbestos in Lower Manhattan (Table 8). The samples were collected at various times of the day to obtain a representative concentration of asbestos fibers in the air as the WTC debris removal program performed different tasks at night. The sampling strategy involved collecting only area samples (where the sampling pump was not attached to a person but rather remained in one location during the entire period of the sampling) at 274 Water Street (Fig. 8). These air samples were collected outside (also referred to as ambient) to determine if a measurable ongoing increase
in airborne asbestos concentration (above background) in Lower Manhattan could be associated with the massive asbestos containing dust cloud produced by the collapse of two of the world’s tallest buildings and the ongoing debris removal. The air was sampled at a flow rate of 20 liters per minute (LPM) and the duration of sampling varied between samples. But was sufficient to collect between 4,770 and 6,064 liters of air (see Table 8 for details of
sampling). The results of the analysis of the six filters by ATEM are shown in Table 9 and summarized below.
Table 8
Description of air monitoring on Water Street near Brooklyn Bridge, New York, NY starting 27 days after Twin Towers of the World Trade Center collapse
ID No.(date collected)
Filter pore size and type of membrane
Type of sample run
Duration of sampling,
min
Flow rate(LPM)
Volume of air sampled,
l
Sampling station(date collected)
Area sample 110/08/01
0.8 m CME* Fiber 238.5 20 4770 5th floor north window 10/08/01
Area sample 210/09/01
0.8 m CME Fiber 240.1 20 4802 5th floor north window 10/09/01
Area sample 310/10/01
0.8 m CME Fiber 241.2 20 4824 5th floor north window 10/10/01
Area sample 410/21/01
0.8 m CME Fiber 287.0 20 5740 5th floor north window 10/21/01
Area sample 510/25/01
0.8 m CME Fiber 245.3 20 4906 5th floor north window 10/25/01
Area sample 610/30/01
0.8 m CME Fiber 303.2 20 6064 5th floor north window 10/30/01
* Area of 25 mm in diameter carboxymethycellulose.
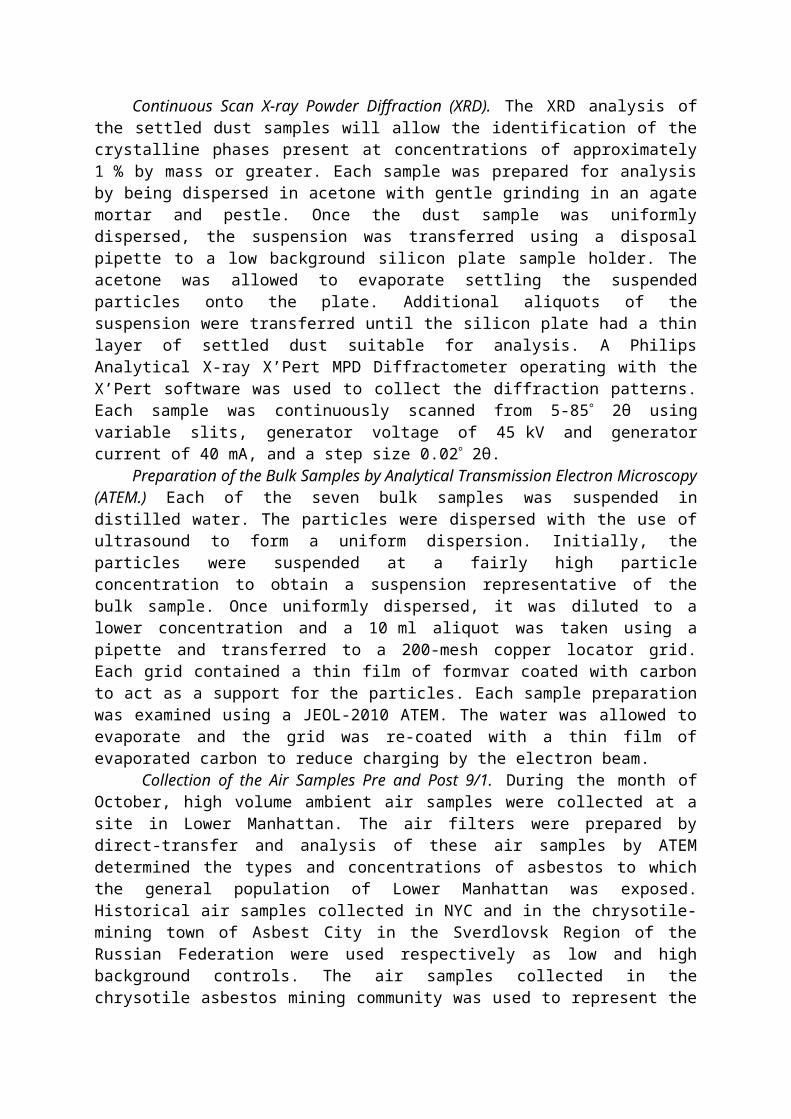
Fig. 8. The highlighted area of Lower Manhattan has 57,511 resident according to the 2000 US Census and was used in the risk assessment as the general population. Three settled dust samples were collected in the area of Styvesant high School one from a motor vehicle on Chambers street, one from and auto van on White Street and one southeast of WTC. The six ambient air samples
were collected at 274 Water Street near the Brooklyn Bridge
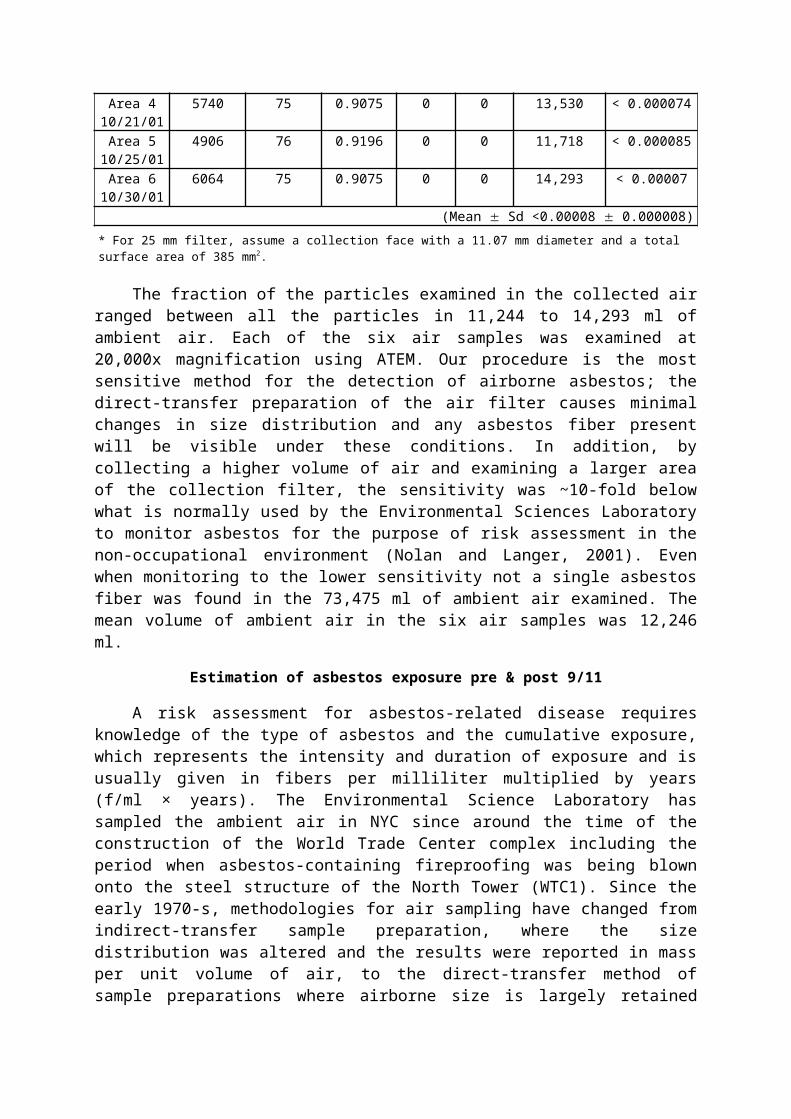
Table 9
Results of the examination of six ambient air samples by analytical transmission electron microscopy.The samples were collected on Water Street near the Brooklyn Bridge in October, 2001
ID No. Volume of air, l
No. of fields examined
Grid area examined*,
mm
Asbestos Volume of air scanned, ml
Total airborne asbestos
concentration, f/ml 5m < 5m
Area 110/08/01
4770 75 0.9075 0 0 11,244 < 0.00009
Area 210/09/01
4802 75 0.9075 0 0 11,319 0.00009
Area 310/10/01
4824 75 0.9075 0 0 11,371 < 0.000088
Area 410/21/01
5740 75 0.9075 0 0 13,530 < 0.000074
Area 510/25/01
4906 76 0.9196 0 0 11,718 < 0.000085
Area 610/30/01
6064 75 0.9075 0 0 14,293 < 0.00007
(Mean Sd <0.00008 0.000008)* For 25 mm filter, assume a collection face with a 11.07 mm diameter and a total surface area of 385 mm2.
The fraction of the particles examined in the collected air ranged between all the particles in 11,244 to 14,293 ml of ambient air. Each of the six air samples was examined at
20,000x magnification using ATEM. Our procedure is the most sensitive method for the detection of airborne asbestos; the direct-transfer preparation of the air filter causes minimal changes in size distribution and any asbestos fiber present will be visible under these conditions. In addition, by collecting a higher volume of air and examining a larger area of the collection filter, the sensitivity was ~10-fold below what is normally used by the Environmental Sciences Laboratory to monitor asbestos for the purpose of risk assessment in the non-occupational environment (Nolan and Langer, 2001). Even when monitoring to the lower sensitivity not a single asbestos fiber was found in the 73,475 ml of ambient air examined. The mean volume of ambient air in the six air samples was 12,246 ml.
Estimation of asbestos exposure pre & post 9/11
A risk assessment for asbestos-related disease requires knowledge of the type of asbestos and the cumulative exposure, which represents the intensity and duration of exposure and is usually given in fibers per milliliter multiplied by years (f/ml × years). The Environmental Science Laboratory has sampled the ambient air in NYC since around the time of the construction of the World Trade Center complex including the period when asbestos-containing fireproofing was being blown onto the steel structure of the North Tower (WTC1). Since the early 1970-s, methodologies for air sampling have changed from indirect-transfer sample preparation, where the size distribution was altered and the results were reported in mass per unit volume of air, to the direct-transfer method of sample preparations where airborne size is largely retained and the number of fibers per ml of air are determined (Nolan and Langer, 2001). The conversion between the two air-monitoring methods has limitations that we choose to avoid by only using air samples analyzed by direct-transfer for background comparison with the result obtained for post 9/11.
For establishing background levels of asbestos in the ambient (or outdoor) air in NYC, we selected air samples collected in 1989, 1992 and 1994 which had been analyzed by the same methodology used for the post 9/11 air sample. Before 9/11, the concentration of airborne asbestos in NYC was consistently less than 0.0008 f/ml where all types of asbestos fibers having lengths equal to or greater than 0.5 m were counted (Table 10). We assume the background for asbestos in the ambient air in NYC is below this concentration and representative of the levels in Lower Manhattan prior to 10AM on the morning of September 11th (Fig. 9).
Table 10
Historical air samples collected in New York and Asbesr City (Russian Federation)to evaluate ambient (or outside) airborne asbestos concentration
and analyzed by analytical transmission electron mocroscopy
Site / date Type of sample
No. of samples
Volume of samples, l
Total asbestos fibers*
Average volume of air scanned, ml
Airborne concentration,
f/ml≥ 5 μm < 5 μmJFK Airport Terminal, 12/14/89
Area / ambient 2 2,048 ± 92 0 0 1,266 ± 77 < 0.00079Blank 2 0 0 0 – < 8.3 f/mm2
Erasmus Hall High School, Brooklyn, NY, 12/28/92
Area / ambient 5 2,042 ± 19 2 7 1,283 ± 12 < 0.00078 (Gru, Ctl)
Blank 3 – 0 0 – < 4.1 f/mm2
Public School 192Q, 109-89 204th Street, Queens, NY, 7/6-7/95
Area / ambient 7 2,005 ± 38 0 0 1,260 ± 24 < 0.00079
Blank 4 – 0 0 – < 4.1 f/mm2
Asbest City, Sverdlovsk Region,
Area / ambient 13 900 13 127 387 ± 185 < 0.003
Russian FederationSimbols: Gru – grunerite, Ctl – chrysotile. * Total number of asbestos fibers found in all air samples
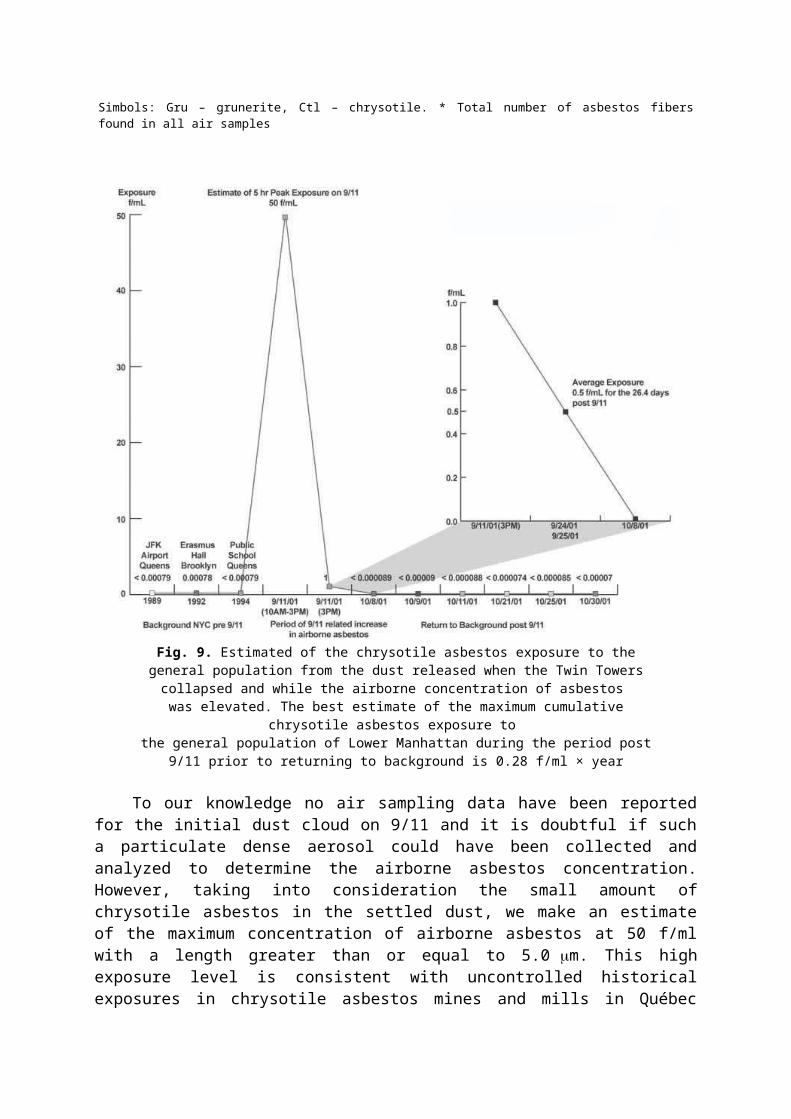
Fig. 9. Estimated of the chrysotile asbestos exposure to the general population from the dust released when the Twin Towers collapsed and while the airborne concentration of asbestos was elevated. The best estimate of the maximum cumulative chrysotile asbestos exposure to the general population of Lower Manhattan during the period post 9/11 prior to returning to
background is 0.28 f/ml × year
To our knowledge no air sampling data have been reported for the initial dust cloud on 9/11 and it is doubtful if such a particulate dense aerosol could have been collected and analyzed to determine the airborne asbestos concentration. However, taking into consideration the small amount of chrysotile asbestos in the settled dust, we make an estimate of the maximum concentration of airborne asbestos at 50 f/ml with a length greater than or equal to 5.0 m. This high exposure level is consistent with uncontrolled historical exposures in chrysotile asbestos mines and mills in Québec where the ore contains a minimum of 2-4 % chrysotile asbestos (Gibbs & DuToit, 1973). As representative WTC settled dust samples contain less than 0.01 % asbestos, the visible aerosol although enormously high, was overwhelmingly made-up of non-asbestos particulate matter and our estimate of airborne asbestos is most likely higher than actually occurred (Fig. 3).
After approximately 5 hours, we assume the airborne concentration of chrysotile asbestos to have decreased by 50-fold to no more than 1 f/ml with a length of 5 m or greater (Fig. 4). We further assume that over the next 26.4 days, until the first air sample was collected on October 8th, the airborne concentration of chrysotile asbestos decreased linearly to a level consistent with background, i.e., effectively zero (Fig. 9). This assumption is
conservative since the decrease is more likely to have been exponential.
Two periods describe the estimated chrysotile asbestos exposure
Analysis of representative settled dust samples released from the attack on the World Trade Center found only trace concentrations of chrysotile asbestos to be present. These analytical results are consistent with the reports describing the uses of asbestos in the WTC. The first 39 stories of the North Tower (WTC1) were sprayed with chrysotile asbestos containing fireproofing and this type of asbestos was used in other construction products in the towers (Langer and Morse, 2001). Based on the analysis of settled dust the exposure estimate for the general population need only consider exposure to chrysotile asbestos. The cumulative exposure from the collapse of the first tower until the first air sample was collected on October 8th is estimated in the following manner:
September 11th from 10AM – 3PM. 5 hours at 50 f/ml with a length greater or equal to 5 m in length is equivalent to 1 day (24 hr) at an exposure of 10.4 f/ml or 3 working days (8 hrs). This initial exposure will be described using a cumulative exposure index (given in f/ml × years) that can be added to a second time period of lower (but still above background) asbestos exposure. Three working days at 10.4 f/ml yield a total exposure of 10.4 f/ml x 3 days or 31.2 f/ml x days. The yearly average can be obtained dividing by 250 working days/year to describe the cumulative exposure on an annual basis that corresponds to 0.12 f/ml x years.
From 3AM on September 11th to October 8th. We are estimating that by mid-afternoon of September 11th the airborne concentration of chrysotile asbestos had decreased to 1 f/ml with a length greater or equal to 5 m. Furthermore, we are assuming the airborne chrysotile asbestos concentration decreased linearly by over 11,000-fold to the experimentally determined value of < 0.00009 f/ml by October 8th. Additional analysis over the month of October indicates the concentration of airborne chrysotile asbestos remained consistently similar to the value determined on October 8th below the sensitivity. The air samples were collected at different times of the day to determine if excursions were occurring – none were found.
Assuming the asbestos fiber concentration decreased linearly, after approximately 13 days, the estimated exposure fell to 0.5 f/ml. Such an exposure for 26.4 days is equivalent to 13.2 f/ml × days. Again, these are 24hr days rather than 8hrs working days so we multiply the exposure by 3 so over the 26.4-day period the cumulative exposure is estimated to be 39.6 f/ml × days. Once the exposure is averaged over a year (divide by 250 days/yr – 0.16 f/ml × years and added to the 5hr exposures of 0.12 f/ml × year, making the total cumulative exposure 0.28 f/ml × years.
The two-time periods of cumulative exposure can be added 0.12 f/ml × years (initial 5 hrs after first tower collapses on 9/11) + 0.16 f/ml × years (next 26.4 days)
To estimate the total cumulative exposure from 9/11 to 10/8 = 0.28 f/ml × years
If you were not exposed to the initial 5hr dust cloud on 9/11, your cumulative chrysotile asbestos exposure will be 43 % lower (Fig. 9).
Risk assessment for pleural mesothelioma and lung cancer from cumulative exposure to chrysotile asbestos post 9/11
The risk of developing an asbestos-related mesothelioma depends on the type of asbestos one is exposed to, the cumulative exposure and the age at which exposure first
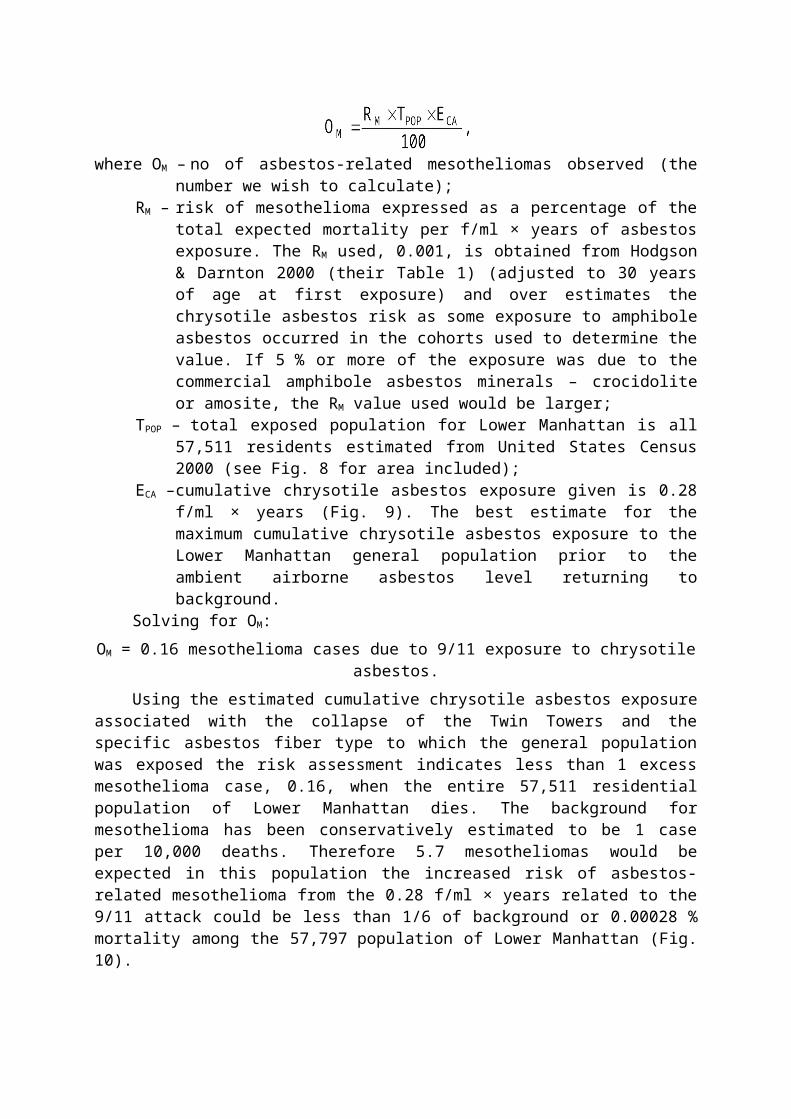
occurs (Hodgson and Darnton, 2000). The number of asbestos-related mesothelioma (OM) can be calculated for a given asbestos exposed population using the following relationship:
where OM – no of asbestos-related mesotheliomas observed (the number we wish to calculate);
RM – risk of mesothelioma expressed as a percentage of the total expected mortality per f/ml × years of asbestos exposure. The RM used, 0.001, is obtained from Hodgson & Darnton 2000 (their Table 1) (adjusted to 30 years of age at first exposure) and over estimates the chrysotile asbestos risk as some exposure to amphibole asbestos occurred in the cohorts used to determine the value. If 5 % or more of the exposure was due to the commercial amphibole asbestos minerals – crocidolite or amosite, the RM value used would be larger;
TPOP –total exposed population for Lower Manhattan is all 57,511 residents estimated from United States Census 2000 (see Fig. 8 for area included);
ECA – cumulative chrysotile asbestos exposure given is 0.28 f/ml × years (Fig. 9). The best estimate for the maximum cumulative chrysotile asbestos exposure to the Lower Manhattan general population prior to the ambient airborne asbestos level returning to background.
Solving for OM:OM = 0.16 mesothelioma cases due to 9/11 exposure to chrysotile asbestos.
Using the estimated cumulative chrysotile asbestos exposure associated with the collapse of the Twin Towers and the specific asbestos fiber type to which the general population was exposed the risk assessment indicates less than 1 excess mesothelioma case, 0.16, when the entire 57,511 residential population of Lower Manhattan dies. The background for mesothelioma has been conservatively estimated to be 1 case per 10,000 deaths. Therefore 5.7 mesotheliomas would be expected in this population the increased risk of asbestos-related mesothelioma from the 0.28 f/ml × years related to the 9/11 attack could be less than 1/6 of background or 0.00028 % mortality among the 57,797 population of Lower Manhattan (Fig. 10).
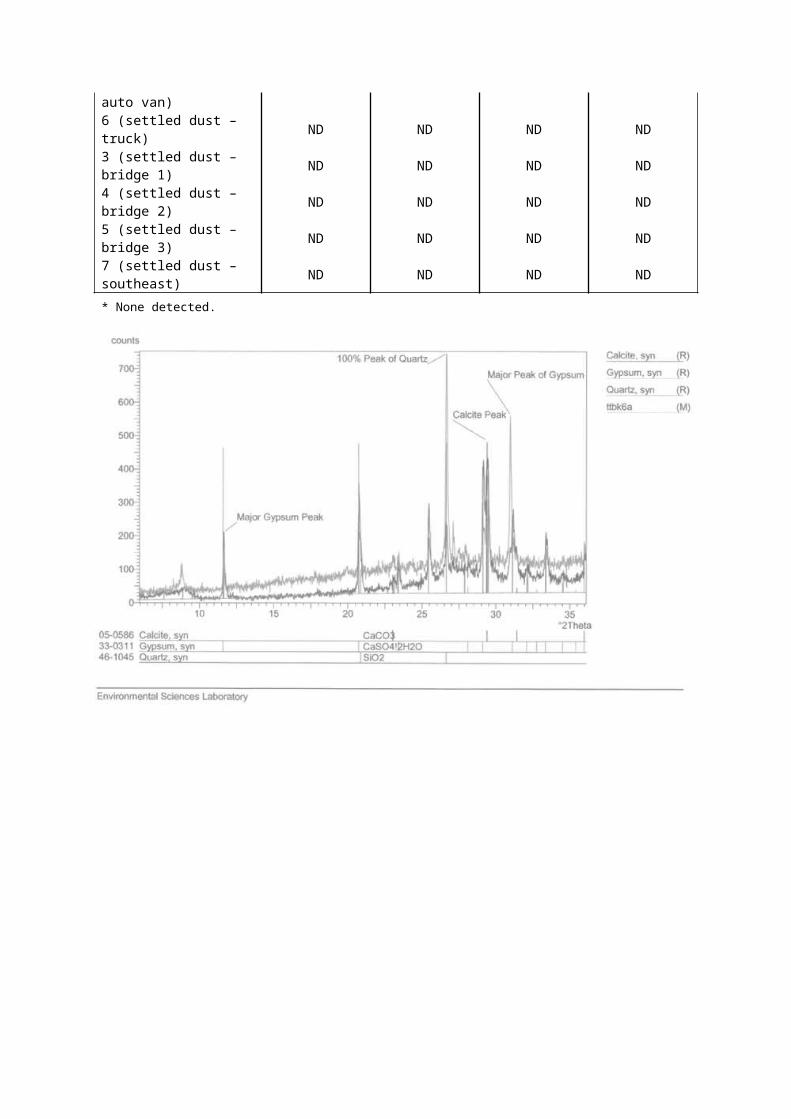
Fig. 10. Percentage of mesothelioma morrtality (adjusted to 30 years of age at first exposure) for cumulative exposure to crocidolote asbestos and chrysotile asbestos
Risk assessment of asbestos-related lung cancer for the population of Lower Manhattan exposed by the events of 9/11
For a given cumulative asbestos exposure the risk of developing lung cancer will increase as a percentage of the lung cancer risk in the population exposed. The most significant risk factor for developing lung cancer for the general populations of Lower Manhattan, as most everywhere else, is cigarette smoking. Approximately 80-85 % of the lung cancer risk is attributed to smoking (Doll & Peto, 1981). We will assume that on average 8 % of cigarette smokers develop lung cancer while among those that choose not to smoke only 0.8 % will develop lung cancer (Wilson and Crouch, 2001, p. 230-231). Furthermore, we will assume that the risk of lung cancer increases linearly with cumulative asbestos exposure following the relationship:
We wish to calculate the increase in the observed number of lung cancers (ObsL) due to exposure to chrysotile asbestos.Where ExpL – expected percentage of lung cancer deaths assumed to be 8 % among smokers;
RL – risk of lung cancer expressed as a percentage of lung cancer deaths per f/ml × years of asbestos exposure. The RL used is 0.062 obtained from Hodgson and Darnton 2000 (their Table 2) and is specific for chrysotile asbestos;
ECA – cumulative chrysotile asbestos exposure given is 0.28 f/ml × years (Fig. 9). The
best estimate of the maximum cumulative chrysotile asbestos exposure to the general population of Lower Manhattan prior to the ambient airborne asbestos level returning to background.
ObsL = 8 % + 0.00139 % = 8.00139 %.
If the entire population of Lower Manhattan, 57,511, smoked cigarettes the lung cancer mortality, after the death of the entire population, would be expected to be 8 % or 4,601 lung cancer cases. The cumulative chrysotile asbestos exposure of 0.28 f/ml × years would increase the percentage of lung cancer to 8.00138 % or add approximately 1 additional case to the 4,601 lung cancer cases among the general population of Lower Manhattan. If the entire population of Lower Manhattan choose not to smoke and were not exposed to asbestos from the events of 9/11, 0.8 % or 460 cases of lung cancer would be expected to occur. The 0.28 f/ml × years cumulative chrysotile asbestos exposure would increase the percentage of lung cancers among the non-smokers to 0.800139 %. The asbestos-related increase in lung cancer is 10-fold lower among the non-smokers because their risk of lung cancer is 10-fold lower. Approximately 0.1 of a lung cancer case among 57,511 deaths among non-smokers (Fig. 11). Thus, if all of the Lower Manhattan residents were non-smokers, the exposure to 0.28 f/ml × years of cumulative chrysotile asbestos exposure would cause an increase of approximately 0.1 of a lung cancer case within the 57,511 deceased residents. Thus, if all the Lower Manhattan residents were non-smokers, the 0.28 f/ml × years of cumulative exposure to chrysotile asbestos would cause an increase of approximately 0.1 of a lung cancer case within the 57,511 decreased residents.
Discussion and conclusions
The murderous attacks on the Twin Towers of NYC’s World Trade Center (WTC) and the subsequent collapse of both towers created a pressure wave, which dispersed an enormous amount of construction dust containing trace concentrations of chrysotile asbestos into the ambient air of Lower Manhattan (Fig. 2a-g). Although estimating the airborne concentration of asbestos on and shortly after 9/11, has limitations; it undoubtedly increased the background concentration of asbestos in the ambient air in NYC, which remained elevated for some period of time (Fig. 3, 5a). A cumulative exposure was estimated for the duration of the time when the background concentration of asbestos was elevated using air sampling data post 9/11 and exposure data available in the scientific literature.
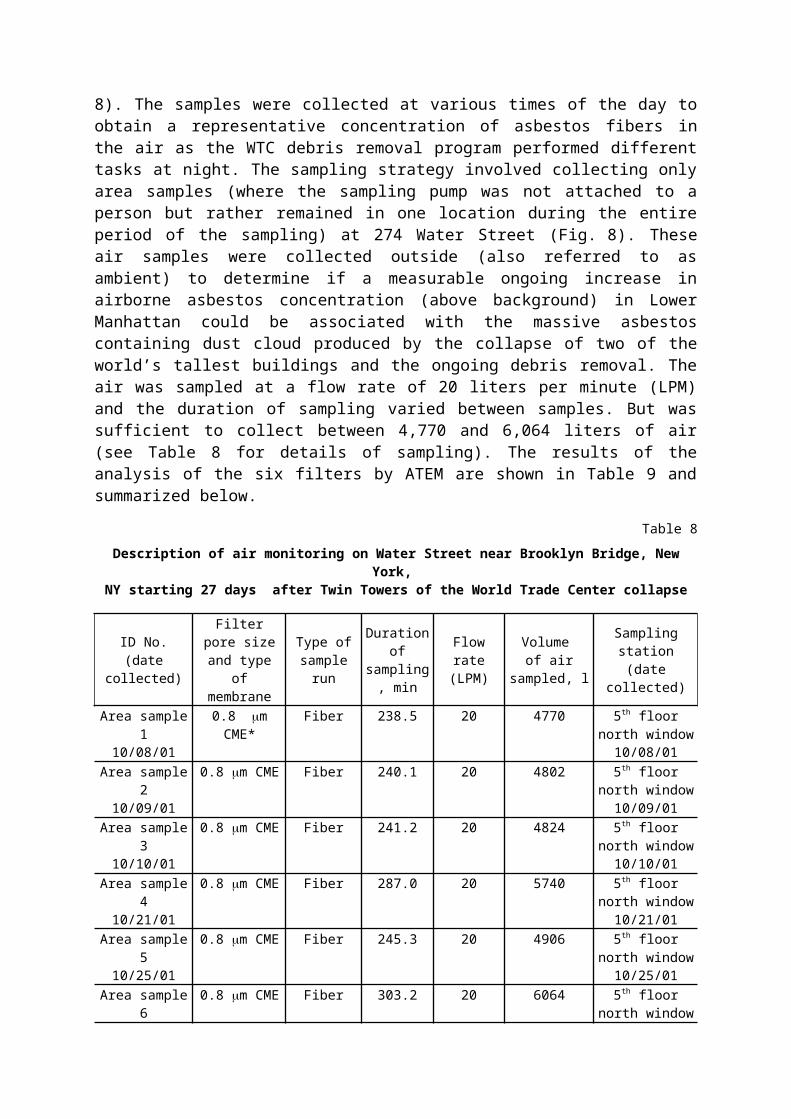
Fig. 11. Comparison of the risk of lung cancer for non-smokers & smokers as a function of exposure to chrysotile asbestos
The potential for the almost 58,000 people living in Lower Manhattan to develop an increased incidence of asbestos-related cancer from post 9/11 asbestos exposure depends principally on three factors: asbestos fiber types to which exposure occurred, the cumulative asbestos exposure (the intensity and duration of exposure usually reported as f/ml × years) and for mesothelioma their ages when the exposures first occurred. When sufficiently large exposures occur, greater than those to the general population in Lower Manhattan post 9/11, cigarette smoking can be an important additional factor in increasing the risk of asbestos-related lung cancer (Fig. 11). Analysis of the settled dust by XRD, PLM and ATEM indicates that of the six regulated asbestos fiber types only chrysotile asbestos is present in the settled dust. We have adequately estimated cumulative chrysotile asbestos exposure related to 9/11 thus we can undertake a risk assessment for the general population of Lower Manhattan due to the asbestos released by the events of 9/11. We will describe the preliminary results of our risk assessment here.
Construction of the Twin Towers occurred at a time when imports of chrysotile asbestos from Canada exceeded 500,000 t per year and it was commonly used in the fabrication of building materials and some of these products were used in the construction of the WTC (Ross and Virta, 2001). The fireproofing of the Twin Towers’ structural steel was originally intended to be a sprayed on chrysotile asbestos product (Table 1). Although the lower floors of the North Tower (WTC1) were fireproofed with this product, the use of asbestos for this application was abandoned prior to completing half of the first tower due to public health concerns (Langer and Morse, 2001). Exposures to the general population from the over spray of the asbestos fireproofing and other construction processes by which asbestos was released into the ambient air was drawing the attention of NYC officials, who were carefully
monitoring these asbestos spray applications (Reitze et al, 1972). Although spray application of asbestos fireproofing was not yet banned in NYC, the contractors voluntarily choose to change to asbestos-free fireproofing prior to completing the first tower. However, chrysotile asbestos containing building products found additional uses besides fireproofing in the construction of the WTC (Langer and Morse, 2001). It is estimated that 320,000 commercial buildings in the U.S. contain friable asbestos (Nolan and Langer, 2001).
Based on our knowledge of the use of chrysotile asbestos in the Twin Towers finding trace levels of the mineral in the settled dust from their collapse was to be expected. Do to the limited use of this fibrous minerals in the construction of the towers, it seems reasonable to assume that a higher concentration, such as 1 % or more reported by others, may occur, but are not representative of the settled dust in general and therefore not relevant to the dust cloud. The uniformity of composition among the six settled dust samples analyzed indicate that mixing occurred tending the dust toward a fairly uniform composition. The chrysotile asbestos content was at trace levels (Table 7).
The extent of the settled dust post 9/11 and the potential for additional asbestos release from the demolition and removal of the WTC debris suggested we should collect ambient air samples to determine, if and for how long, background concentrations of airborne asbestos were increased in Lower Manhattan post 9/11. Our air-sampling program began 27 days after the collapse of the Twin Towers. The air-sampling site was near the WTC site and selected to be representative of ambient non-occupational exposure in Lower Manhattan (Fig. 9). To gather the best exposure data possible, the sampling program was designed to be sensitive enough to detect very small concentrations of airborne asbestos (considered the low end of background) and identify the asbestos fiber type(s) present (ASTM, 2001). Air samples were collected on six days over a three-week period in October; no asbestos of any fiber type was identified (Table 9). The sensitivity for asbestos was below 1 fiber in 12,246 ml or a thousand-fold below OSHA’s occupational asbestos standard of 0.1 f/ml (OSHA, 1994) (see Fig. 12 for comparison of post 9/11 with other standards).
The asbestos fiber concentrations in the ambient air in Lower Manhattan one month post 9/11 are consistently below the sensitivity of the historical air samples used to establish the background in NYC. As post 9/11 air samples that were designed to a sensitivity an order magnitude lower than those of the historical air samples collected pre 9/11, airborne asbestos concentrations pre and post 9/11 may actually be identical. These levels of asbestos exposure are at the lower range of ambient airborne asbestos reported by WHO (1986):
“Based on surveys conducted in 1986, fiber concentrations (fibers 5 m in length) in outdoor air, measured in Austria, Canada, Germany, South Africa and the USA, were between 0.0001 and about 0.01 f/ml, levels in most samples being less than 0.002 f/ml. Means or medians were between 0.00005 and 0.02 f/ml based on more recent determinations in Canada, Italy, Japan, Slovak Republic, Switzerland, United Kingdom, and US”.
One month post 9/11, ambient airborne asbestos concentrations in Lower Manhattan were at the lower end of what the WHO reports as background for ambient air. The positive controls collected in Asbest City were at the high end of the range for ambient air at 0.003 f/ml, greater than or equal to 5 m in length (Fig. 12) or 10-fold higher if chrysotile of all fiber lengths is considered. These air samples indicate the validity of the methodology and only required analyzing all the particles in 387 ml (in the WTC air samples all the particles in a 30-fold greater volume of air were examined, Table 9). In Asbest City where the cumulative chrysotile asbestos exposure to the general population is order of magnitude higher, than that of the general population of Lower Manhattan due to the events of 9/11, an increased incidence of asbestos-related cancer has not been convincingly demonstrated (Shcherbakov et
al, 2001).The post 9/11 air monitoring results reveal a similar pattern to those reported for the
asbestos in the ambient air after the 1995 earthquake in Kobe, Japan where no long-term increase in the background levels of airborne asbestos were also found (Higashi et al., 2001). The Kobe earthquake was a magnitude 7.2 on the Richter Scale, which is 5-fold greater in magnitude than that caused by the collapse of each 500,000 t WTC Tower and involved the loss of 5,500 lives and left 200,000 people homeless. It is noteworthy that with the loss of life and the extent of the property damaged at Kobi exceeded that of 9/11 in NYC.
Air sampling in Lower Manhattan has established that ambient airborne chrysotile asbestos level in NYC had returned to background by October 8th. Therefore the period of elevated airborne concentrations of chrysotile could not be more than 27 days. To estimate the cumulative asbestos exposure, we divided twenty-seven days into two exposure periods of differing intensity and duration. The first time period was the initial five hours after the collapse of the first tower where airborne asbestos concentrations were estimated to be no more than 50 f/ml 5 m in length (Fig. 9). Extremely high exposures of this type are associated with the mining and milling of chrysotile asbestos with a minimum use of control technology to reduce exposure (Gibbs & DuToit, 1973). In the mining environment the concentration of asbestos in the ore is 200-400-fold higher than the 0.01 % chrysotile asbestos found in the WTC dust. Even allowing for the extremely high concentration of airborne dust after the collapse of the towers it is doubtful a dust containing such a small amounts of asbestos could generate an aerosol, which exceed the levels of the mining environment – an intensity of 50 f/ml of asbestos. Within five hours the dense dust cloud had cleared sufficiently for the skyline of Lower Manhattan to be visible again from seven miles away on the Brooklyn College campus (Fig. 4). For the second time period we estimated the airborne concentration of chrysotile asbestos had decreased 50-fold to 1 f/ml by the time the skyline was again visible, further decreasing linearly to background over the next 26.4 days. The mean exposure during that time is estimated to be 0.5 f/ml 5 m in length (Fig. 9).
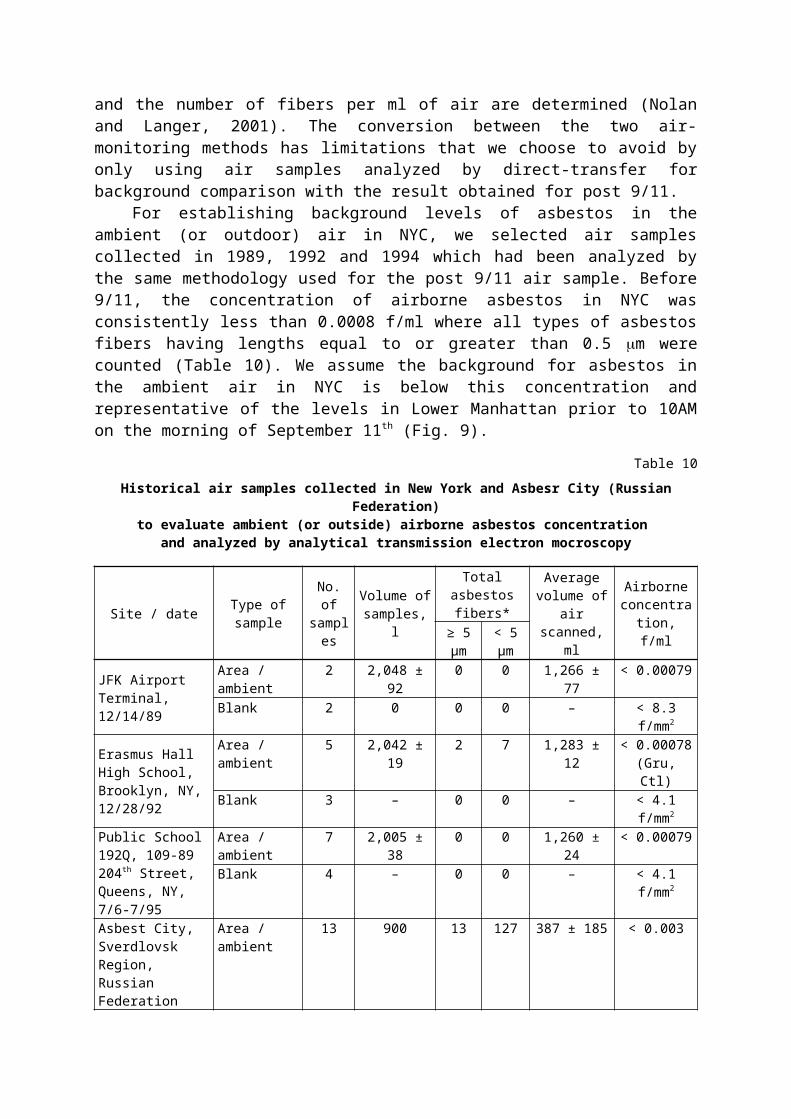
Fig. 12. Comparison of asbestos exposures from the collapse of WTC complex with historical, permissible and background asbestos exposures. Note the United States Environmental Protection Agency (EPA) does
not determine the actual airborne concentration of asbestos but only reports the number of structures per unit area of the collection filter (EPA f/ml value given below is estimated). EPA does not define structure as any of the six regulated types of asbestos therefore asbestos fiber type is not known. The Environmental Science Laboratory (ESL) determined the historical airborne asbestos concentration in NYC to be indistinguishable
from those one month post 9/11
Over the 27 days when the airborne chrysotile asbestos concentration exceed background we estimate a cumulative exposure of 0.28 f/ml × years to have occurred based on the settled dust analysis it is predominantly, if not exclusively, a chrysotile asbestos only exposure. Approximately 43 % of the cumulative exposure is from the initial dust cloud. If one was fortunate enough to avoid this five hour exposure, the estimated cumulative exposure would be reduced to 0.16 f/ml × years. The estimated cumulative asbestos exposure is conservative in that it most likely greater than what actually occurred consistent with our goal of estimating the upper limit of the asbestos-related cancer risk.
The United States Environmental Protection Agency (EPA) and NYC’s Department of Health US EPA 2002 report on 4,946 air samples collected between September 11, 2001 and January 22, 2002. Twenty-seven of these samples exceeded the asbestos standard developed by EPA for AHERA of 70 structures per mm2, for re-occupying school buildings after asbestos abatement. Twenty-seven of the thirty-one air samples that exceeded the AHERA standard occurred prior to September 30, 2001. These data are consistent with our conclusion that by October 8th the airborne concentration of asbestos in Lower Manhattan had returned to background.
Among the 6.4 % of the air samples (27 of 442 air samples collected in September, 2001) above the AHERA standard for re-entering schools post asbestos abatement the EPA does not report – the type, airborne concentration or size distribution of the asbestos present –
all of which are needed for a modern risk assessment. The EPA’s air monitoring results are expressed as structures per mm2 of the air-monitoring filter. The term structure does not specify the type of asbestos found on the filter. The actual volume of air sampled is not reported, but the AHERA method recommends 1,200 to 1,800 liters of air be sampled. We can estimate the f/ml asbestos exposure by assuming a 25 mm diameter air-monitoring filter was used by EPA, which has an effective collection area of 385 mm 2, and then 70 structures per mm2 would correspond to 26,950 structures per filter. If 1,200 liters (or 1,200,000 ml) of air were pumped across the filter to collect the structures than the airborne concentration of structure would be 0.022 f/ml (Fig. 12). If 1,800 liters of air were filtered the value would fall to 0.015 f/ml. EPA does not specify by how much each of these 27 samples exceeded the 70 structure/mm2 standard but in the worst case it appears 93.6 % were below 0.022 f/ml. Again, these EPA/NYC air samples tend to support our view that our estimated average exposure of 0.5 f/ml (for the airborne chrysotile concentration during the 26.4 days post 9/11) is above the actual intensity of the asbestos exposure over that period of time.
The 70 structures/mm2 standard used by EPA/NYC to monitor asbestos in the ambient air of Lower Manhattan is an asbestos standard for indoor air (specifically for re-occupying schools after asbestos abatement) and the value was determined to reflect the number of asbestos fibers on the air filter statistically identical to background (Federal Register, 1987). The EPA relied on a statistical argument claiming that 70 structures/mm2 is statistically equivalent to background levels of asbestos contaminating the air filters and then simply rationalized that background was safe. For comparison, the asbestos contamination measured on our filters were approximately 70-fold lower than the AHERA standard. To our knowledge, the AHERA standard is the only asbestos standard in the world where the actual concentration of asbestos in the air is not determined (WHO, 1989). It was not based on any relationship between cumulative asbestos exposure to the various fiber types and mortality from asbestos-related cancers (Hodgson & Darnton, 2000).
The NYC Department of Environmental Protection notes that neither the US EPA nor NYC has an asbestos standard for outdoor air so they rely on an indoor standard for asbestos of 0.01 f/ml, which seems derivative of the 70 structures/mm2 (NYC, Department of Environmental Protection, 2002) to interpret the results from ambient air monitor in Lower Manhattan post 9/11. Air monitoring data indicate that airborne concentration of asbestos inside and outside of buildings is identical (Nolan and Langer, 2001). Generally, asbestos standards are not specific to either indoor or outdoor (WHO, 1989). It seems reasonable to assume that the indoor dust is similar in chrysotile asbestos content to that of the dust cloud characterized as containing trace concentrations of chrysotile asbestos. The EPA has offered to clean private residences of the dust from 9/11 (Fig. 13). For the purpose of risk assessment the EPA/NYC air sampling data has four major limitations. First the exposure response relationships for asbestos-related cancers are indexed to the number of asbestos fibers ≥ 5 m while the 70 structures/mm2 standard is indexed to fiber ≥ 0.5 m. Secondly, the asbestos fiber types vary in potency particularly for mesothelioma where crocidolite asbestos is 500-fold more potent than chrysotile asbestos therefore it is important to know what fiber type (or types) to which people are being exposed (Fig. 10). Thirdly, without regard to fiber length, the NYC/EPA indoor standard is within 10-fold of the OSHA asbestos standard of 0.1f/ml. Our own experience with asbestos air sampling (indoor and outside) indicates that 0.01 f/ml is too high a sensitivity (Nolan and Langer, 2001). Fourth and most importantly the actual concentration of airborne asbestos was not determined.
Fig. 13. Dusty clothes in a retail store near WTC site post 9/11. Concerns about the risk of asbestos-related cancer from the trace level of chrysotile asbestos in
the indoor continue to be raised in the media
Assuming that any exposure to asbestos (no matter how slight) increases one’s risk of developing asbestos-related cancer is often referred to as the linear no-threshold model. It is commonly used by regulatory agencies throughout the world to provide worst-case scenarios for exposure to carcinogens. Opinions of medical and scientific experts largely view this approach as the most protective of human health. It is not known for certain that these slight exposures carry any cancer risk as they are far below the cumulative exposures known to cause cancer and associated with increases too small ever to be actually observed.
However, high exposure to the various asbestos fiber types will cause asbestos-related cancer. Historically, these high exposures could result in 20 % excess cancer mortality among workers with substantial cumulative exposure to the asbestos minerals (Hodgson & Darnton, 2000). The pattern of asbestos-related cancer is complex and has been studied in considerable detail (Nolan et al., 2001). This analysis makes two fundamental assumptions about the carcinogenicity of chrysotile asbestos. Firstly, it is assumed, following Hodgson and Darnton, 2000, that chrysotile is less carcinogenic than the commercial asbestos minerals – amosite or crocidolite. Secondly, it is assumed that there is a linear dose-response at low dose. Our approach is to interpolate the increase risk of asbestos-related cancer from high cumulative exposures, with known risk for the asbestos-related cancers (mesothelioma and lung), to the very low exposure assuming the risk of cancer to be linear. For a cumulative asbestos exposure of 0.28 f/ml × year, the entire 57,511 residents of Lower Manhattan may experience 1 mesothelioma case then would be otherwise expected (Fig. 9) and if the entire population smoked cigarettes approximately one lung cancer case (Fig. 10). If the exposure was to crocidolite asbestos, the mesothelioma risk would be almost 500-fold higher (Fig. 10). If no one smoked the risk of lung cancer would be 10-fold lower. As of 1993 approximately 25 %
of all persons over 18 years of age smoke and approximately 86 % of the residents in Lower Manhattan are over 18 years of age so the actual increased lung cancer incidence would be about ¼ of a case (Zang and Wynder, 1998). At this very low cumulative asbestos exposure the synergy with smoking is not a significant factor in the calculation.
Acknowledgements
We acknowledge support from a Higher Education Advanced Technology grant from the State of New York to support the Environmental Sciences Laboratory, Brooklyn College of The City University of New York and the International Environmental Research Foundation of New York City. We thank Drs. B. Price and A.M. Langer for very helpful suggestions that led to improvements of this paper.
References
1. Asbestos Hazard Emergency Response Act (AHERA) (1986). Signed into law by President R. Regan on October 22, 1986. Required EPA to propose rules (promulgated final rules) by October 14, 1981.
2. ASTM (2001). Standard practice for asbestos detection limit based on counts. Designation D6620-00.3. Doll R., Peto R. (1981). The causes of cancer: quantitative estimates of avoidable risks of cancer in the
United States today. J. Natl. Cancer. Inst. 66: 1191-1380.4. Federal Register, Part III, Environmental Protection Agency, 40 CFR Part 763, Asbestos-Containing
Materials in Schools, October 30, 1987.5. Federal Emergency Management Agency (FEMA) (2002). World Trade Center Building Performance
Study Data Collection, Preliminary Observations and Recommendations, FEMA 402/May. Federal Insurance and Mitigation Administration, Washington, DC and FEMA Region II, New York, NY, www.fema.gov/library/wtcstudy.shtm
6. Gibbs G.W. and DuToit R.S. (1973). Environmental data in mining. In: Biological Effects of Asbestos IARC Publication No. 8, IARC, Geneva, p. 311-320.
7. Higashi T., Takahashi K. (2001). Asbestos and environmental health in Japan In: The Health Effects of Chrysotile Asbestos: Contribution of Science to Risk-Management Decisions. (Eds) R.P. Nolan, A.M. Langer, M. Ross, F.J. Wicks & R.F. Martin, Ottawa, Canada, Canadian Mineralogist, Spec. Publ. 5, p. 215-226.
8. Hodgson J.T., Darnton A. (2000). The quantitative risk of mesothelioma and lung cancer in relationship to asbestos exposure. Annals of Occup. Hyg. 44: 565-601.
9. ISO 10312 International Standard (1995). Ambient air – determination of asbestos fibers – Direct Transfer. Transmission Electron Microscopy Method.
10. Langer A.M., Morse R.G. (2001) The World Trade Center Catastrophe: Was the type of spray proofing a factor in the collapse of the towers. Indoor. Built. Environment. 10: 350-360.
11. New York Board of Fire Underwriters, Bureau of Fire Prevention and Public Relations. Report on One World Trade Center Fire, New York, NY, February 13, 1975, High-Rise Fire Safety.
12. New York City Department of Environmental Protection, 2002, http://www.nyc.gov/dep.html/ airmonit.html
13. Nolan R.P., Langer A.M., Ross M., Wicks E.J., Martin R.F. (eds) (2001). The Health Effects of Chrysotile Asbestos: Contribution of Science to Risk-Management Decisions, Ottawa, Canada, Canadian Mineralogist, Spec. Publ. 5, p. 1-304.
14. Nolan R.P., Langer A.M. (2001). Concentration and type of asbestos fibers in air inside buildings In: The Health Effects of Chrysotile Asbestos: Contribution of Science to Risk-Management Decisions. (Eds) R.P. Nolan, A.M. Langer, M. Ross, F.J. Wicks & R.F. Martin, Ottawa, Canada, Canadian Mineralogist, Spec. Publ. 5, p. 39-51.
15. Occupational Safety and Health Administration (OSHA) (1994). Department of Labor, Reg. 29CFR1910, Effective October 11, 1994.
16. Reitz W.B., Nicholson W.J., Holaday D.A., Selikoff I.J. (1972). Application of sprayed inorganic fiber containing asbestos: Occupational health hazard. Amer. Indust. Hyg. Assn. J. 33: 178-191.
17. Ross M., Virta R.L. (2001). Occurrence, production and uses of asbestos In: The Health Effects of Chrysotile Asbestos: Contribution of Science to Risk-Management Decisions. (Eds) R.P. Nolan, A.M. Langer, M. Ross, F.J. Wicks & R.F. Martin, Ottawa, Canada, Canadian Mineralogist, Spec. Publ. 5, p. 79-88.
18. Shcherbakov S.V., Kashansky S., Domnin S.G., Kogan F.M., Kozlov V., Kochelayev V.A., Nolan R.P. (2001). The health effects of mining and milling chrysotile: The Russian experience In: The Health Effects of Chrysotile Asbestos: Contribution of Science to Risk-Management Decisions. (Eds) R.P. Nolan, A.M. Langer, M. Ross, F.J. Wicks & R.F. Martin, Ottawa, Canada, Canadian Mineralogist, Spec. Publ. 5,
p. 187-198.19. United States Environmental Protection Agency (2002). http:// www.epa.gov/wtc/data_summary.htm 20. Wilson R., Couch EAC (2001). Risk-benefit analysis, Harvard University Press, Cambridge, MA,
p. 1-370.21. World Health Organization (1986). International Programme on Chemical Safety (IPCS),
Environmental Health Criteria 203, Chrysotile Asbestos, http://www.who.int/docs/ehc_203.htm 22. World Health Organization (1989). Occupational exposure limit for asbestos, Oxford, United
Kingdom, Distr General WHO/OCH/89.1, Annex 2, A Review of the Development of Occupational Exposure Limits for Asbestos.
23. Zang E.A., Wynder E.L. (1998). Smoking trends in the United States between 1969 and 1995 based on patients hospitalized with non-smoking related disease. Preventative Medicine 27: 854-861.