Embed Size (px)
Citation preview
Rural America at a GlanceRural America at a Glance2020 Edition
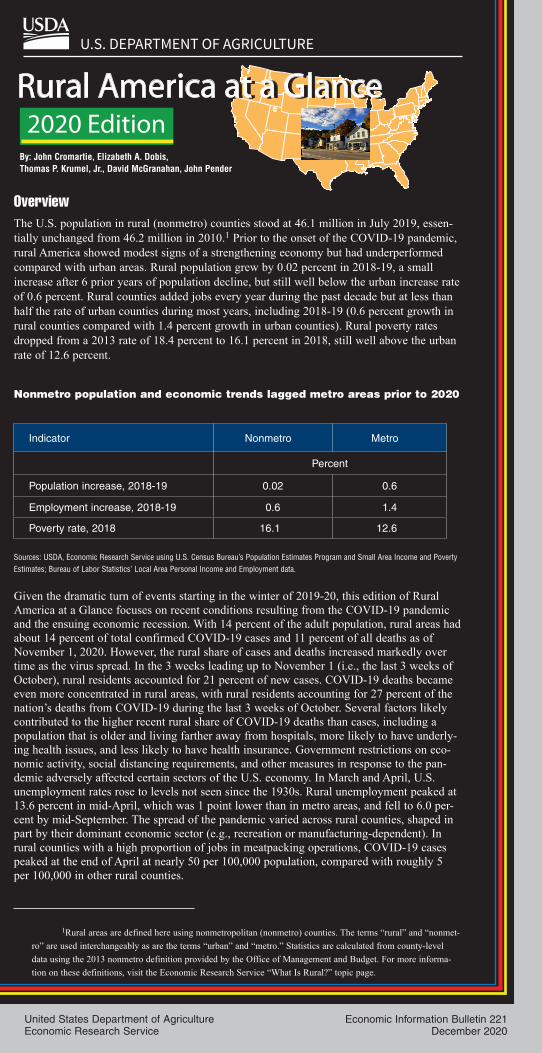
Overview The U.S. population in rural (nonmetro) counties stood at 46.1 million in July 2019, essen-tially unchanged from 46.2 million in 2010.1 Prior to the onset of the COVID-19 pandemic, rural America showed modest signs of a strengthening economy but had underperformed compared with urban areas. Rural population grew by 0.02 percent in 2018-19, a small increase after 6 prior years of population decline, but still well below the urban increase rate of 0.6 percent. Rural counties added jobs every year during the past decade but at less than half the rate of urban counties during most years, including 2018-19 (0.6 percent growth in rural counties compared with 1.4 percent growth in urban counties). Rural poverty rates dropped from a 2013 rate of 18.4 percent to 16.1 percent in 2018, still well above the urban rate of 12.6 percent.
Nonmetro population and economic trends lagged metro areas prior to 2020
Indicator Nonmetro Metro
Percent
Population increase, 2018-19 0.02 0.6
Employment increase, 2018-19 0.6 1.4
Poverty rate, 2018 16.1 12.6
Sources: USDA, Economic Research Service using U.S. Census Bureau’s Population Estimates Program and Small Area Income and Poverty Estimates; Bureau of Labor Statistics’ Local Area Personal Income and Employment data. Given the dramatic turn of events starting in the winter of 2019-20, this edition of Rural America at a Glance focuses on recent conditions resulting from the COVID-19 pandemic and the ensuing economic recession. With 14 percent of the adult population, rural areas had about 14 percent of total confirmed COVID-19 cases and 11 percent of all deaths as of November 1, 2020. However, the rural share of cases and deaths increased markedly over time as the virus spread. In the 3 weeks leading up to November 1 (i.e., the last 3 weeks of October), rural residents accounted for 21 percent of new cases. COVID-19 deaths became even more concentrated in rural areas, with rural residents accounting for 27 percent of the nation’s deaths from COVID-19 during the last 3 weeks of October. Several factors likely contributed to the higher recent rural share of COVID-19 deaths than cases, including a population that is older and living farther away from hospitals, more likely to have underly-ing health issues, and less likely to have health insurance. Government restrictions on eco-nomic activity, social distancing requirements, and other measures in response to the pan-demic adversely affected certain sectors of the U.S. economy. In March and April, U.S. unemployment rates rose to levels not seen since the 1930s. Rural unemployment peaked at 13.6 percent in mid-April, which was 1 point lower than in metro areas, and fell to 6.0 per-cent by mid-September. The spread of the pandemic varied across rural counties, shaped in part by their dominant economic sector (e.g., recreation or manufacturing-dependent). In rural counties with a high proportion of jobs in meatpacking operations, COVID-19 cases peaked at the end of April at nearly 50 per 100,000 population, compared with roughly 5 per 100,000 in other rural counties.
1Rural areas are defined here using nonmetropolitan (nonmetro) counties. The terms “rural” and “nonmet-ro” are used interchangeably as are the terms “urban” and “metro.” Statistics are calculated from county-level data using the 2013 nonmetro definition provided by the Office of Management and Budget. For more informa-tion on these definitions, visit the Economic Research Service “What Is Rural?” topic page.
United States Department of AgricultureEconomic Research Service
Economic Information Bulletin 221December 2020
By: John Cromartie, Elizabeth A. Dobis, Thomas P. Krumel, Jr., David McGranahan, John Pender
Rural America at a Glance 2020 Edition12
The Spread and Severity of COVID-19 Across Urban and Rural Areas
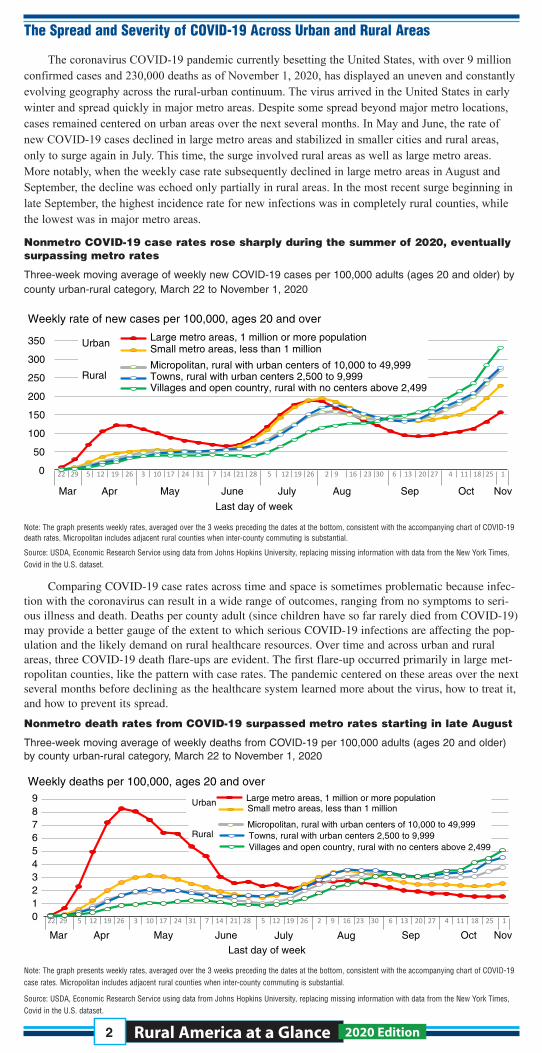
The coronavirus COVID-19 pandemic currently besetting the United States, with over 9 million confirmed cases and 230,000 deaths as of November 1, 2020, has displayed an uneven and constantly evolving geography across the rural-urban continuum. The virus arrived in the United States in early winter and spread quickly in major metro areas. Despite some spread beyond major metro locations, cases remained centered on urban areas over the next several months. In May and June, the rate of new COVID-19 cases declined in large metro areas and stabilized in smaller cities and rural areas, only to surge again in July. This time, the surge involved rural areas as well as large metro areas. More notably, when the weekly case rate subsequently declined in large metro areas in August and September, the decline was echoed only partially in rural areas. In the most recent surge beginning in late September, the highest incidence rate for new infections was in completely rural counties, while the lowest was in major metro areas.
Nonmetro COVID-19 case rates rose sharply during the summer of 2020, eventually surpassing metro rates
Three-week moving average of weekly new COVID-19 cases per 100,000 adults (ages 20 and older) by county urban-rural category, March 22 to November 1, 2020
0
50
100
150
200
250
300
350
1912 2652922 3 31241710 7 14 21 28 5 12 19 26 30231692 2720136 12518114
Mar Apr May June July Aug Sep Oct Nov
Last day of week
Weekly rate of new cases per 100,000, ages 20 and over
Rural
Urban Large metro areas, 1 million or more population
Micropolitan, rural with urban centers of 10,000 to 49,999
Small metro areas, less than 1 million
Towns, rural with urban centers 2,500 to 9,999Villages and open country, rural with no centers above 2,499
Note: The graph presents weekly rates, averaged over the 3 weeks preceding the dates at the bottom, consistent with the accompanying chart of COVID-19 death rates. Micropolitan includes adjacent rural counties when inter-county commuting is substantial.
Source: USDA, Economic Research Service using data from Johns Hopkins University, replacing missing information with data from the New York Times, Covid in the U.S. dataset.
Comparing COVID-19 case rates across time and space is sometimes problematic because infec-tion with the coronavirus can result in a wide range of outcomes, ranging from no symptoms to seri-ous illness and death. Deaths per county adult (since children have so far rarely died from COVID-19) may provide a better gauge of the extent to which serious COVID-19 infections are affecting the pop-ulation and the likely demand on rural healthcare resources. Over time and across urban and rural areas, three COVID-19 death flare-ups are evident. The first flare-up occurred primarily in large met-ropolitan counties, like the pattern with case rates. The pandemic centered on these areas over the next several months before declining as the healthcare system learned more about the virus, how to treat it, and how to prevent its spread.
Nonmetro death rates from COVID-19 surpassed metro rates starting in late August
Three-week moving average of weekly deaths from COVID-19 per 100,000 adults (ages 20 and older) by county urban-rural category, March 22 to November 1, 2020
Large metro areas, 1 million or more population
Micropolitan, rural with urban centers of 10,000 to 49,999
Small metro areas, less than 1 millionUrban
Rural Towns, rural with urban centers 2,500 to 9,999Villages and open country, rural with no centers above 2,499
0123456789
Weekly deaths per 100,000, ages 20 and over
Mar Apr May June July Aug Sep Oct Nov
Last day of week
1912 2652922 3 31241710 7 14 21 28 5 12 19 26 30231692 2720136 12518114
Note: The graph presents weekly rates, averaged over the 3 weeks preceding the dates at the bottom, consistent with the accompanying chart of COVID-19 case rates. Micropolitan includes adjacent rural counties when inter-county commuting is substantial.
Source: USDA, Economic Research Service using data from Johns Hopkins University, replacing missing information with data from the New York Times, Covid in the U.S. dataset.
Rural America at a Glance 2020 Edition2
The second flare-up, which began with a rise in cases in early July and a rise in deaths two weeks later, was different in two respects. First, it fully involved both rural and urban areas as the virus spread from major urban areas. Second, while the increase in the weekly rate of infections was larger than in the initial flare-up, the spike in deaths was much smaller because testing was more widespread, the infected population was younger and less vulnerable, and treatments were more effec-tive.
The third flare-up, ongoing as of this writing, presents an urban-rural geography exactly the opposite of the initial flare-up, being higher the more rural is the type of area across the urban-rural scale. Rural rates of COVID-19 mortality were never previously higher than they were in late October, and the rise in cases during this period suggests that rural mortality is likely to continue increasing. In contrast, rates in large metro areas were the lowest since the beginning of the pandemic, although their recent rise in case rates suggests that this situation may change.
COVID-19 and Rural Healthcare ResourcesSeveral factors likely help explain recent higher rural COVID-19 adult death rates in late
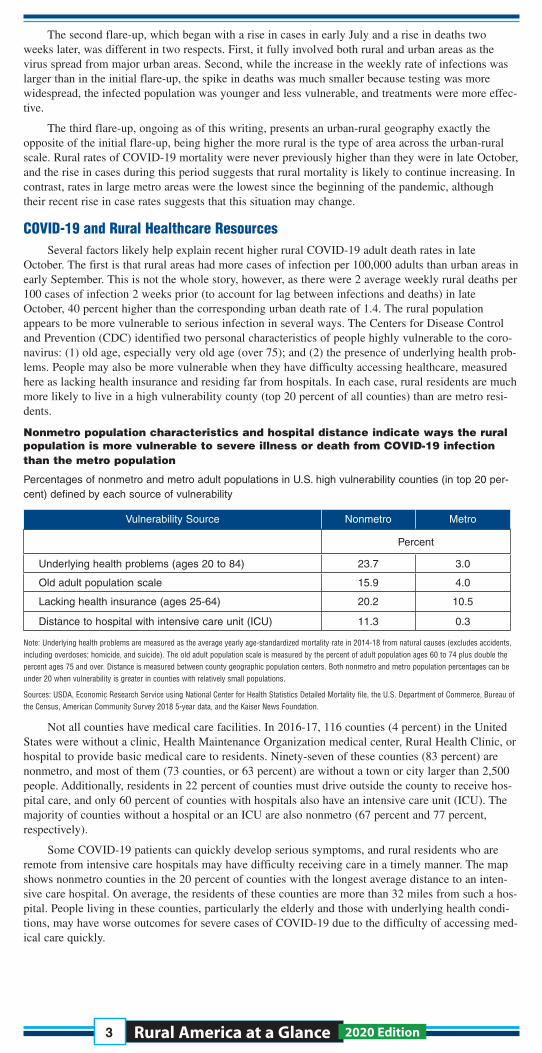
October. The first is that rural areas had more cases of infection per 100,000 adults than urban areas in early September. This is not the whole story, however, as there were 2 average weekly rural deaths per 100 cases of infection 2 weeks prior (to account for lag between infections and deaths) in late October, 40 percent higher than the corresponding urban death rate of 1.4. The rural population appears to be more vulnerable to serious infection in several ways. The Centers for Disease Control and Prevention (CDC) identified two personal characteristics of people highly vulnerable to the coro-navirus: (1) old age, especially very old age (over 75); and (2) the presence of underlying health prob-lems. People may also be more vulnerable when they have difficulty accessing healthcare, measured here as lacking health insurance and residing far from hospitals. In each case, rural residents are much more likely to live in a high vulnerability county (top 20 percent of all counties) than are metro resi-dents.
Nonmetro population characteristics and hospital distance indicate ways the rural population is more vulnerable to severe illness or death from COVID-19 infection than the metro population
Percentages of nonmetro and metro adult populations in U.S. high vulnerability counties (in top 20 per-cent) defined by each source of vulnerability
Vulnerability Source Nonmetro Metro
Percent
Underlying health problems (ages 20 to 84) 23.7 3.0
Old adult population scale 15.9 4.0
Lacking health insurance (ages 25-64) 20.2 10.5
Distance to hospital with intensive care unit (ICU) 11.3 0.3
Note: Underlying health problems are measured as the average yearly age-standardized mortality rate in 2014-18 from natural causes (excludes accidents, including overdoses; homicide, and suicide). The old adult population scale is measured by the percent of adult population ages 60 to 74 plus double the percent ages 75 and over. Distance is measured between county geographic population centers. Both nonmetro and metro population percentages can be under 20 when vulnerability is greater in counties with relatively small populations.
Sources: USDA, Economic Research Service using National Center for Health Statistics Detailed Mortality file, the U.S. Department of Commerce, Bureau of the Census, American Community Survey 2018 5-year data, and the Kaiser News Foundation.
Not all counties have medical care facilities. In 2016-17, 116 counties (4 percent) in the United States were without a clinic, Health Maintenance Organization medical center, Rural Health Clinic, or hospital to provide basic medical care to residents. Ninety-seven of these counties (83 percent) are nonmetro, and most of them (73 counties, or 63 percent) are without a town or city larger than 2,500 people. Additionally, residents in 22 percent of counties must drive outside the county to receive hos-pital care, and only 60 percent of counties with hospitals also have an intensive care unit (ICU). The majority of counties without a hospital or an ICU are also nonmetro (67 percent and 77 percent, respectively).
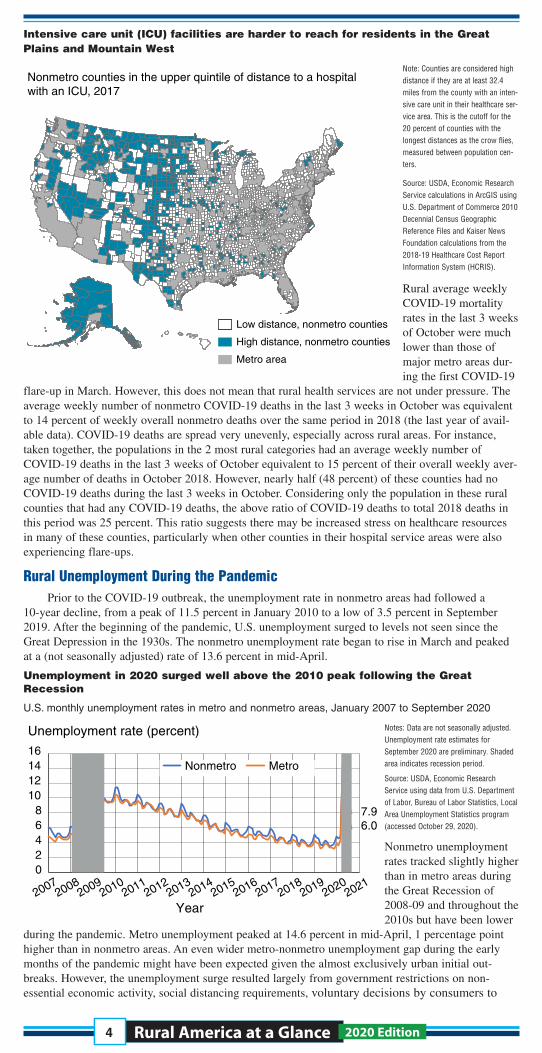
Some COVID-19 patients can quickly develop serious symptoms, and rural residents who are remote from intensive care hospitals may have difficulty receiving care in a timely manner. The map shows nonmetro counties in the 20 percent of counties with the longest average distance to an inten-sive care hospital. On average, the residents of these counties are more than 32 miles from such a hos-pital. People living in these counties, particularly the elderly and those with underlying health condi-tions, may have worse outcomes for severe cases of COVID-19 due to the difficulty of accessing med-ical care quickly.
3
Rural America at a Glance 2020 Edition3
Intensive care unit (ICU) facilities are harder to reach for residents in the Great Plains and Mountain West
Nonmetro counties in the upper quintile of distance to a hospital with an ICU, 2017
Low distance, nonmetro counties
High distance, nonmetro counties
Metro areas
Note: Counties are considered high distance if they are at least 32.4 miles from the county with an inten-sive care unit in their healthcare ser-vice area. This is the cutoff for the 20 percent of counties with the longest distances as the crow flies, measured between population cen-ters.
Source: USDA, Economic Research Service calculations in ArcGIS using U.S. Department of Commerce 2010 Decennial Census Geographic Reference Files and Kaiser News Foundation calculations from the 2018-19 Healthcare Cost Report Information System (HCRIS).
Rural average weekly COVID-19 mortality rates in the last 3 weeks of October were much lower than those of major metro areas dur-ing the first COVID-19
flare-up in March. However, this does not mean that rural health services are not under pressure. The average weekly number of nonmetro COVID-19 deaths in the last 3 weeks in October was equivalent to 14 percent of weekly overall nonmetro deaths over the same period in 2018 (the last year of avail-able data). COVID-19 deaths are spread very unevenly, especially across rural areas. For instance, taken together, the populations in the 2 most rural categories had an average weekly number of COVID-19 deaths in the last 3 weeks of October equivalent to 15 percent of their overall weekly aver-age number of deaths in October 2018. However, nearly half (48 percent) of these counties had no COVID-19 deaths during the last 3 weeks in October. Considering only the population in these rural counties that had any COVID-19 deaths, the above ratio of COVID-19 deaths to total 2018 deaths in this period was 25 percent. This ratio suggests there may be increased stress on healthcare resources in many of these counties, particularly when other counties in their hospital service areas were also experiencing flare-ups.
Rural Unemployment During the PandemicPrior to the COVID-19 outbreak, the unemployment rate in nonmetro areas had followed a
10-year decline, from a peak of 11.5 percent in January 2010 to a low of 3.5 percent in September 2019. After the beginning of the pandemic, U.S. unemployment surged to levels not seen since the Great Depression in the 1930s. The nonmetro unemployment rate began to rise in March and peaked at a (not seasonally adjusted) rate of 13.6 percent in mid-April.
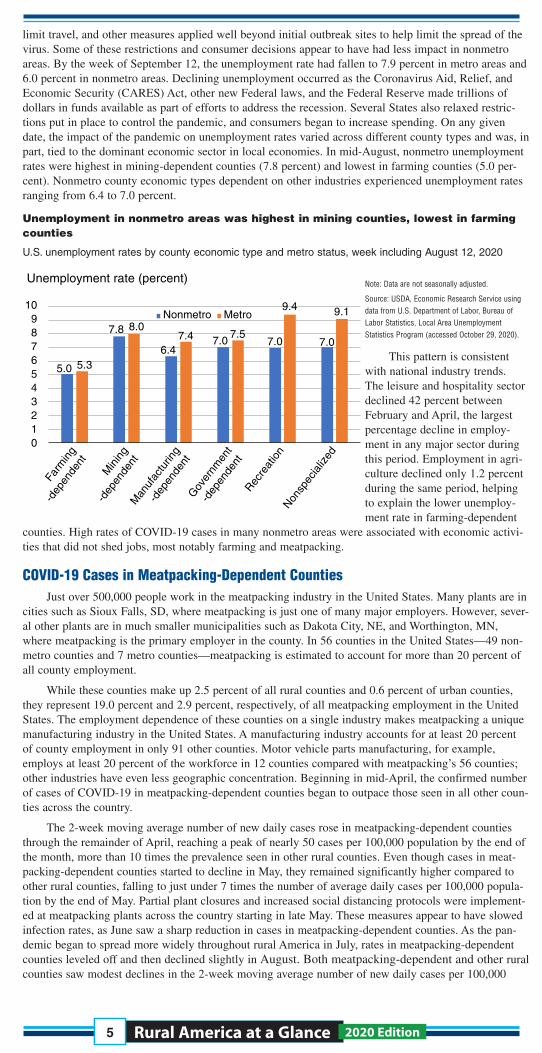
Unemployment in 2020 surged well above the 2010 peak following the Great Recession
U.S. monthly unemployment rates in metro and nonmetro areas, January 2007 to September 2020
6.07.9
20
20072008
20092010
20112012
20132014
20152016
20182017
20192020
2021
468
10121416
Unemployment rate (percent)
Year
Nonmetro Metro
Notes: Data are not seasonally adjusted. Unemployment rate estimates for September 2020 are preliminary. Shaded area indicates recession period.
Source: USDA, Economic Research Service using data from U.S. Department of Labor, Bureau of Labor Statistics, Local Area Unemployment Statistics program (accessed October 29, 2020).
Nonmetro unemployment rates tracked slightly higher than in metro areas during the Great Recession of 2008-09 and throughout the 2010s but have been lower
during the pandemic. Metro unemployment peaked at 14.6 percent in mid-April, 1 percentage point higher than in nonmetro areas. An even wider metro-nonmetro unemployment gap during the early months of the pandemic might have been expected given the almost exclusively urban initial out-breaks. However, the unemployment surge resulted largely from government restrictions on non-essential economic activity, social distancing requirements, voluntary decisions by consumers to
4
Rural America at a Glance 2020 Edition45
limit travel, and other measures applied well beyond initial outbreak sites to help limit the spread of the virus. Some of these restrictions and consumer decisions appear to have had less impact in nonmetro areas. By the week of September 12, the unemployment rate had fallen to 7.9 percent in metro areas and 6.0 percent in nonmetro areas. Declining unemployment occurred as the Coronavirus Aid, Relief, and Economic Security (CARES) Act, other new Federal laws, and the Federal Reserve made trillions of dollars in funds available as part of efforts to address the recession. Several States also relaxed restric-tions put in place to control the pandemic, and consumers began to increase spending. On any given date, the impact of the pandemic on unemployment rates varied across different county types and was, in part, tied to the dominant economic sector in local economies. In mid-August, nonmetro unemployment rates were highest in mining-dependent counties (7.8 percent) and lowest in farming counties (5.0 per-cent). Nonmetro county economic types dependent on other industries experienced unemployment rates ranging from 6.4 to 7.0 percent.
Unemployment in nonmetro areas was highest in mining counties, lowest in farming counties
U.S. unemployment rates by county economic type and metro status, week including August 12, 2020
Unemployment rate (percent)
5.0
7.8
6.47.0 7.0 7.0
5.3
8.07.4 7.5
9.4 9.1
0123456789
10Nonmetro
Farm
ing
-dep
ende
nt
Min
ing
-dep
ende
ntM
anuf
actu
ring
-dep
ende
ntG
over
nmen
t
-dep
ende
ntRec
reat
ion
Nonsp
ecia
lized
Metro
Note: Data are not seasonally adjusted.
Source: USDA, Economic Research Service using data from U.S. Department of Labor, Bureau of Labor Statistics, Local Area Unemployment Statistics Program (accessed October 29, 2020).
This pattern is consistent with national industry trends. The leisure and hospitality sector declined 42 percent between February and April, the largest percentage decline in employ-ment in any major sector during this period. Employment in agri-culture declined only 1.2 percent during the same period, helping to explain the lower unemploy-ment rate in farming-dependent
counties. High rates of COVID-19 cases in many nonmetro areas were associated with economic activi-ties that did not shed jobs, most notably farming and meatpacking.
COVID-19 Cases in Meatpacking-Dependent CountiesJust over 500,000 people work in the meatpacking industry in the United States. Many plants are in
cities such as Sioux Falls, SD, where meatpacking is just one of many major employers. However, sever-al other plants are in much smaller municipalities such as Dakota City, NE, and Worthington, MN, where meatpacking is the primary employer in the county. In 56 counties in the United States—49 non-metro counties and 7 metro counties—meatpacking is estimated to account for more than 20 percent of all county employment.
While these counties make up 2.5 percent of all rural counties and 0.6 percent of urban counties, they represent 19.0 percent and 2.9 percent, respectively, of all meatpacking employment in the United States. The employment dependence of these counties on a single industry makes meatpacking a unique manufacturing industry in the United States. A manufacturing industry accounts for at least 20 percent of county employment in only 91 other counties. Motor vehicle parts manufacturing, for example, employs at least 20 percent of the workforce in 12 counties compared with meatpacking’s 56 counties; other industries have even less geographic concentration. Beginning in mid-April, the confirmed number of cases of COVID-19 in meatpacking-dependent counties began to outpace those seen in all other coun-ties across the country.
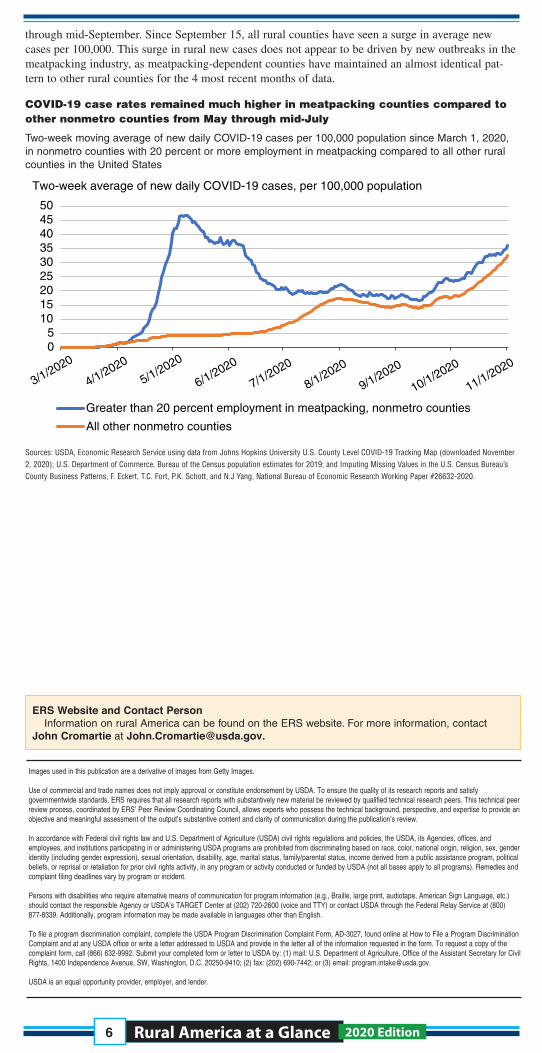
The 2-week moving average number of new daily cases rose in meatpacking-dependent counties through the remainder of April, reaching a peak of nearly 50 cases per 100,000 population by the end of the month, more than 10 times the prevalence seen in other rural counties. Even though cases in meat-packing-dependent counties started to decline in May, they remained significantly higher compared to other rural counties, falling to just under 7 times the number of average daily cases per 100,000 popula-tion by the end of May. Partial plant closures and increased social distancing protocols were implement-ed at meatpacking plants across the country starting in late May. These measures appear to have slowed infection rates, as June saw a sharp reduction in cases in meatpacking-dependent counties. As the pan-demic began to spread more widely throughout rural America in July, rates in meatpacking-dependent counties leveled off and then declined slightly in August. Both meatpacking-dependent and other rural counties saw modest declines in the 2-week moving average number of new daily cases per 100,000
Rural America at a Glance 2020 Edition5
through mid-September. Since September 15, all rural counties have seen a surge in average new cases per 100,000. This surge in rural new cases does not appear to be driven by new outbreaks in the meatpacking industry, as meatpacking-dependent counties have maintained an almost identical pat-tern to other rural counties for the 4 most recent months of data.
COVID-19 case rates remained much higher in meatpacking counties compared to other nonmetro counties from May through mid-July
Two-week moving average of new daily COVID-19 cases per 100,000 population since March 1, 2020, in nonmetro counties with 20 percent or more employment in meatpacking compared to all other rural counties in the United States
50
3/1/2020
4/1/2020
5/1/2020
6/1/2020
7/1/2020
8/1/2020
9/1/2020
10/1/2020
11/1/2020
101520253035404550
Two-week average of new daily COVID-19 cases, per 100,000 population
Greater than 20 percent employment in meatpacking, nonmetro counties
All other nonmetro counties
Sources: USDA, Economic Research Service using data from Johns Hopkins University U.S. County Level COVID-19 Tracking Map (downloaded November 2, 2020); U.S. Department of Commerce, Bureau of the Census population estimates for 2019; and Imputing Missing Values in the U.S. Census Bureau’s County Business Patterns, F. Eckert, T.C. Fort, P.K. Schott, and N.J Yang, National Bureau of Economic Research Working Paper #26632-2020.
6
Images used in this publication are a derivative of images from Getty Images.
Use of commercial and trade names does not imply approval or constitute endorsement by USDA. To ensure the quality of its research reports and satisfy governmentwide standards, ERS requires that all research reports with substantively new material be reviewed by qualified technical research peers. This technical peerreview process, coordinated by ERS’ Peer Review Coordinating Council, allows experts who possess the technical background, perspective, and expertise to provide an objective and meaningful assessment of the output’s substantive content and clarity of communication during the publication’s review. In accordance with Federal civil rights law and U.S. Department of Agriculture (USDA) civil rights regulations and policies, the USDA, its Agencies, offices, and employees, and institutions participating in or administering USDA programs are prohibited from discriminating based on race, color, national origin, religion, sex, gender identity (including gender expression), sexual orientation, disability, age, marital status, family/parental status, income derived from a public assistance program, political beliefs, or reprisal or retaliation for prior civil rights activity, in any program or activity conducted or funded by USDA (not all bases apply to all programs). Remedies and complaint filing deadlines vary by program or incident.
Persons with disabilities who require alternative means of communication for program information (e.g., Braille, large print, audiotape, American Sign Language, etc.) should contact the responsible Agency or USDA’s TARGET Center at (202) 720-2600 (voice and TTY) or contact USDA through the Federal Relay Service at (800) 877-8339. Additionally, program information may be made available in languages other than English.
To file a program discrimination complaint, complete the USDA Program Discrimination Complaint Form, AD-3027, found online at How to File a Program Discrimination Complaint and at any USDA office or write a letter addressed to USDA and provide in the letter all of the information requested in the form. To request a copy of thecomplaint form, call (866) 632-9992. Submit your completed form or letter to USDA by: (1) mail: U.S. Department of Agriculture, Office of the Assistant Secretary for Civil Rights, 1400 Independence Avenue, SW, Washington, D.C. 20250-9410; (2) fax: (202) 690-7442; or (3) email: [email protected].
USDA is an equal opportunity provider, employer, and lender.
ERS Website and Contact Person Information on rural America can be found on the ERS website. For more information, contact
John Cromartie at [email protected].