Embed Size (px)
Citation preview

United States Department of Agriculture
www.ers.usda.gov
A Report from the Economic Research Service
Abstract
Japan imports large amounts of beef, primarily from Oceania and North America, and its consumers are willing to pay a premium for heavily marbled, grain-fed beef. As a result, Japan’s import of certain beef cuts and offal raise the value of U.S. cattle. Trade bans resulting from the discovery of bovine spongiform encephalopathy (BSE) in North America dramatically shifted beef supplies to imported beef from Australia and New Zealand. Beef consumption in Japan may increase from current levels in Japan’s market, particularly if prices fall or income rises, despite a declining popula-tion. Economic factors, demographic factors, import and domestic policies and regula-tions, as well as consumer tastes and preferences, will determine the outlook for beef consumption in Japan and the ability of U.S. beef to compete in that market. Japan’s domestic beef production relies upon imported feed, primarily from the United States, to feed specifi c breeds energy-intensive rations. Government support plays an impor-tant role in the market structure of the domestic beef industry, which has an impact on imported beef from other countries, including the United States.
Keywords: Japan, beef, cattle, trade, beef markets, demand elasticity
About the Authors
Kakuyu Obara is an analyst with USDA’s Foreign Agricultural Service. Michael McConnell and John Dyck are economists with USDA’s Economic Research Service.
Kakuyu ObaraMichael McConnell, [email protected]
John Dyck, [email protected]
Japan’s Beef Market
LDP-M-194-01
August 2010
Contents
Approved by USDA’s World Agricultural
Outlook Board
Summary . . . . . . . . . . . . 3
Introduction . . . . . . . . . . 5
Demand for Beef . . . . . . 7
Domestic Beef Supply . . . . . . . . . . . . . 15
Government Policy Affecting the Beef Sector . . . . . . . . . . . . . .21
Imported Beef . . . . . . . 27
Prices . . . . . . . . . . . . . . 37
Conclusions and Projections . . . . . . . . . 39
References . . . . . . . . . . 42
Appendix 1 . . . . . . . . . . 46
Appendix 2 . . . . . . . . . . 50
Appendix 3 . . . . . . . . . . 52

2Japan’s Beef Market / LDP-M-194-01
Economic Research Service/USDA
Acknowledgments
The authors gratefully acknowledge the reviews of staff from USDA’s Economic Research Service (ERS): William Coyle, Fred Gale, Molly Garber, Kenneth Mathews, Mary Anne Normile, Greg Pompelli, and Richard Stillman; of staff from USDA’s Foreign Agricultural Service (FAS): Yong Keun Ban, Hisao Fukuda, and Claire Mezoughem; Shayle Shagam of USDA’s World Agricultural Outlook Board; Roxanne Clemens of Iowa State Univer-sity; Erin Daley of the U.S. Meat Export Federation; John W. Longworth of the University of Queensland; Hiroshi Mori of Senshu University; Michael Reed of the University of Kentucky; James Robb of the Livestock Marketing Information Center; James R. Simpson of the University of Florida and Ryukoku University; and Wyatt Thompson of the University of Missouri.
Many industry experts in Japan generously provided information for this report in briefi ngs and interviews.The assistance provided by Thomas Aoki, Michael Conlon, Midori Iijima, Tamiko Narisawa, Masayuki Otsuka, and Paul Spencer of FAS/Tokyo, and Greg Hanes from Tokyo’s U.S. Meat Export Federation is gratefully acknowledged. Linda Atkinson (ERS) provided statistical expertise. Special thanks are extended to Angela Anderson for editorial assistance and Wynnice Pointer-Napper for layout design.
Use of commercial and trade names does not imply approval or constitute endorsement by USDA or ERS.

3Japan’s Beef Market / LDP-M-194-01
Economic Research Service/USDA
Japan’s beef consumption is important to U.S. agriculture. Beef eaten in Japan is either produced from Japanese cattle that are fed U.S. feedstuffs or imported. A large share of imported beef historically has come from U.S. cattle.
What Is the Issue?
Japanese beef consumption has been buffeted by severe shocks for over 15 years. As both a competitor of U.S. imported beef and a purchaser of U.S. feedstuffs, Japanese beef production has also suffered setbacks. As a result of the discovery of bovine spongiform encephalopathy (BSE), U.S. beef was completely banned from Japan’s market in 2004 and has had only limited access since. In the after-math of the BSE-related shocks that have affected consumption, production, and trade, a review of the entire Japanese beef market may provide insight into the potential for growth in Japanese beef consumption. It may also reveal the extent to which future Japanese beef production can satisfy a share of consumption and remain a market for U.S. feedstuffs and what the current and future role of U.S. beef might be in satisfying Japanese consumption.
What Did the Study Find?
Japanese beef consumption remains sensitive to income and price changes. Individual consumption of beef could rise signifi cantly if income levels rise or beef prices fall. The price of U.S. beef, relative to substitutes from Australia or Japan, is an important determinant of U.S. trade share. If the price of U.S. beef drops, imports from the United States are likely to expand, perhaps even to the level reached in 2003 (when Japan was the largest foreign market for U.S. beef).
Domestic Japanese beef production has not fi lled the gap left by the restric-tions on North American beef imports. High prices for feeder calves and high feed costs, together with a relatively small-scale feedlot industry, prevent Japanese production from increasing. Although strong Government subsidy support and a substantial import tariff continue to bolster the Japanese industry, beef production is unlikely to expand.
In recent years, Japan’s beef cattle industry has intensifi ed its feeding to increase certain beef attributes, such as marbling. This practice has helped support demand for U.S. corn and barley. The increase in feed per head of cattle may not continue because Japanese consumers may be less enthusiastic, for health reasons, about heavily marbled beef. Beef production in Japan, however, is likely to remain one of the key foreign markets for U.S. feed grain.
Certain lower priced cuts of U.S. beef, primarily “end cuts” and offal, are considered a good value in Japan. The Japanese market bids these U.S. cuts away from competing uses, adding to the cut-out value of U.S. cattle at slaughter. Current Japanese rules limit the supply of these cuts and raise their import prices. If these rules were changed, Japan’s purchases of these cuts could increase, most likely at the expense of Australian beef, which currently has the largest market share of imported beef in Japan.
Summary

4Japan’s Beef Market / LDP-M-194-01
Economic Research Service/USDA
How Was the Study Conducted?
The report draws on several sources of information:
• Livestock and grain and feed reports for Japan from the Foreign Agricul-tural Service (USDA);
• Reports and data published by Japan’s Ministry of Agriculture, Forestry and Fisheries (MAFF);
• Books and articles published about Japan’s beef industry;
• Interviews with representatives of fi rms, Government offi cials, and academics involved in the beef industry in Japan (September 2008);
• Econometric analysis by the authors.

5Japan’s Beef Market / LDP-M-194-01
Economic Research Service/USDA
Japan is the world’s second leading beef importer by value, behind the United States, and once was the most important export market for U.S. beef. In 2009, Japan imported over $470 million in U.S. beef products (down from $1.6 billion in 2003 prior to trade restrictions). Japan’s domestic production is a very important market for U.S. feedstuffs exports, with over $740 million imported to feed beef cattle in 2007 (the latest year with available data). Japan’s beef consumption, still relatively low by developed-country standards, grew substantially in the fi rst half of the 1990s after the liberalization of an import quota regime. Most of the new consumption was met by imports because domestic beef production in Japan is expensive.
A series of disease outbreaks and food safety incidents beginning in 1996 shook Japan’s beef market. Demand was affected repeatedly and, sometimes, substantially. Discovery of bovine spongiform encephalopathy (BSE), the neurological disease also known as mad cow disease, in Japan’s cattle herd in 2001 severely stressed domestic supply and depressed consumer confi dence. Discovery of BSE in North America in 2003 initially halted beef imports into Japan from the United States and Canada and later was followed by restric-tions on beef imports from North America. These actions cut off a large share of Japan’s beef supply, which has still not been replaced by other suppliers or restored from North American suppliers. Following 10 years of turbu-lence—1996 to the present—the future of Japan’s beef market is still unclear.
Through most of the 1990s and into the new century, Japan’s consumers and beef suppliers have operated in a stagnant economy. Income growth per person has been slight, although Japanese households remain among the wealthiest in the world. Population growth slowed over this period and became negative in 2005, a trend that is expected to continue. Given this environment, Japan may never consume as much beef as it did at its peak in 2000.
Japan’s consumers have proven to be price sensitive. Imported beef prices fell as Japan reduced import tariff levels during 1991-2000 and, in some years, as Japan’s currency strengthened. Before the removal of beef import quotas (1988-1991), experts speculated that Japan’s wealthy consumers would seek out the most expensive imported cuts, but some inexpensive cuts from North American and Oceania beef production, in fact, have become best sellers. Japan’s consumers are willing to pay more for these cuts (and some offal) than consumers in the exporting countries are, contributing to higher carcass prices for exporters. Despite the premium that they paid, Japanese customers regarded several popular imported cuts as good values in 2003 and before. Beef customers in Japan have a taste for specifi c cuts and qualities of meat that is different from that of consumers in the West. After trade bans were lifted in 2006, U.S. beef returned to Japan but at higher prices than in 2003, partly due to specifi c restrictions that limited supply. The higher prices indi-cate that demand for grain-fed beef products is still relatively high in Japan.
Japan sources beef both from both wagyu cattle—Japan’s traditional draught animal—and Holstein cattle from the dairy herd. Japan’s beef cattle farms, faced with a limited amount of land and feedstuffs, rely heavily on imported grains and roughage. In recent years, more grain has been used per pound of
Introduction

6Japan’s Beef Market / LDP-M-194-01
Economic Research Service/USDA
beef produced to increase the marbling of the meat. As a result, Japan’s beef production uses a signifi cant share of U.S. corn exports. Japan also imports a signifi cant amount of U.S. barley and other cereals, forages, and protein sources for feed rations. Thus, U.S. grain and forage supports both Japan’s domestic beef and beef imported from the United States.
The Japanese Government, feed companies, and cooperative organizations play an important role in support and risk management for domestic cattle and beef producers. Several Government programs provide subsidies for producers, and an industry program helps mitigate fl uctuating feed prices.
This report reviews the recent history and current situation of the Japanese beef market to help answer important questions about its future.

7Japan’s Beef Market / LDP-M-194-01
Economic Research Service/USDA
Meat consumption in Japan is much lower than in many other countries (fi g. 1). Large volumes of fi sh and seafood characterize the Japanese diet. Fish consumption, however, has stagnated in Japan over the past few decades, providing opportunities for growth in meat consumption. Meat consumption levels may never reach the levels in other societies, but Japan is a valuable market due to the demand for high-quality meat products with specifi c attri-butes. These trends are particularly true for the beef market.
Beef products in Japan are highly segmented. Beef is prepared differently depending not only on the type of cut, but also on whether the beef is wagyu or dairy, domestic or imported, grain-fed or grass-fed. In addition, income, price, consumers’ ages, and preferences can change not only overall beef consumption, but also the type and way in which beef is consumed.
How Beef Is Eaten
Beef is eaten both at home and away from home. Japan’s household consump-tion accounts for approximately 34 percent of beef consumption, while catering and food service accounts for 57 percent of consumption. Processing use—for use in cooked or otherwise preserved products—accounts for the fi nal 9 percent (MAFF, 2007).1 Cooking styles often infl uence what type of beef is preferred.
Traditional Japanese beef dishes are often prepared with short exposure to heat over an open fl ame or in boiling water. Because of this type of prepara-tion, cuts are generally thinly cut and well marbled to attain the desired taste and texture. Examples of traditional beef dishes can be found at yakiniku and shabu-shabu restaurants. Yakiniku is a Korean-style grilled dish served with thin, raw strips of beef. The meat is cooked by the customer on an open-fl ame grill set up at the table. After cooking the meat for a few minutes, the meat is then eaten with other vegetables, rice, and soy items. Similarly, shabu-shabu
1A different source, the Ministry of Agriculture, Forestry and Fisheries (MAFF) Meats for Processing survey, cited by the Agriculture and Livestock Industries Corporation (ALIC) in its Monthly Statistics (December 2009), attributes only 1.5 percent of beef con-sumption to processing.
Demand for Beef
Figure 1
Per capita annual meat consumption, 2008Pounds
Source: USDA, Economic Research Service calculations based on USDA, Foreign Agricultural Service Production, Supply and Distribution Online database and population data.
Brazil Canada China EuropeanUnion-27
Japan Mexico UnitedStates
0
50
100
150
200
250
300Beef Broiler Pork

8Japan’s Beef Market / LDP-M-194-01
Economic Research Service/USDA
restaurants also serve beef raw. The customer cooks the thinly sliced meat in boiling water or broth, and then eats it with different sauces. Other vegetables and noodles are also cooked in the boiling water. In both cases, thinly cut pieces of raw beef are used so that the meat is cooked evenly with a limited amount of heat. Heavily marbled beef is preferred as it provides a tender and fl avorful taste and texture. In most cases, these dishes are prepared with domestic meat.
Gyudon, or beef bowl, is also a popular dish. Gyudon contains onions and beef simmered in sweet soy sauce and served over rice. It can also be served with pickled ginger and miso soup. Gyudon is relatively inexpensive and typically served as a fast-food item. A beef bowl restaurant is a popular destination for lunch among business people seeking a quick and inexpen-sive meal. Yoshinoya and Sukiya are the two largest gyudon chains in Japan. Prior to the discovery of BSE in North America, these chains used imported U.S. beef, primarily short plate, and were hurt by the trade bans initiated in 2003. While Sukiya switched to Australian beef, Yoshinoya stopped serving gyudon altogether. Instead, Yoshinoya introduced buta don, or pork bowl, which has grown in popularity. Yoshinoya resumed its gyudon in 2006, when U.S. beef was available in Japan again, but kept buta don on its menu. With limited supplies of U.S. short-plate due to age restrictions of cattle, brisket is now also used as a substitute. Even for this low-priced dish, the Japanese prefer grain-fed beef. In general, across the spectrum of the different beef dishes, an affi nity for well-marbled beef means that grain-fed beef is used more often than grass-fed beef.
Hamburgers are another major preparation of beef in Japan and an excep-tion to the preference for grain-fed beef. McDonald’s has a strong franchise presence throughout Japan. Hamburgers are seen as a Western food and are especially popular among younger Japanese. In addition to hamburger consumption in restaurants, Japanese also eat a hamburg dish or a hamburg steak at home (a grilled ground beef patty, similar to a hamburger without the bun). These beef products are produced from domestic culled dairy cows and imported frozen beef. Grass-fed frozen beef for use in hamburger patties accounts for a signifi cant portion of the beef imported from Australia (see box, “Ground Beef and Hamburgers”).
Beef is also in demand from the cosmopolitan restaurant industry. Like most major cities around the globe, ethnic and foreign restaurants are quite common in Tokyo. One can fi nd menus ranging from Chinese to Italian to American-style steakhouse. Restaurants with European or American-style menus have created increased demand for meat, dairy, and bakery products. Particularly in urban areas, establishments demand more beef and meat prod-ucts as they seek to create authentic dishes and dining experiences for foreign and native Japanese customers.
Offal2 has a developed market in Japan as well. These cuts, such as tongue, liver, stomach, and intestine, are used in a variety of dishes for both at-home and away-from-home consumption, such as barbecue, hot pot dishes, stews, and soups. Particularly attractive for exporters, these products can be sold at higher prices in Japan than in their respective domestic markets. The United States supplied most of the imported beef offal to Japan prior to 2004. With other major exporters unable to make up for the lost supply of U.S. product,
2Offal are products from the animal that are not skeletal muscle. Offal includes inedible products, such as the hide, but also edible organs and muscles not included on a dressed car-cass. Edible offal can also be referred to as variety meat.

9Japan’s Beef Market / LDP-M-194-01
Economic Research Service/USDA
Japan’s consumers buy ground meat at stores to take home and cook, often in the form of a hamburg steak. They also consume ground meat in the form of hamburgers sold by fast-food restaurants or in hamburg steaks served at family restaurants. Since the mid-1990s, hamburger production for fast food has exceeded production for grocery-store ground beef (box fi g. 1). Both hamburger and ground beef production fell in 2001-03. BSE was discovered in Japan’s cattle in 2000 and in North American cattle in 2003, and food safety concerns may have prompted the reduction in ground meat production and consumption.
Japanese hamburgers are similar in appearance to U.S. hamburgers, but often incorporate features unique to Japan, such as rice buns and teriyaki fl avor. Typically, they use frozen beef trimmings from Australia and New Zealand and beef from Japanese culled cows. Pork, chicken, and fi sh may also be ground up for manufacture into “hamburgers.” For example, in 2007, the Mos Burger chain began selling hamburgers made from both ground pork and beef (Mos Burger).
Hamburger chains in Japan began to grow rapidly in the early 1970s. The largest chains, McDonald’s (with over 3,700 outlets), Mos Burger (with over 1,400 outlets), and Lotteria (over 500 outlets), provide menus for breakfast, lunch, and supper and sell a variety of food and beverages (Otsuka et al., 2009). After 2003, hamburger production rose quickly, regaining the previous peak (in 2000) of over 130,000 tons. At-home use of ground beef, however, has been stable at about 50,000 tons/year.1
How Much Imported Beef Is Used for Ground Beef in Japan?
Data on total beef use for the ground beef/hamburger market are not available. In 2007, about 177,000 tons of ground beef and hamburger were produced (Nihon Hamburg and Hamburger Association).2 The beef portion must be less than this total, because data for hamburgers include some mixed pork and beef, as well as chicken and fi sh products, and even the weight of buns. Trade data provide another view of use of ground meat. Most of the beef imported for hamburgers comes from Australia. Australian data on manufacturing beef, which is often used for hamburger, show exports to Japan of 120,000 tons in 2008. New Zealand data show exports of 17,000 tons of processing beef to Japan—also often used for hamburger. Thus, about 137,000 tons of meat imported by Japan probably was used mostly for ground meat. The Japanese import category “other meat of bovine animals, frozen” (see fi g. 13) is for
unspecifi ed boneless cuts and is chiefl y imported from Australia and New Zealand. This import category also has the lowest value per unit of the four categories of boneless frozen beef, which suggests that this is low-cost meat from grassfed cattle—the kind of meat widely used around the world for hamburgers (box fi g. 2).
However, the “other” category could also contain cuts not accounted for in the remaining three categories (i.e., loins; briskets and plates; chuck, clod, and round) and full sets (the boneless meat from an entire carcass often exported from Australia). After the ban on North American beef in 2003, the quantity and unit value of the “other” category rose, likely because cuts and full sets in this category were replacing some of the meat in the brisket/plate and chuck/clod/round categories that could no longer be sourced from North America. Before 2003, the quantity of frozen beef imported in the “other” category ranged between 80,000 and 100,000 metric tons, which may have been the upper limit on beef imported for hamburger. The 80,000-ton level represents about 11-12 percent of the pre-2001 beef imports (frozen and chilled) and about 16-17 percent of post-2003 beef imports.
Ground Beef and Hamburgers
Box figure 1
Ground beef and hamburger production in Japan1,000 metric tons
Notes: Hamburger includes beef, mixtures of beef and pork, chicken, and fish products, as well as buns. Ground meat that is exclusively pork is not included.
Source: Nihon Hamburg and Hamburger Association.
1989 91 93 95 97 99 2001 03 05 07 090
20406080
100120140160
Hamburger
Ground beef, retail
1Data are not available on ground beef used for hamburg steaks in restaurants.
2Excluding all-pork products.
Box figure 2
Unit value of Japan's frozen beef importsYen/kilograms
Source: USDA, Economic Research Service calculations based on Japan trade data.
1994 96 98 2000 02 04 06 080
200
400
600
800
1,000
Other
Brisket
Chuck
Loin

10Japan’s Beef Market / LDP-M-194-01
Economic Research Service/USDA
Japanese beef offal consumption has decreased since the BSE-related trade restrictions on U.S. beef.
Where Beef Is Purchased
The Japanese retail grocery sector is highly developed and segmented for specifi c consumer markets:
• Grocery stores range from high-end or specialty markets to more value-oriented stores. All stores, however, provide beef in their meat or butcher sections;
• Large, multi-level mass merchandising stores, such as Ito-Yokado and Jusco, sell meat and produce, as well as clothing, electronics, packaged goods, and other household goods; and
• Higher end department stores sell beef in basement-level grocery sections.
Beef is sold either as thinly sliced cuts or as larger steak-sized cuts. Stores typically display several different cuts of beef, as well as both imported and domestic beef, in small trays and clear plastic. Japanese law requires that all meat have a country-of-origin label, so customers can identify whether beef is domestic or imported. In addition, a national animal identifi cation system allows stores to provide information about domestic beef, some even as detailed as a picture of the farmer or farm that raised the animal. While customers do not always use these traceability features, Japanese retailers insist that their presence assures customers of the safety and integrity of their products (Clemens, 2003).
Japan’s numerous convenience stores have become more prominent suppliers in the retail beef market (Matsumoto et al., 2008).3 Prepared meals are commonly sold in stores, such as 7-Eleven. Bento boxes—prepared lunches with an assortment of meat, fi sh, rice, and vegetables—are sold in street shops and railway stations, as well as in convenience stores. Prepared meals and prepared meat are popular because of their convenience and availability in larger grocery stores, in addition to the smaller shops, stands, and conve-nience stores.
Historical Consumption Patterns
Beef consumption in Japan rose dramatically in 1990 after quantitative import restrictions on beef were removed. From 1990 to 1995, beef consump-tion per person increased annually by an average of 6 percent, including a 12-percent increase in 1993 (MAFF, 2005). A combination of modest economic growth, greater availability of imported beef, and a developing taste for imported grain-fed beef led to strong increases in consumption during this period.
Growth in beef consumption has repeatedly faltered since the mid 1990s (fi g. 2). Consumption had fallen 25 percent by 2007 to 5.7 kilograms (kg) per person, compared with its peak of 7.6 kg per person in 2000 (MAFF, 2005). This decline can be attributed to a series of events that infl uenced demand for beef and beef products.
3In 2007, over 68,000 convenience stores were operating in Japan.

11Japan’s Beef Market / LDP-M-194-01
Economic Research Service/USDA
Weak economic growth was one reason for the decrease in demand. From 1997 to 2002, gross domestic product (GDP) per person increased only 1 percent; in several years, GDP contracted. With income levels stagnant, consumers became more value conscious, preferring processed products and lower priced cuts for barbequing, as opposed to higher grade loins and other table cuts (Obara, 2000). Household beef consumption fell most steeply over this period (fi g. 3). Growth in demand from the restaurant and hotel industries kept consumption from falling even more dramati-cally prior to the 2001 discovery of BSE in the Japanese herd (Obara, 1999). After the BSE outbreak in Japan, beef demand fell across the board, leading to increased inventories, lower prices, and increased consumption of competing proteins, pork in particular.
Demographic changes also affect beef demand in Japan, although, on a year-to-year basis, they do not have a large effect on beef consumption. Looking over a decade or more, however, the decline in population and the aging of the population structure are likely to affect consumption signifi cantly.
Figure 2
Beef consumption In Japan has decreased since 2000Kilograms per person
Source: Japan’s Ministry of Agriculture, Forestry and Fisheries, Food Balance Sheet.
1990 92 94 96 98 2000 02 04 06 080
2
4
6
8
10
12
14
Beef
Pork
Chicken
Figure 3
At-home beef consumption in Japan has declined since 1995Kilograms per person
Sources: Japan’s Ministry of Agriculture, Forestry and Fisheries, Food Balance Sheet and Statistical Yearbook of the Ministry of Agriculture, Forestry and Fisheries.
1990 92 94 96 98 2000 02 04 06 080
1
2
3
4
5
6
7
8
Total beef consumption
At-home beef consumption

12Japan’s Beef Market / LDP-M-194-01
Economic Research Service/USDA
Japan’s population growth slowed until 2005 when growth reached zero. Since then, population change has been negative. Birth rates in Japan have been very low, as women choose to have fewer children or no children. Japan’s population is expected to drop by nearly 2.4 million by 2015 and by over 9 million by 2025, compared with the 2008 level of 127 million (U.S. Census Bureau, 2009). By itself, this decline will reduce consumption of all goods and services, including beef. The population decline has been pronounced throughout rural areas and smaller metropolitan areas, though the larger metropolitan areas of Tokyo and Osaka continue to grow at a very low rate. Consumption will be increasingly concentrated in these urban areas if current population trends continue.
Because of Japan’s low birth rate and the increasing lifespan of its citizens, the average age of the population has been increasing. Mori et al. (2006) used an age/period/cohort analysis of urban household expenditure survey data to examine beef consumption per person. Mori et al. found that the cohort eating the largest amount of beef (at home) was born between 1946 and 1950, followed by the group born between 1951 and 1955. All the cohorts born after 1940 had at-home beef consumption above the national average, except the youngest (born between 1976 and 1980). The cohorts born between 1906 and 1940 had below-average consumption. In the coming decade, the number of people in the older (pre-1940) birth cohorts (with below-average beef consumption) will decrease, and Japan’s population will be increasingly dominated by the cohorts born after 1940. These post-1940 cohorts repre-sent a solid base for beef consumption. If younger cohorts (born in 1976 or after) eat as much beef as middle-aged cohorts do now, beef consumption per person could rise from current levels. Consumption could fall if younger cohorts continue to eat less beef than their parents.
The 1996 Escherichia coli (E. coli) outbreaks in Japan and BSE in Europe increased consumers’ awareness of safety issues for beef (Obara, 2000). Even as economic conditions improved at the turn of the century, the 2001 discovery of BSE in the domestic herd and the possibility of infected animals’ entering the food supply damaged beef’s reputation. Consumer confi dence was further eroded by labeling scandals, in which foreign beef was labeled as domestic product (Obara, 2002). These domestic issues had a more severe impact on consumption than did the foreign outbreaks of live-stock diseases.
After the discovery of BSE in the North American cattle herd in late 2003, Japan banned imports from the United States and Canada. With no other country able to produce as much grain-fed beef for the Japanese markets as the United States, availability of beef declined, and beef became signifi cantly more expensive. Even though Australia developed its grain-feeding capacity and the United States regained limited access to the Japanese market, consumption of imported beef is lower than it was in the mid-1990s. As a result, supplies of specifi c cuts remain tight and prices are still well above their 2003 levels (Obara, 2005).
The declining availability of beef resulted in consumers’ substituting other meats, such as pork and poultry. Pork is especially responsive to changes in beef prices. In 2004, when U.S. beef was no longer available, beef consump-tion per person fell by 9 percent, while pork consumption per person

13Japan’s Beef Market / LDP-M-194-01
Economic Research Service/USDA
increased by 7 percent (see fi g. 2). Conversely, in the early part of the 1990s, when beef consumption per person increased, pork consumption per person increased only modestly or decreased. Chicken consumption per person also increased 16 percent after 2004. This increase is partially infl ated, however, because of lower consumption in 2003 and 2004 due to avian infl uenza. Chicken consumption increased 5 percent from 2002 to 2007 (MAFF). Chicken has been less of a substitute than pork for beef. Pork and chicken prices remain well below beef, and price-conscious consumers continue to buy those meats at retail grocery stores in high volumes. These purchasing trends have been particularly evident in the large growth of pork imports into Japan (Obara, 2008).
Recent econometric work using Japanese data supports a positive relation-ship between beef consumption and income. Elasticity estimates, however, do not settle neatly in a narrow range.4 The lowest recent estimate for a cross-section of households in 1999 is 0.14 and applies only to beef consumed at home (Mori et al., 2006). The highest estimate (also for at-home consump-tion) comes from a single equation method and is about 1 (Mori et al., 2006). Recent estimates that account for pork and poultry consumption, as well as beef consumption, provide income elasticity estimates of 0.36 and 0.76 for all beef consumption away from and at home (see box, “Econometric Estimation of Elasticities”).5 The income elasticity of total beef consumption appears to be less than 1. A study that disaggregated beef into one imported and two domestic components found signifi cant differences in demand elasticities for the three segments. All had positive income elasticities, however (Mori and Lin, 1994).
Currently, consumer demand for beef is primarily driven by price. As beef prices remain relatively high, beef sales remain limited, while relatively cheaper pork sales have continued to grow. Estimates of own-price elasticities for beef range between -0.4 and -1.32. While econometric estimates indicate that the effects of prices of other animal proteins (pork, poultry, and some-times fi sh) on beef consumption are weak, there is evidence that the price of beef strongly impacts pork consumption.
Consumer attitudes and concerns have been important in shaping meat demand, including that for beef. Consumers are very aware of disease outbreaks and food scandals that can compromise the integrity of a supplier’s product. Because of the multiple domestic food safety issues and trade policy debates, Japanese consumers are also aware of the sources of their food. In addition, healthy eating is emphasized. Increasingly, consumers are encour-aged to avoid overeating and obesity, referred to as “metabolic syndrome.” Although the Japanese prefer the taste of marbled cuts of meat, they are also aware of the nutritional attributes of their diet. Consumers have altered their eating habits by moderating or eliminating foods that could potentially make them overweight.
4Elasticities are a common way of characterizing the effects of income and prices on the consumption of a good. A food demand elasticity is the percent-age change in consumption of a food given a percentage change in income or price.
5Thompson (2004) estimated 0.36. Obara, McConnell, and Dyck’s esti-mate of 0.76 (this report) shows weak statistical signifi cance.

14Japan’s Beef Market / LDP-M-194-01
Economic Research Service/USDA
Many studies have measured the elasticities of meat demand in Japan, but most dealt with the time between 1970 and 1990 (Dyck, 1988; Mues et al., 1991). A study by Thompson (2004) measured elasticities over the period 1981-2000. For this study, methods similar to Thompson’s were used on data for 1981-2007 (box table 1).1
Thompson’s estimates and the updated estimates used in this report indicate that beef consumption is the most income sensitive of the meats. The estimated beef income elasticity in this study (statistically, weakly signifi cant)2 is higher than Thompson’s result of 0.36.3
In this study, the own-price elasticity of demand suggests that beef consumption is quite sensitive to the price of beef, with an elasticity of -1.32 (box table 2). A rise in the price of beef also affects pork consumption, as shown by the cross-price elasticity of 0.51 (pork consumption rises 0.51 percent given a 1-percent rise in the beef price). In contrast, a rise in the price of pork (or poultry) has no signifi cant effect
on beef consumption. These results are similar to those observed by Thompson for the earlier period. Relative to Thompson’s results, pork and poultry appear less sensitive to changes in the price of beef. Beef demand in Japan is highly segmented, and the price used in the econometric estimation for this study was only for one cut of one type of beef (wagyu); therefore, the results should be used cautiously.4
Econometric Estimation of Elasticities
Box table 1Estimates of income elasticity of demand for beef
Income elasticity
1981-2007Obara, McConnell,
Dyck
1981-2000 Thompson
Beef 0.76 0.36
Poultry 0.02 0.05
Pork 0.38 0.06
1The estimates made for the current study look at relationships over a period that includes the shocks of BSE outbreaks in both Japan and North America. The estimation uses price and quantity data provided by MAFF and the Agriculture and Livestock Industries Corporation (ALIC) from 1981 to 2007 in an Almost Ideal Demand System (AIDS) with meat expenditure treated as an endogenous variable (Thompson, 2004). For further explanation regarding the data and model specifi cations, see “Appendix 1: Econometric Estimation of Income and Substitution Elasticities.”
2See Appendix 1. The regression estimate of the parameter relating national income to meat expenditures parameter is statistically different from zero with 88 percent confi dence—less than the generally accepted levels of 90 and 95 percent. Hence, we defi ne it as weakly signifi cant.
3Income elasticity measures the responsiveness of consumers’ purchases of specifi c goods to changes in income. Spending for an income-elastic good (elasticity greater than 1) is likely to change proportionately more than the change in income, while spending for an income-inelastic good (elasticity less than 1) is likely to change proportionately less than the change in income.
4Mori and Lin (1994) probed various segments of the beef market and found large differences in the characteristics of demand for wagyu, dairy, and imported beef.
Box table 2Estimates of price elasticity of demand for beef
1981-2007 (Obara, McConnell, Dyck)Price
Quantity Beef Poultry Pork
Beef -1.32 -0.04 -0.01
Poultry 0.29 -0.61 0.91
Pork 0.51 0.33 -0.33
1981-2000 (Thompson)Price
Quantity Beef Poultry Pork
Beef -1.28 0.04 0.28
Poultry 0.60 -0.73 0.01
Pork 0.75 -0.01 -0.91

15Japan’s Beef Market / LDP-M-194-01
Economic Research Service/USDA
Japanese farms produce a large share of the country’s beef supply. The beef herd numbers 2.89 million head, comparable with the number of cattle in Colorado (USDA/National Agricultural Statistics Service). Beef production relies on signifi cant Government subsidies and on consumers’ willingness to pay higher prices for domestic beef. Farmers have generally not received high net returns on cattle operations in recent years and revenues have fallen below costs. A fundamental reason for the relative lack of economic success in raising beef cattle has been Japan’s lack of pasture. The land base consists of forested mountains and intensively cropped lowlands. Imported grains and both domestic and imported roughage have replaced the grass that pastures normally provide to cattle. Virtually all of the grain that is fed must be imported across the Pacifi c, adding to the cost of the feed.
During a critical phase of cattle rearing—breeding and nurturing calves—reliance on feeds in the absence of pasture adds an expense that farmers in much of the rest of the world do not bear. In North America and Oceania—beef exporters to Japan—calves are typically bred and raised on pasture, which is less costly than feeding in confi nement. The high price of calves in Japan is a key constraint on the Japanese farmers’ ability to supply beef. Calf prices are high because breeding cows have little access to pasture. Cows are confi ned in and around sheds, and feeds are brought to them. After weaning, calves are usually raised in confi nement by farmers who specialize in raising calves, before being sold to feedlots. For Japan, all three aspects of raising beef stock involve feeding, rather than grazing.
Japan’s intensive use of feed ingredients, such as corn, includes a transport cost component that is much higher than that paid by U.S. grain-fed beef producers. The feeds include harvested forage, soilage,6 and concentrated grain-based feeds. About a fi fth of the roughage, and virtually all of the grains and meals, is imported. Total transportation costs to Japan (truck, barge, rail, or ocean shipping) are frequently as high as or higher than the cost of corn at the U.S. farmer’s delivery point. Additional costs are incurred as corn is trucked from the port in Japan to the feed mill and as compound feed7 is transported from feed mills to farms.
In recent years, the cost of production for fed cattle has ranged from $3,000 to $8,000 per steer, depending on breed (table 1), compared with the cost in the United States of $1,000 to $1,500 per steer. The largest cost to a Japanese feedlot is the feeder calf (fi g. 4 illustrates this for wagyu steers), with recent costs ranging from $900 to $4,400 per calf, depending on breed. Feed, mostly concentrates, is the second most important production cost, at about $2,000 per wagyu feeder calf. In a U.S. feedlot, feed costs are typically much lower.
To build a domestic beef industry in the face of scarce land resources for pasture, Japan’s farmers developed a differentiated cattle herd based on the wagyu-breed animals that were used originally as draught animals for agri-culture but, from the 1960s on, became solely meat animals (Longworth, 1983).8 When fed a diet of primarily grains over a relatively long period, beef from wagyu animals becomes tender and highly marbled with intramuscular fat. The meat looks and tastes different from grass-fed beef and from grain-
6Soilage is crops cut while green and brought to the cattle without being ensiled. For example, rice, including the grain head, is sometimes cut before grain has ripened and fed to cattle.
7Compound feed is a pre-mixed ration for animal feed. Feed mills take component ingredients, such as corn, soybean meal, or byproducts from other milling processes, and produce feed, taking into account certain nutritional requirements and preferences.
8“The four modern Japanese breeds are the result of a substantial infusion of European blood during the Meiji Era, together with a Government-sponsored selection program initiated in 1919” (Longworth).
Domestic Beef Supply

16Japan’s Beef Market / LDP-M-194-01
Economic Research Service/USDA
fed beef using other breeds and feeding regimes. In recent years, 60,000-70,000 cow-calf operations kept about 700,000 wagyu breeding cows.
Japanese consumers have been steady purchasers of relatively stable amounts of wagyu beef. To gain a wider market for larger amounts of domestic beef, however, Japan’s farmers need to provide beef at lower prices. The fi rst effort to do this was to use the male calves from the Holstein dairy herd,9 as well as heifers not kept for milking purposes.10 Holstein calves have relatively low value when sold as veal calves. Like wagyu calves, they are raised on special-ized farms that buy weaned calves and feed them until they are sold to feedlots. As feeder calves, Holstein steers cost feedlots $929 per steer in 2006, compared
9Holstein cows are used primarily for milking purposes in the United States and other countries. Their ge-netic characteristics are well suited for milk production, but often not ideal for intensive feeding for beef production.
10By using Holsteins for beef and developing a market for calves not needed for milk production, Japan’s beef industry signifi cantly added to the profi tability of dairy operations.
Table 1
Comparisons for feedlots in Japan and the United States, 2006
Calf, feedlot entrance Feed costs
Time in feedlot
Total expenses
Cattle, at shipment from feedlot Carcass
pricePrice Weight Age Price Weight
Yen/animal
(U.S.$1)
Kilograms(pounds)
MonthsYen/
animal(U.S.$1)
MonthsYen/
animal(U.S.$1)
Yen/animal
(U.S.$1)
Kilograms(pounds)
Yen/kg(U.S.$/lb)
Wagyu steer
507,593(4,365)
283.7(625)
9.4232,738(2,001)
19.8879,078(7,559)
934,191(8,033)
716(1,578)
2,190(19)
Holstein steer
108,012(929)
282.3(622)
7.7196,135(1,686)
14.2366,218(3,149)
381,826(3,283)
751.2(1,656)
969(8)
F-1 steer2 257,565(2,215)
266.8(588)
8.4240,535(2,068)
19.2586,135(5,040)
604,195(5,195)
750(1,653)
1,439(12)
U.S. steer $821.05317.1(697)
3 $292.28 5.6 4 $1,078.21568.8
(1,251)$3.23
1116.3 Yen/US$, 2006.2F-1 is a common designation for a cross or hybrid between two species or breeds.3There are no comparable surveys provided by Hoelscher or the USDA to indicate average ages of incoming or outgoing cattle in feedlots.4There are no comparable fi gures regarding total expenses in comparison to the Japanese published statistics. Differing fi xed and labor cost structures among feedlots add complexity when calculating a cost representative of the entire U.S. industry.
Sources: Japan’s Ministry of Agriculture, Forestry and Fisheries, Statistical Yearbook of the Ministry of Agriculture, Forestry and Fisheries, 2007-08; and Hoelscher, 2006.
Figure 4
Feedlot costs in Japan, fattening wagyu steers1,000 Yen/head
Source: USDA, Economic Research Service calculations based on data from Japan’s Ministry of Agriculture, Forestry and Fisheries, Statistical Yearbook of the Ministry of Agriculture, Forestry and Fisheries.
Feeder calf Feed Other
2003 2004 2005 2006 20070
200
400
600
800
1,000
1,200

17Japan’s Beef Market / LDP-M-194-01
Economic Research Service/USDA
with $4,365 per wagyu steer. Raising Holsteins compared with wagyu consid-erably reduces the cost of a fed steer. As a result, the sales price for fed steers is lower for Holstein animals because of the lower cost of calves and feed and because its value to consumers is lower. Wagyu fed steers sold for $8,033 in 2006, compared with $3,283 for a Holstein steer (see table 1).
Japan uses a fi ve-level quality grading system, where fi ve is the highest score. Meat yields (the usable meat on a carcass) range from A (the highest) to C (the lowest). Wagyu carcasses often are given a grade of A-4 or A-5. Carcasses from Holstein fed cattle, however, are usually B-2 or B-3. Thus, Holstein beef is regarded as lower in quality and is priced accordingly in the retail market. Also, yields are lower, reducing the value of the carcass.
In order to improve the value of beef from Holstein calves, Japan’s industry developed a cross breed, the F-1 type.11 Holstein milk cows are artifi cially inseminated with semen from wagyu bulls.12 As with wagyu and Holstein calves, the offspring are sold at weaning to specialized calf raisers. Because no F-1 calves are kept for breeding, the number of steers and heifers being raised for feeding are about equal. Calf prices at feedlot entry are between those for pure Holstein and wagyu calves: F-1 steer prices in 2006 aver-aged $2,215 (twice that for Holstein steers and just over half the price for wagyu steers). These reduced prices provide signifi cant savings for feedlots. Although F-1 beef most often grades above the Holstein level, grades of B-3 and B-2 still predominate. Despite this, F-1 beef commands a premium over Holstein beef from consumers, and fed F-1 cattle sell for 50 percent or more than Holstein cattle do (MAFF).13 The relative contribution of different herds to slaughter is shown in fi gure 5.
Another strategy pursued by the Japanese beef industry is embryo transfer. An embryo is transferred from a wagyu cow to a Holstein cow, producing a wagyu calf. The wagyu cow can then be re-inseminated. Splitting wagyu embryos and then implanting them in two Holstein cows or generating twins in one cow further exploits the wagyu genetic stock. Embryo transfer has proved to be expensive and not always successful. As a result, embryo transfer has not become widespread. In the absence of a technological break-
11F-1 is a common designation for a cross or hybrid between two species or breeds.
12Artifi cial insemination is almost universal in Japan’s cattle industry.
13In 2006, the price for Holsteins was $3,283 versus $5,195 for F-1.
1990 92 94 96 98 2000 02 04 06 080
200
400
600
800
1,000
1,200
1,400
1,600
Figure 5
Cattle slaughter in Japan1,000 head
F-1 = Offspring of Holstein cows inseminated with wagyu semen.
Source: Agriculture and Livestock Industries Corporation.
Wagyu female
Wagyu steers
Dairy female
Dairy steers
F-1 femaleF-1 steers
18Japan’s Beef Market / LDP-M-194-01
Economic Research Service/USDA
through like embryo transfer or embryo splitting and twinning, the number of calves that Japan can produce is limited. The Holstein milking herd is gradu-ally shrinking. Milk demand is static, and greater milk yields per cow mean that fewer cows are needed each year.
Intensive feeding remains central to the success of Japanese beef produc-tion. Wagyu cattle are usually fed longer and go to slaughter at a signifi cantly older age than grain-fed cattle in North America or Oceania. Offi cial esti-mates show that wagyu cattle average 19.8 months (for 2006) in a feedlot. In contrast, Holstein fed cattle spend 14.2 months in feedlots and are slaugh-tered at 21.9 months of age—only slightly older than fed cattle slaughtered in the United States. F-1 cattle are fed almost as long as wagyu: 19.2 months (fi g. 6). The 5 additional months of feeding for wagyu and F-1 cattle adds to production costs.
Because net returns to farmers increase if fewer or cheaper inputs can be used to produce output of the same value, increasing feed effi ciency is often a goal of livestock feeders. A feed conversion rate shows the quantity of feed used to produce a given amount of meat. In 1966, the quantity of feed concentrate fed to cattle in Japan was 1.65 times that of beef production in that year (other
Figure 6
Lifecycle of a steer in Japan
Sources: Japan’s Ministry of Agriculture, Forestry and Fisheries, Pocketbook Statistics on Livestock, 2007; Stillman et al, 2009; USDA, National Agricultural Statistics Service, Cattle on Feed and Livestock Slaughter Reports, 2007.
320 8 16 24Months
Wagyu steer
Dairy steer
Calf is castrated at 2months and weaned
at 3 months
Calf is sold forfattening at about 6-6.5
months
Steer is fattened for19-20 months on
grains
Calf is sold for fattening at about
9 months
Steer is fattened for about 14
months on grains
Steer isslaughtered
at 28-30months
625pounds
F-1 steer
Calf is sold forfattening at about
7-8 months
Steer is fattened forabout 19 months on
grains
Steer isslaughtered at
about 27months
1,571pounds
3-3.5 13.5-14
4-5 19-19.5
19-206-6.53-4
U.S. beef steer
Calf is weaned after 6-7 months
Steer isslaughtered atabout 17-21
months
6-7 5-66-8
598pounds
1,624pounds
Calf grazes onforage for 6-8
months
612pounds
600-800pounds
1,360pounds
Calf is fed amostly forageand grain mix
Calf is castrated at 2 months and weaned at 3
Calf is castrated at2 months andweaned at 3
3-4
3-4
1,654pounds
Steer isslaughtered atabout 20-21
months
Steer is fattened for about 5-6 months on grains

19Japan’s Beef Market / LDP-M-194-01
Economic Research Service/USDA
feeds, not concentrates purchased from feed mills, may have been fed in larger quantities than they are today). In 1986-88, just before the beef import quota began to be phased out, the ratio was 5.28.14 Some analysts expected the concentrated feed-use ratio to decline, as farmers tried to be more effi -cient in the face of rising competition from imported beef. The amount of concentrate fed (mostly imported) per unit of meat output has grown, however, reaching a record level in 2008 of 8.96.15
The use of compound feed for beef production increased by 27 percent from the average for 1990-92 compared with the average for 2005-07. The addi-tional feed did not signifi cantly increase the amount of meat produced, possibly because Japanese beef fatteners sought to increase the marbling and tenderness of their beef, differentiating it further from imported beef. Evidently, these beef producers felt the extra cost for increasing the feed-to-meat conversion ratio was offset by greater consumer demand for domestic beef.
Grain dominates the compound feed ration (fi g. 7). In recent years, corn has accounted for almost 40 percent of the ration and barley another 16 percent. All the grains, including sorghum, wheat, etc., constitute 61 percent of the compound feed ration. Oilseed meals accounted for 9 percent of the compound feed in 2007, about two-thirds of which was soymeal. Some parts of the feed ration are produced from Japanese-grown materials: rice bran and rice bran meal, wheat bran, beet pulp, and molasses. Others are prod-ucts of milling or refi ning imported basic materials: wheat bran, molasses, and oilseed meal. Most feed ingredients are imported: grains, oilseed meal, alfalfa, corn gluten feed, dairy powders, etc.16
In recent years, Japan’s beef industry has used over 4 million tons per year of compound feed, and feed use for beef has been growing since 2000 (fi g. 8). Most of the feed is imported from the United States, especially corn. The beef industry in Japan, using 1.8 million tons of U.S. corn, would rank as the eighth largest U.S. corn market, if it were compared with other
14This ratio is affected by both the number of animals fed and the duration of the feeding period. The shrink-ing wagyu herd and increase of dairy animals being fattened in feedlots would decrease the total number of feeding days, and lower the ratio. This effect has been at least partially offset, however, by the addition of the F-1 cross-bred animal to the herd.
15Data on compound feed produc-tion for beef came from Japan’s Statistical Yearbook of the Ministry of Agriculture, Forestry and Fisheries, various editions. Data on beef produc-tion came from USDA’s Production, Supply, and Disappearance database from 2008. The ratios are a rough estimate of compound feed conversion into meat in Japan’s beef industry. Feed for dairy cows that subsequently bear calves (whether the embryo is Holstein, F-1, or wagyu) is not included in this published series from the Japanese Government.
16Data on feed composition are provided by Fukuda (USDA, Foreign Agricultural Service/Tokyo) in the annual Grain and Feed Report from 2002 onward and are derived from the Monthly Feed Statistics of Japan’s Feed Supply Stabilization Organization.
Figure 7
Compound feed for beef cattle in Japan, 2007
1Other ingredients include rice bran, alfalfa, molasses, skim milk powder, whey, beet pulp, and several feed additives.
Sources: USDA, Economic Research Service and Foreign Agricultural Service calculations based on data from the Monthly Feed Statistics of Japan’s Feed Supply Stabilization Organization.
Corn
BarleyOther grains
Wheat bran
Corn byproducts
Soymeal
Other oilseed meals–2%
Other ingredients1
40%
10%
6%
6%
15%
5% 16%

20Japan’s Beef Market / LDP-M-194-01
Economic Research Service/USDA
country destinations for U.S. corn exports. Corn is also a growing market; by 2007, beef fatteners had increased their annual use of U.S. corn by over 300,000 metric tons compared with 1993. Japan’s beef industry is the leading user of feed barley and purchases most of the United States’ barley exports.17 In 2008, the value of feedstuffs exported from the United States to supply Japan’s beef production was nearly $750 million.18
Given the high cost of calves and feed, Japan’s domestic beef supply cannot compete with imported beef on price. Two pillars support current supply levels:
• The willingness of Japanese consumers to pay a high price for domestic beef, which can be attributed to a preference for the differentiated, highly marbled beef or a preference for domestic beef over imports, regardless of quality.
• The support for the beef industry by the Government.
17For example, in 2008, Japan reported imports of 413,662 metric tons of U.S. barley for feed use, which repre-sented 70 percent of U.S. barley exports.
18The value of Japan’s imports from the United States, including insurance and freight, is calculated by: (1) obtain-ing Japan’s complete data on compound feeds used for raising cattle for beef, published in Monthy Feed Statistics; (2) determining the share of imports in Japan’s supply for each of those feeds; (3) determining the U.S. share of Japan’s imports of each feed and the import unit value of imports of each feed from the United States; and (4) multiplying the U.S. share of imports of each feed for beef by the import unit value and summing.
Figure 8
Compound feed production in Japan1,000 metric tons
1Other uses are for pork, broiler meat, milk, egg, and aquaculture production.
Source: Japan’s Ministry of Agriculture, Forestry and Fisheries, Statistical Yearbook of the Ministry of Agriculture, Forestry and Fisheries.
1990 92 94 96 98 2000 02 04 06 080
5
10
15
20
25For other uses1 For beef

21Japan’s Beef Market / LDP-M-194-01
Economic Research Service/USDA
Japan’s Government explicitly targets greater self-suffi ciency in agricultural production. Policymakers interpret this to mean that the beef sector, which currently contributes about 6 percent of the value of total agricultural output, should receive Government support and encouragement through domestic programs and a 38.5-percent import duty (MAFF, 2008). Japan is burdened by high Government debt. Government debt, as a percentage of GDP, has been rising since 1992, and exceeded 100 percent in 2009 (International Monetary Fund, 2010). Intense efforts to contain Government spending and reduce the debt burden confl ict with a desire to increase support to agricul-ture, including the beef sector.
Japan’s beef sector in 2008 was valued at farmgate at 455 billion yen ($4.4 billion) (Organisation for Economic Cooperation and Development, 2009). Government programs help support the value of beef through direct payments, grants, and loan/insurance subsidies that are fi nanced by taxes and the proceeds of the beef tariff. A full accounting of such support is not available, but a partial sum based on 2008 budgets exceeds 62 billion yen ($600 million). In addition to receiving support from budgetary expenditures, Japanese beef production also receives support from the 38.5-percent import tariff on chilled and frozen beef, which acts as a fl oor under domestic prices. Japan’s Government estimated the value of this market price support at 72 billion yen in 2005 ($662 million) (World Trade Organization, 2009). The Organisation for Economic Cooperation and Development estimated policy-induced transfers to beef producers at 132 billion yen in 2008 ($1.28 billion), based overwhelmingly on market price support from the tariff.19 Market price support is basically a transfer from consumers to beef producers, when consumers pay higher prices for beef as a result of Government actions that affect prices (i.e., the import tariff). In addition to Government support, the animal feed industry operates a feed price stabilization program (see box, “High Feed Prices in 2008 Shock Japan’s Beef Sector”).
Major measures taken by the Japanese Government with the 2008 budgetary outlay included the following:20
• A defi ciency payment for feeder calf operations and other support for raising feeder calves—$236 million;
• A stabilization measure (called MARUKIN) for beef-cattle-fattening operations that provides a safety net when costs exceed incomes—$202 million;
• Payment of more than half the cost of insurance against cattle health risks—$94 million;
• Payment that covers farm and industry BSE-related costs—$98 million;
• Intervention by the government-owned ALIC to stabilize meat prices;
19This translates to a producer single-commodity transfer equal to 28.75 percent of the value of beef to produc-ers. Both the total support in yen and the percentage of value have remained relatively stable since 1997.
20Information about expenditures is incomplete, and amounts cited are often budget allocations, rather than actual expenditures. USDA Foreign Agricultural Service data were col-lected from several sources.
Government Policy Affecting the Beef Sector

22Japan’s Beef Market / LDP-M-194-01
Economic Research Service/USDA
• Loans to farms and loans to prop up the industry feed price stabilization fund—$996 million in subsidized loans; and
• Payment assistance for cattle production and marketing—$130 million.
Support for Calf-Raising Farms: $236 Million Budgeted for JFY200821
A portion of the revenue earned from tariffs on beef imports is channeled to Japan’s domestic beef subsidy program—the Defi ciency Payment Scheme for Feeder Calves. In JFY2008, 17.6 billion yen ($170 million) was earmarked for defi ciency payments. This program is designed to protect domestic feeder calf producers and to secure feeder calf supplies for beef cattle fattening opera-tions. The ALIC,22 a company owned by MAFF, implements the program and disburses the Government subsidy payments to the feeder calf growers.
21JFY means Japan Fiscal Year, which begins April 1 and ends March 31. Thus, JFY2008 is April 1, 2008-March 31, 2009.
22Formerly called the Livestock Industry Promotion Corporation (LIPC).
To protect farmers against price surges, Japan’s feed industry has long operated the Feed Price Stabilization Program. Under this program, farmers pay 500 yen per metric ton of concentrated feed into a fund operated by feed millers. Farmers’ payments are not subject to Government taxes, such as the income tax. The fund can then be used to reduce feed prices if prices surge. To supplement the farmer-paid fund, an ‘umbrella’ fund exists with payments supplied 50 percent by the Government and 50 percent by the feed companies. Companies receive payments from the umbrella fund with a 6-month lag (Zennoh, 2008).
Prices of concentrated feeds in Japan soared in 2008, peaking in November 2008 at 73,550 yen per metric ton ($735/metric ton), 50 percent higher than in 2005 and 2006 (MAFF, 2009). This unprecedented increase was caused by higher global grain and oilseed prices, which affected livestock producers worldwide, and the sharp increase in transportation costs due to oil prices. Higher oil prices particularly hurt Japanese livestock producers, who rely upon imported feedstuffs.
Simultaneously, raising the retail price of beef proved impossible. With the economic downturn in 2008, consumers became more cautious about spending, especially for luxury products, such as domestic beef. Japan’s producers were squeezed between rising costs and fl at or lower output prices.
The Feed Price Stabilization Program had accumulated funds over many years of stable or low world prices for feed ingredients, but the funds were completely used up by April 2008, as agricultural prices surged. Subsidies from the program reduced compound feed prices (for all animal feeds, not only beef feed) by as much as 10,500 yen per metric ton in 2008 (about $97 per metric ton, or 14 percent of the peak price). The Government provided a 35-billion-yen ($338 million) loan to the industry to maintain the fund through JFY2008 (beginning April 1) (Fukuda, 2008).1 Repaying this loan and rebuilding of the program’s funds are expected to be diffi cult.
High Feed Prices in 2008 Shock Japan’s Beef Sector
1The Government provided the loan at zero interest, and it must be repaid within 3 years.
23Japan’s Beef Market / LDP-M-194-01
Economic Research Service/USDA
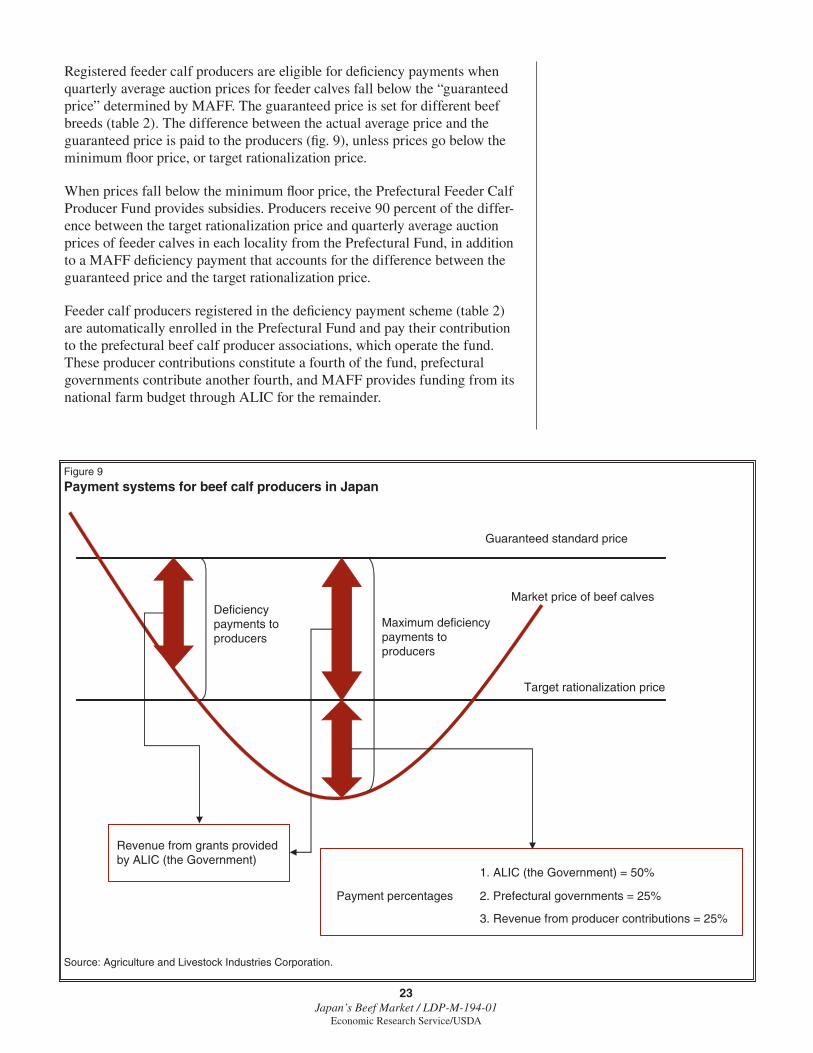
Registered feeder calf producers are eligible for defi ciency payments when quarterly average auction prices for feeder calves fall below the “guaranteed price” determined by MAFF. The guaranteed price is set for different beef breeds (table 2). The difference between the actual average price and the guaranteed price is paid to the producers (fi g. 9), unless prices go below the minimum fl oor price, or target rationalization price.
When prices fall below the minimum fl oor price, the Prefectural Feeder Calf Producer Fund provides subsidies. Producers receive 90 percent of the differ-ence between the target rationalization price and quarterly average auction prices of feeder calves in each locality from the Prefectural Fund, in addition to a MAFF defi ciency payment that accounts for the difference between the guaranteed price and the target rationalization price.
Feeder calf producers registered in the defi ciency payment scheme (table 2) are automatically enrolled in the Prefectural Fund and pay their contribution to the prefectural beef calf producer associations, which operate the fund. These producer contributions constitute a fourth of the fund, prefectural governments contribute another fourth, and MAFF provides funding from its national farm budget through ALIC for the remainder.
Figure 9
Payment systems for beef calf producers in Japan
Source: Agriculture and Livestock Industries Corporation.
Revenue from grants provided by ALIC (the Government)
1. ALIC (the Government) = 50%
Payment percentages 2. Prefectural governments = 25%
3. Revenue from producer contributions = 25%
Deficiencypayments toproducers
Maximum deficiencypayments toproducers
Guaranteed standard price
Market price of beef calves
Target rationalization price

24Japan’s Beef Market / LDP-M-194-01
Economic Research Service/USDA
During 2000-06, prices paid by feedlots for male dairy calves were below the guaranteed standard price every year and below the target rationaliza-tion price in 2003 and 2004 (see table 2). In 2004, a farmer selling a calf at the market price of 68,648 yen would have received 49,000 yen (guaranteed price of 129,000 yen less the target rationalization price of 80,000 yen) from the Defi ciency Payment Scheme and 10,217 yen (target rationalization price of 80,000 yen less the market price of 68,648 yen, times 0.9) from the Prefec-tural Feeder Calf Producer Plan. The 59,217 yen in subsidies would have represented 46 percent of what the farmer received. Clearly, in some years, the Government calf subsidies are critical to maintain the supply of dairy steers for fattening.23
The guaranteed standard price for F-1 calves sold to a feedlot is 175,000 yen. During 2003-07, actual market price averages always exceeded the guaran-teed price, and no subsidies were awarded. In 2008, however, 4.33 billion yen ($42 million) in subsidies went to F-1 calf raisers, as prices for some F-1 feeder calves fell below the guaranteed standard price (ALIC). Defi ciency payments for wagyu calves are uncommon.
In addition to defi ciency payments, MAFF administers a subsidy program for cow-calf operators who are willing to increase or maintain the number of breeding cows in their herd during a time of declining calf prices. Payments are made quarterly when the average price per beef calf falls below the trigger levels set per beef breed (i.e., wagyu breeds, such as black wagyu, brown wagyu, etc.) In JFY2008, 6.84 billion yen ($66 million) were allocated to this project.
Support for Beef Farm Operations: $202 Million in JFY2008
In addition to the subsidy for feeder calves, the beef cattle fattening opera-tion stabilization measure (MARUKIN) provides signifi cant support to fattening farms. The Japan Livestock Industry Association administers the program. Farmers must qualify for participation; the Government is trying to limit participation to farmers who specialize in fattening larger numbers of
23The calf defi ciency payment also ensures that there is a market for dairy steers and heifers not put into milk production that can still provide value for the producer, boosting dairy farm income.
Table 2
Prices for the defi ciency payment scheme for feeder calves in Japan
Item 2000 2001 2002 2003 2004 2005 2006 2007 2008
Yen per head
Guaranteed price:
Black wagyu 304,000 304,000 304,000 304,000 304,000 304,000 304,000 304,000 305,000
Dairy breeds (for beef) 131,000 131,000 131,000 131,000 129,000 110,000 110,000 110,000 113,000
Cross breeds 175,000 175,000 175,000 175,000 175,000 175,000 175,000 NA 178,000
Target rationalization price:
Dairy breeds (for beef) 80,000 80,000 80,000 80,000 80,000 80,000 80,000 80,000 80,000
Market price:Holstein feeder calf 110,710 84,522 100,621 71,674 68,648 81,334 108,012 127,313 NA
NA = Not available.
Sources: Guaranteed and target rationalization prices are based on USDA, Foreign Agricultural Service GAIN reports JA1002 and JA7058. The Holstein feeder calf price is based on Japan’s Ministry of Agriculture, Forestry and Fisheries Statistical Yearbook of the Ministry of Agriculture, Forestry and Fisheries, various issues.
25Japan’s Beef Market / LDP-M-194-01
Economic Research Service/USDA
cattle. If labor costs exceed net income from the operation, or if the total cost exceeds gross income, the MARUKIN program covers part of the loss. In 2008, the program provided 20.88 billion yen to farmers ($202 million).
The MARUKIN subsidy is calculated in two ways:
1. If the estimated family labor cost is more than estimated net income, 80 percent of the difference is provided from a fund that is contrib-uted by the Government (75 percent) and farmers (25 percent); or
2. If the operational cost (excluding family labor cost) exceeds gross income, 60 percent of the difference is provided from Government funds.
Hazard Insurance: Over $94 million in JFY2007
Japan’s Government pays half the premiums and much of the administrative costs for the insurance program for beef cattle, as well as supplying reinsur-ance. Insurance is provided to cover death of farm stock, disease, and inju-ries. In 2007, the Government payment for premiums was 11 billion yen ($94 million) (National Agriculture Insurance Association, 2009).
BSE-Related Measures: $98 million in JFY2008
The Ministry of Health, Labor, and Welfare (MHLW) paid the costs for BSE testing on all slaughtered cattle through JFY2008, amounting to about 2 billion yen per year (about $19 million). Beginning in JFY2009, the MHLW paid for testing only on animals 20 months and older. Prefectural govern-ments have voluntarily paid the costs for testing animals 20 months or younger. Because most of the slaughtered animals are older than 20 months, the amount subsidized is likely to remain near 2 billion yen annually.
In reaction to BSE outbreaks, feed use of meat and bone meal was banned. MAFF spent 8.09 billion yen ($78 million) in JFY2008 to subsidize disposal or alternative uses for the byproducts used in the meal. MAFF also spent 90 million yen (about $900,000) in 2008 on fi nancial support for farms with reported cases of BSE in their cattle.
Beef Price Stabilization
MAFF determines a price band for domestic beef and charges the ALIC with taking market actions when prices fall below or rise above this band (fi g. 10).24 When prices are below the lower bound, ALIC can purchase beef and put it into stocks or ask the industry to stockpile beef with storage costs borne by ALIC. This process reduces market supply and helps raise prices above the lower bound. When prices are above the upper bound, ALIC can release stocks or purchase beef in foreign markets. Such actions raise market supply, which puts downward pressure on prices. In several recent years, however, market prices have remained well above the upper bound. ALIC was evidently unable or unwilling to bring these prices down by releasing additional stocks.
24This is authorized by the Law Concerning the Stabilization of Livestock Prices.

26Japan’s Beef Market / LDP-M-194-01
Economic Research Service/USDA
Other Subsidies ($130 Million in JFY2008) and Subsidized Loan Programs
Japan’s livestock farmers (both cattle and hog farmers) can tap substantial subsidies for a variety of purposes to contribute to greater effi ciency, to satisfy changing environmental regulations, or to retire old debt (table 3). Some measures are multi-year initiatives, while others are for 1 year on an emergency basis. Some measures are designed to assist dairy and hog farms, as well as beef operations.
Figure 10
Stabilization program for beef, B-2 and B-3 steer carcasses in JapanYen/kilogram
Sources: USDA, Economic Research Service calculations based on Livestock Division of MAFF and Japan Meat Conference joint publication, The Meat Statistics in Japan, and ALIC Monthly Statistics.
1995 97 99 2001 03 05 07 090
200
400
600
800
1,000
1,200
1,400
Lower price
Upper price
Tokyo price
Table 3
Selected subsidy and loan programs for beef production in Japan
Project JFY2008 budget
Billion yen
Million U.S. $
Emergency measures to improve beef cattle farm productivity1 1.19 12
Comprehensive measures to rationalize meat distribution 2.42 23
Measures to improve demand structure for domestic meat1, 2 1.3 13
Measures to stabilize demand and supply of livestock byproducts
1.54 15
Individual cattle identifi cation system 0.5 5
Emergency measures to stabilize livestock animal distribution3 0.6 6
Comprehensive measures to use new livestock technologies effectively
0.15 1.45
Create mutual-aid fund for animal disease prevention and control
1.88 18
Maintenance fund to compensate management diffi culties caused by livestock disease
0.21 2
Promote effective utilization of livestock animal waste 3 29
Leasing to improve livestock management productivity (loan program)
684 658
Special loan fi nance for large-size animal farms (cattle) 404 387
Note: Exchange rate of 103.4 yen/U.S.$ used.1Also applies to pork. 2Also applies to poultry meat. 3Shared with dairy and hog farms. 4Maximum amount of lending.
Source: Japan’s Ministry of Agriculture, Forestry and Fisheries, various web pages.
27Japan’s Beef Market / LDP-M-194-01
Economic Research Service/USDA
Role in Japan’s Market
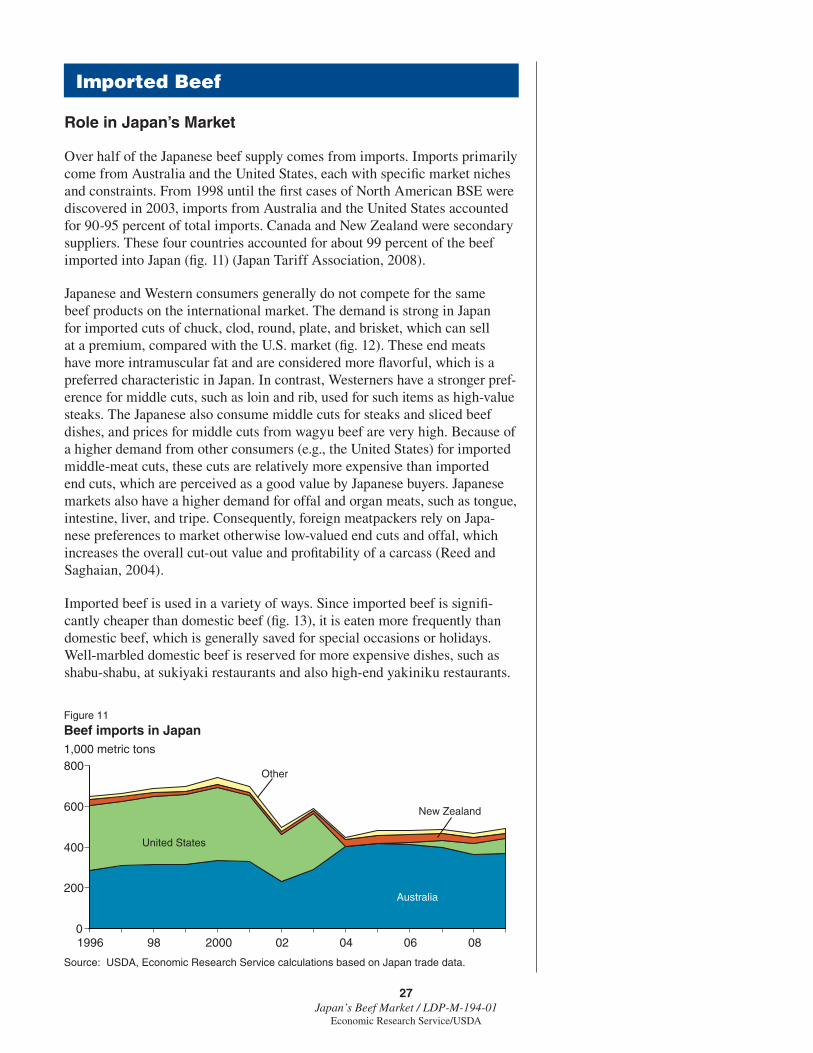
Over half of the Japanese beef supply comes from imports. Imports primarily come from Australia and the United States, each with specifi c market niches and constraints. From 1998 until the fi rst cases of North American BSE were discovered in 2003, imports from Australia and the United States accounted for 90-95 percent of total imports. Canada and New Zealand were secondary suppliers. These four countries accounted for about 99 percent of the beef imported into Japan (fi g. 11) (Japan Tariff Association, 2008).
Japanese and Western consumers generally do not compete for the same beef products on the international market. The demand is strong in Japan for imported cuts of chuck, clod, round, plate, and brisket, which can sell at a premium, compared with the U.S. market (fi g. 12). These end meats have more intramuscular fat and are considered more fl avorful, which is a preferred characteristic in Japan. In contrast, Westerners have a stronger pref-erence for middle cuts, such as loin and rib, used for such items as high-value steaks. The Japanese also consume middle cuts for steaks and sliced beef dishes, and prices for middle cuts from wagyu beef are very high. Because of a higher demand from other consumers (e.g., the United States) for imported middle-meat cuts, these cuts are relatively more expensive than imported end cuts, which are perceived as a good value by Japanese buyers. Japanese markets also have a higher demand for offal and organ meats, such as tongue, intestine, liver, and tripe. Consequently, foreign meatpackers rely on Japa-nese preferences to market otherwise low-valued end cuts and offal, which increases the overall cut-out value and profi tability of a carcass (Reed and Saghaian, 2004).
Imported beef is used in a variety of ways. Since imported beef is signifi -cantly cheaper than domestic beef (fi g. 13), it is eaten more frequently than domestic beef, which is generally saved for special occasions or holidays. Well-marbled domestic beef is reserved for more expensive dishes, such as shabu-shabu, at sukiyaki restaurants and also high-end yakiniku restaurants.
Imported Beef
Figure 11
Beef imports in Japan1,000 metric tons
Source: USDA, Economic Research Service calculations based on Japan trade data.
1996 98 2000 02 04 06 080
200
400
600
800
Australia
United States
New Zealand
Other

28Japan’s Beef Market / LDP-M-194-01
Economic Research Service/USDA
Figure 12
Cuts marketed for the Japanese market
16 167A Knuckle, peeled
10 185B Bottom Sirloin Butt Ball-Tip
11 185D Bottom Sirloin Butt Tri-Tip
9 185A Bottom Sirloin Butt Flap Meat
8 193 Flank Steak
7 121D Inside Skirt
Short Plate (Karubi Plate)
Bone-in Short RibBone-less Short RibRib Finger Meat
Chuck Rib
1 Brisket 2-piece(120A Brisket Flat Cut / 120B Brisket Point Cut)
2 Pectoral Meat
3 114 Shoulder Clod
17 171B Outside Round (Flat)
14 169A Top (Inside) Round Cap-Off
15 169B Top (Inside) Cap
12 184B Top Sirloin
13 184D Top Sirloin Cap (Culotte)
6 109B Rib Blade Meat (Liffer Meat)
Strip Loin (Steak Ready)
112A Rib Eye Roll Lip-on
189A Tender Loin
5 116B Chuck Tender
4 1014D Top Blade (Flat Iron)
116D Chuck Eye Roll
Chuck Flap Tail
Copyright: U.S. Meat Export Federation. Used with permission.
Figure 13
Retail beef prices in Japan: Imports and domesticYen per 100 grams
Source: Agriculture and Livestock Industries Corporation.
Australian sirloin Domestic dairy and F-1 sirloinDomestic wagyu sirloinU.S. sirloin
1996 98 2000 02 04 06 080
200
400
600
800
1,000
1,200
1,400

29Japan’s Beef Market / LDP-M-194-01
Economic Research Service/USDA
Imported beef is more commonly eaten day-to-day, such as in hamburgers or at popular beef bowl restaurant chains. Imported beef is also available at retail grocery stores for meals at home.
Prior to 2003, most imported beef from Australia and New Zealand was grass-fed. Oceania primarily produced grass-fed beef due to relatively higher grain costs and lower land costs. Australia did export grain-fed beef, which was available at prices competitive with prices for U.S. grain-fed beef. Australian grain-fed cattle were usually on feed for shorter periods than were U.S. grain-fed cattle, which affected the marbling of the beef. Grain-fed beef is more heavily marbled than grass-fed beef, and grain-fed animals produce a white fat generally considered tastier than the yellow fat produced by grass-fed animals. Australia’s increased investment in the beef cattle industry and its expanded feedlot capacity has provided more Australian exports of grain-fed beef, although Australia’s cattle are still typically not fed for as long as North American cattle are. The United States and Canada export mainly grain-fed beef from cattle that have been fed over 100 days, primarily due to differences in production systems between the United States and Australia. Because of the relatively high availability of feedgrains, North American production is better suited for fi nishing cattle with high rations of corn, soybean meal, or other grains.
Geographic factors also infl uence the type of meat products that the United States and Australia export to Japan. Relatively closer to Asian markets, Australia has an advantage in distance over North America in providing chilled meat cuts (fi g. 14). Prior to 2003, about 60 percent of Australian imported muscle cuts were chilled. Conversely, the United States sent mostly frozen product to Japan, with slightly less than 60 percent of American muscle cuts being frozen (fi g. 15).
Japanese imports of beef increased steadily until 2000. In 2001 and 2002, the discovery of BSE in the Japanese herd and food safety scandals within Japan hurt overall demand for beef, which caused imports to decline 33 percent from their apex. Beef imports increased again in 2003 before Japan banned U.S. and Canadian imports once BSE had been identifi ed in North America. Imports in 2004 were nearly 40 percent below 2000 levels.
1996 98 2000 02 04 06 080
50
100
150
200
250
300
350
400
Figure 14
Chilled beef imports to Japan mostly come from Australia1,000 metric tons
Source: USDA, Economic Research Service calculations based on Japan trade data.
Other
Canada
United States
Australia

30Japan’s Beef Market / LDP-M-194-01
Economic Research Service/USDA
The ban on U.S. beef in the Japanese market drastically changed the compo-sition of the import market. Prior to the 2003 discovery of BSE, the United States was the second largest foreign supplier of beef behind Australia. Australian and New Zealand producers attempted to fi ll some of the market void created by the loss of U.S. product. Investment in feedlots and North American-style feeding regimens in both countries tried to capture the grain-fed market segment in Japan.
Total imports, however, never fully recovered and imported beef prices remained above pre-ban levels. Higher feed prices, limited feedlot capacity, and drought hindered the expansion of grain-fed production in Australia. Australian beef was more expensive because of increased demand and often was marketed as full-sets (multiple cuts bundled together in a single order) instead of individual cuts. Thus, Japanese buyers were forced to purchase cuts that were in lower demand, in addition to the cuts that provided better value, which hurt profi tability. Trade data show that the sharpest reduction in imports was in the brisket and plate category, where U.S. end meats had dominated (fi g. 16). Ultimately, many Japanese consumers reduced their beef consumption, substituting other protein sources, particularly pork, for beef.
Figure 15
Frozen beef imports in Japan1,000 metric tons
Source: USDA, Economic Research Service calculations based on Japan trade data.
Mexico OtherCanadaUnited States New ZealandAustralia
1996 98 2000 02 04 06 080
50
100
150
200
250
300
350
400
Figure 16
Frozen beef imports by Japan, by cut1,000 metric tons
Source: USDA, Economic Research Service calculations based on Japan trade data.
1994 96 98 2000 02 04 06 080
50
100
150
200
Other
Brisket and plate
Chuck, clod, and round
Loin

31Japan’s Beef Market / LDP-M-194-01
Economic Research Service/USDA
Offal Imports
Japan imports tongues, livers, and other meat that is not considered part of a dressed carcass, such as diaphragm, cheek, or face meat. Before 2004, the United States provided over 75 percent of Japan’s sizable imports of bovine offal (fi g. 17). During 1994-2000, offal import values ranged from $415 million-$816 million, reaching their peak in 2000. Imports fell precipitously in 2004, after U.S. supply was cut off following the fi rst case of BSE in the United States in 2003. In 2008, the volume imported (35,000 metric tons) was a third of the typical volume imported in 1994-2000 and only 36 percent of the volume imported in 2003, the last year in which U.S. offal was freely imported. As with imported muscle cuts, imported offal from Australia and New Zealand increased after 2004. The volume, however, was not suffi cient to fi ll the void created by the loss of U.S. offal products.
Over the past 5 years, most offal imports have been frozen tongues. From 1995 to 1998, such cuts as cheek and diaphragm meat were the most common offal imports. Diaphragm meat, in particular, was a popular imported cut because of lower tariffs and the ability to substitute it for muscle cuts from a dressed carcass, which carried a higher tariff. Chilled offal cuts have been increasing as a percentage of total offal imports. Although Australia has a geographical advantage in supplying chilled offal, the United States was the primary supplier prior to 2004, and once again became the top supplier in 2008. The United States has yet to recapture its spot as the top supplier of frozen offal.
Reintroduction of U.S. Beef Into the Japanese Market
Since U.S. beef was reintroduced into the Japanese market in 2005, total beef imports have increased slightly. U.S. beef has primarily recaptured market share at the expense of Australian beef. The Export Verifi cation (EV) program calls for all U.S. beef to be from cattle younger than 21 months. All products, including offal, must come from plants operating under the EV program, which ensures that all U.S. products exported to Japan are in compliance with the agreement (Clemens, 2007).25
25The United States International Trade Commission, 2008, also provides further discussion on import restrictions and estimates on loss of trade due to BSE-related measures. Details on the export verifi cation program for Japan, administered by USDA’s Agricultural Marketing Service can be found at http://www.ams.usda.gov/AMSv1.0/getfi le?dDocName=STELDEV3103526.
Figure 17
Bovine offal imports by Japan1,000 metric tons
Source: USDA, Economic Research Service calculations based on Japan trade data.
United States Rest of world
1995 97 99 2001 03 05 07 090
25
50
75
100
125
150

32Japan’s Beef Market / LDP-M-194-01
Economic Research Service/USDA
Japan’s Beef Import Policies
Japan administers two sets of Government policies that directly affect beef imports.
1. The import tariff, or tax, system; and
2. Sanitary rules.
Japan’s basic import tariff on fresh, chilled, and frozen meat of cattle is 38.5 percent of the value of an import shipment, which applies to all countries, even those holding preferential trading pacts with Japan, and has been in force since 2000 (fi g. 18). Two World Trade Organization (WTO) safeguard mechanisms apply to beef import tariffs in the case of rapid rises in import volumes.
• The Uruguay Round Agreement on Safeguards,26 which Japan has not used for beef.
• A 1995 bilateral agreement between the United States and Japan, which became part of the overall Uruguay Round Agreement, and applies equally to all WTO members exporting beef to Japan.
The bilateral agreement allows Japan to raise the tariff on chilled or frozen beef if imports from the beginning of Japan’s fi scal year up to the end of the relevant quarter exceed 117 percent of the quantity of imports during the corresponding period of the preceding year. The increase is then in place until the end of the fi scal year, when it expires. If the situation as described occurs at the end of the fourth quarter of a JFY, Japan can apply a higher tariff during the fi rst quarter of the following JFY. Beef offal is not affected by the safeguard, and the most important offal categories face a 12.8-percent tariff (see “Appendix 2, Japan’s Beef Tariffs”).
The safeguard gives Japan the option to not raise the tariff, to raise it to a level between 38.5 and 50 percent, or to raise the tariff to 50 percent.
26The Agreement on Safeguards is available at the WTO website: http://www.wto.org/english/docs_e/legal_e/25-safeg.pdf.
Figure 18
Japan's tariffs for chilled and frozen beefPercent
Notes: A 1988 agreement allowed Japan to raise its tariff after the import quota on beef was phased out, and then required it to be reduced in steps to 50 percent. In the Uruguay Round, Japan agreed to lower the tariff to 38.5 percent.
Source: USDA, Economic Research Service.
1990 92 94 96 98 2000 02 04 06 080
10
20
30
40
50
60
70
80

33Japan’s Beef Market / LDP-M-194-01
Economic Research Service/USDA
Bound tariffs allow a country to raise its tariff (from whatever level is currently applied) at any time, without foreign consultation. In the case of chilled and frozen beef in Japan, however, the tariff is actually bound at 38.5 percent; only a 17-percent or greater surge in import volume (as described earlier) allows it to apply the 50-percent rate listed as “bound” in international documents.
Raising the tariff to 50 percent when import quantities surge increases the landed cost of a shipment of beef by about 8.3 percent (150/138.5 -1 = .083). This cost increase can represent a serious impediment to trade. The safe-guard mechanism also introduces uncertainty into trade. Contracts made when no safeguard is in place can become unprofi table when a safeguard is imposed, but it can be too late to stop the fl ow of beef and companies suffer losses. Japan fi rst used the beef safeguard in JFY1996, when it imposed the 50-percent tariff for frozen beef from August 1, 1996, to March 31, 1997 (Obara, 1996). In 2003, Japan applied this safeguard to fresh and chilled beef imports, raising the tariff from 38.5 to 50.0 percent from August 1, 2003, through March 31, 2004 (USDA/ERS, 2009; Obara, 2005).27
Tariff increases became more likely after 2004, since the ban on North American beef, imposed because of BSE, resulted in drastic reductions in trade volumes after December 2003. Any major resumption of beef trade in later years would be compared with an artifi cially low import volume in 2004 and after.28 Recognizing this, Japan’s Government devised a tempo-rary method of choosing a historical import volume with which to compare current import levels. The trigger for a safeguard was set at: 1) 117 percent of the import volume in the corresponding period 1 year earlier; or 2) 117 percent of the average import volume in the corresponding periods in JFY2002 and 2003 (refl ecting a period when North American beef imports were quite large) (Obara, 2006).29 This temporary method, begun in JFY2006, has been extended annually, preventing imposition of the safeguard through JFY2010.
Sanitary rules that have affected beef trade with Japan primarily relate to foot-and-mouth disease (FMD) and bovine spongiform encephalopathy (BSE). Japan refuses to accept uncooked beef from any area not recognized as “free from FMD” or in which cattle have been vaccinated against FMD. For decades, this practice has limited Japan’s imports of chilled and frozen beef to supplies from the United States, Canada, Australia, and New Zealand. Minor amounts of chilled and frozen beef have come from a few other suppliers (imports from FMD-free zones in Mexico are the most noteworthy). Imports from South America, a major beef-exporting region, however, have been blocked due to numerous outbreaks of FMD. Japan accepts cooked (thermally treated) beef products from countries known to have FMD.
Japan does not accept beef products, even cooked products, from countries that have uncontrolled risk of BSE outbreaks. In December 2003, Japan ended all imports from the United States because of BSE. Trade was partially resumed 2 years later.
In 2005, Japan reopened beef imports from the United States only for beef from animals 20 months of age or younger at slaughter. Parts designated as Specifi ed Risk Materials (SRMs), such as the brain and spinal column,
27In JFY1996, the tariff on frozen beef imports was 46.2 percent. The tariff was reduced in increments until it reached 38.5 percent on April 1, 2000. Thus, the impact of raising the tariff to 50 percent was greater in 2003 than it was in 1996. See http://www.ers.usda.gov/Briefi ng/Japan/issuesandanalysis.htm#safeguard for more information.
28The JFY2005 fi rst-quarter beef safeguard (April–June) was avoided because meat importers voluntarily delayed customs clearance of ship-ments that arrived in June until July. As a result, April–June quarterly imports of chilled beef and frozen beef did not exceed the trigger level.
29As in the pre-2006 safeguard regime, trade volumes are assessed quarterly, and the cumulative imports through each quarter are compared with comparable periods in the reference year. Thus, imports are compared for April-June (after the fi rst quarter), April-September (after the second quarter), and so forth.

34Japan’s Beef Market / LDP-M-194-01
Economic Research Service/USDA
are excluded from import into Japan. Japan has a similar export verifi ca-tion arrangement with Canada (Canadian Food Inspection Agency, 2008). In practice, the age restriction has been a limiting factor for beef trade with Japan. Age verifi cation entails added costs, and the conservative rules about verifying age from carcass condition likely exclude some animals that are actually 20 months of age or younger. The United States has urged Japan to apply the guidelines recommended by the World Organisation for Animal Health (OIE), which allow trade in beef from carcasses of any age.
Transportation Costs
Most imported beef is brought to Japan by ship. The two most signifi cant ports in Japan are Tokyo and Osaka. American beef is shipped from West Coast ports, particularly from Los Angeles, Oakland, and Seattle (USDA, Agricultural Marketing Service, 2008). Australian beef is shipped primarily from the ports of Brisbane, Sydney, and Melbourne on the eastern and southern coasts of Australia (Teal et al., 1987).
Shipping from the West Coast of the United States to Tokyo generally takes 10-13 days. According to industry sources, once in Japan, chilled U.S. product generally has a shelf-life of 62 days, compared with 77 days for chilled Australian beef. In 2008, the average container rate was $3,947 for frozen primal beef on a 40-foot-equivalent-unit basis. Rates have remained lower than before the BSE-related trade bans. The container price of frozen primal beef decreased 30 percent from the price in 2003, when the average rate was $4,944 (USDA, Agricultural Marketing Service, 2008).
Shipping costs have increased over the past 3 years. The 2008 fi nancial crisis and dramatic drop in worldwide trade created temporary relief from higher shipping costs, but container rates have steadily increased since U.S. beef was allowed back into the Japanese market. Chilled and frozen beef products must be transported in refrigerated containers to maintain the quality of the product. Because of the limited number of containers for shipping, coun-tries must bid their beef products against poultry and pork exports to Japan, which have greatly increased since 2003. Global competition, especially from Brazil, has also increased the demand and price for shipping containers. Global exports of meat and poultry products increased 32 percent between 2003 and 2008 (USDA, Foreign Agricultural Service, 2009). Companies also must bid for ships to carry their containers. As the volume of worldwide trade increased and the number of ocean vessels remained relatively fi xed, container rates also increased, accounting for part of the increase in container rates from 2006 to 2008. As trade volumes and demand for containers declined in the last quarter of 2008, container rates subsequently fell (fi g. 19).
Exchange Rates
The strength of the Japanese yen relative to the currencies of major trading partners affects the price of imported beef.30 The yen has historically been weaker against the U.S. dollar since the late 1990s, compared with the Australian, New Zealand, and Canadian dollars. The exchange rate between the U.S. dollar and the yen, however, is more stable among the major beef exporters (fi g. 20).
30Miljkovic et al. found that the U.S. export unit value of beef destined for Japan dropped by 0.3 percent for a reduction of 10 percent in the value of the yen versus the U.S. dollar, based on data for 1989-96.
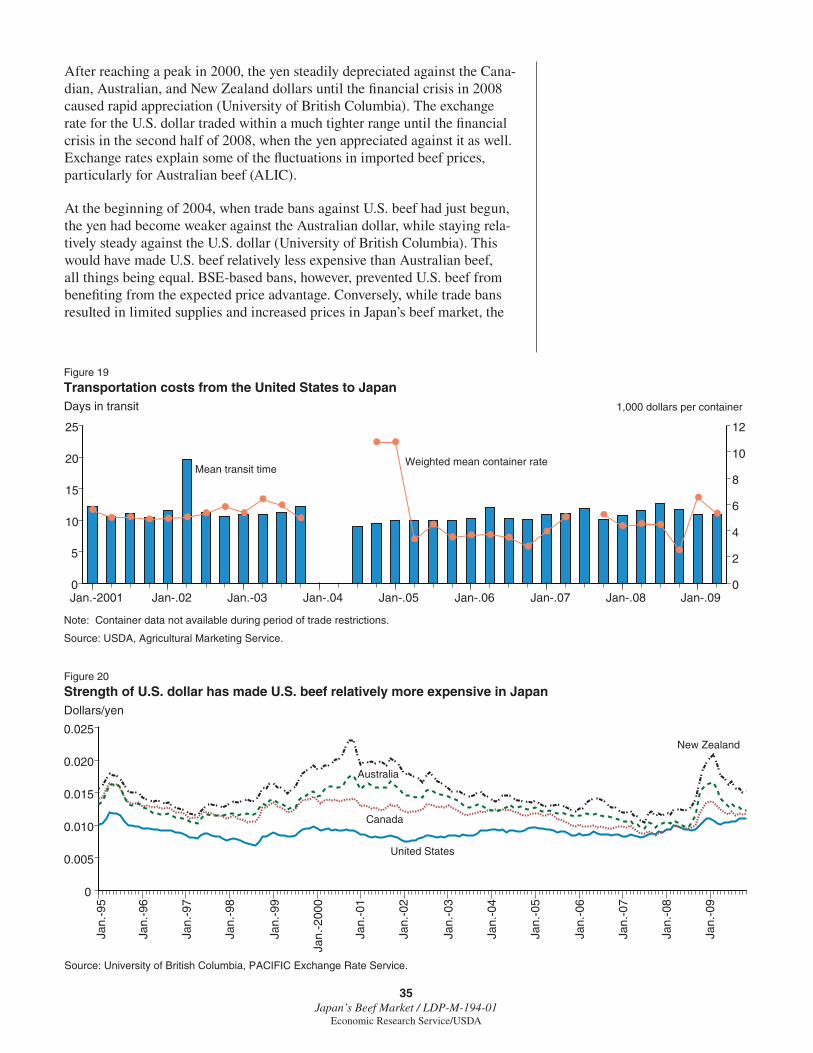
35Japan’s Beef Market / LDP-M-194-01
Economic Research Service/USDA
After reaching a peak in 2000, the yen steadily depreciated against the Cana-dian, Australian, and New Zealand dollars until the fi nancial crisis in 2008 caused rapid appreciation (University of British Columbia). The exchange rate for the U.S. dollar traded within a much tighter range until the fi nancial crisis in the second half of 2008, when the yen appreciated against it as well. Exchange rates explain some of the fl uctuations in imported beef prices, particularly for Australian beef (ALIC).
At the beginning of 2004, when trade bans against U.S. beef had just begun, the yen had become weaker against the Australian dollar, while staying rela-tively steady against the U.S. dollar (University of British Columbia). This would have made U.S. beef relatively less expensive than Australian beef, all things being equal. BSE-based bans, however, prevented U.S. beef from benefi ting from the expected price advantage. Conversely, while trade bans resulted in limited supplies and increased prices in Japan’s beef market, the
Figure 19
Transportation costs from the United States to JapanDays in transit
Note: Container data not available during period of trade restrictions.
Source: USDA, Agricultural Marketing Service.
Jan.-2001 Jan-.02 Jan.-03 Jan-.04 Jan-.05 Jan-.06 Jan-.07 Jan-.08 Jan-.090
5
10
15
20
25
0
2
4
6
8
10
12
Mean transit timeWeighted mean container rate
1,000 dollars per container
Figure 20
Strength of U.S. dollar has made U.S. beef relatively more expensive in JapanDollars/yen
Source: University of British Columbia, PACIFIC Exchange Rate Service.
Jan.
-95
Jan.
-96
Jan.
-97
Jan.
-98
Jan.
-99
Jan.
-200
0
Jan.
-01
Jan.
-02
Jan.
-03
Jan.
-04
Jan.
-05
Jan.
-06
Jan.
-07
Jan.
-08
Jan.
-09
0
0.005
0.010
0.015
0.020
0.025
United States
Canada
Australia
New Zealand
36Japan’s Beef Market / LDP-M-194-01
Economic Research Service/USDA
appreciating Australian dollar further compounded the price increase by making available Australian beef more expensive in terms of yen.
When trade of U.S. beef resumed in 2006 under the EV Program, the yen continued to appreciate against the U.S. dollar and depreciate against the Australian dollar. This combination meant that U.S. beef products were relatively cheaper in terms of yen. This pattern changed, however, after the summer of 2008’s fi nancial crisis. As a result, the yen appreciated rapidly against nearly all major currencies, except for the U.S. dollar, against which it appreciated much more modestly in percentage terms. The pattern of convergence between the U.S. and Australian dollar that had taken place over the previous 6 years was temporarily reversed, making Australian products relatively cheaper than U.S. products (University of British Columbia, 2009). In 2009, the Australian and U.S. dollar moved closer in value, with U.S. beef expected to be more competitive. After initial concerns due to the fi nancial crisis were moderated, the Japanese yen was stronger overall, facilitating more Japanese imports of all goods, including beef.

37Japan’s Beef Market / LDP-M-194-01
Economic Research Service/USDA
Domestic
Japan’s highly segmented beef market is differentiated by price. Even within the same yield and quality grade, carcasses of different breed and sex receive signifi cantly different prices.31 A top grade wagyu steer has a wholesale price almost twice as high as an F-1 cross-bred steer and nearly three times as high as for a dairy steer. Meat from wagyu cows and heifers carries a premium price over steers in each grade. For dairy and cross-bred breeds, however, meat from heifers is lower priced than that from steers. Breed and place of origin are given on retail labels, while carcass grades are not.
Domestic beef is considerably more costly than imported beef because of the high feed costs and longer feeding periods, but also because consumers are willing to pay prices that cover these costs. Prices for domestic beef dropped in 2001 after discovery of BSE in the Japanese herd and the realization that cattle infected with the disease had entered the food supply. Domestic beef prices gradually recovered in 2002 and 2003, before the discovery of BSE in the U.S. herd in late 2003.
The loss of U.S. beef in the Japanese market created a void in grain-fed beef, particularly affecting lower grades of Japanese beef, which are closer substi-tutes for U.S. beef. Domestic wholesale beef prices increased 11 percent on average between 2003 and 2007. Grade B beef prices increased more than high-quality wagyu beef. Wagyu beef prices increased during this period but only 5 percent, compared with the 12-percent increase in dairy and cross-bred beef prices. Beef from dairy cows increased 24 percent for C-2 and 34 percent for C-1 cows (ALIC).
Retail beef prices rose even more than wholesale prices did. As with whole-sale prices, retail prices for nonwagyu beef increased more than retail prices for wagyu beef. Prices for brisket and chuck seemed particularly sensitive; the normal selling price of nonwagyu brisket increased 48 percent between 2003 and 2007, compared with only 13 percent for sirloin (ALIC). In general, the average discount price rose more than the normal selling price, providing fewer savings opportunities for Japanese consumers. These increases are magnifi ed given that overall consumer price levels have declined since 1998 (Euromonitor).
Imports
Prices for imported U.S. beef have been considerably higher in Japan than domestic U.S. beef prices, even before the ban on U.S. beef. From 1996 to 2003, a U.S. sirloin cut cost nearly twice as much in Japan as a choice-grade sirloin steak in the United States, when the price was converted from yen into dollars per pound. Similarly, a U.S. cut of chuck was about 50 percent higher at retail for Japanese customers than for U.S. customers (ALIC and Univer-sity of British Columbia). The import tariff and transport costs account for some of the increased margins. Consumer preferences, as well as the unique marketing structure in Japan, also raise prices for Japanese consumers.
31Mori and Lin (1994), chapter 5 and appendix A, provide additional discus-sion that remains pertinent to current conditions.
Prices

38Japan’s Beef Market / LDP-M-194-01
Economic Research Service/USDA
Australian beef was generally less expensive in Japan than U.S. beef. Australian brisket was particularly less expensive at retail, priced about 60 percent cheaper per kilogram than U.S. brisket, on average, from 1996 to 2003 (ALIC). U.S. cuts of chuck roll and sirloin had smaller premiums over Australian products, averaging 15 and 11 percent, respectively (ALIC).
Compared with domestic beef prices, however, both Australian and U.S. imported beef were much less expensive. Australian beef was about 65 percent cheaper than wagyu beef and 45-50 percent cheaper than beef from dairy and cross-bred animals. U.S. end cuts, such as brisket and rounds, were priced 60-65 percent less than wagyu beef and 35-40 percent less than dairy or cross-bred beef from 1996 until 2003. Higher priced sirloin from the United States was about 45-55 percent less expensive than wagyu and about 10 percent cheaper than dairy and cross-bred beef (ALIC).
The price of Australian cuts increased after U.S. beef was banned from the Japanese market. Australian chuck roll was nearly 29 percent higher from 2004 to 2007 compared with the price from 4 years prior. Brisket prices also increased by nearly 47 percent as the supply of end meats declined. Prices for Australian end meats have remained high as the Australian industry worked to expand their grain-feeding feedlot system (ALIC). However, Australian imports were never able to completely fi ll the void left by the United States. Limited feedlot capacity and limited Australian domestic demand, as well as drought, made supplying the Japanese market with suffi cient individual cuts diffi cult for Australian producers, unlike the larger American industry. As a result, some Australian beef exported to Japan was marketed as full sets. Full sets included high-demand cuts, such as end meats, as well as cuts that were of lower demand in Japan, primarily middle meats. Including these cuts in full sets affected marketing strategies and the profi tability of wholesalers.
Beef prices have remained higher than they were before 2004 as U.S. beef regained access to the market. The current EV program requirements increase the cost and availability of imported beef from the United States. Since U.S. beef has returned to the market, U.S. beef prices have been much higher than Japanese customers are accustomed to, partially dampening demand. Overall, total beef supplies have not recovered to their 2003 levels, and beef prices have remained relatively high.

39Japan’s Beef Market / LDP-M-194-01
Economic Research Service/USDA
Japan’s market for imported beef depends on demand and supply within Japan. Demand is below historic levels. However, evidence indicates that the Japanese consume more beef when their incomes rise and when beef prices fall. On the supply side, farm returns have been weak and have prevented substantial herd expansion, even in the absence of North American beef from the market. If future conditions are favorable for higher beef demand, much of the extra consumption will be supplied by imports.
There is no guarantee that Japanese incomes will grow or that beef prices will fall in the coming years. If we imagine a scenario where incomes, prices, and other factors do not change, and we disregard changes in age cohorts, consump-tion per person will not change. Because Japan’s population is declining, total consumption will drop by almost 50,000 metric tons per year by 2020 (fi g. 21). Rising beef prices, or a continuation of the economic slump seen in 2008 and 2009, could exacerbate this underlying decline dictated by Japan’s demographic conditions. Current projections, however, point to a return to economic growth, and easier access to U.S. beef could lead to lower average prices in Japan (see “Appendix 3: Thinking about the Future of Japan’s Beef Market”).
For our income projections for Japan, we used those published by the USDA Agricultural Projections to 2019 (USDA/ERS, 2010), and assumed no changes in price or other factors that would affect consumption. We found that beef consumption per person would rise because positive economic growth is
Conclusions and Projections
Figure 21
Consumption scenarios in Japan1,000 metric tons
Source: USDA, Economic Research Service.
Case 1: Population constant, prices fixed, per capita consumption fixed
Case 2: Population follows U.S. Census projections, prices fixed, per capita consumption fixed
Case 4a: Income elasticity is .2, prices fixed
Case 4b: Income elasticity is .76, prices fixed
Case 6a: Price elasticity is -.2, income fixed
Case 6b: Price elasticity is -1.32, income fixed
1999 01 03 05 07 09 11 13 15 17 191,000
1,100
1,200
1,300
1,400
1,500
1,600

40Japan’s Beef Market / LDP-M-194-01
Economic Research Service/USDA
projected for 2010 and beyond. The degree to which beef consumption responds to income change is uncertain. An arbitrary choice of a low income elasticity of 0.2 would raise consumption per person, but not by enough to overcome population decline; total consumption would be 13,000 metric tons lower in 2020 than in 2008. Using a higher income elasticity (0.76, estimated for 1981-2007), consumption would rise 86,000 metric tons above current levels by 2020.
The possible effects of changes in beef prices, assuming that all other vari-ables are constant, except for the population decline, can also be examined by making simple assumptions. If we arbitrarily assume that the average beef price declines by 2 percent per year to demonstrate how the elasticity would affect consumption (i.e., more than a 20-percent decline over a 10-year period), and that the own-price elasticity is a low estimate of -0.2 (i.e., for each 1-percent decline in price, consumption per person rises by 0.2 percent), then consumption per person would rise by over 4 percent over a decade. In this case, total consumption would remain near 2008 levels; a population decline would balance price-driven growth in consumption per person. If we assume instead that the own-price elasticity is -1.32 (estimated for 1981-2007), consumption per person rises much more, and total consumption would be 320,000 metric tons higher in 2020 than in 2008.
Consumption change in these simple scenarios ranges from a 50,000-metric-ton drop in annual consumption to a 320,000-metric ton rise in 2020, compared with 2008. Much, or even all, of the consumption change would be refl ected in import levels. If domestic production were static at 2008 levels, then all the consumption change in 2020 would be refl ected in imports (assuming no changes in stocks) that are as much as 50,000 metric tons below 2008 levels or as much as 320,000 metric tons above 2008 levels. If, however, we assume that the proportion of supply coming from domestic production and imports remains the same, then the change is shared between production and trade. Imports could fall by 30,000 metric tons in 2020 or rise by 180,000 metric tons.
Other possible scenarios include a decline in the proportion of supply contrib-uted by domestic production. It is unlikely, however, that only one variable would change. A combination of modestly higher income and modestly lower prices could push domestic consumption above the record high of 1,563,000 metric tons in 2000. Imports could also rise above previous record levels, if domestic production is constant or declines.
If the price of imported beef falls in Japan, import quantities could grow because of the additional demand for beef in response to lower prices and because of potential substitutions away from domestic beef and other meats. Global markets are important in determining imported beef prices, but some price-related factors are specifi c to Japan’s market:
• Imported beef prices could fall if the import tariff on beef were reduced; or
• A change in Japan’s policies allows beef from more carcasses to be imported from the United States. The current limitation on beef from animals verifi ed as less than 21 months old is restrictive and could be the cause of higher prices.

41Japan’s Beef Market / LDP-M-194-01
Economic Research Service/USDA
While growth in Japan’s domestic beef production is not likely and decline is possible, Japan’s domestic herds supply a large and distinct portion of beef demand and may continue to do so. Domestic beef production relies heavily on U.S. feedstuffs. Although further intensifi cation of feed use per animal—a trend seen in recent years—is likely to be discouraged by consumers’ aver-sion to foods with a higher fat content (as well as costly for producers to carry out), beef cattle feeding in Japan will remain an important market for U.S. grains, fodder, and oilseed meals.
Japan’s beef trade is tied to specifi c cuts. Restoring former levels will be important to retailers and restaurants that relied on those cuts and want to sell them again. The conditions prevailing in 2003 and before, where U.S. exporters were able to capture over 50 percent of a larger Japanese import market, may not be fully realized in the future. The potential Japanese market for U.S. beef, however, could be signifi cantly larger than in 2008.

42Japan’s Beef Market / LDP-M-194-01
Economic Research Service/USDA
Agriculture and Livestock Industries Corporation (ALIC). Monthly Statistics, various issues.
Canadian Food Inspection Agency. “Additional Requirements for Estab-lishments Eligible to Export Beef Products to Japan,” Meat and Poultry Manual of Procedures, annex F to chapter 11, 2008, http://www.inspec-tion.gc.ca/english/fssa/meavia/man/ch11/coupay/jap/annexfe.shtml.
Clemens, Roxanne. Meat Traceability and Consumer Assurance in Japan, MATRIC Briefi ng Paper 03-MBP 5, September 2003, http://www.card.iastate.edu/publications/DBS/PDFFiles/03mbp5.pdf.
Clemens, Roxanne. After the Ban: The Japanese Market for U.S. Beef, MATRIC Briefi ng Paper 07-MBP 12, April 2007, http://www.card.iastate.edu/publications/DBS/PDFFiles/07mbp12.pdf.
Dyck, John H. Demand for Meats in Japan; A Review and an Update of Elasticity Estimates, Staff Report No. AGES880525, U.S. Department of Agriculture, Economic Research Service, August 1988.
Euromonitor International. 2009, http://www.euromonitor.com/.
Fukuda, Hisao, Annual Japan Grain and Feed Reports, Global Agricultural Information Network series, U.S. Department of Agriculture, Foreign Agricultural Service (FAS), various issues, http://gain.fas.usda.gov/Pages/Default.aspx.
Hoelscher, M.A. “Feedyard Analysis,” Feedstuffs, various issues, 2006.
International Monetary Fund (IMF). World Economic Outlook database, 2010, http://www.imf.org/external/pubs/ft/weo/2010/01/weodata/index.aspx.
Japan Meat Grading Association. Beef Carcass Grading Standard, January 2000.
Japan Tariff Association. Custom Tariff Schedules of Japan, 2008.
Japan Tariff Association. “Offi cial trade data of Japan,” World Trade Atlas, 2009, www.gtis.com.
LaFrance, J. T. “When Is Expenditure ‘Exogenous’ in Separable Demand Models?” Western Journal of Agricultural Economics 16(1991): pp. 49–62.
Longworth, John W. Beef in Japan; Politics, Production, Marketing & Trade, Australia: University of Queensland Press, 1983.
Matsumoto, Masahiro, and John Mark Looney. Japan Retail Food Sector Annual Report 2008, GAIN Series No. JA8713, U.S. Department of Agriculture, Foreign Agricultural Service (FAS), November 14, 2008, http://gain.fas.usda.gov/Pages/Default.aspx.
References

43Japan’s Beef Market / LDP-M-194-01
Economic Research Service/USDA
Miljkovic, Dragan, Gary W. Brester, and John M. Marsh. “Exchange rate pass-through, price discrimination, and U.S. meat export prices,” Applied Economics Vol. 35, pp. 641-50, 2003.
Ministry of Agriculture, Forestry and Fisheries (MAFF). Annual Report on Food, Agriculture and Rural Areas in Japan FY 2008 (Summary), 2008, http://www.maff.go.jp/e/annual_report/2008/pdf/e_indi.pdf.
Ministry of Agriculture, Forestry and Fisheries (MAFF). Food Balance Sheet for 2005, 2007.
Ministry of Agriculture, Forestry and Fisheries (MAFF). Monthly Statistics of Agriculture, Forestry and Fisheries, various issues.
Ministry of Agriculture, Forestry and Fisheries (MAFF). Statistical Year-book of Ministry of Agriculture, Forestry and Fisheries, various issues.
Ministry of Agriculture, Forestry and Fisheries (MAFF). Statistics of Live-stock Industry, various issues.
Ministry of Agriculture, Forestry and Fisheries (MAFF). Pocketbook Statis-tics on Livestock, 2007, July 2008.
Ministry of Agriculture, Forestry and Fisheries, Livestock Division, and Japan Meat Conference. The Meat Statistics in Japan, various issues.
Mori, Hiroshi, and Biing-Hwan Lin. Japanese Beef Market; Distinctly Unique, Japan: Senshu University Press, 1994.
Mori, Hiroshi, Dennis L. Clason, John Dyck, and William D. Gorman. “Age in Food Demand Analysis,” Cohort Analysis of Japanese Food Consump-tion—New and Old Generations, chapter 10, (Mori, Hiroshi, ed.), Japan: Senshu University Press, 2001.
Mori, Hiroshi, Kimiko Ishibashi, Dennis Clason, and John Dyck. “Age-Free Income Elasticities of Demand for Foods: New Evidence from Japan,” The Annual Bulletin of Social Science Vol. 40, Senshu University, March 2006.
Mos Burger Website. 2009, http://www.mos.co.jp/english/history/.
Mues, Colin, David Harris, Robyn Horton, and Nashika Baskerville. Substi-tution relationships between beef and other meats in Japan, Technical Paper 91.6, Canberra: Australian Bureau of Agricultural and Resource Economics, 1991.
National Agricultural Insurance Association. The Outline of Japan’s Agricul-tural Insurance Scheme, briefi ng booklet, February 2009.
Nihon Hamburg and Hamburger Association. http://nhha.lin.gr.jp/research/fi gures.html.
44Japan’s Beef Market / LDP-M-194-01
Economic Research Service/USDA
Obara, Kakuyu. Japan Livestock Reports, GAIN series, U.S. Department of Agriculture, Foreign Agricultural Service (FAS), various issues, http://gain.fas.usda.gov/Pages/Default.aspx.
Organisation of Economic Cooperation and Development. Producer and Consumer Support Estimates, OECD Database 1986-2007, 2009, http://www.oecd.org/document/11/0,3343,en_2649_33797_43352651_1_1_1_1,00.html.
Otsuka, Masayuki, Chika Motomura, and Sarah Newsome. Japan HRI Food Service Sector Report 2009, GAIN Series No. JA9507, U.S. Department of Agriculture, Foreign Agricultural Service (FAS), March 9, 2009, http://gain.fas.usda.gov/Pages/Default.aspx.
Reed, Michael R., and Sayed H. Saghaian. “Measuring the Intensity of Competition in the Japanese Beef Market,” Journal of Agricultural and Applied Economics Vol. 36, No. 1, pp. 113-21, April 2004.
Simpson, J.R., Y. Kojima, R. Kada, A. Miyazaki, and T. Yoshida. Japan’s Beef Industry; Economics and Technology for the Year 2000, United Kingdom: Center for Agriculture and Biosciences International, 1996.
Stillman, Richard, Mildred Haley, and Kenneth Mathews. “Grain Prices Impact Entire Livestock Production Cycle,” Amber Waves, March 2009, http://www.ers.usda.gov/AmberWaves/March09/Features/GrainPrices.htm.
Teal, Francis, Andrew Dickson, Darrell Porter, and Diane Whiteford. Japa-nese Beef Policies: Implications for trade, prices, and market shares, Occasional Paper 102, Canberra: Australian Bureau of Agricultural and Resource Economics, 1987, http://www.abare.gov.au/publications_html/livestock/archive/87_japanbeef.pdf.
Terauchi, Eiji. Tokyo Meat Market Co., Ltd., interview, September 4, 2008.
Thompson, Wyatt. “Using Elasticities from an Almost Ideal Demand System? Watch Out for Group Expenditure!” American Journal of Agricultural Economics Vol. 86, No. 4, pp. 1108-16, November 2004.
Tokyo Metropolitan Central Wholesale Market. Market Guide, 2006.
U.S. Department of Agriculture, Agricultural Marketing Service. Grain Trans-portation Report, May 1, 2008, http://www.ams.usda.gov/AMSv1.0/ams.fetchTemplateData.do?template=TemplateA&navID=AgriculturalTransportation&leftNav=AgriculturalTransportation&page=ATGrainTransportationReport&description=Grain%20Transportation%20Report%20(GTR).
U.S. Department of Agriculture, Agricultural Marketing Service, Audit, Review, and Compliance Branch. USDA Export Verifi cation (EV) Program Specifi ed Product Requirements for Beef – Japan, ARC 1030J Procedure, December 12, 2005, http://www.ams.usda.gov/AMSv1.0/getfi le?dDocName=STELDEV3103526.

45Japan’s Beef Market / LDP-M-194-01
Economic Research Service/USDA
U.S. Department of Agriculture, Economic Research Service. Japan Briefi ng Room, 2009, http://www.ers.usda.gov/Briefi ng/Baseline/macro.htm.
U.S. Department of Agriculture, , Economic Research Service. USDA Long-Term Agricultural Projection Tables, 2010, http://usda.mannlib.cornell.edu/MannUsda/viewStaticPage.do?url=http://usda.mannlib.cornell.edu/usda/ers/94005/./2010/index.html.
U.S. Department of Agriculture, Foreign Agricultural Service. Production, Supply and Disappearance (PS&D) Database 2009, http://www.fas.usda.gov/psdonline/psdHome.aspx.
U.S. Department of Agriculture, National Agricultural Statistics Service. Quick Stats. 2009, http://www.nass.usda.gov/Data_and_Statistics/Quick_Stats/index.asp.
U.S. Department of Commerce, U.S. Census Bureau. International Database, 2009, http://www.census.gov/ipc/www/idb/.
U.S. Department of Labor, Bureau of Labor Statistics. Average price data, 2009, http://data.bls.gov/PDQ/outside.jsp?survey=ap.
U.S. International Trade Commission. Global Beef Trade: Effects of Animal Health, Sanitary, Food Safety, and Other Measures on U.S. Beef Exports Investigation No. 332-488, USITC Publication 4033, September 2008, http://www.usitc.gov/publications/332/pub4033.pdf.
University of British Columbia, Sauder School of Business. PACIFIC Exchange Rate Service, 2009, http://fx.sauder.ubc.ca/.
World Trade Organization (WTO). Agreement on Safeguards. http://www.wto.org/english/docs_e/legal_e/25-safeg.pdf.
Zennoh. Briefi ng, September 4, 2008.

46Japan’s Beef Market / LDP-M-194-01
Economic Research Service/USDA
Appendix 1Econometric Estimation of Income and Substitution Elasticities
Estimates for the demand elasticities of meats in Japan were calculated using an Almost Ideal Demand System (AIDS), primarily following the method provided by Thompson (2004). What follows is an explanation of the data and methodology used to calculate the estimates reported in the text.
Data
Price and quantity data were used to calculate meat expenditures and a budget share for each good for the AIDS model. The disappearance data series of the Food Balance Sheet (FBS) provided quantities per person for pork, beef, and poultry from 1981 to 2007. Prices were obtained from the Japan Retail Price Survey series, also from 1981 to 2007. For both beef and pork, shoulder prices were used in the AIDS model. For chicken meat, the broiler leg price was used.
Macroeconomic variables were used in an equation relating meat expendi-tures to total expenditures. The Japanese Gross Domestic Product (GDP) per person, Consumer Price Index (CPI), and a price index for fresh fi sh and shellfi sh were taken from the website of the Ministry of Internal Affairs and Communications, Statistics Bureau.
Model
The model was primarily derived from Thompson (2004), who estimated a nonlinear AIDS model with an added equation that both related meat expen-ditures to total income and provided an instrument for meat expenditures, which were calculated from prices and quantities, and thus endogenous. Three-stage least squares (IT3SLS in SAS) estimation was used to iterate the added equation and the AIDS budget share equations until parameters converged. Homogeneity in prices and income was imposed on the entire model, and symmetry and adding-up constraints were imposed on the AIDS budget-share equations.
These equations were estimated (variables are in capitals and parameters in lower-case):
( )
( ( ) ( )
( ) ( ) ( ) ( ) )
Ex
B a aa B ab C a
C b ab B bb C b
a B b c c P aa B ab B C ac B P
ab C B bb C bc C P ac P B bc
o y a c f A
P C P
t z
c
l
c
W P P (Ex P)
W P P Ex P
P P P P P P * P P * P
P * P P P
d d GD
* P P * P P
P d P d CPI d P d Ex
P
E
*
d S
P
B
,
−
=α +γ + γ + β −
=α +γ + γ + β −
=α +α +α +α + γ + γ + γ +
γ + γ + γ + γ
= + +
+ γ +
+ + + +
γ ⋅
20
2
1
2
12
where Ex is endogenous, and the instruments used to address simultaneity are CPI, GDP, Ext–1, PB, PC, and PA.

47Japan’s Beef Market / LDP-M-194-01
Economic Research Service/USDA
Results for the beef and chicken equations were used to calculate the pork parameters and the demand elasticities. Variable defi nitions and parameter estimates are presented in appendix table 1, and the data used in the regres-sion are found in appendix table 2.
The meat expenditure term is regressed against GDP, CPI, the price index of fi sh, meat expenditure lagged 1 year, the calculated meat price index (as specifi ed by the AIDS model), and a dummy variable to capture the effects of BSE in Japan. The dummy variable in the expenditure equation is 1 for all years after 2001, when the fi rst case of BSE was found in Japan. This event, as well as the discovery of BSE in North America in 2003, had a noticeable impact on beef consumption in Japan. The effect is captured in the expen-diture equation in this model. The meat expenditure variable is endogenous (Thompson, LaFrance). An instrument for meat expenditure is calculated and then used in the budget share equations, which produce the coeffi cients used in the elasticity calculations. The parameter estimates are provided below, while the elasticity calculations are included in the main text of the report.
Appendix table 1
Variable Label
Ex Log form of total meat expenditure
GDP Log form of per capita Gross Domestic Product (GDP)
CPI Log form of Consumer Price Index (CPI)
PA Log form of fi sh price index
Ex(t-1) Log form of total meat expenditure lagged 1 year
BSE BSE dummy variable
PB Log form for price of beef
PC Log form for price of chicken
PP Log form for price of pork
WB Budget share for beef
WC Budget share for chicken
P Log form of nonlinear price index

48Japan’s Beef Market / LDP-M-194-01
Economic Research Service/USDA
Appendix table 2: Model results
Nonlinear IT3SLS summary of residual errors
Equation DF model DF error SSE MSE Root MSE R-SquareAdjusted R-
Square
WB 2.667 24.33 0.00214 0.000088 0.00938 0.9750 0.9733
WC 2.667 24.33 0.000366 0.000015 0.00388 0.9682 0.9661
Ex 7.667 19.33 0.0322 0.00166 0.0408 0.9726 0.9632
Nonlinear IT3SLS parameter estimates
Parameter Estimate Approximate standard error t valueApproximate
Pr > |t|Label
dy 0.432779 0.2677 1.62 0.1224
da 0.303702 0.2991 1.02 0.3227
dc -0.50671 0.9271 -0.55 0.5910
df -0.22977 0.7378 -0.31 0.7589
aa -0.16773 0.0200 -8.39 <.0001
ab 0.032043 0.0176 1.82 0.0819
ac 0.135691 0.0112 12.11 <.0001
bb -0.0055 0.0214 -0.26 0.7992
bc -0.02654 0.0128 -2.08 0.0488
cc -0.10915 0.0122 -8.98 <.0001
a 0.30947 0.0682 4.54 0.0001
b 0.399472 0.0859 4.65 0.0001
_c 0.291058 0.0888 3.28 0.0033
d0 -1.14257 2.0452 -0.56 0.5829
dl 0.882031 0.0969 9.10 <.0001
dz -0.07957 0.0482 -1.65 0.1150
a 0.417973 0.0236 17.67 <.0001
b -0.1389 0.0102 -13.59 <.0001
Restrict 0 -3.43648 1.3737 -2.50 0.0081 dy + da + dc + df = 0
Restrict 1 -79.8212 47.6526 -1.68 0.0943 g1aa+g1ab+g1ac = 0
Restrict 2 -96.8746 60.3651 -1.60 0.1100 g1ab+g1bb+g1bc = 0
Restrict 3 -71.2183 46.5937 -1.53 0.1291 g1ac+g1bc+g1cc = 0
Restrict 4 -5.03926 2.5778 -1.95 0.0479 aa + ab + ac = 1

49Japan’s Beef Market / LDP-M-194-01
Economic Research Service/USDA
Appendix table 3: Data set
QB QP QC PB PP PC CPI GDP PA
1981 3.7 9.6 7.9 5750 2010 1200 79.52987 2648.689 87.9
1982 3.9 9.5 8.3 5710 2060 1180 81.58668 2699.875 93.4
1983 4.2 9.6 8.6 5800 2150 1190 83.15377 2727.916 93.6
1984 4.3 9.7 8.9 5940 2110 1170 85.01469 2816.721 93.6
1985 3.9 9.3 8.4 6230 2100 1150 86.58178 2926.749 95.9
1986 4.2 9.6 9 6360 2040 1120 86.58178 2994.529 97
1987 4.5 10.1 9.3 6380 1990 1060 87.0715 3129.233 95.5
1988 4.9 10.3 9.6 6430 1990 1050 87.7571 3323.787 94.7
1989 5 10.4 9.6 6620 2020 1050 90.20568 3453.953 96.3
1990 5.5 10.3 9.4 6800 2090 1080 93.04603 3647.63 99.8
1991 5.6 10.4 9.6 6900 2150 1090 95.59256 3711.821 103.8
1992 6 10.4 9.8 7050 2190 1120 97.15965 3737.754 105.5
1993 6.7 10.3 9.5 7200 2200 1120 98.43291 3689.357 104.9
1994 7.2 10.4 9.8 7110 2170 1090 98.72674 3759.135 103.1
1995 7.5 10.3 10.1 6890 2190 1080 98.53085 3844.465 101.8
1996 6.9 10.5 10.3 6730 2220 1080 98.92262 3948.099 103.7
1997 7.2 10.2 10.1 7080 2340 1130 100.9794 3938.562 106.1
1998 7.3 10.4 9.9 7280 2370 1150 101.1753 3869.932 107.5
1999 7.3 10.6 10.2 7310 2340 1160 100.6856 3892.479 107.2
2000 7.6 10.6 10.2 7340 2300 1160 100 3983.596 104.9
2001 6.3 10.8 10.4 7690 2300 1170 99.02057 3940.436 104.3
2002 6.4 11.4 10.4 7970 2350 1250 98.43291 3976.587 103.9
2003 6.2 11.6 10.1 8390 2350 1250 98.23702 4054.547 101.9
2004 5.6 12 9.8 8340 2400 1230 98.13908 4132.077 100.6
2005 5.6 12.1 10.5 8440 2390 1230 97.94319 4226.604 100
2006 5.5 11.5 10.6 8550 2390 1230 98.13908 4322.4 102.2
2007 5.665 11.546 10.6636 8840 2420 1250 98.53085 4404.838 103.1

50Japan’s Beef Market / LDP-M-194-01
Economic Research Service/USDA
HS tariff lines
Product
Tariff
NoteTrade value,
2008WTO
Least-developed countries
Mexico Chile
ad valorem
specifi c ad valorem
PercentYen/
kilogramPercent
Million U.S. dollars
0201Meat of bovine animals, fresh or chilled
38.5 0 30.81 38.5 1,249.687
0202 Meat of bovine animals, frozen 38.5 0 30.82 34.6 895.801
Offal of bovine animals, fresh or chilled:
0206.10.011 Tongues 12.8 0 7.6 12.8 76.0870206.10.020 Cheek and head meat 50 0 50 50 0.2920206.10.019 Internal organs 12.8 0 7.6 12.8 75.7470206.10.090 Other fresh or chilled edible offal 21.3 0 21.3 21.3 0Offal of bovine animals, frozen:
0206.21.000 Tongues 12.8 0 7.6 11.5 156.2960206.22.000 Livers 12.8 0 11.5 11.5 2.030206.29.020 Cheek and head meat 50 0 30 50 1.8860206.29.010 Other internal organs 12.8 0 7.6 11.5 43.7220206.29.090 Other frozen edible offal 21.3 0 19.1 19.1 4.033
0210.20.000
Meat and edible meat offal of bo-vine animals, salted, in brine, dried or smoked; edible fl ours and meals of bovine meat or meat offal
161.5 0 3 3 0
1601.00 Sausages 10 0 10 10 NA
Other prepared or preserved bovine meat, meat offal, or blood:
1602.10 Homogenized preparations 21.3 0 21.3 21.319.9 percent for Thailand 0
1602.20.010 Livers 21.3 0 21.3 21.317.8 percent for Thailand
NA
1602.50.100Guts, bladders, and stomachs, whole and pieces thereof, simply boiled in water
0 0 0 0 6.314
1602.50.291, 810, 910
Beef or beef offal, simply boiled in water
50 0 50 50 2.836
1602.50.410Dried after being boiled in water, in airtight containers, not chilled or frozen
38.3 0 38.3 38.3 0
1602.50.420Dried after being boiled in water, in airtight containers, chilled or frozen
50 0 50 50 0
1602.50.510Beef jerky, in airtight containers, not chilled or frozen
38.3 0 9 38.3 0
1602.50.520Beef jerky, in airtight containers, chilled or frozen
50 0 9 50 0
1602.50.590 Beef jerky, other 10 0 9 10 16.051—continued
Appendix 2Japan’s Beef Tariffs, 2009

51Japan’s Beef Market / LDP-M-194-01
Economic Research Service/USDA
HS tariff lines
Product
Tariff
NoteTrade value,
2008WTO
Least-developed countries
Mexico Chile
ad valorem
specifi c ad valorem
PercentYen/
kilogramPercent
Million U.S. dollars
1602.50.890In airtight containers, otherwise containing vegetables, not chilled or frozen, not boiled in water
38.3 0 38.3 38.3 0.017
1602.50, 210, 292, 299, 310, 320, 331, 339, 391, 399, 490, 600, 700
Other preparations 21.3 0 21.34 21.314.9 percent for Thailand, 1602.50.600
32.258
1602.90.210Other preparations, including prep-arations of blood of any animal, containing bovine meat or offal
21.3 0 21.3 21.3 NA
1603.00.010 Extracts and juices of bovine meat 12 0 6 66 percent for developing countries
NA
Note: Least-developed countries include 10 countries in Asia, 33 countries in Sub-Saharan Africa and Haiti.
NA = A value for beef imports cannot be separated because categories report the aggregate of beef- and pork-based imports.1Tariff is 30.8 percent for all boneless cuts; 34.6 percent for bone-in cuts; and 38.5 percent for carcasses.2Tariff is 30.8 percent for bone-in cuts and for boneless loin, chuck, clod, round, brisket, and plate; 34.6 percent for other boneless cuts; and 38.5 percent for carcasses.3Imports are assessed a tariff of 161.5 yen/kg.4Tariff is 19.1 percent for 1602.50.600 and 1602.50.700.
Sources: Japan Tariff Association, Customs Tariff Schedules of Japan, 2008. World Trade Atlas trade values.

52Japan’s Beef Market / LDP-M-194-01
Economic Research Service/USDA
Reference 1999 2000 2001 2002 2003 2004 2005 2006 2007 2008 2009 2010
1,000 metric tons
Historical consumption (1,000 mt) 1,502 1,563 1,399 1,304 1,348 1,169 1,188 1,159 1182 1174 1189 1195
Historical imports (1,000 mt) 986 1,045 982 697 833 634 686 678 686 659 672 678
2011 2012 2013 2014 2015 2016 2017 2018 2019 2020
1,000 metric tons
I. Assessing: Population change, with income and prices fi xed
Consumption, if relative prices, real income, and other effects are constant, but population size changes:
Case 1: No change in population 1,189 1,189 1,189 1,189 1,189 1,189 1,189 1,189 1,189 1,189
Case 2: Population change follows U.S. Census projections
1,183 1,180 1,176 1172 1,167 1,162 1,156 1,151 1,144 1,138
Imports, assuming domestic production fi xed:
Case 1: No change in population 664 664 664 664 664 664 664 664 664 664
Case 2: Population change follows U.S. Census projections
658 655 651 647 642 637 631 626 619 613
II. Assessing: Income change, with prices fi xed, and population declining
Consumption, if real income changes, while prices remain fi xed:
Case 3: No changes in income 1,183 1,180 1,176 1,172 1,167 1,162 1,156 1,151 1,144 1,138
Case 4a: USDA baseline projec-tion incomes, elasticity is .2
1,171 1,172 1,173 1,173 1,173 1,173 1,172 1,171 1,169 1,167
Case 4b: Income elasticity is .76 1,183 1,197 1,211 1,225 1,239 1,252 1,265 1,278 1,290 1,303
Imports, assuming domestic production fi xed:
Case 3: No changes in income 658 655 651 647 642 637 631 626 619 613
Case 4a: USDA baseline projec-tion incomes, elasticity is .2
646 647 648 648 648 648 647 646 644 642
Case 4b: USDA baseline projec-tion incomes, elasticity is .76
658 672 686 700 714 727 740 753 765 778
III. Assessing: Price change, with income fi xed and population declining
Consumption, if the real price of beef changes, but income does not change:
Case 5: No beef price change 1,183 1,180 1,176 1,172 1,167 1,162 1,156 1,151 1,144 1,138
Case 6a: Beef price drops by 2 percent per year, elasticity is -.2
1,176 1,177 1,178 1,178 1,178 1,178 1,177 1,176 1,174 1,172
Case 6b: Beef price drops by 2 percent per year, elasticity is -1.32
1,229 1,258 1,287 1,316 1,345 1,374 1,404 1,434 1,464 1,494
Imports, assuming domestic production fi xed:
Case 5: No beef price change 658 655 651 647 642 637 631 626 619 613
Case 6a: Beef price drops by 2 percent per year, elasticity is -.2
651 652 653 653 653 653 652 651 649 647
Case 6b: Beef price drops by 2 percent per year, elasticity is -1.32
704 733 762 791 820 849 879 909 939 969
Source: USDA, Economic Research Service calculations.
Appendix 3Thinking About the Future of Japan’s Beef Market