Embed Size (px)
Citation preview
ww
w.er
s.usda.gov
Want to learn more about WIC and the retail price of infant formula? Visit our website at www.ers.usda.gov.
You can also find additional information, both paper and electronic, about ERS publications, databases, and other products at our website.
Visit Our Website To Learn More!
Just dial 1-800-999-6779. Toll free in the United States and Canada.
Ask for WIC and the Retail Price of Infant Formula (FANRR-39)
It's Easy To Order Another Copy!
The U.S. Department of Agriculture (USDA) prohibits discrimination in all its programs and activities on the basis of race, color, national origin, sex, religion, age, disability, political beliefs, sexual orientation, or marital or family status. (Not all prohibited bases apply to all programs.) Persons with disabilities who require alternative means for communication of program information (Braille, large print, audiotape, etc.) should contact USDA's TARGET Center at (202) 720-2600 (voice and TDD).
To file a complaint of discrimination, write USDA, Director, Office of Civil Rights, Room 326-W, Whitten Building, 14th and Independence Ave., SW, Washington, DC 20250-9410, or call (202) 720-5964 (voice and TDD). USDA is an equal opportunity provider and employer.
National Agricultural Library Cataloging Record: WIC and the retail price of infant formula. (Food Assistance and Nutrition Research report ; no. 39) 1. Special Supplemental Nutrition Program for Women, Infants, and Children (U.S.). 2. Infant formulas--Prices--United States. 3. Rebates--Economic aspects--United States. I. Oliveira, Victor J. II. United States. Dept. of Agriculture. Economic Research Service. III. Title.
United StatesDepartmentof Agriculture
www.ers.usda.gov
A Report from the Economic Research Service
May 2004
Food Assistanceand NutritionResearch Report Number 39
WIC and the Retail Priceof Infant Formula
Victor Oliveira, Mark Prell, David Smallwood, and Elizabeth Frazão
Abstract
Rebates from infant formula manufacturers to State agencies that admin-ister the Special Supplemental Nutrition Program for Women, Infants, andChildren (WIC) support over one-quarter of all WIC participants.However, concerns have been raised that WIC and its infant formularebate program may significantly affect the infant formula prices faced bynon-WIC consumers. This report presents findings from the most compre-hensive national study of infant formula prices at the retail level. For agiven set of wholesale prices, WIC and its infant formula rebate programresulted in modest increases in the supermarket price of infant formula,especially in States with a high percentage of WIC formula-fed infants.However, lower priced infant formulas are available to non-WICconsumers in most areas of the country, and the number of these lowerpriced alternatives is increasing over time.
Keywords: WIC program, infant formula, cost-containment, rebates,food package costs, Special Supplemental Nutrition Program for Women,Infants, and Children, child nutrition, food assistance.
1800 M Street, NW May 2004Washington, DC 20036-5831

Contents
Summary . . . . . . . . . . . . . . . . . . . . . . . . . . . . . . . . . . . . . . . . . . . . . . iii
Definitions . . . . . . . . . . . . . . . . . . . . . . . . . . . . . . . . . . . . . . . . . . . . . vi
Chapter 1. Introduction . . . . . . . . . . . . . . . . . . . . . . . . . . . . . . . . . . 1
Chapter 2. Overview of the WIC Program . . . . . . . . . . . . . . . . . . 6Participant Eligibility . . . . . . . . . . . . . . . . . . . . . . . . . . . . . . . . . 6Participant Benefits . . . . . . . . . . . . . . . . . . . . . . . . . . . . . . . . . . . 7Food Delivery Systems . . . . . . . . . . . . . . . . . . . . . . . . . . . . . . . . 8WIC Funding and Cost-Containment Measures . . . . . . . . . . . . . 9
Chapter 3. The WIC Infant Formula Rebate Program . . . . . . . 11
Chapter 4. The Domestic Infant Formula Market . . . . . . . . . . . 16Demand for Infant Formula . . . . . . . . . . . . . . . . . . . . . . . . . . . 16Structure of the Infant Formula Market . . . . . . . . . . . . . . . . . . 17
Chapter 5. Source of Infant Formula Data . . . . . . . . . . . . . . . . . 22Limitations of the Data . . . . . . . . . . . . . . . . . . . . . . . . . . . . . . .24
Chapter 6. Infant Formula Trends . . . . . . . . . . . . . . . . . . . . . . . . 26Volume of Infant Formula Sold . . . . . . . . . . . . . . . . . . . . . . . . 26Dollar Sales of Infant Formula . . . . . . . . . . . . . . . . . . . . . . . . . 27Retail Price of Infant Formula . . . . . . . . . . . . . . . . . . . . . . . . . 28Increases in the Retail Price of Infant Formula Relative
to Inflation . . . . . . . . . . . . . . . . . . . . . . . . . . . . . . . . . . . . . . . 30Retail Markup . . . . . . . . . . . . . . . . . . . . . . . . . . . . . . . . . . . . . . 32
Chapter 7. Infant Formula Prices and Availability by Market Area . . . . . . . . . . . . . . . . . . . . . . . . . . . . . . . . . . . . . . 34
Availability of Infant Formula by Market Area . . . . . . . . . . . . 34Retail Infant Formula Prices by Market Area . . . . . . . . . . . . . . 34Infant Formula as a Loss Leader . . . . . . . . . . . . . . . . . . . . . . . . 38Contract Brand Retail Prices and Costs to the WIC Program . . . 42
Chapter 8. Event Study Analysis of Retail Infant Formula Prices . . . . . . . . . . . . . . . . . . . . . . . . . . . . . . . . . . . . 45
Chapter 9. Multivariate Analysis of the Determinants of Retail Infant Formula . . . . . . . . . . . . . . . . . . . . . . . . . . . . . . . . . 49
The Regression Model . . . . . . . . . . . . . . . . . . . . . . . . . . . . . . . 49Regression Results . . . . . . . . . . . . . . . . . . . . . . . . . . . . . . . . . . 53
Chapter 10. Discussion . . . . . . . . . . . . . . . . . . . . . . . . . . . . . . . . . . 59
Chapter 11. Conclusions . . . . . . . . . . . . . . . . . . . . . . . . . . . . . . . . . 63
References . . . . . . . . . . . . . . . . . . . . . . . . . . . . . . . . . . . . . . . . . . . . 66
Appendix A—History of the WIC Infant Formula Rebate Program . . . . . . . . . . . . . . . . . . . . . . . . . . . . . . . . . . . . . . . 69
Appendix B—Change in Price of Infant Formula After a Changein the Holder of the WIC Contract by Market Area . . . . . . . . . . . 72
Appendix C—The Economic Model of the Retail Infant FormulaMarket . . . . . . . . . . . . . . . . . . . . . . . . . . . . . . . . . . . . . . . . . . . . . . 81
Appendix D—Detailed Regression Results . . . . . . . . . . . . . . . . . . . 88
Appendix E—Data Sources and Construction of Variables . . . . . . 96
ii ● WIC and the Retail Price of Infant Formula / FANRR-39 Economic Research Service/USDA
Summary
Since 1989, Federal law has required that the State agencies administering the Special Supple-mental Nutrition Program for Women, Infants, and Children (WIC) enter into cost-containmentcontracts for the purchase of infant formula used in WIC. Typically, WIC State agencies obtainsignificant discounts in the form of rebates from the manufacturers for each can of infant formulapurchased by WIC participants. In exchange for rebates, a manufacturer is given the exclusiveright to provide its products to WIC participants in the State.
Concerned about the rise in the price of infant formula since the WIC rebate program began,Congress in 2000 directed the U.S. Department of Agriculture’s Economic Research Service(ERS) to report on several aspects of the infant formula market. While the resulting Report toCongress answered the specific questions posed by Congress, this new report extends the originalanalyses and provides a more indepth examination of the effects of WIC and its infant formularebate program on the retail prices of infant formula. Wholesale prices of infant formula can indi-rectly affect retail prices, but this report focuses more narrowly on the pricing behavior of retailersfor a given set of national wholesale prices. Therefore, this report’s analysis does not capture alleffects of WIC and the rebate program, including the extent to which WIC and the rebate programaffect wholesale prices in addition to the retail markup. Specifically, this report uses 1994-2000data to examine the following questions:
What are the recent trends in the infant formula market?
Since 1997, the volume of infant formula sold in the United States has remained rela-tively stable at about 27 billion ounces to 28 billion ounces (reconstituted) per year. Overthree-quarters of all infant formula sold in 2000 was milk-based, while soy-based infantformula accounted for another 20 percent. While most infant formula is sold in super-markets—69 percent in 2000—the proportion of infant formula sold by mass merchan-disers (at prices typically below those in supermarkets) has increased slightly in recentyears, accounting for about 28 percent of total volume sold. One of the more dramatictrends in the infant formula market in recent years has been the increase of formula soldin powdered form (generally, the least expensive form of formula)—from 44 percent ofall formula sold in 1994 to 62 percent in 2000. The volume of powdered infant formulathat is sold in large—24 or more ounces—containers (at lower per unit prices) is also onthe rise, increasing from only 4 percent in 1994 to 19 percent in 2000. Specialized for-mula (which is generally more expensive than standard formula) has made significantinroads in the market in recent years and accounted for 8 percent of all formula sold in2000. Total dollars sales of infant formula has increased in recent years, much of itattributed to the increased sales of specialized formula. The average retail price of infantformula continues to increase over time, across the different physical forms, productbases, and outlets.
Has the number of infant formula suppliers decreased since WIC’s infant formula rebateprogram began?
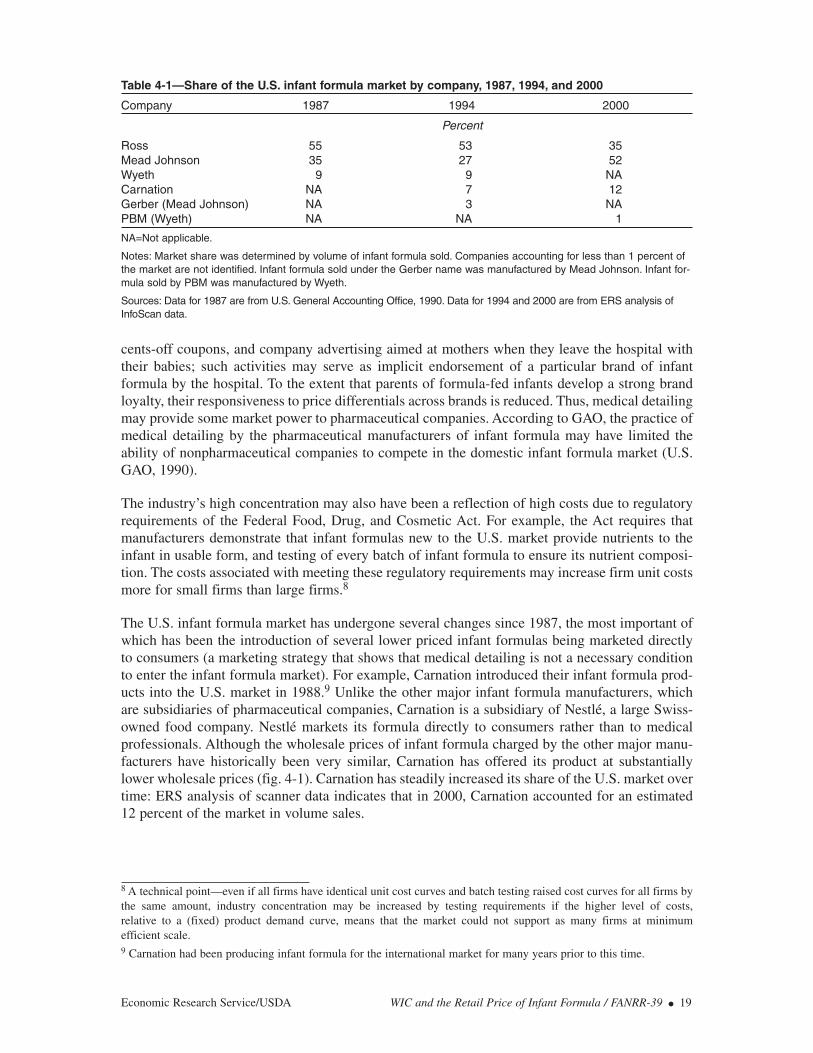
In 1987, before WIC’s infant formula rebate programs were widely implemented, and in2000, three manufacturers accounted for about 99 percent of the infant formula market.Furthermore, in both years, two companies—Ross and Mead Johnson—accounted forbetween 87 percent and 90 percent of all infant formula sold. However, the third-largestproducer in 2000—Carnation—entered the U.S. market after the rebate program began.Carnation continues to make inroads into the infant formula market. In 2000, the com-pany accounted for 12 percent of all formula sold. In addition, a fourth company—PBM
Economic Research Service/USDA WIC and the Retail Price of Infant Formula / FANRR-39 ● iii
Products—entered the infant formula market in 1997. PBM began marketing formulaproduced by Wyeth (Wyeth withdrew from the U.S. retail market in 1996.). Thus, thereis no evidence that WIC’s infant formula rebate program has resulted in a reduction ofthe number of infant formula manufacturers, thereby lessening competition.
Have infant formula prices increased faster than inflation in recent years?
The increase in the retail price of infant formula from 1994 to 2000 varied by manufac-turer and type of formula. But in nearly all cases, the average annual increase in the retailprice of infant formula exceeded inflation regardless of which of three consumer priceindices (CPI) were used to represent inflation—All Items, Food at Home, or Nonprescrip-tion Drugs and Medical Supplies. In addition, in every case the annual rate of increase inretail prices exceeded the annual rate of increase in wholesale prices. Since little informa-tion is available on the operating costs associated with selling infant formula at the retaillevel, it is not possible to determine the extent to which the increase in retail infant formulaprices above the rate of inflation is attributable to increased costs of retailing. In addition,infant formula prices were increasing faster than inflation even before the rebate programwas implemented.
Does the percentage retail markup of infant formula differ by brand or type of formula?
The size of the retail markups in percentage terms varied by type and manufacturer.Carnation brands of infant formula had a higher retail markup than did Mead Johnsonand Ross brands. Since the wholesale prices of Carnation are generally lower than thetwo other brands, retailers can mark Carnation products up more and still price themlower than the Ross and Mead Johnson brands. In addition, liquid concentrate forms offormula (both milk- and soy-based) had higher markups than powdered forms of for-mula for all manufacturers. All categories of formula had positive average annual retailmarkups at the national level. However, in many individual market areas, the retailprices of some infant formula products were priced below their listed wholesale prices,suggesting that many retailers use infant formula as loss leaders to attract customers intotheir stores.
What is the availability of infant formula products from the major manufacturers bymarket area?
Infant formulas manufactured by Mead Johnson, Ross, and Carnation are widely avail-able in supermarkets throughout the United States. Formula manufactured by Wyeth andmarketed by PBM Products, usually at relatively low retail prices, is available in somesupermarkets in most areas of the country.
Is the retail price of formula that is included in the WIC rebate program greater thanformula that is not included in the WIC rebate program?
Retail prices of infant formula vary widely across geographic areas. Within marketareas, there is not a clear and consistent relationship between a formula being the WICcontract brand and that formula being sold at the highest average retail price.
What effect does being the WIC contract brand have on the retail price of infant formula?
A study of retail prices before and after a change in the WIC contract holder showed thatafter such a change, the retail price of the new contract brand of formula increased morethan that of the old contract holder and the other brands of formula. This finding suggeststhat being the contract brand of formula results in higher retail prices. This general resultof higher prices—but not necessarily the highest price—was robust across all product
iv ● WIC and the Retail Price of Infant Formula / FANRR-39 Economic Research Service/USDA
bases and all physical forms of formula. A multivariate regression analysis examined retailprices while controlling for a variety of economic, demographic, and WIC program fac-tors. Results showed that a manufacturer’s brand of formula had a higher retail price, fora given wholesale price, if that brand was the WIC contract brand. The use of two differ-ent analytical approaches that produced comparable findings provides stronger, more cred-ible results.
Does the size of the WIC program affect the retail price of infant formula?
A multivariate regression analysis showed that the greater the relative size of the WICprogram in the State, as measured by the ratio of WIC formula feeders to non-WIC for-mula feeders, the greater the retail price of both the contract and noncontract brands offormula, holding other factors constant. This result held across nearly all brands andtypes of infant formula. Increasing the prevalence of breastfeeding among WIC motherswould decrease the relative size of the WIC program, thereby resulting in lower retailprices of infant formula.
In conclusion, supermarket prices of infant formula in a market area depend on a number ofeconomic, demographic, and WIC program factors. WIC and its infant formula rebate program eachtend to modestly increase the supermarket price of infant formula for non-WIC consumers, for givenwholesale prices. The infant formula rebate program affects retail prices due to the designation of asingle brand of formula as the contract brand (i.e., sole sourcing). The WIC program also affectsretail infant formula prices through changes in WIC’s size as measured by the number of formula-fed WIC infants relative to formula-fed non-WIC infants. An increase in the relative size of the WICprogram tends to result in higher retail prices.
Accordingly, States with a high percentage of formula-fed infants in WIC had higher prices (otherfactors equal) with the amount of the increase depending on type and brand of formula consumed.For example, when moving from an area where WIC infants account for half of all formula-fedinfants to an area where they account for two-thirds, a family with a typical 12-pound formula-fedinfant has monthly expenditures (for milk-based formula) that increase by about $3 to $5 for contractbrands of formula and about $1 to $4 for noncontract brands. No evidence was found that suggeststhat rebate levels affect retail markups. A full discussion of the price effects on non-WIC consumersdue to WIC and its infant formula rebate program should consider that over one out of every fourparticipants in the WIC program (i.e., almost 2 million people per month in fiscal 2000) is servedwith rebate money. Furthermore, recent legislative changes provide USDA with enhanced control ofthe prices WIC vendors charge for the contract brand of infant formula.
Economic Research Service/USDA WIC and the Retail Price of Infant Formula / FANRR-39 ● v
Definitions
Infant formula: defined in the Federal Food, Drug, and Cosmetic Act as a food that purports to be oris represented for special dietary use solely as a food for infants by reason of its simulation of humanmilk or its suitability as a complete or partial substitute for human milk (U.S. Code (U.S.C.) 321 (z)).
Exempt infant formula: defined in the Federal Food, Drug, and Cosmetic Act as any infant formulathat is represented and labeled for use by an infant who has an inborn error of metabolism or alow-birth weight, or who otherwise has an unusual medical or dietary problem (U.S.C. 350a).Exempt infant formulas require prescriptions for use in the WIC program and are not covered byrebate contracts.
Standard infant formula: as defined in this report, standard infant formula includes milk-based andsoy-based infant formulas, excluding specialized infant formula, that meet the nutritional needs ofmost full-term, healthy infants less than 1 year old and is not targeted at “special needs.”
Specialized infant formula: as defined in this report, specialized formula is formula for childrenwith special nutritional requirements, such as hypoallergenic formula, thickened formula, formulato treat diarrhea, formula for premature babies, or formula for infants with other diseases or disor-ders such as phenylketonuria (PKU). This category of formula also includes lactose-free (nonsoy)formula, and formula marketed to children 1 year of age or older. Specialized infant formula mayinclude some nonexempt infant formula, such as thickened formula, which does not require aprescription for use in the WIC program and is covered by rebate contracts.
Contract brand: all the infant formula, other than exempt infant formulas, that is produced by themanufacturer awarded the WIC contract. All contract brand formulas are covered by rebatecontracts.
Primary contract brand: the standard infant formula on which bids are solicited.
Manufacturer’s wholesale price: the manufacturer’s lowest national wholesale price per unit for afull truckload of infant formula.
Medical detailing: the manufacturer’s practice of contacting hospitals and medical practitionersdirectly, providing them with free or discounted infant formula, and encouraging physicians torecommend one particular brand of formula (U.S. General Accounting Office, 1990). Medicaldetailing also includes providing hospitals with “discharge packs” containing formula samples,cents-off coupons, and company advertising aimed at mothers when they leave the hospital with theirbabies; such activities may serve as an implicit endorsement of a particular brand of infant formulaby the hospital. Medical detailing also includes other types of support, such as donating equipmentand services to hospitals (e.g., incubators, nursers, calendars, pens, etc.) and providing funding forresearch on infant nutrition to hospitals and physicians.
Retail markup: The difference between the retail price and the wholesale price.
Loss leader: An item priced below cost in order to bring customers into the store.
Relative size of WIC: The number of WIC formula-fed infants relative to the number of non-WICformula-fed infants.
vi ● WIC and the Retail Price of Infant Formula / FANRR-39 Economic Research Service/USDA
Chapter 1
Introduction
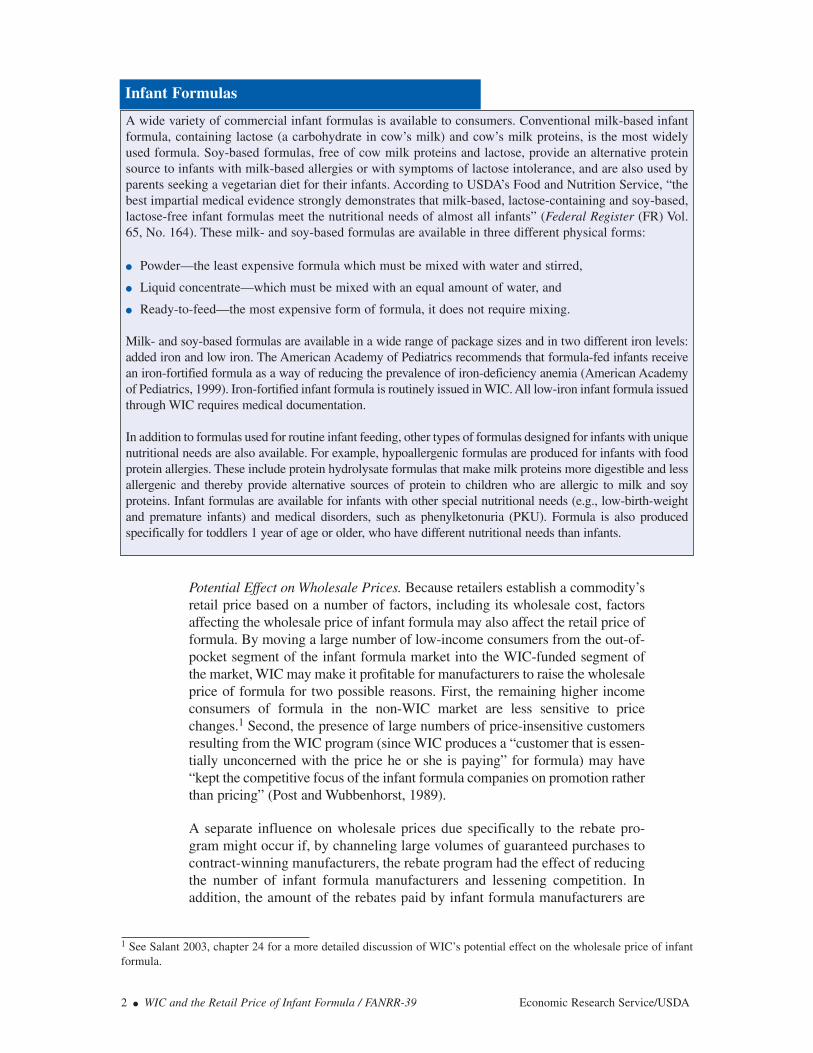
The Special Supplemental Nutrition Program for Women, Infants, and Children (WIC) safeguardsthe health of low-income infants and children under 5 years of age, as well as pregnant, breast-feeding, and postpartum women who are at nutritional risk, by providing a package of supple-mental foods, nutrition education, and health care referrals. On average, 7.5 million people permonth participated in the WIC program in fiscal 2002, including 1.9 million infants or almost halfof all infants in the United States (U.S. Department of Agriculture (USDA), 2003). Although WICencourages mothers to breastfeed if possible, most of these participating infants receive infantformula through WIC (see box “Infant Formulas”).
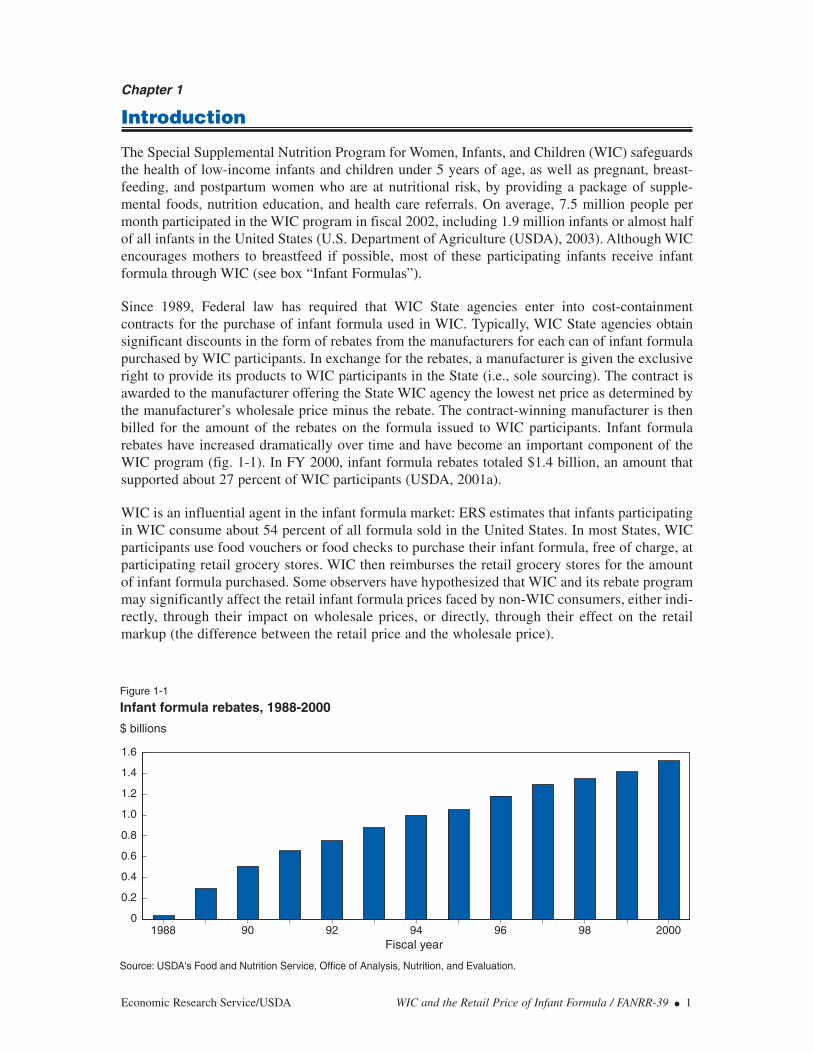
Since 1989, Federal law has required that WIC State agencies enter into cost-containmentcontracts for the purchase of infant formula used in WIC. Typically, WIC State agencies obtainsignificant discounts in the form of rebates from the manufacturers for each can of infant formulapurchased by WIC participants. In exchange for the rebates, a manufacturer is given the exclusiveright to provide its products to WIC participants in the State (i.e., sole sourcing). The contract isawarded to the manufacturer offering the State WIC agency the lowest net price as determined bythe manufacturer’s wholesale price minus the rebate. The contract-winning manufacturer is thenbilled for the amount of the rebates on the formula issued to WIC participants. Infant formularebates have increased dramatically over time and have become an important component of theWIC program (fig. 1-1). In FY 2000, infant formula rebates totaled $1.4 billion, an amount thatsupported about 27 percent of WIC participants (USDA, 2001a).
WIC is an influential agent in the infant formula market: ERS estimates that infants participatingin WIC consume about 54 percent of all formula sold in the United States. In most States, WICparticipants use food vouchers or food checks to purchase their infant formula, free of charge, atparticipating retail grocery stores. WIC then reimburses the retail grocery stores for the amountof infant formula purchased. Some observers have hypothesized that WIC and its rebate programmay significantly affect the retail infant formula prices faced by non-WIC consumers, either indi-rectly, through their impact on wholesale prices, or directly, through their effect on the retailmarkup (the difference between the retail price and the wholesale price).
Economic Research Service/USDA WIC and the Retail Price of Infant Formula / FANRR-39 ● 1
Figure 1-1
Infant formula rebates, 1988-2000
Source: USDA's Food and Nutrition Service, Office of Analysis, Nutrition, and Evaluation.
$ billions
Fiscal year1988 90 92 94 96 98 2000
0
0.2
0.4
0.6
0.8
1.0
1.2
1.4
1.6
Potential Effect on Wholesale Prices. Because retailers establish a commodity’sretail price based on a number of factors, including its wholesale cost, factorsaffecting the wholesale price of infant formula may also affect the retail price offormula. By moving a large number of low-income consumers from the out-of-pocket segment of the infant formula market into the WIC-funded segment ofthe market, WIC may make it profitable for manufacturers to raise the wholesaleprice of formula for two possible reasons. First, the remaining higher incomeconsumers of formula in the non-WIC market are less sensitive to pricechanges.1 Second, the presence of large numbers of price-insensitive customersresulting from the WIC program (since WIC produces a “customer that is essen-tially unconcerned with the price he or she is paying” for formula) may have“kept the competitive focus of the infant formula companies on promotion ratherthan pricing” (Post and Wubbenhorst, 1989).
A separate influence on wholesale prices due specifically to the rebate pro-gram might occur if, by channeling large volumes of guaranteed purchases tocontract-winning manufacturers, the rebate program had the effect of reducingthe number of infant formula manufacturers and lessening competition. Inaddition, the amount of the rebates paid by infant formula manufacturers are
2 ● WIC and the Retail Price of Infant Formula / FANRR-39 Economic Research Service/USDA
Infant Formulas
A wide variety of commercial infant formulas is available to consumers. Conventional milk-based infantformula, containing lactose (a carbohydrate in cow’s milk) and cow’s milk proteins, is the most widelyused formula. Soy-based formulas, free of cow milk proteins and lactose, provide an alternative proteinsource to infants with milk-based allergies or with symptoms of lactose intolerance, and are also used byparents seeking a vegetarian diet for their infants. According to USDA’s Food and Nutrition Service, “thebest impartial medical evidence strongly demonstrates that milk-based, lactose-containing and soy-based,lactose-free infant formulas meet the nutritional needs of almost all infants” (Federal Register (FR) Vol.65, No. 164). These milk- and soy-based formulas are available in three different physical forms:
● Powder—the least expensive formula which must be mixed with water and stirred,
● Liquid concentrate—which must be mixed with an equal amount of water, and
● Ready-to-feed—the most expensive form of formula, it does not require mixing.
Milk- and soy-based formulas are available in a wide range of package sizes and in two different iron levels:added iron and low iron. The American Academy of Pediatrics recommends that formula-fed infants receivean iron-fortified formula as a way of reducing the prevalence of iron-deficiency anemia (American Academyof Pediatrics, 1999). Iron-fortified infant formula is routinely issued in WIC. All low-iron infant formula issuedthrough WIC requires medical documentation.
In addition to formulas used for routine infant feeding, other types of formulas designed for infants with uniquenutritional needs are also available. For example, hypoallergenic formulas are produced for infants with foodprotein allergies. These include protein hydrolysate formulas that make milk proteins more digestible and lessallergenic and thereby provide alternative sources of protein to children who are allergic to milk and soyproteins. Infant formulas are available for infants with other special nutritional needs (e.g., low-birth-weightand premature infants) and medical disorders, such as phenylketonuria (PKU). Formula is also producedspecifically for toddlers 1 year of age or older, who have different nutritional needs than infants.
1 See Salant 2003, chapter 24 for a more detailed discussion of WIC’s potential effect on the wholesale price of infantformula.
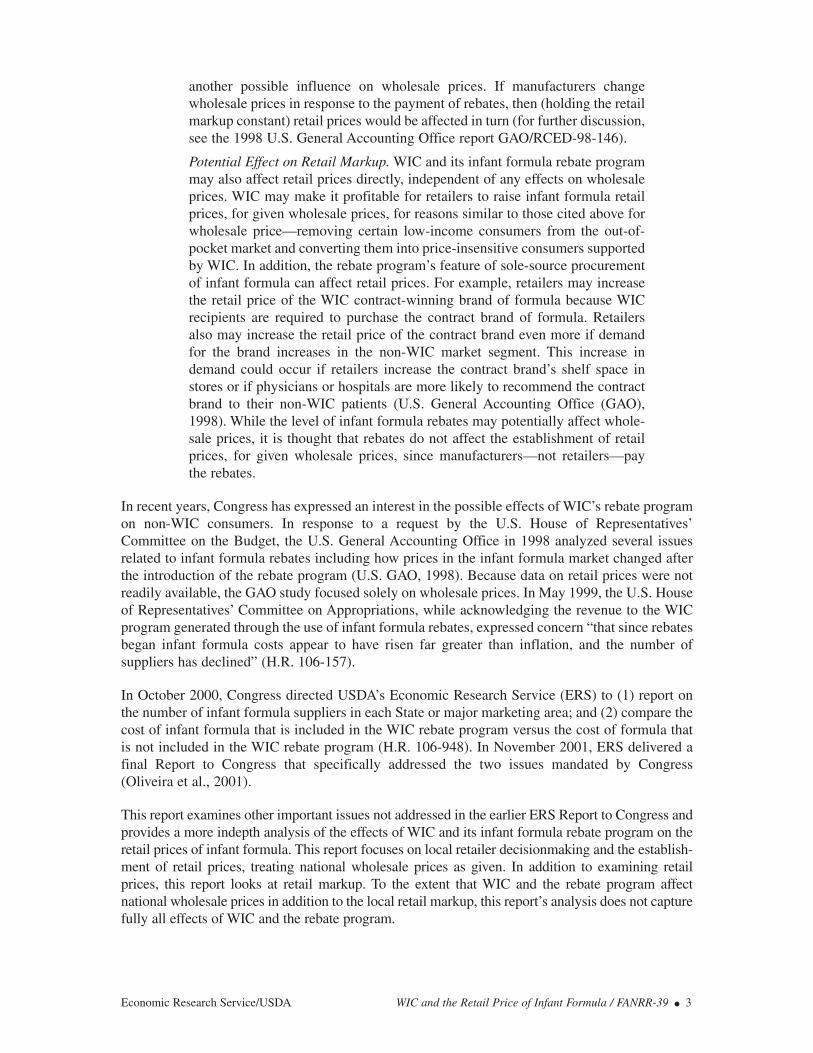
another possible influence on wholesale prices. If manufacturers changewholesale prices in response to the payment of rebates, then (holding the retailmarkup constant) retail prices would be affected in turn (for further discussion,see the 1998 U.S. General Accounting Office report GAO/RCED-98-146).
Potential Effect on Retail Markup. WIC and its infant formula rebate programmay also affect retail prices directly, independent of any effects on wholesaleprices. WIC may make it profitable for retailers to raise infant formula retailprices, for given wholesale prices, for reasons similar to those cited above forwholesale price—removing certain low-income consumers from the out-of-pocket market and converting them into price-insensitive consumers supportedby WIC. In addition, the rebate program’s feature of sole-source procurementof infant formula can affect retail prices. For example, retailers may increasethe retail price of the WIC contract-winning brand of formula because WICrecipients are required to purchase the contract brand of formula. Retailersalso may increase the retail price of the contract brand even more if demandfor the brand increases in the non-WIC market segment. This increase indemand could occur if retailers increase the contract brand’s shelf space instores or if physicians or hospitals are more likely to recommend the contractbrand to their non-WIC patients (U.S. General Accounting Office (GAO),1998). While the level of infant formula rebates may potentially affect whole-sale prices, it is thought that rebates do not affect the establishment of retailprices, for given wholesale prices, since manufacturers—not retailers—paythe rebates.
In recent years, Congress has expressed an interest in the possible effects of WIC’s rebate programon non-WIC consumers. In response to a request by the U.S. House of Representatives’Committee on the Budget, the U.S. General Accounting Office in 1998 analyzed several issuesrelated to infant formula rebates including how prices in the infant formula market changed afterthe introduction of the rebate program (U.S. GAO, 1998). Because data on retail prices were notreadily available, the GAO study focused solely on wholesale prices. In May 1999, the U.S. Houseof Representatives’ Committee on Appropriations, while acknowledging the revenue to the WICprogram generated through the use of infant formula rebates, expressed concern “that since rebatesbegan infant formula costs appear to have risen far greater than inflation, and the number ofsuppliers has declined” (H.R. 106-157).
In October 2000, Congress directed USDA’s Economic Research Service (ERS) to (1) report onthe number of infant formula suppliers in each State or major marketing area; and (2) compare thecost of infant formula that is included in the WIC rebate program versus the cost of formula thatis not included in the WIC rebate program (H.R. 106-948). In November 2001, ERS delivered afinal Report to Congress that specifically addressed the two issues mandated by Congress(Oliveira et al., 2001).
This report examines other important issues not addressed in the earlier ERS Report to Congress andprovides a more indepth analysis of the effects of WIC and its infant formula rebate program on theretail prices of infant formula. This report focuses on local retailer decisionmaking and the establish-ment of retail prices, treating national wholesale prices as given. In addition to examining retailprices, this report looks at retail markup. To the extent that WIC and the rebate program affectnational wholesale prices in addition to the local retail markup, this report’s analysis does not capturefully all effects of WIC and the rebate program.
Economic Research Service/USDA WIC and the Retail Price of Infant Formula / FANRR-39 ● 3

Because the report is an extension of the earlier congressionally mandated study, results from theReport to Congress are contained in this report, along with the results from the latter analyses.Specifically, this report examines the following eight issues:
What are the recent trends in the infant formula market?The report examines the infant formula market in terms of the types, amounts, and pricesof formula sold, and how it has changed in recent years.
Has the number of infant formula suppliers decreased since WIC’s infant formula rebateprogram began?Congress has expressed concern that the WIC rebate program has brought about adecrease in the number of infant formula suppliers.
Have infant formula prices increased faster than inflation in recent years?Congress also expressed concern that the WIC rebate program may have led to anincrease in the real (i.e., inflation-adjusted) cost of infant formula to consumers.
Does the retail markup differ by brand and by type of infant formula?Because retail price is the sum of an item’s wholesale price and its retail markup, thereport calculates the amount of the retail markup for each of the major types of infantformula, by brand.
What is the availability of infant formula products from the major manufacturers in dif-ferent market areas?The local availability of different infant formula brands directly affects the choices avail-able to consumers in a market area.
Is the retail price of infant formula that is included in the WIC rebate program greaterthan the price of formula that is not included in the WIC rebate program? Congress is concerned that non-WIC consumers may be paying a higher price for for-mula that is included in the rebate program relative to formula not included in the rebateprogram.
What effect does contract brand status have on the retail price of infant formula? This report uses two different methodologies—an event study analysis and a multivari-ate regression analysis—to determine if winning a State’s WIC infant formula contractresults in higher retail prices for the new contract brand of formula. The event studyanalysis compares prices before and after changes in the contract brand in various mar-ket areas between 1994 and 2000. The multiple regression analysis examines the priceeffects of contract brand status simultaneously with the effects of other price-determin-ing variables.
Does the size of the WIC program affect the retail price of infant formula?The multivariate regression analysis also examines retail price effects that are associatedwith the size of a State’s WIC program, as measured by the ratio of WIC infants to non-WIC infants who use infant formula.
The main focus of this report is to provide answers to these last two questions, both of which dealwith identifying the effects that the WIC program and its infant formula rebate program have onthe retail prices of formula. This report is the most comprehensive national study to analyze pricesof infant formula at the retail level; most of the previous work examined wholesale infant formula
4 ● WIC and the Retail Price of Infant Formula / FANRR-39 Economic Research Service/USDA

prices (for example, see U.S. GAO, 1998). By using scanner-based retail sales data, this studyexamines directly the infant formula prices faced by non-WIC consumers and the pricing behaviorof retailers for a given set of wholesale prices.
The next several chapters provide readers with background information on the WIC program(chapter 2), WIC’s infant formula rebate program (chapter 3), the domestic infant formula market(chapter 4), and the primary data set used in the analysis (chapter 5). Recent trends in the infantformula market are examined in chapter 6. Chapter 7 responds specifically to the directives made byCongress. Chapters 8 and 9 present the main empirical analyses of the report—an event studyanalysis and a multivariate regression analysis. The major implications of the analyses are discussedin chapter 10 while chapter 11 summarizes the study’s major findings. Appendix A presents a historyof WIC’s infant formula rebate system and appendix B contains tables providing detailed informa-tion on the event study analysis. Detailed information regarding the regression model used in theanalysis of retail infant formula prices is presented in appendices C through E.
Economic Research Service/USDA WIC and the Retail Price of Infant Formula / FANRR-39 ● 5
Chapter 2
Overview of the WIC Program
WIC was created as a 2-year pilot program in 1972 by an amendment to the Child Nutrition Act of1966 (Public Law 92-433). The program was made permanent in 1975 by P.L. 94-105, which statesthat “Congress finds that substantial numbers of pregnant women, infants, and young children are atspecial risk in respect to their physical and mental health by reason of poor or inadequate nutrition orhealth care, or both.” WIC is based on the premise that early intervention programs during criticaltimes of growth and development can help prevent future medical and developmental problems.Administered by USDA’s Food and Nutrition Service (FNS), the program currently provides grantsfor supplemental foods, nutrition services, and administration to 88 WIC State agencies, including the50 States, the District of Columbia, Guam, the U.S. Virgin Islands, American Samoa, the Common-wealth of Puerto Rico, and 33 Indian Tribal Organizations.
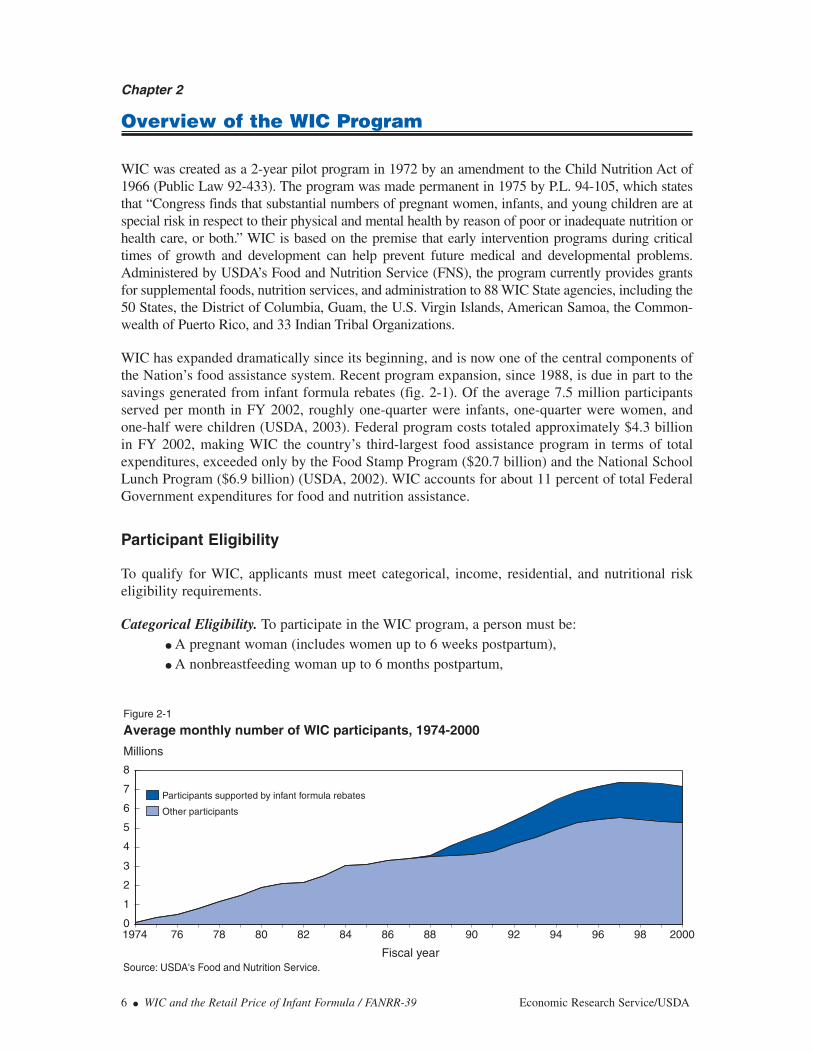
WIC has expanded dramatically since its beginning, and is now one of the central components ofthe Nation’s food assistance system. Recent program expansion, since 1988, is due in part to thesavings generated from infant formula rebates (fig. 2-1). Of the average 7.5 million participantsserved per month in FY 2002, roughly one-quarter were infants, one-quarter were women, andone-half were children (USDA, 2003). Federal program costs totaled approximately $4.3 billionin FY 2002, making WIC the country’s third-largest food assistance program in terms of totalexpenditures, exceeded only by the Food Stamp Program ($20.7 billion) and the National SchoolLunch Program ($6.9 billion) (USDA, 2002). WIC accounts for about 11 percent of total FederalGovernment expenditures for food and nutrition assistance.
Participant Eligibility
To qualify for WIC, applicants must meet categorical, income, residential, and nutritional riskeligibility requirements.
Categorical Eligibility. To participate in the WIC program, a person must be:● A pregnant woman (includes women up to 6 weeks postpartum),● A nonbreastfeeding woman up to 6 months postpartum,
6 ● WIC and the Retail Price of Infant Formula / FANRR-39 Economic Research Service/USDA
Figure 2-1
Average monthly number of WIC participants, 1974-2000
Source: USDA's Food and Nutrition Service.
Millions
Fiscal year
Other participants
Participants supported by infant formula rebates
1974 76 78 80 82 84 86 88 90 92 94 96 98 20000
1
2
3
4
5
6
7
8
● A breastfeeding woman up to 1 year postpartum,● An infant under 1 year of age, or ● A child up to his/her fifth birthday.
Income Eligibility. The family income of WIC applicants must meet specified guidelines.1 All Statescurrently set the income cutoff at the maximum 185 percent of the Federal poverty line ($31,543 fora family of four in July 2000). Applicants who participate in or who have certain family members whoparticipate in the Food Stamp, Medicaid, or Temporary Assistance for Needy Families (TANF)programs are adjunctively income eligible; that is, they are deemed to meet the income eligibilitycriteria automatically.2
Residential Eligibility. The applicants must reside in the State in which they apply.
Nutritional Risk. Applicants must be at nutritional risk, as determined by a health professionalsuch as a physician, nutritionist, or nurse. Federal regulations recognize five major types of nutri-tional risk for WIC eligibility:
(1) detrimental or abnormal nutritional conditions detectable by biochemical oranthropometric measurements,
(2) other documented nutritionally related medical conditions,
(3) dietary deficiencies that impair or endanger health,
(4) conditions that directly affect the nutritional health of a person, including alcoholism or drug abuse, and
(5) conditions that predispose persons to inadequate nutritional patterns or nutri-tionally related medical conditions, including, but not limited to, homelessnessand migrancy (7 Code of Federal Regulations (CFR) 246.2).
Participant Benefits
The WIC program offers three types of benefits to participants: a supplemental food package,nutrition education, and referrals to health and other services.
Supplemental Food Package. WIC provides participants with supplemental foods that are high in fivetarget nutrients—protein, calcium, iron, and vitamins A and C. These nutrients are frequently lackingin the diets of the program’s target population, which may result in adverse health consequences.There are seven different food packages, based on the category of the participant, as follows:
(1) infants through 3 months old,(2) infants 4-12 months old,(3) children 1-4 years old,(4) pregnant and breastfeeding women (basic),(5) nonbreastfeeding postpartum women,
Economic Research Service/USDA WIC and the Retail Price of Infant Formula / FANRR-39 ● 7
1 WIC regulations state that the maximum allowable family gross income (i.e., before taxes are withheld) must not exceedthe guidelines for reduced-price school meals, which are 185 percent of the U.S. Poverty Income Guidelines (7 CFR 246.7).State agencies may set the income guidelines equal to State or local guidelines for free or reduced-price health care, as longas they are equal to or less than 185 percent of the poverty guidelines and greater than 100 percent of the poverty guide-lines.2 In April 1998, about half of all WIC participants also participated in at least one of these three programs (Bartlett etal., 2000).
(6) breastfeeding women (enhanced), and (7) children or women with special dietary needs.
WIC supplemental foods include iron-fortified infant and adult cereal, vitamin C-rich fruit and/orvegetable juice, eggs, milk, cheese, peanut butter, tuna fish, carrots, and dried beans or peas, in addi-tion to iron-fortified infant formula.3 Exempt infant formulas and certain medical foods may also beprovided by the WIC food package when prescribed by a physician or health professional for aspecific medical condition.4 Breastfeeding women whose infants do not receive formula from WICcan receive an enhanced food package that includes tuna and carrots in addition to other WIC foods.
Nutrition Education. WIC makes nutrition education, including breastfeeding promotion andsupport, available to all participants (or to the parents or caretakers of infant or child participants).The nutrition education is designed to achieve two broad goals:
(1) to stress the relationship between proper nutrition and good health and raiseawareness about the dangers of using drugs and other harmful substances, and
(2) to assist the nutritionally at-risk individual in achieving a positive change infood habits, resulting in improved nutritional status and in the prevention ofnutrition-related problems through the use of the supplemental foods and othernutritious foods (7 CFR 246.11).
Local WIC agencies are required to offer participants at least two nutrition education sessions duringeach 6-month period, in either an individual or a group setting. However, individuals who do notattend the nutrition education activities are not denied the WIC food package.
Referrals to Health Care and Social Services. WIC was designed to operate as an adjunct tohealth care. Local WIC agencies assist WIC participants in obtaining health care and social serv-ices (such as food stamps, Medicaid, immunizations, etc.), either through onsite health services orreferrals to other agencies.
Food Delivery Systems
To provide program participants with supplemental food packages, the States may use three typesof food delivery systems (or any combination of the three):
● Retail food delivery systems—participants obtain supplemental food by transact-ing a food instrument (e.g., check or voucher) at authorized retail vendors.
● Home food delivery systems—supplemental foods are delivered to the participant’shome.
● Direct distribution food delivery systems—participants pick up supplementalfoods from storage facilities operated by the State or local agency.
8 ● WIC and the Retail Price of Infant Formula / FANRR-39 Economic Research Service/USDA
3 The maximum monthly allowance for food package I—infants 0-3 months—is 403 fluid ounces of concentrated liq-uid infant formula (powdered or ready-to-feed formula may be substituted at specified rates). The maximum monthlyallowance for food package II—infants 4-12 months—is the same as that for package I with the addition of 96 fluidounces of reconstituted fruit juice and 24 ounces of infant cereal. 4 Exempt infant formula is defined in the Federal Food, Drug, and Cosmetic Act as any infant formula that is representedand labeled for use by an infant who has an inborn error of metabolism or a low-birth weight, or who otherwise has anunusual medical or dietary problem.
The vast majority of WIC participants receive their supplemental foods via retail food deliverysystems. Under the retail food delivery system, WIC State agencies issue food instruments toparticipants, who then transact the food instruments for specific supplemental foods at authorizedretail vendors (e.g., grocery stores). The food instrument specifies the type and amount of supple-mental foods that can be obtained. Only those vendors who are authorized by the WIC Stateagency may transact and redeem food instruments. WIC State agencies develop the criteria forselecting vendors. However, the selection criteria must include four mandatory criteria:
(1) the WIC State agency must consider the prices a vendor applicant charges forWIC foods as compared with the prices charged by other applicants andauthorized vendors,
(2) the WIC State agency must establish minimum requirements for the varietyand quantity of supplemental foods that a vendor must stock to be authorized,
(3) the WIC State agency must consider the business integrity of a vendor appli-cant, and
(4) the WIC State agency may not authorize an applicant vendor that is disquali-fied from the Food Stamp Program or that has been assessed a Food StampProgram disqualification or civil money penalty for hardship, unless it wouldresult in inadequate participant access (7 CFR 246.2).
During FY 2000, 49,682 vendors were authorized by the WIC program nationwide (U.S. Depart-ment of Agriculture, 2001c). The vast majority of these vendors were either supermarkets orgrocery stores. In addition, about 6 percent of WIC authorized stores were pharmacies that werenot operated as part of a retail store.5 Outlets such as Wal-Mart that contain grocery stores may beauthorized as WIC vendors provided that they meet the State agency’s vendor selection criteria,including the criteria for minimum variety and quantity of WIC supplemental foods.
WIC Funding and Cost-Containment Measures
WIC is a discretionary grant program funded annually at a specific grant level determined byappropriations law. Therefore, the number of participants that can be served depends upon theannual Congressional appropriation as well as the cost of operating the program.6,7 In the eventWIC does not have the funds to enroll all eligible applicants, WIC developed a priority system inorder to ensure that those persons at the greatest nutrition risk receive program benefits. Expan-sion of the WIC program during the 1990s allowed a greater number of lower priority applicantsto participate, and the role of the priority system in allocating available program slots among appli-cants decreased in importance relative to previous years when program funds were more limited.Anecdotal evidence suggests that in recent years nearly everyone who was eligible and whoapplied for the program has been able to participate.
Because program funding is a fixed level, cost-containment practices allow WIC to maximize thenumber of applicants it can enroll. The WIC State agencies use a variety of cost-containment prac-tices in addition to infant formula rebates, including rebate systems for other foods, such as infant
Economic Research Service/USDA WIC and the Retail Price of Infant Formula / FANRR-39 ● 9
5 Typically, these pharmacy vendors only provide exempt infant formula and WIC-eligible medical foods. However,some State agencies allow pharmacy vendors to transact and redeem food instruments for all infant food packages,including infant formula (USDA, 2001b). 6 By contrast, the Food Stamp Program is an entitlement program whereby everyone who meets the eligibility criteriamay receive benefits if they so choose. 7 Although there is no requirement for State matching funds, some States use their own funds to supplement the Federal grant.
cereal and infant fruit juice.8 However, savings from rebates for other food products are muchlower than for infant formula in part because no other single product accounts for as large a portionof WIC costs as infant formula and because the market characteristics of other products make itunlikely that manufacturers would offer large rebates per item (U.S. GAO, 1998).9
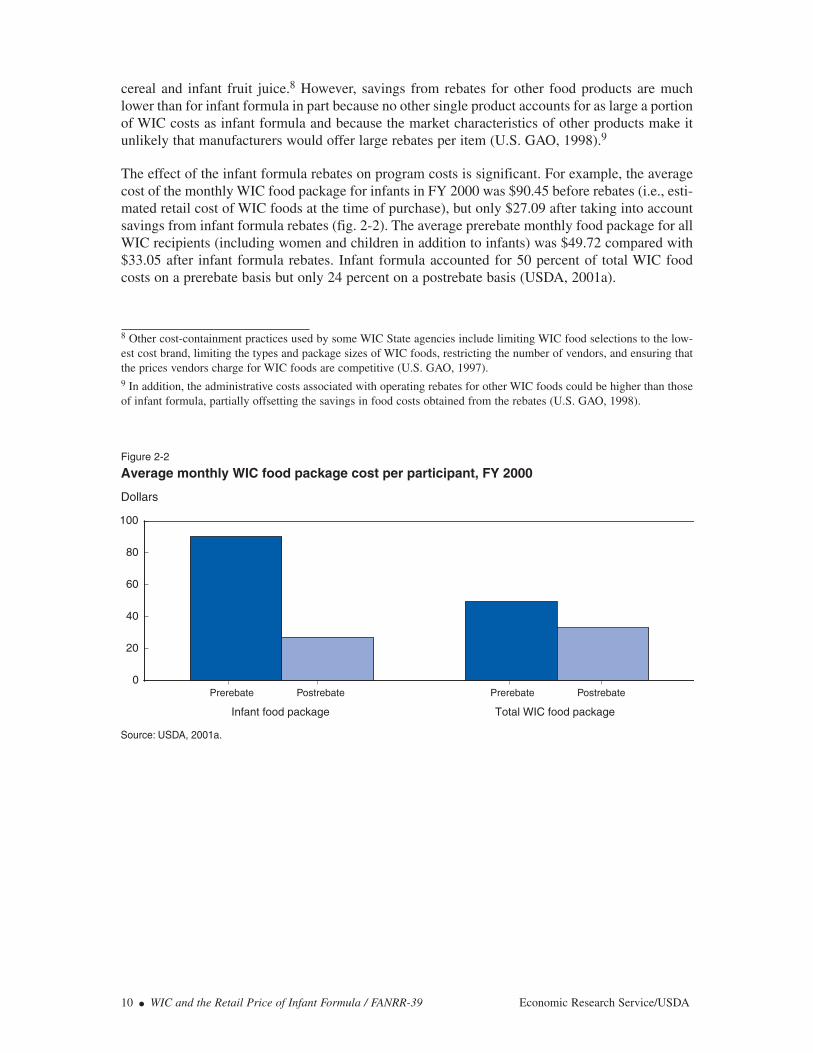
The effect of the infant formula rebates on program costs is significant. For example, the averagecost of the monthly WIC food package for infants in FY 2000 was $90.45 before rebates (i.e., esti-mated retail cost of WIC foods at the time of purchase), but only $27.09 after taking into accountsavings from infant formula rebates (fig. 2-2). The average prerebate monthly food package for allWIC recipients (including women and children in addition to infants) was $49.72 compared with$33.05 after infant formula rebates. Infant formula accounted for 50 percent of total WIC foodcosts on a prerebate basis but only 24 percent on a postrebate basis (USDA, 2001a).
10 ● WIC and the Retail Price of Infant Formula / FANRR-39 Economic Research Service/USDA
8 Other cost-containment practices used by some WIC State agencies include limiting WIC food selections to the low-est cost brand, limiting the types and package sizes of WIC foods, restricting the number of vendors, and ensuring thatthe prices vendors charge for WIC foods are competitive (U.S. GAO, 1997).9 In addition, the administrative costs associated with operating rebates for other WIC foods could be higher than thoseof infant formula, partially offsetting the savings in food costs obtained from the rebates (U.S. GAO, 1998).
Source: USDA, 2001a.
Figure 2-2
Average monthly WIC food package cost per participant, FY 2000
Dollars
PostrebatePrerebate
Infant food package Total WIC food package
0
20
40
60
80
100
PostrebatePrerebate

Chapter 3
The WIC Infant Formula Rebate Program
In the mid-1980s, infant formula accounted for nearly 40 percent of total WIC food costs andinfant formula retail prices were rising more quickly than prices for other foods (U.S. GAO, 1990).These factors led Tennessee and other States to look into cost-containment practices to reduceinfant formula costs. In 1987, Tennessee became the first State to initiate a rebate contract systemand other States followed soon after.1 In 1989, P.L. 101-147 required State WIC agencies to usecompetitive bidding—or an alternate method that would yield savings equal to or greater thanthose produced by competitive bidding—to procure infant formula.
Current Federal regulations specify that all WIC State agencies must operate a cost-containmentsystem for the procurement of infant formula except those States with home delivery or directdistribution food delivery systems or Indian State agencies with 1,000 or fewer participants (7CFR 246.16a). Those State agencies required to operate a cost-containment system for infantformula must use a sole-source (i.e., single supplier) competitive system unless an alternativesystem provides savings equal to or greater than a sole-source competitive system.2 Under thesole-source competitive system, a WIC State agency uses competitive bidding to award a contractto a manufacturer of infant formula in exchange for a rebate for each can of infant formula that isissued to WIC participants. (The State agency issues only the contract brand of infant formulaexcept (1) when medical documentation supports the use of a noncontract brand of infant formula;or (2) if a noncontract brand of formula is needed for religious reasons.)3 As a result, the brand ofinfant formula provided by WIC will vary by State according to which manufacturer holds thecontract for that State. Generally, infant formula rebate contracts are for 3 years.
At the WIC State agency’s option, solicitation for bids under the sole-source competitive systemcan take one of two forms: single solicitation or separate solicitations. Under single solicitation,the request for bids is for a single iron-fortified milk-based infant formula that is suitable forroutine issuance to the majority of generally healthy, full-term infants.4 This formula is referred toas the primary contract brand infant formula. The primary contract brand infant formula must beoffered in all physical forms—liquid concentrate, powdered, and ready-to-feed—and it cannot bean exempt infant formula, which is defined as any formula that is represented and labeled for useby an infant who has an inborn error of metabolism or a low birth weight, or who otherwise hasan unusual medical or dietary problem (exempt infant formula is not required to have a rebate).Manufacturers who submit bids for the WIC contract are required to specify a rebate amount forthe primary contract brand infant formula for each of the three physical forms of infant formula.
The sole-source contract is awarded to the bidder offering the lowest total monthly net price, asdetermined by the submission of sealed bids, for a standardized amount of the primary contractbrand infant formula by physical form.5 WIC regulations define net price as the difference between
Economic Research Service/USDA WIC and the Retail Price of Infant Formula / FANRR-39 ● 11
1 See appendix A for a more detailed discussion of the history of the infant formula rebate program. 2 An interim rule, effective October 2000, strengthened and simplified the requirements for operating a sole-sourceinfant formula rebate system (FR, Vol. 65, No. 164). 3 GAO (2003) estimated that 90.3 percent of all WIC infants using formula in fiscal year 2002 received the contractbrand. 4 Only iron-fortified infant formulas are authorized for use in the WIC program.5 WIC State agencies can elect to award the WIC contract to the bidder offering the highest monthly rebate if theweighted average of retail prices for different brands of infant formula in the State vary by 5 percent or less.
an infant formula manufacturer’s lowest national wholesale price per unit for a full truckload ofinfant formula and the rebate level offered by the manufacturer.
All the different types of infant formula (except exempt infant formula) produced by the contract-winning manufacturer are referred to as contract brand infant formula. Under single solicitation,the winning bidder is required to supply and provide rebates for all the different types of contractbrand infant formula the WIC State agency chooses to issue, such as lactose-free formula andformula for older infants. Contract-winning manufacturers that do not produce soy-based infantformulas must subcontract with another manufacturer to supply a soy-based infant formula underthe contract. The amount of the rebate on the contract brand infant formula is based on the samepercentage discount for the particular physical form of the primary contract brand infant formula.For example, if the rebate offered for the primary contract brand of powdered infant formula was85 percent of the manufacturer’s wholesale price, then the rebate for all other powdered forms ofthe contract brand infant formula would also be 85 percent of its wholesale price.
Under the process of separate solicitations, solicitations for bids are issued for milk-based and soy-based infant formulas separately. Separate solicitations may increase competition for WIC contractsby allowing new or smaller infant formula manufacturers with a limited product line to bid oncontracts (FR, Vol. 65, No. 164). Although States have awarded contracts to two different manufac-turers in the past (i.e., one manufacturer held the milk-based contract and another manufacturer heldthe soy-based contract), in 2000, only one manufacturer in each State held the WIC contract.
The WIC State agency may choose to issue all or some of the different types of contract brandinfant formula. Any noncontract brand of infant formula (including exempt infant formulas andformulas not manufactured by the WIC contract manufacturer) may be issued only with medicaldocumentation (provided by a licensed health care professional authorized to write medicalprescriptions under State law) that an infant has a condition that dictates the formula’s use.6 TheWIC State agency does not receive rebates from noncontract brand infant formula.
The WIC program usually issues infant formula to WIC participants in powdered or liquidconcentrate forms. However, formula may be issued in ready-to-feed form in special situations,such as when the participant’s household does not have an adequate and safe water supply orrefrigeration, or if the person caring for the participant may have difficulty in correctly dilutingconcentrated liquid or powdered forms of infant formula.
As noted, most WIC participants receive food instruments, such as vouchers, that they transact forthe contract brand of infant formula at authorized retailers. The WIC State agency then reimbursesthe vendor for the full retail price of the infant formula. The State agency, or the State agency’sfinancial institution, then bills the contract-winning manufacturer for the rebate agreed to in thecontract. As a result, the actual cost of infant formula to the State WIC agency equals the retailcost minus the amount of the manufacturer’s rebate.7
In fiscal year 2000, 67 of the 88 WIC State agencies operated a competitive sole-source rebatesystem in conjunction with a retail food delivery system. The exceptions were Vermont, whichused a home delivery system; Mississippi and parts of Chicago, which used a direct distributionsystem; and 19 Indian Tribal State agencies with participation of less than 1,000, which either
12 ● WIC and the Retail Price of Infant Formula / FANRR-39 Economic Research Service/USDA
6 The only exception to this rule is that local WIC agencies may issue noncontract brand infant formula without med-ical documentation in order to accommodate religious eating patterns (FR, Vol. 65, No. 164). 7 The net price, as defined in a WIC infant formula rebate contract, is wholesale price minus the rebate. Because theretail price is wholesale price plus the retail markup, the cost of infant formula to the WIC program—retail price minusthe rebate—differs from the net price received by the manufacturer by the amount of the retail markup.
did not operate a cost-containment system for infant formula or else used a cost-containmentprocedure other than a competitive sole-source rebate system. Of the programs using retail fooddelivery systems, 7 were multi-State systems, involving 40 WIC State agencies. Under thesesystems, WIC State agencies join together in a single rebate agreement to obtain infantformula.8 In this way, WIC State agencies with small- to medium-size populations can pool theirbuying power to leverage higher rebate levels (Liu, 1991).
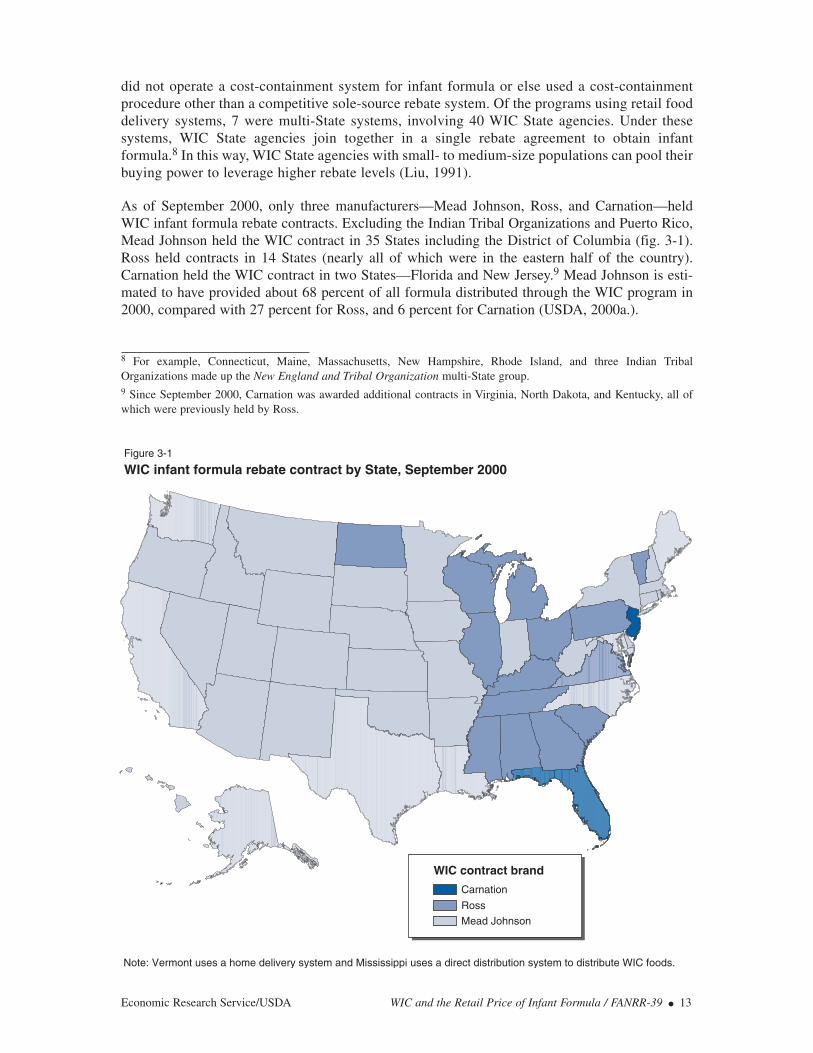
As of September 2000, only three manufacturers—Mead Johnson, Ross, and Carnation—heldWIC infant formula rebate contracts. Excluding the Indian Tribal Organizations and Puerto Rico,Mead Johnson held the WIC contract in 35 States including the District of Columbia (fig. 3-1).Ross held contracts in 14 States (nearly all of which were in the eastern half of the country).Carnation held the WIC contract in two States—Florida and New Jersey.9 Mead Johnson is esti-mated to have provided about 68 percent of all formula distributed through the WIC program in2000, compared with 27 percent for Ross, and 6 percent for Carnation (USDA, 2000a.).
Economic Research Service/USDA WIC and the Retail Price of Infant Formula / FANRR-39 ● 13
Figure 3-1
WIC infant formula rebate contract by State, September 2000
Carnation
Ross
Mead Johnson
WIC contract brand
Note: Vermont uses a home delivery system and Mississippi uses a direct distribution system to distribute WIC foods.
8 For example, Connecticut, Maine, Massachusetts, New Hampshire, Rhode Island, and three Indian TribalOrganizations made up the New England and Tribal Organization multi-State group. 9 Since September 2000, Carnation was awarded additional contracts in Virginia, North Dakota, and Kentucky, all ofwhich were previously held by Ross.
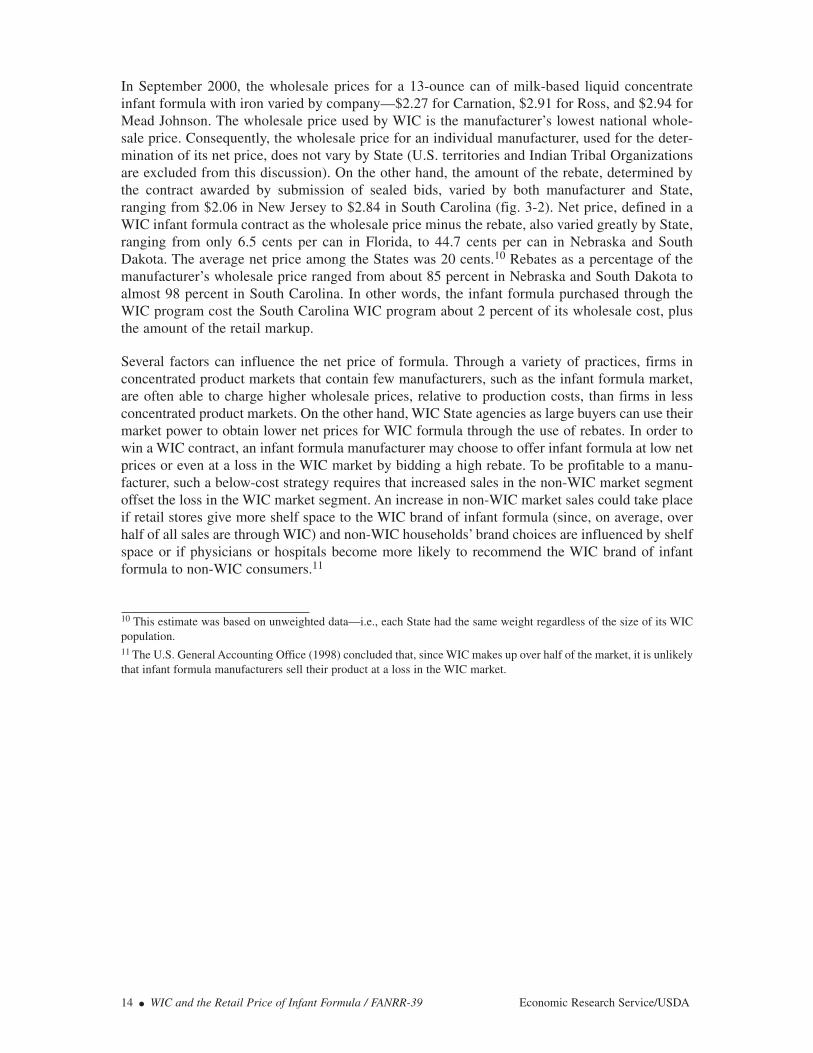
In September 2000, the wholesale prices for a 13-ounce can of milk-based liquid concentrateinfant formula with iron varied by company—$2.27 for Carnation, $2.91 for Ross, and $2.94 forMead Johnson. The wholesale price used by WIC is the manufacturer’s lowest national whole-sale price. Consequently, the wholesale price for an individual manufacturer, used for the deter-mination of its net price, does not vary by State (U.S. territories and Indian Tribal Organizationsare excluded from this discussion). On the other hand, the amount of the rebate, determined bythe contract awarded by submission of sealed bids, varied by both manufacturer and State,ranging from $2.06 in New Jersey to $2.84 in South Carolina (fig. 3-2). Net price, defined in aWIC infant formula contract as the wholesale price minus the rebate, also varied greatly by State,ranging from only 6.5 cents per can in Florida, to 44.7 cents per can in Nebraska and SouthDakota. The average net price among the States was 20 cents.10 Rebates as a percentage of themanufacturer’s wholesale price ranged from about 85 percent in Nebraska and South Dakota toalmost 98 percent in South Carolina. In other words, the infant formula purchased through theWIC program cost the South Carolina WIC program about 2 percent of its wholesale cost, plusthe amount of the retail markup.
Several factors can influence the net price of formula. Through a variety of practices, firms inconcentrated product markets that contain few manufacturers, such as the infant formula market,are often able to charge higher wholesale prices, relative to production costs, than firms in lessconcentrated product markets. On the other hand, WIC State agencies as large buyers can use theirmarket power to obtain lower net prices for WIC formula through the use of rebates. In order towin a WIC contract, an infant formula manufacturer may choose to offer infant formula at low netprices or even at a loss in the WIC market by bidding a high rebate. To be profitable to a manu-facturer, such a below-cost strategy requires that increased sales in the non-WIC market segmentoffset the loss in the WIC market segment. An increase in non-WIC market sales could take placeif retail stores give more shelf space to the WIC brand of infant formula (since, on average, overhalf of all sales are through WIC) and non-WIC households’ brand choices are influenced by shelfspace or if physicians or hospitals become more likely to recommend the WIC brand of infantformula to non-WIC consumers.11
14 ● WIC and the Retail Price of Infant Formula / FANRR-39 Economic Research Service/USDA
10 This estimate was based on unweighted data—i.e., each State had the same weight regardless of the size of its WICpopulation.11 The U.S. General Accounting Office (1998) concluded that, since WIC makes up over half of the market, it is unlikelythat infant formula manufacturers sell their product at a loss in the WIC market.

Economic Research Service/USDA WIC and the Retail Price of Infant Formula / FANRR-39 ● 15
Figure 3-2
AlaskaArizona
ArkansasCaliforniaColorado
ConnecticutDelaware
District of ColumbiaFlorida
GeorgiaHawaiiIdahoIllinois
IndianaIowa
KansasLouisiana
MaineMassachusetts
MarylandMontanaMichigan
MinnesotaMissouri
NebraskaNew Hampshire
New JerseyNew Mexico
New YorkNevada
North CarolinaNorth Dakota
OhioOklahoma
OregonPennsylvania
Puerto RicoRhode Island
South CarolinaSouth Dakota
TennesseeTexas
UtahVirginia
WashingtonWest Virginia
WisconsinWyoming
Alabama
0 0.5 1 1.5 2 2.5 3
Dollars per can of 13-ounce milk-based liquid concentrate
Wholesale price, WIC rebate, and net price of milk-based infant formula by State, September 20001
Notes: Mississippi operates a direct distribution system, Vermont operates a home delivery system, and Kentucky uses a composite price for milk- and soy-based infant formula.
1Net price plus rebate equals the wholesale price.
Net price Rebate
Source: USDA's Food and Nutrition Service, 2000.
Chapter 4
The Domestic Infant Formula Market
The development of the infant formula market has been greatly influenced by the demand forinfant formula. This section describes some of the major factors that have impacted the demandfor formula and the structure of the infant formula market in the United States.
Demand for Infant Formula
Commercially prepared infant formulas in powdered form have been available in the UnitedStates since the late 1800s (Fomon, 2001).1 Prior to 1930, most infants were breastfed throughtheir first year, although many were fed some formula as well, most of which was made in thehome from cow’s milk or, starting in the 1920s, from evaporated milk. Powdered formulaswere appreciably more expensive than these home-prepared formulas and, as a result, the useof commercially prepared formulas was low at the time.
From 1930 to the 1970s, the percentage of breastfed infants in the United States declined andmost children were fed cow’s milk after 6 months of age (Fomon, 2001).2 During the earlyportion of this period, the use of home-prepared formulas exceeded that of commerciallyprepared formulas. However, the use of commercially prepared formulas increased dramati-cally after the introduction of concentrated liquid formulas in 1951, when convenience consid-erations began to outweigh cost considerations. By the late 1950s, liquid concentrate hadbecome the predominant form of commercially made formula (it would remain the predomi-nant form of commercially made formula until the 1990s when powdered formula becamepredominant).3 During the early 1960s, commercially prepared formulas replaced home-prepared formulas as the predominant source of infant formula, due in part to the introductionof iron-fortified formulas in 1959 and the promotion of these formulas by the infant formulaindustry and pediatricians.
The downward trend in breastfeeding reached its nadir in 1971 when fewer than 25 percent ofinfants in the United States were breastfed while in the hospital, and fewer than 6 percent werebreastfed at 5 to 6 months (Martinez and Krieger, 1985). At this time, most of the infants notbreastfeeding were fed commercially prepared formulas until they reached 4 to 6 months ofage and then they were fed cow’s milk, which was considerably less expensive and moreconvenient to use than formula (Fomon, 2001). Breastfeeding rates increased during the rest ofthe 1970s. The increase in breastfeeding decreased the use of commercially prepared formulasamong infants younger than 4 months of age. However, the use of commercially preparedformulas among infants older than 4 months of age rose as cow’s milk was increasingly beingintroduced to infants at later ages, thereby extending the duration of formula use.
Although breastfeeding rates dipped slightly in the 1980s, they increased again during the 1990s.By 2000, 68 percent of mothers initiated breastfeeding in the hospital, and 31 percent of mothers
16 ● WIC and the Retail Price of Infant Formula / FANRR-39 Economic Research Service/USDA
1 The early commercially prepared formulas were milk-based. The first soy-based infant formulas, developed for infantsallergic to cow’s milk, were introduced in 1929 (Fomon, 2001). 2 This decline in breastfeeding has been widely attributed, at least in part, to the concurrent increase in maternal employment. 3 Prior to the early 1970s, the physical properties of powdered formulas were such that they were less readily suspendedin water than today’s powdered form of formulas (Fomon, 2001).
were breastfeeding at 6 months, the highest rates since data were first collected in 1955 (see box“Breastfeeding Rates Among WIC Participants”) (Abbott Laboratories, 2001).4 Although breast-feeding rates have increased in recent years, breastfeeding duration is still generally short—onlya minority of children in the United States are still being breastfed by the time they are 6 monthsold. At the same time, the feeding of cow’s milk continues to occur at later ages (Fomon, 2001).As a result, a large majority of infants in the United States are fed at least some formula.5
Structure of the Infant Formula Market
Although a number of firms manufacturing infant formula appeared during the early 1900s, theirranks were reduced considerably during the 1930s depression (Post and Wubbenhorst, 1989). Itwas not until the baby boom following World War II that the large-scale manufacture of infantformula appeared.
The Infant Formula Act of 1980 (the amendment of the Federal Food, Drug, and Cosmetic Act)had a significant impact on the manufacture of infant formula. The Act provided the legislativebasis for greater regulatory control over the production of infant formula.6 Provisions of the Act(along with 1986 amendments) established minimum (and in some cases maximum) nutrientlevels for infant formula, thereby standardizing its nutritional content to a large degree. The Actalso provided the legislative basis for quality control procedures for producing infant formula andgave the Food and Drug Administration (FDA) the authority to enforce standards for infantformula marketed in the United States.
Even before the WIC infant formula rebate program was implemented, the infant formula industrywas highly concentrated. A small number of manufacturers, usually owned by pharmaceutical compa-nies, produced the vast majority of the infant formula sold in the United States. In 1987, three manu-facturers, all owned by pharmaceutical companies, accounted for 99 percent of the total U.S. marketshare of infant formula:
● Ross Labs, owned by Abbott Laboratories,● Mead Johnson, owned by Bristol-Myers, and ● Wyeth-Ayerst Laboratories, owned by American Home Products (table 4-1).7
The fact that only a few firms were producing infant formula for the U.S. market suggests that thecosts of entering the market were high. One factor that may have contributed to the high cost ofentry is medical detailing. Medical detailing is the manufacturer’s practice of contacting hospitalsand medical practitioners directly, providing them with free or discounted infant formula, andencouraging physicians to recommend one particular brand of formula (U.S. GAO, 1990). Medicaldetailing also includes providing hospitals with “discharge packs” containing formula samples,
Economic Research Service/USDA WIC and the Retail Price of Infant Formula / FANRR-39 ● 17
4 Reasons cited for the continued increase in breastfeeding initiation rates since the early 1970s include the publicationof numerous reports documenting the advantages of breastfeeding, recognition of breastfeeding as the preferred methodof infant feeding from a number of professional societies, the influence of the natural childhood movement whichemphasized breastfeeding, and increased breastfeeding promotion efforts, particularly those conducted through the WICprogram (American Dietetic Association, 1997; Wright and Schanler, 2001).5 Over 80 percent of infants ages 3-11 months of age in 1998 were estimated to be fed at least some formula (includesinfants who were also breastfed) (Fomon, 2001). 6 Congress passed the Act in response to a substantial number of infants having been made seriously ill in 1979 due tothe inadvertent omission of chlorides (an essential nutrient for growth and development) in some infant formula whena manufacturer reformulated several of its infant formula products (FR, Vol. 61, No. 132). 7 All three of these companies entered the infant formula market in the 1920s (Post and Wubbenhorst, 1989).

18 ● WIC and the Retail Price of Infant Formula / FANRR-39 Economic Research Service/USDA
Breastfeeding Rates Among WIC Participants
The American Academy of Pediatrics (AAP) recognizes breastfeeding as the ideal method of feedinginfants and achieving optimal infant and child health, growth, and development (American Academy ofPediatrics, 1997). AAP recommends exclusive breastfeeding for approximately the first 6 months afterbirth and the gradual introduction of iron-enriched foods in the second half of the infant’s first year tocomplement the breast milk diet. Breastfeeding is recommended for at least 12 months and thereafter foras long as mutually desired. Despite the wide acknowledgement of breastfeeding as the best method offeeding most infants, many women do not breastfeed their infants.
Since 1955, the Ross Laboratories Mothers Survey, a large national mail survey of infant feeding practicesconducted by the infant formula manufacturer, has been used to monitor breastfeeding trends in the UnitedStates. From 1990 to 2000, the initiation of breastfeeding (i.e., breastfeeding while in the hospital) increasedby almost 33 percent (see table below). By 2000, 68.4 percent of women were initiating breastfeeding, thehighest rate ever recorded. Rates of breastfeeding infants at 6 months of age increased by 78 percent over thesame period, from about 18 to 31 percent (breastfeeding women included those who breastfed exclusively aswell as those who supplemented breast milk with infant formula or milk from other sources). Despite therecent increases in breastfeeding rates, they remain far below the Healthy People 2010 target that 75 percentof mothers breastfeed their babies during the early postpartum period, 50 percent of mothers breastfeed theirbabies at 6 months of age, and 25 percent of mothers breastfeed their babies at 1 year (U.S. Department ofHealth and Human Services, 2000).
WIC participants showed even greater increases in the prevalence of breastfeeding during the 1990s(mothers who, since the birth of their child, participated in WIC themselves, or whose child participatedin the program, were considered to be WIC participants). The percentage of WIC participants who initi-ated breastfeeding increased by 69 percent from 1990 to 1998, while the percentage who were breast-feeding at 6 months increased by 145 percent. Despite these gains, WIC participants are still less likely tobreastfeed (both in the hospital and when the infants reach 6 months) than non-WIC participants.
Some have questioned whether WIC, by supplying free infant formula, provides an incentive not to breastfeed(the average cash value of the WIC food package received by a nonbreastfeeding postpartum woman and herformula-fed infant is more than three times that received by a breastfeeding woman whose infant does notreceive formula through WIC) (Rossi, 1998). However, historically, the more vulnerable and less affluentgroups of mothers who are more likely to participate in WIC, including mothers who are Black, poor, and havelow education levels, have been less likely to breastfeed their children (Ryan, 1997). Furthermore, through itsnutrition education and breastfeeding promotion programs, the WIC program encourages mothers to breast-feed their infants if possible. Breastfeeding women also have a higher priority for certification into the programthan nonbreastfeeding postpartum women and they are eligible to receive program benefits for up to 1 yearpostpartum (as long as they continue to breastfeed), as opposed to only 6 months of postpartum benefits fornonbreastfeeding women.
Breastfeeding rates by WIC status, 1990-2000
Item 1990 1991 1992 1993 1994 1995 1996 1997 1998 1999 2000
In hospital:All infants 51.5 53.3 54.2 55.9 57.4 59.7 59.2 62.4 64.3 67.2 68.4
By WIC participation status:WIC 33.7 36.9 38.8 41.6 44.3 46.6 46.6 50.4 55.8 56.1 56.8Non-WIC 62.9 65.2 66.4 67.9 68.8 71.0 70.8 73.4 75.2 76.9 77.8
At 6 months:All infants 17.6 18.2 18.9 19.0 19.7 21.6 21.7 26.0 28.6 30.7 31.4
By WIC participation status:WIC 8.2 9.0 10.1 10.8 11.6 12.7 12.9 16.5 18.9 19.9 20.1Non-WIC 23.6 24.6 25.6 25.8 26.5 29.2 29.5 35.5 38.5 40.3 40.7
Source: Abbott Laboratories, 2001.
cents-off coupons, and company advertising aimed at mothers when they leave the hospital withtheir babies; such activities may serve as implicit endorsement of a particular brand of infantformula by the hospital. To the extent that parents of formula-fed infants develop a strong brandloyalty, their responsiveness to price differentials across brands is reduced. Thus, medical detailingmay provide some market power to pharmaceutical companies. According to GAO, the practice ofmedical detailing by the pharmaceutical manufacturers of infant formula may have limited theability of nonpharmaceutical companies to compete in the domestic infant formula market (U.S.GAO, 1990).
The industry’s high concentration may also have been a reflection of high costs due to regulatoryrequirements of the Federal Food, Drug, and Cosmetic Act. For example, the Act requires thatmanufacturers demonstrate that infant formulas new to the U.S. market provide nutrients to theinfant in usable form, and testing of every batch of infant formula to ensure its nutrient composi-tion. The costs associated with meeting these regulatory requirements may increase firm unit costsmore for small firms than large firms.8
The U.S. infant formula market has undergone several changes since 1987, the most important ofwhich has been the introduction of several lower priced infant formulas being marketed directlyto consumers (a marketing strategy that shows that medical detailing is not a necessary conditionto enter the infant formula market). For example, Carnation introduced their infant formula prod-ucts into the U.S. market in 1988.9 Unlike the other major infant formula manufacturers, whichare subsidiaries of pharmaceutical companies, Carnation is a subsidiary of Nestlé, a large Swiss-owned food company. Nestlé markets its formula directly to consumers rather than to medicalprofessionals. Although the wholesale prices of infant formula charged by the other major manu-facturers have historically been very similar, Carnation has offered its product at substantiallylower wholesale prices (fig. 4-1). Carnation has steadily increased its share of the U.S. market overtime: ERS analysis of scanner data indicates that in 2000, Carnation accounted for an estimated12 percent of the market in volume sales.
Economic Research Service/USDA WIC and the Retail Price of Infant Formula / FANRR-39 ● 19
Table 4-1—Share of the U.S. infant formula market by company, 1987, 1994, and 2000
Company 1987 1994 2000
Percent
Ross 55 53 35Mead Johnson 35 27 52Wyeth 9 9 NACarnation NA 7 12Gerber (Mead Johnson) NA 3 NAPBM (Wyeth) NA NA 1
NA=Not applicable.
Notes: Market share was determined by volume of infant formula sold. Companies accounting for less than 1 percent ofthe market are not identified. Infant formula sold under the Gerber name was manufactured by Mead Johnson. Infant for-mula sold by PBM was manufactured by Wyeth.
Sources: Data for 1987 are from U.S. General Accounting Office, 1990. Data for 1994 and 2000 are from ERS analysis ofInfoScan data.
8 A technical point—even if all firms have identical unit cost curves and batch testing raised cost curves for all firms bythe same amount, industry concentration may be increased by testing requirements if the higher level of costs,relative to a (fixed) product demand curve, means that the market could not support as many firms at minimum efficient scale. 9 Carnation had been producing infant formula for the international market for many years prior to this time.
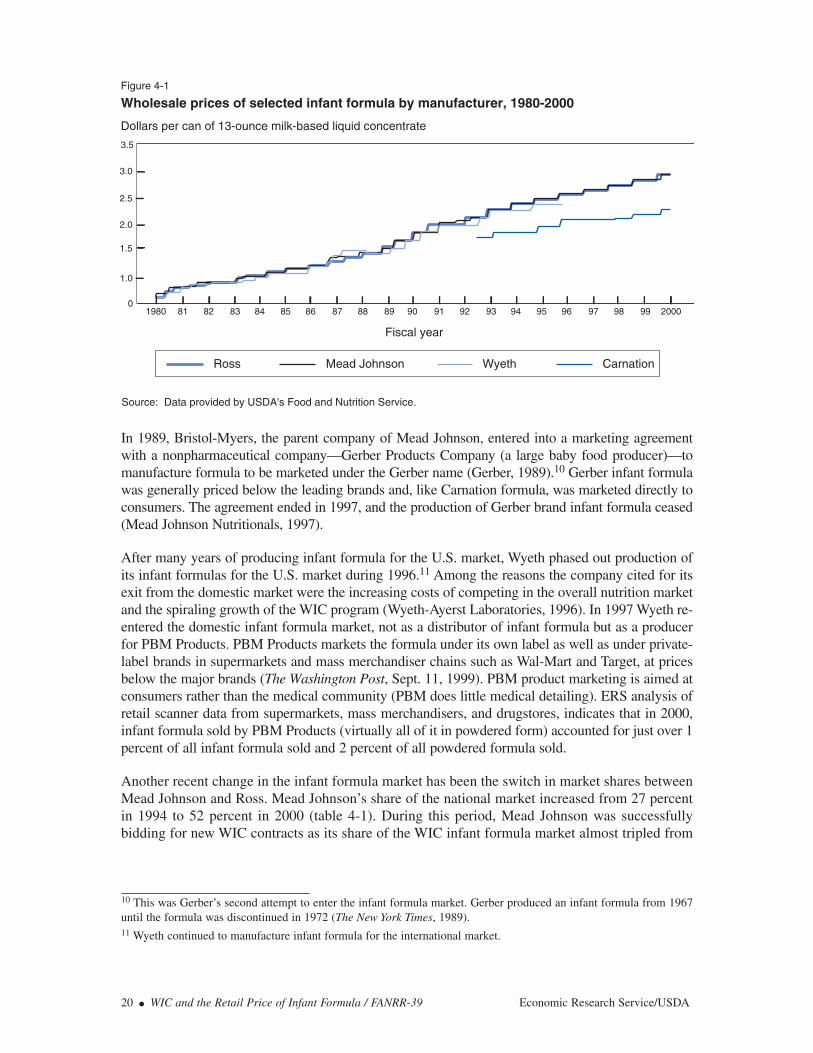
In 1989, Bristol-Myers, the parent company of Mead Johnson, entered into a marketing agreementwith a nonpharmaceutical company—Gerber Products Company (a large baby food producer)—tomanufacture formula to be marketed under the Gerber name (Gerber, 1989).10 Gerber infant formulawas generally priced below the leading brands and, like Carnation formula, was marketed directly toconsumers. The agreement ended in 1997, and the production of Gerber brand infant formula ceased(Mead Johnson Nutritionals, 1997).
After many years of producing infant formula for the U.S. market, Wyeth phased out production ofits infant formulas for the U.S. market during 1996.11 Among the reasons the company cited for itsexit from the domestic market were the increasing costs of competing in the overall nutrition marketand the spiraling growth of the WIC program (Wyeth-Ayerst Laboratories, 1996). In 1997 Wyeth re-entered the domestic infant formula market, not as a distributor of infant formula but as a producerfor PBM Products. PBM Products markets the formula under its own label as well as under private-label brands in supermarkets and mass merchandiser chains such as Wal-Mart and Target, at pricesbelow the major brands (The Washington Post, Sept. 11, 1999). PBM product marketing is aimed atconsumers rather than the medical community (PBM does little medical detailing). ERS analysis ofretail scanner data from supermarkets, mass merchandisers, and drugstores, indicates that in 2000,infant formula sold by PBM Products (virtually all of it in powdered form) accounted for just over 1percent of all infant formula sold and 2 percent of all powdered formula sold.
Another recent change in the infant formula market has been the switch in market shares betweenMead Johnson and Ross. Mead Johnson’s share of the national market increased from 27 percentin 1994 to 52 percent in 2000 (table 4-1). During this period, Mead Johnson was successfullybidding for new WIC contracts as its share of the WIC infant formula market almost tripled from
20 ● WIC and the Retail Price of Infant Formula / FANRR-39 Economic Research Service/USDA
Wholesale prices of selected infant formula by manufacturer, 1980-2000Figure 4-1
Fiscal year
Dollars per can of 13-ounce milk-based liquid concentrate
Ross Mead Johnson Wyeth Carnation
Source: Data provided by USDA's Food and Nutrition Service.
1980 20009081 82 83 84 85 86 87 88 89 91 92 93 94 95 96 97 98 990
1.0
1.5
2.0
2.5
3.0
3.5
10 This was Gerber’s second attempt to enter the infant formula market. Gerber produced an infant formula from 1967until the formula was discontinued in 1972 (The New York Times, 1989).11 Wyeth continued to manufacture infant formula for the international market.

23 percent to 68 percent.12 Meanwhile, Ross’s share of the national market declined from 53percent in 1994 to 35 percent in 2000 as its share of the WIC market fell from 54 to 27 percent.
Since 2000 (the last year for which retail price data for this report were analyzed), other changeshave occurred in the infant formula market. Anecdotal evidence suggests that PBM continues togain market share. Recently PBM has introduced both liquid concentrate and ready-to-feedversions of infant formula into the market. In the spring of 2001, Abbott Labs, the parent companyof Ross, began producing a private label infant formula for sale in Costco stores. This product,priced well below the Ross brand of formula, will compete with other brands—including Rossproducts—in the infant formula market. Lastly, in the summer of 2001, the U.S. Food and DrugAdministration (FDA) approved the use of the fatty acids docosahexaenoic acid (DHA) andarachidonic acid (ARA) in domestic infant formula (The New York Times, 2001). Manufacturersthat choose to add the fatty acids to their formula are required to do postmarketing surveillance,to ensure that infants consuming the product do not experience bad effects, that may result inhigher costs.13
Economic Research Service/USDA WIC and the Retail Price of Infant Formula / FANRR-39 ● 21
12 Much of this dramatic shift occurred between fiscal years 1995 and 1996 when Mead Johnson’s share of the WICmarket increased from 33 percent to 62 percent (appendix table A-1). 13 Mead Johnson, Ross, Carnation, and PBM have all introduced formula containing DHA and ARA into their productline while continuing to offer formula without the fatty acids as well.
Chapter 5
Source of Infant Formula Data
The primary source of data on the retail prices of infant formula used in the following analyses isInfoScan, a scanner-based retail sales tracking service provided by Information Resources Incor-porated. InfoScan is based on weekly retail scanner information from a sample of 11,300 super-markets, 7,500 drugstores, and 288 mass merchandisers across the United States. The retail storesin the sample are statistically selected and must meet strict data quality standards. Once a week,the sampled retailers provide retail scanner data, including the price and description of all prod-ucts scanned in these stores during that week. In addition, an extensive network of professionalfield auditors collects weekly information on promotional activities from all sample stores. Thisinformation is used to differentiate everyday volume from volume due to promotional activity, aswell as to quality-check the data and to ensure that changes in volume correlate to the relevant in-store promotional activity.
After the data are reviewed and checked for errors or inconsistencies, InfoScan applies projec-tion factors to extrapolate total volume of product sold and total dollar sales of the product forchains, market areas, regions, and the total United States. InfoScan data are averages across aspecified geographic area; data from individual stores were not available for this analysis.Supermarket data, representing supermarkets that have at least $2 million in sales annually, areprojected to 64 market areas (fig. 5-1). The market areas are sets of counties selected on thebasis of their retail trading environment. The market area data are then combined with data fromsample stores representing the counties outside the 64 market areas to project regional andnational supermarket sales. Data from mass merchandisers (stores belonging to chains that sellat least $200 million annually) and drugstores are not projected to the market area; rather, indi-vidual store-level data are projected directly to eight standard regions that, when combined,reflect the total for the United States.
The InfoScan infant formula category includes information on dollar sales, unit sales, volumesales, and prices per unit for more than 500 distinct items. These items are unique in terms of suchcharacteristics as product brand, package size, product form, and product base and usuallyconform to a unique universal product code (UPC). One exception to the correspondence of indi-vidual items and UPCs is private-label items. In this case, items are grouped by unique packagecharacteristics. Consequently, individual private label brands or store labels are not identified.Fortunately, this does not create a problem for this study because PBM, which entered the infantformula market in 1997, was the only company marketing private-label infant formula during thestudy period. As a result, InfoScan private-label infant formula as well as all infant formula iden-tified as being manufactured by Wyeth after 1996 was coded as PBM infant formula (all PBMinfant formula is manufactured by Wyeth).
Each item in the infant formula category on the InfoScan data base was examined by ERS analystsand classified as to type: standard formula (382 items), specialized formula (58 items), or notinfant formula (90 items). As defined in this report, standard infant formula includes milk-basedand soy-based infant formulas that meet the nutritional needs of most full-term, healthy infantsyounger than 1 year old and is not targeted at “special needs.” Specialized formula includesformula for children with special nutritional requirements, such as hypoallergenic formula (e.g.,hydrolyzed-protein formula), thickened formula, formula to treat diarrhea, formula for prematurebabies, formula for infants with other diseases or disorders (such as PKU), lactose-free (non-soy)
22 ● WIC and the Retail Price of Infant Formula / FANRR-39 Economic Research Service/USDA
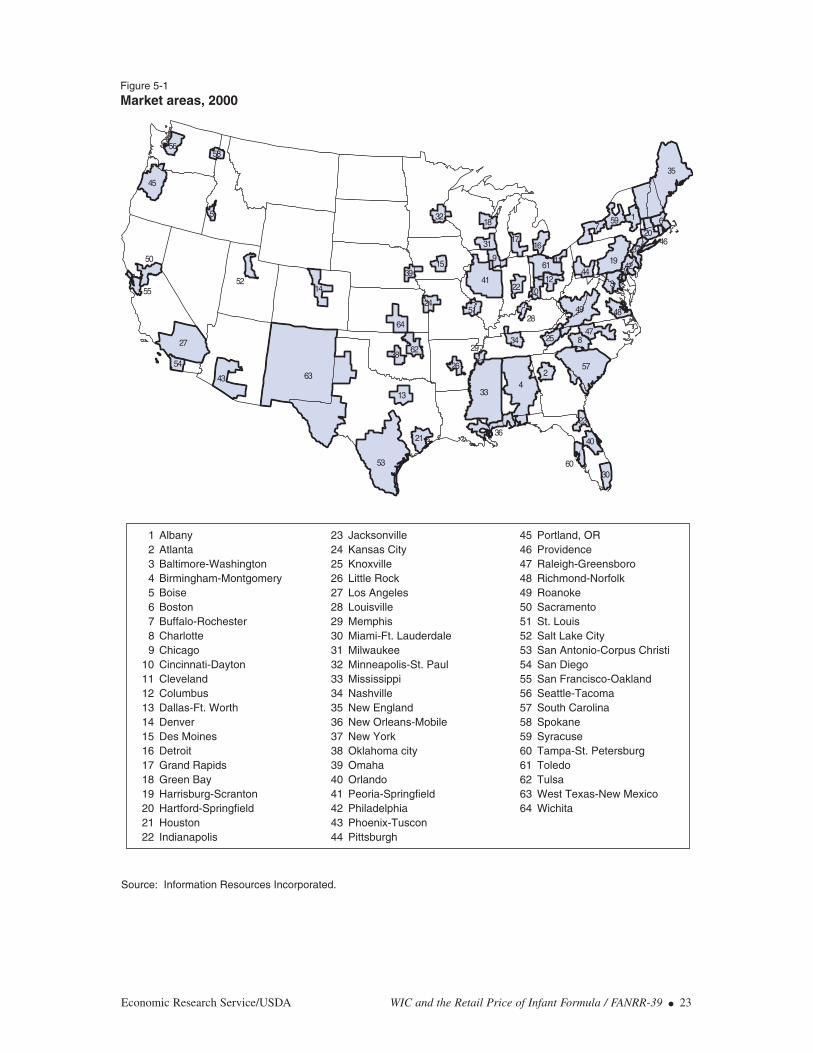
Economic Research Service/USDA WIC and the Retail Price of Infant Formula / FANRR-39 ● 23
1 Albany 23 Jacksonville 45 Portland, OR2 Atlanta 24 Kansas City 46 Providence3 Baltimore-Washington 25 Knoxville 47 Raleigh-Greensboro4 Birmingham-Montgomery 26 Little Rock 48 Richmond-Norfolk5 Boise 27 Los Angeles 49 Roanoke6 Boston 28 Louisville 50 Sacramento7 Buffalo-Rochester 29 Memphis 51 St. Louis8 Charlotte 30 Miami-Ft. Lauderdale 52 Salt Lake City9 Chicago 31 Milwaukee 53 San Antonio-Corpus Christi
10 Cincinnati-Dayton 32 Minneapolis-St. Paul 54 San Diego11 Cleveland 33 Mississippi 55 San Francisco-Oakland12 Columbus 34 Nashville 56 Seattle-Tacoma13 Dallas-Ft. Worth 35 New England 57 South Carolina14 Denver 36 New Orleans-Mobile 58 Spokane15 Des Moines 37 New York 59 Syracuse16 Detroit 38 Oklahoma city 60 Tampa-St. Petersburg17 Grand Rapids 39 Omaha 61 Toledo18 Green Bay 40 Orlando 62 Tulsa19 Harrisburg-Scranton 41 Peoria-Springfield 63 West Texas-New Mexico20 Hartford-Springfield 42 Philadelphia 64 Wichita21 Houston 43 Phoenix-Tuscon22 Indianapolis 44 Pittsburgh
Market areas, 2000Figure 5-1
Source: Information Resources Incorporated.
58
55
26
3915
52
5438
5
24
32
56
62
50
21
13
64
14
45
43
27
35
53
46
11
29
28
23
60
10
37
18
51
1222
25
161731
30
34
42
20
40
44
48
59
47
9
6
36
2
1
61
8
3
7
19
49
41
57
334
63
formula, as well as formula marketed to toddlers 1 year or older.1 In general, specialized infantformulas are not marketed to the broad population of infants under 1 year of age but rather to aparticular segment of infants with special needs. In many cases, the composition and price struc-ture of specialized formulas differs substantially from that of standard formulas. The terms “stan-dard” and “specialized” were developed for this report to categorize these different types of infantformula. They do not coincide with categories used either for the regulation of infant formula orin the administration of the WIC infant formula rebate program.
Items determined not to be infant formula, such as Pedialyte and other electrolyte maintenance solu-tions, were excluded from this analysis. Each formula item was further classified as to the productbase (milk, soy, or other), and product form (liquid concentrate, powder, or ready to feed). ERSfurther processed the InfoScan data to convert the volume measures to single strength equivalents.Each ounce of liquid concentrate is equivalent to 2 ounces of ready-to-feed formula. Conversionfactors for powder formula range from 7.08 to 7.5, depending on brand and product base.
Infant formula prices reported in this study are converted to apply to a standard unit of volume, 26ounces of ready-to-feed formula.2 This volume was chosen as the standard because it is the ready-to-feed equivalent of a 13-ounce can of liquid concentrate, the unit used most often in previousstudies of infant formula pricing. This conversion allows one to easily compare retail prices fordifferent package sizes and product forms. The price is calculated by dividing dollar sales byvolume sales in single-strength, ready-to-feed equivalents. This procedure creates a volume-weighted average price.
ERS obtained InfoScan quarterly data on infant formula covering the 1st quarter of 1994 throughthe 3rd quarter of 2000. The quarterly data were then aggregated to represent annual periods;infant formula sales and volume figures for the year 2000 were annualized based on data for thefirst three quarters of the year, the most recent data available at the time the study was initiated.
Limitations of the Data
One of the limitations of the data for this study is that the InfoScan data are not available at theState level. In some cases, the 64 market areas span State boundaries. Whereas 41 of the 64market areas fall within the boundaries of a single State, the remaining 23 cover more than oneState (e.g., the Philadelphia market area includes parts of Pennsylvania, New Jersey, Delaware,and Maryland). Seven States—Alaska, Hawaii, Montana, Nevada, North Dakota, South Dakota,and Wyoming—are not included in any of the 64 market areas.
Another limitation of the data for this study is that only supermarket data are projected to themarket area level; sales data from drug stores and mass merchandisers are available at thenational level only. Mass merchandisers and drugstores account for a considerable—andincreasing—proportion of all infant formula sales, amounting to nearly 29 percent of dollarsales and 32 percent of volume sales of all infant formula in 2000.
Furthermore, the scanner data used in this report do not measure sales in other types of outlets,such as convenience and food stores with less than $2 million in sales annually, and nonfood storesthat sell baby food, such as Toys “R” Us. In addition, consumers can now order infant formula
24 ● WIC and the Retail Price of Infant Formula / FANRR-39 Economic Research Service/USDA
1 Since the focus of this report is formulas for infants, formulas for toddlers 1 year of age and older (which has a differ-ent nutrient composition than formulas for infants) were classified as specialized. 2 As a result, an item’s retail price as cited in this report may differ from the item’s actual shelf price found in supermarkets.
through the Internet, often at a discount. The contribution of these other outlets of infant formulato total volume sales or prices is unknown but it is believed that they currently account for only asmall proportion of overall sales of infant formula in the United States.
This study’s analysis of InfoScan data was limited to the years 1994 through 2000. Prior to 1994,information on mass merchandisers was not collected. In addition, by 1994, most WIC State agen-cies (excluding Indian State agencies with 1,000 or fewer participants) with infant formula rebateoperations had switched to sole-source competitive rebate systems (see appendix A).
Economic Research Service/USDA WIC and the Retail Price of Infant Formula / FANRR-39 ● 25
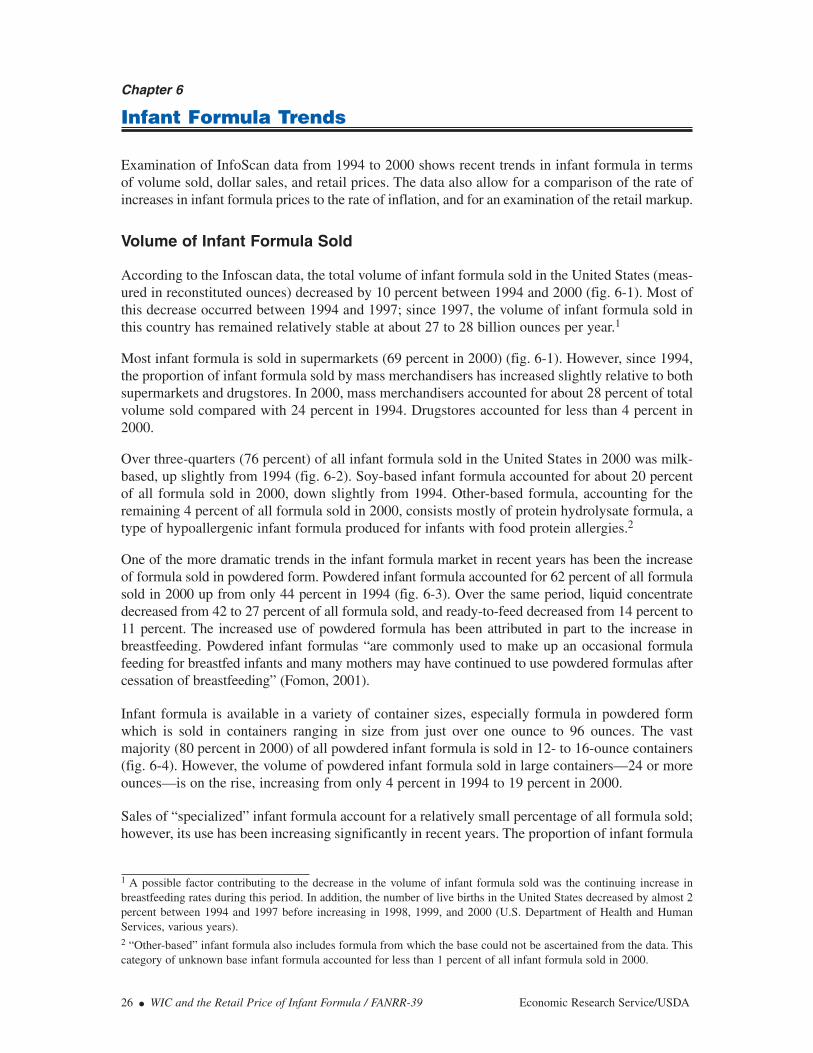
Chapter 6
Infant Formula Trends
Examination of InfoScan data from 1994 to 2000 shows recent trends in infant formula in termsof volume sold, dollar sales, and retail prices. The data also allow for a comparison of the rate ofincreases in infant formula prices to the rate of inflation, and for an examination of the retail markup.
Volume of Infant Formula Sold
According to the Infoscan data, the total volume of infant formula sold in the United States (meas-ured in reconstituted ounces) decreased by 10 percent between 1994 and 2000 (fig. 6-1). Most ofthis decrease occurred between 1994 and 1997; since 1997, the volume of infant formula sold inthis country has remained relatively stable at about 27 to 28 billion ounces per year.1
Most infant formula is sold in supermarkets (69 percent in 2000) (fig. 6-1). However, since 1994,the proportion of infant formula sold by mass merchandisers has increased slightly relative to bothsupermarkets and drugstores. In 2000, mass merchandisers accounted for about 28 percent of totalvolume sold compared with 24 percent in 1994. Drugstores accounted for less than 4 percent in2000.
Over three-quarters (76 percent) of all infant formula sold in the United States in 2000 was milk-based, up slightly from 1994 (fig. 6-2). Soy-based infant formula accounted for about 20 percentof all formula sold in 2000, down slightly from 1994. Other-based formula, accounting for theremaining 4 percent of all formula sold in 2000, consists mostly of protein hydrolysate formula, atype of hypoallergenic infant formula produced for infants with food protein allergies.2
One of the more dramatic trends in the infant formula market in recent years has been the increaseof formula sold in powdered form. Powdered infant formula accounted for 62 percent of all formulasold in 2000 up from only 44 percent in 1994 (fig. 6-3). Over the same period, liquid concentratedecreased from 42 to 27 percent of all formula sold, and ready-to-feed decreased from 14 percent to11 percent. The increased use of powdered formula has been attributed in part to the increase inbreastfeeding. Powdered infant formulas “are commonly used to make up an occasional formulafeeding for breastfed infants and many mothers may have continued to use powdered formulas aftercessation of breastfeeding” (Fomon, 2001).
Infant formula is available in a variety of container sizes, especially formula in powdered formwhich is sold in containers ranging in size from just over one ounce to 96 ounces. The vastmajority (80 percent in 2000) of all powdered infant formula is sold in 12- to 16-ounce containers(fig. 6-4). However, the volume of powdered infant formula sold in large containers—24 or moreounces—is on the rise, increasing from only 4 percent in 1994 to 19 percent in 2000.
Sales of “specialized” infant formula account for a relatively small percentage of all formula sold;however, its use has been increasing significantly in recent years. The proportion of infant formula
26 ● WIC and the Retail Price of Infant Formula / FANRR-39 Economic Research Service/USDA
1 A possible factor contributing to the decrease in the volume of infant formula sold was the continuing increase inbreastfeeding rates during this period. In addition, the number of live births in the United States decreased by almost 2percent between 1994 and 1997 before increasing in 1998, 1999, and 2000 (U.S. Department of Health and HumanServices, various years). 2 “Other-based” infant formula also includes formula from which the base could not be ascertained from the data. Thiscategory of unknown base infant formula accounted for less than 1 percent of all infant formula sold in 2000.
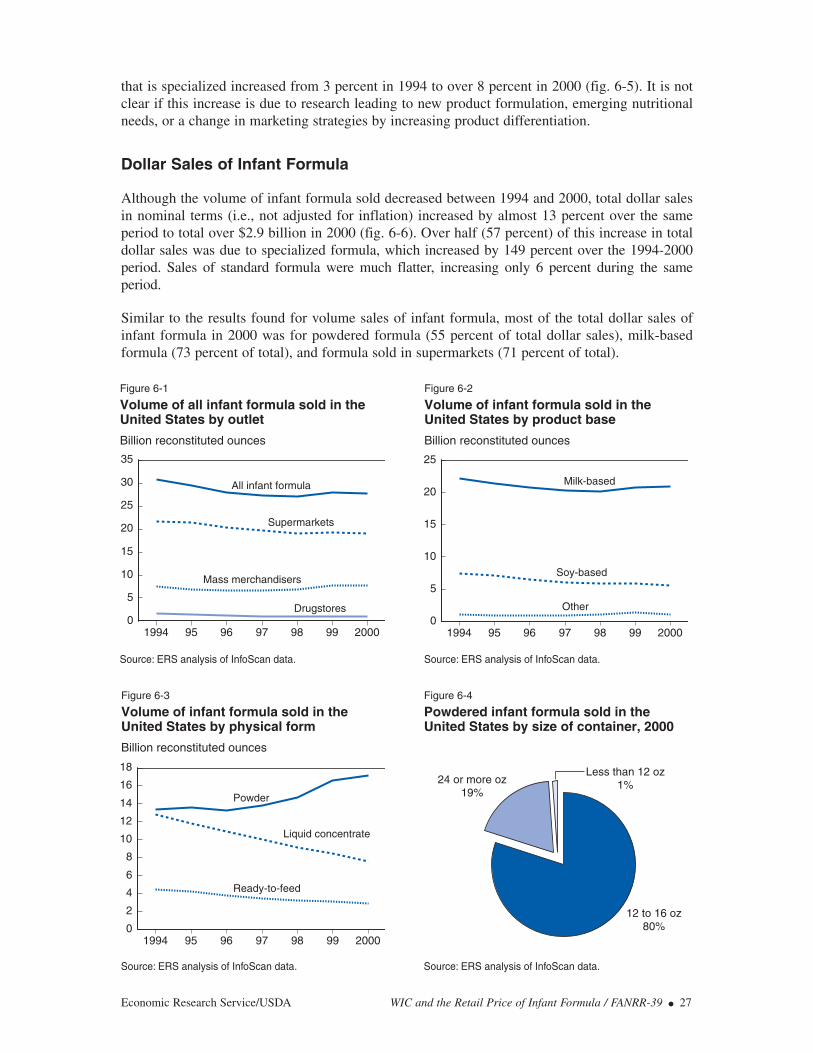
that is specialized increased from 3 percent in 1994 to over 8 percent in 2000 (fig. 6-5). It is notclear if this increase is due to research leading to new product formulation, emerging nutritionalneeds, or a change in marketing strategies by increasing product differentiation.
Dollar Sales of Infant Formula
Although the volume of infant formula sold decreased between 1994 and 2000, total dollar salesin nominal terms (i.e., not adjusted for inflation) increased by almost 13 percent over the sameperiod to total over $2.9 billion in 2000 (fig. 6-6). Over half (57 percent) of this increase in totaldollar sales was due to specialized formula, which increased by 149 percent over the 1994-2000period. Sales of standard formula were much flatter, increasing only 6 percent during the sameperiod.
Similar to the results found for volume sales of infant formula, most of the total dollar sales ofinfant formula in 2000 was for powdered formula (55 percent of total dollar sales), milk-basedformula (73 percent of total), and formula sold in supermarkets (71 percent of total).
Economic Research Service/USDA WIC and the Retail Price of Infant Formula / FANRR-39 ● 27
Figure 6-1
Volume of all infant formula sold in the United States by outlet
Source: ERS analysis of InfoScan data.
Billion reconstituted ounces
1994 95 96 97 98 99 20000
5
10
15
20
25
30
35
Drugstores
Supermarkets
Mass merchandisers
All infant formula
Figure 6-2
Volume of infant formula sold in the United States by product base
Source: ERS analysis of InfoScan data.
Billion reconstituted ounces
Other
Soy-based
Milk-based
1994 95 96 97 98 99 20000
5
10
15
20
25
Figure 6-3
Volume of infant formula sold in theUnited States by physical form
Source: ERS analysis of InfoScan data.
Billion reconstituted ounces
Liquid concentrate
Ready-to-feed
Powder
1994 95 96 97 98 99 20000
2
4
6
8
10
12
14
16
18
Figure 6-4
Powdered infant formula sold in the United States by size of container, 2000
Source: ERS analysis of InfoScan data.
12 to 16 oz80%
24 or more oz19%
Less than 12 oz1%
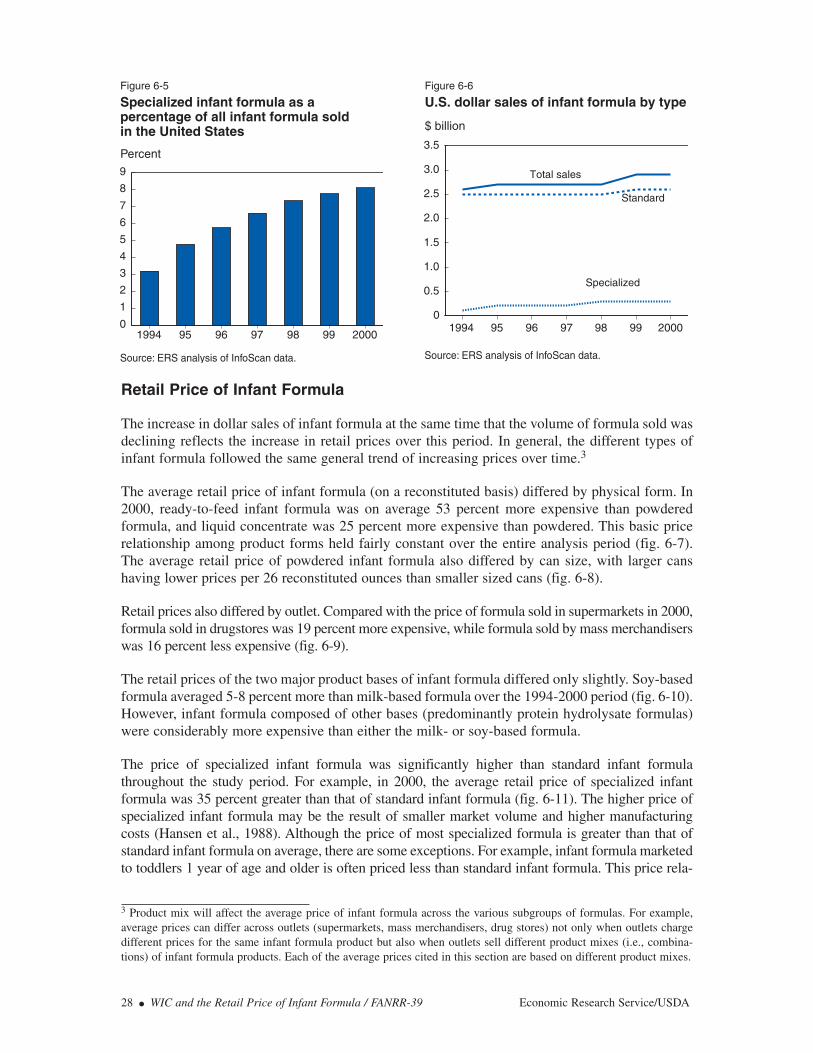
Retail Price of Infant Formula
The increase in dollar sales of infant formula at the same time that the volume of formula sold wasdeclining reflects the increase in retail prices over this period. In general, the different types ofinfant formula followed the same general trend of increasing prices over time.3
The average retail price of infant formula (on a reconstituted basis) differed by physical form. In2000, ready-to-feed infant formula was on average 53 percent more expensive than powderedformula, and liquid concentrate was 25 percent more expensive than powdered. This basic pricerelationship among product forms held fairly constant over the entire analysis period (fig. 6-7).The average retail price of powdered infant formula also differed by can size, with larger canshaving lower prices per 26 reconstituted ounces than smaller sized cans (fig. 6-8).
Retail prices also differed by outlet. Compared with the price of formula sold in supermarkets in 2000,formula sold in drugstores was 19 percent more expensive, while formula sold by mass merchandiserswas 16 percent less expensive (fig. 6-9).
The retail prices of the two major product bases of infant formula differed only slightly. Soy-basedformula averaged 5-8 percent more than milk-based formula over the 1994-2000 period (fig. 6-10).However, infant formula composed of other bases (predominantly protein hydrolysate formulas)were considerably more expensive than either the milk- or soy-based formula.
The price of specialized infant formula was significantly higher than standard infant formulathroughout the study period. For example, in 2000, the average retail price of specialized infantformula was 35 percent greater than that of standard infant formula (fig. 6-11). The higher price ofspecialized infant formula may be the result of smaller market volume and higher manufacturingcosts (Hansen et al., 1988). Although the price of most specialized formula is greater than that ofstandard infant formula on average, there are some exceptions. For example, infant formula marketedto toddlers 1 year of age and older is often priced less than standard infant formula. This price rela-
28 ● WIC and the Retail Price of Infant Formula / FANRR-39 Economic Research Service/USDA
Figure 6-5
Specialized infant formula as a percentage of all infant formula sold in the United States
Source: ERS analysis of InfoScan data.
Percent
1994 95 96 97 98 99 20000
1
2
3
4
5
6
7
8
9
Figure 6-6
U.S. dollar sales of infant formula by type
Source: ERS analysis of InfoScan data.
$ billion
Standard
Specialized
Total sales
1994 95 96 97 98 99 20000
0.5
1.0
1.5
2.0
2.5
3.0
3.5
3 Product mix will affect the average price of infant formula across the various subgroups of formulas. For example,average prices can differ across outlets (supermarkets, mass merchandisers, drug stores) not only when outlets chargedifferent prices for the same infant formula product but also when outlets sell different product mixes (i.e., combina-tions) of infant formula products. Each of the average prices cited in this section are based on different product mixes.

tionship may be due in part to toddler formulacompeting with the much cheaper cow’s milkfor a place in the toddler’s diet.
The rest of this chapter examines increases inretail infant formula prices relative to inflationand the relationship between a brand’s retailand wholesale prices. Because the retail priceof infant formula varies by a wide range offactors (e.g., product base, physical form,outlet, and even size of container), it wasnecessary to narrow the focus of the study tosimilar infant formula products, otherwise theinclusion of infant formulas with differentprice structures could bias the results of thestudy. Therefore, the remainder of this report
Economic Research Service/USDA WIC and the Retail Price of Infant Formula / FANRR-39 ● 29
Figure 6-7
Average U.S. price of infant formula by physical form
Source: ERS analysis of InfoScan data.
$ per 26 reconstituted ounces
Liquid concentrate
Powder
Ready to feed
1994 95 96 97 98 99 20001.0
1.5
2.0
2.5
3.0
3.5
4.0
Figure 6-8
Retail price of U.S. powdered infant formula by can size, 2000
Source: ERS analysis of InfoScan data.
$ per 26 reconstituted ounces
Less than12 ounces
12 to 16ounces
24 or moreounces
0
0.5
1.0
1.5
2.0
2.5
3.0
Figure 6-9
Average U.S. price of infant formula by outlet
Source: ERS analysis of InfoScan data.
$ per 26 reconstituted ounces
Supermarkets
Mass merchandisers
Drugstores
1994 95 96 97 98 99 20001.0
1.5
2.0
2.5
3.0
3.5
4.0
Figure 6-10
Average U.S. price of infant formula by product base
Source: ERS analysis of InfoScan data.
$ per 26 reconstituted ounces
Soy
Milk
Other
1994 95 96 97 98 99 20000
1
2
3
4
5
6
Figure 6-11
Average U.S. price of infant formula by type
Source: ERS analysis of InfoScan data.
$ per 26 reconstituted ounces
Standard
Specialized
1994 95 96 97 98 99 20001.0
1.5
2.0
2.5
3.0
3.5
4.0
examines retail prices for each of the four major infant formula types (milk-based powder, milk-based liquid concentrate, soy-based powder, and soy-based liquid concentrate) represented by onespecific product per manufacturer as determined by the universal product code (UPC) with thelargest volume of sales in 2000 for that manufacturer (table 6-1).4 (The analysis excluded bothspecialized formulas and ready-to-feed formulas since they account for a relatively small portionof the infant formula market.) The selected infant formula products, all of which were iron-forti-fied, accounted for the majority of infant formula sold by each manufacturer in that specific cate-gory. The price data represent only supermarkets, which account for 69 percent of all infantformula sold by volume in 2000.
Increases in the Retail Price of Infant Formula Relative to Inflation
In 1999, the members of the House Committee on Appropriations stated that they were “concernedthat since rebates began, infant formula costs appear to have risen far greater than inflation” (H.R.106-157). Up to now, this report’s discussion of the retail prices of infant formula has been innominal terms only, that is, not adjusted for inflation. This section looks at the increase in infantformula prices relative to the Consumer Price Index (CPI) for All Items.5 The CPI for All Items isa broad, comprehensive price index that is used to measure the average change over time in theprices paid by urban consumers for a market basket of consumer goods and services. It is the mostwidely used measure of inflation, or general price changes, in the United States. The study alsoused indexes for two other groups of consumer expenditures. The CPI for Food At Home, theNation’s principal indicator of changes in retail food prices, was used since most infant formula issold in retail food stores. Lastly, the CPI for Nonprescription Drugs and Medical Supplies wasused since most infant formula is produced by pharmaceutical companies and all formula mustconform to regulatory standards enforced by the Food and Drug Administration.
Figures 6-12 through 6-14 show the average annual rate of increases in both wholesale and retailprices for the four major types of formula by the three larger manufacturers (resulting in 12 cases)during the 1994-2000 period.6 Although the increases in retail prices varied by manufacturer andtype of formula, they exceeded the average percentage increase in both the CPI for All Items andthe CPI for Food At Home in all cases except one (Carnation soy-based powder). With the excep-tion of the two Carnation soy-based formulas, the increase in retail prices exceeded the CPI forNonprescription Drugs and Medical Supplies as well. That is, regardless of type of formula andmanufacturer, the average annual increase in the retail price of infant formula during the studyperiod nearly always exceeded price inflation regardless of which of the three price indexes wasused. In addition, the data indicate that in all 12 cases the annual rate of increase in retail pricesexceeded the annual rate of increase in wholesale prices. Note that retail infant formula priceswere rising faster than overall food prices even before the rebate program began nationwide in1989.7 Since little information is publicly available on the operating costs associated with retailinginfant formula (e.g., shelving, overhead, etc.), it is not possible to determine the extent to which
30 ● WIC and the Retail Price of Infant Formula / FANRR-39 Economic Research Service/USDA
4 In other words, one infant formula product per manufacturer for each of the major types of infant formula was chosenas the standard of measurement for comparison purposes. 5 Specifically, this analysis uses the Consumer Price Index for All Urban Consumers (CPI-U) for the U.S. City Averagefor All Items, not seasonally adjusted, constructed by the U.S. Department of Labor, Bureau of Labor Statistics (BLS). 6 Since Wyeth dropped out of the market in 1996, and PBM Products did not enter the market until 1997 and accounted foronly 1 percent of the infant formula market in 2000, neither were included in this comparison of formula prices to the CPIand the following analysis of the retail markup. 7 The rapid increase in the retail price of infant formula during the 1980s has been cited as one of the primary reasonsthe infant formula rebate system was first implemented (U.S. GAO, 1990).
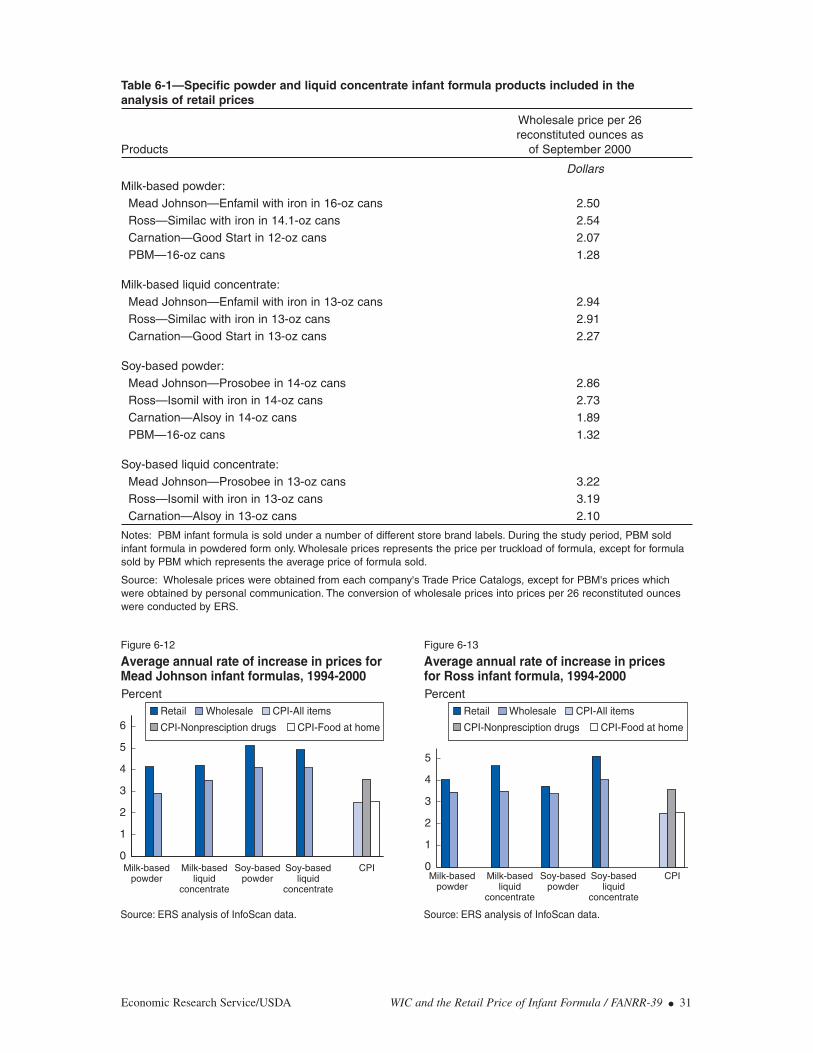
Economic Research Service/USDA WIC and the Retail Price of Infant Formula / FANRR-39 ● 31
Table 6-1—Specific powder and liquid concentrate infant formula products included in the analysis of retail prices
Wholesale price per 26 reconstituted ounces as
Products of September 2000
DollarsMilk-based powder:
Mead Johnson—Enfamil with iron in 16-oz cans 2.50Ross—Similac with iron in 14.1-oz cans 2.54Carnation—Good Start in 12-oz cans 2.07PBM—16-oz cans 1.28
Milk-based liquid concentrate:Mead Johnson—Enfamil with iron in 13-oz cans 2.94Ross—Similac with iron in 13-oz cans 2.91Carnation—Good Start in 13-oz cans 2.27
Soy-based powder:Mead Johnson—Prosobee in 14-oz cans 2.86Ross—Isomil with iron in 14-oz cans 2.73Carnation—Alsoy in 14-oz cans 1.89PBM—16-oz cans 1.32
Soy-based liquid concentrate:Mead Johnson—Prosobee in 13-oz cans 3.22Ross—Isomil with iron in 13-oz cans 3.19Carnation—Alsoy in 13-oz cans 2.10
Notes: PBM infant formula is sold under a number of different store brand labels. During the study period, PBM soldinfant formula in powdered form only. Wholesale prices represents the price per truckload of formula, except for formulasold by PBM which represents the average price of formula sold.
Source: Wholesale prices were obtained from each company's Trade Price Catalogs, except for PBM's prices whichwere obtained by personal communication. The conversion of wholesale prices into prices per 26 reconstituted ounceswere conducted by ERS.
Figure 6-12
Average annual rate of increase in prices forMead Johnson infant formulas, 1994-2000
Source: ERS analysis of InfoScan data.
Percent
Milk-basedpowder
Milk-basedliquid
concentrate
Soy-basedpowder
Soy-basedliquid
concentrate
CPI0
1
2
3
4
5
6Retail
CPI-Food at homeCPI-Nonpresciption drugs
CPI-All itemsWholesale
Figure 6-13
Average annual rate of increase in prices for Ross infant formula, 1994-2000
Source: ERS analysis of InfoScan data.
PercentRetail
CPI-Food at homeCPI-Nonpresciption drugs
CPI-All itemsWholesale
0
1
2
3
4
5
Milk-basedpowder
Milk-basedliquid
concentrate
Soy-basedpowder
Soy-basedliquid
concentrate
CPI
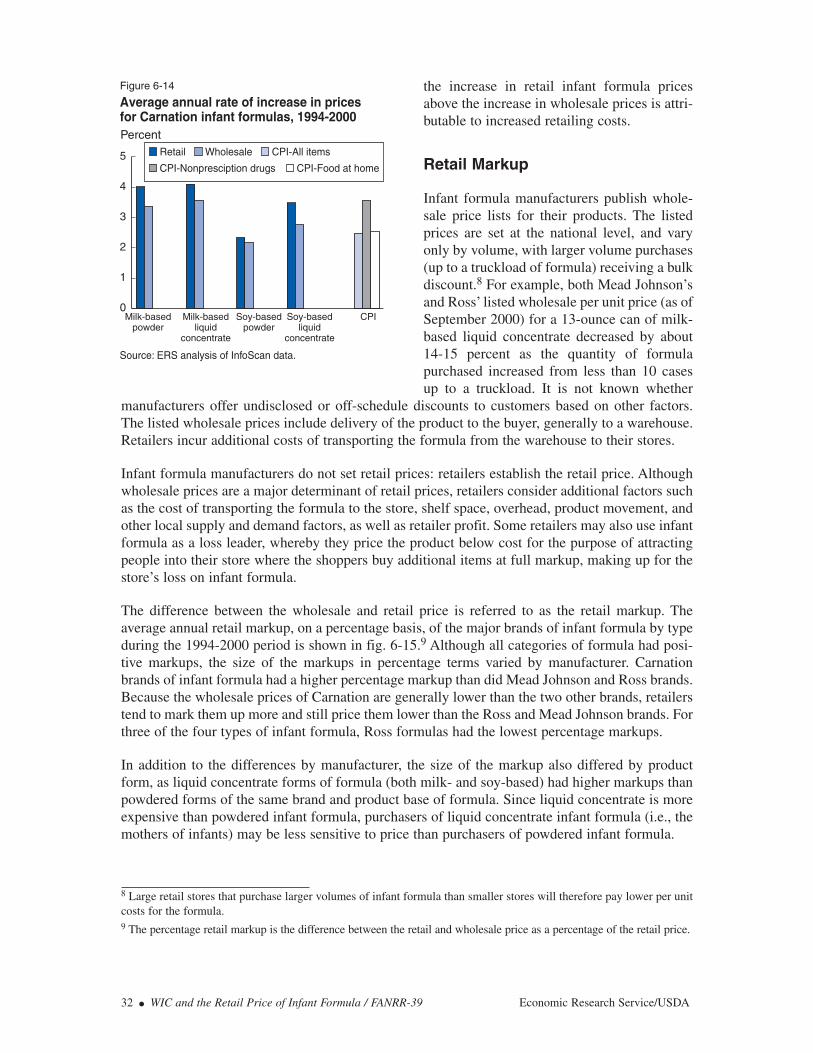
the increase in retail infant formula pricesabove the increase in wholesale prices is attri-butable to increased retailing costs.
Retail Markup
Infant formula manufacturers publish whole-sale price lists for their products. The listedprices are set at the national level, and varyonly by volume, with larger volume purchases(up to a truckload of formula) receiving a bulkdiscount.8 For example, both Mead Johnson’sand Ross’ listed wholesale per unit price (as ofSeptember 2000) for a 13-ounce can of milk-based liquid concentrate decreased by about14-15 percent as the quantity of formulapurchased increased from less than 10 casesup to a truckload. It is not known whether
manufacturers offer undisclosed or off-schedule discounts to customers based on other factors.The listed wholesale prices include delivery of the product to the buyer, generally to a warehouse.Retailers incur additional costs of transporting the formula from the warehouse to their stores.
Infant formula manufacturers do not set retail prices: retailers establish the retail price. Althoughwholesale prices are a major determinant of retail prices, retailers consider additional factors suchas the cost of transporting the formula to the store, shelf space, overhead, product movement, andother local supply and demand factors, as well as retailer profit. Some retailers may also use infantformula as a loss leader, whereby they price the product below cost for the purpose of attractingpeople into their store where the shoppers buy additional items at full markup, making up for thestore’s loss on infant formula.
The difference between the wholesale and retail price is referred to as the retail markup. Theaverage annual retail markup, on a percentage basis, of the major brands of infant formula by typeduring the 1994-2000 period is shown in fig. 6-15.9 Although all categories of formula had posi-tive markups, the size of the markups in percentage terms varied by manufacturer. Carnationbrands of infant formula had a higher percentage markup than did Mead Johnson and Ross brands.Because the wholesale prices of Carnation are generally lower than the two other brands, retailerstend to mark them up more and still price them lower than the Ross and Mead Johnson brands. Forthree of the four types of infant formula, Ross formulas had the lowest percentage markups.
In addition to the differences by manufacturer, the size of the markup also differed by productform, as liquid concentrate forms of formula (both milk- and soy-based) had higher markups thanpowdered forms of the same brand and product base of formula. Since liquid concentrate is moreexpensive than powdered infant formula, purchasers of liquid concentrate infant formula (i.e., themothers of infants) may be less sensitive to price than purchasers of powdered infant formula.
32 ● WIC and the Retail Price of Infant Formula / FANRR-39 Economic Research Service/USDA
Figure 6-14
Average annual rate of increase in prices for Carnation infant formulas, 1994-2000
Source: ERS analysis of InfoScan data.
PercentRetail
CPI-Food at homeCPI-Nonpresciption drugs
CPI-All itemsWholesale
Milk-basedpowder
Milk-basedliquid
concentrate
Soy-basedpowder
Soy-basedliquid
concentrate
CPI0
1
2
3
4
5
8 Large retail stores that purchase larger volumes of infant formula than smaller stores will therefore pay lower per unitcosts for the formula. 9 The percentage retail markup is the difference between the retail and wholesale price as a percentage of the retail price.
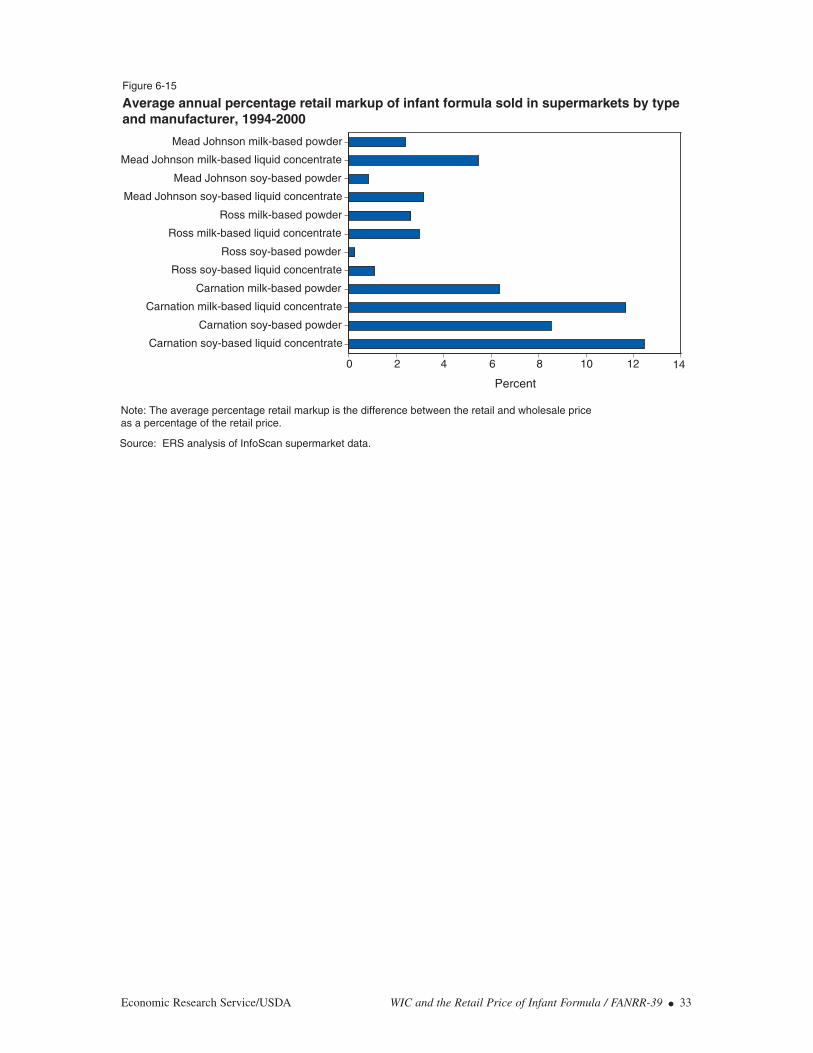
Economic Research Service/USDA WIC and the Retail Price of Infant Formula / FANRR-39 ● 33
Average annual percentage retail markup of infant formula sold in supermarkets by type and manufacturer, 1994-2000
Figure 6-15
Percent
Source: ERS analysis of InfoScan supermarket data.
Carnation soy-based liquid concentrate
Carnation soy-based powder
Carnation milk-based liquid concentrate
Carnation milk-based powder
Ross soy-based liquid concentrate
Ross soy-based powder
Ross milk-based liquid concentrate
Ross milk-based powder
Mead Johnson soy-based liquid concentrate
Mead Johnson soy-based powder
Mead Johnson milk-based liquid concentrate
Mead Johnson milk-based powder
1486420 1210
Note: The average percentage retail markup is the difference between the retail and wholesale priceas a percentage of the retail price.
Chapter 7
Infant Formula Prices and Availability by Market Area
In 2000, ERS was directed by Congress to report “on the number of suppliers of infant formula in eachState or major marketing area, and to compare the cost of formula that is included in the WIC rebateprogram versus the cost of formula that is not in the WIC rebate program” (H.R. 106-948). Thischapter presents findings from the Report to Congress that responded to these directives made byCongress (Oliveira et al., 2001). The section “Availability of Infant Formula” examines the number ofinfant formula suppliers by market area while the section “Retail Infant Formula Prices by MarketArea” compares the cost of formula that is included in the WIC rebate program versus the cost offormula that is not in the WIC rebate program. In addition, two new sections, not included in theReport to Congress, examine the use of infant formula as a loss leader and discuss the implications ofvariations in the contract brand retail prices on costs to WIC State agencies, respectively.
Availability of Infant Formula by Market Area
InfoScan data contain information on the volume sales of infant formula in supermarkets bycompany for the 64 local market areas.1 The data indicate that milk-based formulas produced byMead Johnson, Ross, and Carnation were available in all 64 market areas in 2000.2 Milk-basedformula produced by Wyeth but sold in supermarkets by the new marketing firm PBM Productswas available in 53 of the 64 of the market areas (fig. 7-1). This may be an undercount since databased solely on supermarket sales may underestimate the availability of PBM Products. Unlike theother manufacturers of infant formula, PBM sells a larger proportion of its formula through massmerchandisers and drugstores (41 percent in 2000) relative to the industry as a whole (31 percent).Despite the possible undercount, the results indicate that formula sold by PBM products waswidely available throughout the country (in 83 percent of the market areas). Furthermore, PBMhas continued to expand its market since 2000 and recently introduced both liquid concentrate andready-to-feed infant formulas to their line of products.
Retail Infant Formula Prices by Market Area
The InfoScan data contained retail price information for 64 market areas. Of those areas, 23 spanned2 or more States. In some of these multi-State areas, the WIC contract brand was the same throughoutthe market area. In others, a different WIC contract brand made up only a small share of the marketarea. Since the objective of this analysis is to compare the cost of WIC contract brand infant formulawith other brands of infant formula, those market areas located in two or more States with differentWIC contract-winning manufacturers present a problem in identifying the WIC contract brand ofinfant formula. The criterion for including a multi-State market area in this analysis was that a marketarea had to have at least 90 percent of the area’s population in an area that had the same WIC contractbrand throughout the reference period, which ran from January 2000 through September 2000.3
Fifty-four of the market areas met this criterion. However, one of these market areas, Mississippi,does not use a retail food delivery system and was excluded from the analysis on this basis. There-
34 ● WIC and the Retail Price of Infant Formula / FANRR-39 Economic Research Service/USDA
1 About 69 percent of all infant formula was sold in supermarkets in 2000.2 Availability was determined by whether any of that company’s formula was sold in the area. Data on the number ofsupermarkets in which the product was sold were not available. 3 Geocoding analysis was used to estimate the proportion of the population within each market area that resided in spe-cific States.

fore, a WIC contract brand was designated in 53 of the 64 market areas (fig. 7-2).4 Mead Johnsonhad the WIC contract in 32 of these market areas, Ross in 17 market areas, and Carnation in 4 marketareas. It was not possible to assign a meaningful “WIC brand” to the remaining market areas.
Milk-Based Powdered Formula. The average retail price of milk-based powdered infant formulassold in supermarkets in the 64 market areas in 2000 is shown in table 7-1.5 Prices differed signif-icantly by brand across the market areas. PBM brand formula (in those market areas where saleswere recorded) was always the lowest priced, and with several exceptions, Carnation brandformula was priced below the Mead Johnson and Ross brands. Similarly, within the same brandof formula, retail prices varied significantly across market areas. For example, the price of MeadJohnson formula ranged from $1.97 per 26 reconstituted ounces in Albany, NY, to $3.12 inChicago, IL.
There was no apparent relationship between a formula being the WIC contract brand and being thehighest priced formula. In 23 of the 53 market areas in which a WIC contract brand was desig-nated (43 percent), the WIC brand was the highest priced milk-based formula. In the remaining 30market areas, the WIC contract brand was not the highest priced formula.
Milk-Based Liquid Concentrate Formula. The comparison of the average retail price of WICcontract brand and other brands of milk-based liquid concentrate infant formula by market area is
Economic Research Service/USDA WIC and the Retail Price of Infant Formula / FANRR-39 ● 35
Number of milk-based infant formula powder manufacturers with products in supermarkets, 2000
Figure 7-1
3
4
Number of manufacturers
Note: Numerical identifiers of markets are provided in figure 5-1.Source: ERS analysis of Infoscan supermarket data, 2000.
4 The Report to Congress recognized 55 market areas (including Mississippi) in which a WIC contract brand was designated. 5 Prices are based on the specific infant formula products specified in table 6-1 plus an aggregate average price of allPBM Products milk-based powdered infant formula sold in 16-oz cans.

shown in table 7-2. Because the data did not identify any PBM Products in liquid concentrate, onlythree companies—Ross, Mead Johnson, and Carnation—were represented. In all 53 market areasin which a WIC brand was designated, Carnation brand formula had the lowest retail prices. Thecompany producing the highest priced formula varied between Ross and Mead Johnson. Therewas not a consistent relationship between being the WIC contract brand of formula and having thehighest average price. In 30 of the 53 market areas with a designated WIC contractor (57 percent),the WIC contract brand of infant formula was the highest priced formula, and in one additionalmarket area it tied for the highest price. In the remaining 22 market areas, the WIC contract brandwas not the highest priced infant formula.
Soy-Based Powdered Formula. Infant formula sold by PBM was the lowest priced soy-basedpowdered formula in each of the 44 market areas in which it was available, followed by Carnationbrand formula (table 7-3). In 43 market areas, Mead Johnson had the highest priced formula. In33 of the 53 market areas (62 percent) in which a WIC contract brand was designated, the WICbrand was the highest priced soy-based powdered formula, and in an additional market area it tiedfor the highest price.
Soy-Based Liquid Concentrate Formula. The average retail prices of soy-based liquid concentrateinfant formulas made by Carnation, Mead Johnson, and Ross are shown in table 7-4 (PBM did notmarket liquid concentrate formula during the study period). In all 53 market areas, Carnation had thelowest priced formula. The WIC contract brand was the highest priced formula in 32 of the 53 marketareas (60 percent), and in 4 more it tied for the highest.
36 ● WIC and the Retail Price of Infant Formula / FANRR-39 Economic Research Service/USDA
WIC infant formula contract brand by market area, 2000Figure 7-2
Carnation
Mead Johnson
WIC contract brands
Note: Numerical identifiers of markets are provided in figure 5-1.Source: ERS analysis of FNS WIC contracts.
56
45
50
55
27
54
43
52
5
58
14
63
64
38 62
13
53
21
26
2451
29
33
36
34
42
25
23
40
50 30
57
847
4928
12
10
4419
759 1
37
48
342
20 46
6
35
61
1116
17
2241
931
18
39
15
32
Ross
Two or more brands

Economic Research Service/USDA WIC and the Retail Price of Infant Formula / FANRR-39 ● 37
Table 7-1—Infant formula average retail prices: 12- to 16-oz cans of milk-based powder in supermarkets by market area, 20001
Market area PBM (Wyeth) Carnation Mead Johnson Ross
Dollars per 26 ounces reconstituted
Albany 1.72 2.13 1.97 2.31Atlanta — 2.16 2.46 2.62Baltimore/Washington 1.51 2.09 2.57 2.60Birmingham/Montgomery 1.81 2.14 2.53 2.66Boise 1.50 2.16 2.38 2.53Boston 1.73 2.12 2.29 2.50Buffalo/Rochester 1.43 2.11 2.22 2.30Charlotte 1.49 2.06 2.51 2.58Chicago — 2.57 3.12 2.94Cincinnati/Dayton 1.73 1.98 2.12 2.43
Cleveland 1.62 2.17 2.41 2.52Columbus — 2.10 2.38 2.56Dallas/Ft. Worth 1.60 2.24 2.54 2.73Denver 1.50 2.28 2.62 2.68Des Moines 1.67 2.23 2.67 2.72Detroit — 2.16 2.53 2.74Grand Rapids 1.64 2.11 2.14 2.34Green Bay — 2.28 2.77 2.86Harrisburg/Scranton 1.51 2.12 2.40 2.55Hartford/Springfield 1.73 2.18 2.43 2.60
Houston 1.53 2.12 2.48 2.66Indianapolis 1.73 2.29 2.43 2.40Jacksonville 1.50 2.18 2.49 2.55Kansas City 1.58 2.27 2.65 2.51Knoxville 1.44 2.09 2.48 2.60Little Rock — 2.32 2.70 2.90Los Angeles 1.64 2.22 2.86 2.81Louisville 1.53 1.99 2.37 2.41Memphis 1.63 2.30 2.76 2.93Miami/Ft. Lauderdale 1.62 2.34 2.53 2.60
Milwaukee 1.54 2.25 2.67 2.78Minneapolis/St. Paul — 2.13 2.46 2.63Mississippi 1.60 2.20 2.57 2.81Nashville 1.49 2.13 2.53 2.72New England 1.73 2.18 2.16 2.51New Orleans/Mobile 1.51 2.23 2.73 2.68New York 1.71 2.13 2.56 2.59Oklahoma City 1.60 2.28 2.62 2.73Omaha 1.58 2.16 2.52 2.60Orlando 1.60 2.29 2.53 2.61
Peoria/Springfield — 2.27 2.40 2.66Philadelphia 1.81 2.11 2.49 2.65Phoenix/Tucson 1.66 2.10 2.27 2.39Pittsburgh — 2.21 2.42 2.48Portland, Oregon 1.62 2.37 2.69 2.82Providence 1.73 2.11 2.26 2.52
See notes at end of table. Continued—
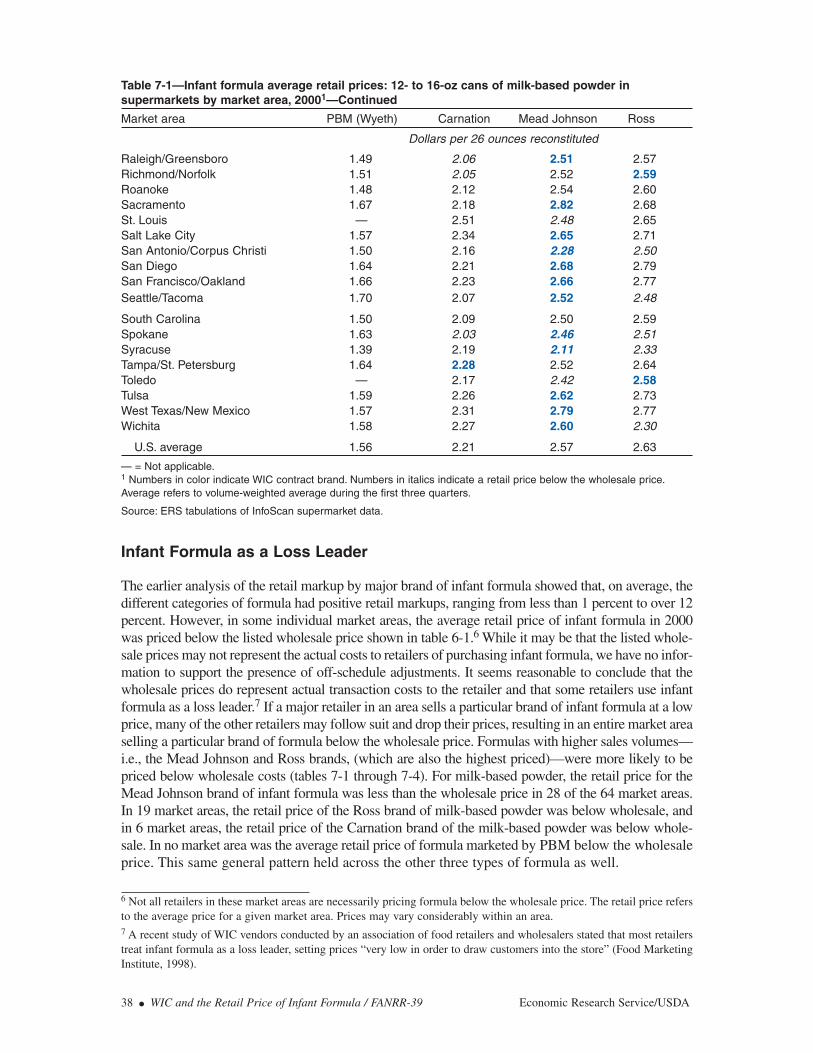
Infant Formula as a Loss Leader
The earlier analysis of the retail markup by major brand of infant formula showed that, on average, thedifferent categories of formula had positive retail markups, ranging from less than 1 percent to over 12percent. However, in some individual market areas, the average retail price of infant formula in 2000was priced below the listed wholesale price shown in table 6-1.6 While it may be that the listed whole-sale prices may not represent the actual costs to retailers of purchasing infant formula, we have no infor-mation to support the presence of off-schedule adjustments. It seems reasonable to conclude that thewholesale prices do represent actual transaction costs to the retailer and that some retailers use infantformula as a loss leader.7 If a major retailer in an area sells a particular brand of infant formula at a lowprice, many of the other retailers may follow suit and drop their prices, resulting in an entire market areaselling a particular brand of formula below the wholesale price. Formulas with higher sales volumes—i.e., the Mead Johnson and Ross brands, (which are also the highest priced)—were more likely to bepriced below wholesale costs (tables 7-1 through 7-4). For milk-based powder, the retail price for theMead Johnson brand of infant formula was less than the wholesale price in 28 of the 64 market areas.In 19 market areas, the retail price of the Ross brand of milk-based powder was below wholesale, andin 6 market areas, the retail price of the Carnation brand of the milk-based powder was below whole-sale. In no market area was the average retail price of formula marketed by PBM below the wholesaleprice. This same general pattern held across the other three types of formula as well.
38 ● WIC and the Retail Price of Infant Formula / FANRR-39 Economic Research Service/USDA
Table 7-1—Infant formula average retail prices: 12- to 16-oz cans of milk-based powder in supermarkets by market area, 20001—Continued
Market area PBM (Wyeth) Carnation Mead Johnson Ross
Dollars per 26 ounces reconstituted
Raleigh/Greensboro 1.49 2.06 2.51 2.57Richmond/Norfolk 1.51 2.05 2.52 2.59Roanoke 1.48 2.12 2.54 2.60Sacramento 1.67 2.18 2.82 2.68St. Louis — 2.51 2.48 2.65Salt Lake City 1.57 2.34 2.65 2.71San Antonio/Corpus Christi 1.50 2.16 2.28 2.50San Diego 1.64 2.21 2.68 2.79San Francisco/Oakland 1.66 2.23 2.66 2.77Seattle/Tacoma 1.70 2.07 2.52 2.48
South Carolina 1.50 2.09 2.50 2.59Spokane 1.63 2.03 2.46 2.51Syracuse 1.39 2.19 2.11 2.33Tampa/St. Petersburg 1.64 2.28 2.52 2.64Toledo — 2.17 2.42 2.58Tulsa 1.59 2.26 2.62 2.73West Texas/New Mexico 1.57 2.31 2.79 2.77Wichita 1.58 2.27 2.60 2.30
U.S. average 1.56 2.21 2.57 2.63
— = Not applicable.1 Numbers in color indicate WIC contract brand. Numbers in italics indicate a retail price below the wholesale price.Average refers to volume-weighted average during the first three quarters.
Source: ERS tabulations of InfoScan supermarket data.
6 Not all retailers in these market areas are necessarily pricing formula below the wholesale price. The retail price refersto the average price for a given market area. Prices may vary considerably within an area. 7 A recent study of WIC vendors conducted by an association of food retailers and wholesalers stated that most retailerstreat infant formula as a loss leader, setting prices “very low in order to draw customers into the store” (Food MarketingInstitute, 1998).
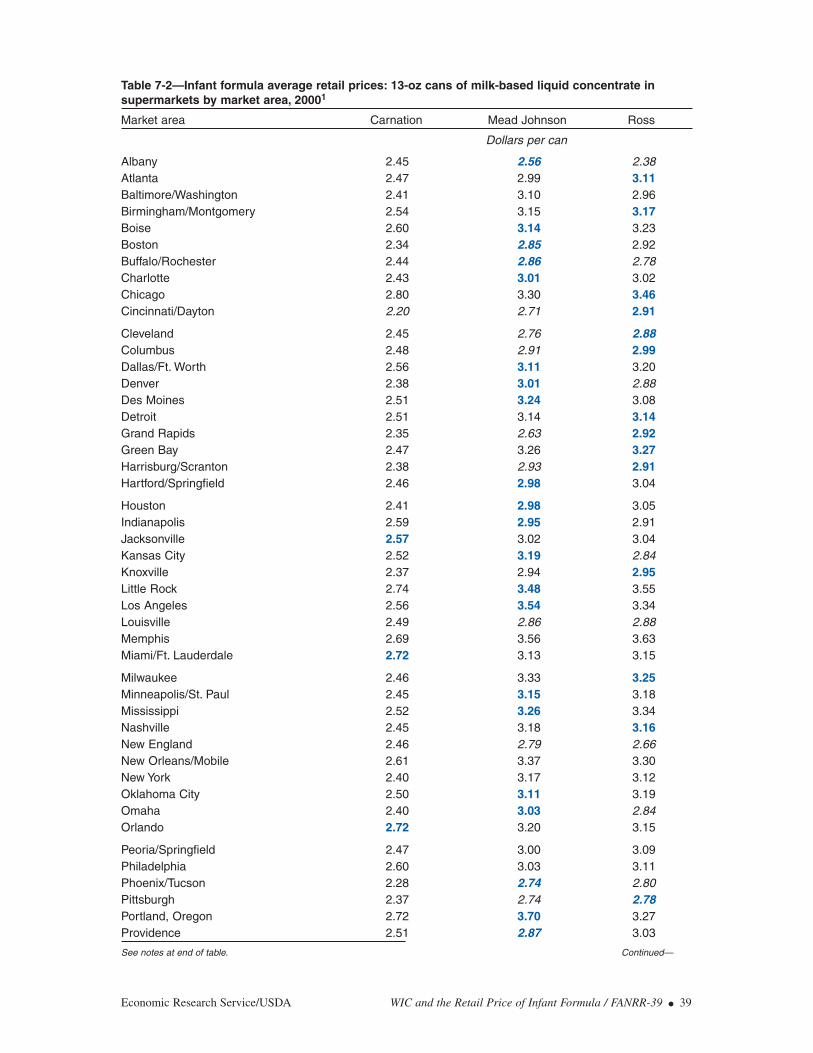
Economic Research Service/USDA WIC and the Retail Price of Infant Formula / FANRR-39 ● 39
Table 7-2—Infant formula average retail prices: 13-oz cans of milk-based liquid concentrate in supermarkets by market area, 20001
Market area Carnation Mead Johnson Ross
Dollars per can
Albany 2.45 2.56 2.38Atlanta 2.47 2.99 3.11Baltimore/Washington 2.41 3.10 2.96Birmingham/Montgomery 2.54 3.15 3.17Boise 2.60 3.14 3.23Boston 2.34 2.85 2.92Buffalo/Rochester 2.44 2.86 2.78Charlotte 2.43 3.01 3.02Chicago 2.80 3.30 3.46Cincinnati/Dayton 2.20 2.71 2.91
Cleveland 2.45 2.76 2.88Columbus 2.48 2.91 2.99Dallas/Ft. Worth 2.56 3.11 3.20Denver 2.38 3.01 2.88Des Moines 2.51 3.24 3.08Detroit 2.51 3.14 3.14Grand Rapids 2.35 2.63 2.92Green Bay 2.47 3.26 3.27Harrisburg/Scranton 2.38 2.93 2.91Hartford/Springfield 2.46 2.98 3.04
Houston 2.41 2.98 3.05Indianapolis 2.59 2.95 2.91Jacksonville 2.57 3.02 3.04Kansas City 2.52 3.19 2.84Knoxville 2.37 2.94 2.95Little Rock 2.74 3.48 3.55Los Angeles 2.56 3.54 3.34Louisville 2.49 2.86 2.88Memphis 2.69 3.56 3.63Miami/Ft. Lauderdale 2.72 3.13 3.15
Milwaukee 2.46 3.33 3.25Minneapolis/St. Paul 2.45 3.15 3.18Mississippi 2.52 3.26 3.34Nashville 2.45 3.18 3.16New England 2.46 2.79 2.66New Orleans/Mobile 2.61 3.37 3.30New York 2.40 3.17 3.12Oklahoma City 2.50 3.11 3.19Omaha 2.40 3.03 2.84Orlando 2.72 3.20 3.15
Peoria/Springfield 2.47 3.00 3.09Philadelphia 2.60 3.03 3.11Phoenix/Tucson 2.28 2.74 2.80Pittsburgh 2.37 2.74 2.78Portland, Oregon 2.72 3.70 3.27Providence 2.51 2.87 3.03
See notes at end of table. Continued—
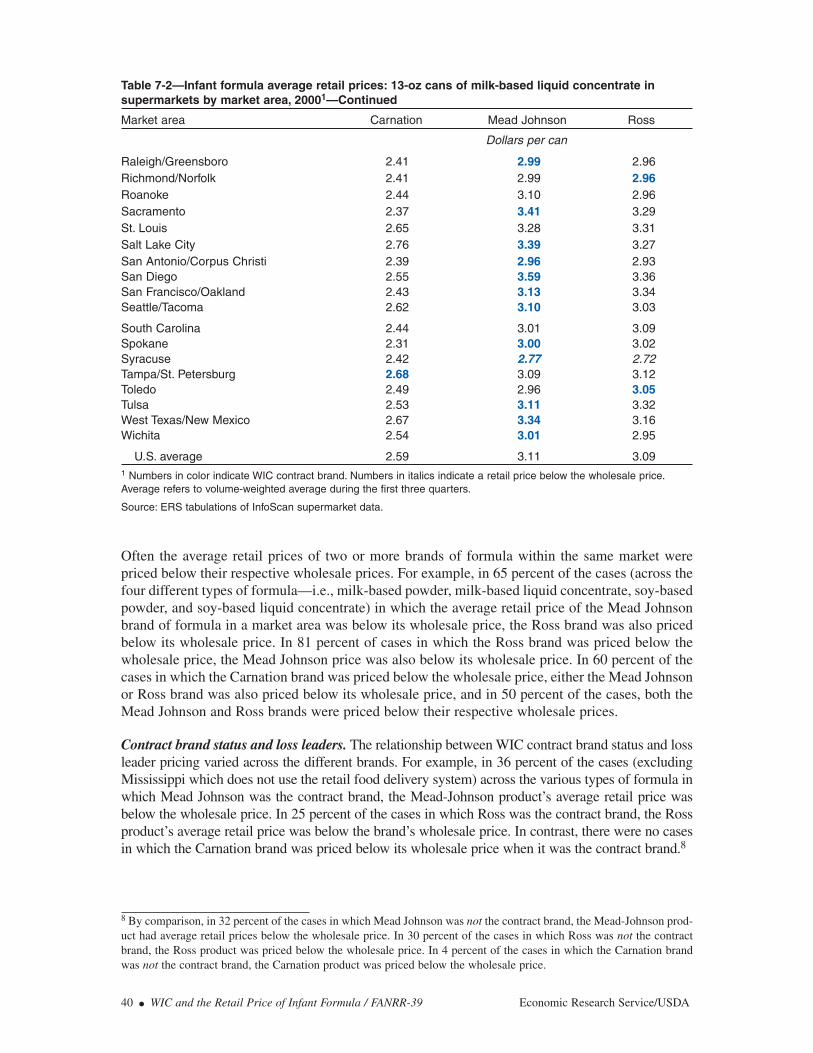
Often the average retail prices of two or more brands of formula within the same market werepriced below their respective wholesale prices. For example, in 65 percent of the cases (across thefour different types of formula—i.e., milk-based powder, milk-based liquid concentrate, soy-basedpowder, and soy-based liquid concentrate) in which the average retail price of the Mead Johnsonbrand of formula in a market area was below its wholesale price, the Ross brand was also pricedbelow its wholesale price. In 81 percent of cases in which the Ross brand was priced below thewholesale price, the Mead Johnson price was also below its wholesale price. In 60 percent of thecases in which the Carnation brand was priced below the wholesale price, either the Mead Johnsonor Ross brand was also priced below its wholesale price, and in 50 percent of the cases, both theMead Johnson and Ross brands were priced below their respective wholesale prices.
Contract brand status and loss leaders. The relationship between WIC contract brand status and lossleader pricing varied across the different brands. For example, in 36 percent of the cases (excludingMississippi which does not use the retail food delivery system) across the various types of formula inwhich Mead Johnson was the contract brand, the Mead-Johnson product’s average retail price wasbelow the wholesale price. In 25 percent of the cases in which Ross was the contract brand, the Rossproduct’s average retail price was below the brand’s wholesale price. In contrast, there were no casesin which the Carnation brand was priced below its wholesale price when it was the contract brand.8
40 ● WIC and the Retail Price of Infant Formula / FANRR-39 Economic Research Service/USDA
Table 7-2—Infant formula average retail prices: 13-oz cans of milk-based liquid concentrate in supermarkets by market area, 20001—Continued
Market area Carnation Mead Johnson Ross
Dollars per can
Raleigh/Greensboro 2.41 2.99 2.96Richmond/Norfolk 2.41 2.99 2.96Roanoke 2.44 3.10 2.96Sacramento 2.37 3.41 3.29St. Louis 2.65 3.28 3.31Salt Lake City 2.76 3.39 3.27San Antonio/Corpus Christi 2.39 2.96 2.93San Diego 2.55 3.59 3.36San Francisco/Oakland 2.43 3.13 3.34Seattle/Tacoma 2.62 3.10 3.03
South Carolina 2.44 3.01 3.09Spokane 2.31 3.00 3.02Syracuse 2.42 2.77 2.72Tampa/St. Petersburg 2.68 3.09 3.12Toledo 2.49 2.96 3.05Tulsa 2.53 3.11 3.32West Texas/New Mexico 2.67 3.34 3.16Wichita 2.54 3.01 2.95
U.S. average 2.59 3.11 3.091 Numbers in color indicate WIC contract brand. Numbers in italics indicate a retail price below the wholesale price.Average refers to volume-weighted average during the first three quarters.
Source: ERS tabulations of InfoScan supermarket data.
8 By comparison, in 32 percent of the cases in which Mead Johnson was not the contract brand, the Mead-Johnson prod-uct had average retail prices below the wholesale price. In 30 percent of the cases in which Ross was not the contractbrand, the Ross product was priced below the wholesale price. In 4 percent of the cases in which the Carnation brandwas not the contract brand, the Carnation product was priced below the wholesale price.

Economic Research Service/USDA WIC and the Retail Price of Infant Formula / FANRR-39 ● 41
Table 7-3—Infant formula average retail prices: 14- to 16-oz cans of soy-based powder in supermarkets by market area, 20001
Market area PBM (Wyeth) Carnation Mead Johnson Ross
Dollars per 26 ounces reconstituted
Albany 1.79 2.04 2.32 2.29Atlanta 1.52 2.03 2.87 2.77Baltimore/Washington 1.59 2.01 2.87 2.78Birmingham/Montgomery 1.75 2.11 2.84 2.88Boise 1.55 2.04 2.65 2.59Boston 1.79 2.06 2.71 2.62Buffalo/Rochester 1.60 1.94 2.46 2.38Charlotte 1.51 2.00 2.84 2.76Chicago — 2.21 3.38 3.09Cincinnati/Dayton 1.51 1.93 2.52 2.56
Cleveland 1.68 2.09 2.77 2.65Columbus 1.53 1.81 2.79 2.72Dallas/Ft. Worth 1.63 2.11 2.95 2.89Denver 1.69 2.10 2.91 2.90Des Moines 1.75 2.12 3.26 2.84Detroit 1.55 2.01 2.81 2.79Grand Rapids 1.46 1.95 2.43 2.44Green Bay — 2.09 3.13 3.04Harrisburg/Scranton 1.55 2.01 2.79 2.70Hartford/Springfield 1.78 2.09 2.68 2.69
Houston 1.57 2.07 2.83 2.77Indianapolis 1.62 1.98 2.78 2.54Jacksonville 1.58 2.09 2.87 2.72Kansas City 1.62 2.14 3.06 2.86Knoxville 1.54 1.99 2.80 2.72Little Rock 1.59 2.06 3.09 3.18Los Angeles 1.80 2.05 3.14 2.89Louisville 1.56 1.96 2.67 2.59Memphis 1.60 2.10 3.15 3.17Miami/Ft. Lauderdale 1.69 2.10 2.92 2.73
Milwaukee 1.73 2.13 2.92 3.02Minneapolis/St. Paul — 2.05 2.94 2.78Mississippi 1.49 2.10 2.94 3.03Nashville 1.55 1.98 2.83 2.89New England 1.79 2.09 2.68 2.55New Orleans/Mobile 1.56 2.14 3.14 2.85New York 1.75 2.18 2.88 2.70Oklahoma City 1.64 2.10 3.05 2.91Omaha 1.66 2.06 2.83 2.75Orlando 1.66 2.09 2.93 2.78
Peoria/Springfield 1.56 2.10 2.87 2.73Philadelphia 1.83 2.21 2.82 2.74Phoenix/Tucson 1.66 1.85 2.48 2.35Pittsburgh — 2.19 2.87 2.60Portland, Oregon 1.64 2.23 3.13 2.94Providence 1.79 2.13 2.72 2.62See notes at end of table. Continued—
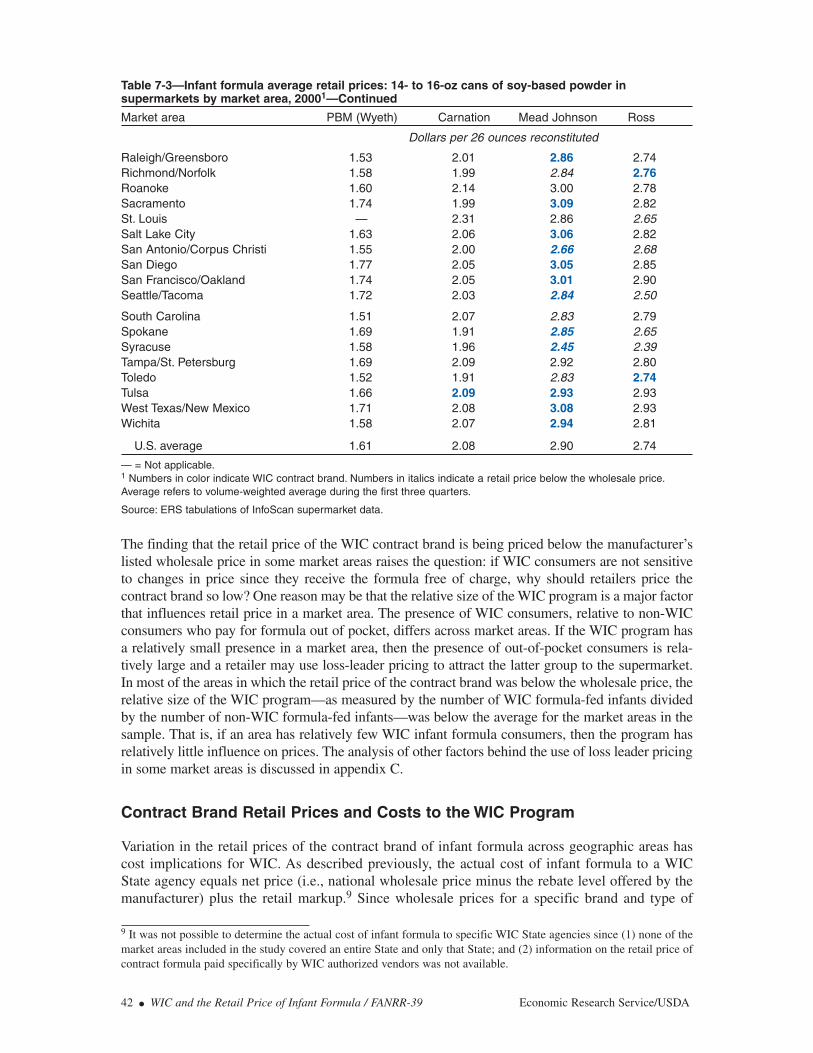
The finding that the retail price of the WIC contract brand is being priced below the manufacturer’slisted wholesale price in some market areas raises the question: if WIC consumers are not sensitiveto changes in price since they receive the formula free of charge, why should retailers price thecontract brand so low? One reason may be that the relative size of the WIC program is a major factorthat influences retail price in a market area. The presence of WIC consumers, relative to non-WICconsumers who pay for formula out of pocket, differs across market areas. If the WIC program hasa relatively small presence in a market area, then the presence of out-of-pocket consumers is rela-tively large and a retailer may use loss-leader pricing to attract the latter group to the supermarket.In most of the areas in which the retail price of the contract brand was below the wholesale price, therelative size of the WIC program—as measured by the number of WIC formula-fed infants dividedby the number of non-WIC formula-fed infants—was below the average for the market areas in thesample. That is, if an area has relatively few WIC infant formula consumers, then the program hasrelatively little influence on prices. The analysis of other factors behind the use of loss leader pricingin some market areas is discussed in appendix C.
Contract Brand Retail Prices and Costs to the WIC Program
Variation in the retail prices of the contract brand of infant formula across geographic areas hascost implications for WIC. As described previously, the actual cost of infant formula to a WICState agency equals net price (i.e., national wholesale price minus the rebate level offered by themanufacturer) plus the retail markup.9 Since wholesale prices for a specific brand and type of
42 ● WIC and the Retail Price of Infant Formula / FANRR-39 Economic Research Service/USDA
Table 7-3—Infant formula average retail prices: 14- to 16-oz cans of soy-based powder in supermarkets by market area, 20001—Continued
Market area PBM (Wyeth) Carnation Mead Johnson Ross
Dollars per 26 ounces reconstituted
Raleigh/Greensboro 1.53 2.01 2.86 2.74Richmond/Norfolk 1.58 1.99 2.84 2.76Roanoke 1.60 2.14 3.00 2.78Sacramento 1.74 1.99 3.09 2.82St. Louis — 2.31 2.86 2.65Salt Lake City 1.63 2.06 3.06 2.82San Antonio/Corpus Christi 1.55 2.00 2.66 2.68San Diego 1.77 2.05 3.05 2.85San Francisco/Oakland 1.74 2.05 3.01 2.90Seattle/Tacoma 1.72 2.03 2.84 2.50
South Carolina 1.51 2.07 2.83 2.79Spokane 1.69 1.91 2.85 2.65Syracuse 1.58 1.96 2.45 2.39Tampa/St. Petersburg 1.69 2.09 2.92 2.80Toledo 1.52 1.91 2.83 2.74Tulsa 1.66 2.09 2.93 2.93West Texas/New Mexico 1.71 2.08 3.08 2.93Wichita 1.58 2.07 2.94 2.81
U.S. average 1.61 2.08 2.90 2.74
— = Not applicable.1 Numbers in color indicate WIC contract brand. Numbers in italics indicate a retail price below the wholesale price.Average refers to volume-weighted average during the first three quarters.
Source: ERS tabulations of InfoScan supermarket data.
9 It was not possible to determine the actual cost of infant formula to specific WIC State agencies since (1) none of themarket areas included in the study covered an entire State and only that State; and (2) information on the retail price ofcontract formula paid specifically by WIC authorized vendors was not available.
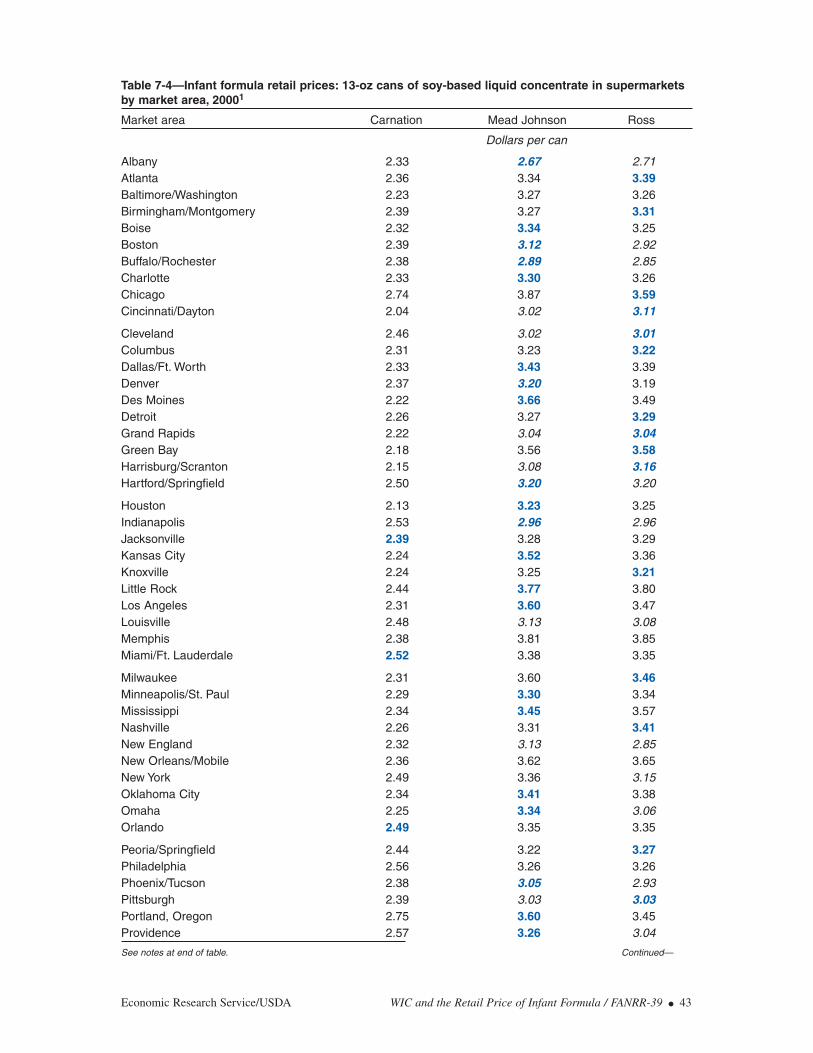
Economic Research Service/USDA WIC and the Retail Price of Infant Formula / FANRR-39 ● 43
Table 7-4—Infant formula retail prices: 13-oz cans of soy-based liquid concentrate in supermarketsby market area, 20001
Market area Carnation Mead Johnson Ross
Dollars per can
Albany 2.33 2.67 2.71Atlanta 2.36 3.34 3.39Baltimore/Washington 2.23 3.27 3.26Birmingham/Montgomery 2.39 3.27 3.31Boise 2.32 3.34 3.25Boston 2.39 3.12 2.92Buffalo/Rochester 2.38 2.89 2.85Charlotte 2.33 3.30 3.26Chicago 2.74 3.87 3.59Cincinnati/Dayton 2.04 3.02 3.11
Cleveland 2.46 3.02 3.01Columbus 2.31 3.23 3.22Dallas/Ft. Worth 2.33 3.43 3.39Denver 2.37 3.20 3.19Des Moines 2.22 3.66 3.49Detroit 2.26 3.27 3.29Grand Rapids 2.22 3.04 3.04Green Bay 2.18 3.56 3.58Harrisburg/Scranton 2.15 3.08 3.16Hartford/Springfield 2.50 3.20 3.20
Houston 2.13 3.23 3.25Indianapolis 2.53 2.96 2.96Jacksonville 2.39 3.28 3.29Kansas City 2.24 3.52 3.36Knoxville 2.24 3.25 3.21Little Rock 2.44 3.77 3.80Los Angeles 2.31 3.60 3.47Louisville 2.48 3.13 3.08Memphis 2.38 3.81 3.85Miami/Ft. Lauderdale 2.52 3.38 3.35
Milwaukee 2.31 3.60 3.46Minneapolis/St. Paul 2.29 3.30 3.34Mississippi 2.34 3.45 3.57Nashville 2.26 3.31 3.41New England 2.32 3.13 2.85New Orleans/Mobile 2.36 3.62 3.65New York 2.49 3.36 3.15Oklahoma City 2.34 3.41 3.38Omaha 2.25 3.34 3.06Orlando 2.49 3.35 3.35
Peoria/Springfield 2.44 3.22 3.27Philadelphia 2.56 3.26 3.26Phoenix/Tucson 2.38 3.05 2.93Pittsburgh 2.39 3.03 3.03Portland, Oregon 2.75 3.60 3.45Providence 2.57 3.26 3.04
See notes at end of table. Continued—

formula (see table 6-1) do not vary across areas, variation in the retail markup is determined solelyby variation in the retail price.
Because WIC receives rebates that are generally large relative to the wholesale price, the net priceis relatively small—for example, the average net price for a can of milk-based liquid concentratewas only 20 cents as of September 2000. Since the retail markup may approach or even exceed netprice in areas with high retail prices, the retail price of the contract brand of formula as well as theamount of the manufacturer’s rebate play important roles in determining the cost of infant formulato the WIC program.10
44 ● WIC and the Retail Price of Infant Formula / FANRR-39 Economic Research Service/USDA
Table 7-4—Infant formula retail prices: 13-oz cans of soy-based liquid concentrate in supermarketsby market area, 20001—Continued
Market area Carnation Mead Johnson Ross
Dollars per can
Raleigh/Greensboro 2.33 3.29 3.23Richmond/Norfolk 2.30 3.29 3.24Roanoke 2.33 3.43 3.26Sacramento 2.42 3.64 3.45St. Louis 2.64 3.34 3.27Salt Lake City 2.37 3.72 3.63San Antonio/Corpus Christi 2.26 3.05 3.20San Diego 2.31 3.59 3.36San Francisco/Oakland 2.40 3.44 3.54Seattle/Tacoma 2.34 3.41 3.30
South Carolina 2.31 3.29 3.31Spokane 2.02 3.23 3.30Syracuse 2.53 2.88 2.87Tampa/St. Petersburg 2.39 3.37 3.36Toledo 2.29 3.22 3.27Tulsa 2.38 3.47 3.41West Texas/New Mexico 2.45 3.50 3.46Wichita 2.21 3.34 3.16
U.S. average 2.43 3.35 3.291 Numbers in color indicate WIC contract brand. Numbers in italics indicate a retail price below the wholesale price.Average refers to volume-weighted average during the first three quarters.
Source: ERS tabulations of InfoScan supermarket data.
10 ERS analysis of InfoScan data indicate that, at the national level, the average retail markup per can of milk-based liquid concentrate, regardless of contract brand status, was about 21 cents for Mead Johnson products, 20 cents for Rossproducts, and 35 cents for Carnation products.
Chapter 8
Event Study Analysis of Retail Infant Formula Prices
The primary objective of this report is to determine the effects of WIC and its infant formula rebateprogram on infant formula retail prices beyond their effect on wholesale prices. The examinationin the previous section of average retail prices across market areas did not reveal a clear andconsistent relationship between being the WIC contract brand and having the highest average retailprice. However, comparing the retail prices of contract and noncontract brands of formula bymarket area does not necessarily identify WIC-related price effects since other factors may affectretail prices, too. For example, a brand’s wholesale price is an important determinant of thatbrand’s retail price, and therefore differences in wholesale price across manufacturers canconfound price effects due to WIC and its rebate program.1
An event study methodology and a multivariate regression methodology are two approachesfor holding other factors constant in order to isolate WIC-related price effects. The event studyis simpler to implement than a regression approach, and as a result of that simplicity, the eventstudy’s results may be more transparent and easier to interpret. On the other hand, the eventstudy approach has certain inherent limitations and statistical weaknesses that can be remediedby using the more sophisticated regression approach—but at the cost of greater complexity inboth implementation and interpretation. This chapter describes the event study and its results,while the next chapter explains the regression analysis approach and its results.
The event study analysis used here examines the change in retail infant formula prices when theholder (i.e., the infant formula manufacturer) of the WIC contract changes. Thus, the specific“event” referred to in this “event study” analysis is a change in the contract brand in a particularmarket area. The event differed in time from market area to market area, and some market areashad two events during the 1994-2000 study period. A new WIC contract does not in itself consti-tute an event: if a State WIC agency awarded a new contract without a change in contract brand—i.e., the new contract was awarded to the same manufacturer that held the old contract—then nochange in contract brand took place.
The event study analysis may also be called a “pre-/postanalysis.” Specifically, it compares theprechange and postchange retail prices of the infant formula brand of the contract winner (i.e., thenew WIC contract holder) in a market area with the pre- and postchange retail prices of both theinfant formula brand of the contract loser (i.e., the old WIC contract holder) and the other brandof infant formula in the market area (other brands of formula are brands in which their WICcontract status did not change during the period—that is, they neither won nor lost the WICcontract).2 If the change in retail prices during the pre- and postchange period is greater for thenew contract holder relative to the old contract holder and the other brand of formula, it wouldsuggest that being the WIC contract brand results in higher retail prices.
Economic Research Service/USDA WIC and the Retail Price of Infant Formula / FANRR-39 ● 45
1 Carnation’s wholesale price, for example, is well below the wholesale prices of Mead Johnson and Ross. Even aftertaking into account that retailers generally establish a percentage retail markup for Carnation that is greater than that ofthe other two brands, Carnation products can be expected to be sold in most market areas at a relatively low retail pricedue to Carnation’s relatively low wholesale price. Thus, any price-increasing effect of Carnation being the WIC contractbrand would have to be so large as to overcome the price-dampening effect of its relatively low wholesale price. As aresult, being the WIC contract brand in a specific area can increase the retail price of that formula in the area and yet itsprice may still be below the prices of the other noncontract brands. 2 In this analysis, one “other” brand was designated per market area. In those instances in which there were severalbrands of formula none of which won or lost the WIC contract during the period in question, the “other” brand was rep-resented by the brand of the larger manufacturer.
A key assumption underlying the event study analysis is that the prechange and postchangeperiods are sufficiently close together so that, within the given market area for each event, otherprice-determining factors are essentially constant.3 The InfoScan data on infant formula retailprices were collected by quarter. To determine the effect of a change in the holder of the WICcontract in this study, the price of formula in the quarter before the change occurred was comparedwith the price in the quarter after the change occurred. For example, if the change in the WICcontract occurred during the 3rd quarter of 1998, then the price of infant formula in the 4th quarterof 1998 (postchange) was compared with the price in the 2nd quarter of 1998 (prechange).4
Within the 54 market areas in which a WIC contract brand was designated, the holder of the WICmilk-based contract changed 51 times during the 1994-2000 study period and the holder of theWIC soy-based contract changed 47 times.5 In 12 cases, the change in the WIC contract holder inboth the milk- and soy-based markets involved Wyeth losing the WIC contract in 1996, the sameyear that Wyeth phased out their production of infant formulas for the U.S. market. BecauseWyeth’s exit during this period could have affected the retail pricing of their formulas, these 12cases were excluded in the following analysis.6
Appendix B contains tables of infant formula retail prices, pre- and postchange, by individualmarket areas. In 33 of the 39 events in which the WIC contract for milk-based powder changed(excluding those cases where Wyeth lost the contract in 1996), the price of WIC contract-winningbrand of formula increased more than the price of the contract-losing formula (appendix table B-1).7
In 30 of the 39 events, the price of the winning contract holder’s formula increased more than theprice of the “other” brand of formula. With regard to milk-based liquid concentrate, in 35 of the39 events the change in the price of the contract-winning brand of formula exceeded the changein price of the contract-losing brand and in 31 of the 39 events, the price change in the contract-winning formula exceeded that of the “other” formula (appendix table B-2). Tests indicated thatthese results were statistically significant at the 5 percent level of significance (i.e., there was lessthan a 1 in 20 chance of these results occurring as a random event).8
This statistically significant pattern also held for the soy-based infant formulas. In 23 of the 35events in which the WIC contract for powder changed (excluding those cases where Wyeth lost thecontract in 1996), the price of the contract-winning brand of formula increased more than the priceof the contract-losing brand, and in 20 of 27 events, the price of the contract-winning brandincreased more than that of the “other” brand (in 8 market areas, there were no sales data for the“other” brand during the period in which the contract changed) (appendix table B-3). For liquidconcentrate formula, the change in the price of the winning contract brand of formula exceededthe change in price of the contract-losing brand in 24 of the 35 events, while in 19 of the 27 events,
46 ● WIC and the Retail Price of Infant Formula / FANRR-39 Economic Research Service/USDA
3 For example, changes in a market area’s average income or its poverty rate may affect the area’s infant formula prices,but in short spans of time such factors do not usually fluctuate by large amounts. 4 The quarter after the change was used to represent the “postchange” since the contract may have changed late in aquarter and most of that quarter’s data would be more representative of the period before the change. In addition,because of existing inventory at the time of the change, retailers may wait until they have sold off their existing stock offormula before instituting a price change. 5 In some market areas with separate solicitations, the holder of the milk-based contract changed while the holder of thesoy-based contract remained the same (or vice versa). Some market areas experienced two changes in the holder of theWIC contract during the study period. 6 The same general conclusions concerning price effects would be reached whether or not these 12 cases were includedin the analysis; see appendix B. 7 Two “events” could occur in a market area if that market area experienced two changes in the holder of the WIC contract during the study period. 8 Sign tests were used to test for statistical significance.
the price change in the contract-winning brand exceeded that of the “other” formula (there wereno sales data for the “other” brand in 8 of the events) (appendix table B-4).
The average change in the retail price of formula after a change in the WIC contract holder byproduct base and form is summarized in figure 8-1. The results clearly show that the averageincrease in infant formula prices pre- and postchange in contract holder was greater for thecontract-winning brand of formula than for both the contract-losing brand of formula and the“other” brand of formula. For example, the retail price of milk-based powdered formula for thecontract-winning brand increased by an average of 10 cents compared with 3 cents for thecontract-losing brand of formula and 5 cents for the other” brand. This general result held regard-less of product base and physical form. These findings are consistent with economic theory.Winning the WIC contract increases the demand for the contract brand of formula resulting in anincrease in its retail price since price-insensitive WIC recipients are required to purchase the WICbrand of formula.9 Demand for the contract brand of formula may also increase among non-WICconsumers to the degree that winning the WIC contract results in increased shelf space in storesor if physicians recommend the contract brand to non-WIC mothers.
Table 8-1 shows the average change in the retail price of infant formula by brand when the WICcontract holder changes.10 For example, the average price of Carnation brand milk-basedpowdered formula increased by 14 cents when it won the contract but increased only 8 cents whenit lost the contract.11 In every case, the average price of a manufacturer’s infant formula increasedmore when it gained the WIC contract than when it lost the contract. That is, regardless of thebrand of formula, winning the WIC contract resulted in an average increase in its retail pricegreater than when it lost the contract.
One might expect that after losing the WIC contract, the retail price of the contract-losing brandwould decrease, or at least increase to a lesser degree than the price of the “other” brand. That is,since it no longer was the WIC contract brand of formula (and therefore no longer guaranteed allthe WIC sales), the demand for that product would lessen, resulting in lower prices, or at leastprices that increase by relatively little. At the same time, the “other” brand neither gains nor losesthe demand of the WIC household. Tests were conducted to determine whether the percentage ofcases in which the change in the price of the “other” brand was greater than that of the old WICcontract holder was statistically significant. However, the proportion of market areas in which thechange in the price of the “other” infant formula exceeded the change in the price of the old WICcontract holder was not statistically different from 50 percent. For example, in 24 of the 39 marketareas in which the WIC contract for milk-based powder changed (excluding those cases whereWyeth lost the contract in 1996), the price of the “other” WIC contract holder increased more thanthe price of the contract-losing brand. For milk-based liquid concentrate formula in 20 of the 39market areas, the price of the “other” WIC contract holder increased more than the did the priceof the contract-losing brand. With regard to soy-based powder, in only 8 of the 27 market areas didthe change in the price of the “other” brand exceed the change in price of the contract-losing brandand, in 11 of these 27 areas, the price change in the “other” brand’s soy-based liquid concentrateformula exceeded that of the contract-losing brand of formula.
One possible explanation for this result is that demand for infant formula exhibits strong brandpreference or habit persistence. This may result from the effects of medical detailing and/or the
Economic Research Service/USDA WIC and the Retail Price of Infant Formula / FANRR-39 ● 47
9 For an additional discussion on the economic theory on how WIC contracts may affect retail prices, see appendix C.10 For this analysis, all market areas in which the WIC contract changed (even those areas in which Wyeth lost the contract in 1996) were included. 11 Note that the average increase in prices of Carnation brand formulas was based on only a small number of observations.

actual or perceived digestive sensitivities of infants to product changes.12 Consequently, prices ofinfant formula may be “sticky downwards”—that is, they tend not to decrease. Although someretailers may lower the price of infant formula to act as a loss leader at least in some instances, theevent study analysis indicates that, on average, retailers do not lower price when a particular brandloses the WIC contract. Instead, retailers simply do not raise the price of the contract-losing brandof formula as much as the price of the new WIC contract brand.
48 ● WIC and the Retail Price of Infant Formula / FANRR-39 Economic Research Service/USDA
Note: The change in price reflects the difference in the price of infant formula in the quarter before the holder of the WIC contract changed and the price in the quarter after the change occurred. Based on unweighted data, that is, each market area was given the same weight.
Figure 8-1
Change in the retail price of infant formula when the holder of the WIC contract changes
Cents per 26 reconstituted ounces
Milk-based powder Milk-based liquid concentrate Soy-based powder Soy-based liquid concentrate0
24
68
1012
14
1618
Source: ERS analysis of InfoScan supermarket data.
New WIC contract holder
Other brand
Old WIC contract holder
Table 8-1—Average change in retail price of formula when the holder of the WIC contract changes,by formula type and manufacturer
New WIC Old WIC Formula type/manufacturer contract holder contract holder
DollarsMilk-based powder:
Carnation 0.14 (n=4) 0.08 (n=5)Mead Johnson 0.11 (n=32) 0.04 (n=12)Ross 0.1 (n=12) 0.0 (n=20)
Milk-based liquid concentrate:Carnation 0.16 (n=4) 0.11 (n=5)Mead Johnson 0.17 (n=32) 0.04 (n=12)Ross 0.11 (n=12) 0.02 (n=20)
Soy-based powder:Carnation 0.1 (n=4) NA (n=0)Mead Johnson 0.06 (n=28) 0.05 (n=12)Ross 0.06 (n=12) 0.03 (n=21)
Soy-based liquid concentrate:Carnation 0.14 (n=4) NA (n=0)Mead Johnson 0.09 (n=28) 0.03 (n=12)Ross 0.12 (n=12) 0.04 (n=21)
Notes: N=number of observations. NA=No data available. Change in price reflects the difference in the price of infantformula in the quarter before the holder of the WIC contract changed and the price in the quarter after the changeoccurred.
Source: ERS analysis of InfoScan supermarket data.
12 For example, parents who are satisfied with an infant formula may be reluctant to change brands out of concern thattheir infant will not tolerate the new formula as well.

Chapter 9
Multivariate Analysis of the Determinants of RetailInfant Formula Prices
Although the event study analysis described earlier strongly suggests that being the WIC contractbrand leads to higher retail prices relative to the noncontract brands, the analysis has several limi-tations. First, it examines changes in price over a relatively short period—from shortly before toshortly after a change in the holder of the WIC contract. The analysis does not indicate if the posi-tive effect that being the WIC contract holder has on the price of infant formula holds up overlonger periods: a more thorough analysis requires that differences in infant formula retail pricesby WIC contract status be examined over a longer period. Second, the event study analysis looksonly at market areas in which the WIC contract brand changed over the 1994-2000 study period.Thirteen of the 54 market areas in which a WIC brand was designated did not experience a changein the milk-based contract brand during the study period while 17 market areas did not experiencea change in the soy-based contract brand. A methodology that can also examine market areas withno changes in the WIC contract holder would support broader conclusions. Third, the event studyanalysis does not control for other factors that may have influenced changes in infant formulaprices by brand. The possible confounding effects of these various factors must be disentangled inorder to definitively determine the relationship between WIC contract brand status and retail price.
In order to assess the quantitative relationship between the WIC infant formula rebate program andretail infant formula prices within individual market areas over the entire 1994-2000 study period,a multivariate regression analyses was used. Multivariate regression analysis is a statistical toolused to study the statistical dependence of a variable, called the dependent variable, on two ormore other variables, called explanatory or independent variables. It measures the net effect of anindependent variable on the dependent variable, given that other independent variables are in themodel. It has the benefit of simultaneously controlling for multiple factors that may influence theretail price of infant formula, such as the wholesale price of infant formula, consumer income, andthe presence of discount stores. (See appendix C for a discussion of the theoretical basis of theregression model.)
The Regression Model
The dependent variable in the model was the average real (i.e., inflation-adjusted) retail price ofinfant formula in supermarkets in a particular market area. Since retail prices may be influencedby a number of factors, it is important to control for as many of these confounding factors aspossible when assessing the quantitative relationship between WIC’s infant formula rebatesystem and the retail price of formula. Therefore, the model included a number of independentvariables to represent economic, demographic, and WIC program factors thought to influence theretail price of infant formula (table 9-1).These independent variables included the median house-hold income in the area, the poverty rate, the wholesale price of infant formula, the presence ofWyeth and PBM infant formula products, and a measure of number of discount stores (seeappendix E for detailed information on the construction of the variables used in the model).1 Onepotential complicating factor to modeling factors influencing the retail price of infant formula is
Economic Research Service/USDA WIC and the Retail Price of Infant Formula / FANRR-39 ● 49
1 While a market area’s median household income and its poverty rate may be (negatively) correlated, both variables areincluded in the regression model. The former measures the income level at which a market area’s income distribution iscentered while the latter reflects the shape of the income distribution; in principle, either variable can change separatelyfrom the other and both variables can affect infant formula retail prices.
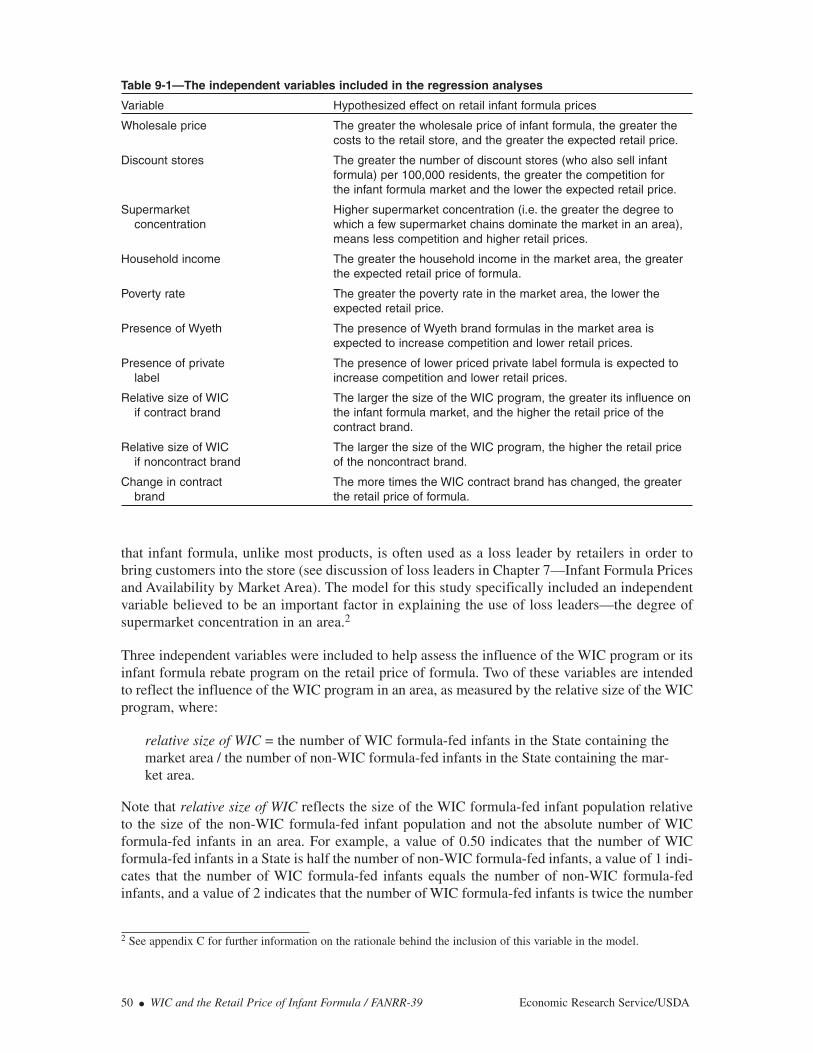
that infant formula, unlike most products, is often used as a loss leader by retailers in order tobring customers into the store (see discussion of loss leaders in Chapter 7—Infant Formula Pricesand Availability by Market Area). The model for this study specifically included an independentvariable believed to be an important factor in explaining the use of loss leaders—the degree ofsupermarket concentration in an area.2
Three independent variables were included to help assess the influence of the WIC program or itsinfant formula rebate program on the retail price of formula. Two of these variables are intendedto reflect the influence of the WIC program in an area, as measured by the relative size of the WICprogram, where:
relative size of WIC = the number of WIC formula-fed infants in the State containing themarket area / the number of non-WIC formula-fed infants in the State containing the mar-ket area.
Note that relative size of WIC reflects the size of the WIC formula-fed infant population relativeto the size of the non-WIC formula-fed infant population and not the absolute number of WICformula-fed infants in an area. For example, a value of 0.50 indicates that the number of WICformula-fed infants in a State is half the number of non-WIC formula-fed infants, a value of 1 indi-cates that the number of WIC formula-fed infants equals the number of non-WIC formula-fedinfants, and a value of 2 indicates that the number of WIC formula-fed infants is twice the number
50 ● WIC and the Retail Price of Infant Formula / FANRR-39 Economic Research Service/USDA
2 See appendix C for further information on the rationale behind the inclusion of this variable in the model.
Table 9-1—The independent variables included in the regression analyses
Variable Hypothesized effect on retail infant formula prices
Wholesale price The greater the wholesale price of infant formula, the greater the costs to the retail store, and the greater the expected retail price.
Discount stores The greater the number of discount stores (who also sell infant formula) per 100,000 residents, the greater the competition for the infant formula market and the lower the expected retail price.
Supermarket Higher supermarket concentration (i.e. the greater the degree to concentration which a few supermarket chains dominate the market in an area),
means less competition and higher retail prices.
Household income The greater the household income in the market area, the greater the expected retail price of formula.
Poverty rate The greater the poverty rate in the market area, the lower the expected retail price.
Presence of Wyeth The presence of Wyeth brand formulas in the market area is expected to increase competition and lower retail prices.
Presence of private The presence of lower priced private label formula is expected to label increase competition and lower retail prices.
Relative size of WIC The larger the size of the WIC program, the greater its influence on if contract brand the infant formula market, and the higher the retail price of the
contract brand.
Relative size of WIC The larger the size of the WIC program, the higher the retail price if noncontract brand of the noncontract brand.
Change in contract The more times the WIC contract brand has changed, the greater brand the retail price of formula.
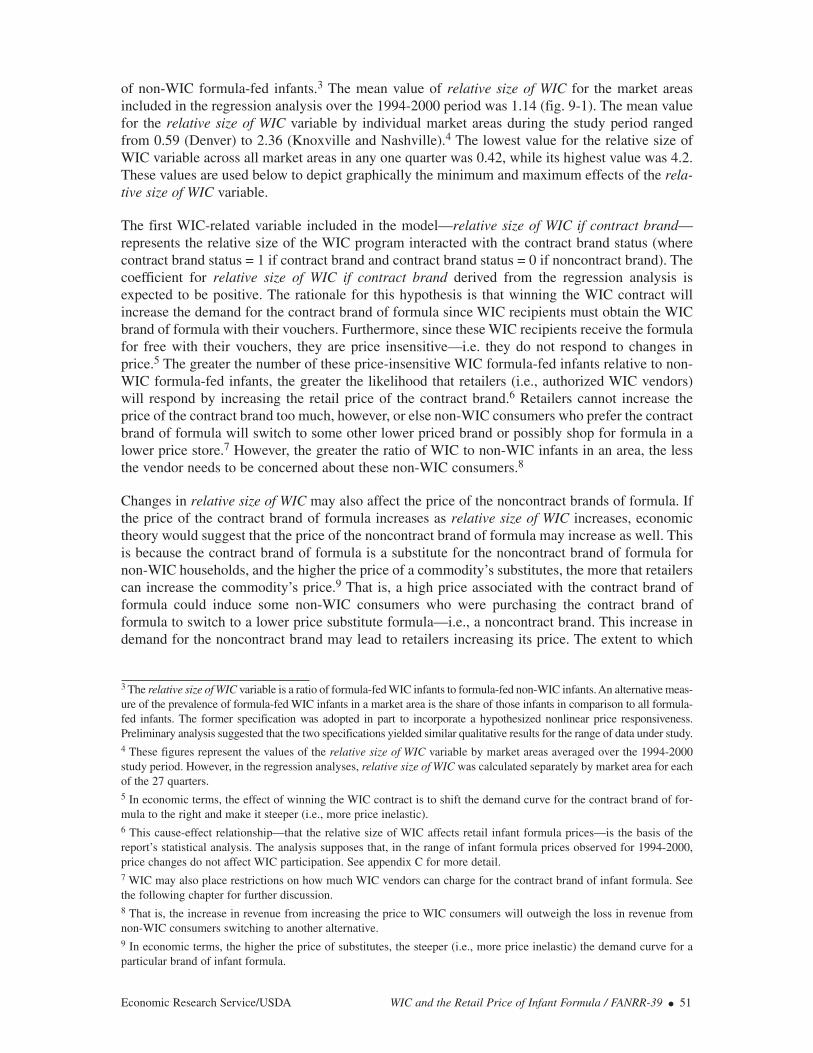
of non-WIC formula-fed infants.3 The mean value of relative size of WIC for the market areasincluded in the regression analysis over the 1994-2000 period was 1.14 (fig. 9-1). The mean valuefor the relative size of WIC variable by individual market areas during the study period rangedfrom 0.59 (Denver) to 2.36 (Knoxville and Nashville).4 The lowest value for the relative size ofWIC variable across all market areas in any one quarter was 0.42, while its highest value was 4.2.These values are used below to depict graphically the minimum and maximum effects of the rela-tive size of WIC variable.
The first WIC-related variable included in the model—relative size of WIC if contract brand—represents the relative size of the WIC program interacted with the contract brand status (wherecontract brand status = 1 if contract brand and contract brand status = 0 if noncontract brand). Thecoefficient for relative size of WIC if contract brand derived from the regression analysis isexpected to be positive. The rationale for this hypothesis is that winning the WIC contract willincrease the demand for the contract brand of formula since WIC recipients must obtain the WICbrand of formula with their vouchers. Furthermore, since these WIC recipients receive the formulafor free with their vouchers, they are price insensitive—i.e. they do not respond to changes inprice.5 The greater the number of these price-insensitive WIC formula-fed infants relative to non-WIC formula-fed infants, the greater the likelihood that retailers (i.e., authorized WIC vendors)will respond by increasing the retail price of the contract brand.6 Retailers cannot increase theprice of the contract brand too much, however, or else non-WIC consumers who prefer the contractbrand of formula will switch to some other lower priced brand or possibly shop for formula in alower price store.7 However, the greater the ratio of WIC to non-WIC infants in an area, the lessthe vendor needs to be concerned about these non-WIC consumers.8
Changes in relative size of WIC may also affect the price of the noncontract brands of formula. Ifthe price of the contract brand of formula increases as relative size of WIC increases, economictheory would suggest that the price of the noncontract brand of formula may increase as well. Thisis because the contract brand of formula is a substitute for the noncontract brand of formula fornon-WIC households, and the higher the price of a commodity’s substitutes, the more that retailerscan increase the commodity’s price.9 That is, a high price associated with the contract brand offormula could induce some non-WIC consumers who were purchasing the contract brand offormula to switch to a lower price substitute formula—i.e., a noncontract brand. This increase indemand for the noncontract brand may lead to retailers increasing its price. The extent to which
Economic Research Service/USDA WIC and the Retail Price of Infant Formula / FANRR-39 ● 51
3 The relative size of WIC variable is a ratio of formula-fed WIC infants to formula-fed non-WIC infants. An alternative meas-ure of the prevalence of formula-fed WIC infants in a market area is the share of those infants in comparison to all formula-fed infants. The former specification was adopted in part to incorporate a hypothesized nonlinear price responsiveness.Preliminary analysis suggested that the two specifications yielded similar qualitative results for the range of data under study. 4 These figures represent the values of the relative size of WIC variable by market areas averaged over the 1994-2000study period. However, in the regression analyses, relative size of WIC was calculated separately by market area for eachof the 27 quarters. 5 In economic terms, the effect of winning the WIC contract is to shift the demand curve for the contract brand of for-mula to the right and make it steeper (i.e., more price inelastic). 6 This cause-effect relationship—that the relative size of WIC affects retail infant formula prices—is the basis of thereport’s statistical analysis. The analysis supposes that, in the range of infant formula prices observed for 1994-2000,price changes do not affect WIC participation. See appendix C for more detail. 7 WIC may also place restrictions on how much WIC vendors can charge for the contract brand of infant formula. Seethe following chapter for further discussion. 8 That is, the increase in revenue from increasing the price to WIC consumers will outweigh the loss in revenue fromnon-WIC consumers switching to another alternative. 9 In economic terms, the higher the price of substitutes, the steeper (i.e., more price inelastic) the demand curve for aparticular brand of infant formula.
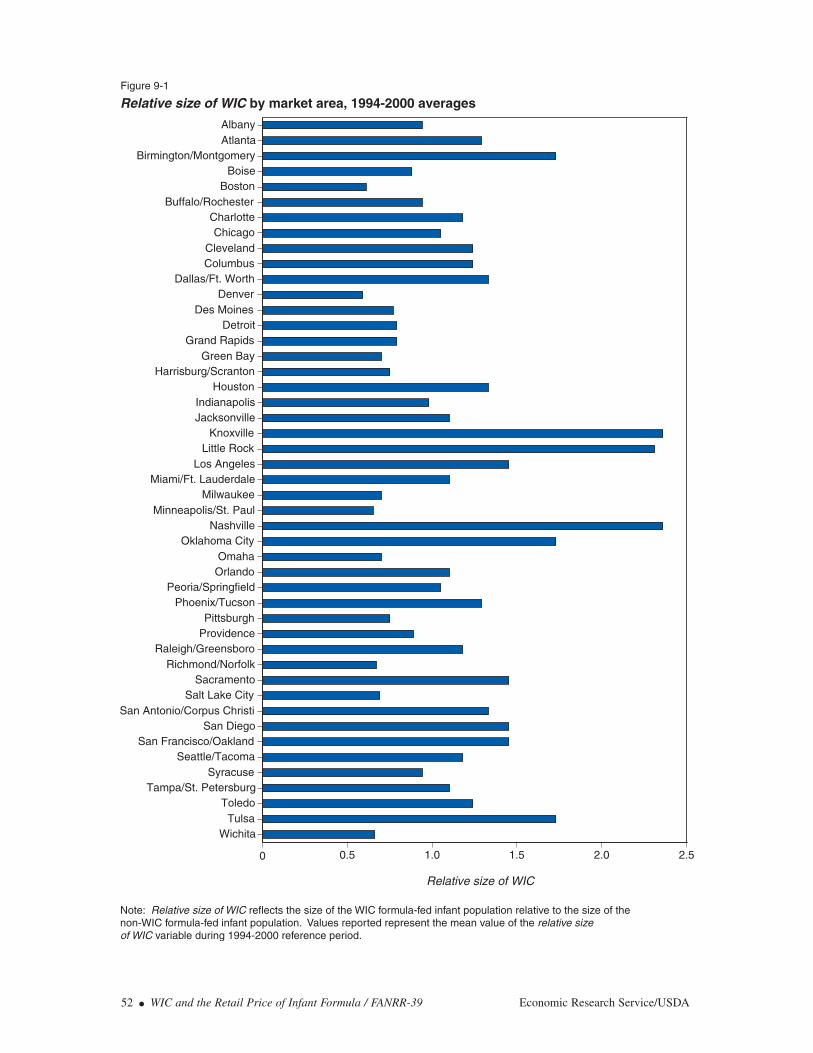
52 ● WIC and the Retail Price of Infant Formula / FANRR-39 Economic Research Service/USDA
Figure 9-1
Relative size of WIC
Relative size of WIC by market area, 1994-2000 averages
Note: Relative size of WIC reflects the size of the WIC formula-fed infant population relative to the size of the non-WIC formula-fed infant population. Values reported represent the mean value of the relative size of WIC variable during 1994-2000 reference period.
WichitaTulsa
ToledoTampa/St. Petersburg
SyracuseSeattle/Tacoma
San Francisco/OaklandSan Diego
San Antonio/Corpus ChristiSalt Lake City
SacramentoRichmond/Norfolk
Raleigh/GreensboroProvidencePittsburgh
Phoenix/TucsonPeoria/Springfield
OrlandoOmaha
Oklahoma CityNashville
Minneapolis/St. PaulMilwaukee
Miami/Ft. LauderdaleLos Angeles
Little RockKnoxville
JacksonvilleIndianapolis
HoustonHarrisburg/Scranton
Green BayGrand Rapids
DetroitDes Moines
DenverDallas/Ft. Worth
ColumbusCleveland
ChicagoCharlotte
Buffalo/RochesterBoston
BoiseBirmington/Montgomery
AtlantaAlbany
0 0.5 1.0 1.5 2.0 2.5
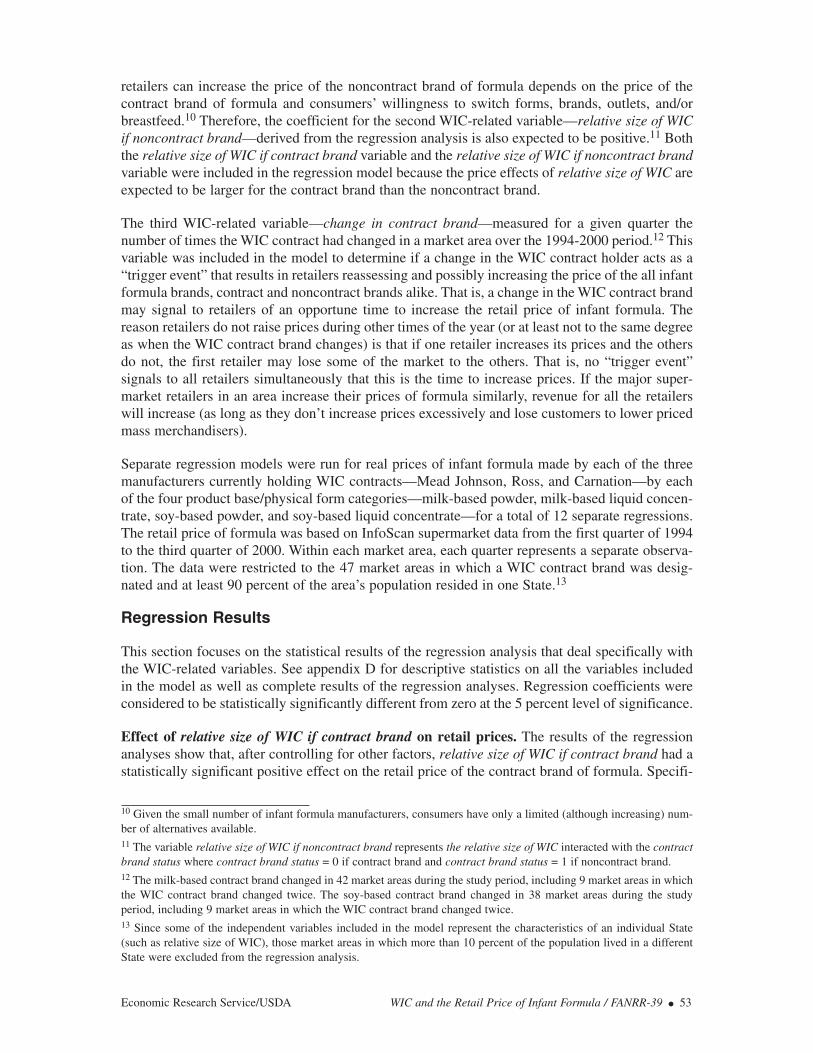
retailers can increase the price of the noncontract brand of formula depends on the price of thecontract brand of formula and consumers’ willingness to switch forms, brands, outlets, and/orbreastfeed.10 Therefore, the coefficient for the second WIC-related variable—relative size of WICif noncontract brand—derived from the regression analysis is also expected to be positive.11 Boththe relative size of WIC if contract brand variable and the relative size of WIC if noncontract brandvariable were included in the regression model because the price effects of relative size of WIC areexpected to be larger for the contract brand than the noncontract brand.
The third WIC-related variable—change in contract brand—measured for a given quarter thenumber of times the WIC contract had changed in a market area over the 1994-2000 period.12 Thisvariable was included in the model to determine if a change in the WIC contract holder acts as a“trigger event” that results in retailers reassessing and possibly increasing the price of the all infantformula brands, contract and noncontract brands alike. That is, a change in the WIC contract brandmay signal to retailers of an opportune time to increase the retail price of infant formula. Thereason retailers do not raise prices during other times of the year (or at least not to the same degreeas when the WIC contract brand changes) is that if one retailer increases its prices and the othersdo not, the first retailer may lose some of the market to the others. That is, no “trigger event”signals to all retailers simultaneously that this is the time to increase prices. If the major super-market retailers in an area increase their prices of formula similarly, revenue for all the retailerswill increase (as long as they don’t increase prices excessively and lose customers to lower pricedmass merchandisers).
Separate regression models were run for real prices of infant formula made by each of the threemanufacturers currently holding WIC contracts—Mead Johnson, Ross, and Carnation—by eachof the four product base/physical form categories—milk-based powder, milk-based liquid concen-trate, soy-based powder, and soy-based liquid concentrate—for a total of 12 separate regressions.The retail price of formula was based on InfoScan supermarket data from the first quarter of 1994to the third quarter of 2000. Within each market area, each quarter represents a separate observa-tion. The data were restricted to the 47 market areas in which a WIC contract brand was desig-nated and at least 90 percent of the area’s population resided in one State.13
Regression Results
This section focuses on the statistical results of the regression analysis that deal specifically withthe WIC-related variables. See appendix D for descriptive statistics on all the variables includedin the model as well as complete results of the regression analyses. Regression coefficients wereconsidered to be statistically significantly different from zero at the 5 percent level of significance.
Effect of relative size of WIC if contract brand on retail prices. The results of the regressionanalyses show that, after controlling for other factors, relative size of WIC if contract brand had astatistically significant positive effect on the retail price of the contract brand of formula. Specifi-
Economic Research Service/USDA WIC and the Retail Price of Infant Formula / FANRR-39 ● 53
10 Given the small number of infant formula manufacturers, consumers have only a limited (although increasing) num-ber of alternatives available. 11 The variable relative size of WIC if noncontract brand represents the relative size of WIC interacted with the contractbrand status where contract brand status = 0 if contract brand and contract brand status = 1 if noncontract brand.12 The milk-based contract brand changed in 42 market areas during the study period, including 9 market areas in whichthe WIC contract brand changed twice. The soy-based contract brand changed in 38 market areas during the studyperiod, including 9 market areas in which the WIC contract brand changed twice.13 Since some of the independent variables included in the model represent the characteristics of an individual State(such as relative size of WIC), those market areas in which more than 10 percent of the population lived in a differentState were excluded from the regression analysis.
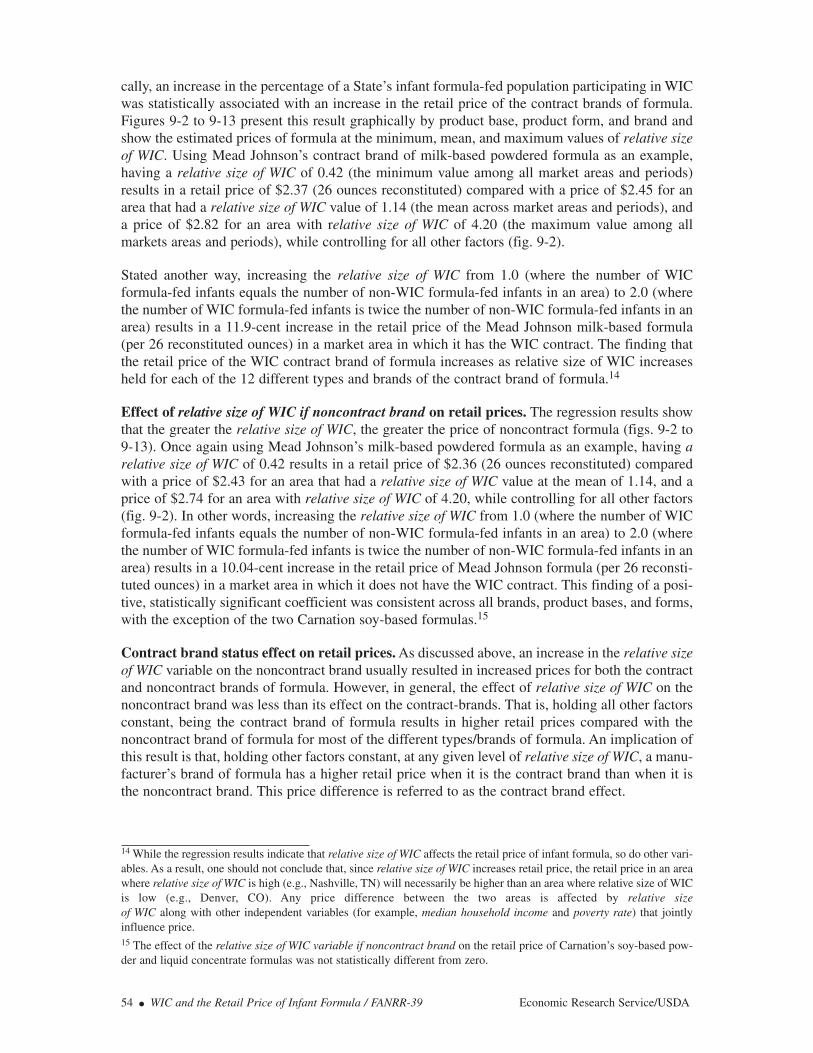
cally, an increase in the percentage of a State’s infant formula-fed population participating in WICwas statistically associated with an increase in the retail price of the contract brands of formula.Figures 9-2 to 9-13 present this result graphically by product base, product form, and brand andshow the estimated prices of formula at the minimum, mean, and maximum values of relative sizeof WIC. Using Mead Johnson’s contract brand of milk-based powdered formula as an example,having a relative size of WIC of 0.42 (the minimum value among all market areas and periods)results in a retail price of $2.37 (26 ounces reconstituted) compared with a price of $2.45 for anarea that had a relative size of WIC value of 1.14 (the mean across market areas and periods), anda price of $2.82 for an area with relative size of WIC of 4.20 (the maximum value among allmarkets areas and periods), while controlling for all other factors (fig. 9-2).
Stated another way, increasing the relative size of WIC from 1.0 (where the number of WICformula-fed infants equals the number of non-WIC formula-fed infants in an area) to 2.0 (wherethe number of WIC formula-fed infants is twice the number of non-WIC formula-fed infants in anarea) results in a 11.9-cent increase in the retail price of the Mead Johnson milk-based formula(per 26 reconstituted ounces) in a market area in which it has the WIC contract. The finding thatthe retail price of the WIC contract brand of formula increases as relative size of WIC increasesheld for each of the 12 different types and brands of the contract brand of formula.14
Effect of relative size of WIC if noncontract brand on retail prices. The regression results showthat the greater the relative size of WIC, the greater the price of noncontract formula (figs. 9-2 to9-13). Once again using Mead Johnson’s milk-based powdered formula as an example, having arelative size of WIC of 0.42 results in a retail price of $2.36 (26 ounces reconstituted) comparedwith a price of $2.43 for an area that had a relative size of WIC value at the mean of 1.14, and aprice of $2.74 for an area with relative size of WIC of 4.20, while controlling for all other factors(fig. 9-2). In other words, increasing the relative size of WIC from 1.0 (where the number of WICformula-fed infants equals the number of non-WIC formula-fed infants in an area) to 2.0 (wherethe number of WIC formula-fed infants is twice the number of non-WIC formula-fed infants in anarea) results in a 10.04-cent increase in the retail price of Mead Johnson formula (per 26 reconsti-tuted ounces) in a market area in which it does not have the WIC contract. This finding of a posi-tive, statistically significant coefficient was consistent across all brands, product bases, and forms,with the exception of the two Carnation soy-based formulas.15
Contract brand status effect on retail prices. As discussed above, an increase in the relative sizeof WIC variable on the noncontract brand usually resulted in increased prices for both the contractand noncontract brands of formula. However, in general, the effect of relative size of WIC on thenoncontract brand was less than its effect on the contract-brands. That is, holding all other factorsconstant, being the contract brand of formula results in higher retail prices compared with thenoncontract brand of formula for most of the different types/brands of formula. An implication ofthis result is that, holding other factors constant, at any given level of relative size of WIC, a manu-facturer’s brand of formula has a higher retail price when it is the contract brand than when it isthe noncontract brand. This price difference is referred to as the contract brand effect.
54 ● WIC and the Retail Price of Infant Formula / FANRR-39 Economic Research Service/USDA
14 While the regression results indicate that relative size of WIC affects the retail price of infant formula, so do other vari-ables. As a result, one should not conclude that, since relative size of WIC increases retail price, the retail price in an areawhere relative size of WIC is high (e.g., Nashville, TN) will necessarily be higher than an area where relative size of WICis low (e.g., Denver, CO). Any price difference between the two areas is affected by relative size of WIC along with other independent variables (for example, median household income and poverty rate) that jointly influence price. 15 The effect of the relative size of WIC variable if noncontract brand on the retail price of Carnation’s soy-based pow-der and liquid concentrate formulas was not statistically different from zero.
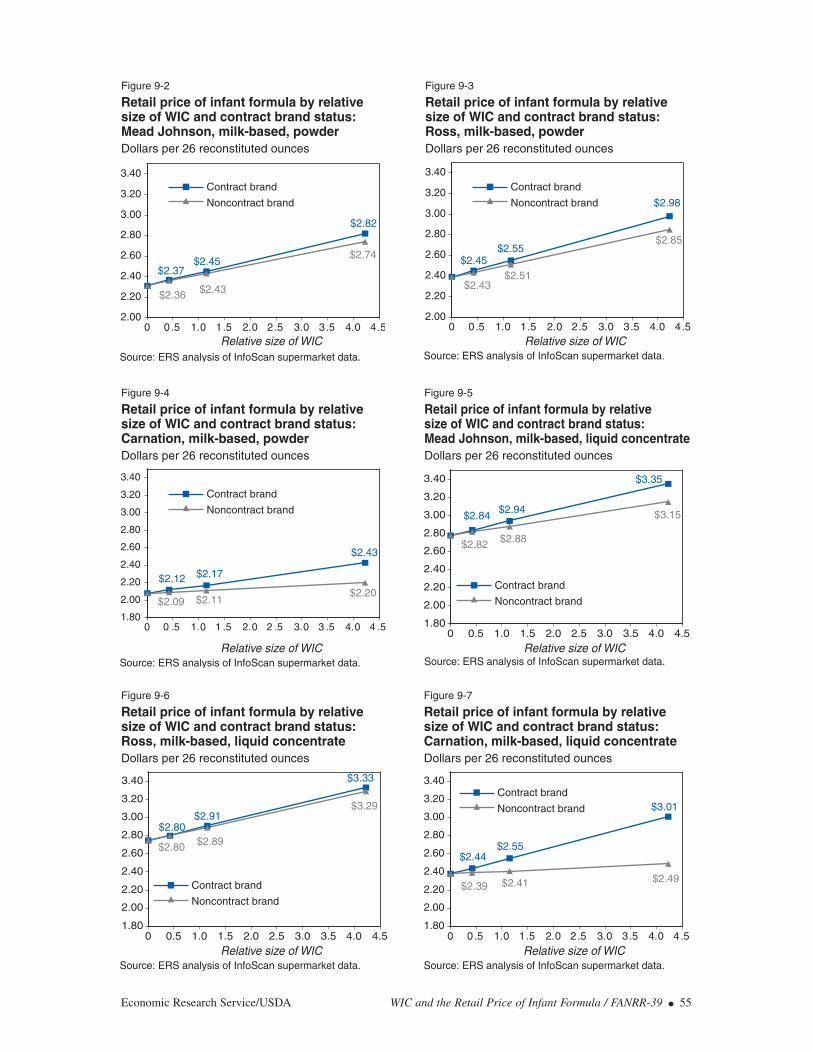
Economic Research Service/USDA WIC and the Retail Price of Infant Formula / FANRR-39 ● 55
Figure 9-2
Retail price of infant formula by relative size of WIC and contract brand status: Mead Johnson, milk-based, powder
Relative size of WIC
Dollars per 26 reconstituted ounces
$2.74
2.00
2.20
2.40
2.60
2.80
3.00
3.20
3.40
0 0 .5 1.0 1.5 2.0 2.5 3.0 3.5 4.0 4.5
$2.36
$2.37
$2.43
$2.45
$2.82
Contract brand
Noncontract brand
Source: ERS analysis of InfoScan supermarket data.
Figure 9-3
Retail price of infant formula by relative size of WIC and contract brand status: Ross, milk-based, powder
Relative size of WIC
Dollars per 26 reconstituted ounces
$2.85
$2.43
$2.45$2.51
$2.55
$2.98
Contract brand
Noncontract brand
2.00
2.20
2.40
2.60
2.80
3.00
3.20
3.40
0 0.5 1.0 1.5 2.0 2.5 3.0 3.5 4.0 4.5
Source: ERS analysis of InfoScan supermarket data.
Figure 9-4
Retail price of infant formula by relative size of WIC and contract brand status: Carnation, milk-based, powder
Relative size of WIC
Dollars per 26 reconstituted ounces
$2.20$2.09
$2.12
$2.11
$2.17
$2.43
Contract brand
Noncontract brand
1.80
2.00
2.20
2.40
2.60
2.80
3.00
3.20
3.40
0 0 .5 1.0 1 .5 2.0 2 .5 3.0 3 .5 4.0 4 .5
Source: ERS analysis of InfoScan supermarket data.
Figure 9-5
Retail price of infant formula by relative size of WIC and contract brand status: Mead Johnson, milk-based, liquid concentrate
Relative size of WIC
Dollars per 26 reconstituted ounces
$3.15
$2.82
$2.84
$2.88
$2.94
$3.35
Contract brand
Noncontract brand
1.80
2.00
2.20
2.40
2.60
2.80
3.00
3.20
3.40
0 0.5 1.0 1.5 2.0 2.5 3.0 3.5 4.0 4.5
Source: ERS analysis of InfoScan supermarket data.
Figure 9-6
Retail price of infant formula by relative size of WIC and contract brand status: Ross, milk-based, liquid concentrate
Relative size of WIC
Dollars per 26 reconstituted ounces
$3.29
$2.80
$2.80$2.89
$2.91
$3.33
Contract brand
Noncontract brand
1.80
2.00
2.20
2.40
2.60
2.80
3.00
3.20
3.40
0 0.5 1.0 1.5 2.0 2.5 3.0 3.5 4.0 4.5
Source: ERS analysis of InfoScan supermarket data.
Figure 9-7
Retail price of infant formula by relative size of WIC and contract brand status: Carnation, milk-based, liquid concentrate
Relative size of WIC
Dollars per 26 reconstituted ounces
$2.49$2.39
$2.44
$2.41
$2.55
$3.01Contract brand
Noncontract brand
1.80
2.00
2.20
2.40
2.60
2.80
3.00
3.20
3.40
0 0 .5 1.0 1.5 2.0 2.5 3.0 3.5 4.0 4.5
Source: ERS analysis of InfoScan supermarket data.

56 ● WIC and the Retail Price of Infant Formula / FANRR-39 Economic Research Service/USDA
Figure 9-8
Retail price of infant formula by relative size of WIC and contract brand status: Mead Johnson, soy-based, powder
Relative size of WIC
Dollars per 26 reconstituted ounces
$3.22
$2.62
$2.61
$2.74
$2.71
$3.14
Contract brand
Noncontract brand
1.80
2.00
2.20
2.40
2.60
2.80
3.00
3.20
3.40
0 0.5 1.0 1.5 2.0 2.5 3.0 3.5 4.0 4.5
Source: ERS analysis of InfoScan supermarket data.
Figure 9-9
Retail price of infant formula by relative size of WIC and contract brand status: Ross, soy-based, powder
Relative size of WIC
Dollars per 26 reconstituted ounces
$3.00
$2.58
$2.59$2.66
$2.69
$3.08Contract brand
Noncontract brand
1.80
2.00
2.20
2.40
2.60
2.80
3.00
3.20
3.40
0 0.5 1.0 1.5 2.0 2.5 3.0 3.5 4.0 4.5
Source: ERS analysis of InfoScan supermarket data.
Figure 9-10
Retail price of infant formula by relative size of WIC and contract brand status: Carnation, soy-based, powder
Relative size of WIC
Dollars per 26 reconstituted ounces
$2.01$2.02
$2.05
$2.02
$2.08$2.23
Contract brand
Noncontract brand
1.80
2.00
2.20
2.40
2.60
2.80
3.00
3.20
3.40
0 0 .5 1.0 1.5 2.0 2.5 3.0 3.5 4.0 4.5
Source: ERS analysis of InfoScan supermarket data.
Figure 9-11
Retail price of infant formula by relative size of WIC and contract brand status: Mead Johnson, soy-based, liquid concentrate
Relative size of WIC
Dollars per 26 reconstituted ounces
$3.73
$3.15
$3.15$3.26
$3.26
$3.73Contract brand
Noncontract brand
2.40
2.60
2.80
3.00
3.20
3.40
3.60
3.80
4.00
0 0 .5 1.0 1.5 2.0 2.5 3.0 3.5 4.0 4.5
Source: ERS analysis of InfoScan supermarket data.
Figure 9-12
Retail price of infant formula by relative size of WIC and contract brand status: Ross, soy-based, liquid concentrate
Relative size of WIC
Dollars per 26 reconstituted ounces
$3.49
$2.96
$2.95
$3.06
$3.04
$3.41
Contract brand
Noncontract brand
2.40
2.60
2.80
3.00
3.20
3.40
3.60
3.80
4.00
0 0.5 1.0 1.5 2.0 2.5 3.0 3.5 4.0 4.5
Source: ERS analysis of InfoScan supermarket data.
Figure 9-13
Retail price of infant formula by relative size of WIC and contract brand status: Carnation, soy-based, liquid concentrate
Relative size of WIC
Dollars per 26 reconstituted ounces
$2.30$2.28
$2.31
$2.29
$2.35
$2.53
Contract brand
Noncontract brand
1.80
2.00
2.20
2.40
2.60
2.80
3.00
3.20
3.40
0 0.5 1.0 1.5 2.0 2.5 3.0 3.5 4.0 4.5
Source: ERS analysis of InfoScan supermarket data.

This contract brand effect is shown in figures 9-2 to 9-13 as the difference between the line repre-senting the contract brand and the line representing the noncontract brands. For example, the effectof being the contract brand of formula on Mead Johnson’s milk-based powdered formula, evaluatedat the mean size of WIC of 1.14 is the difference between $2.45 (for the contract brand) and $2.43(for the noncontract brand) or 2 cents (shown in fig. 9-2). For five of the six types of milk-basedformulas, being the contract brand was associated with statistically significant higher retail prices(the difference in the retail price of Ross’ liquid concentrate formula when it was the contract brandwas not significantly different from the price when it was the noncontract brand). This contract brandeffect was especially noticeable for the Carnation brands (e.g., being the contract brand increased theretail price of Carnation’s milk-based liquid concentrate, evaluated at the mean size of WIC of 1.14,by 14 cents per 26 reconstituted ounces). In total for milk-based formula, these results support thefindings from the event-study analysis of prices—winning the WIC contract brand of formula leadsto higher retail prices relative to the noncontract brands of formula.
The effect of contract brand status on retail prices was less clear among soy-based formulas thanamong milk-based formulas. For three of the six types of soy-based formula—Ross’ powderedformula and Carnation’s powdered and liquid concentrate formula—being the contract brand wasassociated with significantly higher retail prices. Similar to the results for the milk-based formulas,the greatest effect of being the contract brand was on the Carnation brands of formula (about 6cents for both the powdered and liquid concentrate evaluated at the mean 1.14 size of WIC). Forone type of formula—Mead Johnson’s soy-based powder—the effect of being the WIC contractbrand was to lower the retail price, a result that is unexplained. The contract brand effect for theMead Johnson and Ross liquid concentrate brands was not statistically significant.
The average contract brand effect across the three manufacturer’s brands, two product bases, andtwo product forms was estimated for summary purposes. When measured at the mean 1.14 rela-tive size of WIC, the average contract brand effect was 2.5 cents.
Effect of change in contract brand on retail prices. The regression model included the variablechange in contract brand that represented a count, by quarter, of the number of times the WICcontract brand changed in a market area over the course of the 1994-2000 study period. This “triggerevent” variable was found to have a statistically significant effect on retail prices for some but not allof the formulas (fig. 9-14). A change in the contract brand, holding other factors constant, was asso-ciated with an increase in the price of Ross milk-based powder (by 2.37 cents per change), and themilk-based liquid concentrate brands of Mead Johnson (2.98 cents per change) and Ross (5.61 centsper change) formulas. A change in the contract brand was also associated with an increase in theretail price of Carnation soy-based brand powder (1.36 cents per change). For unknown reasons, achange in the WIC contract brand was also associated with a decrease in the price of Mead Johnson’ssoy-based liquid concentrate formula of 2.67 cents. The effect of a change in the contract brand forthe other types of infant formulas was not statistically significant.
Despite the statistically significant results associated with this variable for some of the formulas, itdoes not necessarily mean that consumers in market areas with many contract brand changes paymore for infant formula in the long run than consumers in market areas with few or no contract brandchanges, even after controlling for other factors. Retailers may be using a change in the WIC contractbrand as an occasion to re-evaluate their pricing of formula, and introduce price increases (for boththe contract and noncontract brands) that otherwise would have occurred anyway (i.e., even in theabsence of a change in the WIC contract brand) over a longer period, in smaller increments, and atdifferent times by different retailers. A change in the contract brand in an area may concentrate pricechanges by the different retailers into the same short period. The difference in the pricing patternsbetween market areas that experienced changes in contract brand and those that did not experiencea change may be only a difference in the timing of the increments in retail price.
Economic Research Service/USDA WIC and the Retail Price of Infant Formula / FANRR-39 ● 57
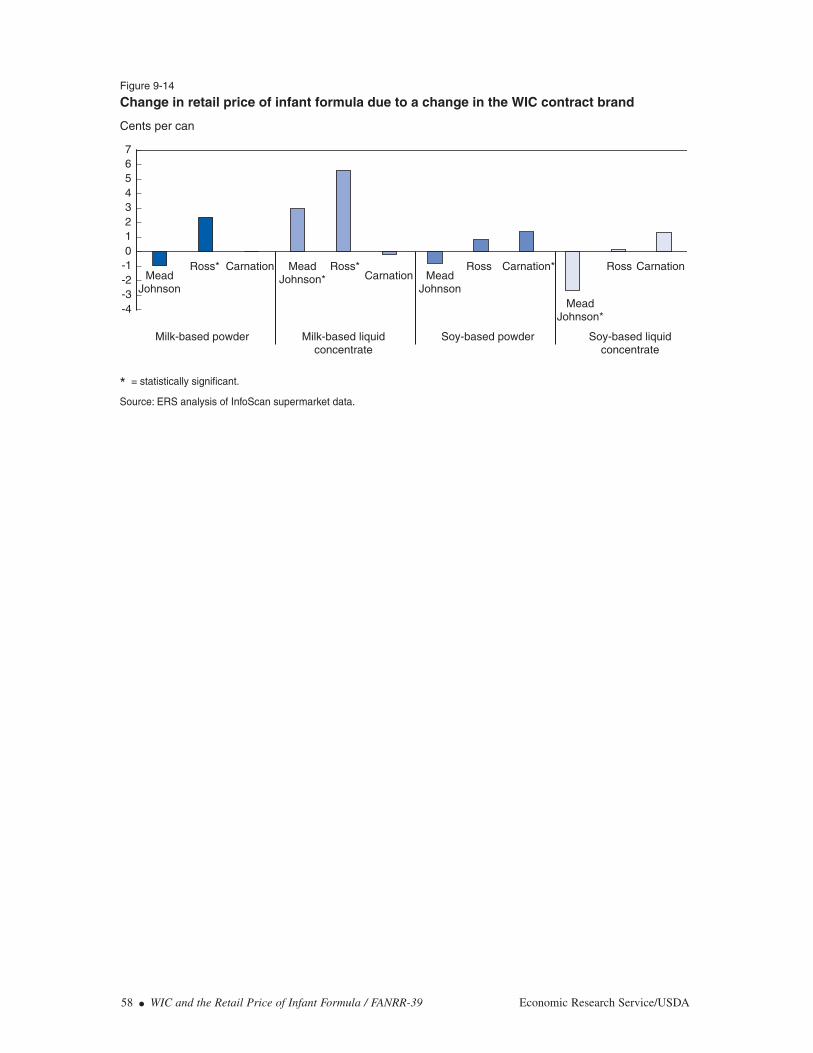
58 ● WIC and the Retail Price of Infant Formula / FANRR-39 Economic Research Service/USDA
* = statistically significant.
Figure 9-14
Change in retail price of infant formula due to a change in the WIC contract brand
Cents per can
Source: ERS analysis of InfoScan supermarket data.
MeadJohnson
Ross* Carnation MeadJohnson*
Ross*Carnation Mead
Johnson
Ross Carnation*
MeadJohnson*
Ross Carnation
-4-3-2-101234567
Milk-based powder Soy-based liquidconcentrate
Soy-based powderMilk-based liquidconcentrate
Chapter 10
Discussion
The empirical study examined price effects associated with contract and noncontract brands ofinfant formula and changes in the relative size of WIC, given that WIC and its rebate program areboth in effect. It did not consider issues related to the existence versus absence of the rebate orWIC programs. More specifically, the empirical study did not consider what infant formula pricesare under WIC compared with what infant formula prices would be in the absence of WIC. Neitherdid it consider how infant formula prices under the rebate program would compare with infantformula prices if the rebate program were not in effect. These comparisons were not consideredbecause the 1994-2000 dataset used in the analysis covers the period after WIC and its rebateprogram were instituted.
Results of the regression analysis indicate that WIC and its infant formula rebate program (withits designation of one manufacturer as the WIC contract brand) affect the retail price of infantformula in several ways:
(1) Compared with being the noncontract brand, being the WIC contract brand ofinfant formula was typically associated with higher retail prices for most typesof formula—especially the milk-based brands of formulas (holding other fac-tors constant). The results of the event study analysis that compared prices inthe calendar quarter before and the calendar quarter after a change in the WICcontract holder support these findings that the WIC infant formula rebate pro-gram leads to higher prices of the contract brand of formula compared withwhat the price would be if the brand were not the contract brand. For example,for milk-based powder formula (the highest volume type of formula), the pre/postprice increase averaged 10 cents for new contract holders comparedwith 3 cents for old contract brands that had lost the WIC contract.
(2) The regression analysis found that the larger the relative size of the WIC pro-gram, the greater the retail price of the contract brand of formula, ranging from8 to 14 cents across brands of milk-based powder formula (per 26 ounces ofreconstituted formula) for a one-unit change in relative size of WIC (e.g.,WIC’s share of all formula infants increases from one-half to two-thirds).
(3) The analysis found that the relative size of the WIC program also affects theretail price of noncontract formula by amounts ranging (for milk-based powerformula) from 3 cents to 11 cents. That is, larger WIC programs result inhigher retail prices of the noncontract brands of formula although the increaseis less than that of the contract brand.
(4) A change in the WIC contract brand within a market area regardless of whowon or lost the contract, was also associated with a small, but statistically sig-nificant, effect on the retail prices of some types of formula.
These results have implications for both WIC State agencies and non-WIC consumers. First, thelarger the relative size of a State’s WIC program (holding other factors constant), the smaller theState WIC agency’s savings per can from the rebate program for a given negotiated rebate level.1
This is because, for each can of the contract brand of infant formula sold through WIC, the WIC
Economic Research Service/USDA WIC and the Retail Price of Infant Formula / FANRR-39 ● 59
1 It should be noted that larger WIC States (i.e., States with large numbers of WIC infants in absolute terms) may beable to negotiate larger rebate savings from the infant formula manufacturers.
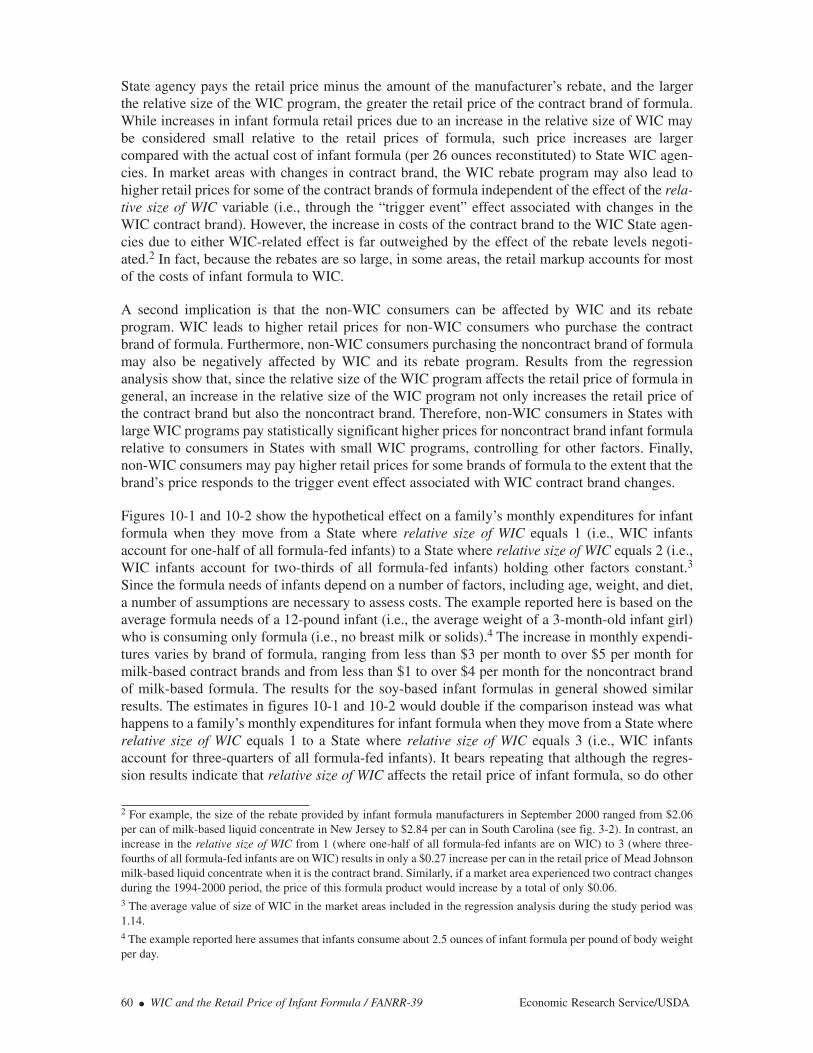
State agency pays the retail price minus the amount of the manufacturer’s rebate, and the largerthe relative size of the WIC program, the greater the retail price of the contract brand of formula.While increases in infant formula retail prices due to an increase in the relative size of WIC maybe considered small relative to the retail prices of formula, such price increases are largercompared with the actual cost of infant formula (per 26 ounces reconstituted) to State WIC agen-cies. In market areas with changes in contract brand, the WIC rebate program may also lead tohigher retail prices for some of the contract brands of formula independent of the effect of the rela-tive size of WIC variable (i.e., through the “trigger event” effect associated with changes in theWIC contract brand). However, the increase in costs of the contract brand to the WIC State agen-cies due to either WIC-related effect is far outweighed by the effect of the rebate levels negoti-ated.2 In fact, because the rebates are so large, in some areas, the retail markup accounts for mostof the costs of infant formula to WIC.
A second implication is that the non-WIC consumers can be affected by WIC and its rebateprogram. WIC leads to higher retail prices for non-WIC consumers who purchase the contractbrand of formula. Furthermore, non-WIC consumers purchasing the noncontract brand of formulamay also be negatively affected by WIC and its rebate program. Results from the regressionanalysis show that, since the relative size of the WIC program affects the retail price of formula ingeneral, an increase in the relative size of the WIC program not only increases the retail price ofthe contract brand but also the noncontract brand. Therefore, non-WIC consumers in States withlarge WIC programs pay statistically significant higher prices for noncontract brand infant formularelative to consumers in States with small WIC programs, controlling for other factors. Finally,non-WIC consumers may pay higher retail prices for some brands of formula to the extent that thebrand’s price responds to the trigger event effect associated with WIC contract brand changes.
Figures 10-1 and 10-2 show the hypothetical effect on a family’s monthly expenditures for infantformula when they move from a State where relative size of WIC equals 1 (i.e., WIC infantsaccount for one-half of all formula-fed infants) to a State where relative size of WIC equals 2 (i.e.,WIC infants account for two-thirds of all formula-fed infants) holding other factors constant.3
Since the formula needs of infants depend on a number of factors, including age, weight, and diet,a number of assumptions are necessary to assess costs. The example reported here is based on theaverage formula needs of a 12-pound infant (i.e., the average weight of a 3-month-old infant girl)who is consuming only formula (i.e., no breast milk or solids).4 The increase in monthly expendi-tures varies by brand of formula, ranging from less than $3 per month to over $5 per month formilk-based contract brands and from less than $1 to over $4 per month for the noncontract brandof milk-based formula. The results for the soy-based infant formulas in general showed similarresults. The estimates in figures 10-1 and 10-2 would double if the comparison instead was whathappens to a family’s monthly expenditures for infant formula when they move from a State whererelative size of WIC equals 1 to a State where relative size of WIC equals 3 (i.e., WIC infantsaccount for three-quarters of all formula-fed infants). It bears repeating that although the regres-sion results indicate that relative size of WIC affects the retail price of infant formula, so do other
60 ● WIC and the Retail Price of Infant Formula / FANRR-39 Economic Research Service/USDA
2 For example, the size of the rebate provided by infant formula manufacturers in September 2000 ranged from $2.06per can of milk-based liquid concentrate in New Jersey to $2.84 per can in South Carolina (see fig. 3-2). In contrast, anincrease in the relative size of WIC from 1 (where one-half of all formula-fed infants are on WIC) to 3 (where three-fourths of all formula-fed infants are on WIC) results in only a $0.27 increase per can in the retail price of Mead Johnsonmilk-based liquid concentrate when it is the contract brand. Similarly, if a market area experienced two contract changesduring the 1994-2000 period, the price of this formula product would increase by a total of only $0.06. 3 The average value of size of WIC in the market areas included in the regression analysis during the study period was1.14. 4 The example reported here assumes that infants consume about 2.5 ounces of infant formula per pound of body weightper day.
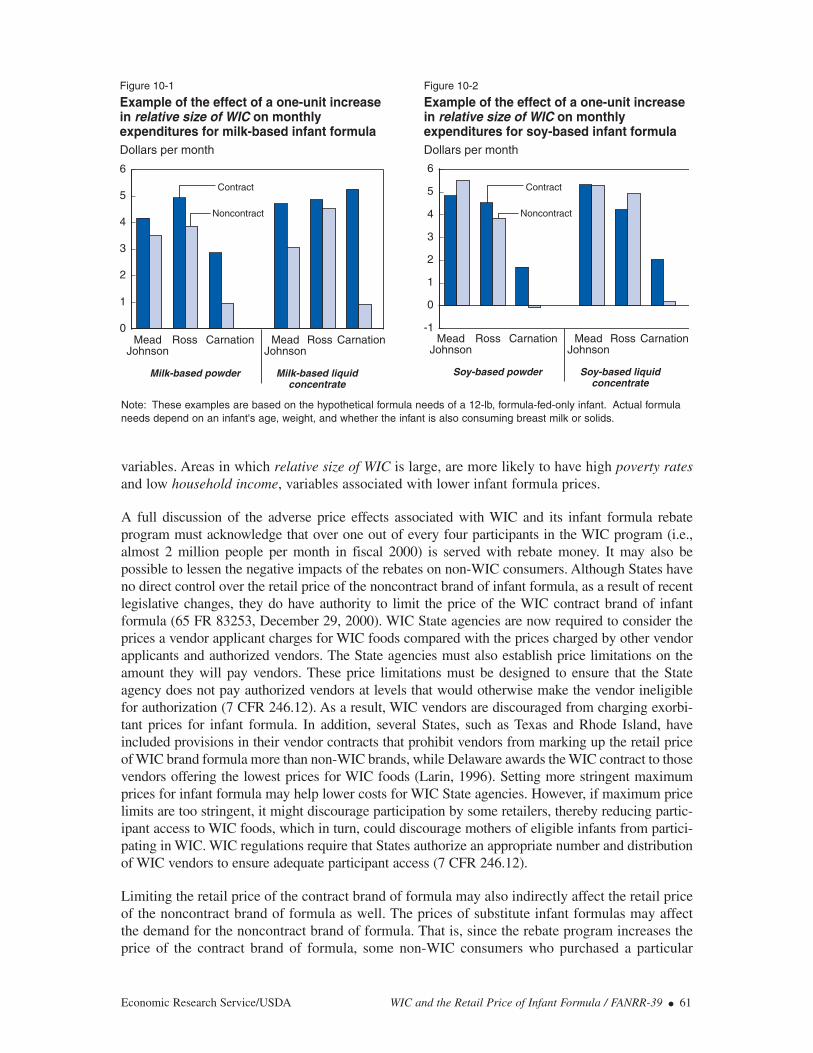
variables. Areas in which relative size of WIC is large, are more likely to have high poverty ratesand low household income, variables associated with lower infant formula prices.
A full discussion of the adverse price effects associated with WIC and its infant formula rebateprogram must acknowledge that over one out of every four participants in the WIC program (i.e.,almost 2 million people per month in fiscal 2000) is served with rebate money. It may also bepossible to lessen the negative impacts of the rebates on non-WIC consumers. Although States haveno direct control over the retail price of the noncontract brand of infant formula, as a result of recentlegislative changes, they do have authority to limit the price of the WIC contract brand of infantformula (65 FR 83253, December 29, 2000). WIC State agencies are now required to consider theprices a vendor applicant charges for WIC foods compared with the prices charged by other vendorapplicants and authorized vendors. The State agencies must also establish price limitations on theamount they will pay vendors. These price limitations must be designed to ensure that the Stateagency does not pay authorized vendors at levels that would otherwise make the vendor ineligiblefor authorization (7 CFR 246.12). As a result, WIC vendors are discouraged from charging exorbi-tant prices for infant formula. In addition, several States, such as Texas and Rhode Island, haveincluded provisions in their vendor contracts that prohibit vendors from marking up the retail priceof WIC brand formula more than non-WIC brands, while Delaware awards the WIC contract to thosevendors offering the lowest prices for WIC foods (Larin, 1996). Setting more stringent maximumprices for infant formula may help lower costs for WIC State agencies. However, if maximum pricelimits are too stringent, it might discourage participation by some retailers, thereby reducing partic-ipant access to WIC foods, which in turn, could discourage mothers of eligible infants from partici-pating in WIC. WIC regulations require that States authorize an appropriate number and distributionof WIC vendors to ensure adequate participant access (7 CFR 246.12).
Limiting the retail price of the contract brand of formula may also indirectly affect the retail priceof the noncontract brand of formula as well. The prices of substitute infant formulas may affectthe demand for the noncontract brand of formula. That is, since the rebate program increases theprice of the contract brand of formula, some non-WIC consumers who purchased a particular
Economic Research Service/USDA WIC and the Retail Price of Infant Formula / FANRR-39 ● 61
Figure 10-1
Example of the effect of a one-unit increase in relative size of WIC on monthly expenditures for milk-based infant formulaDollars per month
MeadJohnson
Ross Carnation Mead Johnson
Ross Carnation0
1
2
3
4
5
6
Noncontract
Contract
Milk-based powder Milk-based liquidconcentrate
Figure 10-2
Example of the effect of a one-unit increase in relative size of WIC on monthly expenditures for soy-based infant formulaDollars per month
Noncontract
Contract
MeadJohnson
Ross Carnation Mead Johnson
Ross Carnation
Soy-based powder Soy-based liquidconcentrate
-1
0
1
2
3
4
5
6
Note: These examples are based on the hypothetical formula needs of a 12-lb, formula-fed-only infant. Actual formulaneeds depend on an infant's age, weight, and whether the infant is also consuming breast milk or solids.
brand of formula before it was the contract brand may have switched brands after it became thecontract brand rather than pay higher prices.
The results of this analysis indicate that increasing the prevalence of breastfeeding among WICinfants would decrease the retail price of both the contract and noncontract brands of infantformula. Since relative size of WIC measures the number of WIC formula-fed infants relative tothe number of non-WIC formula-fed infants, increasing the breastfeeding rate among WIC partic-ipants would reduce the number of WIC formula-fed infants, thereby reducing relative size of WIC(and WIC’s influence in the infant formula market), resulting in lower retail prices for bothcontract and noncontract brands of infant formula. Although the breastfeeding rate for infantsparticipating in WIC (20 percent at 6 months of age in 2000) has been increasing in recent years,it remains far below the rate for non-WIC infants (41 percent).
While this analysis indicates that the WIC program and its infant formula rebate program weregenerally found to result in modestly higher retail prices of infant formula in supermarkets, lowerpriced infant formulas are available to non-WIC consumers in most areas of the country, andfurthermore, the number of these lower priced alternatives is increasing over time.5 For example,Carnation brand formula, which is available in supermarkets throughout the country, is nearlyalways priced below that of comparable Mead Johnson and Ross products, even when Carnationis the WIC contract brand of formula. Infant formula marketed by PBM Products (which beganoperations in 1997) is available in supermarkets in most areas of the country and is priced signif-icantly below formula produced by the other three manufacturers of infant formula. In 2001,Abbott Labs, the parent company of Ross, began producing a low-priced private-label infantformula for sale in Costco stores.6
Furthermore, the results from this analysis apply only to supermarkets (where WIC foods arepredominantly sold). Increasingly non-WIC consumers are purchasing infant formula sold bymass merchandisers, who cater to the non-WIC consumer, at prices below that of supermarkets.(Since many of these mass merchandisers sell a limited variety of food products, they are notauthorized WIC vendors and cannot participate in the infant formula rebate program.)
The increase in the range of alternatives available in the market place may be in response to infantformula consumers becoming more price conscious.7 In addition to the increased purchase oflower priced brands and purchases from mass merchandisers, the purchase of powdered formula(the least expensive form of formula) and powdered formula in large-sized containers (with lowerper unit prices) has increased dramatically in recent years.8 As consumers become more priceconscious, the role of medical detailing, which attempts to make consumers less price responsiveby fostering brand loyalty, may be declining.
62 ● WIC and the Retail Price of Infant Formula / FANRR-39 Economic Research Service/USDA
5 Other brands of infant formula may provide close substitutes for consumers wishing to switch brands. Since the contentand quality of infant formula is strictly regulated, all brands of infant formula must meet the same nutritional standards. 6 Because all infant formulas sold in the United States are required to meet the nutritional requirements of the FederalFood, Drug and Cosmetic Act for infant formula, private-label brands are as nutritionally complete as the nationalbrands.7 In addition to a range of price alternatives, consumer choice in other areas has also widened in recent years as newtypes of infant formulas and new types of packaging have emerged.8 The increase in the prevalence of breastfeeding in recent years may also reflect greater sensitivity to infant formulaprices by mothers.
Chapter 11
Conclusions
Since 1989, Federal law has required that WIC State agencies enter into cost-containmentcontracts for the purchase of infant formula used in WIC. Typically, WIC State agencies obtainsignificant discounts in the form of rebates from the manufacturers for each can of infant formulapurchased by WIC participants. In exchange for rebates, a manufacturer is given the exclusiveright to provide its products to WIC participants in the State.
Concerned about the rise in the price of infant formula since the WIC rebate program began,Congress in 2000 directed ERS to report on the several aspects of the infant formula market. Whilethe resulting Report to Congress answered the specific questions posed by Congress, this reportextends the original analyses and provides a more indepth examination of the effects of WIC andits infant formula rebate program on the retail prices of infant formula. Although wholesale pricescan indirectly affect retail prices, this report focused on the pricing behavior of retailers for a givenset of wholesale prices.1 Specifically, this report provides answers to the following questions:
What are the recent trends in the infant formula market?Since 1997, the volume of infant formula sold in the United States has remained relativelystable at about 27-28 billion ounces (reconstituted) per year. Over three-quarters of allinfant formula sold in 2000 was milk-based, while soy-based infant formula accounted foranother 20 percent. While most infant formula is sold in supermarkets (69 percent in2000), the proportion of infant formula sold by mass merchandisers (at prices typicallybelow those in supermarkets) has increased slightly in recent years, accounting for about28 percent of total volume sold. One of the more dramatic trends in the infant formulamarket in recent years has been the increase of formula sold in powdered form (generally,the least expensive form of formula)—from 44 percent of all formula sold in 1994 to 62percent in 2000. The volume of powdered infant formula that is sold in large—24 or moreounces—containers (at lower per unit prices) is also on the rise, increasing from only 4percent in 1994 to 19 percent in 2000. Specialized formula (which is generally moreexpensive than standard formula) has made significant inroads in the market in recentyears and accounted for 8 percent of all formula sold in 2000. Total dollars sales of infantformula has increased in recent years, much of it attributed to the increased sales of spe-cialized formula. The average retail price of infant formula continues to increase overtime, across the different physical forms, product bases, and outlets.
Has the number of infant formula suppliers decreased since WIC’s infant formula rebateprogram began?In both 1987, before WIC’s infant formula rebate programs were widely implemented, andin 2000, three manufacturers accounted for about 99 percent of the infant formula market.Furthermore, in both years, two companies—Ross and Mead Johnson—accounted forbetween 87 percent and 90 percent of all infant formula sold. However, the third-largest pro-ducer in 2000—Carnation—entered the U.S. market after the rebate program began.Carnation continues to make inroads into the infant formula market; they accounted for 12percent of all formula sold in 2000. In addition, a fourth company—PBM Products—enteredthe infant formula market in the late 1990s. Starting in 1997, PBM began marketing formulaproduced by Wyeth (which withdrew from the U.S. retail market in 1996). Thus, there is no
Economic Research Service/USDA WIC and the Retail Price of Infant Formula / FANRR-39 ● 63
1 To the extent that WIC and the rebate program affect wholesale prices in addition to the retail markup, this report’sanalysis does not capture all effects of WIC and the rebate program.
evidence that WIC’s infant formula rebate program has resulted in a reduction of the num-ber of infant formula manufacturers, thereby lessening competition.
Have infant formula prices increased faster than inflation in recent years?
Although the increase in the retail price of infant formula over the 1994-2000 period var-ied by manufacturer and type of formula, in nearly all cases, the average annual increasein the retail price of infant formula exceeded inflation regardless of which of threeConsumer Price Indices (CPI) were used to represent inflation—All Items, Food at Home,or Nonprescription Drugs and Medical Supplies. In addition, in every case the annual rateof increase in retail prices exceeded the annual rate of increase in wholesale prices. Sincelittle information is available on the operating costs associated with retailing infant for-mula, it is not possible to determine the extent to which the increase in retail infant for-mula prices above the rate of inflation are attributable to increased costs of retailing. It alsoshould be noted that infant formula prices were increasing faster than inflation even beforethe rebate program was implemented.
Does the percentage retail markup of infant formula differ by brand or type of formula?
The size of the retail markups in percentage terms varied by type and manufacturer.Carnation brands of infant formula had a higher retail markup than did Mead Johnson andRoss brands. Since the wholesale prices of Carnation are generally lower than the twoother brands, retailers can mark Carnation products up more and still price them lowerthan the Ross and Mead Johnson brands. In addition, liquid concentrate forms of formula(both milk- and soy-based) had higher markups than powdered forms of formula acrossmanufacturers. All categories of formula had positive average annual retail markups at thenational level. However, in many individual market areas, the retail prices of some infantformula products were priced below the listed wholesale price suggesting that many retail-ers may use infant formula as loss leaders to attract customers into their stores.
What is the availability of infant formula products from the major manufacturers by mar-ket area?
Infant formula manufactured by Mead Johnson, Ross, and Carnation are widely availablein supermarkets throughout the United States. Formula manufactured by Wyeth and mar-keted by PBM Products, usually at relatively low retail prices, is available in some super-markets in most areas of the country.
Is the retail price of formula that is included in the WIC rebate program greater than for-mula that is not included in the WIC rebate program?
Retail prices of infant formula vary widely across geographic areas. Within market areasthere is not a clear and consistent relationship between a formula’s being the WIC contractbrand and having the highest average retail price.
What effect does being the WIC contract brand have on the retail price of infant formula?The results from the event study analysis clearly showed that after a change in the WICcontract holder, the retail price of the new contract brand of formula increased more thanthat of the old contract holder and the other brands of formula. This finding suggests thatbeing the contract brand of formula results in higher retail prices. This general result ofhigher, but not necessarily the highest price, was robust across all product bases and phys-ical forms. A multivariate regression analysis examined retail prices while controlling fora variety of economic, demographic, and WIC program factors. Results showed that amanufacturer’s brand of formula had a higher retail price—for a given wholesale price—if that brand is the WIC contract brand. The use of two different analytical approacheswith comparable findings provides stronger, more credible results.
64 ● WIC and the Retail Price of Infant Formula / FANRR-39 Economic Research Service/USDA
Does the size of the WIC program affect the retail price of infant formula?
The multivariate regression analysis showed that the greater the relative size of the WICprogram in the State, as measured by the ratio of WIC formula feeders to non-WIC for-mula feeders, the greater the retail price of both the contract and noncontract brands offormula, holding other factors constant. This result held across nearly all brands and typesof infant formula. Increasing the prevalence of breastfeeding among WIC mothers woulddecrease the relative size of the WIC program, thereby resulting in lower retail prices ofinfant formula.
In conclusion, supermarket prices of infant formula in a market area depend on a number ofeconomic, demographic, and WIC program factors. WIC and its infant formula rebate programeach tend to modestly increase the supermarket price of infant formula for non-WIC consumers,for given wholesale prices. The infant formula rebate program affects retail prices due to the desig-nation of a single brand of formula as the contract brand (i.e., sole sourcing). The WIC programalso affects retail infant formula prices through changes in WIC’s size as measured by the numberof formula-fed WIC infants relative to the number of formula-fed non-WIC infants. An increasein the relative size of the WIC program tends to result in higher retail prices. Accordingly, Stateswith a high percentage of formula-fed infants in WIC had higher prices (other factors equal) withthe amount of the increase depending on type and brand of formula consumed. For example, whenmoving from an area where WIC infants account for half of all formula-fed infants to an areawhere they account for two-thirds, a family with a typical 12-pound formula-fed infant hasmonthly expenditures (for milk-based formula) that increase by about $3 to $5 for contract brandsof formula and about $1 to $4 for noncontract brands. No evidence was found that suggests thatrebate levels affect retail markups. A full discussion of the price effects on non-WIC consumersdue to WIC and its infant formula rebate program should consider that over one out of every fourparticipants in the WIC program (i.e., almost 2 million people per month in fiscal 2000) is servedwith rebate money. Furthermore, recent legislative changes provide USDA with enhanced controlof the prices WIC vendors charge for the contract brand of infant formula.
Economic Research Service/USDA WIC and the Retail Price of Infant Formula / FANRR-39 ● 65
References
Abbott Laboratories, Ross Products Division. “Ross Mother Survey: Breastfeeding TrendsThrough 2000,” unpublished report, 2001.
American Academy of Pediatrics. “Breastfeeding and the Use of Human Milk,” policy statementof the American Academy of Pediatrics, Pediatrics, Vol. 100(6), Dec. 1997.
American Academy of Pediatrics. “Iron Fortification of Infant Formulas (RE9865),” policy state-ment of the American Academy of Pediatrics, Pediatrics, Vol. 104(1), July 1999.
American Dietetic Association, “Promotion of Breast-Feeding—Position of ADA,” Journal of theAmerican Dietetic Association, Vol. 97, 1997.
Bartlett, S., M. Brown-Lyons, D. Moore, and A. Estacion. WIC Participant and Program Charac-teristics 1998. No. WIC-00-PC, prepared by Abt Associates, Inc. for USDA’s Food and Nutri-tion Service, Office of Analysis, May 2000.
Center on Budget and Policy Priorities. Analysis of Infant Formula Cost Containment in FiscalYear 1994, March 1995.
Federal Trade Commission, “Abbott Labs to Settle FTC Case Alleging Conspiracy AgainstConsumer Advertising,” FTC news release, Oct. 28, 1993.
Fomon, S.J. “Infant Feeding in the 20th Century: Formula and Beikost,” The Journal of Nutrition(Supplement), Vol. 131, 2001.
Food Marketing Institute, Making WIC Work: A Guide to Successfully Implementing the WICProgram, 1998.
Gerber Products Company. “Gerber Launches New Baby Formula in Cooperation with Bristol-Myers,” press release, June 15, 1989.
Hansen, J.W., D.A. Cook, A. Cordano, and S.G. Miguel. “Human Milk Substitutes,” in NutritionDuring Infancy, Philadelphia, PA, 1988.
Harvey, S., R. Greenstein, and S. Barancik. Saving to Serve More: Ways to Reduce WIC InfantFormula Costs. Center on Budget and Policy Priorities, Sept. 1988.
Kirlin, J.A., N. Cole, and C. Logan. Assessment of WIC Cost-Containment Practices, prepared byAbt Associates for USDA’s Economic Research Service. E-FAN-03-005. February 2003.
Larin, K. Maintaining a Competitive Market: The Long-Term Threat to WIC Cost Containment.Center on Budget and Policy Priorities, May 1996.
Liu, J.T. Strength in Numbers: Multi-State Cost Containment in the WIC Program. Center onBudget and Policy Priorities, July 1991.
Martinez, G.A., and F.W. Krieger. “1984 Milk-Feeding Patterns in the United States,” Pediatrics,Vol. 76(6), December 1985.
Mauskopf, J.A, and N.B. Dean. WIC Program Rebates: An Economic Analysis, prepared byResearch Triangle Institute for USDA’s Food and Nutrition Service, Nov. 1990.
66 ● WIC and the Retail Price of Infant Formula / FANRR-39 Economic Research Service/USDA
Mead Johnson Nutritionals. Letter to States with WIC contracts with Mead Johnson, Feb. 1997.
Oliveira, V., M. Prell, E. Frazão, and D. Smallwood. Infant Formula Prices and Availability: ERSFinal Report to Congress. USDA, Economic Research Service. October 2001.
Post, J.E., and W.H. Wubbenhorst III. Assessing the Infant Formula Rebate Initiative. BostonUniversity School of Management, Apr. 1989.
Rossi, P.H. Feeding the Poor: Assessing Federal Food Aid. The AEI Press, 1998.
Ryan, A.S. “The Resurgence of Breastfeeding in the United States, Pediatrics, Vol. 99(4), April 1997.
Salant, S. “Microeconomics in Practice” at www.wnorton.com/mip. Accessed Jan. 2003.
The New York Times. “A Human Touch Is Added to Infant Formulas,” July 17, 2001.
The New York Times. “Gerber Plan for Infant Formula,” June 16, 1989.
The Washington Post. “Testing a New Formula,” Sept. 11, 1999.
U.S. Department of Agriculture, Food and Nutrition Service, Budget Division. Program Informa-tion Report (Keydata), U.S. Summary, March 2003. May 2003.
U.S. Department of Agriculture, Food and Nutrition Service, Office of Analysis and Evaluation.Summary: Fiscal Year 2000 WIC Food Package Costs. Dec. 2001a.
U.S. Department of Agriculture, Food and Nutrition Service, Office of Analysis and Evaluation.Cost-Effectiveness of Infant Formula Rebate Systems in the Special Supplemental FoodProgram for Women, Infants, and Children (WIC). May 1991.
U.S. Department of Agriculture, Food and Nutrition Service. WIC Program Infant Formula RebateListing. June 27, 2000.
U.S. Department of Agriculture, Food and Nutrition Service, Supplemental Food Program Divi-sion. Personal communication. September 2001b.
U.S. Department of Agriculture, Food and Nutrition Service, Supplemental Food Program Divi-sion. The Integrity Profile (TIP) Report, 2001c.
U.S. Department of Health and Human Services, Centers for Disease Control and Prevention,National Center for Health Statistics. National Vital Statistics Reports, 1994, 1995, 1996,1997, 1998, 1999, and 2000.
U.S. Department of Health and Human Services, Healthy People 2010: Understanding andImproving Health. 2nd edition, Nov. 2000.
U.S. General Accounting Office, Resources, Community, and Economic Development. FoodAssistance: A Variety of Practices May Lower the Costs of WIC. GAO/RCED-97-225, Sept.1997.
U.S. General Accounting Office, Resources, Community, and Economic Development. FoodAssistance: Information on WIC Sole-Source Rebates and Infant Formula Prices.GAO/RCED-98-146, May 1998.
Economic Research Service/USDA WIC and the Retail Price of Infant Formula / FANRR-39 ● 67
U.S. General Accounting Office, Human Resources Division. Infant Formula: Cost Containmentand Competition in the WIC Program. GAO/HRD-90-122, Sept. 1990.
U.S. General Accounting Office. Food Assistance: Potential to Serve More WIC Infants byReducing Formula Cost. GAO-03-331, Feb. 2003.
U.S. Senate, Committee on the Judiciary, Subcommittee on Antitrust Monopolies and BusinessRights. The Pricing Behavior of Infant Formula Companies, Senate Hearing 101-979,May 29, 1990.
Ward, M. B., J. P. Shimshack, J. M. Perloff, and J. M. Harris. “Effects of the Private-Label Inva-sion in Food Industries,” American Journal of Agricultural Economics, Vol. 84(4), Nov. 2002.
Wright A. L. and R. J. Schanler. “The Resurgence of Breastfeeding at the End of the SecondMillennium,” Journal of Nutrition, Vol. 131(supplement), August 2001.
Wyeth-Ayerst Laboratories. “Wyeth-Ayerst Laboratories to Phase Out Its U.S. Infant FormulaProducts,” press release, Jan. 8, 1996.
68 ● WIC and the Retail Price of Infant Formula / FANRR-39 Economic Research Service/USDA

Several States have engaged in infant formula cost-containment practices since WIC’s establish-ment in the early 1970s (Harvey et al., 1988). For example, Vermont, which uses a home deliverysystem to distribute WIC foods, has always used competitive bidding to purchase infant formulafor its WIC program. Mississippi, which uses a direct distribution system for WIC foods,purchased infant formula in bulk in order to take advantage of available discounts.1 However, theother States, all of which use retail purchase systems to distribute WIC foods, purchased infantformula at full retail prices prior to 1987.2
In the mid-1980s several factors prompted the States with retail purchase systems to look intoalternative ways to reduce infant formula costs: (1) nearly 40 percent of total WIC food costs wereattributed to infant formula; (2) formula prices grew faster than overall food prices; and (3) theinfant formula industry structure suggested that cost-containment initiatives could be successful(U.S. General Accounting Office, 1990). Tennessee became the first State with a retail purchasefood delivery system to implement a rebate system to control costs associated with infant formulawhen it awarded a competitively bid single-source exclusive contract in June 1987. Significantly,the contract was awarded to Wyeth Laboratories (the only company to submit a bid), who—sinceit accounted for only a small portion of the infant formula market—had the most to gain fromwinning a sole-source contract (Post and Wubberhorst, 1989). In December 1987, Oregon becamethe second State to implement a competitively bid single-source exclusive contract. The contractwas awarded to Wyeth Laboratories, which was once again the only company to submit a bid (U.S.GAO, 1990).
In late 1987 and early 1988, Florida, Michigan, and Wyoming instituted an alternative infantformula cost-containment strategy, known as the “open market” system. Under this system, therewere no sealed bids or exclusive contracts. Rather, infant formula manufacturers voluntarilyagreed to provide a rebate to the State for their share of infant formula purchased through WIC(Center on Budget and Policy Priorities, 1995). However, WIC participants could still chooseformula of manufacturers that chose not to provide a rebate. In spring of 1988, Texas awarded acompetitive bid single-source exclusive contract, which was the first to be bid on by more than onemanufacturer (U.S. GAO, 1990).
On October 1, 1988, P.L. 100-460 required that all State WIC agencies explore the feasibility ofimplementing cost-containment procedures for acquiring infant formula, and if the procedureswere determined to lower costs, begin implementing the cost-containment system within a year.Although States had the option of using a home delivery system (Vermont) or direct distributionsystem (Mississippi) to reduce costs, most found these to be infeasible due to the costs associatedwith administering the systems or because of their impact on participants (U.S. Department ofAgriculture, 1991). By late 1989, 57 State WIC agencies had implemented infant formula rebatecontracts, 35 used the open market system, 19 used the competitive sole-source system, and 3 useda competitive multisource rebate approach (U.S. GAO, 1990).3 Savings under the open market
Economic Research Service/USDA WIC and the Retail Price of Infant Formula / FANRR-39 ● 69
Appendix A—History of the WIC Infant Formula Rebate Program
1 In 1984, Mississippi began using competitive bidding (with the low bidder winning the contract) to purchase its infantformula for WIC (Harvey et. al., 1988). 2 In the past, parts of Ohio and Maryland also used the home delivery system to distribute WIC foods. These areas usedcompetitive bidding to award delivery contracts to the WIC vendors. These vendors in turn, tried to purchase the infantformula at the lowest cost (Harvey et al., 1988). 3 Under the competitive multisource rebate system, contracts were awarded to the best bidder and any other bidders whomet specified minimum bid criteria (U.S. GAO, 1990).
system, in which no sealed bids were submitted and the low bidder did not win an exclusivecontract, resulted in lower savings than under competitive bidding.4 The greater savings realizedunder the competitive bidding system were attributed to the lack of strong inherent pressure forprice competition in the infant formula industry (U.S. GAO, 1990).5
On November 10, 1989, P.L. 101-147 required States to use competitive bidding or an alternatemethod that yielded savings equal to or greater than that produced by competitive bidding toprocure infant formula (Indian State agencies with 1,000 or fewer WIC participants are exemptedfrom this requirement). Competitive bidding was defined as a procurement process in which theState WIC agency selects the single source (i.e., infant formula manufacturer) offering the lowestprice for the infant formula, as determined by the submission of sealed bids.6
Since the infant formula market was dominated by a small number of manufacturers, there wasconcern that coordination of pricing strategies between the manufacturers was leading to high infantformula prices and large profits for the producers. In May 1990, the Senate Subcommittee onAntitrust, Monopolies, and Business Rights held a hearing on the pricing behavior of infant formulacompanies. At the hearing, the Chairman, Senator Howard Metzenbaum, referred to the formulacompanies’ “campaign to undermine cost-containment efforts” in the WIC program as an exampleof the attempts of producers to “push prices higher” (U.S. Senate, 1990). At about that time, theFederal Trade Commission (FTC) began investigating potential anticompetitive practices in theinfant formula industry. In June 1992, the FTC brought charges against the three largest domesticmanufacturers of infant formula—Abbott Laboratories (parent company of Ross), Mead Johnson,and American Home Products (parent company of Wyeth)—alleging bid-rigging in connection witha WIC contract to provide infant formula in Puerto Rico (Federal Trade Commission, 1993). MeadJohnson and American Home Products agreed to settle charges by providing 3.6 million pounds offree infant formula to the WIC program (Mauskopf and Dean, 1990). In May 1994, the court ruledin favor of Abbott Laboratories (853 Federal Supplement 526, May 27, 1994).
The original cost-containment regulations published in 1989 required States to use competitivebidding to obtain infant formula, with the manufacturer offering the “lowest price” being awardedthe contract. Historically, States awarded infant formula contracts to the bidder offering the lowestnet costs (that is, the difference between the manufacturer’s wholesale price for infant formula andthe rebate offered to the State).7 However, in the mid-1990s, several States began awarding theircontracts to the bidder offering the highest total rebate (Larin, 1996).8 Contracts awarded on thebasis of highest total rebate favor manufacturers with high wholesale prices over those with lowwholesale prices. P.L. 105-86, enacted in November 1997, requires that contracts be awarded tothe bidder offering the lowest net price unless the average retail price for different brands of infantformula do not vary by more than 5 percent.
70 ● WIC and the Retail Price of Infant Formula / FANRR-39 Economic Research Service/USDA
4 An analysis by GAO found that after statistically controlling for other factors, competitive sole-source contractsresulted in prices (for a 13-ounce can of milk-based infant formula) that were $0.36 lower than that of open market con-tracts (U.S. GAO, 1990). 5 GAO states that the natural pressures for price competition between infant formula manufacturers are limited in theabsence of competitively bid contracts due to: (1) the small number of infant formula producers; (2) the difficulty newcompetitors face in entering the domestic market; and (3) consumer selection of infant formula brands that may be rel-atively unresponsive to price differences among the brands (U.S. GAO, 1990). 6 The best bid was determined by either the lowest net cost of infant formula or the highest rebate. 7 At the time the regulations were published in 1998, there were only relatively small differences in the wholesale priceof formula across the different brands. 8 The States contended that retail prices were not related to wholesale prices, and if retail prices for the different brandsof infant formula were similar, then the State would realize the greatest cost savings by awarding the contract to the bid-der offering the largest rebate (Larin, 1996).

The two largest infant formula companies, Ross and Mead Johnson, have long dominated the WICinfant formula market. In fact, only two other infant formula manufacturers, Wyeth and Carnation,have ever won WIC sole-source competitive infant formula rebate contracts, and Wyeth stoppedproducing infant formula under its own name in 1996.9 Since 1994, when most WIC State agen-cies switched to sole-source competitive rebate systems (excluding Indian State agencies with1,000 or fewer WIC participants), Carnation has accounted for between 1 percent and 6 percentannually of the formula purchased in WIC (appendix table A-1). Mead Johnson has gained inmarket share over Ross in recent years and now accounts for over two-thirds of the WIC market.
Economic Research Service/USDA WIC and the Retail Price of Infant Formula / FANRR-39 ● 71
9 Two small infant formula manufacturers, Loma Linda and Rimaco, participated in several open market contracts in theearly 1990s. These companies have since exited the infant formula market.
Appendix table A-1—Share of the WIC infant formula market by manufacturer, 1994-2000
Fiscal year Ross Mead Johnson Wyeth Carnation
Percent
1994 54.2 23.0 17.8 5.01995 48.5 32.8 13.7 5.11996 22.3 62.4 13.2 2.01997 31.0 67.4 0 1.41998 31.6 65.5 0 2.91999 25.8 70.1 0 4.22000 26.8 67.6 0 5.6
Source: Food and Nutrition Service, USDA.
Tables:
72 ● WIC and the Retail Price of Infant Formula / FANRR-39 Economic Research Service/USDA
Appendix B—Change in the Price of Infant Formula After a Change in the Holder of the WIC Contract by Market Area
Appendix B-1 Average retail price of milk-based powdered infant formula by market area,pre- and postchange in WIC contract holder, 1994-2000
Appendix B-2 Average retail price of milk-based liquid concentrate, infant formula by marketarea, pre- and postchange in WIC contract holder, 1994-2000
Appendix B-3 Average retail price of soy-based powdered infant formula by market area,pre- and postchange in WIC contract holder, 1994-2000
Appendix B-4 Average retail price of soy-based liquid concentrate infant formula by marketarea, pre- and postchange in WIC contract holder, 1994-2000

Economic Research Service/USDA WIC and the Retail Price of Infant Formula / FANRR-39 ● 73
Appendix table B-1—Average retail price of milk-based powdered infant formula by market area,
pre- and postchange in WIC contract holder, 1994-2000
Time of Old contract Pre- Post- Dollar New contract Pre- Post- Dollar change1 holder change change change holder change change change
Market area price price in price price price in price
Dollars Dollars Dollars Dollars
Albany 5 Ross 1.57 1.61 0.04 Mead Johnson 1.64 1.67 0.02
Atlanta 4 Ross 1.86 1.83 -0.03 Mead Johnson 1.89 1.93 0.04
Atlanta 19 Mead Johnson 2.31 2.32 0.02 Ross 2.44 2.50 0.06
Boise 8 Carnation 1.76 1.88 0.12 Mead Johnson 1.97 2.19 0.22
Boston 4 Mead Johnson 2.03 2.06 0.03 Wyeth 1.99 1.99 0.00
Boston 10 Wyeth 2.02 2.09 0.07 Mead Johnson 2.05 2.08 0.03
Buffalo/Rochester 5 Ross 1.87 1.87 0.00 Mead Johnson 1.90 1.92 0.03
Charlotte 4 Wyeth 1.99 1.96 -0.03 Mead Johnson 2.12 2.14 0.02
Chicago 9 Wyeth 2.33 2.35 0.02 Ross 2.40 2.61 0.21
Dallas/Ft Worth 20 Ross 2.50 2.53 0.03 Mead Johnson 2.52 2.56 0.04
Des Moines 20 Ross 2.49 2.63 0.14 Mead Johnson 2.37 2.55 0.19
Detroit 10 Wyeth 2.11 2.23 0.12 Ross 2.36 2.42 0.06
Grand Rapids 10 Wyeth 1.99 1.97 -0.01 Ross 1.93 2.07 0.14
Green Bay 10 Wyeth 2.37 2.31 -0.06 Ross 2.50 2.60 0.10
Harrisburg/Scranton 20 Mead Johnson 2.34 2.36 0.02 Ross 2.45 2.48 0.03
Hartford/Springfield 4 Mead Johnson 2.13 2.16 0.03 Wyeth 2.05 2.10 0.05
Hartford/Springfield 10 Wyeth 2.14 2.16 0.02 Mead Johnson 2.20 2.23 0.03
Houston 20 Ross 2.49 2.46 -0.03 Mead Johnson 2.27 2.34 0.07
Indianapolis 10 Wyeth 2.13 2.38 0.25 Ross 2.27 2.36 0.08
Indianapolis 24 Ross 2.31 2.33 0.02 Mead Johnson 2.10 2.37 0.28
Jacksonville 5 Ross 2.11 2.18 0.07 Mead Johnson 2.12 2.20 0.09
Jacksonville 21 Mead Johnson 2.49 2.51 0.02 Carnation 2.04 2.14 0.10
Knoxville 23 Mead Johnson 2.39 2.42 0.04 Ross 2.48 2.52 0.04
Little Rock 4 Ross 2.12 2.14 0.02 Mead Johnson 2.08 2.18 0.09
Los Angeles 7 Ross 2.39 2.23 -0.17 Mead Johnson 2.25 2.42 0.17
Miami/Ft Lauderdale 5 Ross 2.15 2.18 0.03 Mead Johnson 2.11 2.21 0.10
Miami/Ft Lauderdale 21 Mead Johnson 2.44 2.52 0.08 Carnation 2.06 2.24 0.19
Milwaukee, 10 Wyeth 2.26 2.28 0.01 Ross 2.48 2.57 0.09
Minneapolis/St Paul 20 Ross 2.44 2.29 -0.15 Mead Johnson 2.33 2.31 -0.02
Nashville 23 Mead Johnson 2.48 2.49 0.01 Ross 2.47 2.62 0.16
Oklahoma City 10 Wyeth 2.16 2.19 0.04 Mead Johnson 2.29 2.28 -0.01
Omaha 24 Ross 2.49 2.58 0.09 Mead Johnson 2.09 2.44 0.35
Orlando 5 Ross 2.10 2.18 0.08 Mead Johnson 2.12 2.21 0.10
Orlando 21 Mead Johnson 2.42 2.52 0.10 Carnation 2.07 2.20 0.13
Peoria/Springfield 9 Wyeth 2.10 2.06 -0.04 Ross 2.13 2.36 0.23
Pittsburgh 20 Mead Johnson 2.19 2.22 0.03 Ross 2.42 2.42 0.00
Portland 8 Carnation 1.84 1.94 0.09 Mead Johnson 1.86 2.16 0.30
Providence 4 Mead Johnson 2.05 2.07 0.03 Wyeth 2.05 2.13 0.08
Providence 10 Wyeth 2.11 2.22 0.11 Mead Johnson 2.13 2.16 0.03
See notes at end of table. Continued—
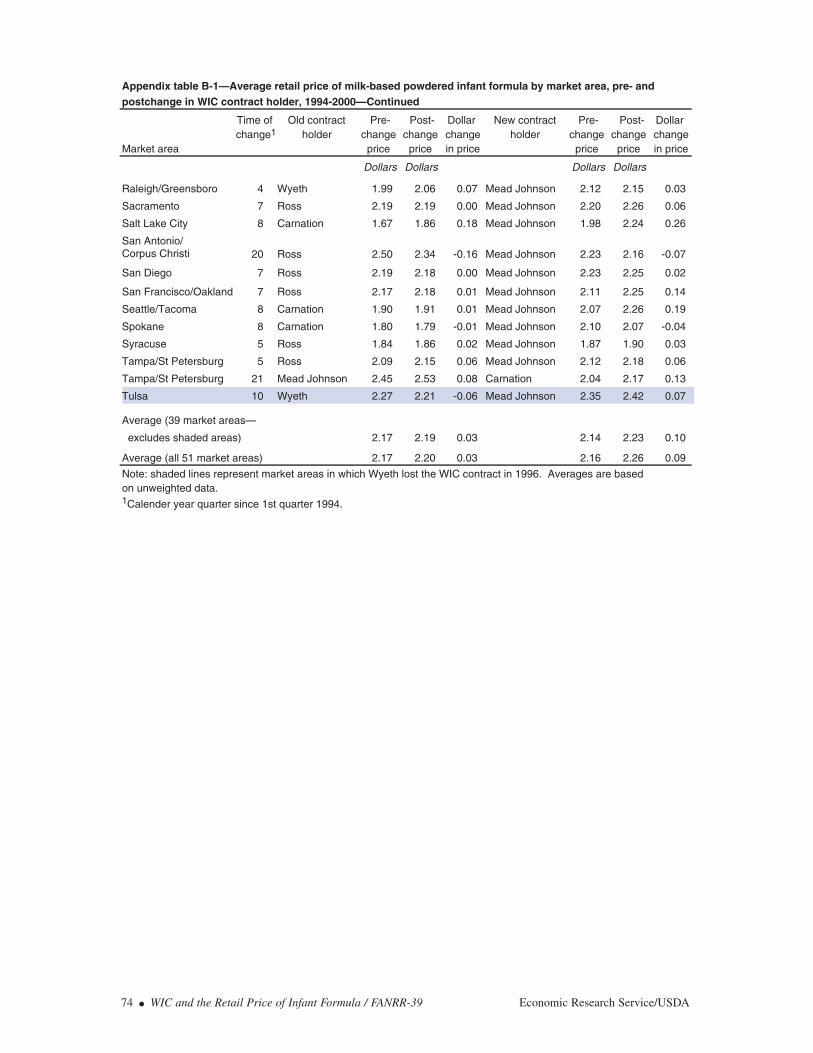
74 ● WIC and the Retail Price of Infant Formula / FANRR-39 Economic Research Service/USDA
Appendix table B-1—Average retail price of milk-based powdered infant formula by market area, pre- and postchange in WIC contract holder, 1994-2000—Continued
Time of Old contract Pre- Post- Dollar New contract Pre- Post- Dollar change1 holder change change change holder change change change
Market area price price in price price price in price
Dollars Dollars Dollars Dollars
Raleigh/Greensboro 4 Wyeth 1.99 2.06 0.07 Mead Johnson 2.12 2.15 0.03
Sacramento 7 Ross 2.19 2.19 0.00 Mead Johnson 2.20 2.26 0.06
Salt Lake City 8 Carnation 1.67 1.86 0.18 Mead Johnson 1.98 2.24 0.26
San Antonio/Corpus Christi 20 Ross 2.50 2.34 -0.16 Mead Johnson 2.23 2.16 -0.07
San Diego 7 Ross 2.19 2.18 0.00 Mead Johnson 2.23 2.25 0.02
San Francisco/Oakland 7 Ross 2.17 2.18 0.01 Mead Johnson 2.11 2.25 0.14
Seattle/Tacoma 8 Carnation 1.90 1.91 0.01 Mead Johnson 2.07 2.26 0.19
Spokane 8 Carnation 1.80 1.79 -0.01 Mead Johnson 2.10 2.07 -0.04
Syracuse 5 Ross 1.84 1.86 0.02 Mead Johnson 1.87 1.90 0.03
Tampa/St Petersburg 5 Ross 2.09 2.15 0.06 Mead Johnson 2.12 2.18 0.06
Tampa/St Petersburg 21 Mead Johnson 2.45 2.53 0.08 Carnation 2.04 2.17 0.13
Tulsa 10 Wyeth 2.27 2.21 -0.06 Mead Johnson 2.35 2.42 0.07
Average (39 market areas—
excludes shaded areas) 2.17 2.19 0.03 2.14 2.23 0.10
Average (all 51 market areas) 2.17 2.20 0.03 2.16 2.26 0.09
Note: shaded lines represent market areas in which Wyeth lost the WIC contract in 1996. Averages are based on unweighted data.1Calender year quarter since 1st quarter 1994.

Economic Research Service/USDA WIC and the Retail Price of Infant Formula / FANRR-39 ● 75
Appendix table B-2—Average retail price of milk-based liquid concentrate infant formula by market area,
pre- and postchange in WIC contract holder, 1994-2000
Time of Old contract Pre- Post- Dollar New contract Pre- Post- Dollar change1 holder change change change holder change change change
Market area price price in price price price in price
Dollars Dollars Dollars Dollars
Albany 5 Ross 1.92 2.05 0.14 Mead Johnson 1.90 2.08 0.18
Atlanta 4 Ross 2.30 2.33 0.03 Mead Johnson 2.27 2.36 0.09
Atlanta 19 Mead Johnson 2.84 2.85 0.01 Ross 2.82 2.89 0.07
Boise 8 Carnation 1.98 2.22 0.24 Mead Johnson 2.09 2.74 0.65
Boston 4 Mead Johnson 2.38 2.37 -0.01 Wyeth 2.27 2.31 0.03
Boston 10 Wyeth 2.35 2.39 0.04 Mead Johnson 2.34 2.53 0.19
Buffalo/Rochester 5 Ross 2.31 2.39 0.08 Mead Johnson 2.30 2.41 0.12
Charlotte 4 Wyeth 2.27 2.32 0.05 Mead Johnson 2.41 2.42 0.02
Chicago 9 Wyeth 2.78 2.76 -0.03 Ross 2.72 3.00 0.28
Dallas/Ft Worth 20 Ross 2.92 3.06 0.14 Mead Johnson 2.71 2.87 0.16
Des Moines 20 Ross 2.68 2.64 -0.03 Mead Johnson 2.62 3.09 0.46
Detroit 10 Wyeth 2.53 2.68 0.15 Ross 2.54 2.61 0.07
Grand Rapids 10 Wyeth 2.45 2.49 0.04 Ross 2.22 2.36 0.13
Green Bay 10 Wyeth 2.63 2.64 0.02 Ross 2.80 2.85 0.06
Harrisburg/Scranton 20 Mead Johnson 2.79 2.82 0.03 Ross 2.75 2.80 0.04
Hartford/Springfield 4 Mead Johnson 2.45 2.45 0.00 Wyeth 2.38 2.44 0.06
Hartford/Springfield 10 Wyeth 2.50 2.50 0.00 Mead Johnson 2.53 2.65 0.12
Houston 20 Ross 2.72 2.75 0.03 Mead Johnson 2.74 2.81 0.07
Indianapolis 10 Wyeth 2.48 2.65 0.17 Ross 2.50 2.60 0.10
Indianapolis 24 Ross 2.73 2.92 0.19 Mead Johnson 2.45 2.83 0.39
Jacksonville 5 Ross 2.41 2.49 0.08 Mead Johnson 2.41 2.50 0.10
Jacksonville 21 Mead Johnson 2.94 2.99 0.05 Carnation 2.28 2.40 0.12
Knoxville 23 Mead Johnson 2.90 2.93 0.03 Ross 2.78 2.85 0.07
Little Rock 4 Ross 2.41 2.33 -0.08 Mead Johnson 2.57 2.68 0.11
Los Angeles 7 Ross 2.70 2.53 -0.17 Mead Johnson 2.62 2.83 0.21
Miami/Ft Lauderdale 5 Ross 2.43 2.49 0.07 Mead Johnson 2.40 2.49 0.09
Miami/Ft Lauderdale 21 Mead Johnson 2.96 3.06 0.10 Carnation 2.30 2.51 0.21
Milwaukee 10 Wyeth 2.56 2.61 0.04 Ross 2.79 2.76 -0.03
Minneapolis/St Paul 20 Ross 2.81 2.74 -0.07 Mead Johnson 2.84 3.01 0.17
Nashville 23 Mead Johnson 3.03 3.01 -0.02 Ross 2.87 3.05 0.18
Oklahoma City 10 Wyeth 2.54 2.62 0.07 Mead Johnson 2.62 2.65 0.03
Omaha 24 Ross 2.84 2.74 -0.10 Mead Johnson 2.46 2.89 0.44
Orlando 5 Ross 2.42 2.50 0.08 Mead Johnson 2.40 2.50 0.10
Orlando 21 Mead Johnson 2.95 3.09 0.14 Carnation 2.34 2.52 0.18
Peoria/Springfield 9 Wyeth 2.51 2.52 0.01 Ross 2.24 2.55 0.32
Pittsburgh 20 Mead Johnson 2.57 2.61 0.04 Ross 2.54 2.59 0.04
Portland 8 Carnation 2.04 2.13 0.10 Mead Johnson 2.24 2.61 0.37
Providence 4 Mead Johnson 2.29 2.37 0.08 Wyeth 2.26 2.41 0.16
Providence 10 Wyeth 2.27 2.47 0.20 Mead Johnson 2.46 2.64 0.18
See notes at end of table. Continued—
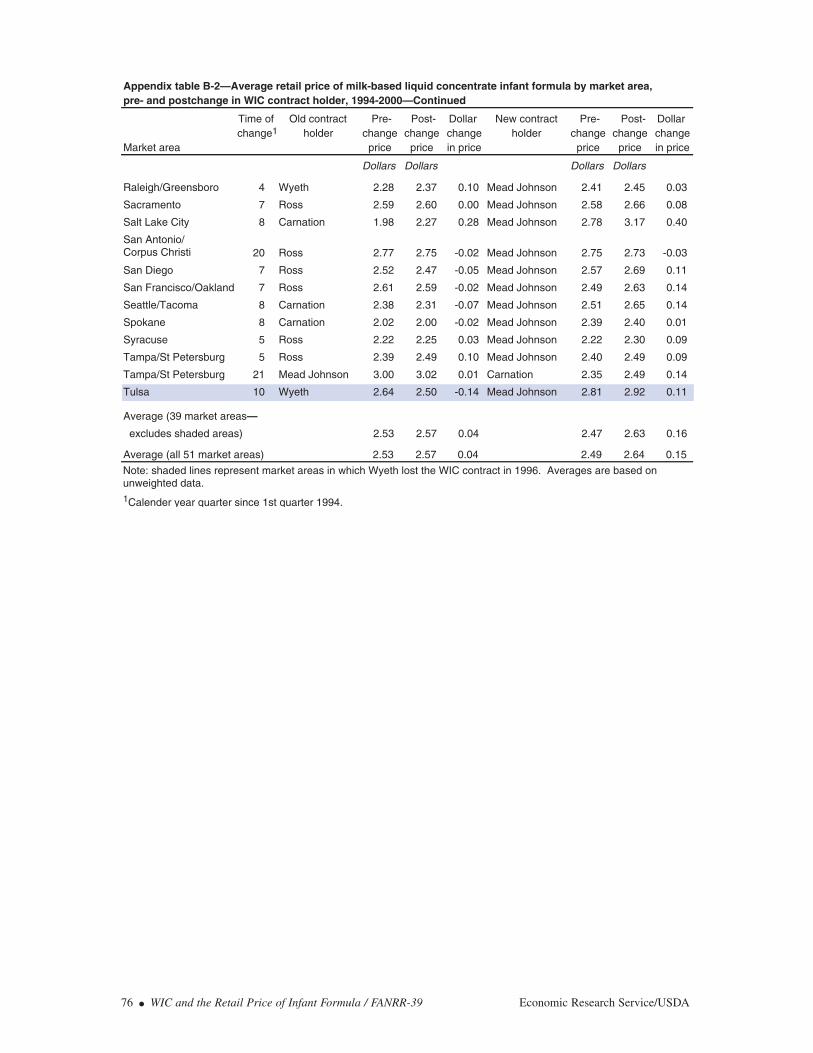
76 ● WIC and the Retail Price of Infant Formula / FANRR-39 Economic Research Service/USDA
Appendix table B-2—Average retail price of milk-based liquid concentrate infant formula by market area, pre- and postchange in WIC contract holder, 1994-2000—Continued
Time of Old contract Pre- Post- Dollar New contract Pre- Post- Dollar change1 holder change change change holder change change change
Market area price price in price price price in price
Dollars Dollars Dollars Dollars
Raleigh/Greensboro 4 Wyeth 2.28 2.37 0.10 Mead Johnson 2.41 2.45 0.03
Sacramento 7 Ross 2.59 2.60 0.00 Mead Johnson 2.58 2.66 0.08
Salt Lake City 8 Carnation 1.98 2.27 0.28 Mead Johnson 2.78 3.17 0.40
San Antonio/Corpus Christi 20 Ross 2.77 2.75 -0.02 Mead Johnson 2.75 2.73 -0.03
San Diego 7 Ross 2.52 2.47 -0.05 Mead Johnson 2.57 2.69 0.11
San Francisco/Oakland 7 Ross 2.61 2.59 -0.02 Mead Johnson 2.49 2.63 0.14
Seattle/Tacoma 8 Carnation 2.38 2.31 -0.07 Mead Johnson 2.51 2.65 0.14
Spokane 8 Carnation 2.02 2.00 -0.02 Mead Johnson 2.39 2.40 0.01
Syracuse 5 Ross 2.22 2.25 0.03 Mead Johnson 2.22 2.30 0.09
Tampa/St Petersburg 5 Ross 2.39 2.49 0.10 Mead Johnson 2.40 2.49 0.09
Tampa/St Petersburg 21 Mead Johnson 3.00 3.02 0.01 Carnation 2.35 2.49 0.14
Tulsa 10 Wyeth 2.64 2.50 -0.14 Mead Johnson 2.81 2.92 0.11
Average (39 market areas—
excludes shaded areas) 2.53 2.57 0.04 2.47 2.63 0.16
Average (all 51 market areas) 2.53 2.57 0.04 2.49 2.64 0.15
Note: shaded lines represent market areas in which Wyeth lost the WIC contract in 1996. Averages are based on unweighted data.1Calender year quarter since 1st quarter 1994.

Economic Research Service/USDA WIC and the Retail Price of Infant Formula / FANRR-39 ● 77
Appendix table B-3—Average retail price of soy-based powdered infant formula by market area,
pre- and postchange in WIC contract holder, 1994-2000
Time of Old contract Pre- Post- Dollar New contract Pre- Post- Dollar change1 holder change change change holder change change change
Market area price price in price price price in price
Dollars Dollars Dollars Dollars
Albany 5 Ross 1.80 1.86 0.06 Mead Johnson 1.88 1.95 0.07
Atlanta 4 Ross 1.97 1.98 0.01 Mead Johnson 1.88 1.97 0.08
Atlanta 19 Mead Johnson 2.64 2.65 0.02 Ross 2.56 2.59 0.03
Boston 4 Mead Johnson 2.20 2.24 0.05 Wyeth 1.98 1.94 -0.04
Boston 10 Wyeth 1.94 1.96 0.01 Mead Johnson 2.28 2.32 0.04
Buffalo/Rochester 5 Ross 2.08 2.10 0.02 Mead Johnson 1.98 2.07 0.08
Charlotte 4 Wyeth 1.85 1.91 0.06 Mead Johnson 2.26 2.29 0.02
Chicago 9 Wyeth 2.28 2.31 0.03 Ross 2.60 2.75 0.15
Dallas/Ft Worth 20 Ross 2.73 2.76 0.03 Mead Johnson 2.91 2.96 0.06
Denver 8 Ross 2.18 2.20 0.02 Mead Johnson 2.26 2.27 0.01
Des Moines 20 Ross 2.61 2.77 0.16 Mead Johnson 2.74 2.97 0.23
Detroit 10 Wyeth 2.00 2.21 0.21 Ross 2.39 2.42 0.04
Grand Rapids 10 Wyeth 1.90 1.86 -0.04 Ross 2.02 2.05 0.03
Green Bay 10 Wyeth 2.18 2.17 -0.01 Ross 2.68 2.74 0.07
Harrisburg/Scranton 20 Mead Johnson 2.67 2.67 0.01 Ross 2.53 2.57 0.04
Hartford/Springfield 4 Mead Johnson 2.29 2.32 0.02 Wyeth 2.03 2.09 0.05
Hartford/Springfield 10 Wyeth 2.14 2.15 0.01 Mead Johnson 2.38 2.45 0.07
Houston 20 Ross 2.55 2.55 0.00 Mead Johnson 2.50 2.59 0.09
Indianapolis 10 Wyeth 2.05 2.22 0.17 Ross 2.32 2.35 0.04
Indianapolis 24 Ross 2.38 2.44 0.06 Mead Johnson 2.58 2.73 0.15
Jacksonville 5 Ross 2.26 2.34 0.08 Mead Johnson 2.26 2.36 0.10
Jacksonville 21 Mead Johnson 2.69 2.80 0.12 Carnation 1.91 2.01 0.09
Knoxville 23 Mead Johnson 2.71 2.76 0.05 Ross 2.52 2.56 0.03
Little Rock 4 Ross 2.41 2.48 0.07 Mead Johnson 2.45 2.48 0.03
Los Angeles 7 Ross 2.45 2.36 -0.09 Mead Johnson 2.37 2.48 0.11
Miami/Ft Lauderdale 5 Ross 2.28 2.35 0.07 Mead Johnson 2.26 2.34 0.08
Miami/Ft Lauderdale 21 Mead Johnson 2.72 2.81 0.09 Carnation 1.92 2.04 0.12
Milwaukee 10 Wyeth 2.15 2.17 0.01 Ross 2.75 2.76 0.01
Minneapolis/St Paul 20 Ross 2.58 2.46 -0.12 Mead Johnson 2.69 2.65 -0.04
Nashville 23 Mead Johnson 2.76 2.73 -0.03 Ross 2.55 2.75 0.20
Oklahoma City 10 Wyeth 2.06 2.17 0.12 Mead Johnson 2.53 2.55 0.02
Omaha 24 Ross 2.67 2.67 0.00 Mead Johnson 2.61 2.73 0.12
Orlando 5 Ross 2.26 2.35 0.09 Mead Johnson 2.26 2.35 0.09
Orlando 21 Mead Johnson 2.71 2.87 0.16 Carnation 1.93 2.03 0.10
Peoria/Springfield 9 Wyeth 2.00 2.01 0.00 Ross 2.36 2.48 0.12
Pittsburgh 20 Mead Johnson 2.64 2.71 0.07 Ross 2.50 2.49 -0.01
Providence 4 Mead Johnson 2.21 2.23 0.02 Wyeth 2.06 2.06 0.00
Providence 10 Wyeth 2.07 2.13 0.06 Mead Johnson 2.23 2.32 0.09
Raleigh/Greensboro 4 Wyeth 1.85 1.94 0.08 Mead Johnson 2.26 2.29 0.03
See notes at end of table. Continued—

78 ● WIC and the Retail Price of Infant Formula / FANRR-39 Economic Research Service/USDA
Appendix table B-3—Average retail price of soy-based powdered infant formula by market area, pre- and postchange in WIC contract holder, 1994-2000—Continued
Time of Old contract Pre- Post- Dollar New contract Pre- Post- Dollar change1 holder change change change holder change change change
Market area price price in price price price in price
Dollars Dollars Dollars Dollars
Sacramento 7 Ross 2.39 2.37 -0.02 Mead Johnson 2.44 2.46 0.02
San Antonio/Corpus Christi 20 Ross 2.59 2.60 0.01 Mead Johnson 2.59 2.58 -0.01
San Diego 7 Ross 2.37 2.36 -0.01 Mead Johnson 2.35 2.42 0.07
San Francisco/Oakland 7 Ross 2.36 2.37 0.01 Mead Johnson 2.38 2.40 0.03
Syracuse 5 Ross 2.04 2.08 0.04 Mead Johnson 2.02 2.10 0.07
Tampa/St Petersburg 5 Ross 2.25 2.31 0.06 Mead Johnson 2.26 2.34 0.08
Tampa/St Petersburg 21 Mead Johnson 2.77 2.84 0.06 Carnation 1.90 2.00 0.09
Tulsa 10 Wyeth 2.15 2.10 -0.05 Mead Johnson 2.65 2.67 0.03
Average (35 market areas—
excludes shaded areas) 2.40 2.44 0.04 2.30 2.37 0.06
Average (all 47 market areas) 2.32 2.35 0.04 2.34 2.40 0.06
Note: shaded lines represent market areas in which Wyeth lost the WIC contract in 1996. Averages are based on unweighted data.1Calender year quarter since 1st quarter 1994.
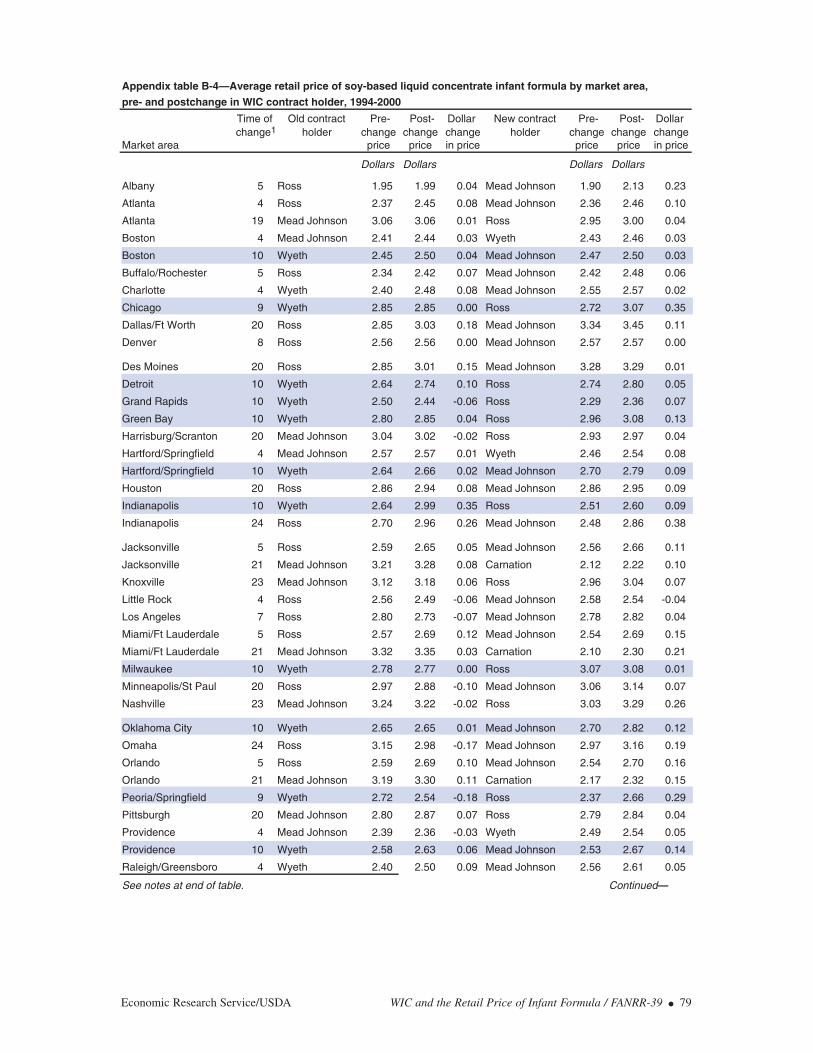
Economic Research Service/USDA WIC and the Retail Price of Infant Formula / FANRR-39 ● 79
Appendix table B-4—Average retail price of soy-based liquid concentrate infant formula by market area,
pre- and postchange in WIC contract holder, 1994-2000
Time of Old contract Pre- Post- Dollar New contract Pre- Post- Dollar change1 holder change change change holder change change change
Market area price price in price price price in price
Dollars Dollars Dollars Dollars
Albany 5 Ross 1.95 1.99 0.04 Mead Johnson 1.90 2.13 0.23
Atlanta 4 Ross 2.37 2.45 0.08 Mead Johnson 2.36 2.46 0.10
Atlanta 19 Mead Johnson 3.06 3.06 0.01 Ross 2.95 3.00 0.04
Boston 4 Mead Johnson 2.41 2.44 0.03 Wyeth 2.43 2.46 0.03
Boston 10 Wyeth 2.45 2.50 0.04 Mead Johnson 2.47 2.50 0.03
Buffalo/Rochester 5 Ross 2.34 2.42 0.07 Mead Johnson 2.42 2.48 0.06
Charlotte 4 Wyeth 2.40 2.48 0.08 Mead Johnson 2.55 2.57 0.02
Chicago 9 Wyeth 2.85 2.85 0.00 Ross 2.72 3.07 0.35
Dallas/Ft Worth 20 Ross 2.85 3.03 0.18 Mead Johnson 3.34 3.45 0.11
Denver 8 Ross 2.56 2.56 0.00 Mead Johnson 2.57 2.57 0.00
Des Moines 20 Ross 2.85 3.01 0.15 Mead Johnson 3.28 3.29 0.01
Detroit 10 Wyeth 2.64 2.74 0.10 Ross 2.74 2.80 0.05
Grand Rapids 10 Wyeth 2.50 2.44 -0.06 Ross 2.29 2.36 0.07
Green Bay 10 Wyeth 2.80 2.85 0.04 Ross 2.96 3.08 0.13
Harrisburg/Scranton 20 Mead Johnson 3.04 3.02 -0.02 Ross 2.93 2.97 0.04
Hartford/Springfield 4 Mead Johnson 2.57 2.57 0.01 Wyeth 2.46 2.54 0.08
Hartford/Springfield 10 Wyeth 2.64 2.66 0.02 Mead Johnson 2.70 2.79 0.09
Houston 20 Ross 2.86 2.94 0.08 Mead Johnson 2.86 2.95 0.09
Indianapolis 10 Wyeth 2.64 2.99 0.35 Ross 2.51 2.60 0.09
Indianapolis 24 Ross 2.70 2.96 0.26 Mead Johnson 2.48 2.86 0.38
Jacksonville 5 Ross 2.59 2.65 0.05 Mead Johnson 2.56 2.66 0.11
Jacksonville 21 Mead Johnson 3.21 3.28 0.08 Carnation 2.12 2.22 0.10
Knoxville 23 Mead Johnson 3.12 3.18 0.06 Ross 2.96 3.04 0.07
Little Rock 4 Ross 2.56 2.49 -0.06 Mead Johnson 2.58 2.54 -0.04
Los Angeles 7 Ross 2.80 2.73 -0.07 Mead Johnson 2.78 2.82 0.04
Miami/Ft Lauderdale 5 Ross 2.57 2.69 0.12 Mead Johnson 2.54 2.69 0.15
Miami/Ft Lauderdale 21 Mead Johnson 3.32 3.35 0.03 Carnation 2.10 2.30 0.21
Milwaukee 10 Wyeth 2.78 2.77 0.00 Ross 3.07 3.08 0.01
Minneapolis/St Paul 20 Ross 2.97 2.88 -0.10 Mead Johnson 3.06 3.14 0.07
Nashville 23 Mead Johnson 3.24 3.22 -0.02 Ross 3.03 3.29 0.26
Oklahoma City 10 Wyeth 2.65 2.65 0.01 Mead Johnson 2.70 2.82 0.12
Omaha 24 Ross 3.15 2.98 -0.17 Mead Johnson 2.97 3.16 0.19
Orlando 5 Ross 2.59 2.69 0.10 Mead Johnson 2.54 2.70 0.16
Orlando 21 Mead Johnson 3.19 3.30 0.11 Carnation 2.17 2.32 0.15
Peoria/Springfield 9 Wyeth 2.72 2.54 -0.18 Ross 2.37 2.66 0.29
Pittsburgh 20 Mead Johnson 2.80 2.87 0.07 Ross 2.79 2.84 0.04
Providence 4 Mead Johnson 2.39 2.36 -0.03 Wyeth 2.49 2.54 0.05
Providence 10 Wyeth 2.58 2.63 0.06 Mead Johnson 2.53 2.67 0.14
Raleigh/Greensboro 4 Wyeth 2.40 2.50 0.09 Mead Johnson 2.56 2.61 0.05
See notes at end of table. Continued—
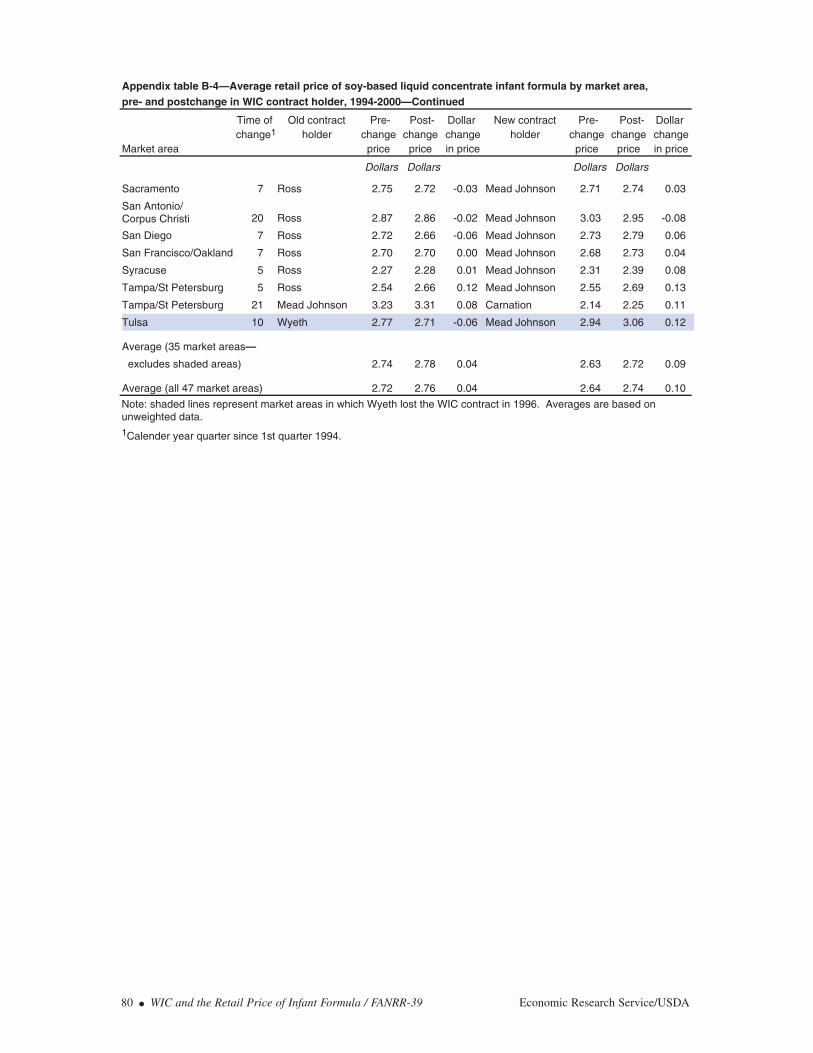
80 ● WIC and the Retail Price of Infant Formula / FANRR-39 Economic Research Service/USDA
Appendix table B-4—Average retail price of soy-based liquid concentrate infant formula by market area, pre- and postchange in WIC contract holder, 1994-2000—Continued
Time of Old contract Pre- Post- Dollar New contract Pre- Post- Dollar change1 holder change change change holder change change change
Market area price price in price price price in price
Dollars Dollars Dollars Dollars
Sacramento 7 Ross 2.75 2.72 -0.03 Mead Johnson 2.71 2.74 0.03
San Antonio/Corpus Christi 20 Ross 2.87 2.86 -0.02 Mead Johnson 3.03 2.95 -0.08
San Diego 7 Ross 2.72 2.66 -0.06 Mead Johnson 2.73 2.79 0.06
San Francisco/Oakland 7 Ross 2.70 2.70 0.00 Mead Johnson 2.68 2.73 0.04
Syracuse 5 Ross 2.27 2.28 0.01 Mead Johnson 2.31 2.39 0.08
Tampa/St Petersburg 5 Ross 2.54 2.66 0.12 Mead Johnson 2.55 2.69 0.13
Tampa/St Petersburg 21 Mead Johnson 3.23 3.31 0.08 Carnation 2.14 2.25 0.11
Tulsa 10 Wyeth 2.77 2.71 -0.06 Mead Johnson 2.94 3.06 0.12
Average (35 market areas—
excludes shaded areas) 2.74 2.78 0.04 2.63 2.72 0.09
Average (all 47 market areas) 2.72 2.76 0.04 2.64 2.74 0.10
Note: shaded lines represent market areas in which Wyeth lost the WIC contract in 1996. Averages are based onunweighted data.1Calender year quarter since 1st quarter 1994.
This appendix summarizes the results of an economic model (hereafter, “WIC model”) of thefactors that influence the supermarket retail prices of infant formula, with special attention devotedto the role of WIC and its infant formula rebate program. The WIC model generalizes the standardmulti-firm Cournot oligopoly model to a new setting that features two differentiated products,heterogeneous consumers who are segmented by income, and the presence of WIC and its rebateprogram. A forthcoming companion report, An Economic Model of WIC, the Infant FormulaRebate Program, and the Retail Price of Infant Formula, provides the formal mathematical devel-opment of the WIC model and examines the model’s results more fully.
Under sole-source procurement, the formula provided by the contract-winning manufacturerreceives all of the infant formula demand of WIC households (hereafter, “WIC demand”) and allother manufacturers’ brands receive none of the WIC demand.1 In September 2000, each of theWIC State agencies of the 50 States was using sole-source procurement. A critical feature of theWIC model’s specification is its inclusion of not one but two formula brands (two “products”), afeature that is required to identify the simultaneous interactions between the prices of contract andnoncontract brands of formula.
The WIC model constitutes the theoretical framework for the specification and interpretation ofthe regression models presented in this report. Of the various factors that may affect supermarketretail prices of infant formula, two WIC-related factors receive particular attention:
● the effects on the prices of the contract and noncontract brands of formula of anincrease in the relative size of WIC (as measured by the number of formula-fedWIC infants relative to the number of formula-fed non-WIC infants)
● the effects on the price of a manufacturer’s infant formula product of a change inthe product’s contract brand status between being the contract brand and being anoncontract brand.
The WIC model focuses on the retail markup in supermarkets.2 It treats the wholesale price as anexogenous variable independent of a manufacturer’s contract brand status in any one market area.The model assumes a manufacturer’s wholesale price of formula is the same across supermarkets,but does not restrict the manufacturers’ wholesale prices to equal one another.
The WIC model assumes that there are three distinct formula-buying groups or market segments:
H - high-income households; L - low-income non-WIC households; or W - low-income households that receive vouchers in the WIC program.3
Economic Research Service/USDA WIC and the Retail Price of Infant Formula / FANRR-39 ● 81
Appendix C—The Economic Model of the Retail Infant Formula Market
1 An exception to this general statement is that the WIC State agency can issue formula provided by a different manu-facturer to accommodate religious eating patterns or when medical documentation supports the use of another infant for-mula product.2 Because the behavior of supermarket retail prices can be expected to differ systematically based on the distributionsystem used by a State, the discussion in this appendix and the report’s regression analysis both consider only those mar-ket areas in which the retail food delivery system is used (as opposed to the Direct Distribution system, used inMississippi, or the Home Distribution system, used in Vermont).3 The model sets the income “cutoff” that divides low-income from high-income households above the income thresh-old for WIC income eligibility (185 percent of poverty) instead of equal to or below that threshold. Thus, by definitionof the term low-income, there is some positive number of low-income non-WIC households (L > 0) even if all house-holds (with infants) with income below 185 percent of poverty participate in WIC.
Two fundamental aspects of the model’s structure pertain to the price responsiveness of these threegroups: (1) The model assumes a low-income non-WIC household is relatively more responsiveto an increase in the price of an infant formula product, switching to substitutes (perhaps especiallydiscount store formula) more readily than do high-income non-WIC households; and (2) Itassumes that a WIC household does not respond at all to an increase in price—i.e., that WICdemand is completely insensitive to price (perfectly inelastic)—because WIC households receivefood instruments (“vouchers”) for a fixed amount of formula rather than paying out of pocket aslow-income non-WIC and higher income households do. Salant (1999) and Post and Wubbenhorst(1989) each adopted one of these assumptions about price sensitivities. Their two argumentsregarding the effects of WIC, relative to the absence of WIC, are compatible and both are adaptedhere to consider the price effects of an increase in the relative size of WIC.
Salant considered the behavior of a monopolistic infant formula manufacturer and examined majormanufacturers’ wholesale price series. Based on a “reservation price” monopoly model, Salantargued: “by removing the portion of the population with the lowest reservation price for infantformula from the general market, the WIC program inevitably raised the profit-maximizingmonopoly price … What previously restrained [the monopolist] was the recognition that a priceincrease would drive away the poorer customers; but once the WIC program absorbs thesecustomers, the monopolist has nothing further to lose if he raises the price … As more infants areadded to the WIC program, the model predicts that the [monopolist] will continue to raise the priceto non-WIC customers.”4 The pricing behavior identified by Salant does not require that the firm bea monopolist or a manufacturer: his economic reasoning also applies to the WIC model in whichmultiple supermarkets engage in (imperfect) competition in the establishment of a retail price.
Salant’s argument that WIC “removes” from the general market the (low-income) households withthe lowest reservation price is recast by the WIC model as the argument that WIC “removes” fromthe general market the (low-income) households that are relatively more price sensitive. When therelative size of WIC increases, some additional low-income non-WIC households leave the out-of-pocket segment of the market and enter the WIC segment, changing the mix of out-of-pockethouseholds towards relatively more H and less L. This change in the mix lowers the overall price-sensitivity of the out-of-pocket households, which is a weighted average of their segment-specificprice sensitivities. As a result of the increase in the relative size of WIC, each of the supermarketchains will find it profit-maximizing to increase retail price (of the contract brand), holding otherfactors constant. The WIC model calls this price-increasing effect of WIC the out-of-pocketcomposition effect because the effect depends on whether out-of-pocket demand is composed ofrelatively few or many low-income households.
The second mechanism by which WIC decreases the price sensitivity of demand was identified byPost and Wubbenhorst (1989). They argued that by providing WIC households with vouchers, theWIC program produces a “customer that is essentially unconcerned with the price she or he ispaying.” When the relative size of WIC increases, the mix of demands in total market demand ischanged, with relatively fewer price-sensitive out-of-pocket households and relatively more price-insensitive WIC households resulting in a decrease in overall price sensitivity. As a result of theincrease in the relative size of WIC, each of the supermarket chains will find it profit-maximizing
82 ● WIC and the Retail Price of Infant Formula / FANRR-39 Economic Research Service/USDA
4 Salant noted that this effect is analogous to pricing effects that seem to be found in the markets for certain pharmaceu-tical products. In some instances, the price of a brand-name drug increased after entry into the market by generic drugs.One explanation is that consumers who were most price sensitive switched to the generic drug, leaving the less price-sensitive customers in the market for the brand-name product and prompting an increase in the brand-name product’sprice. Similar pricing behavior was found in a broad study of thirty-two processed food and beverages industries byWard et al. (2002), who found that brand-name firms’ prices tend to rise when the share of private-label firms increase.
to increase retail price (of the contract brand), holding other factors constant. The WIC model callsthis price-increasing effect of WIC the voucher effect.
While WIC does “remove” a set of low-income households from the out-of-pocket segment of theretail food system, as Salant emphasized, WIC also provides vouchers that make the WIC house-holds price insensitive, as Post and Wubbenhorst emphasized, which “adds” those same house-holds back into the retail food system. Supermarket retail price (of the contract brand) is positivelyrelated to the relative to size of WIC due to both mechanisms. Although the out-of-pocket compo-sition effect and the voucher effect both affect the mix of households in the infant formula market,the two effects are different: the former changes the mix within the group of out-of-pocket house-holds, while the latter changes the mix between the out-of-pocket households and the WIC house-holds. A way of describing both effects at once is to state that WIC converts out-of-pocket lowincome households (whose price sensitivity is greater than for high-income households) into WIChouseholds (whose price sensitivity—of zero—is smaller than for high-income households).5
The statistical analysis of the report is based on the retailer-behavior hypothesis, which states thatsupermarket infant formula prices (P) are determined, in part, by the relative size of WIC (S). Anadditional family-behavior hypothesis should be considered, which states that higher infant for-mula prices lead to increased participation in WIC since the value and attractiveness of the WICbenefit rises when infant formula prices are higher. Thus, the retailer-behavior hypothesis statesthat P depends on S while the family-behavior hypothesis states that S depends on P. If bothhypotheses are valid—in the relevant price range found in the 1994-2000 sample—then observeddata for P and S are generated by two simultaneous equations.6 The report focuses exclusively onthe retailer hypothesis, treating S as an exogenous factor, based in part on the belief that the vastmajority of eligibles participated in WIC during the 1994-2000 period. While one can easilyimagine that some, even many, WIC-eligible families are indeed attracted to WIC and apply forthe program due (in part) to infant formula prices, that scenario by itself does not mean that thefamily-behavior hypothesis is pertinent statistically in the relevant price range. It is thought thatthose families who base WIC participation decisions on infant formula prices do so well beforeinfant formula prices reach the levels observed in the data, so that—on the margin—variation inprice does not affect participation decisions of the remaining eligible nonparticipants. Technically,the family-behavior function S = g(P) is thought to be strictly concave with a slope g’(P)approaching zero in the relevant price range.
The designation of a particular manufacturer as the contract brand may do more than bring WICdemand to its product. Non-WIC demand may be drawn to the contract brand for either of tworeasons identified by the GAO (1998) and others. First, doctors or hospitals may tend to promotethe State’s contract brand, either through recommendations or the provision of formula samples,and such promotions may lead to a brand-inducement behavior by which some number of non-WIC households favor the contract brand when making their out-of-pocket formula purchase.Second, some number of non-WIC households may favor the brand that has a greater presence onthe supermarket shelf.
Economic Research Service/USDA WIC and the Retail Price of Infant Formula / FANRR-39 ● 83
5 The concept of converting low-income households from non-WIC to WIC participation helps clarify how there are twoanswers to the seemingly simple question: “Are WIC households more sensitive or less sensitive to price than high-income households?” The answer depends on whether the price sensitivity of WIC households is considered ex ante orex post to their participation in WIC.6 It is believed that during 1994-2000, WIC funding was sufficient to support participation by all eligible householdswho chose to enroll their infants in the program. If WIC funding had been more limited, then it is possible that anincrease in infant formula prices would have decreased WIC participation by (formula-fed) infants—even if it increasedthe number of applicants—because less formula can be purchased with a fixed limited budget when price increases.
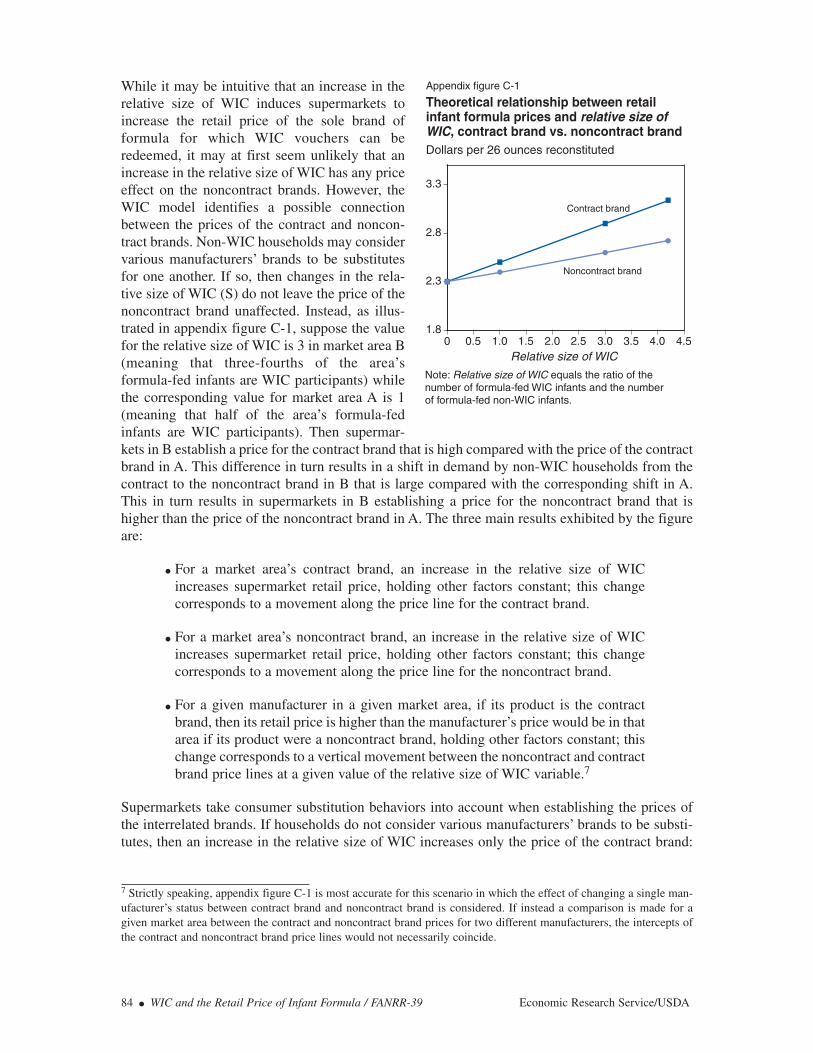
While it may be intuitive that an increase in therelative size of WIC induces supermarkets toincrease the retail price of the sole brand offormula for which WIC vouchers can beredeemed, it may at first seem unlikely that anincrease in the relative size of WIC has any priceeffect on the noncontract brands. However, theWIC model identifies a possible connectionbetween the prices of the contract and noncon-tract brands. Non-WIC households may considervarious manufacturers’ brands to be substitutesfor one another. If so, then changes in the rela-tive size of WIC (S) do not leave the price of thenoncontract brand unaffected. Instead, as illus-trated in appendix figure C-1, suppose the valuefor the relative size of WIC is 3 in market area B(meaning that three-fourths of the area’sformula-fed infants are WIC participants) whilethe corresponding value for market area A is 1(meaning that half of the area’s formula-fedinfants are WIC participants). Then supermar-kets in B establish a price for the contract brand that is high compared with the price of the contractbrand in A. This difference in turn results in a shift in demand by non-WIC households from thecontract to the noncontract brand in B that is large compared with the corresponding shift in A.This in turn results in supermarkets in B establishing a price for the noncontract brand that ishigher than the price of the noncontract brand in A. The three main results exhibited by the figureare:
● For a market area’s contract brand, an increase in the relative size of WICincreases supermarket retail price, holding other factors constant; this changecorresponds to a movement along the price line for the contract brand.
● For a market area’s noncontract brand, an increase in the relative size of WICincreases supermarket retail price, holding other factors constant; this changecorresponds to a movement along the price line for the noncontract brand.
● For a given manufacturer in a given market area, if its product is the contractbrand, then its retail price is higher than the manufacturer’s price would be in thatarea if its product were a noncontract brand, holding other factors constant; thischange corresponds to a vertical movement between the noncontract and contractbrand price lines at a given value of the relative size of WIC variable.7
Supermarkets take consumer substitution behaviors into account when establishing the prices ofthe interrelated brands. If households do not consider various manufacturers’ brands to be substi-tutes, then an increase in the relative size of WIC increases only the price of the contract brand:
84 ● WIC and the Retail Price of Infant Formula / FANRR-39 Economic Research Service/USDA
Appendix figure C-1
Theoretical relationship between retail infant formula prices and relative size of WIC, contract brand vs. noncontract brandDollars per 26 ounces reconstituted
Noncontract brand
Contract brand
1.8
2.3
2.8
3.3
0 0.5 1.0 1.5 2.0 2.5 3.0 3.5 4.0 4.5Relative size of WIC
Note: Relative size of WIC equals the ratio of the number of formula-fed WIC infants and the number of formula-fed non-WIC infants.
7 Strictly speaking, appendix figure C-1 is most accurate for this scenario in which the effect of changing a single man-ufacturer’s status between contract brand and noncontract brand is considered. If instead a comparison is made for agiven market area between the contract and noncontract brand prices for two different manufacturers, the intercepts ofthe contract and noncontract brand price lines would not necessarily coincide.
the noncontract brand price line would be horizontal (not shown). The regression analysis revealswhat the retail price data show about the slope of noncontract brand price lines, by manufacturerand product type.
As noted, the WIC model assumes that the price sensitivities of high-income non-WIC consumersare lower than those of low-income non-WIC consumers. The regression analysis includes medianhousehold income as an independent variable with the expectation that an increase in a marketarea’s household income results in an increase in the retail price established by supermarkets.
The role played by the mix or composition of out-of-pocket households H and L was alsoexplained by the model. No readily available data compare the middle and upper reaches of theincome distribution for these two household segments. Instead, a market area’s Poverty Rate isassumed to capture the general location of the area’s income distribution, and the Poverty Rate isincluded in the price regressions to proxy for the presence of the low-income non-WIC households(whose incomes in fact exceed the poverty line) relative to the high-income non-WIC householdsat the high end of the income distribution. An increase in the poverty rate is expected to increasethe overall price sensitivity of the out-of-pocket segment of the market, and thereby result in adecrease in the supermarket retail price.8
According to the WIC model, another factor that affects supermarket price is the ease (of the out-of-pocket households) of switching to lower priced formula sold in the discount store sector inresponse to an increase in the supermarket retail price. The price sensitivity of demand for super-market formula increases due to an increase in the number of discount stores (which compete withsupermarkets for infant formula consumers), holding other factors constant, which in turn wouldinduce supermarkets to establish a lower supermarket retail price. In order to adjust for the scaleof population in a market area, the regression analysis uses the number of discount stores per100,000 people as its measure of the presence of discount stores.
An increase in the number of (equally sized) supermarkets lowers supermarket concentration,whether concentration is measured by the Herfindahl-Hirschman Index, the four-firm concentra-tion ratio, or any other measure of concentration. Typically, economic theory predicts a positiverelationship between concentration and price, reflecting some combination of market power influ-ences and tacit (or explicit) collusion. Indeed, the formal WIC model discussed so far in thisappendix predicts a positive price-concentration relationship due to its underlying Cournot modelstructure. However, formula (and, possibly, a select number of other supermarket products) mayexhibit a negative price-concentration relationship—contrary to the Cournot and WIC models—iftwo conditions are both met.
Suppose that the Cournot model is correct for most supermarket products—i.e., a typical super-market item has a positive price-concentration relationship. If so, then in a highly concentratedmarket area a typical item will have a high price-cost margin (relative to the margin in a less concen-trated area)—making a marginal customer especially valuable to the supermarket in the highlyconcentrated area. In addition, suppose that infant formula exhibits what may be called “attractor”characteristics that lead (at least some) customers to change shopping location in pursuit of a low-priced “attractor” item, draws them to the supermarket and results in joint purchases with other items.If both conditions are met, then supermarkets in a high-concentration area may establish a relativelylow supermarket price for infant formula as they seek to lure customers to purchase the high-margin
Economic Research Service/USDA WIC and the Retail Price of Infant Formula / FANRR-39 ● 85
8 It would be more difficult to predict the expected sign for the poverty rate if the relative size of WIC were not includedin the regression. In this case, the poverty rate could reflect two factors—the presence of WIC households (relative tonon-WIC households) and the presence of low-income non-WIC households (relative to high-income non-WIC house-holds)—that have price effects of opposite signs.
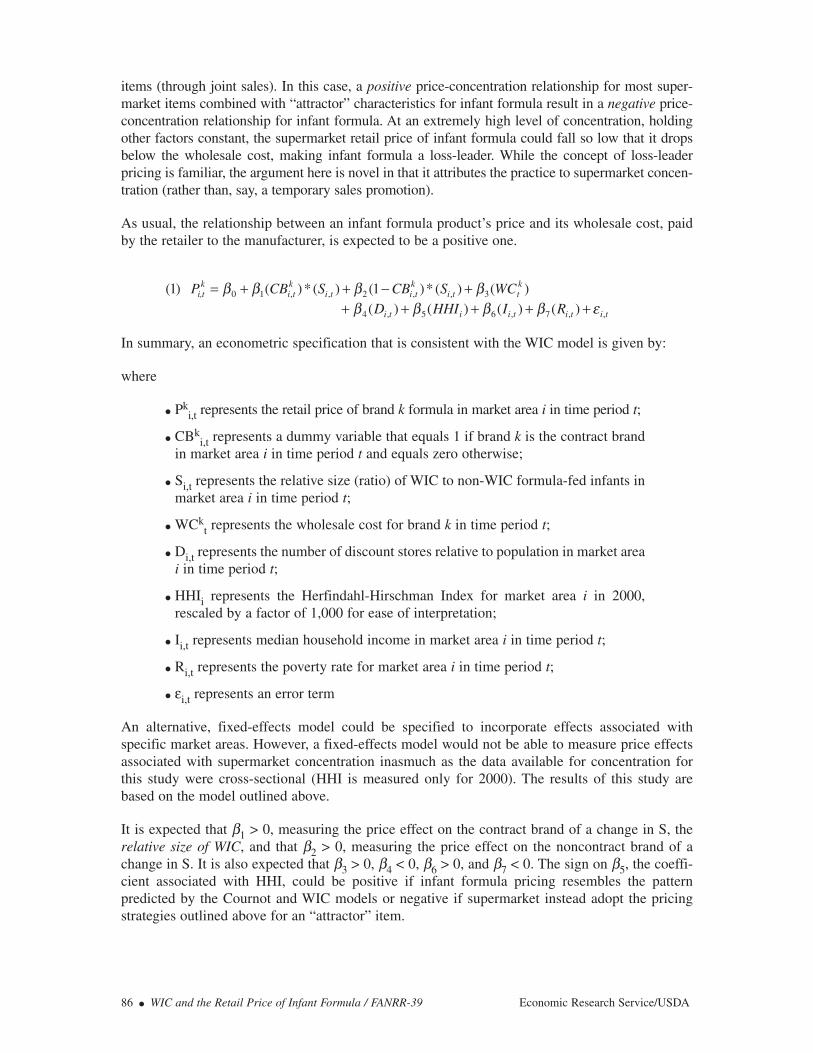
items (through joint sales). In this case, a positive price-concentration relationship for most super-market items combined with “attractor” characteristics for infant formula result in a negative price-concentration relationship for infant formula. At an extremely high level of concentration, holdingother factors constant, the supermarket retail price of infant formula could fall so low that it dropsbelow the wholesale cost, making infant formula a loss-leader. While the concept of loss-leaderpricing is familiar, the argument here is novel in that it attributes the practice to supermarket concen-tration (rather than, say, a temporary sales promotion).
As usual, the relationship between an infant formula product’s price and its wholesale cost, paidby the retailer to the manufacturer, is expected to be a positive one.
In summary, an econometric specification that is consistent with the WIC model is given by:
where
● Pki,t represents the retail price of brand k formula in market area i in time period t;
● CBki,t represents a dummy variable that equals 1 if brand k is the contract brand
in market area i in time period t and equals zero otherwise;
● Si,t represents the relative size (ratio) of WIC to non-WIC formula-fed infants inmarket area i in time period t;
● WCkt represents the wholesale cost for brand k in time period t;
● Di,t represents the number of discount stores relative to population in market areai in time period t;
● HHIi represents the Herfindahl-Hirschman Index for market area i in 2000,rescaled by a factor of 1,000 for ease of interpretation;
● Ii,t represents median household income in market area i in time period t;
● Ri,t represents the poverty rate for market area i in time period t;
● εi,t represents an error term
An alternative, fixed-effects model could be specified to incorporate effects associated withspecific market areas. However, a fixed-effects model would not be able to measure price effectsassociated with supermarket concentration inasmuch as the data available for concentration forthis study were cross-sectional (HHI is measured only for 2000). The results of this study arebased on the model outlined above.
It is expected that β1 > 0, measuring the price effect on the contract brand of a change in S, therelative size of WIC, and that β2 > 0, measuring the price effect on the noncontract brand of achange in S. It is also expected that β3 > 0, β4 < 0, β6 > 0, and β7 < 0. The sign on β5, the coeffi-cient associated with HHI, could be positive if infant formula pricing resembles the patternpredicted by the Cournot and WIC models or negative if supermarket instead adopt the pricingstrategies outlined above for an “attractor” item.
86 ● WIC and the Retail Price of Infant Formula / FANRR-39 Economic Research Service/USDA
tititiiti
ktti
ktiti
kti
kti,
RIHHID
WCSCBSCB P
,,7,65,4
3,,2,,10
)()()()()()(*)1()(*)()1(
εββββββββ
++++++−++=

The full empirical specification augments the specification outlined in the previous section byincluding a pair of additional variables to reflect that the number of alternative infant formulaproducts that supermarkets carried varied in the sample by market area and period. The regressionsincluded two dummy variables, presence of Wyeth and presence of private label to capture thisvariation. For either brand, Wyeth or private label, the dummy variable equals 1 if that brand isavailable in a given market area in a given quarter in the same product base and product form asthe product modeled in the regression (e.g., if the regression’s independent variable is the price ofMead-Johnson milk-based liquid concentrate then presence of Wyeth equals 1 for that regressionif supermarkets carried Wyeth’s milk-based liquid concentrate infant formula product, and equals0 otherwise). Households may consider Wyeth brand formula or private label formula to be asubstitute for one or more of the brands (Mead-Johnson, Ross, Carnation) whose price-deter-mining factors are estimated by the regressions. If so, then the coefficient on the dummy variablefor the presence of the alternative brand would be negative.
Economic Research Service/USDA WIC and the Retail Price of Infant Formula / FANRR-39 ● 87
This appendix considers in detail the statistical results from regression models that examine theeconomic, demographic, and programmatic factors that affect the supermarket retail prices ofinfant formula. The quantity “unit” for which all price data are calculated is a 26-ounce reconsti-tuted equivalent.1
The sample means, minimum values, and maximum values of the variables used in the regressionsare presented in appendix tables D-1 and D-2 for milk-based and soy-based formula price regres-sions, respectively. Most of the price regressions contained a sample size of 1,261 observations.2
The dependent mean values are averages across market areas and periods of inflation-adjustedsupermarket retail prices, measured in cents. The variable relative size of WIC if contract brand islikewise an average across market areas and periods. The variable’s low values of 0.04 or 0.03 forCarnation reflects the fact that Carnation was the contract brand for relatively few observations,which means many zeroes are averaged into the value. In contrast, the values for Ross and Mead-Johnson are higher than for Carnation, and show that these brands were the contract brand in moremarket areas in more periods. The change in contract brand variable averaged 0.59 or 0.55,reflecting that a substantial number of market areas had one or two changes in the manufacturerthat held the contract brand, but that many market areas had no contract brand turnovers, bringingthe cross-market average below 1. The means of the presence of private label and presence ofWyeth variables show the proportions of observations for which these variables equal 1. Thesample average of discount stores is 2.54 stores (per 100,000), while the Herfindahl-HirschmanIndex averages 1990 as conventionally measured, or 1.99 as used in the scale-adjusted specifica-tion (designated supermarket concentration) in the regressions. Household income and povertyrate values average $37,030 and 12.8 percent across observations. The means of wholesale priceare, like the dependent variable, measured in (inflation-adjusted) cents.
The magnitudes and t-tests for the regression coefficients are reported in appendix tables D-3 andD-4 for regressions of milk-based formula prices and soy-based formula prices, respectively. Eachtable contains six regressions, distinguished by form (powdered vs. liquid concentrate) for each ofthe three major brands (Mead-Johnson, Ross, and Carnation) that were producing for the domesticmarket in September 2000, the close of this report’s 1994-2000 study period.3 To evaluate theeffect of contract brand status, the differences between certain pairs of coefficients are measuredand subjected to t-tests in appendix table D-5. In the following discussion, the 5 percent level ofconfidence is adopted for statistical significance.
The analysis that follows considers the magnitudes and interpretation of the numerical coefficientsfrom the price regressions, and identifies which of the above effects have strong statistical supportand which require greater qualification. Certain empirical results do depend somewhat on whetherprices are examined for milk-based formula or soy-based formula. Inasmuch as milk is the product
88 ● WIC and the Retail Price of Infant Formula / FANRR-39 Economic Research Service/USDA
Appendix D—Detailed Regression Results
1 For example, the 26-ounce equivalent corresponds to a single 13-ounce can of liquid concentrate formula with the dilu-tion ratio of 1 ounce of water for each ounce of concentrate.2 The reason for a smaller sample size for certain Carnation prices was that the not all Carnation soy-based productswere available in each of the market areas in all 27 quarters of the study period. 3 Statistical results for the Wyeth formula are not reported here. Wyeth is a formula manufacturer that no longer mar-kets its own formula, exiting from the domestic market early in the 1994-2000 study period (during 1996). Preliminaryanalysis using the foreshortened price series available for Wyeth formula suggested that estimated coefficients for Wyethwere not well-behaved, sometimes taking on unexpected signs that differed from the signs predicted by economic the-ory and the signs exhibited by other companies. It is not known to what extent the unusual results for Wyeth are attrib-utable to the short period for which Wyeth price information are available and how much to any other factors.
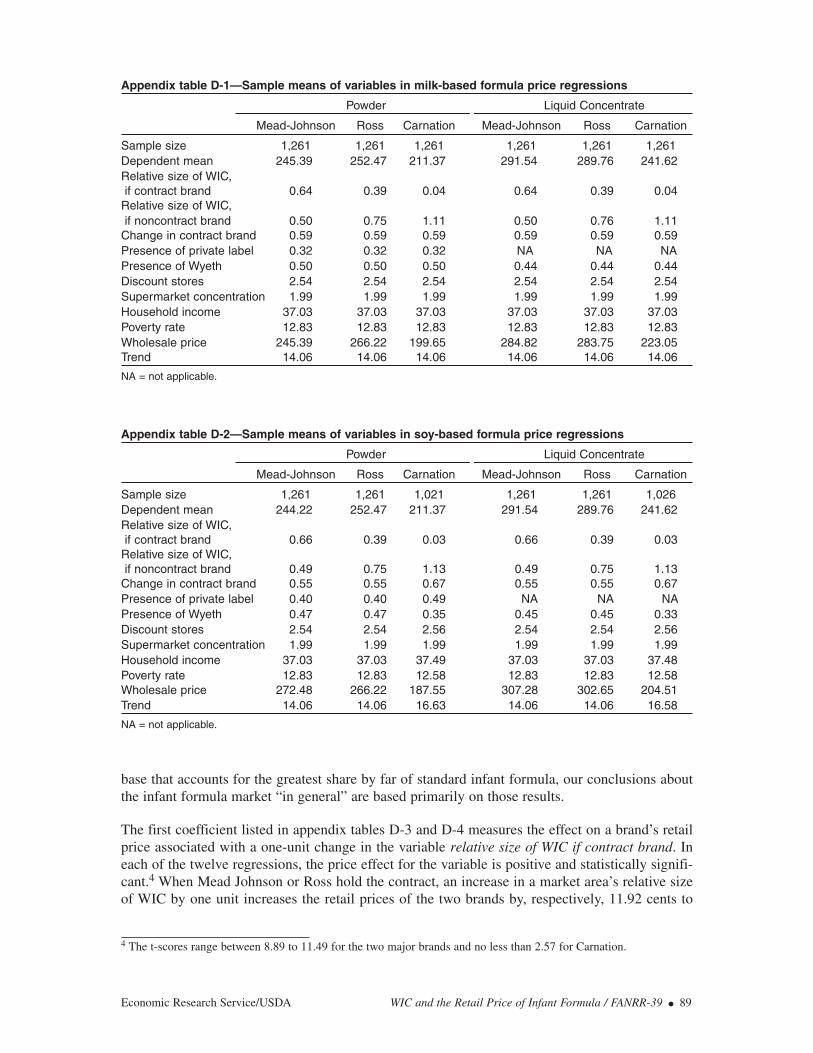
base that accounts for the greatest share by far of standard infant formula, our conclusions aboutthe infant formula market “in general” are based primarily on those results.
The first coefficient listed in appendix tables D-3 and D-4 measures the effect on a brand’s retailprice associated with a one-unit change in the variable relative size of WIC if contract brand. Ineach of the twelve regressions, the price effect for the variable is positive and statistically signifi-cant.4 When Mead Johnson or Ross hold the contract, an increase in a market area’s relative sizeof WIC by one unit increases the retail prices of the two brands by, respectively, 11.92 cents to
Economic Research Service/USDA WIC and the Retail Price of Infant Formula / FANRR-39 ● 89
Appendix table D-1—Sample means of variables in milk-based formula price regressions
Powder Liquid Concentrate
Mead-Johnson Ross Carnation Mead-Johnson Ross Carnation
Sample size 1,261 1,261 1,261 1,261 1,261 1,261Dependent mean 245.39 252.47 211.37 291.54 289.76 241.62Relative size of WIC,if contract brand 0.64 0.39 0.04 0.64 0.39 0.04
Relative size of WIC,if noncontract brand 0.50 0.75 1.11 0.50 0.76 1.11
Change in contract brand 0.59 0.59 0.59 0.59 0.59 0.59Presence of private label 0.32 0.32 0.32 NA NA NAPresence of Wyeth 0.50 0.50 0.50 0.44 0.44 0.44Discount stores 2.54 2.54 2.54 2.54 2.54 2.54Supermarket concentration 1.99 1.99 1.99 1.99 1.99 1.99Household income 37.03 37.03 37.03 37.03 37.03 37.03Poverty rate 12.83 12.83 12.83 12.83 12.83 12.83Wholesale price 245.39 266.22 199.65 284.82 283.75 223.05Trend 14.06 14.06 14.06 14.06 14.06 14.06
NA = not applicable.
Appendix table D-2—Sample means of variables in soy-based formula price regressions
Powder Liquid Concentrate
Mead-Johnson Ross Carnation Mead-Johnson Ross Carnation
Sample size 1,261 1,261 1,021 1,261 1,261 1,026Dependent mean 244.22 252.47 211.37 291.54 289.76 241.62Relative size of WIC,if contract brand 0.66 0.39 0.03 0.66 0.39 0.03
Relative size of WIC,if noncontract brand 0.49 0.75 1.13 0.49 0.75 1.13
Change in contract brand 0.55 0.55 0.67 0.55 0.55 0.67Presence of private label 0.40 0.40 0.49 NA NA NAPresence of Wyeth 0.47 0.47 0.35 0.45 0.45 0.33Discount stores 2.54 2.54 2.56 2.54 2.54 2.56Supermarket concentration 1.99 1.99 1.99 1.99 1.99 1.99Household income 37.03 37.03 37.49 37.03 37.03 37.48Poverty rate 12.83 12.83 12.58 12.83 12.83 12.58Wholesale price 272.48 266.22 187.55 307.28 302.65 204.51Trend 14.06 14.06 16.63 14.06 14.06 16.58
NA = not applicable.
4 The t-scores range between 8.89 to 11.49 for the two major brands and no less than 2.57 for Carnation.
14.07 cents (per 26-oz equivalent). 5 In contrast, the price effect for Carnation is relatively low forpowdered formula (at 8.19 cents) and relatively high for liquid concentrate (at 14.99 cents). Forthe soy-based formula of the two major brands, price effects range between 12.04 cents and 15.15cents, with relatively low price effects for Carnation for both product forms (equaling 4.85 or 5.79cents). The regression results strongly support the conclusion that, holding other factors constant,an increase in the relative size of WIC in a market area increases the retail price for that area’scontract brand of infant formula.
The second coefficient listed in appendix tables D-3 and D-4 measures the effect on a brand’s retailprice associated with a one-unit change in the variable relative size of WIC if noncontract brand.For 11 of the 12 regressions, the price effect on a noncontract brand’s retail price of an increase inthe relative size of WIC is positive. The sole exception to this pattern was Carnation soy-basedpowdered formula, and its negative sign is not statistically significant from zero. Of the 11 posi-tive coefficients, 10 are statistically significant (Carnation soy-based formula—this time the liquidconcentrate—is the exception). In the milk-based formula price regressions, the pattern of coeffi-cient matches the pattern already examined for the price effect of the variable relative size of WICif contract brand: the price effects are relatively larger for Mead Johnson and Ross (rangingbetween 8.71 cents and 11.04 cents) compared with Carnation (at 2.62 and 2.73 cents). For thesoy-based formula price regressions, the price effect is positive and statistically for the two majorbrands, although insignificant for Carnation. Given that Carnation’s statistically insignificant coef-ficients were found only for soy-based formula, the product base that is relatively small, and thatCarnation itself is a manufacturer that is relatively small, we conclude as a general result that anincrease in the relative size of WIC in a market area increases retail price for that area’s noncon-tract brands of infant formula.
In appendix table D-5, the two rows of figures and associated t-scores record the differencebetween the coefficients for the variables relative size of WIC if contract brand and relative size ofWIC if noncontract brand for each given manufacturer’s product (by base and form). For example,for milk-based powdered formula the price regression’s two coefficients are 11.92 cents and 10.04cents for Mead Johnson (shown in appendix table D-3) resulting in a 1.88-cent difference (shownin appendix table D-5). Thus, the figures in appendix table D-5 measure the “contract brandeffect”—the difference in a product’s retail price associated with the product’s manufacturerchanging its contract brand status between being a noncontract brand to being the contract brandin a market area. In the table, the contract brand effect is evaluated at a relative size of WIC of1.0.6 The contract brand effect is said to be a “positive” price effect if the product’s retail price ishigher when its manufacturer holds the WIC contract (holding other factors constant); the “posi-tive” effect is a mathematical term, not a normative one meaning “desirable.”
90 ● WIC and the Retail Price of Infant Formula / FANRR-39 Economic Research Service/USDA
5 Because the relative size of WIC is constructed as the ratio of (formula-fed) WIC infants to (formula-fed) non-WICinfants, a one-unit change in the variable corresponds, for example, to a change from a local condition of one WIC infantfor each non-WIC infant to a local condition of two WIC infants for each non-WIC infant.6 The figures and discussion in the body of this report differ slightly from the figures considered in this appendix. Thefigures in appendix table D-5 pertain to a relative size of WIC value of 1.0 because the coefficients in appendix table D-3 and D-4 are for one-unit changes in relative size of WIC. In contrast, in the body of the report the figures for the con-tract brand effect pertain to a relative size of WIC value of 1.14 because that value is the average in the sample of therelative size of WIC. The value of the contract brand effect for any given value of the relative size of WIC variable canbe found by multiplying the figures in appendix table D-5 by the chosen value of the relative size of WIC. In the quar-terly data, the relative size of WIC ranges from a low of 0.42 to a high of 4.2. Figure 9-1 in the text shows a range thatis less broad because its figures are means across all quarters, by State, which average out the high and low values ofthe quarterly data. In either case, the contract brand effect in a given market area and period can be smaller than or sev-eral times larger than the figures reported in appendix table D-5.

For all six milk-based formula price regressions, the differences in coefficients are positive, asexpected, and statistically significant in five of the six cases (the exception is Ross liquid concen-trate formula). The contract brand effect ranges from a low of 1.88 cents (for Mead-Johnsonpowdered formula) to a high of 12.37 cents (for Carnation liquid concentrate formula). For thesoy-based formula price regression the results are less conclusive: positive and statistically signif-icant price effects were found in just three of the six cases, and in one case (Mead Johnsonpowdered formula) the price effect was negative and statistically significant. Because milk-basedformula is a much larger part of the infant formula market than soy-based formula, our conclusionabout infant formula “in general” draws heavily from the milk-based results. We conclude that ina given market area, holding other factors constant, the retail price of a manufacturer’s producttends to be higher than it otherwise would be if the manufacturer is the WIC contract brand.
Economic Research Service/USDA WIC and the Retail Price of Infant Formula / FANRR-39 ● 91
Appendix table D-3—Regression coefficients and standard errors for supermarket infant formula prices: milk-based infant formula by product base and brand
Powder Liquid Concentrate
Mead-Johnson Ross Carnation Mead-Johnson Ross Carnation
Relative size of WIC, 11.92 14.07 8.19 13.45 13.91 14.99if contract brand 9.86 10.12 5.79 10.36 8.89 8.84
Relative size of WIC, 10.04 11.04 2.73 8.71 12.87 2.62if noncontract brand 6.47 10.24 4.43 5.21 10.68 3.55
Change in contract brand -0.97 2.37 0.05 2.98 5.61 -0.190.91 2.46 0.10 2.60 5.24 0.30
Presence of private label 1.56 -2.85 -2.75 NA NA NA1.06 2.16 3.71
Presence of Wyeth 0.32 2.53 0.77 0.74 2.47 -2.420.18 1.49 0.84 0.36 1.31 2.10
Discount stores -9.17 -7.70 -0.49 -9.29 -9.99 -0.2510.69 10.09 1.13 10.26 11.91 4.77
Supermarket concentration -4.75 -4.93 -0.66 -2.44 -5.03 0.348.29 9.65 2.26 3.97 8.82 0.96
Household income 0.11 0.09 0.18 0.76 0.62 0.620.63 0.56 2.08 4.15 3.60 5.93
Poverty rate -1.07 -0.90 -0.28 -0.47 -0.55 -0.334.60 4.32 2.35 1.87 2.37 2.30
Wholesale price 0.56 0.62 0.56 0.60 0.66 0.743.58 5.27 5.71 2.73 2.96 8.53
Trend 0.45 0.97 0.52 0.86 0.94 0.473.07 6.99 5.36 3.81 4.50 5.03
Intercept 129.28 105.70 88.60 99.83 90.65 54.353.31 3.57 4.64 1.65 1.49 2.80
Dependent mean 244.22 252.47 211.37 291.54 289.76 241.62
Adjusted R-squared 0.24 0.42 0.35 0.38 0.44 0.45
Notes: a. Dependent variable is supermarket retail price (average price within an InfoScan market area), measured incents. Coefficients measure the change in price, in cents, for a one-unit change in the variable.b. For each variable in each of the six regressions the upper figure is the variable's OLS coefficient and the lower figureis the coefficient's t-statistic (in absolute value). Bold figures are coefficients that are significantly different from zero atthe 5% confidence level. Italicized bold figures are coefficients that are significantly different from zero at the 10% levelbut not at the 5% level.NA = not applicable.

92 ● WIC and the Retail Price of Infant Formula / FANRR-39 Economic Research Service/USDA
Appendix table D-4—Regression coefficients and standard errors for supermarket infant formula prices: soy-based infant formula by product base and brand
Powder Liquid Concentrate
Mead-Johnson Ross Carnation Mead-Johnson Ross Carnation
Relative size of WIC, 13.75 12.87 4.85 15.15 12.04 5.79if contract brand 11.49 8.07 3.46 10.04 6.66 2.57
Relative size of WIC, 15.70 10.98 -0.29 15.09 14.01 0.49if noncontract brand 10.20 8.85 0.45 7.76 10.02 0.47
Change in contract brand -0.8 0.83 1.36 -2.67 0.16 1.350.79 0.78 3.06 2.08 0.14 1.88
Presence of private label -1.90 0.11 -2.44 NA NA NA1.18 0.07 3.49
Presence of Wyeth -1.20 -0.45 -0.36 3.71 2.67 -1.860.66 0.24 0.44 1.43 1.21 1.30
Discount stores -8.40 -6.56 -2.58 -12.38 -10.60 -0.1810.02 7.61 6.57 11.62 10.8 0.28
Supermarket concentration -3.08 -4.06 -1.15 -1.28 -4.36 -0.515.47 6.98 4.30 1.80 6.63 1.19
Household income 0.09 0.12 -0.12 0.85 0.80 -0.230.54 0.66 1.59 3.98 4.02 1.86
Poverty rate -1.54 -1.50 -0.23 -0.74 -0.95 -0.576.81 6.36 1.99 2.58 3.56 3.13
Wholesale price 0.47 0.73 0.77 0.63 0.6 0.612.75 4.03 8.57 3.15 3.19 3.72
Trend 0.84 0.24 -0.06 1.41 1.11 0.633.89 1.42 0.68 5.23 4.06 5.13
Intercept 161.01 95.35 75.92 94.13 111.32 109.893.57 2.00 4.71 1.60 2.05 3.32
Dependent mean 272.31 267.17 201.86 311.08 305.51 230.59
Adjusted R-squared 0.40 0.23 0.20 0.43 0.41 0.16
Notes: a. Dependent variable is supermarket retail price (average price within an IRI market area), measured in cents.Coefficients measure the change in price, in cents, for a one-unit change in the variable.b. For each variable in each of the six regressions the upper figure is the variable's OLS coefficient and the lower figureis the coefficient's t-statistic (in absolute value). Bold figures are coefficients that are significantly different from zero atthe 5% confidence level. Italicized bold figures are coefficients that are significantly different from zero at the 10% levelbut not at the 5% level.
NA = not applicable
Appendix table D-5—Estimated contract brand effect1
Powder Liquid Concentrate
Mead-Johnson Ross Carnation Mead-Johnson Ross Carnation
Milk-based formula 1.88 3.03 5.46 4.74 1.03 12.371.99 3.45 4.27 4.67 1.07 8.02
Soy-based formula -1.95 1.89 5.14 0.05 -1.97 5.302.16 1.95 4.11 0.05 1.78 2.62
1 Differences between coefficients of relative size of WIC if contract brand and relative size of WIC if noncontract brandby product base, product form, and brand.
Note: Bold figures are coefficients that are significantly different from zero at the 5% confidence level. Italicized bold fig-ures are coefficients that are significantly different from zero at the 10% level but not at the 5% level.

The variable change in contract brand measures, by quarters, the number of times the contractbrand had changed between any two manufacturers in a market area, capturing whether turnoverin the identity of the contract brand has effects on supermarket price for the product of each manu-facturer (whether or not it was a contract winner, contract loser, or not involved with the contractturnover). In the milk-based price regressions in appendix table D3, results for the variable showthat liquid concentrate formula prices exhibited a turnover effect that is positive and significant foreach of the two major brands, but powdered formula prices exhibited such an effect for only onemajor brand (Ross); for neither product base does Carnation exhibit any price effect associatedwith the number of contract brand changes. In the soy-based formula price regressions, in contrast,Carnation formula was the only formula exhibiting a positive, statistically significant effect, whileMead Johnson exhibited an effect that is significant but negative. We conclude that the price effectof the variable is not strongly conclusive, with a positive turnover effect identified in some but notall cases.
The variable presence of private label had negative and statistically significant coefficients in theRoss and Carnation price regressions for milk-based formula. The interpretation of this result isthat households consider private label formula to be a substitute for these brands, lowering theprices of these brands by about 2.85 cents and 2.75 cents, respectively. For the soy-based formulaprice regression, the coefficient is negative (at –2.44 cents) and statistically significant only forCarnation.
The variable presence of Wyeth has a negative and statistically significant effect in only oneinstance (Carnation milk-based liquid concentrate). Therefore, we conclude that the exit of Wyethfrom the domestic market did not have an effect on infant formula retail prices in general (for givenlevels of wholesale prices of the remaining manufacturers).7
For Mead Johnson and Ross infant formula, each additional discount store (per 100,000 popula-tion) in a market area lowers supermarket retail price by a statistically significant amount for allproduct bases and forms. The amounts of price decreases ranged between 7.70 and 9.99 cents formilk-based formula, and between 6.56 and 12.38 cents for soy-based formula. Carnation formulahad significant coefficients in two cases, equaling 2.58 cents and 0.25 cents, and in two other casesCarnation’s coefficient for discount stores was insignificant. Even with those two cases of statis-tical insignificance, we considered it reasonable to conclude for infant formula in general thatretail prices in the supermarket sector decrease in response to a greater presence of discount stores.
As explained in appendix C, if infant formula serves as an “attractor” item (of which a “lossleader” item is an extreme example), its price may be expected to decrease as supermarket concen-tration rises. For milk-based formula price regressions, the supermarket concentration variable hasa negative, statistically significant coefficient in five out of six cases. For the two major brands, anincrease in supermarket concentration as measured by a one-unit change in the variable (a 1000-unit change in the underlying Herfindahl-Hirschman Index) lowers retail price by as much as 4.75cents to 4.93 cents. Carnation’s coefficient for powdered formula was statistically significant, butmuch lower in magnitude (in absolute value) at just –0.66; Carnation’s coefficient for liquidconcentrated formula was statistically insignificant. For soy-based infant formula, a negative andstatistically significant price effect was found in four out of six cases. We conclude for infantformula in general that supermarket concentration lowers—rather than increases—supermarketretail prices. We interpret this result as one that is consistent with the joint conditions that marketpower raises price for other supermarket items and infant formula serves as an “attractor” item.
Economic Research Service/USDA WIC and the Retail Price of Infant Formula / FANRR-39 ● 93
7 If the exit of Wyeth resulted in an increase in the wholesale prices of other manufacturers, retail prices of other brandswould be expected to increase.
In four of the six milk-based formula price regressions, the coefficient on household income waspositive and significant. Three of those four coefficients are found in the three regressions forliquid concentrate. The coefficients’ magnitudes ranged from 0.62 to 0.76. For the Ross and Carna-tion liquid concentrate regressions, the coefficient of 0.62 means that an increase in a market area’smedian household income by $10,000 results in a supermarket retail price increase of 6.2 cents.In the soy-based formula price regression, the household income coefficient was positive andsignificant only for the two major manufacturers’ liquid concentrate formula, as is the case fortheir milk-based price regression counterparts. In contrast, Carnation’s two household incomecoefficients for its soy-based formula were each negative, although statistically insignificant. Weconclude that, for the two major brands, there seems to be a qualitative difference between the twomajor forms of infant formula: household income affects supermarket prices for liquid concentrateformula but not for powdered formula.
The variable poverty rate is included in the regression as a rough proxy for the overall shape ofthe income distribution within a market area. In the six milk-based regressions, the sign is nega-tive and statistically significant in five out of six cases. The magnitudes of the coefficient weresmallest (in absolute value) for Carnation products (at -0.28 and –0.33), and ranged up to –1.07for Mead Johnson powdered formula. Thus, an increase in a market area’s poverty rate by onepercentage point is associated with a reduction in the supermarket retail price of Mead Johnsonpowdered formula by 1 cent. In the soy-based formula price regressions, all six coefficients werenegative and statistically significant, and again Carnation had the two lowest coefficients. Weconclude that supermarket infant formula prices in general respond negatively to a market area’spoverty rate.
The coefficients on the variable wholesale price are all positive and statistically significant,ranging between 0.56 and 0.74 in the six milk-based formula price regressions and 0.47 and 0.77in the soy-based formula price regressions. The interpretation of these results is that an increase inthe price paid by supermarkets to a brand’s manufacturer results in an increase in that brand’ssupermarket retail price, but by less than the increase in the wholesale price. For example, thecoefficient of 0.56 for Mead-Johnson powdered formula means that a 10-cent increase in Mead-Johnson’s wholesale price results in an increase of 5.6 cents in that product’s retail price.8
The variable trend captures any changes in a brand’s retail price, on average over time, that is notstatistically accounted for by other independent variables in the model (which already includeswholesale price and accounts for inflation in the general price level). The coefficients on trend areall positive and statistically significant for milk-based formula prices, ranging from 0.5 cents to0.9 cents, and positive and statistically significant in four out of six cases for soy-based formulaprices. Because the trend coefficients measure price changes per quarter, these magnitudes on anannual basis are higher than the coefficients by a factor of four, ranging from 2.0 cents to 3.6 centsper annum.
Alternative regression specifications were examined to identify the robustness of the model,including introducing some variables (such as regional dummy variables, market area population,and an interaction variable between contract brand status and supermarket concentration), anddropping certain variables (such as change in contract brand and presence of Wyeth). Two typesof results are sensitive to regression specification. First, for various specifications of Ross milk-based liquid concentrate regressions, the coefficients on relative size of WIC if contract brand andrelative size of WIC if noncontract brand were always positive, but in some specifications the coef-
94 ● WIC and the Retail Price of Infant Formula / FANRR-39 Economic Research Service/USDA
8 As discussed in appendix C, the result that the coefficients are positive fractions is consistent with the specification oflinear infant formula demand curves adopted by the theoretical model on which the regression specifications are based.
ficient on relative size of WIC if contract brand is smaller than the coefficient on relative size ofWIC if noncontract brand, yielding a negative contract brand price effect—a result that did notmatch the results found for the five other milk-based formula products. Second, the introductionof regional dummy variables diminishes the role played by household income, probably becausethe values of household income across market areas are related to the geographical region in whichthe market area is located. The specification reported here provides clean, straightforward inter-pretations of coefficients and yields the same basic results as alternative specifications—notably,the coefficients for relative size of WIC if contract brand and relative size of WIC if noncontractbrand are positive and statistically significant under alternative specifications.
Economic Research Service/USDA WIC and the Retail Price of Infant Formula / FANRR-39 ● 95
This appendix explains the sources and procedures that were used to construct the data for theempirical analysis in appendix D.
The regressions used quarterly data from the first quarter of 1994 through the third quarter of2000. The InfoScan market areas that were selected for the sample were those for which 90percent or more of the population resided in States that belonged to a single WIC contract. In addi-tion, Mississippi was excluded from the regression sample because it does not use the retail distri-bution system.1
Dependent Variable
The regressions’ dependent variable is a market area’s inflation-adjusted supermarket retail pricefor the specific infant formula products produced by Mead-Johnson, Ross, and Nestle identified intable 6-1. For each manufacturer, the four products selected were distinguished by two productbases (milk-based and soy-based) and by two product forms (liquid concentrate and powder).Chapter 5, “Source of Infant Formula Data” describes the nature and limitations of the InfoScandata on supermarket retail prices for these products. The quarterly CPI-U was used to deflate thenominal supermarket price series.
Independent Variables
The variable relative size of WIC if contract brand is an interactive variable, constructed as theproduct of relative size of WIC and a dummy variable, contract brand status, for which contractbrand status equals 1 if the manufacturer’s brand is the contract brand for the observation andcontract brand status equals 0 if it is a noncontract brand.
The variable relative size of WIC if noncontract brand is an interactive variable, constructed as theproduct of relative size of WIC and a dummy variable, noncontract brand status, for whichnoncontract brand status equals 1 if the manufacturer’s brand is a noncontract brand for the obser-vation and noncontract brand status equals 0 if it is the contract brand.
Information from USDA’s Food and Nutrition Service (FNS) identified which manufacturer was aState’s WIC contract brand in each quarter. If the manufacturer of the contract brand changed afterthe middle of a quarter, the change was treated as taking place at the start of the following quarter.
The variable relative size of WIC in a State was computed as the number of formula-fed WIC infantsrelative to the number of formula-fed non-WIC infants in the State. The number of formula-fed WIC(non-WIC) infants was calculated as the product of the number of WIC (non-WIC) infants in theState and the State’s WIC (non-WIC) formula-feeding rate. A State’s relative size of WIC value wasused to proxy the relative size of WIC value in all market areas within the State.
The number of WIC infants, by State, was obtained from USDA’s Food and Nutrition Service(FNS). The annual number of live births, by State, was available from the U.S. Department of
96 ● WIC and the Retail Price of Infant Formula / FANRR-39 Economic Research Service/USDA
1 Furthermore, certain quarterly observations were dropped for market areas in the sample if either there was more thanone contract brand (Open Market System) in effect during a quarter (Phoenix; seven quarters of 1994:1-1995:3) or, inone instance, if there was no contract brand for a quarter (Atlanta; 1994:4).
Appendix E—Data Sources and Construction of Variables

Health and Human Services’ Centers for Disease Control and Prevention (CDC). Quarterly datafor each series were obtained by interpolation of annual data. The difference between live birthsand WIC infants represents the number of non-WIC infants. Formula-feeding rates were obtainedfrom breastfeeding rates using the relationship that a breastfeeding rate and its correspondingformula-feeding rate sum to 1.0. Annual data for the breastfeeding rates of women, by State, wereobtained from a breastfeeding survey conducted by Ross Laboratories (Ross Labs Mothers’Survey, various years). Separate data were available for breastfeeding rates for a State’s WICmothers (households) and for a State’s non-WIC mothers (households). Annual data were interpo-lated on a quarterly basis.
The quarterly variable number of contract brand changes equals the number of contract brandchanges that have occurred in the market area since the inception of the study period (for theproduct base and product form of each separate price regression). The variable is market-areaspecific rather than manufacturer-specific: its value is shared within a given market area for allmanufacturers. Its values begin at zero in the first quarter of 1994 for each market area, and forsome market areas it reaches a value of 2 by the end of the sample period in which case thecontract brand changed twice among the manufacturers in the market area.
For each regression—for an infant formula product distinguished by manufacturer, product base,and product form—a quarterly dummy variable was constructed to represent the presence ofWyeth products in a market area. The variable presence of Wyeth equaled 1 for a given observa-tion if Wyeth marketed an infant formula product of the relevant product base and product form inthe given market area in the given quarter. Although Wyeth phased out production of its infantformulas for the U.S. market in 1996, the quarter in which it ceased marketing in any one marketarea differed across market areas.
A similar approach was used to construct the dummy variable presence of private label. PBMbegan marketing powdered infant formula in 1997, although the quarter in which it beganmarketing in any one market area differed across market areas and as of the third quarter of 2000it was not marketing in every market area in the sample.
Annual data on a market area’s number of discount stores and population were obtained fromMetro Market Studies; together these data were used to calculate the number of discount stores per100,000 population, a variable that is labeled discount stores in appendix D.2 The discount storesthat were counted include such retailers as Wal-Mart, K-Mart, and Target who carry infantformula; chains such as T.J. Maxx whose product line does not included infant formula were notcounted. Quarterly data were obtained by interpolation.
The variable supermarket concentration is the standard Herfindahl-Hirschman Index used tomeasure concentration within a market area among its supermarket chains. The more closely amarket area resembles one that is served by a single, monopoly supermarket chain, the greater isthe value of the market area’s supermarket concentration. Each market area had a single super-market concentration value (based on 2000 data) that was used to represent the entire study period.Market share information was gathered from MarketScope2000.3
Economic Research Service/USDA WIC and the Retail Price of Infant Formula / FANRR-39 ● 97
2 The annual publication Discount Store Distribution Analysis and Guide is written and published by Metro MarketStudies of Tucson, AZ. 3 For each market area, if two or more chains with different names were owned by a single entity, the market shares forthose chains were aggregated. The Supermarket Concentration utilized all available share information, including inde-pendents.
The real (constant purchasing power) median household income in a market area was obtainedusing three series. A State’s nominal median income was treated as the nominal median income ofits market area(s). State nominal median income figures on an annual basis were obtained fromthe U.S. Department of Commerce’s Census Bureau; quarterly figures were obtained by interpo-lation. The nominal median income data were adjusted for both intertemporal and cross-sectionaldifferences in the purchasing power of a dollar. The data were adjusted for inflation using the quar-terly CPI-U. The data were adjusted for a local market area’s cost-of-living relative to the U.S.average cost-of-living using the American Chambers of Commerce Research Association(ACCRA) cost-of-living index.4
It is noted that the geographic boundaries of the InfoScan market areas, which are reflected in thedetermination of the independent variables of supermarket retail prices, do not coincide exactlywith the geographic boundaries used for determining the variables discount stores, supermarketconcentration, and household income.
The variable poverty rate represents the percentage of people in poverty, based on annual datafrom the U.S. Census Bureau (Department of Commerce). A State’s poverty rate was used toproxy for the poverty rate in all market areas within the State. Annual figures were interpolated ona quarterly basis.
For each of a manufacturer’s four infant formula products, the variable wholesale price wasobtained from wholesale price lists published by the manufacturer. Price changes that took effectafter the middle of a quarter were treated as taking place at the start of the following quarter. Aproduct’s inflation-adjusted wholesale price was obtained by deflating the nominal price series bythe CPI-U.
A simple linear time trend was created, which changes by one unit each quarter.
98 ● WIC and the Retail Price of Infant Formula / FANRR-39 Economic Research Service/USDA
4 For most market areas, the 1995 value of the ACCRA index was used, although for a few market areas, the value ofthe index was taken from a different period under the assumption that the market area’s cost of living relative to the U.S.average was steady over time.