Embed Size (px)
Citation preview
Page 1, November 2017 Eastex - Jensen Area
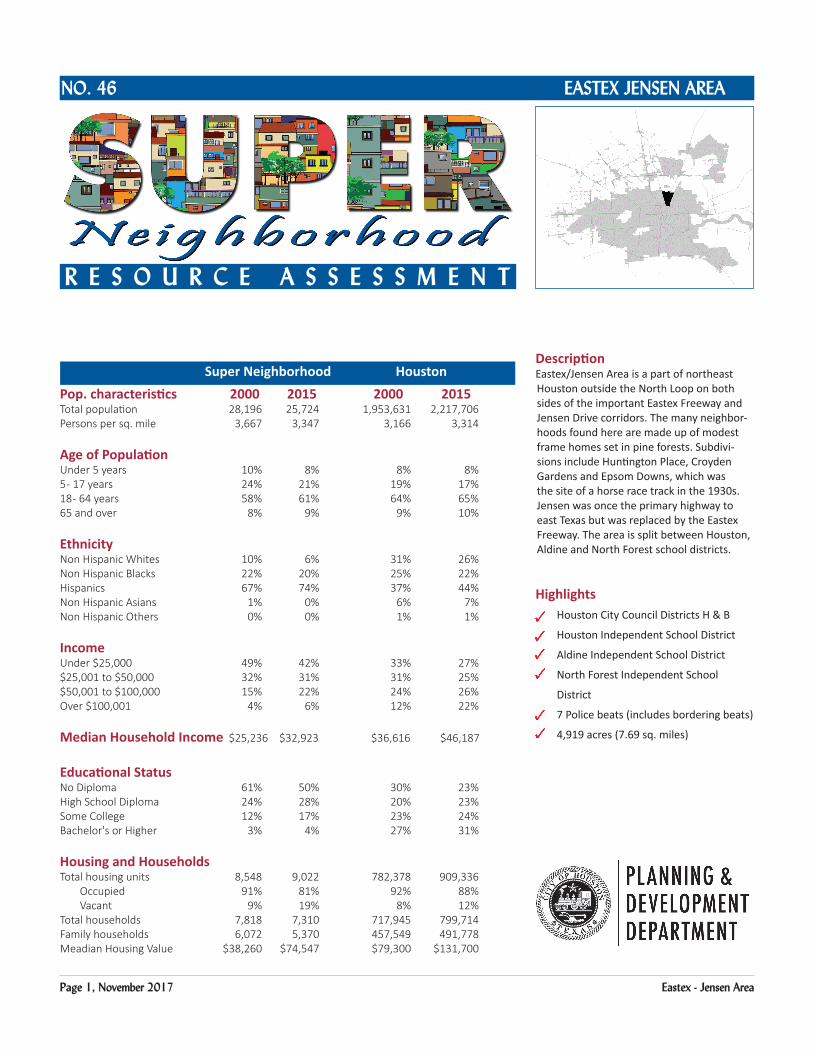
DescriptionEastex/Jensen Area is a part of northeast Houston outside the North Loop on both sides of the important Eastex Freeway and Jensen Drive corridors. The many neighbor-hoods found here are made up of modest frame homes set in pine forests. Subdivi-sions include Huntington Place, Croyden Gardens and Epsom Downs, which was the site of a horse race track in the 1930s. Jensen was once the primary highway to east Texas but was replaced by the Eastex Freeway. The area is split between Houston, Aldine and North Forest school districts.
Highlights Houston City Council Districts H & B
Houston Independent School District
Aldine Independent School District
North Forest Independent School
District
7 Police beats (includes bordering beats)
4,919 acres (7.69 sq. miles)
Super Neighborhood HoustonPop. characteristics 2000 2015 2000 2015Total population 28,196 25,724 1,953,631 2,217,706 Persons per sq. mile 3,667 3,347 3,166 3,314
Age of PopulationUnder 5 years 10% 8% 8% 8%5 - 17 years 24% 21% 19% 17%18 - 64 years 58% 61% 64% 65%65 and over 8% 9% 9% 10%
EthnicityNon Hispanic Whites 10% 6% 31% 26%Non Hispanic Blacks 22% 20% 25% 22%Hispanics 67% 74% 37% 44%Non Hispanic Asians 1% 0% 6% 7%Non Hispanic Others 0% 0% 1% 1%
IncomeUnder $25,000 49% 42% 33% 27%$25,001 to $50,000 32% 31% 31% 25%$50,001 to $100,000 15% 22% 24% 26%Over $100,001 4% 6% 12% 22%
Median Household Income $25,236 $32,923 $36,616 $46,187
Educational StatusNo Diploma 61% 50% 30% 23%High School Diploma 24% 28% 20% 23%Some College 12% 17% 23% 24%Bachelor's or Higher 3% 4% 27% 31%
Housing and HouseholdsTotal housing units 8,548 9,022 782,378 909,336 Occupied 91% 81% 92% 88% Vacant 9% 19% 8% 12%Total households 7,818 7,310 717,945 799,714Family households 6,072 5,370 457,549 491,778Meadian Housing Value $38,260 $74,547 $79,300 $131,700
EASTEX JENSEN AREANo. 46
R E S o u R c E A S S E S S m E N T
Super Neighborhood Houston

Page 2, November 2017 Eastex - Jensen Area
Eastex - Jensen: Land Use
PARKER
HIRSCH
JENSEN
TIDWELL
HARDY
LITTLE YORK
FULT
ON
CROSSTIMBERSIRVIN
GTON
LOCKW
OO
D
BERRY
WEAVER
LANGLEY
ALDINE W
ESTFIELD
BENTLEY
BENNINGTON
LAURA KOPPE
ELYSIAN
KELLEY
HIRSCH
BERRY
HARDY
HARD
Y
HARDYBENNINGTON
LAURA KOPPE
US
59
IH 610
HARDY TOLL
IH 45
US 59
HARDY TOLL
IH 610
I 0 0.5 10.25Miles
Freeway
Rail Road
Super Neighborhood Boundary
Single-family Residential
Multi-family Residential
Commercial
Office
Industrial
Public and Institutional
Transportation and Utilities
Parks and Open Space
Undeveloped
Agricultural Production
Open Water
Unknown
Source: City of Houston GIS Database,
Date: November 15, 2017
Harris County Appraisal District
Page 3, November 2017 Eastex - Jensen Area
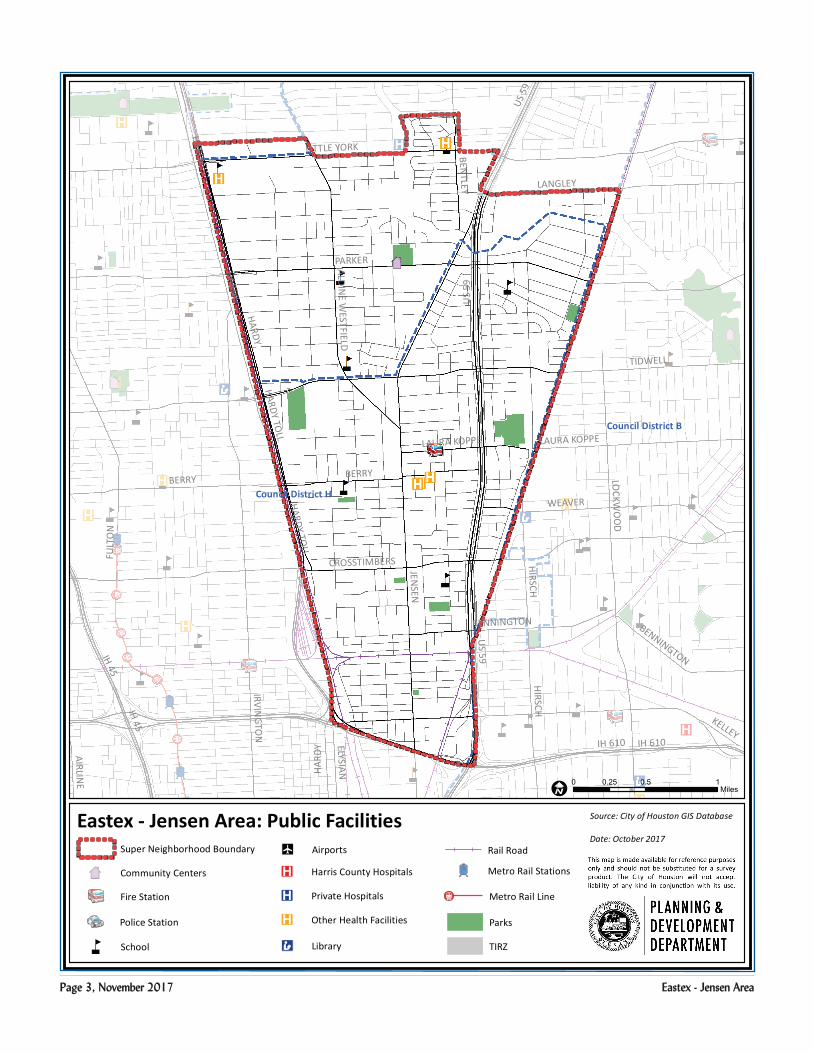
Eastex - Jensen Area: Public Facilities Source: City of Houston GIS Database
Date: October 2017
Council District H
Council District B
PARKER
HIRSCH
JENSEN
TIDWELL
HARDY
FULT
ON
LITTLE YORK
IRVINGTO
NCROSSTIMBERS
LOCKW
OO
D
BERRY
WEAVER
LANGLEY
ALDINE W
ESTFIELD
BENTLEY
BENNINGTON
LAURA KOPPE
ELYSIAN
AIRLINE
KELLEY
HIRSCH
BERRY
HARDY
HARDY
HARD
Y
BENNINGTON
LAURA KOPPE
US
59
IH 610
HARDY TOLL
IH 45
US 59
HARDY TOLL
IH 45
US 5
9
IH 610
Community Centers
Fire Station
ÆP Harris County Hospitals
ÆP Private Hospitals
ÆP Other Health Facilities
Æc Library
Metro Rail Stations
Police Station
Rail Road
å School
Parks
I0 0.5 10.25
Miles
Super Neighborhood Boundary
Metro Rail Line¬(Å
AirportsZ
TIRZ

Page 4, November 2017 Eastex - Jensen Area
Language Spoken at Home Employment Status
Housing Units by Year Built Housing Occupancy
89%
11%
Employed Unemployed
0%
11%
3%
7%
13%
20%22%
17%
5%
0%
5%
10%
15%
20%
25%
20100r Later
2000 to
2009
1990 to
1999
1980 to
1989
1970 to
1979
1960 to
1969
1950 to
1959
1940 to
1949
1939 or
earlier
31%
68%
0%0%
10%
20%
30%
40%
50%
60%
70%
80%
English Spanish Other
81%
19%
Occupied Vacant
Source: U.S. Census Bureau, 2000 American Community Survey, 2011-2015 Estimates