Embed Size (px)
Citation preview

© 2012 Melinda S. Jensen

PREDICTING NOTICING: INDIVIDUAL DIFFERENCES IN CHANGE BLINDNESS AND INATTENTIONAL BLINDNESS
BY
MELINDA S. JENSEN
THESIS Submitted in partial fulfillment of the requirements
for the degree of Master of Arts in Psychology in the Graduate College of the
University of Illinois at Urbana-Champaign, 2012
Urbana, Illinois
Adviser: Professor Daniel J. Simons
ABSTRACT
Change blindness and inattentional blindness share commonalities in their
phenomenology as failures to notice and in factors that prior research suggests are critical to
determining the detectability of visual anomalies. However, few studies explore whether
individual performance across these noticing tasks is consistent, whether there are “better
noticers” across different scenarios. Here, I compare performance on three noticing tasks:
incidental change detection, intentional change detection, and an inattentional blindness task.
Participants were reliably faster and more accurate than one another when intentionally searching
for change. Individuals who were better at intentionally searching for change were also more
likely to notice unexpected changes during a short video clip. They were also somewhat more
likely to notice an unexpected object while focusing on an unrelated primary task. Participants
also completed a basic attention and personality measures. While attention ability predicts both
intentional and incidental change detection, it does not predict inattentional blindness.
Personality did not show a clear pattern of relationships with noticing visual anomalies.
ii

ACKNOWLEDGMENTS
Thanks to Daniel J. Simons and the Visual Cognition Lab for helpful thoughts and
comments throughout the project and to my readers for dedicated some of their valuable time to
this paper. I would also like to thank Nathan Bowers, Yusra Al-Shawif, and Caitlin Kienzler for
their help with subject management and data collection. Finally, I would like to thank my family
and friends for their encouragement and emotional support throughout this process.
iii
TABLE OF CONTENTS
CHAPTER 1: INTRODUCTION………………………………………………………... 1 1.1 Are there Better Noticers? …………..……………………………………….. 1 1.2 Consistency in Noticing: Attention & Cognitive Ability…………………….. 6 1.3 Consistency in Noticing: Personality…………………..…………………….. 12 1.4 Current Study……………………………………………………………….... 12
CHAPTER 2: METHODOLOGY…………..………………………………………….. 14 2.1 Participants…………………………..……………………………………….. 14 2.2 Materials & Procedure.…………..…………..………………………………. 14 CHAPTER 3: RESULTS……………………………………………………………….… 19
3.1 Better Noticers? Consistency in Noticing Visual Anomalies……………….... 20 3.2 Predicting Noticing using Cognitive and Personality Predictors…………….. 25 3.3 Predicting Noticing – Revisited…………………………………………..…... 29
CHAPTER 4: DISCUSSION ……………………………………………………………. 32 CHAPTER 5: CONCLUSION …………………………………………………………. 36 TABLES & FIGURES …………………………………………………………………... 40 REFERENCES …..………………………………………………………………………. 45 APPENDIX…..…..………………………………………………………………………. 52
iv
CHAPTER 1 INTRODUCTION
In change detection experiments, observers can fail to notice one person change into
another across a film cut (Levin & Simons, 1997), or a conversation partner change into another
person when a door briefly occludes him (Simons & Levin, 1998). In some inattentional
blindness studies, some observers counting videoed basketball passes will not notice a person in
gorilla suit walking through the players (Simons & Chabris, 1999), or a woman screeching her
nails down a blackboard behind the players (Wayand, Levin, & Varakin, 2005). Observers
talking on cell phones have failed to see a unicycling clown (Hyman, Boss, Wise & Caggiano,
2009), and observers chasing after a runner have failed to notice a staged assault (Chabris,
Weinberger, Fontaine, & Simons, 2011). In all of these experiments, some individuals fail to
notice information that is obvious to others; they are blind to some of the perceivable
information we expect them to notice in the world. Are those “blind” individuals likely to be the
same person across different scenarios?
1.1 Are there Better Noticers?
We all have intuitions about how people interact with the world. Some people seem
gifted with a critical eye, noticing visual inconsistencies whether we intend them to or not.
Others seem oblivious, as unlikely to notice you have cut your hair as to realize there's a gorilla
lurking in the room. Although we may have intuitions about noticing visual anomalies,
experimental research reminds us that our intuitions about our cognitive perceptions can be
wrong (Simons & Chabris, 2011). From experimental data, we know we are wrong in our
expectations about noticing visual anomalies; We tend to overestimate the detail we will notice
and remember in the world around us (Levin & Angelone, 2008; Levin, Momen, Drivdahl &
1
Simons 2000). We may also be wrong when we assume people are consistent enough in their
interactions with the visual world that noticing in a single instance could be predictable despite
all of the noise and variability inherent in the world and in human behavior. Despite the intuitive
appeal of a "noticing ability", few studies explore whether noticing across different scenarios is
consistent.
If some individuals are better at noticing visual anomalies than others, there should be
stability in how quickly and accurately they can detect unexpected information. Measuring
reliability in noticing requires repeated observations of the behavior. However, repeatedly
presenting unusual visual events may alter how observers approach a situation. Once subjects
know that visual anomalies are probable, they may direct perceptual, attentional, and cognitive
resources towards monitoring for such inconsistencies. Therefore, noticing unexpected changes
or objects might be fundamentally different than the more intentional search for changes that is
typical of many laboratory experiments. To avoid changing observer expectation across trials,
experiments designed to test noticing of unexpected changes or visual events tend to have a
single critical trial. As a result, there is little available evidence for (or against) better noticers
despite the wealth of research on topics like inattentional blindness and incidental change
detection.
Knowing to look for a visual anomaly improves your chance of seeing one. For example,
when a change occurs between two presentations of a scene, 91% of subjects notice the change
when they are prompted to search for changes, whereas only 38% of subjects notice the same
changes when they are not prompted to search for changes (Beck, Levin, Angelone, 2007).
Observers are also faster to find changes they have seen before (Becker & Rasmussen, 2008;
Takahashi & Watanabe, 2008), changes that are naturally more probable (Beck et al., 2004;
2
Beck, Peterson, & Angelone, 2007), and changes that they learn are more probable after repeated
exposures (Beck, Angelone, & Levin, 2004; Beck, Angelone, Levin, Peterson, & Varakin, 2008).
The importance of expectation in noticing visual anomalies is explicit in the phenomenology of
change blindness. An observer knows to search for changes in intentional change detection
scenarios, whereas the changes are unexpected in incidental change detection scenarios (Simons
2000, Simons & Mitroff, 2001).
In inattentional blindness paradigms, the role of expectation is both explicit in the
phenomenology and central to theoretical explanations for the blindness. In these studies,
observers attending to a primary task are presented with an unexpected object and then are asked
to report what they noticed. The first presentation of unexpected information is called an
inattentional blindness trial because the observer is focusing attention on the primary task
leaving unexpected information outside the focus of attention. Additional exposures to
unexpected information are called divided attention trials because subjects are assumed to
allocate some resources toward monitoring for additional unexpected objects after they have
been asked about the first (Mack & Rock, 1998). Repeated exposure to unexpected objects
improves detection rates (Mack & Rock, 1998) and prior experience with a particular
inattentional blindness scenario improves detection of the previously experienced unexpected
object (Simons, 2010; Beanland & Pammer, 2010).
If expectation makes visual anomalies more detectable, then some regularity in noticing
should be predicted by prior experience. And, indeed, observers who have reason to expect their
prior exposure to inattentional blindness might be relevant to their current task are more likely to
detect similar unexpected objects (Beanland & Pammer, 2010). However, more experienced
noticers do not seem to become better noticers in general. For example, observers who report
3
previous experience with a video of basketball passes and unexpected gorillas are less likely to
miss the gorilla when viewing a similar video. But, those observers are no more likely to notice
other unexpected events, like the absence of a player, in that same video (Simons, 2010).
Similarly, although observers are faster to find previously located changes, they are not faster to
find new changes in the same scenes (Beckman & Rasmussen, 2008). Experience with previous
unexpected information helps us notice similar information in a similar context in the future, but
its benefits may be limited or context-dependent. In the search for better noticers, then,
experience, familiarity, and expectation may act as noise by predicting performance for a
specific scenario but not across all contexts.
Much of what we currently know about what makes visual anomalies more or less
noticeable is similarly context-dependent. Prior research emphasizes the influence of factors
specific to the task (e.g., the observers’ attentional set or the task’s attentional demands) in
determining the likelihood that an unexpected object will be noticed (see Jensen, Yao, Street, &
Simons, 2011 for a review). If specifics of the scenario have a strong influence on noticing, then
there may be little variance in noticing that can be explained by an individual’s consistencies
across tasks. There are also consistencies of an individual that may predict noticing in a specific
situation but that may not apply across scenarios. For example, observers' interests, expertise,
previous experience, knowledge, and learned attentional routines will vary depending on
situation and stimuli.
If noticing visual anomalies is primarily determined by factors specific to the situation,
then it might not be possible to predict an individual’s likelihood of noticing an unexpected event
in the complex environment of the real world. From test theory, we expect error in the
measurement of a single data point relative to some underlying true ability of noticing. There is
4
also an infinity of other reasons to expect variation on a single trial that is not predictive of
overall performance. Traditionally, this variation is treated as noise and is averaged away across
trials (we hope). However, in incidental change detection or in inattentional blindness tasks, we
are limited to only a single observation of noticing. Noticing in that single trial might just be too
variable to be predicted by more stable differences between individuals.
Although there is little evidence for stability in noticing unexpected visual anomalies,
many studies of intentional change detection often involve multiple trials. Although none of the
traditional change detection studies explicitly assess stability of individual subject performance,
regularity in intentional change detection performance in both accuracy and speed at identifying
changes is likely. At their most simple, visual short term working memory (VSTM) tasks tend to
be intentional one-shot change detection tasks (e.g. Luck & Vogel, 1997). Observers look at a
display and then a second display and report if there was a difference. Performance across these
one-shot change detection trials is then used as an index of individual variation on some kind of
visual memory dimension. Although VSTM tasks tend to include simple stimuli (e.g. colored
squares on a plain background) in contrast to real-world change detection tasks or those with
complex scenes, participants intentionally searching for change may still show consistency in
noticing visual irregularities across trials.
One of the primary goals of this study is to look for regularity in detecting visual
anomalies. Participants completed an intentional change detection task with multiple trials as
well as one incidental change detection task and an inattentional blindness task. I will look for
evidence of stability, for evidence of better noticers, across these noticing tasks.
5
1.2 Consistency in Noticing: Attention & Cognitive Ability
Both change blindness and inattentional blindness research traditions have converged on
attention as being central to noticing visual anomalies: The more likely an unexpected object or
change is to draw attention, the more likely it is to be noticed. The reverse seems to also be true:
Information that is unlikely to be attended is also less likely to be noticed. Both literatures
emphasize this selective nature of attention; some information is preferentially processed at a
cost to other information (Chun & Marois, 2002).
In a typical inattentional blindness task, subjects engage in a primary task (e.g., make
judgments about displays, track objects, count events) and then an unexpected, but obvious and
anomalous, object appears in the subject’s field of view. Depending on task conditions, a
proportion of subjects fail to notice this critical object or event, a target they easily see when
asked to look for it (Mack & Rock, 1998; Most et al, 2001; Most, Scholl, Clifford & Simons,
2005; Simons & Chabris, 1999). Inattentional blindness is explained as a demonstration of how
information beyond the focus of attention can be missed; either because attention is spatially
directed elsewhere, because attention resources are engaged in processing attended information,
or both (Most, 2010).
Attention is also central in change detection and change blindness. Although the attention
requirements of change detection tasks often vary, many researchers argue attention is necessary
if not sufficient to detect change (Rensink, O’Regan, & Clark, 1997, Rensink, 2002; Simons &
Rensink, 2005). According to the dominant change blindness theories, in order to notice a
change has occurred, you must attend to the original information, attend to the changed
information, and somehow notice a discrepancy (Simons & Ambinder, 2005). A failure to notice
6 6
a change could result from a failure in any one or more of these processing stages (e.g. difficulty
in encoding, storing, or comparing change-related information). However, in order to encode,
store, or compare information to successfully detect a change, the information first has to be
attended. For example, observers are less likely to detect changes to items they have never
fixated (Henderson & Hollingworth, 1999; Hollingworth, Schrock, & Henderson, 2001). For
both blindness paradigms, then, awareness of unexpected information is theorized to occur
because the relevant information was processed by the sensory system, selected by attention, and
bound into some kind of mental representation. If the visual anomaly related information is
never attended, it should never be noticed.
Manipulations that make the unexpected information more likely to be attended increase
detection rates. For example, because attention selects task-relevant items (Bichot &
Schall,1999; Folk, Remington & Johnston, 1992), items that share features with those task-
relevant items should also be more likely to be attended and, consequently, less likely to be
missed. In several different inattentional blindness paradigms, observers are more likely to
notice unexpected items that share features with primary task items, like location and color
(Koivisto, Hyona, & Revonsuo, 2004; Most et al 2001; Most, Scholl, Clifford, & Simons, 2005;
Mack & Rick, 1998; Most & Astur, 2007; Simons & Chabris, 1999). Similarly, people are more
likely to notice changes to information that is likely to be attended. For example, subjects are
faster to detect changes when attention is exogenously drawn to their location (Aginsky & Tarr,
2000; Hollingworth, 2003; Hollingworth, 2005; Scholl, 2000). And, changes to items that people
agree are more centrally 'interesting' are more likely to be detected, (Hollingworth & Henderson
2000; Rensink, O'Regan, Clark, 1997). Similarly, unexpected items that are of high semantic
importance (e.g. a smiley face or your own name) are also more detectable in inattentional
7
blindness scenarios (Chun & Marois, 2002; Downing, Bray, Rogers, & Child, 2004; Lee &
Telch, 2008; Mack & Rock, 1998). As are changes made to self-relevant information, like an
observer’s prior experience or expertise (Jones et al, 2003; Marchetti et al, 2006; Mayer et al,
2006; McGlynn et al 2008; Reingold et al, 2001; Tager-Flusberg et al, 2007; Werner & Theis,
2000).
The relationship between an item’s likelihood of being attended and the probability of
noticing visual anomalies related to that item suggests that noticing requires attention. Attention
is selective, boosting some information and inhibiting other information (Beck & Kastner, 2009).
Therefore, task manipulations that decrease the amount of attention observers have to focus on
visual anomalies should also decrease the likelihood that those anomalies will be noticed. For
instance, participants are less likely to report noticing unexpected information when a primary
task has heavier attention demands (Beanland & Pammer, 2010; Cartwright-Finch & Lavie,
2006; Fougnie & Marois, 2007; Macdonald, & Lavie, 2011; Simons & Jensen, 2009; Simons &
Chabris, 1999; Todd, Fougnie, & Marois, 2005). Similarly, when demands on observers’
attention are higher, they are also worse at detecting changes. For example, observers have more
difficulty detecting changes to scenes that flank a display under higher perceptual load than
lower perceptual load (Lavie, 2006). Noticing performance is also worse under dual-task
conditions like holding a cell-phone conversation while trying to detect changes to driving-
related images (McCarley et al, 2004; Fougnie & Marois, 2007; Strayer, Drews, & Johnson,
2003; Hyman et al., 2009).
If attention is necessary to detect change, then measures that capture meaningful variation
in attention may predict noticing. Although few studies examine whether individuals who notice
visual anomalies are likely to be the same person across different scenarios, some studies do
8
attempt to predict detection by measuring various aspects of attention, perceptual abilities, and
working memory capacity. For example, the functional field of view task (FFOV) requires
participants to localize a briefly presented target at different eccentricities and is argued to be an
indicator of the breadth of an individual’s attention. And, FFOV is correlated with intentional
change detection speed where subjects with a better FFOV are faster to find a change across
flickering scenes (Pringle, Irwn, Kramer & Atchley 2001). Change detection performance
during intentional tasks is also correlated with performance on visuospatial working memory,
attentional breadth, and perceptual processing speed in mixed-age samples (Pringle et al, 2004).
While measures of cognitive and perceptual ability may correlate with intentional change
detection, there are few studies examining how these measures covary with detection in
inattentional blindness and none with incidental change detection. Neither ability to track
multiple objects nor functional field of view predicts noticing of an unexpected object during a
multiple object tracking task (Memmert, Simons, & Grimes, 2009). Similarly, visuospatial
working memory does not correlate with inattentional blindness (Hannon & Richards, 2010).
When subjects are asked to track objects moving across a display, tracking performance on this
primary task does not predict inattentional blindness - neither when objects are presented at the
same speed for all subjects nor when objects are presented at a speed adjusted for individual’s
tracking ability (Simons & Jensen, 2009). One possibility is that measures of perceptual abilities
best predict primary task performance, while noticing of unexpected objects is a more
serendipitous confluence of chance.
A number of studies have examined how working memory capacity predicts noticing of
unexpected objects with mixed results. Participants with greater working memory capacity may
be more likely to have extra capacity for processing unexpected information while doing the
9
same task as participants with lower working memory. As a result, higher working memory
individuals may be more likely to have spare capacity available for noticing additional
information like unexpected objects. In one study looking for evidence of a relationship between
working memory capacity and inattentional blindness, observers who noticed an unexpected red
cross while tracking bouncing letters were more likely to have higher working memory capacity
than those who did not report seeing the cross (Richards, Hannon, & Derakshan 2010). In an
earlier study from the same group, inattentional blindness during the same task was also
correlated with OSPAN at r = .27 (Hannon & Richards, 2010). Similarly, among accurate
observers, participants who notice the gorilla while counting the basketball passes of players
dressed in black tend to have higher working memory scores (Seigmiller et. al 2011). However,
there is no correlation between noticing and working memory capacity in the full sample. Also,
in two large college-aged samples, there was no link between working memory and inattentional
blindness (Bredemeir & Simons, 2012).
The question of whether working memory capacity predicts noticing of unexpected
information remains open. The discrepancy between these findings may result from a number of
differences between the studies including population or task differences (see Bredemeir &
Simons, in press, for a discussion). However, the lack of a clear relationship between working
memory and inattentional blindness could result from a lack of consistency across noticing
scenarios. The way working memory capacity is directed may vary depending on task demands,
as well as by chance, or by other individual differences. In this case, working memory should
differentially predict noticing depending on how likely a stimulus is to enter focused attention
and on how working memory resources are being distributed (see Bredemeier & Simons, 2012
for relevant discussion). More generally, any measures of attention ability or capacity should
10
only predict noticing of visual anomalies insofar as focused attention is directed toward those
visual anomalies.
While selective attention is central to our understanding of both change blindness and
inattentional blindness, there are important distinctions between the paradigms. One critical
difference between inattentional blindness and change blindness is where the center of attention
is focused1. In inattentional blindness scenarios, attention is directed toward an observer’s
primary task or current goal. Researchers then measure whether subjects are able to notice
unexpected information that is outside of that central task. In other words, attention is directed
away (either spatially or cognitively) from the critical visual anomaly and toward the observer’s
task. In contrast, most change blindness scenarios involve observers who are directing their
cognitive resources toward change-relevant info, either through passive viewing or while
actively searching for the change. Individual difference measures that tap cognitive processes
involved in change blindness and inattentional blindness could predict noticing. However, these
individual difference measures of cognitive ability may only relate to noticing to the extent that
those abilities are directed toward the visual anomalies. In inattentional blindness scenarios or in
scenarios where attention and cognitive resources are directed away from the visual anomaly,
cognitive measures may be less useful as predictors of noticing.
1 There are additional differences between inattentional blindness and change blindness. For
example, change detection requires a comparison with previously encoded information to notice
a difference while the unexpected information in inattentional blindness studies is usually
identifiable as unique from a single exposure. Therefore, noticing tasks may also differ in the
quantity and quality of representations and processing required to notice the anomaly.
11
1.3 Consistency in Noticing: Personality
Another potential source of variation in detection ability is an individual's general cognitive
style in engaging the visual world. Although research on trait and state-related influences on
perceptual behavior is still in its infancy, a slowly accumulating body of work is beginning to
address how these more global differences between individuals may relate to perception. One
possibility is that cognitive abilities are directly related to personality. For example, social
psychologists argue that mood, amygdala activation, affect, and emotion are central to visual
attention (Weierich & Barrett 2010; Todd & Anderson, 2010). Alternatively, personality
dimensions like extraversion/introversion may represent differences in the levels of arousal an
individual requires to maintain focused attention (Szymura & Necka, 1998) Personality factors
may also reflect different levels of effort or motivation a subject is willing to put into task. Or,
there may be differences in the allocation of attention related to personality that result in
different interests, different reporting biases, or even different available resources. There is also
evidence of cultural differences in attention (see Duffy & Kitayama, 2010 for a review).
Cultural tendencies toward more focused attention or more dispersed attention strategies could
result in different patterns of noticing for various types of visual anomalies (Masuda & Nisbett,
2001).
1.4 Current Study
If detection of visual anomalies is yoked to an individual's attention direction,
expectations, and experiences, then there is room for substantial variation between people across
instances of blindness. Here I explore how intentional change detection, incidental change
detection, and inattentional blindness during a single testing session are related to one another.
12

While incidental and intentional change detection scenarios share the memory and comparison
demands for successful noticing, incidental change detection and inattentional blindness
scenarios share the unexpected nature of the anomaly. I also include a measure of perceptual
ability through the functional field of view task and a series of personality questions to use as
predictors of noticing in the various detection tasks.
13

CHAPTER 2 METHODOLOGY
2.1 Participants
A total of 139 (66 female, 73 male) undergraduate students from the University of Illinois
volunteered to participate in this study in exchange for course credit as part of the psychology
subject pool. Participants were pre-screened through the subject pool for reported color vision
and normal or corrected-to-normal vision.
2.2 Materials & Procedure
All tasks were presented using custom software written in Matlab using the psychtoolbox
(Brainard, 1997; Pelli, 1997) on a Macintosh eMac computer with a 17-in. CRT monitor (1,024
X 768) with a refresh rate of 85 Hz. Subjects viewed the screen from a distance of 57 cm through
open goggles that were attached to a black cloth viewing-hood that both obscured the screen
from other viewers and controlled the viewing distance. A viewing distance of 57 cm is
assumed for all visual angle calculations.
Subjects were self-paced and completed each task in the order listed below in groups of
1-8 on their own computers in 45 minute sessions. Unless otherwise noted, all tasks and
instructions appeared in black text against a light grey background.
2.2.1 Incidental Change Detection Task
For the first task, participants were instructed, "You are about to see a short video clip.
Please watch it carefully. You will be asked questions about what you saw when it ends." Then,
they pressed a key to start a video that appeared in the center of the screen and subtended 320 X
240 pixels (10.2° X 7.6°).
14
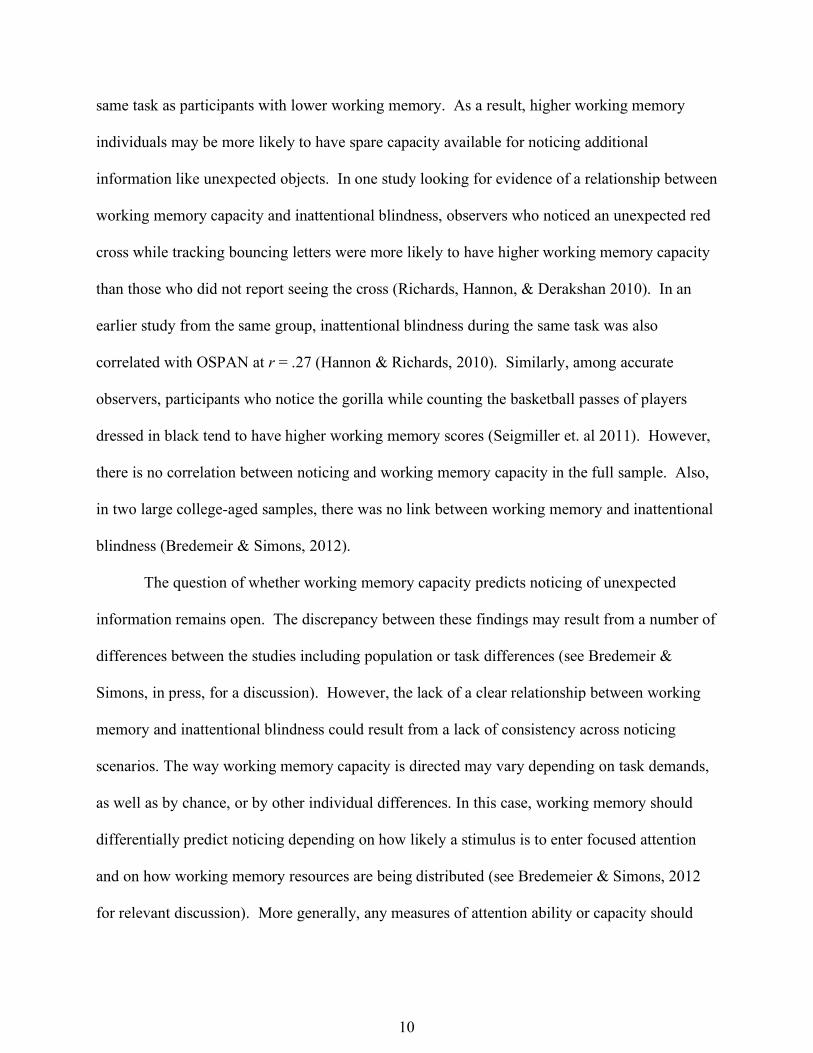
In this 8-second clip, a student picks up a book from a shelf and walks toward the viewer.
After 4.5 seconds, the student walks into the hallway. As he does, the camera view cuts down
the hall to face the student who continues to walk toward the viewer for the remainder of the
clip. Across the jump cut, there are several changes: The student's shirt changes in both color
(from tan to blue) and from being unbuttoned to being buttoned. In addition, the book switches
position from the left to the right hand.
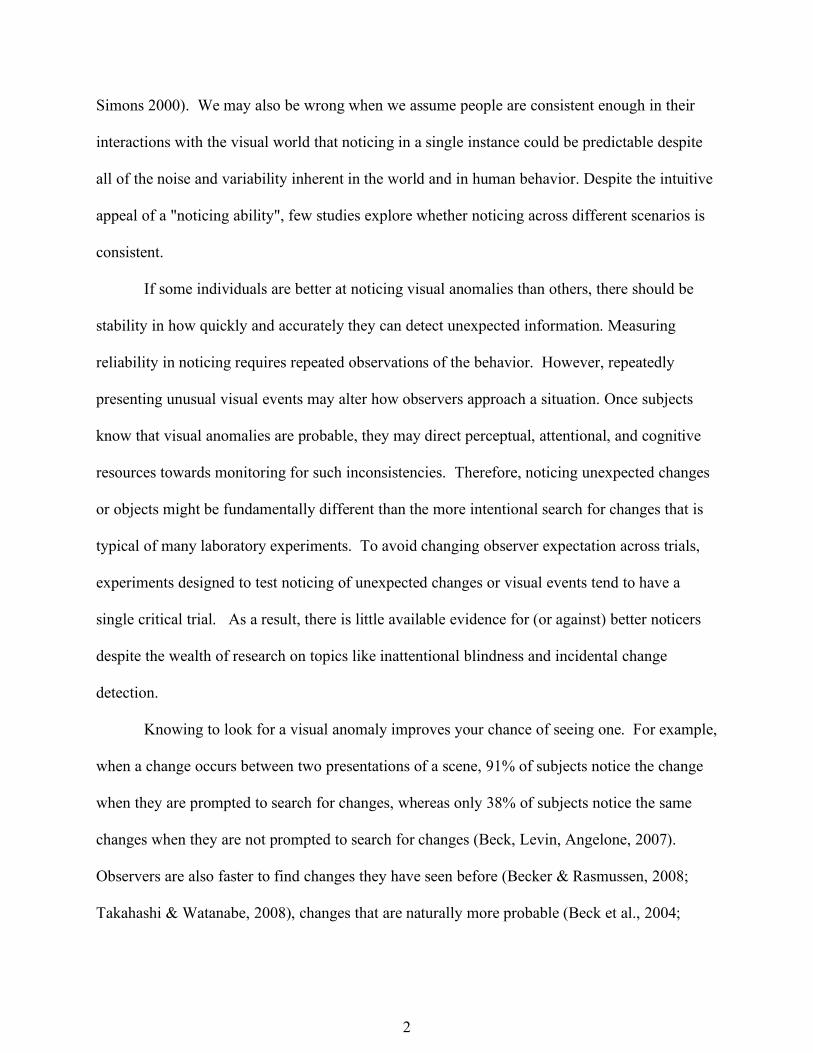
After the video ended subjects were prompted, "Did you notice anything that changed
during that video clip?" and asked to make yes/no response. Subjects then saw the final clip
from the film (see Figure 1a) and were asked to click on any changes they noticed. Subjects'
click responses were recorded.
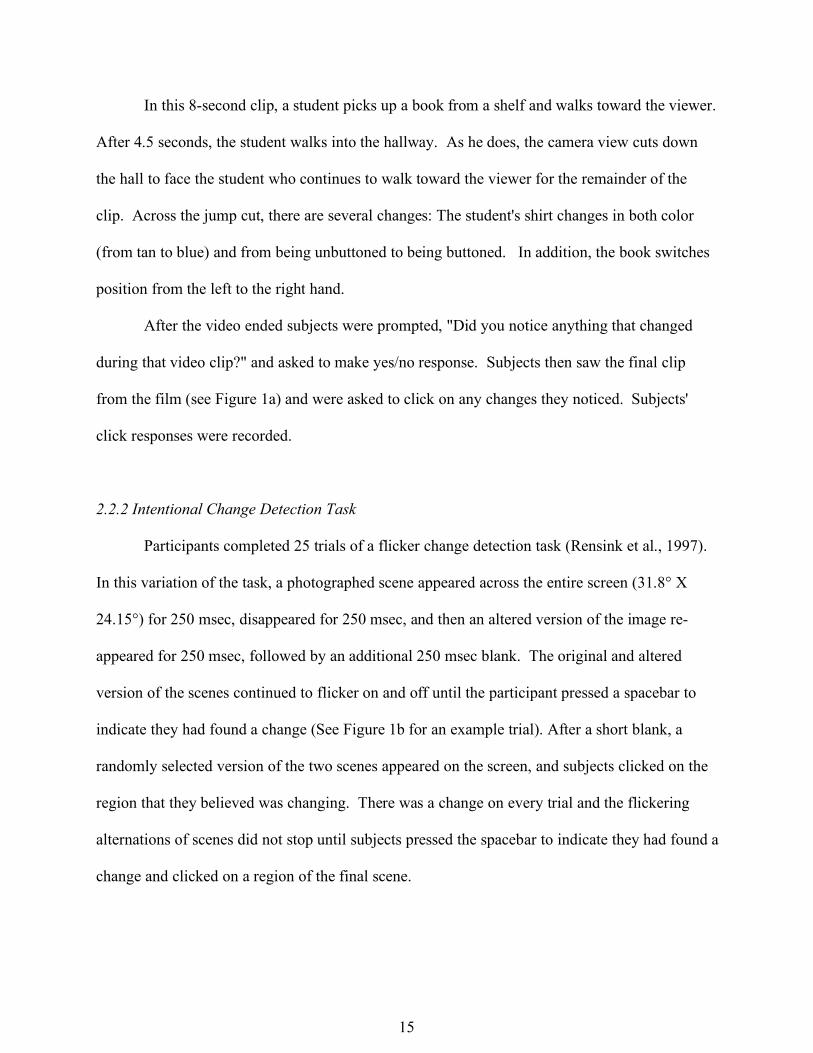
2.2.2 Intentional Change Detection Task
Participants completed 25 trials of a flicker change detection task (Rensink et al., 1997).
In this variation of the task, a photographed scene appeared across the entire screen (31.8° X
24.15°) for 250 msec, disappeared for 250 msec, and then an altered version of the image re-
appeared for 250 msec, followed by an additional 250 msec blank. The original and altered
version of the scenes continued to flicker on and off until the participant pressed a spacebar to
indicate they had found a change (See Figure 1b for an example trial). After a short blank, a
randomly selected version of the two scenes appeared on the screen, and subjects clicked on the
region that they believed was changing. There was a change on every trial and the flickering
alternations of scenes did not stop until subjects pressed the spacebar to indicate they had found a
change and clicked on a region of the final scene.
15
The 25 scene pairs were selected from a normed VisCogLab dataset and contained a
variety of indoor and outdoor scenes from the Champaign-Urbana campus and surrounding area.
Each original and altered photographic scene was identical except for one location where an
object (e.g., a trashcan, a tree, a sidewalk, a car, a silo, a person, a sign) was either removed or
added to the scene depending on the randomly selected order of presentation in the trial. During
the creation of the stimuli, the object was removed from the original image and replaced with
scene congruent background texture through image editing (See Figure 1b for an example scene).
Images and their changes were selected from the database to have minimal conceptual overlap
(Visual Cognition Lab, unpublished data). The changes varied in their size as a proportion of the
image (M = 2.1%, SD = 2.1%, Range = .2% to 7%). Data from a previous norming study using
these image pairs during a trial-limited flicker task suggests the scene changes represented a
range of different search difficulties as defined by overall accuracy at finding the change (M =
.9, SD = .07, Range = .65 to 1) and the average number of alterations needed to find the change
before the trial time-out (M = 19.8, SD = 10.3, Range = 6 to 48).
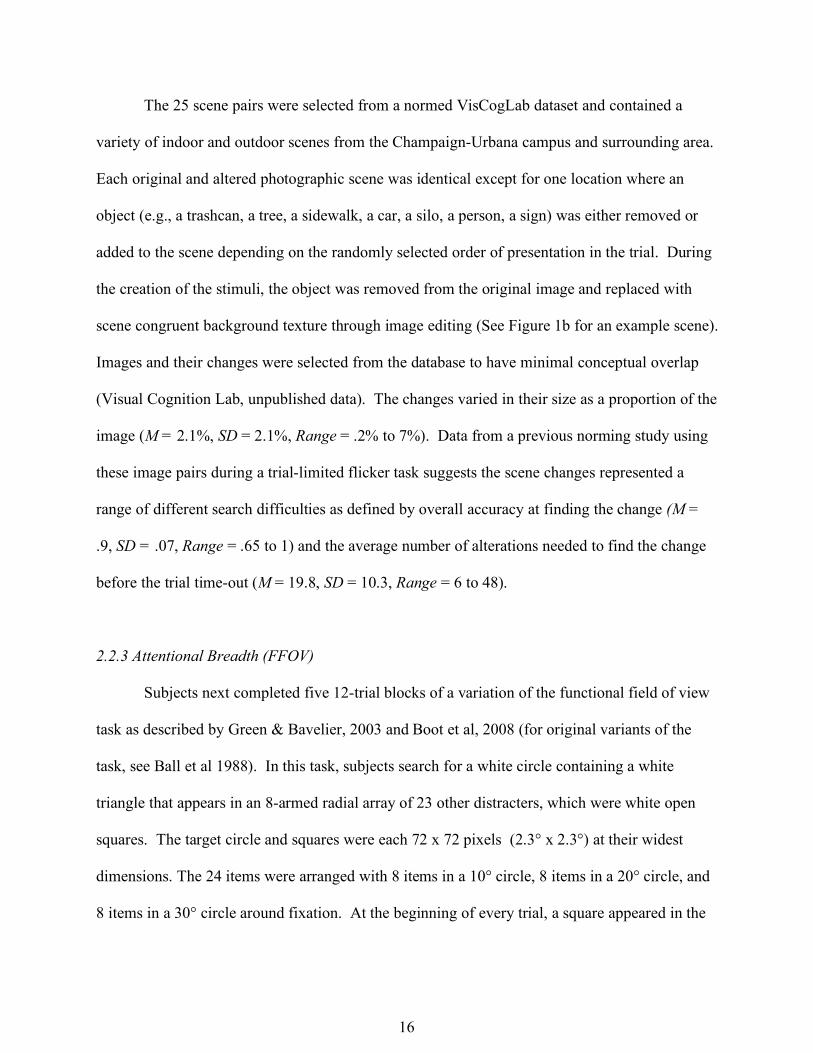
2.2.3 Attentional Breadth (FFOV)
Subjects next completed five 12-trial blocks of a variation of the functional field of view
task as described by Green & Bavelier, 2003 and Boot et al, 2008 (for original variants of the
task, see Ball et al 1988). In this task, subjects search for a white circle containing a white
triangle that appears in an 8-armed radial array of 23 other distracters, which were white open
squares. The target circle and squares were each 72 x 72 pixels (2.3° x 2.3°) at their widest
dimensions. The 24 items were arranged with 8 items in a 10° circle, 8 items in a 20° circle, and
8 items in a 30° circle around fixation. At the beginning of every trial, a square appeared in the
16

middle of the screen to show subjects where to focus their eyes and remained throughout the
trial. Then, the array of shapes appeared for a brief duration depending on block followed by a
100 msec mask of scrambled and overlaid black and white shapes. Finally, a response screen
with lines representing the arms of the radial array appeared and subjects indicated which arm
contained the target. See Figure 1c for an example trial.
During the first three blocks of practice trials the target array appeared for 75, 50, and
then 25 msec. In the final two test blocks the array appeared for 6 msec for a target at 10 degrees
of eccentricity or 12 msec for targets at 20 or 30 degrees.
2.2.4 Inattentional Blindness Task
After a break screen, subjects began an inattentional blindness task as described by Rock,
Linnett, Grant, & Mack (1992). See Figure 1d for an example trial. The instructions and stimuli
for this task were presented in the center of a 12.9° diameter circular aperture (a white circular
window in the center of a black screen) that appeared for the duration of the task. Participants'
primary task was to make a judgment about a cross by comparing the length of the two briefly
presented perpendicular lines of the cross. The lines were always one of four possible lengths
but were never the same length. The lines could be 80 pixels (2.6°), 97 pixels (3.1°), 115 pixels
(3.7°), or 132 pixels (4.2°) long. Subjects saw the two overlapping lines for 200 msec followed
for 500 msec by a high-contrast pixelated mask that was 148 pixels square (4.7° x 4.7°). Then,
when prompted by text, subjects identified whether the longer line was horizontal (h-key press)
or vertical (v-key press).
On some trials, an additional unexpected shape (approximately .6° X .6°) appeared within
2.1° of the cross’ center during the line judgment display. The unexpected shape was randomly
17

selected to be a rectangle, triangle, or cross that was red, blue, or black. After making the line
length judgment on trials with additional objects, observers were asked to report whether they
"notice[d] anything else presented at the same time as the cross?" They responded and then
identified features of the unexpected object. Subjects first selected the object’s color out of a list
of 7 possible colors, the object’s location as one of four quadrants around the cross, and the
object’s identity out of six shape foils.
Subjects completed a total of 8 line judgment trials, three with critical objects. The first
unexpected object appeared on the 4th trial and will be treated as an inattentional blindness trial.
The second object appeared on trial 7, a divided attention trial. On the eighth and final trial,
subjects were asked to ignore the line-judgment task and just look at the display, a full attention
trial.
2.2.5 Personality Questionnaires
Finally, participants responded to a number of self-paced personality questions on a 5-
point scale (1 = strongly disagree and 5 = strongly agree). Subjects first completed the Big Five
Inventory with established subscales of agreeableness, conscientiousness, extraversion,
neuroticism, and openness (John, Donahue, & Kentle 1991; John, Naumann, & Soto, 2008).
Then, questions from the following four scales were randomly interspersed: Need for Closure
(Kruglasnkie, Webster, & Klem, 1993), Need for Cognition (Cacioppo & Petty, 1982), the top 16
questions of the Horizontal & Vertical Individualism & Collectivism II with four dimensions
(Supportive (HC), Independent (HI), Dutiful (VC), Competitive(VI) (Triandis & Gelfand, 1998),
and the Barratt Impulsiveness Scale (Patton, Stanford & Barratt, 1995).
18
CHAPTER 3 RESULTS
Data from one participant were removed before any analyses because of a computer
recording error across several tasks. Data from the remaining 138 participants were compiled for
all subjects. A subset of participants (N = 12) was more than 2 standard deviations below the
mean in accuracy on the flicker change detection task (for those 12 subjects, M = 3.3% correct,
Range: 0-20%, SD = 6.3%). Abysmal accuracy on the flicker task suggests these subjects were
not trying to do the search task. Across the literature, accuracy on the flicker task tends to be
above 80% as subjects have multiple alternations to find the change. The typical dependent
measure in the flicker task is the number of alterations or the time to correctly find a change.
Inaccurate trials are excluded from analyses. Because of low accuracy on the flicker task, these
12 subjects were excluded from all of the analyses because they did not complete enough
accurate trials to provide a reliable estimate of their change detection speed2. After removing
2 These subjects' performance on other tasks was also somewhat poor. For instance,
while 9 out of 12 subjects said they noticed a change in the video clip, none of them were able to
correctly identify any of the changes. Accuracy at judging line lengths and correctly locating the
FFOV target was poor relative to the rest of the sample (on average, -.6 and -.65 standard
deviations below the rest of the sample mean, respectively). Response times for personality
questions and clicking on the flicker task were fast (on average, -.44 and -1.3 standard deviations
faster than the rest of the sample mean). Altogether, these subjects' performance suggests they
may not have been fully engaging in all tasks throughout the experiment. While understanding
individual differences in these participants could be informative, I am not confident that we have
reliable or representative estimates of their behavior across our measures.
19

these 12 subjects’ data, accuracy on the flicker task for the remaining 126 participants ranged
from 40% to 100%. If we apply a more stringent cutoff criterion of 80% accuracy on the flicker
task, an additional 17 subjects are dropped from the dataset. The resulting pattern of
relationships with the 80% and above accuracy group is similar to the pattern with the full 126
participant dataset. I discuss the full 126 participant dataset in detail in the results. Data tables
with the restricted 80% sample are also provided for reference. Inconsistencies between the two
datasets are discussed in context.
There are three additional missing data points in this set, two subjects are missing a
subset of personality responses because they ran out of time in the 45 minute session, and one
subject did not complete the attentional breadth task. In the following section, I summarize the
results of the 126 subjects across each task. The correlations between change detection
performance in the flicker task and the other main tasks are provided in Table 1. (For a full table
of the correlations between different outcome measures see Appendix.)
3.1 Better Noticers? Consistency in Noticing Visual Anomalies
To assess whether there is consistency in an individual’s likelihood of noticing visual
anomalies, I will first examine performance on the intentional change detection task. The
intentional change detection task is the only noticing task with the multiple trials necessary for
an analysis of consistency in search performance for visual anomalies. Then, I will discuss the
single trials of the incidental change detection and inattentional blindness tasks and examine
whether participants who are better noticers in the intentional change detection task are also
more likely to notice unexpected changes or items.
20
3.1.1 Intentional change detection
Across the scene flicker trials, there was variability in individuals’ average time to
correctly detect a change (M = 15.01 sec, SD = 20.96 sec, Range = 6.11 to 59.04) as well as in
accuracy (M = 90.3%, SD = 11.9%). Participant accuracy across trials had good internal
consistency as estimated by Cronbach's alpha (α =.80).
Being a better change detector in the flicker task typically means being faster to find the
changes. The average time to correctly find a change varied by image (M = 16.55, SD = 8.42)
and the range in average time to find a change for each image pair across all observers was large
(5.6 to 37.28 sec), reflecting a variety of difficulties in change detection trials. Individual
response times on correct trials were standardized in relation to the average solution time for
each image pair. The resulting standardized RT provides a measure of a person’s detection
speed in relation to other participants on a given change trial. Response times across trials had
moderate internal consistency (α =.65). Calculating alpha requires an observation for all test
items and individuals, so I included response time for all images regardless of accuracy.
However, time to accurately detect a change may be qualitatively different than the time subjects
take to terminate a search with an incorrect response.
31 subjects correctly identified all of the changes. The remaining 95 subjects varied in
how many alternations of the scenes they viewed before selecting an incorrect location (N = 95,
M = 71.7 alternations, SD = 69.5, Range = 1 to 380). The number of alternations an observer
searches before terminating the trial with an incorrect response may be predicted by cognitive or
personality factors. However, this variable is noisy, is represented by unequal observations for
each subject, is not directly related to our central question, and will not be considered further in
these analyses as is typical of the literature. All participants had some trials that took them
21

substantially longer than their average speed. Observer’s maximum search time to find a single
change before ending the trial could be several minutes (M = 76 sec, SD = 53 sec, Range = 20 to
390 sec). This variability in time to find changes is a likely contributor to some observer’s poor
accuracy in the flicker task.
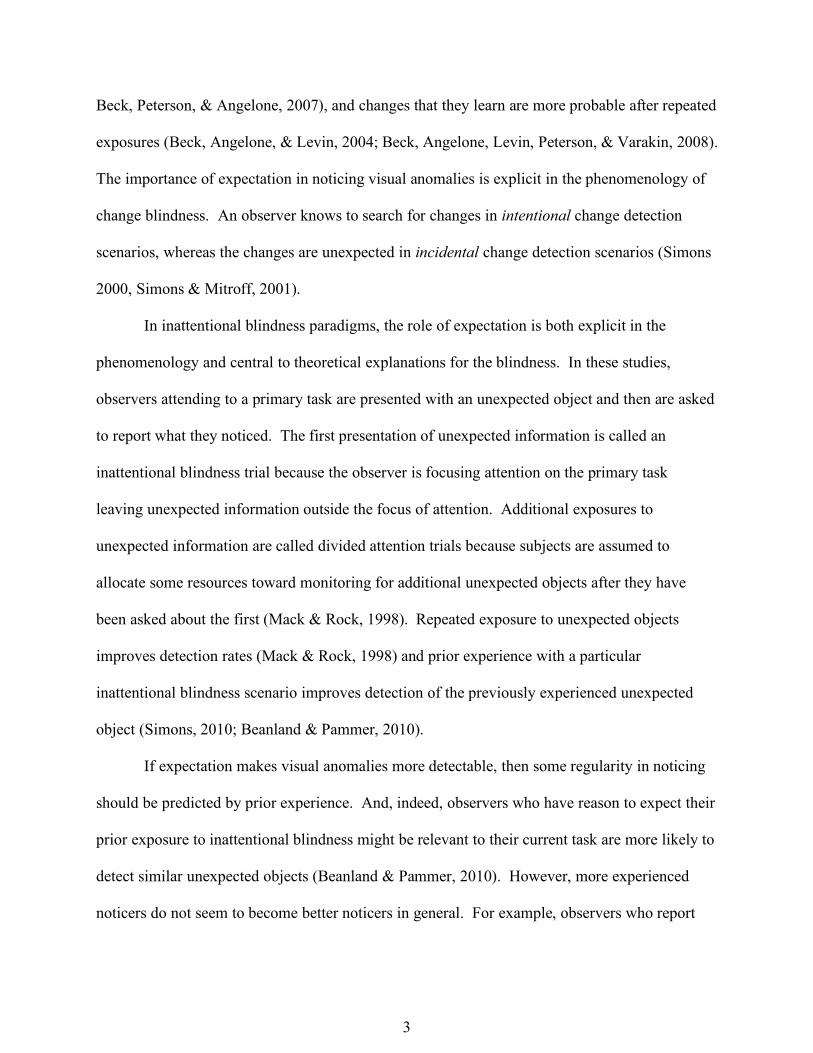
The standardized response times for accurate trails were averaged across an individual to
give an estimate of how slow or fast a participant was in relation to others on average (M = 0.0,
SD = .32, Range = -.58 to 1.33). See Figure 2 for simplified boxplots of the standardized
response times for each individual. The plots are ordered by accuracy on the change detection
task and then by average detection speed in the experiment.
In this flicker task, subjects varied in how quickly they found changes and in their
accuracy at localizing the change. To examine whether observers are better or worse than one
another overall, I created a single measure of change detection performance by combining
overall accuracy and response time on correct trials into a composite score. I subtracted the
average standardized response time from the standardized accuracy, resulting in scores where
high values reflect fast and accurate change detectors, low values reflect slow and inaccurate
detectors, and the remaining participants score in the middle. Combining scores together into a
composite was arbitrary choice for ease of interpretation. Average response time and accuracy
are both correlated to the composite (r(124) = -.7 and r(124) = .7, respectively). The pattern of
results with the composite better noticers measure is representative of the patterns with the
separate measures of accuracy and response time. See Appendix for the full correlation matrix.
Overall, there was substantial variation in performance on the intentional change
detection task. However, high estimates of internal consistency in accuracy and response time is
evidence of regularity in participant’s search for changes. Some individuals are faster than
22

others to find changes and some observers are reliably more likely to correctly identify the
change. Despite this consistency, performance on any individual change detection trial is
stochastic and it remains to be determined how well we can predict performance during a single
intentional search for change from overall performance.
3.1.2 Incidental change detection
During the incidental change video clip, 44.4% of subjects reported noticing a change (N
= 56/126). Of those subjects who reported noticing a change, 60.0% were able to correctly
identify one or more of the changes by clicking on the shirt or book in the test image (N =
33/56). Participants who did not click on the book or shirt overwhelming clicked on the hallway
or background information that changed as the central figure exited one room and entered the
hallway. When prompted, 20.0% of subjects who did not report noticing any changes also
clicked on the change locations in the final still of the video (14/70). Overall, then, 37.3% of
subjects correctly selected a change location (N = 47/126: 14 the book alone, 26 the shirt alone,
and 6 clicked on both). In other words, 26.2% of observers reported noticing the change and
correctly identified changed items (N = 33/126), whereas 11.1% of observers did not report
noticing the change but did click on a change location when prompted (N = 14/126).
3.1.3 Inattentional blindness.
Overall task means were consistent with Rock et al (1992). Subjects accurately selected
the longer line on most trials (M = 81.4% sec, SD = 16.6% sec). 71.4% of subjects reported
noticing an additional item on the first unexpected object trial (N = 90/126). 95.2% of subjects
reported noticing the object in the divided attention trial (N = 120/126), and 100% of subjects
23
saw the object in the full attention trial. When observers reported noticing the object during the
inattentional blindness trial, they overwhelmingly also selected the correct color (Color|Notice =
86.7%, N=78/90) and location (Location|Notice = 87.8%, N=79/90). Due to a programming
error, shape was not reliably recorded.
83.3 % of subjects who reported noticing the unexpected object accurately identified the
longer line during the line judgment task on that trial (N = 75/90), whereas 91.6% of those who
did not see the object correctly identified the longer line (N = 33/36), c2(1, N = 126) = 1.46, p =
.23. Many inattentional blindness studies report that noticers show a non-significant decrease in
primary task performance relative to non-noticers. The implication of this relationship is
unknown. Observers not attending to the primary task may be more likely to notice unexpected
information, or noticing unexpected information may distract observers from their primary task.
3.1.4 Consistency in Noticing
Subjects’ ability to search and find changes in scenes across a visual disruption is related
to whether subjects correctly identify unexpected inconsistencies across an angle cut in a short
film, both in the full sample, r(124) = .18, and in the restricted sample, r(107) = .21.
In the full dataset, better change detection performance is correlated with observer reports
of noticing the unexpected object during the critical trial of the line judgment task r(124) = .29.
When we restrict the sample to subjects who were more accurate at detecting changes, the
relationship between inattentional blindness and overall change detection weakens, r(107) = .08.
However, in the restricted sample, subjects who saw the unexpected object are still faster to find
changes but not more accurate, r(107) = -.23. Restricting the sample to 80% accuracy on the
change detection task removes a subset of participants who were particularly unlikely to notice
24
the unexpected object. Only 41.2% of the low accuracy subjects report noticing the unexpected
object on the first critical trial (7/17), in contrast to the overall sample mean of 71.4%. This
subset of participants was equally likely to see the critical object on the later divided attention
trial (94% vs 95%).
Noticing the unexpected object during the line judgment task does not show a strong
relationship with correctly identifying the unexpected changes that occurred in the video in both
the full sample, r(124) = .05 and in the restricted sample, r(107) = -.04.
3.2 Predicting Noticing using Cognitive and Personality Predictors
3.2.1 Attentional Breadth (FFOV)
Subjects varied in their ability to locate a briefly presented target at different
eccentricities in the functional field of view task. Across subjects, performance on practice trials
was better (M = 63.2% correct, SD = 26.2%) than on the final two test blocks with short array
exposures (M = 39.9% correct, SD = 25.3%, chance = 12.5%).
Although a subset of participants did not average above chance (N = 10/126), I did not
exclude participants based on performance on this task. The data were evenly spread across the
range of scores and, unlike in the intentional change detection task, there was no clear dividing
point between subjects with extremely low accuracy and the rest of the sample. Moreover, these
overall rates of accuracy are consistent with performance documented in other studies using this
task (e.g., Balavier & Green, 2003).3
3 Removing subjects with low accuracy on the functional field of view does not dramatically
change the overall trends. If anything, the correlations between performance on functional field
25
Participants who were better able to report the target's location in the FFOV task were
also faster and more accurate at intentionally detecting changes r(123) = .21. The magnitude of
this correlation is consistent with previous work even in this more homogenous sample, despite
the smaller variability in age in our sample.
FFOV is also related to noticing the unexpected change during the short video clip r(123)
= .18, where subjects who were better able to locate the target across different eccentricities were
also more likely to accurately identify the changes that occurred across an angle-cut. FFOV is
more strongly related to whether subjects are better able to click on a correct change location
r(123) = .26, than to reported noticing.
FFOV does not strongly relate to inattentional blindness both in the full sample, r(123) =
.10, and in the restricted sample, r(106) = .09.
3.2.2 Personality outcomes.
Subjects spent an average of 4.28 seconds responding to each of the 150 personality
questions (M = 4.28 sec, SD = 1.38 sec) with an average rating of 3.45 on a scale from 1-5 (SD
= .77).
Since the various items on the subscales are inter-related, we factored responses to the
individual questions into five general factors using principle component analysis with a varimax
rotation. The resulting factors roughly correspond to the big five personality dimensions. For
example, items from the neuroticism scale like "Gets nervous easily" and "Worries a lot" weigh
of view and the noticing tasks becomes slightly cleaner. In the following analyses, we report
correlations between accuracy on the test trials and various measures. However, including the
practice trials or using only practice trials does not qualitatively change the pattern of results.
26
most heavily on the first factor. Some items from the scales measuring need for closure and
impulsivity also weigh on this factor (e.g. "I tend to put off making important decisions until the
last possible moment." or "I have racing thoughts.") The second factor is most heavily
determined by items from the big five conscientiousness questions and a combination of items
from the impulsivity and need for closure scales, where a higher score indicates more impulsive
(e.g., "Tends to be disorganized", "I act on the spur of the moment.") and lower scores more
conscientious and steady (e.g. "I am self-controlled", "I save regularly."). The third factor is
most heavily determined by many of the need for cognition questions (e.g., "I like to have the
responsibility of handling a situation that requires a lot of thinking."), the big five openness
questions (e.g. "Likes to reflect, play with ideas"), and some impulsivity questions (e.g. "I do
things without thinking."). The big five extraversion questions primarily define the forth factor
("Is outgoing, sociable", "Is talkative") along with a few impulsivity questions like "I don't pay
attention". The final personality factor is most influenced by many of the agreeableness
questions from the big five questionnaire where more agreeable responses (e.g., "Is considerate
and kind to almost everyone", "Is helpful and unselfish with others ") are on the bottom of the
scale and more individualistic and competitive responses (e.g. "I often do my own thing",
"Winning is everything") are represented by higher values on this factor4
4 These factor scores were computed as an estimate to help analyze and present the data in a
coherent manner; I do not mean to suggest these values represent some true score on a cognitive
dimension. The resulting scores and pattern of relationships is similar to the pattern of data
using the twelve established personality subscales. For ease of interpretation, we complete the
following analyses with the simplified 5 factors.
27
Noticing unexpected changes during the short video did not relate to most personality
dimensions (see Appendix A for the full correlation matrix). The most dominant pattern of
relationships is with the conscientiousness factor. Subjects who were more impulsive and less
conscientious were more likely to report noticing a change after the video clip r(122) = .24.
However, that same personality factor did not correlate with subjects’ ability to accurately
identify the changed locations r(122) = .06. When we restrict the sample to individuals who
accurately identified flickering changes on at least 80% of the trials, the correlation with
conscientiousness no longer remains, instead subjects who are more conscientious tend to be
more likely to both report noticing the changes r(105) = -.15 and to identify them correctly
r(105) = -.19.
The personality variables do not show a consistent relationship to intentional change
detection performance (see Appendix for the full correlation matrix). In the full sample,
extraversion is correlated with accuracy(r(105) = -.18, where subjects with high extraversion are
less accurate at clicking on the change location, but there is no relationship to how long it takes
them to find a change. The correlation also does not hold with the reduced sample, r(105) = .1.
In the reduced sample, individuals who rate themselves as being more conscientious tend
to be slightly faster and more accurate to detect a change r(105) = -.25, but the relationship does
not hold in the full dataset r(122) = .08.
Personality variables do not show a consistently strong relationship to intentional
blindness performance (see Appendix for the full correlation matrix). In both the full sample and
the reduced sample, subjects who were more impulsive and less conscientious were somewhat
more likely to report noticing the unexpected object, r(122) = .16 and r(105) = .14 respectively.
Unfortunately, we did not obtain an independent measure of accuracy at identifying features of
28
the unexpected object, as only subjects who reported noticing an object were asked about the
object’s features. Therefore, we cannot contrast predictors’ relationship to reported noticing and
accurate memory for the unexpected object in the inattentional blindness task.
3.2.3 Regression
For the detailed results, see Table 2. We conducted regression analysis to test if personality
factors and performance on the other tasks predicted participants' noticing rates in each noticing
task. For incidental change detection, the results of the binary logistic regression were significant
(R2=.104, F(11,111)=1.17, p=.3). FFOV best predicted accuracy at identifying the changes in the
video in both the full and reduced samples. For intentional change detection with the full sample,
the results of the regression were significant (R2=.206, F(12,110)=2.38, p>.05). Here, noticing in
the IB task explained most of the unique variance. For intentional change detection with the partial
sample, the results of the regression were also significant (R2=.104, F(12,93)=2.68, p>.05). Here,
noticing in the IB task, overall accuracy at the line judgment task, conscientiousness, and
extraversion all explain unique variance. For noticing during the inattentional blindness trial with
the full sample, the results of the regression were significant (R2=.17, F(12,110)=1.95, p>.05),
where the better noticers in the flicker task was the best predictor.
3.3 Predicting Noticing – Revisited
Because incidental change detection and inattentional blindness are nominal variables
with two categories (see/not see), I constructed classification trees using the other variables as
predictors. For each predictor variable, the classifier evaluates all possible splits and selects the
best possible split to minimize impurity (e.g. within sum-of-squares error) of the resulting
subsets (Hubert, 2011; Breiman, Friedman, Olshen & Stone, 1984). To find a good model that
cross-validates well, I used ensemble methods to grow multiple trees on random subsets of the
29
sample, leaving approximately 1/3 of the observations out-of-bag for each tree to be used for
cross-validation. Using this method, I can assess which predictors tend to be most informative as
predictor variables across a number of different tree and leaf sizes. Because each generation of a
classification tree leaves a proportion of observations out of the sample to use to cross-validate
the model, this analysis is more robust to outliers and provides a more stable depiction of the
underlying patterns and relationships between variables in the data than a single standard
regression analysis can provide. All analyses were completed in Matlab R2011a using primarily
TreeBagger as well as fitensemble and ClassificationTree.fit.
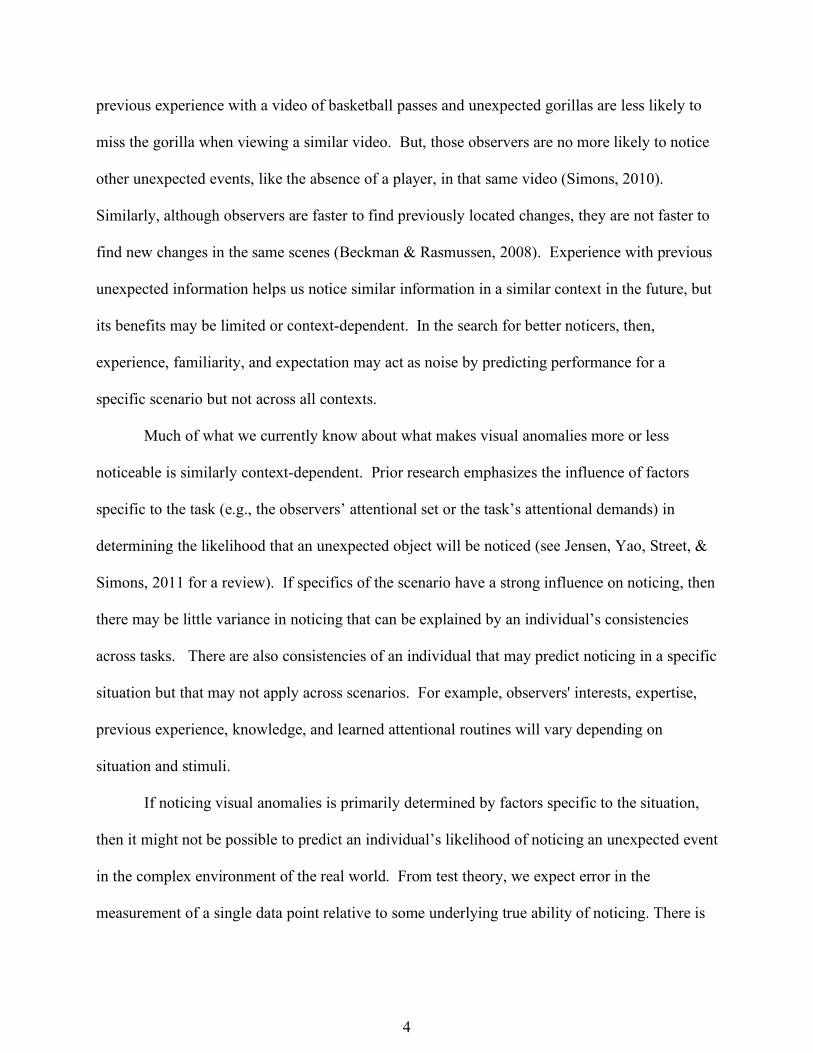
Here, I predict whether subjects will correctly identify the video changes using
performance on the other tasks. I first estimated an appropriate leaf size (the smallest number of
observations to allow in a subgroup) and selected a larger leaf size of 20 to avoid over-fitting.
To determine which features tend to be most important for predicting noticing, the classifier
measures the increase in error that occurs when out-of-the-bag observations are randomly
permuted across each predictor variable. The classifier’s average feature importance for each
predictor was averaged across 50 runs in which 200 randomly generated trees were created and
assessed. As can be seen in Figure 3, two variables were most predictive of incidental change
detection, FFOV and being a better noticer in the flicker change detection task. In figure 3, I
have provided a single representative tree as a particular instantiation of the underlying model to
use as an example. Without any model, we would make the naive prediction that no observers
should identify the change (as baserate noticing was less than 50%), which would produce an
error of .37. The out of bag error for the classifier is also .37, meaning on average 37% of the
observers would be mis-classified. The resubstitution error for a single representative tree like
the one shown in Figure 3 is .29. The classifier is not able to predict noticing better than no
30
model, suggesting that while these factors are related to detection they do not allow us to predict
noticing in a single unexpected change detection trial better than chance.
We also predicted inattentional blindness as a nominal variable using classification trees
with a leaf size of 20. In the full sample, the various measures of change detection are most
predictive of noticing in the inattentional blindness trial, as well as the average time to respond to
the personality questions and agreeableness (oobloss = .2, resuberror = .21). In the reduced
sample, the similar predictors are important (oobloss = .19, resuberror = .17). A representative
tree is provided in Figure 3. Again, the model performs similarly to change, (e.g. the assumption
that all individuals will perform as the majority of observers did and, in this case, notice the
unexpected object).
To predict intentional change detection across a number of trials, we use a regression
tree, which is parallel to regression or ANOVA modeling (in the same way that classification
trees share commonalities with discriminate analysis). Here, we predict the composite change
detection score using a leaf size of 20. In Figure 3, the top chart displays the most important
variables for predicting change detection in the full sample. The lower graph shows data for the
reduced sample. In the full dataset, inattentional blindness, incidental change detection accuracy,
line judgment accuracy, FFOV, conscientiousness, and agreeabless are some of the best
predictors of change detection ability (oobloss = 1.64, resuberror = 1.88). In the reduced sample,
inattentional blindness is no longer a strong predictor, but the other variables remain important
(oobloss = 1.19, resuberror = .98). Again, we have provided a representative tree with the full
sample in Figure 3.
31
CHAPTER 4 DISCUSSION
In this exploratory attempt to find observers who are more likely to notice visual
anomalies, we found consistencies among a relatively homogeneous population of undergraduate
students in a large university. Within the context of an intentional change detection task, some
observers are reliably better noticers. Some subjects are faster to find change; others are reliably
more accurate. Consistent with prior work, we found change detection performance was related
to performance on functional field of view tasks (Pringle, et al, 2001) while noticing unexpected
objects was not (Memmert, Simons, & Grimes, 2009). For the first time, we looked at whether
individuals who were better at detecting changes in scenes were also better at noticing
unexpected changes or unexpected objects.
During the incidental change detection video, subjects viewed a short video clip and then
were asked if they noticed anything unusual change in the clip. They responded yes or no and
then clicked on the locations that they thought had changed. The resulting variables from these
two responses are both correlated to better change detection performance, but they are
differentially predicted by cognitive and personality measures. Whereas reported noticing of
unusual changes was predicted by aspects of the personality variables (like low
conscientiousness), accurately identifying the changes was more strongly predicted by an
attention measure (FFOV). The difference in the pattern of results between these two similar
dependent measures is consistent with previous work on change detection and human behavior.
Observers can shift response criterions or change their answers depending on how questions are
asked. For example, when asked to identify information about changes they had not reported
noticing, observers are sometimes able to correctly identify features of the change suggesting
they may know more about the change than their verbal report of noticing suggested (Mitroff,
32
Simons, & Levin, 2004). Consistencies in personality or cognitive style may be related to how
people respond to noticing questions, particularly when the questions are ambiguous. In this
case, reported noticing of unusual changes might depend more on observer’s interpretation of the
question given the visual evidence they have accumulated than on actual noticing of the change.
For both measures of incidental change detection, noticing is predicted by performance
on the attentional breadth task. During this incidental change detection task, observers were
exposed to unexpected visual changes to the central actor of a short video clip. Their primary
task was simply to watch the video clip. Given the camera focus, video cues, size of the figure,
and an attention bias toward human figures, it is likely this actor was the center of observers’
attention during most of the clip. Under these conditions, performance on intentional change
detection tasks or other measures of attention ability and capacity may reliably relate to noticing
of unexpected changes. Although the changes are unexpected, the task scenario encourages
viewers to passively attend to the information necessary for noticing the changes. This type of
scenario may represent optimal conditions for finding commonalities between standard measures
of cognitive ability as collected in the laboratory and incidental change detection. Additional
work is needed to replicate this finding and to explore how predictive cognitive measures will be
of noticing when the unexpected change is not in the center of attention.
Next, observers completed several trials where they searched for changes across
flickering presentations of a scene. As in previous work, we found that attentional breadth
predicted change detection performance. There were no obvious predictors of change detection
performance from the personality measures. Despite some tantalizing suggestions among the
various correlations that suggest factors like conscientiousness or agreeableness might relate to
performance, the personality predictors were not stable across various analyses. Performance on
33
the intentional change detection task also tended to be lightly correlated to performance on other
behavioral measures like accuracy on the line judgment task. This commonality in performance
across tasks suggests some participants are just better and faster than others across a range of
tasks in the same experiment. This ‘awesomeness’ factor could be driven by a myriad of
consistencies within a participant across tasks, from arousal and interest level to cognitive and
personality factors. Before we use data showing relationships between performances on
different tasks as evidence of consistency between the cognitive mechanisms those tasks are
theororized to measure, it is important to acknowledge that some more general factor may
explain the relationship. For example, in this study, it could be that individuals who have a
higher attentional breadth also tend to be better change detectors because that attentional breadth
is relevant to change detection. However, it may also be that subjects who are motivated and
engaged by finding changes in flickering images are also adept at understanding and executing
the FFOV task (among an infinity of other possibilities) or making judgments about line lengths.
In our final noticing task, participants making judgments about the length of briefly
presented crossed lines were shown an additional unexpected object in an inattentional blindness
trial. Predicting whether individuals will notice that additional unexpected item remains an
elusive goal. In this sample, attentional breadth was not strongly related to inattentional
blindness and did not explain variance in noticing during the inattentional blindness trial in any
of our analyses. In contrast, noticing the unexpected object was related to better performance on
the intentional change detection task. Participants with low accuracy on the flicker task were
particularly unlikely to notice the unexpected object, despite performing adequately on the
primary line judgment task and being equally likely to notice the item on the divided attention
trial. Individuals who find the flicker task particularly challenging seem to be less likely to
34
notice unexpected changes and objects. Instead of better noticers, then, we seem to have found
evidence for particularly bad noticers. Similarly, in one of the only studies to examine noticing
across different phenomena, inattentional blindness rates have been linked to the magnitude of
the attentional blink, where subjects who fail to see the unexpected object during a dynamic
tracking task tend to have a larger attentional blink magnitude (Beanland & Pammer, 2011).
Given the theoretical and practical importance of identifying whether there are better and worse
noticers of visual anomalies, future research needs to continue to search for consistency in
noticing across different tasks of visual awareness.
Even if cognitive predictors relate to noticing of visual anomalies, the results of this study
suggest predictors may only relate to noticing for information that falls within attended sets or
regions of a display. In any given task, cognitive abilities like working memory are likely to
vary in how they are allocated based on the specifics of task, previous experience, and so on.
For example, in a dichotic listening task, when ignoring an irrelevant audio channel, high
working capacity subjects miss their own name more than lower working memory participants
(Colflesh & Conway, 2007). However, when told to monitor the alternate auditory channel for
their own name, high working memory capacity individuals miss their name less often than
lower working memory participants (Colflesh & Conway, 2007). In other words, how well
attention measures will predict noticing may vary depending on how attention is allocated in a
given situation.
35
CHAPTER 5 CONCLUSION
Within this dataset, there is some indication that noticing visual anomalies varies
consistently across people. If noticing unexpected information is reliable and we are able to
identify factors that may predict noticing, the result could benefit both our understanding of the
human mind as well as society in general. Imagine, for example, the utility of a family selecting
the driver least likely to miss a deer in the road to drive them through the forests of Wisconsin or
the driver best able to navigate through a novel big city’s traffic. Or, imagine the benefit for
systems design in being able to understand how much failures to notice information are predicted
by things like response biases, motivation and approach to the task, and current cognitive ability
to perform basic attention measures.
Nevertheless, the possibility of future utility should not distract us from the limitations of
this kind of research. As we all (should) learn from our first introductions to experimental
methods, correlations are not good evidence of causation and correlational research must be
interpreted with caution. Relationships between two factors can be illusory or driven by other
variables no matter how intuitively satisfying a causal interpretation might be. Nor should we let
the patterns we see or hope to find blind us to the potential flaws in our interpretation of the data
or to the imperfection in our methods. Pareidolia is easier to acknowledge when it is found in a
fluffy cloud or a piece of holy toast than in quantified data. The solutions are as they have
always been in science: collecting repeated observations, working to make measurements more
precise and less biased, providing detailed information about methods and analysis, and being
willing to consider conflicting evidence to update hypotheses.
With these limitations in mind, there are several conclusions I will emphasize from this
dataset. First, noticing performance is variable. Even in the intentional change detection task,
36
individual subjects varied in their time to search for changes. There is also substantial noise in
reports of visual awareness. In the incidental change detection task, reported noticing and
accuracy at identifying the changes yielded different estimates of noticing performance for the
exact same stimulus/trial. Second, even in the relatively controlled context of a laboratory
setting, individuals approach experimental tasks in different ways. We had to remove twelve
subjects from the sample because these subject pool students did not even try to find changes in a
scene flicker task that many other subjects report as being fun and entertaining (many of them
did not even move the mouse from trial to trial, ending the trial as soon as it began). Participants
who tried to do the task also varied in how long they would search before giving up on a trial.
More generally, some subjects rush through experiments while others proceed at a leisurely pace.
In other words, there may be a lot of consistencies across an individual’s performance on tasks
that may be explained by commonalities like overall approach to an experiment. Third, despite
all of this variability there is some consistency in performance. Subjects who spend a long time
to respond to questions about their personality tend to also respond more slowly to any response
prompt. Subjects who are faster to find one change tend to be faster to find another change or to
locate a briefly presented target. Understanding these kinds of consistencies and variability
between individuals and how they relate to individual performance is a critical step in a more
holistic understanding of human perception and cognition.
In addition to these conclusions, there are several patterns within the dataset that we
should continue to look for in future work, both for confirmatory and disconfirmatory evidence.
First, further evidence of consistency in noticing is necessary. My attempts to predict noticing in
a single inattentional blindness trial or in an incidental change detection trial were unsuccessful.
One possibility is that there are better measures of cognitive ability or personality to use as
37
predictors. Alternatively, noticing unexpected information in any specific scenario may be too
variable or too strongly influenced by other factors to be predicted by an individual’s
characteristics. And, by correlating an individual difference measure with a single noisy
measure of noticing, we may be more likely to find meaningless correlations that are due to the
stochastic nature of the measures. Second, attention and memory measures may predict noticing
when attention is focused on information important for noticing, but it is unclear if these same
predictors will be informative for information outside of focused attention. A dissociation in
predicting noticing for attended and unattended information would be consistent with the wider
perception literature that suggests attended information is given special processing. Third,
although the personality measures in this study did not strongly correlate to noticing, there is
some suggestion that personality differences may relate to noticing measures, particularly if there
is opportunity for response biases and criterion shifts in reporting noticing.
Despite the challenges of predicting noticing across scenarios, there is still great value in
studying individual differences. Correlational work provides a more holistic view of cognition
and emphasizes both the variability and regularity across human perception and behavior. An
additional benefit of assessing performance across noticing tasks is that it allows researches to
assess the reliability of our measurements and to understand what kinds of laboratory tasks may
be tapping common resources and abilities across different situations. Observing co-variance in
performance might also suggest later more causal experimental manipulation. For example if
factors related to motivation strongly correlate with performance, then we can design studies to
manipulate motivation and observe how noticing changes as a result.
Detection of visual anomalies is not likely to be explained by variance in any single
dimension of individual difference measures. Instead, we are more or less likely to notice visual
38

inconsistencies for a number of reasons; including our general approach to a situation; the
knowledge, interests, and expertise we bring to the situation; the perceptual and cognitive
abilities we have at our disposal and how we deploy them; and random chance. Here, I find a
simple perceptual task that measures attentional breadth shares commonalities with noticing
visual changes. Other measures of perceptual and cognitive ability are likely to relate as well.
Understanding what predictors best explain noticing and why merits future work.
39

TABLES & FIGURES
TABLE 1 Table 1A Correlations between Main Tasks (N =126)
Intentional Change
Detection
Incidental Change
Detection Inattentional
Blindness FFOV Intentional CB 1.00 Incidental CB 0.18 1.00 Inattentional Blindness 0.29 0.05 1.00 FFOV 0.21 0.26 0.10 1.00
Note: To provide a reference of what may be meaningful correlations, in classical hypothesis testing, r(124) = .175, p < .05. Here, we are not attempting to do hypothesis testing or correct for multiple comparisons, but provide the significance cutoff as a reference. Table 1B Correlations between Main Tasks (N =109)
Intentional Change
Detection
Incidental Change
Detection Inattentional
Blindness FFOV Intentional CB 1.00 Incidental CB 0.21 1.00 Inattentional Blindness 0.08 -0.04 1.00 FFOV 0.20 0.27 0.09 1.00
Note: For reference, r(107) = .19, p < .05.
40
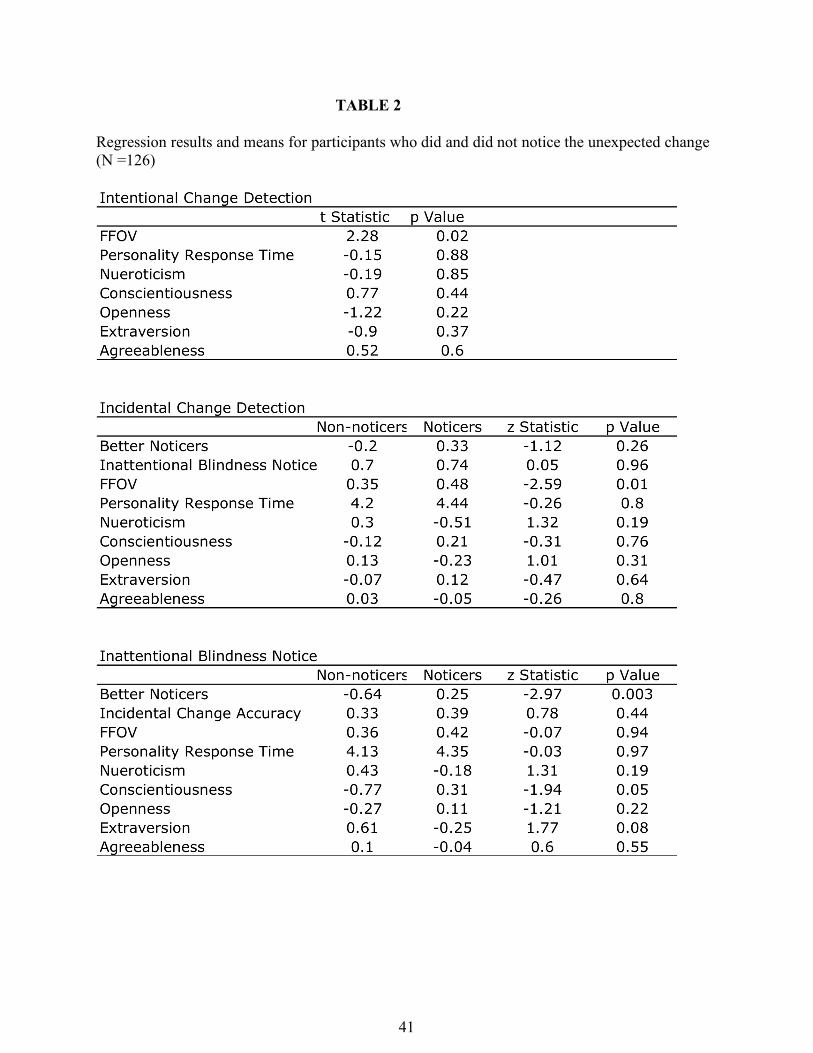
TABLE 2 Regression results and means for participants who did and did not notice the unexpected change (N =126)
41
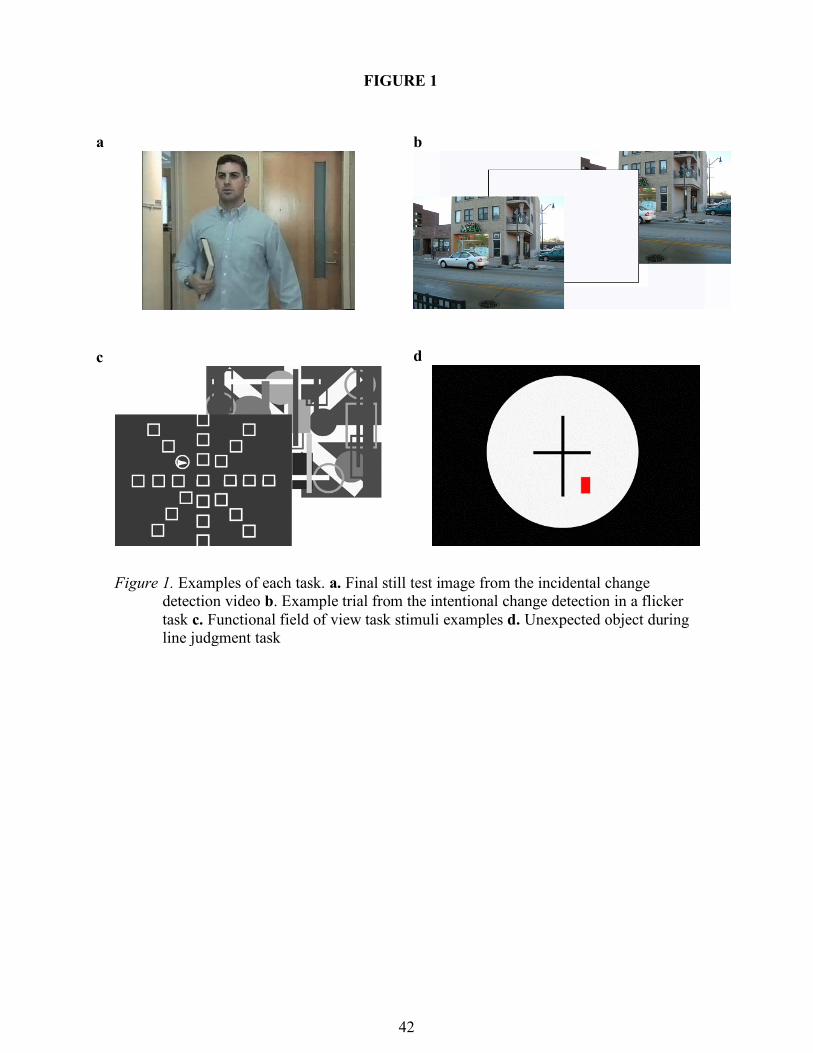
a
c
b
d
Figure 1. Examples of each task. a. Final still test image from the incidental change detection video b. Example trial from the intentional change detection in a flicker task c. Functional field of view task stimuli examples d. Unexpected object during line judgment task
FIGURE 1
42
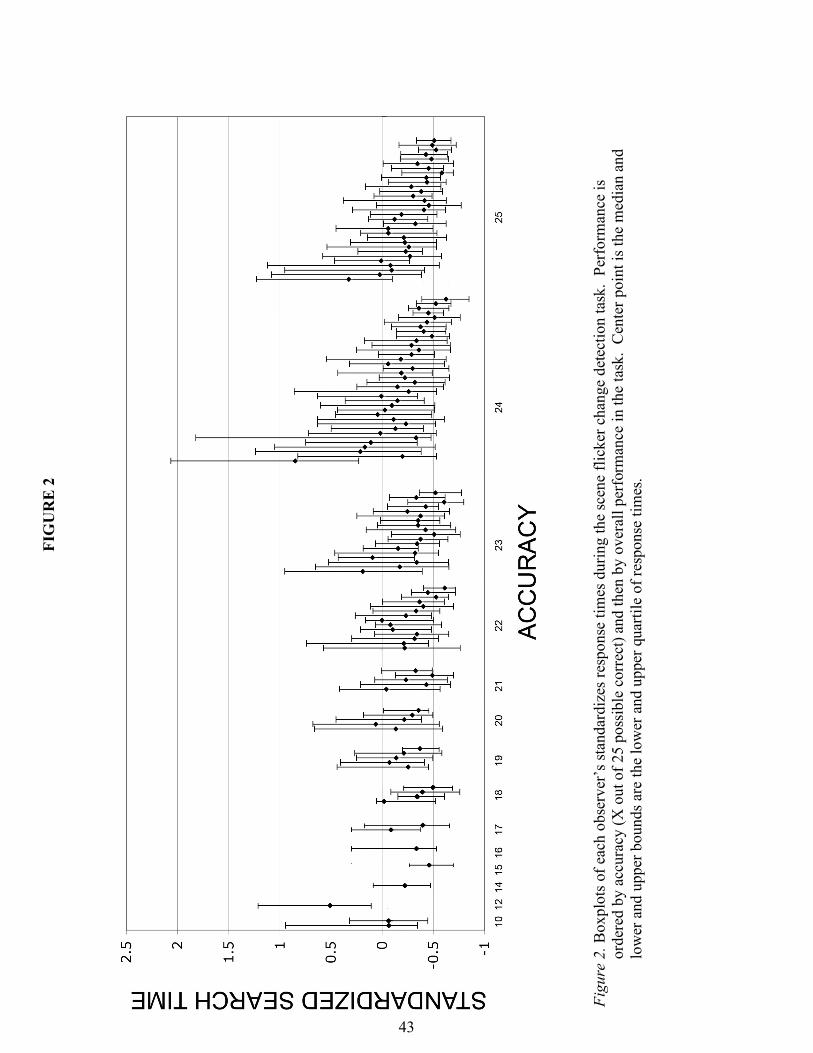
Figu
re 2
. Box
plot
s of e
ach
obse
rver
’s st
anda
rdiz
es re
spon
se ti
mes
dur
ing
the
scen
e fli
cker
cha
nge
dete
ctio
n ta
sk.
Perf
orm
ance
is
orde
red
by a
ccur
acy
(X o
ut o
f 25
poss
ible
cor
rect
) and
then
by
over
all p
erfo
rman
ce in
the
task
. C
ente
r poi
nt is
the
med
ian
and
low
er a
nd u
pper
bou
nds a
re th
e lo
wer
and
upp
er q
uarti
le o
f res
pons
e tim
es.
FIG
UR
E 2
43
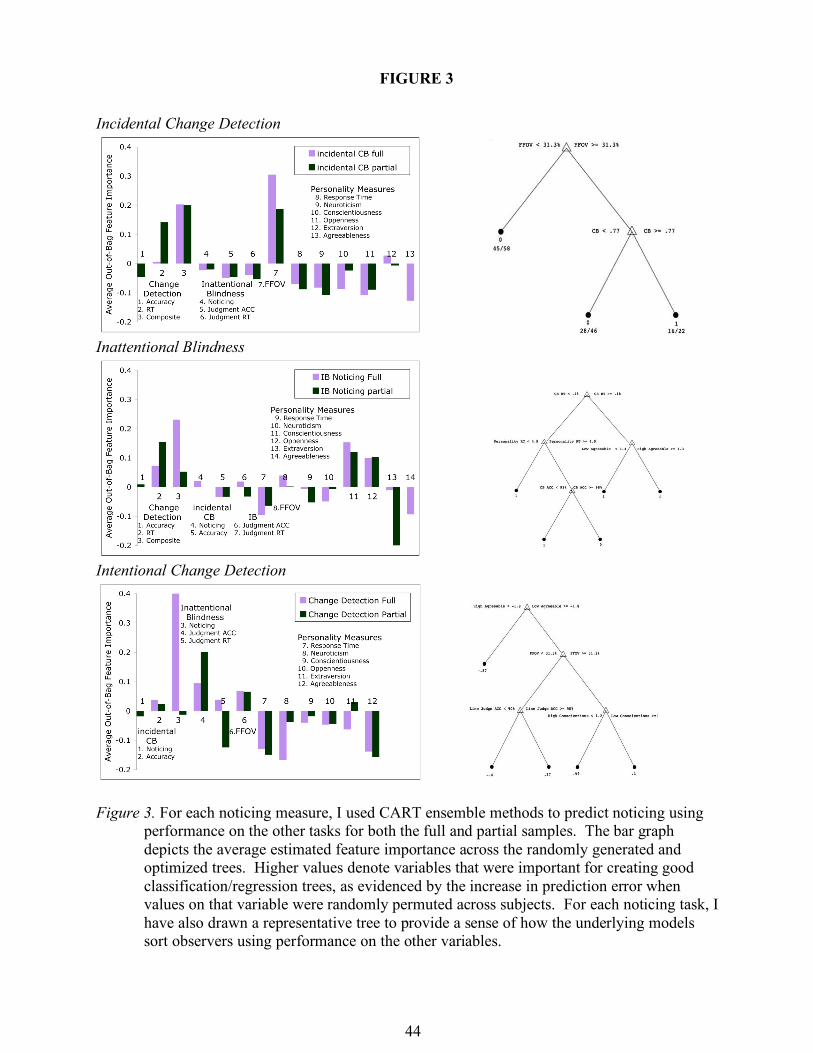
Incidental Change Detection
Inattentional Blindness
Intentional Change Detection
Figure 3. For each noticing measure, I used CART ensemble methods to predict noticing using
performance on the other tasks for both the full and partial samples. The bar graph depicts the average estimated feature importance across the randomly generated and optimized trees. Higher values denote variables that were important for creating good classification/regression trees, as evidenced by the increase in prediction error when values on that variable were randomly permuted across subjects. For each noticing task, I have also drawn a representative tree to provide a sense of how the underlying models sort observers using performance on the other variables.
FIGURE 3
44
REFERENCES
Aginsky, V., & Tarr, M.J. (2000) How are different properties of a scene encoded in visual
memory? Visual Cognition (Special Issue: Change Blindness and Visual Memory, 7, 147–162.
Ball, K. K., Beard, B. L., Roenker, D. L., & Miller, R. L. (1988). Age and visual search:
Expanding the useful field of view. Journal of the Optical Society of America, A, Optics, Image & Science, 5, 2210-2219.
Beanland, V., & Pammer, K. (2010). Looking without seeing or seeing without looking? Eye
movements in sustained inattentional blindness. Vision Research, 50, 977-988. Beanland, V., & Pammer, K. (2010). Gorilla watching: Effects of exposure and expectations on
inattentional blindness. In W. Christensen, E. Schier, & J. Sutton (Eds.), ASCS09: Proceedings of the 9th conference of the australasian society for cognitive science (pp.12–20). Sydney: Macquarie Centre for Cognitive Science. doi:10.5096/ASCS20093
Beck, D. M., & Kastner, S. (2009). Top-down and bottom-up mechanisms in biasing competition
in the human brain. Vision Research, 49, 1154-1165. Beck, M. R., Angelone, B.A., & Levin, D. T. (2004). Knowledge about the probability of change
affects change detection performance. Journal of Experimental Psychology: Human Perception and Performance, 30(4), 778-791.
Beck, M. R., Angelone, B.A., Levin, D.T., Peterson, M.S., & Varakin, A. (2008). Implicit
learning for probable changes in a visual change detection task. Consciousness and Cognition, 17, 1192-1208.
Beck, M. R., Levin, D.T. & Angelone, B.A. (2007) Change blindness blindness: Beliefs about
the roles of intention and scene complexity in change detection. Consciousness and Cognition, 16, 31-5
Beck, M.R., Peterson, M.S., & Angelone, B.A. (2007). The roles of encoding, retrieval, and
awareness in change detection. Memory and Cognition, 35(4), 610-620. Becker, M. W., & Rasmussen, I. P. (2008). Guidance of attention to objects and locations by
long-term memory of natural scenes. Journal of Experimental Psychology: Learning, Memory, and Cognition, 34, 1325-1338.
Bichot, N. P., & Schall, J. D. (1999). Saccade target selection in macaque during feature and
conjunction visual search. Visual Neuroscience, 1, 81-89.
45
Boot, W. R., Kramer, A. F., Simons, D. J., Fabiani, M., Gratton, G. (2008). The effects of video game playing on attention, memory, and executive control. Acta Psychologica, 129(3), 387-398.
Brainard, D.H. (1997) The Psychophysics Toolbox, Spatial Vision 10:443-446. Bredemeier, K., & Simons, D. J. (2012). Working memory and inattentional blindness.
Psychonomic Bulletin & Review, 19, 239-244. Breiman, L., Friedman, J. H., Olshen, R. A., and Stone, C. J. 1984. Classification and Regression
Trees. Wadsworth International, Belmont, Ca. Cacioppo, J. T., & Petty, R. E. (1982). The need for cognition. Journal of Personality and Social
Psychology, 42, 116-131. Cartwright-Finch, U., & Lavie, N. (2007) The role of perceptual load in inattentional blindness.
Cognition, 102, 321–340. Chabris, C., Weinberger, A., Fontaine, M., & Simons, D. (2011). You do not talk about Fight
Club if you do not notice Fight Club: Inattentional blindness for a simulated real-world assault. i-Perception, 2, 150-153.
Chun, M., & Marois, R. (2002). The dark side of visual attention. Current Opinion in
Neurobiology, 12, 184-189. Colflesh, G. J. H., & Conway, A. R. A. (2007). Individual differences in working memory
capacity and divided attention in dichotic listening. Psychonomic Bulletin & Review, 14, 699-703.
Downing, P.E., Bray, D., Rogers, J., & Childs, C. (2004) Bodies capture attention when nothing
is expected. Cognition, 93, B27–B38. Duffy, S., & Kitayama, S. (2010) Cultural modes of seeing through cultural modes of being:
Cultural influences on visual attention. In Social psychology of visual perception, 51-75. New York, NY, US:Psychology Press, 2010.
Fougnie, D. & Marois, R. (2007). Executive working memory load induces inattentional
blindness. Psychonomic Bulletin & Review, 14, 142-147. Folk, C. L., Remington, R. W., & Johnston, J. C. (1992). Involuntary covert orienting is
contingent on attentional control settings. Journal of Experimental Psychology: Human Perception and Performance, 18, 1030-1044.
Green, C. S., & Bavelier, D. (2003) Action video game modifies visual selective attention.
Nature, 423, 534-537.
46
Hannon, E. M., & Richards, A. (2010). Is inattentional blindness related to individual differences in visual working memory capacity or executive control functioning? Perception, 39, 309-319.
Henderson, J.M., & Hollingworth, A.(1999). The role of fixation position in detecting scene
changes across saccades. Psychological Science, 10, 438–443. Hollingworth, A. (2003). Failures of retrieval and comparison constrain change detection in
natural scenes. Journal of Experimental Psychology: Human Perception and Performance, 29, 388-403.
Hollingworth, A. (2005). Memory for object position in natural scenes. Visual Cognition, 12,
1003-1016. Hollingworth, A., & Henderson, J. M. (2000). Semantic informativeness mediates the detection
of changes in natural scenes. Visual Cognition, 7, 213-235. Hollingworth, A., Schrock, G., & Henderson, J.M. (2001). Change detection in the flicker
paradigm: the role of fixation position within the scene. Memory & Cognition, 29, 296–304.
Hyman, I., Boss, S., Wise, B., McKenzie, K., & Caggiano, J. (2010). Did you see the unicycling
clown?: Inattentional blindness while walking and talking on a cell phone. Applied Cognitive Psychology, 24, 597-607.
John, O. P., Donahue, E. M., & Kentle, R. L. (1991). The Big Five Inventory- Versions 4a and
54. Social Psychology, 57, 552–567. Jones, B. T., Jones, B. C., Smith, H., & Copley, N. (2003) A flicker paradigm for inducing
change blindness reveals alcohol and cannabis information processing biases in social users. Addiction, 98, 235-244.
Jensen, M. W., Yao, R., Street, W. N., & Simons, D. J. (2011). Change blindness and
inattentional blindness. WIREs Cognitive Science, 2, 529–546. DOI: 10.1002/wcs.130. Koivisto, M., Hyona, J., & Revonsuo, A. (2004) The effects of eye movements, spatial attention,
and stimulus features on inattentional blindness. Vision Research, 44, 3211–3221. Kruglanski, A.W. & Webster, D.M., & Klem, A. (1993). Motivated Resistance and Openness to
Persuasion in the presence or absence of prior information. Attitudes and Social Cognition, 65, 861-876.
Lavie, N. (2006). The role of perceptual load in visual awareness. Brain Research, 1080, 91-100. Lee H., & Telch, M.J. (2008). Attentional biases in social anxiety: an investigation using the
inattentional blindness paradigm. Behavioral Research Theory, 46, 819–835.
47
Levin, D.T., & Angelone, B.L. (2008) The visual metacognition questionnaire: A measure of
intuitions about vision. American Journal of Psychology, 121, 451–472. Levin, D.T., Momen, N., Drivdahl, S.B., & Simons, D.J. (2000) Change blindness blindness:
The metacognitive error of overestimating change-detection ability. Visual Cognition, 7, 397–412.
Levin, D. T., & Simons, D. J. (1997). Failure to detect changes to attended objects in motion
pictures. Psychonomic Bulletin and Review, 4, 501-506. Luck, S. J., & Vogel, E. K. (1997). The capacity of visual working memory for features and
conjunctions. Nature, 6657, 279-281. Macdonald, J. S., Lavie, N. (2011). Visual perceptual load induces inattentional deafness. Atten
Percept Psychophys 73(6), 1780-1789 Mack, A., & Rock, I. (1998b). Inattentional blindness: Perception without attention. In R. Wright
(Ed.), Visual attention (pp. 55-76). New York: Oxford University Press. Masuda, T., & Nisbett, R. E. (2001). Attending holistically versus analytically: Comparing the
context sensitivity of Japanese and Americans. Journal of Personality and Social Psychology, 81, 922-934.
Mayer, B., Muris, P., Vogel, L., Nojoredjo, I., & Merckelbach, H. (2006) Fear-relevant change
detection in spider-fearful and non-fearful participants. Journal of Anxiety Disorders, 20, 510–519.
Marchetti, L. M., Biello, S. M., Broomfield, N. M., MacMahon, K. M. A., & Espie, C. A.. (2006)
Who is pre-occupied with sleep? A comparison of attention bias in people with psychophysiological insomnia, delayed sleep phase syndrome and good sleepers using the induced change blindness paradigm. Journal of Sleep Research, 15, 212-221.
McCarley, J.S., Vais, M.J., Pringle, H., Kramer, A.F., Irwin, D.E., & Strayer, D.L. (2004)
Conversation disrupts change detection in complex traffic scenes. Human Factors, 46, 424–436.
McGlynn, F.D., Wheeler, S.A., Wilamowska, Z.A., & Katz, J.S. (2008) Detection of change in
threat-related and innocuous scenes among snake-fearful and snake-tolerant participants: data from the flicker task. Journal of Anxiety Disorders, 22, 515–523.
Memmert, D., Simons, D. J., & Grimme, T. (2009). The relationship between visual attention
and expertise in sports. Psychology of Sport and Exercise, 10(1), 146-151. Most, S.B., & Astur, R.S. (2007). Feature-based attentional set as a cause of traffic accidents.
Visual Cognition, 15, 125–132.
48
Most, S. B., Scholl, B. J., Clifford, E. R., & Simons, D. J. (2005). What you see is what you set:
Sustained inattentional blindness and the capture of awareness. Psychological Review, 112, 217-242.
Most, S. B., Simons, D. J., Scholl, B. J., Jimenez, R., Clifford, E., & Chabris, C. F. (2001). How
not to be seen: The contribution of similarity and selective ignoring to sustained inattentional blindness. Psychological Science, 12, 9-17.
Patton, J.H., Standford, M.S., & Barratt, E.S. (1995). Factor structure of the Barratt
impulsiveness scale. Journal of Clinical Psychology, 51, 768-774. Pelli, D. G. (1997) The VideoToolbox software for visual psychophysics: Transforming numbers
into movies, Spatial Vision, 10, 437-442. Pringle H.L., Irwin D.E., Kramer A.F., & Atchley P. (2001). The role of attentional breadth in
perceptual change detection. Psychonomics Bulletin & Review, 8(1), 89-95. Pringle, H.L., Kramer, A.F., & Irwin, D.E. (2004) Individual Differences in the Visual
Representation of Scenes In: Levin DT, editor. Thinking and seeing: Visual metacognition in adults and children. Cambridge, MA, US: MIT Press, 165-85.
Reingold, E.M., Charness, N., Pomplun, M., & Stampe, D.M. (2001) Visual span in expert chess
players: evidence from eye movements. Psychological Science, 12, 48–55. Rensink, R.A., (2002a). Change detection. Annual Review of Psychology, 53: 245-277. Rensink, R.A., O'Regan, J.K., & Clark, J.J. (1997). To see or not to see: The need for attention to
perceive changes in scenes. Psychological Science, 8: 368-373. Richards, A., Hannon, E., & Derakshan, N. (2010). Predicting and manipulating the incidence of
inattentional blindness. Psychological Research, 74, 513–523. Rock, I., Linnett, C. M., Grant, P., & Mack, A. (1992). Perception without attention: Results of a
new method. Cognitive Psychology, 24, 502-534. Scholl, B. J. (2000). Attenuated change blindness for exogenously attended items in a flicker
paradigm. Visual Cognition, 7(1/2/3), 377-396. Seegmiller, J. K., Watson, J. M., & Strayer, D. L. (2011). Individual differences in susceptibility
to inattentional blindness. Journal of Experimental Psychology: Learning, Memory, and Cognition, 37, 785–791.
Simons, D. J. (2000). Current approaches to change blindness. Visual Cognition, 7, 1-16.
49
Simons, D. J. (2010). Monkeying around with the gorillas in our midst: Familiarity with an inattentional-blindness task does not improve the detection of unexpected events. i-Perception, 1, 3-6.
Simons, D. J., & Ambinder (2005). Change blindness: Theory and consequences. Current
Directions in Psychological Science, 14, 44-48. Simons, D. J., & Chabris, C. F. (1999). Gorillas in our midst: Sustained inattentional blindness
for dynamic events. Perception, 28, 1059-1074. Simons, D. J., & Chabris, C. F. (2011). What people believe about how memory works: A
representative sample of the U.S. population. PLoS ONE, 6, e22757. Simons, D. J., & Jensen, M. S. (2009). The effects of individual differences and task difficulty on
inattentional blindness. Psychonomic Bulletin & Review, 16(2), 398-403. Simons, D. J., & Levin, D. T. (1998). Failure to detect changes to people during a real-world
interaction. Psychonomic Bulletin and Review, 5, 644-649. Simons, D. J., & Mitroff, S. R. (2001). The role of expectations in change detection and
attentional capture. In L.R. Harris & M. R. M. Jenkin (Eds.), Vision and Attention (pp. 189-207). New York: Springer Verlag.
Simons, D.J., & Rensink, R.A. (2005a). Change blindness: Past, present, and future. Trends in
Cognitive Sciences, 9: 16-20. Strayer, D. L., Drews, F. A., & Johnston, W. A. (2003). Cell phone-induced failures of visual
attention during simulated driving. Journal of Experimental Psychology: Applied, 9, 23–32.
Szymura, B., & Nęcka, E. (1998). Visual selective attention and personality: An experimental
verification of three models of extraversion. Personality and Individual Differences, 24, 713-729.
Tager-Flusberg, H., Plesa-Skwerer, D., Schofield, C., Verbalis, A., Simons, D. J. (2007). Change
detection as a tool for assessing attentional deployment in atypical populations: The case of Williams Syndrome. Cognition, Brain, & Behavior, 11, 491-506.
Takahashi, K., & Watanabe, K. (2008) Persisting effect of prior experience of change blindness.
Perception, 37, 324-327. Todd, R. M., & Anderson, A.K. (2010) Through the lens of emotion: The role of the amygdala in
emotionality, arousal, and attention to the visual world. In Social psychology of visual perception, 149-170. New York, NY, US:Psychology Press, 2010.
50
Todd, J. J., Fougnie, D., & Marois, R. (2005). Visual short-term memory load suppresses temporo-parietal junction activity and induces inattentional blindness. Psychological Science, 16, 965-972.
Triandis, H.C., & Gelfand. M.J. (1998), Converging Measurement of Horizontal and Vertical
Individualism and Collectivism24(1), 118-128. Wayand, J.F., Levin D.T., & Varakin A. (2005). Inattentional blindness for a noxious
multimodal stimulus. American Journal of Psychology. 118(3):339-52. Weierich, M., & Barrett, L. F. (2010) Affect as a source of visual attention. In Social
psychology of visual perception, 125-148. New York, NY, US:Psychology Press. Werner, S., & Thies, B. (2000) Is ‘‘change blindness’’ attenuated by domain-specific expertise? An expert–novices comparison of change detection in football images. Visual Cognition (Special Issue: Change Blindness and Visual Memory), 7, 163–173.
51
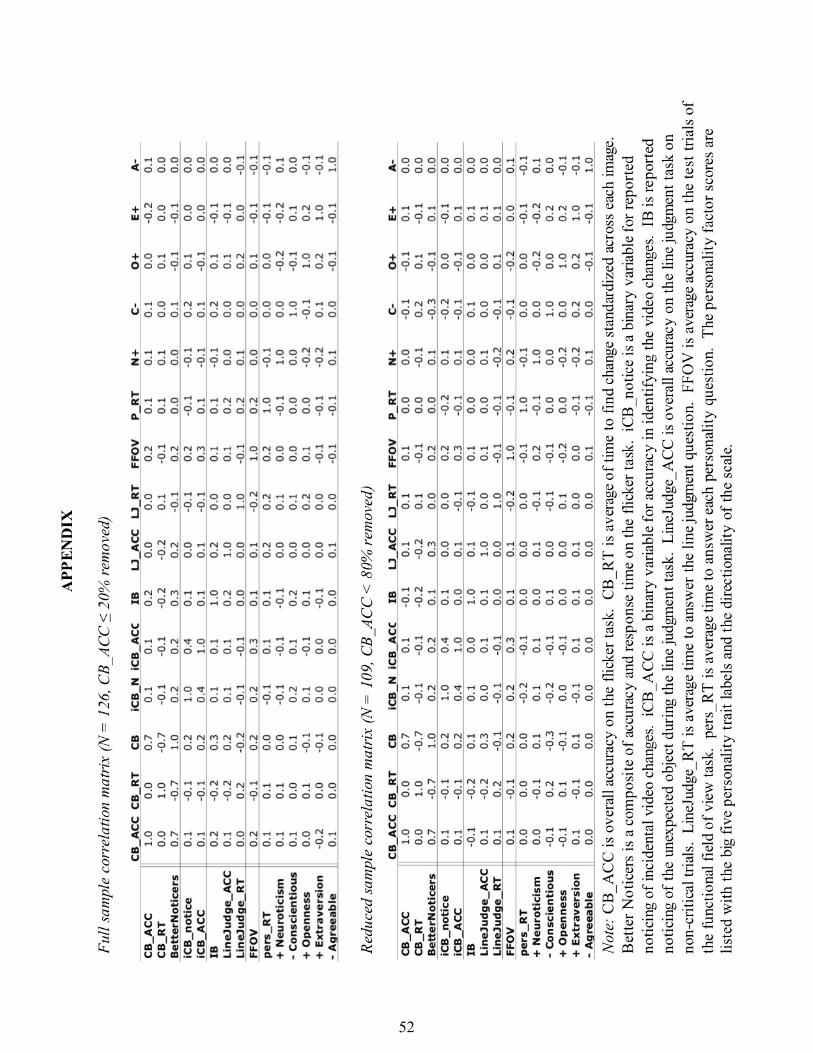
APPEN
DIX
Full sam
ple correlation matrix (N = 126, CB_ACC ≤ 20%
removed)
Reduced sample correlation m
atrix (N = 109, CB_ACC <
80% rem
oved)
52


![4.- Secrets [Melinda Metz]](https://img.pdfslide.us/doc/110x75/5571fc184979599169967b52/4-secrets-melinda-metz.jpg)