Embed Size (px)
Citation preview

R. BARRERO (VUB) - X. TACKOEN (ULB)
STIB - Brussels - 5th of February 2009
ENERGY STORAGE SOLUTIONS FOR IMPROVING THE ENERGY EFFICIENCY
OF PUBLIC TRANSPORT VEHICLES

Plan of the presentation
• The EVEREST project
• The supercapacitors technology and market overview
• Potential solutions for STIB rail vehicles
- On-board application for the tram network- Stationary application for the metro network
• Conclusion and project perspectives
• Lunch & talk

The EVEREST project
OBJECTIVES
• Define the most efficient energy storage applications for the Brussels public transport company (STIB/MIVB)
• Estimate the potential energy savings of each application
• Measure the associated air pollution reduction
• Assess the costs and benefits of the identified configurations

The EVEREST projectAKNOWLEDGEMENTS
• Project supported by the Institute for the Encouragement of Scientific Research and Innovation of Brussels (IRSIB/IWOIB)
• Multi-actor project involving the VUB for the technical aspects and the ULB for the economic aspects, both partners working on the environmental issues
• 4 years project started in January 2007

THE SUPERCAPACITORS TECHNOLOGY AND MARKET OVERVIEW

THE SUPERCAPACITORS TECHNOLOGY AND MARKET OVERVIEW

SUPERCAPACITORS BRIDGE THE GAP BETWEEN BATTERIES AND CONVENTIONAL CAPACITORS
Source : Wikipedia

• Based on conventional capacitor principle, make use of battery technology
• Electrical energy stored in an electric field (capacitors)
TECHNOLOGY

• Based on conventional capacitor principle, make use of battery technology
• Electrical energy stored in an electric field (capacitors)
• Special electrodes soaked in electrolyte (batteries)Charge separation occurs in the interface electrode-electrolyte↑ Capacitance
• No chemical reaction involved
TECHNOLOGY

ADVANTAGES
• High power density• High efficiency• Low internal resistance• Long lifetime, there is very little
wear induced by cycling • Easy to determine the state of
charge by measuring the cell voltage• Rapid charge and discharge• Wide range of temperature
operation
SHORTCOMINGS
• Low energy density• High price in energy
terms• Low cell voltage
requires many cells in series for certain applications
• Voltage balancing needed

• Telecommunications
• Industrial electronics
• Energy generation
• Transportation & automobile industry
MARKET OVERVIEW

• Annual growth rate of 15%
• Slow market entry due to high manufacturing costs
• Thanks to more automated techniques, costs should come down to +/- 0,005€ per Farad by 2010Source : Maxwell
MARKET OVERVIEW

POTENTIAL APPLICATIONS FOR THE BRUSSELS NETWORK

On-board application for the tram network
ENERGY STORAGE SYSTEMS

Gearbox and Wheels
-
ElectricMotor
Power train
Motor Drive
Low pass filter
DC OVERHEAD LINE 700 V
CONVENTIONAL TRAM ARCHITECTURE

Hybrid Electric Power System
Gearbox and Wheels
-
Supercapacitor
ESS
ElectricMotor
DC/DCconverter
Power train
Motor Drive
Low pass filter
DC OVERHEAD LINE 700 V
HYBRID TRAM ARCHITECTURE

• In commercial service after a 4 years trial phase
• Very good regularity
• Around 20% total energy savings
MITRAC ENERGY SAVER IN MANNHEIM (GERMANY)

• In commercial service after a 4 years trial phase
• Very good regularity
• Around 20% total energy savings
MITRAC ENERGY SAVER IN MANNHEIM (GERMANY)
2 modules of 0,85 kWh each = 1,7 kWh
270.000€ per vehicle

• Assess the potential energy savings related to hybrid vehicles following a city route
• Simulation software needed to do a sensitivity analysis of several parameters
• Simulation tool:
- Determination of power flow and energy consumption
- ‘effect-cause’ method
- Relatively simple vehicle models
- Fast simulation times
TECHNICAL METHODOLOGY

• Former 23 line from Heysel to Gare du Midi
• Real distances between stops
- Total length: 20.4 km
• Max speed
- 60 km/h in tunnel sections
- 50 km/h in surface (30 km/h for short distances between stops)
• Traffic conditions and altitude differences are not considered
• Each tram stop is set to 20 seconds
CASE STUDY: TRAM LINE 23 IN BRUSSELS
SYSTEM MODEL

Option A. Middle size Option B. Middle size alternative
Cells: C=2000F, Vmax= 2.5VConfiguration: 4 strings x 232 cells in seriesUsable energy: 1.2 kWhMax Voltage: 580 VCells weight: 371kg
Built-in modules: C=63F, Vmax= 125 V.Configuration: 3 strings X 4 modules in seriesUsable energy: 1.23 kWh Max Voltage: 500VModules weight: 696 kg*
Option C. Large size Option D. Small size
Cells: C=3000F, Vmax= 2.5VConfiguration: 4 strings x 200 cells in seriesUsable energy: 1.56 kWhMax Voltage: 500 VCells weight: 440 kg
Cells: C=1500F, Vmax= 2.5VConfiguration: 4 strings x 234 cells in seriesUsable energy: 0.91 kWhMax Voltage: 585 VCells weight: 300 kg
*including cells, connections, packaging and cooling
ENERGY STORAGE SYSTEM CONFIGURATIONS

ENERGY SAVINGS• Energy savings range from 23% up to 26% and increase with supercapacitors size
• Savings are higher when the vehicle is loaded with passengers
• Energy savings decrease at the end of life of the supercapacitors
• Voltage drops are significantly reduced

ENERGY SAVINGS• Energy savings range from 23% up to 26% and increase with supercapacitors size
• Savings are higher when the vehicle is loaded with passengers
• Energy savings decrease at the end of life of the supercapacitors
• Voltage drops are significantly reduced

• Energy savings range from 23% up to 26% and increase with supercapacitors size
• Savings are higher when the vehicle is loaded with passengers
• Energy savings decrease at the end of life of the supercapacitors
• Voltage drops are significantly reduced
VOLTAGE DROPS

BENEFITS VS COSTS
InvestmentInstallation
Maintenance Insurance
Energy savings
Emissions reduction
Less infrastructure

PARAMETERS AND SCENARIOS
• Parameters
- Annual mileage: 50.000 kilometers
- Average vehicle occupancy: 2 passengers/m2
- Vehicle weight: 45,2 tons
- Lifetime of the system: 15 years
• Scenario 1 (medium size)
- Module A configuration
- Energy content: 1,2 kWh
• Scenario 2 (small size)
- Module D configuration
- Energy content: 0,91 kWh

Energy savings
• Lifetime results show a consumption reduction of 960 MWh for scenario 1 and 890 MWH for scenario 2
• The price of eletricity for large consumers almost doubled in 5 years between 2002 and 2007
LIFETIME BENEFITS ANALYSIS
Source : Essenscia


Energy savings benefits for a T3000 (lifecycle approach)
0,00 €
20 000,00 €
40 000,00 €
60 000,00 €
80 000,00 €
100 000,00 €
120 000,00 €
140 000,00 €
160 000,00 €
180 000,00 €
200 000,00 €
0% 50% 100% 200%
Energy price increase (baseline=74€)
En
erg
y s
avin
gs
ben
efi
ts
Scenario 1 (Module A - 1,2 kWh)
Scenario 2 (Module D - 0,91kWh)
• Considering a 50% price increase in 15 years, lifetime benefits amount to +/- 80.000€
• A higher price increase would allow substantial benefits
LIFETIME BENEFITS ANALYSIS

Air pollutants reduction
• Unlike cars or conventional buses using fuel, electric vehicles do not exhaust pollutants locally
• However, the production of electricity generates various air pollutants: CO2, CH4, N2O, NOx, SO2, particulate matters, volatile organic compounds
• The STIB network is exclusively supplied by ELECTRABEL
Source: Electrabel
LIFETIME BENEFITS ANALYSIS

Air pollutants reduction
• CO2 tons could be cut annually by 15 tons for both scenarios
• Other harmful emissions could also be reduced
LIFETIME BENEFIT ANALYSIS

Air pollutants reduction
• By attributing a valuation price to each pollutant, we can estimate the cost of the externalities associated to the production of one MWh by the ELECTRABEL facilities (figures from 2007)
LIFETIME BENEFIT ANALYSIS

Air pollutants reduction
• The valuation price of a CO2 ton is expected to increase in the future
LIFETIME BENEFIT ANALYSIS
Source: Handbook on external costs

Air pollutants reduction
• The valuation price of a CO2 ton is expected to increase in the future
LIFETIME BENEFIT ANALYSIS
Source: Handbook on external costs
Valuation of environmental benefits (lifecycle approach)
0,00 €
5 000,00 €
10 000,00 €
15 000,00 €
20 000,00 €
25 000,00 €
30 000,00 €
35 000,00 €
40 000,00 €
45 000,00 €
50 000,00 €
11,65 € 18,66 € 29,18 € 47,87 €
Environmental effects monetary values (€/MWh)
En
vir
on
men
tal
ben
efi
ts
mo
neti
zati
on
Scenario 1 (Module A - 1,2 kWh)
Scenario 2 (Module D - 0,91kWh)

LIFETIME COSTS ANALYSIS
• Costs have been estimated using cost functions with many uncertainties and assumptions
• Determining the cost of an energy storage system is difficult due to :
- influence of development costs
- the absence of standardized products for the public transport sector

BENEFITS VS COSTS
Energy savings + environmental benefits
0,00 €
50 000,00 €
100 000,00 €
150 000,00 €
200 000,00 €
250 000,00 €
300 000,00 €
Pessimistic Averagelow
Averagehigh
Optimistic
Scenarios
To
tal b
en
efi
ts
Scenario 1 (Module A -1,2 kWh)Scenario 2 (Module D -0,91kWh)ESS cost (Mannheim -1,7kWh)ESS cost (prototype - 1,2kWh)ESS cost (large-scale -1,2 kWh)ESS cost (prototype -0,91 kWh)ESS cost (large-scale -0,91 kWh)

COST-BENEFIT APPROACH (CBA)
• In order to determine if investing in energy storage solutions is socially desirable, a cost-benefit analysis has been carried out.
• The approach consists in calculating the Net Present Value (NPV) of the various scenarios (prototype and large-scale).
• The NPV is defined as the net present value of future cash flows. When the NPV is higher than 0, the project is acceptable.
• We considered a discount rate of 4% showing that much attention is given to the future generations.

MOBILE ESS FOR A TRAM (PROTOTYPE) - SCENARIO 2

CBA: SENSITIVITY ANALYSIS
Energy price increase
External costs valuation increase

• The use of the ESS has proved that substantial energy savings (around 25%) and emissions reduction could be achieved
• However, even in the most optimistic cases, investing in mobile energy storage solutions for the Brussels tram network seems not profitable due to the high costs of the technology and the lack of standardization in the public transport sector
• We estimate that the cost per vehicle should not exceed 100.000€ to become attractive
• Other benefits such as reducing the number of substations or operate without overhead lines could influence the analysis and will have to be assessed in the next steps of the project
MOBILE ESS FOR A TRAM: CONCLUSION

Stationary application for the metro
network
ENERGY STORAGE SYSTEMS

On the Brussels metro network, conventional energy transfers between vehicles can go up to 35% at peak time.
But the energy regeneration could be significantly improved by storing the energy in supercapacitors (time differentiation)

STATIONARY SYSTEM ARCHITECTURE

STATIONARY SYSTEM ARCHITECTURE

• In operation in cities including Bochum, Cologne and Dresden (Germany), Madrid (Spain) and Peking (China)
• 300-500 MWh saved annually
• Around 300 CO2 tons avoided annually
SITRAS SES IN COLOGNE (GERMANY)

• In operation in cities including Bochum, Cologne and Dresden (Germany), Madrid (Spain) and Peking (China)
• 300-500 MWh saved annually
• Around 300 CO2 tons avoided annually
SITRAS SES IN COLOGNE (GERMANY)

• High traffic density network (metro every 3 minutes at peak-time)
• High speeds achieved (70 km/h) before the introduction of the Eco-Drive program
• Significant altitude differences
• High vehicle mass (compared to trams)
CASE STUDY: METRO LINE 2

• Vehicles auxiliaries consumption 20 kW/car
• Unidirectional line simulated
• Altitude differences considered
• Substations installed every 1000 m
• Trafic scenarios:
ASSUMPTIONS
Cars per metro train
Occupancy rate [p/m2]
Time delay between trains [min]
Peak Time 5 4 3Off-Peak 5 2 4
Night & WE 4 Only Seats 10

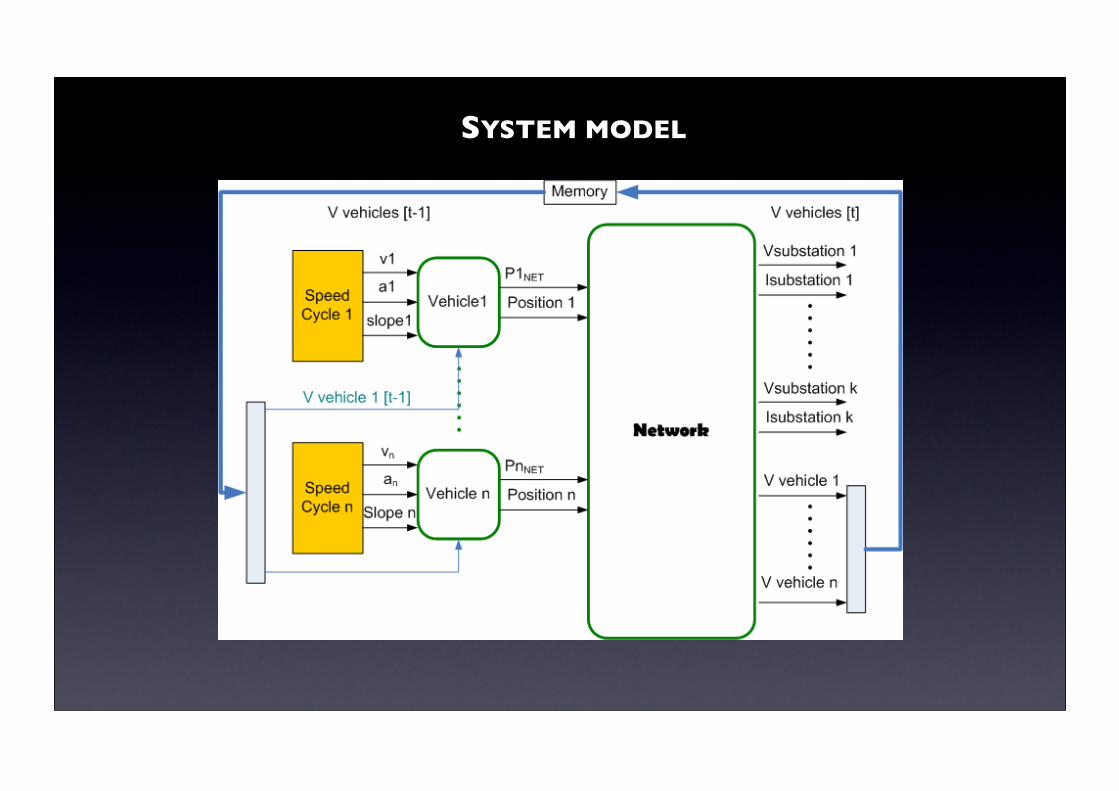
‘Effect-cause’ model of vehicles, network and stationary ESS
MODEL DESCRIPTION

‘Effect-cause’ model of vehicles, network and stationary ESS
Vehicles driving cycle
MODEL DESCRIPTION

‘Effect-cause’ model of vehicles, network and stationary ESS
Vehicles driving cycle
Vehicles power
MODEL DESCRIPTION

‘Effect-cause’ model of vehicles, network and stationary ESS
Vehicles driving cycle
Vehicles power
Substations power
MODEL DESCRIPTION

‘Effect-cause’ model of vehicles, network and stationary ESS
Vehicles driving cycle
Vehicles power
Substations power
Network voltage
MODEL DESCRIPTION

‘Effect-cause’ model of vehicles, network and stationary ESS
Vehicles driving cycle
Vehicles power
Substations power
ESS power
Network voltage
ESS SoC
MODEL DESCRIPTION

Substations delivered energy [kWh] 1080
Traction energy (vehicles) [kWh] 1333
Braking energy regenerated (vehicles) [kWh] 336
Line losses [kWh] 82
Max. available braking energy (vehicles) [kWh] 615
Energy recuperation (E regen./ E traction) [%] 25Substation delivered energy [kWh] 744
Traction energy (vehicles) [kWh] 859
Braking energy regenerated (vehicles) [kWh] 159
Line losses [kWh] 43
Max. available braking power (vehicles) [kWh] 392
Energy recuperation (E regen./ E traction) [%] 18
Substation delivered energy [kWh] 235
Traction energy (vehicles) [kWh] 246
Braking energy regenerated (vehicles) [kWh] 18
Line losses [kWh] 7
Max. available braking power (vehicles) [kWh] 115
Energy recuperation (E regen./ E traction) [%] 7
Peak time
Night and Weekend
Off-peak
SIMULATION RESULTS: CONVENTIONAL VEHICLES

Small Medium
Cells: C=1500F, Vmax= 2.5VConfiguration: 10 strings x 232 cells in seriesUsable energy: 2.26 kWhMax Voltage: 580 VCells weight: 742kg
Cells: C=3000F, Vmax= 2.7VConfiguration: 10 strings x 232 cells in seriesUsable energy: 4.53 kWhMax Voltage: 580 VCells weight: 1275 kg
Large Extra large
Cells: C=3000F, Vmax= 2.7VConfiguration: 15 strings x 232 cells in seriesUsable energy: 6.79 kWhMax Voltage: 580 VCells weight: 1914 kg
Cells: C=3000F, Vmax= 2.7VConfiguration: 20 strings x 232 cells in seriesUsable energy: 9,06 kWhMax Voltage: 580 VCells weight: 2552 kg
ENERGY STORAGE SYSTEM CONFIGURATIONS

ENERGY SAVINGS AT PEAK TIME

ENERGY SAVINGS AT OFF-PEAK TIME
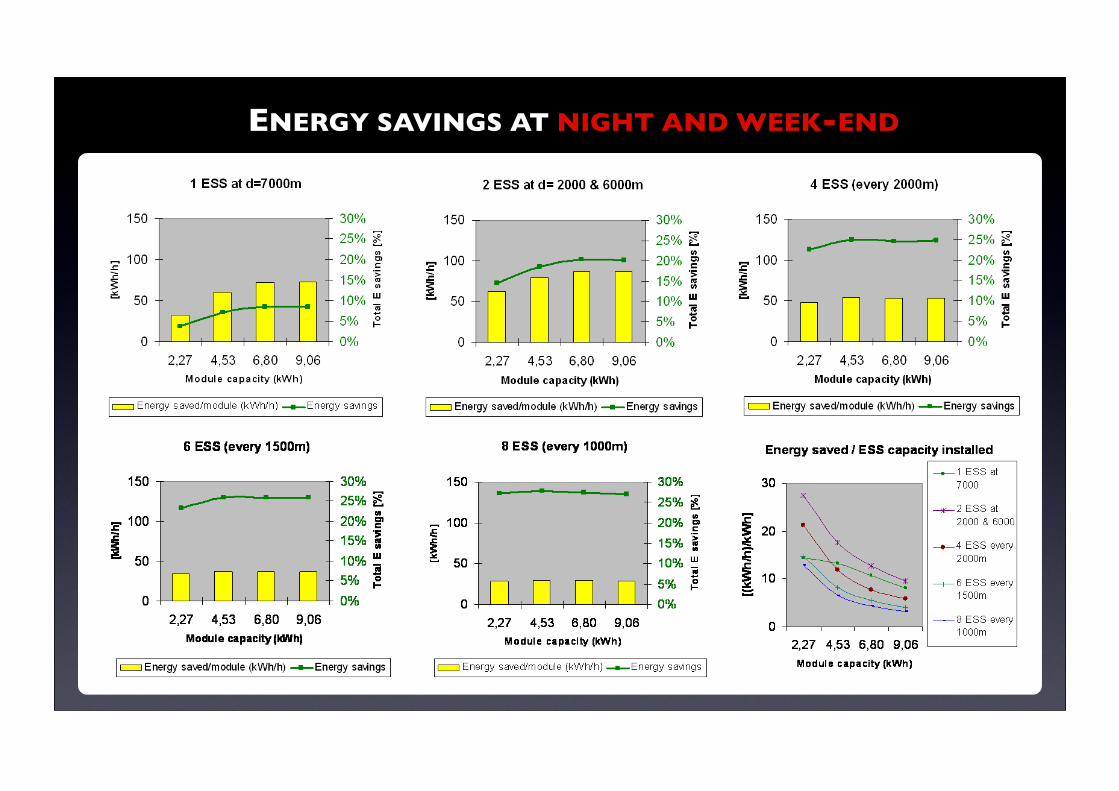
ENERGY SAVINGS AT NIGHT AND WEEK-END
• High impact of ESS size and line positionning
• Savings up to 11% and 25% depending on trafic scenarios
• ESS size around 2-4 kWh and distribution every 1500-2000m seems to be the best trade-off solution for this case study
• Line losses remain unaltered
• The chosen strategy focuses on energy savings and does not produce any benefits for the network voltage (voltage drops avoidance)
ENERGY SAVINGS CONCLUSION

InvestmentInstallation
Maintenance Insurance
Energy savings
Emissions reduction
Less infrastructure
BENEFITS VS COSTS

PARAMETERS AND SCENARIOS
• Scenario 1
- 4 ESS on the line spread every 2000 meters
- small-size modules
• Scenario 2
- 4 ESS on the line spread every 2000 meters
- medium-size modules
• Scenario 3
- 6 ESS on the line spread every 1500 meters
- small-size modules
• Scenario 4
- 6 ESS on the line spread every 1500 meters
- medium-size modules

Energy savings
• In this case, energy savings are measured on an hourly basis (kWh/h)
• For each traffic condition, the number of operating hours during one year were calculated based on the timetables
LIFETIME BENEFIT ANALYSIS

Energy savings
• Results show a reduction of 1.800 MWh up to 2.800 MWh annually for the whole metro line depending on the chosen scenarios
LIFETIME BENEFIT ANALYSIS

Energy savings
• Results show a reduction of 1.800 MWh up to 2.800 MWh annually for the whole metro line depending on the chosen scenarios
LIFETIME BENEFIT ANALYSIS
Energy savings benefits (lifecycle approach)
0,00 €
1 000 000,00 €
2 000 000,00 €
3 000 000,00 €
4 000 000,00 €
5 000 000,00 €
6 000 000,00 €
7 000 000,00 €
8 000 000,00 €
0% 50% 100% 200%
Energy price increase (baseline=74€)
En
erg
y s
avin
gs
ben
efi
ts
Scenario 1 (4 small-size ESS every2000m)
Scenario 2 (4 medium-size ESS every2000m)
Scenario 3 (6 small-size ESS every1500m)
Scenario 4 (6 medium-size ESS every1500m)

Air pollutants reduction
• Results show a cut of 423 up to 666 tons of CO2 annually and important reduction of the other air pollutants
LIFETIME BENEFIT ANALYSIS

Air pollutants reduction
• Results show a cut of 423 up to 666 tons of CO2 annually and important reduction of the other air pollutants
LIFETIME BENEFIT ANALYSIS
Valuation of environmental benefits (lifecycle approach)
0,00 €
500 000,00 €
1 000 000,00 €
1 500 000,00 €
2 000 000,00 €
2 500 000,00 €
11,65 € 18,66 € 29,18 € 47,87 €
Environmental effects monetary values (€/MWh)
En
vir
on
men
tal
ben
efi
ts m
on
eti
zati
on
Scenario 1 (4 small-size ESS every2000m)
Scenario 2 (4 medium-size ESS every2000m)
Scenario 3 (6 small-size ESS every1500m)
Scenario 4 (6 medium-size ESS every1500m)

LIFETIME COSTS ANALYSIS
• This table shows the price only for one system but several systems must be installed along the line

Energy savings + environmental benefits
0,00 €
1 000 000,00 €
2 000 000,00 €
3 000 000,00 €
4 000 000,00 €
5 000 000,00 €
6 000 000,00 €
7 000 000,00 €
8 000 000,00 €
9 000 000,00 €
10 000 000,00 €
Pessimistic Average low Average high Optimistic
Scenarios
To
tal b
en
efi
ts
Scenario 1 (4 small-size ESSevery 2000m)Scenario 2 (4 medium-size ESSevery 2000m)Scenario 3 (6 small-size ESSevery 1500m)Scenario 4 (6 medium-size ESSevery 1500m)Scenario 1 (prototype)
Scenario 2 (prototype)
Scenario 3 (prototype)
Scenario 4 (prototype)
BENEFITS VS COSTS

COST-BENEFIT ANALYSIS: SCENARIO 2 (PROTOTYPE)

CBA: SENSITIVITY ANALYSIS
• The Net Present Value appears positive in most cases which indicates that benefits overcome the costs

• The use of stationary energy storage systems on the metro network offers consequent energy savings and emissions reduction
• Even in the case of an energy prices stabilization, investing in stationary energy storage solutions for the Brussels metro network seems profitable
• Scenario 2 seems the best option and consists in installing a medium-size module in four substations spread every 2000 metres.
• The main advantage of the stationary application compared to the on-board is that the vehicles must not be retrofitted which is easier to implement by the transport company.
STATIONARY ESS FOR THE METRO NETWORK: CONCLUSION

CONCLUSION
• Significant energy consumption reduction
• Voltage drop compensation in weak distribution networks
• Potential investment reduction in infrastructure: substations, overhead lines,...
• A good way to fight against the energy price increase
ADVANTAGES OF ENERGY STORAGE SYSTEMS
OBSTACLES FOR A WIDE USE OF THE TECHNOLOGY
• High development costs due to a lack of standardization in the public transport network
• Difficult to retrofit existing vehicles

• A mobile system for the metro has been assessed and shows interesting results but seem almost impossible to implement on the vehicles due to the lack of room (more info on request)
• Information requested from STIB to consider:
- the benefits of having more vehicles without adding new substations- the economic impact of driving without overhead lines on small sections- the influence of reducing the electricity demand at peak time and benefit from better tariffs (avoid to go beyond some thresholds)
PROJECT PERSPECTIVES

More information and full report on
www.everest-project.net
THANK YOU FOR YOUR INTEREST !
YOUR FEEDBACK IS ESSENTIAL.


![Stib Driver Self Service V4[1]](https://img.pdfslide.us/doc/110x75/5592c3111a28abd70f8b464c/stib-driver-self-service-v41.jpg)