Embed Size (px)
Citation preview
City of Wanneroo March 2000
Quinns Beach Coastal Protection Works
Stage 3 Report
Design & Specifications
M P ROGERS & ASSOCIATES PTY LTD Coastal and Port Engineers
Report R078 Rev 0
City of Wanneroo March 2000
Quinns Beach Coastal Protection Works
Stage 3 Report
Design & Specifications
Job J248 Report R078 Rev 0
Prepared by: ___________________ Date: _________
Reviewed by: ___________________ Date: _________
Approved by: ___________________ Date: _________
M P ROGERS & ASSOCIATES PTY LTD Consulting Engineers Specialising in Coastal, Ocean & Marine Projects
3/135 Main Street Osborne Park, Western Australia, 6017 Telephone: +618 9444 4045 Facsimile: +618 9444 4341
Email: [email protected]
Limitations of Report
M P ROGERS & ASSOCIATES Quinns Beach Coastal Protection Works
Report R078 Rev 0, Page (i)
This report has been prepared for use by the Client in accordance with the
agreement between the Client and M P Rogers & Associates Pty Ltd which
includes constraints on the scope, budget and time available for the services.
The services have been completed with the degree of skill, care and
diligence normally exercised by members of the engineering profession
performing services of a similar nature, in accordance with the ethics of the
engineering profession. No other warranty, expressed or implied, is made
as to the accuracy of the data and professional advice included in this report.
This report has not been prepared for use by parties other than the Client
and its consulting advisers. It may not contain sufficient information for the
purposes of other parties or for other uses.
M P Rogers & Associates Pty Ltd (ACN 062 681 252) takes no
responsibility for the completeness or form of any subsequent copies of this
report. Copying this report without the permission of the client or
M P Rogers & Associates Pty Ltd is not permitted.
Executive Summary
M P ROGERS & ASSOCIATES Quinns Beach Coastal Protection Works
Report R078 Rev 0, Page (ii)
The City of Wanneroo (Wanneroo) has been involved in combating coastal
erosion at Quinns Rocks since 1970. Presently, coastal erosion is
threatening to undermine the car park located to the north of Quinns Cusp,
and there are also concerns regarding the ongoing stability of the beach to
the south and adjacent Ocean Drive. The aim of this study is to provide a
comprehensive evaluation of suitable coastal protection options for Quinns.
The study is defined by the following three stages:
Stage 1 The review of existing data and technical reports, the calculation of
appropriate design criteria for coastal protection options, and the
preliminary review of coastal protection options.
Stage 2 A comprehensive review of suitable coastal protection options.
Stage 3 The final design and cost estimate of the coastal management option
nominated by Wanneroo.
This report documents Stage 3 of the Study and contains the design review,
cost estimates and contract specification for the construction of a seawall
and the placement of sand renourishment.
The purpose of the seawall is to provide increased protection to the Quinns
northern beach car park and Fredrick Stubbs Grove during storm events.
However, it should be noted that the construction of the seawall is not
expected to significantly reduce the net losses of sediment from the area,
and an average annual renourishment requirement of 7,000 m3/year
(9,000 m3/year in the truck) is expected. Without sand renourishment the
beach will be lost and excessive wave action will damage and undermine
the seawall.
Contents
M P ROGERS & ASSOCIATES Quinns Beach Coastal Protection Works Report R078 Rev 0, Page (iii)
Executive Summary (ii)
1. Introduction 1
1.1 General 1
1.2 Study Area 1
1.3 Results of Stage 1 2
1.4 Results of Stage 2 3
2. Seawall Design 6
2.1 Coastal Processes 6
2.2 Seawall Design Criteria 6
2.3 Seawall Design Review 7
2.4 Boat Ramp 8
3. Renourishment Design 9
3.1 Southern Beach 9
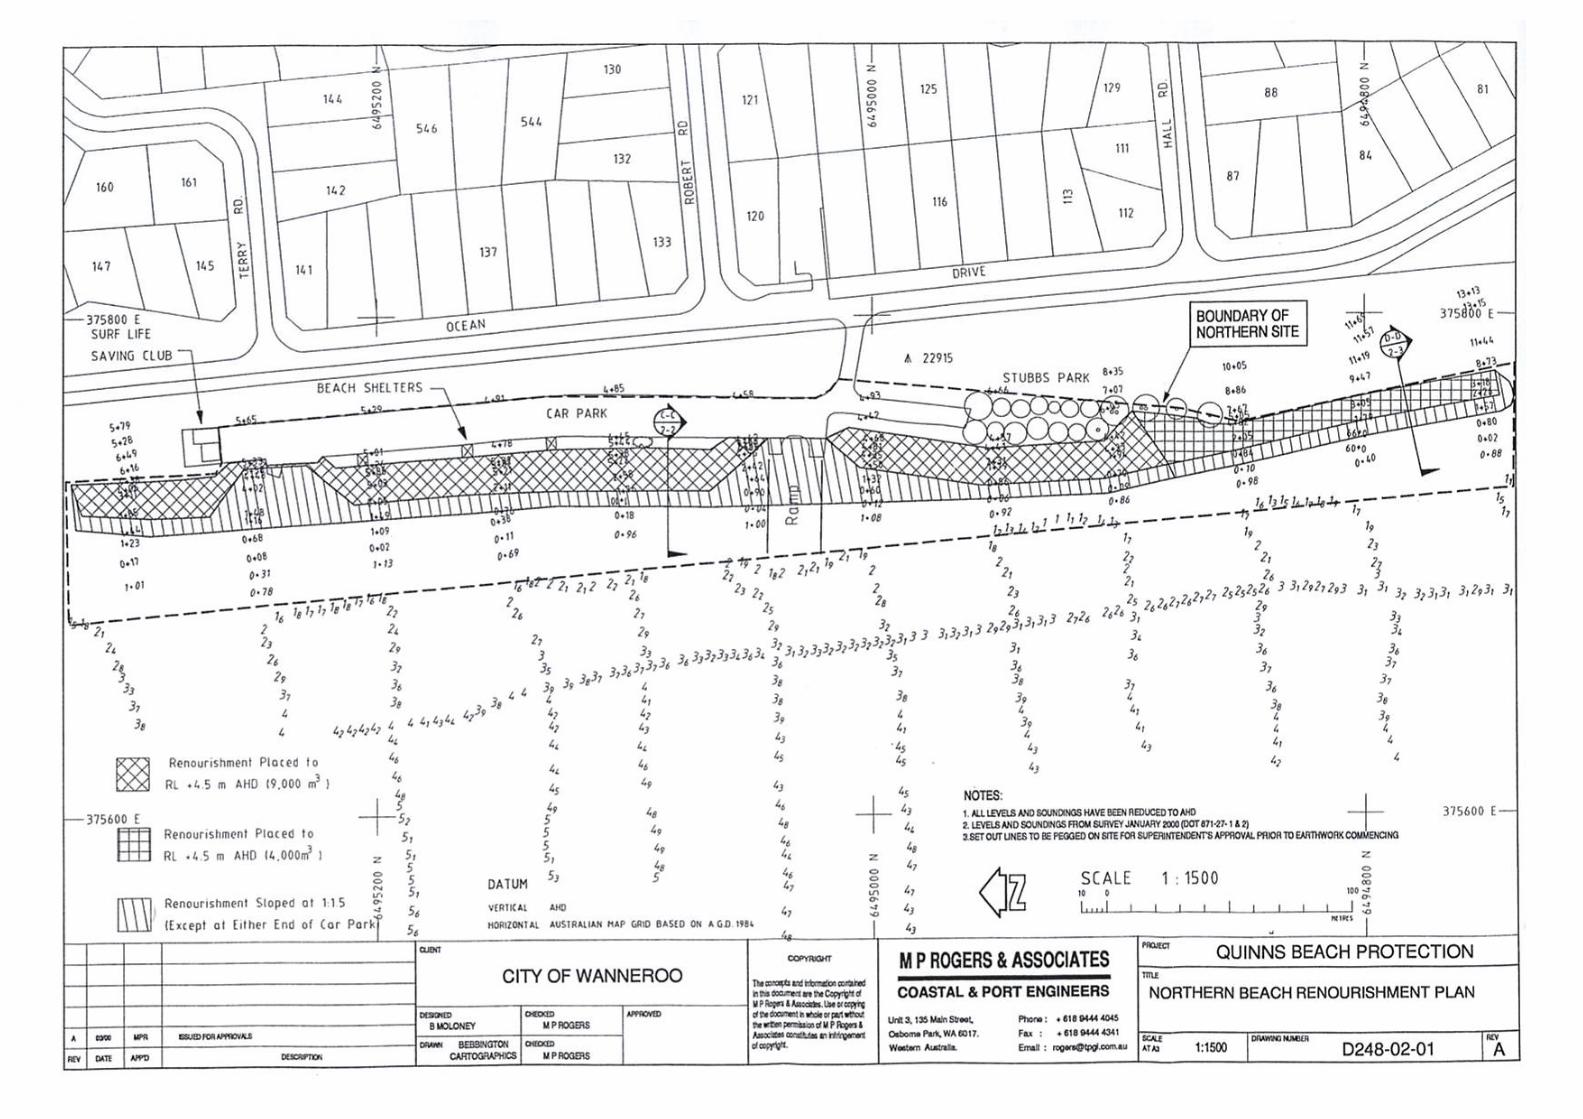
3.2 Northern Beach 9
3.3 Quality of Sand for Renourishment 10
4. Cost Estimates for Designed Works 13
5. References 15
Figures 16
Appendix A - Specifications 18
Appendix B - Design Drawings 39
1. Introduction
M P ROGERS & ASSOCIATES Quinns Beach Coastal Protection Works Report R078 Rev 0, Page 1
1.1 General
The City of Wanneroo has been involved in combating coastal erosion at
Quinns Rocks since 1970 when a seawall was constructed to protect the
parking lot and toilet block located at the end of Quinns Road. Additional
protection works were completed in 1977, with a rubble headland built to
the immediate south of Quinns Cusp to encourage accretion along the
Southern Beach. Presently, coastal erosion is threatening to undermine the
car park located to the north of the cusp, and there are also concerns
regarding the ongoing stability of the Southern Beach and adjacent Ocean
Drive (refer to Figure 1.1).
In 1997, a study of the coastal processes at Quinns was prepared by
Tremarfon (1997) which recommended a combination of sand
renourishment and retreat in the short term, with the construction of
seawalls at defined locations in the longer term if renourishment proved
ineffective and the foreshore continued to recede. The option of seawalls
was reviewed by the Department of Transport (Transport) and concerns
were raised regarding the potentially adverse effects and likely costs.
The present study was commissioned by the Shire of Wanneroo (Wanneroo)
to provide a comprehensive evaluation of the coastal protection options
available. These options include renourishment, seawall construction,
groynes / headlands and breakwaters. The study is defined by the following
three stages:
Stage 1 The review of existing data and technical reports, the calculation of
appropriate design criteria for coastal protection options, and the
preliminary review of coastal protection options.
Stage 2 A comprehensive review of suitable coastal protection options.
Stage 3 The final design and cost estimate of the coastal management option
nominated by Wanneroo.
The results of the Stage 1 and Stage 2 investigations were presented in
Rogers & Associates (1999a & 1999b), and the results of Stage 3 are
presented in this report.
1.2 Study Area
Quinns Beach is located approximately 35 km north of Perth, Western
M P ROGERS & ASSOCIATES Quinns Beach Coastal Protection Works
Report R078 Rev 0, Page 2
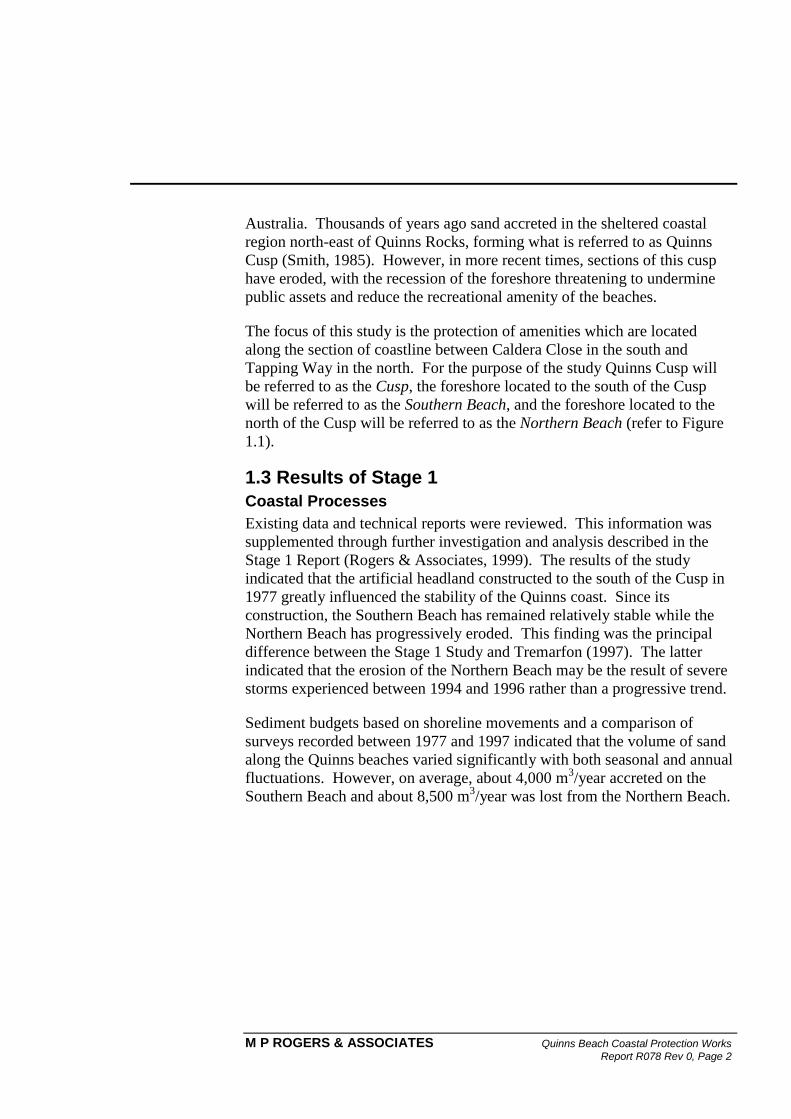
Australia. Thousands of years ago sand accreted in the sheltered coastal
region north-east of Quinns Rocks, forming what is referred to as Quinns
Cusp (Smith, 1985). However, in more recent times, sections of this cusp
have eroded, with the recession of the foreshore threatening to undermine
public assets and reduce the recreational amenity of the beaches.
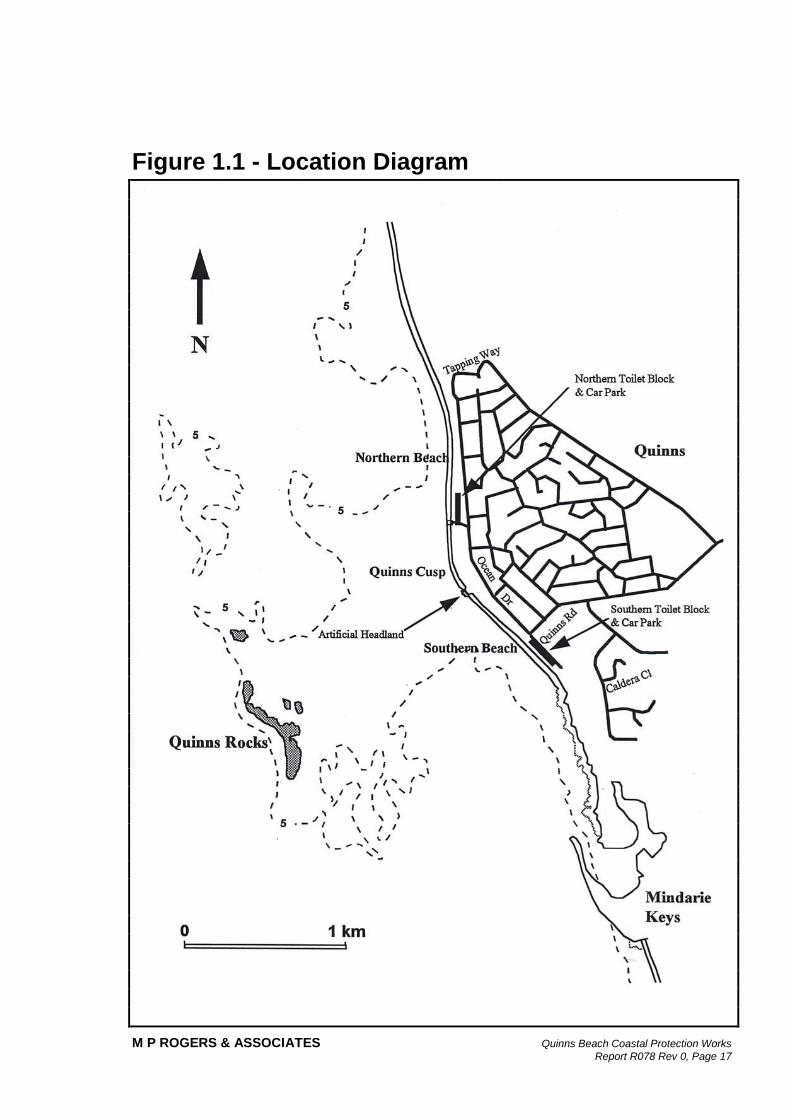
The focus of this study is the protection of amenities which are located
along the section of coastline between Caldera Close in the south and
Tapping Way in the north. For the purpose of the study Quinns Cusp will
be referred to as the Cusp, the foreshore located to the south of the Cusp
will be referred to as the Southern Beach, and the foreshore located to the
north of the Cusp will be referred to as the Northern Beach (refer to Figure
1.1).
1.3 Results of Stage 1
Coastal Processes
Existing data and technical reports were reviewed. This information was
supplemented through further investigation and analysis described in the
Stage 1 Report (Rogers & Associates, 1999). The results of the study
indicated that the artificial headland constructed to the south of the Cusp in
1977 greatly influenced the stability of the Quinns coast. Since its
construction, the Southern Beach has remained relatively stable while the
Northern Beach has progressively eroded. This finding was the principal
difference between the Stage 1 Study and Tremarfon (1997). The latter
indicated that the erosion of the Northern Beach may be the result of severe
storms experienced between 1994 and 1996 rather than a progressive trend.
Sediment budgets based on shoreline movements and a comparison of
surveys recorded between 1977 and 1997 indicated that the volume of sand
along the Quinns beaches varied significantly with both seasonal and annual
fluctuations. However, on average, about 4,000 m3/year accreted on the
Southern Beach and about 8,500 m3/year was lost from the Northern Beach.
M P ROGERS & ASSOCIATES Quinns Beach Coastal Protection Works
Report R078 Rev 0, Page 3
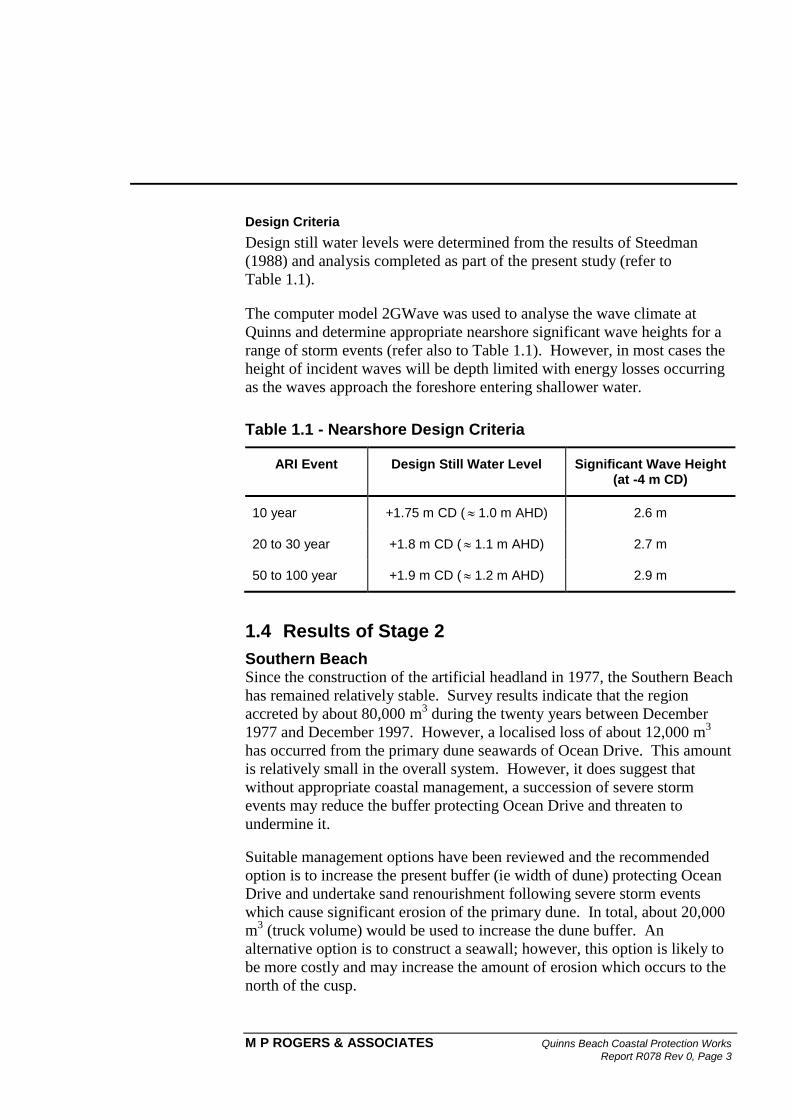
Design Criteria
Design still water levels were determined from the results of Steedman
(1988) and analysis completed as part of the present study (refer to
Table 1.1).
The computer model 2GWave was used to analyse the wave climate at
Quinns and determine appropriate nearshore significant wave heights for a
range of storm events (refer also to Table 1.1). However, in most cases the
height of incident waves will be depth limited with energy losses occurring
as the waves approach the foreshore entering shallower water.
Table 1.1 - Nearshore Design Criteria
ARI Event Design Still Water Level Significant Wave Height (at -4 m CD)
10 year +1.75 m CD ( 1.0 m AHD) 2.6 m
20 to 30 year +1.8 m CD ( 1.1 m AHD) 2.7 m
50 to 100 year +1.9 m CD ( 1.2 m AHD) 2.9 m
1.4 Results of Stage 2
Southern Beach Since the construction of the artificial headland in 1977, the Southern Beach
has remained relatively stable. Survey results indicate that the region
accreted by about 80,000 m3 during the twenty years between December
1977 and December 1997. However, a localised loss of about 12,000 m3
has occurred from the primary dune seawards of Ocean Drive. This amount
is relatively small in the overall system. However, it does suggest that
without appropriate coastal management, a succession of severe storm
events may reduce the buffer protecting Ocean Drive and threaten to
undermine it.
Suitable management options have been reviewed and the recommended
option is to increase the present buffer (ie width of dune) protecting Ocean
Drive and undertake sand renourishment following severe storm events
which cause significant erosion of the primary dune. In total, about 20,000
m3 (truck volume) would be used to increase the dune buffer. An
alternative option is to construct a seawall; however, this option is likely to
be more costly and may increase the amount of erosion which occurs to the
north of the cusp.
M P ROGERS & ASSOCIATES Quinns Beach Coastal Protection Works
Report R078 Rev 0, Page 4
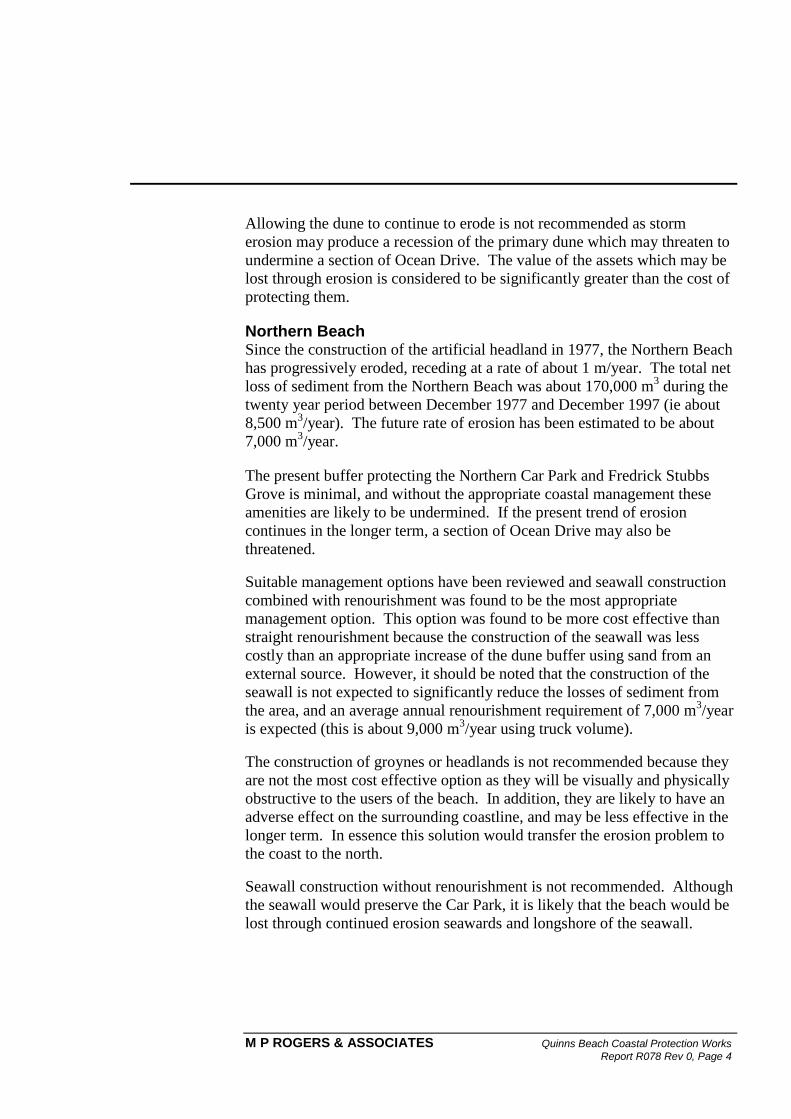
Allowing the dune to continue to erode is not recommended as storm
erosion may produce a recession of the primary dune which may threaten to
undermine a section of Ocean Drive. The value of the assets which may be
lost through erosion is considered to be significantly greater than the cost of
protecting them.
Northern Beach Since the construction of the artificial headland in 1977, the Northern Beach
has progressively eroded, receding at a rate of about 1 m/year. The total net
loss of sediment from the Northern Beach was about 170,000 m3 during the
twenty year period between December 1977 and December 1997 (ie about
8,500 m3/year). The future rate of erosion has been estimated to be about
7,000 m3/year.
The present buffer protecting the Northern Car Park and Fredrick Stubbs
Grove is minimal, and without the appropriate coastal management these
amenities are likely to be undermined. If the present trend of erosion
continues in the longer term, a section of Ocean Drive may also be
threatened.
Suitable management options have been reviewed and seawall construction
combined with renourishment was found to be the most appropriate
management option. This option was found to be more cost effective than
straight renourishment because the construction of the seawall was less
costly than an appropriate increase of the dune buffer using sand from an
external source. However, it should be noted that the construction of the
seawall is not expected to significantly reduce the losses of sediment from
the area, and an average annual renourishment requirement of 7,000 m3/year
is expected (this is about 9,000 m3/year using truck volume).
The construction of groynes or headlands is not recommended because they
are not the most cost effective option as they will be visually and physically
obstructive to the users of the beach. In addition, they are likely to have an
adverse effect on the surrounding coastline, and may be less effective in the
longer term. In essence this solution would transfer the erosion problem to
the coast to the north.
Seawall construction without renourishment is not recommended. Although
the seawall would preserve the Car Park, it is likely that the beach would be
lost through continued erosion seawards and longshore of the seawall.

M P ROGERS & ASSOCIATES Quinns Beach Coastal Protection Works
Report R078 Rev 0, Page 5
Allowing the erosion to continue (ie do nothing) is also not recommended.
Although the upper foreshore would continue to supply sand to the eroding
beach, access and other amenities would be lost, and in the longer term, a
section of Ocean Drive may be threatened.
2. Seawall Design
M P ROGERS & ASSOCIATES Quinns Beach Coastal Protection Works Report R078 Rev 0, Page 6
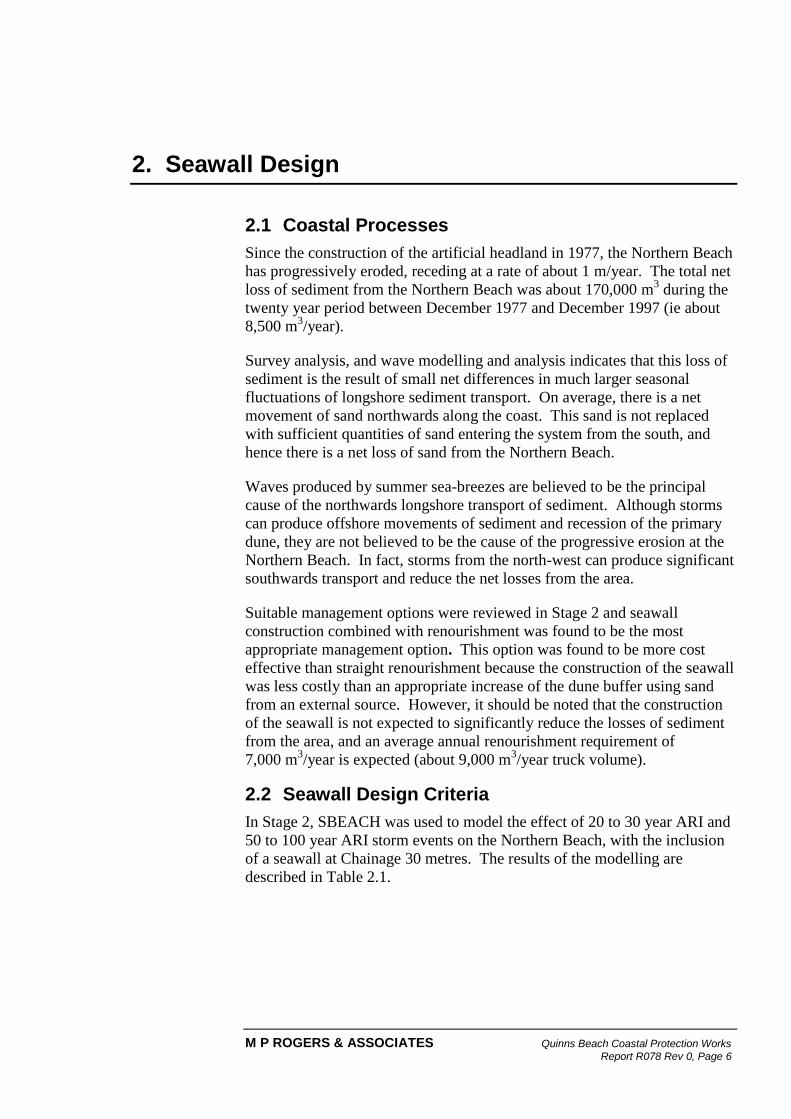
2.1 Coastal Processes
Since the construction of the artificial headland in 1977, the Northern Beach
has progressively eroded, receding at a rate of about 1 m/year. The total net
loss of sediment from the Northern Beach was about 170,000 m3 during the
twenty year period between December 1977 and December 1997 (ie about
8,500 m3/year).
Survey analysis, and wave modelling and analysis indicates that this loss of
sediment is the result of small net differences in much larger seasonal
fluctuations of longshore sediment transport. On average, there is a net
movement of sand northwards along the coast. This sand is not replaced
with sufficient quantities of sand entering the system from the south, and
hence there is a net loss of sand from the Northern Beach.
Waves produced by summer sea-breezes are believed to be the principal
cause of the northwards longshore transport of sediment. Although storms
can produce offshore movements of sediment and recession of the primary
dune, they are not believed to be the cause of the progressive erosion at the
Northern Beach. In fact, storms from the north-west can produce significant
southwards transport and reduce the net losses from the area.
Suitable management options were reviewed in Stage 2 and seawall
construction combined with renourishment was found to be the most
appropriate management option. This option was found to be more cost
effective than straight renourishment because the construction of the seawall
was less costly than an appropriate increase of the dune buffer using sand
from an external source. However, it should be noted that the construction
of the seawall is not expected to significantly reduce the losses of sediment
from the area, and an average annual renourishment requirement of
7,000 m3/year is expected (about 9,000 m
3/year truck volume).
2.2 Seawall Design Criteria
In Stage 2, SBEACH was used to model the effect of 20 to 30 year ARI and
50 to 100 year ARI storm events on the Northern Beach, with the inclusion
of a seawall at Chainage 30 metres. The results of the modelling are
described in Table 2.1.
M P ROGERS & ASSOCIATES Quinns Beach Coastal Protection Works
Report R078 Rev 0, Page 7
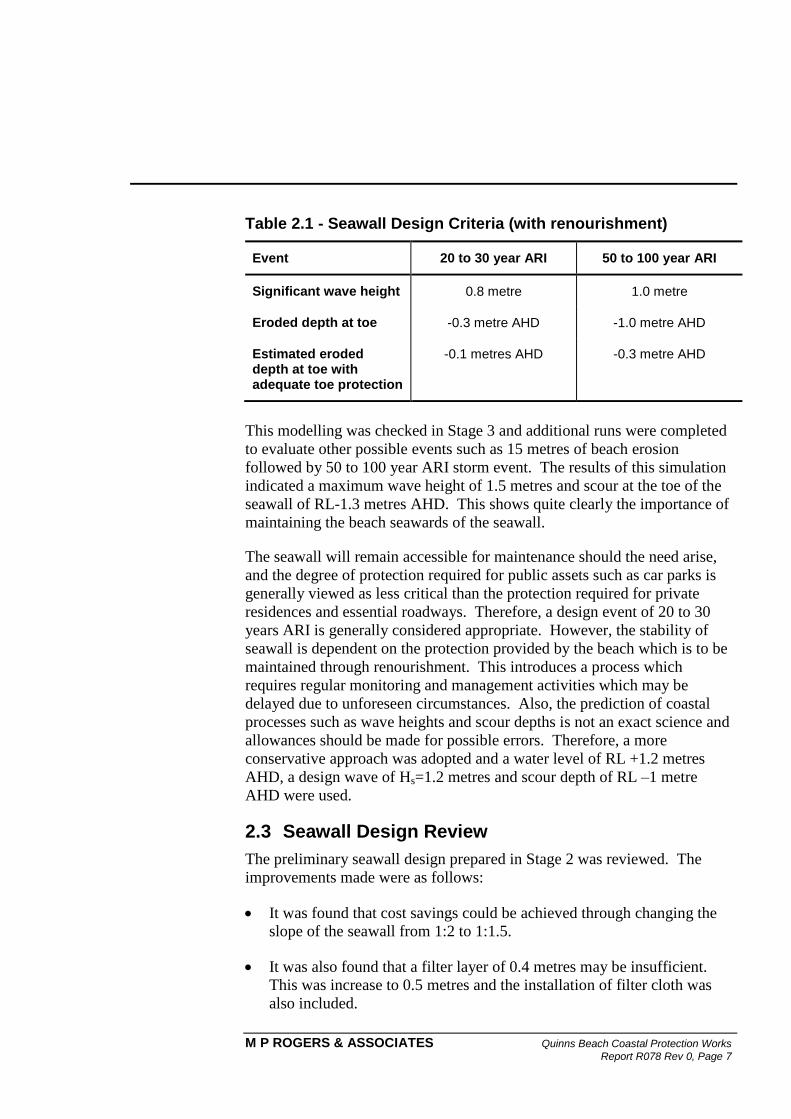
Table 2.1 - Seawall Design Criteria (with renourishment)
Event 20 to 30 year ARI 50 to 100 year ARI
Significant wave height 0.8 metre 1.0 metre
Eroded depth at toe -0.3 metre AHD -1.0 metre AHD
Estimated eroded depth at toe with adequate toe protection
-0.1 metres AHD -0.3 metre AHD
This modelling was checked in Stage 3 and additional runs were completed
to evaluate other possible events such as 15 metres of beach erosion
followed by 50 to 100 year ARI storm event. The results of this simulation
indicated a maximum wave height of 1.5 metres and scour at the toe of the
seawall of RL-1.3 metres AHD. This shows quite clearly the importance of
maintaining the beach seawards of the seawall.
The seawall will remain accessible for maintenance should the need arise,
and the degree of protection required for public assets such as car parks is
generally viewed as less critical than the protection required for private
residences and essential roadways. Therefore, a design event of 20 to 30
years ARI is generally considered appropriate. However, the stability of
seawall is dependent on the protection provided by the beach which is to be
maintained through renourishment. This introduces a process which
requires regular monitoring and management activities which may be
delayed due to unforeseen circumstances. Also, the prediction of coastal
processes such as wave heights and scour depths is not an exact science and
allowances should be made for possible errors. Therefore, a more
conservative approach was adopted and a water level of RL +1.2 metres
AHD, a design wave of Hs=1.2 metres and scour depth of RL –1 metre
AHD were used.
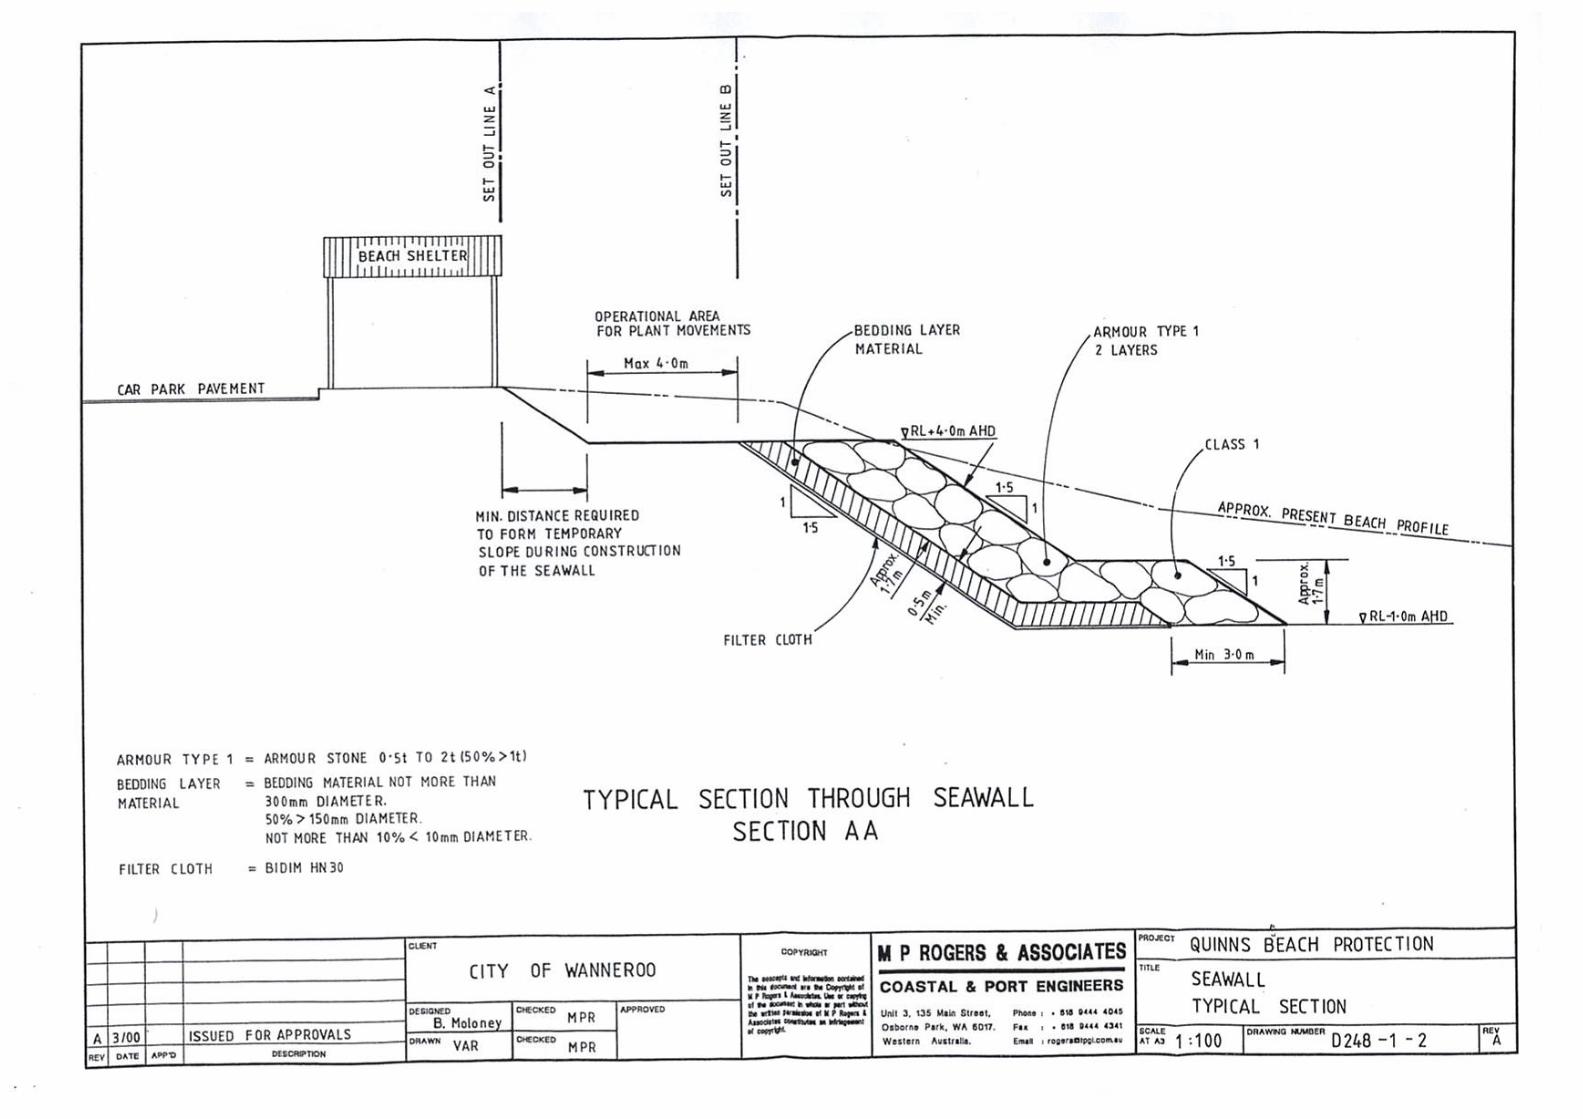
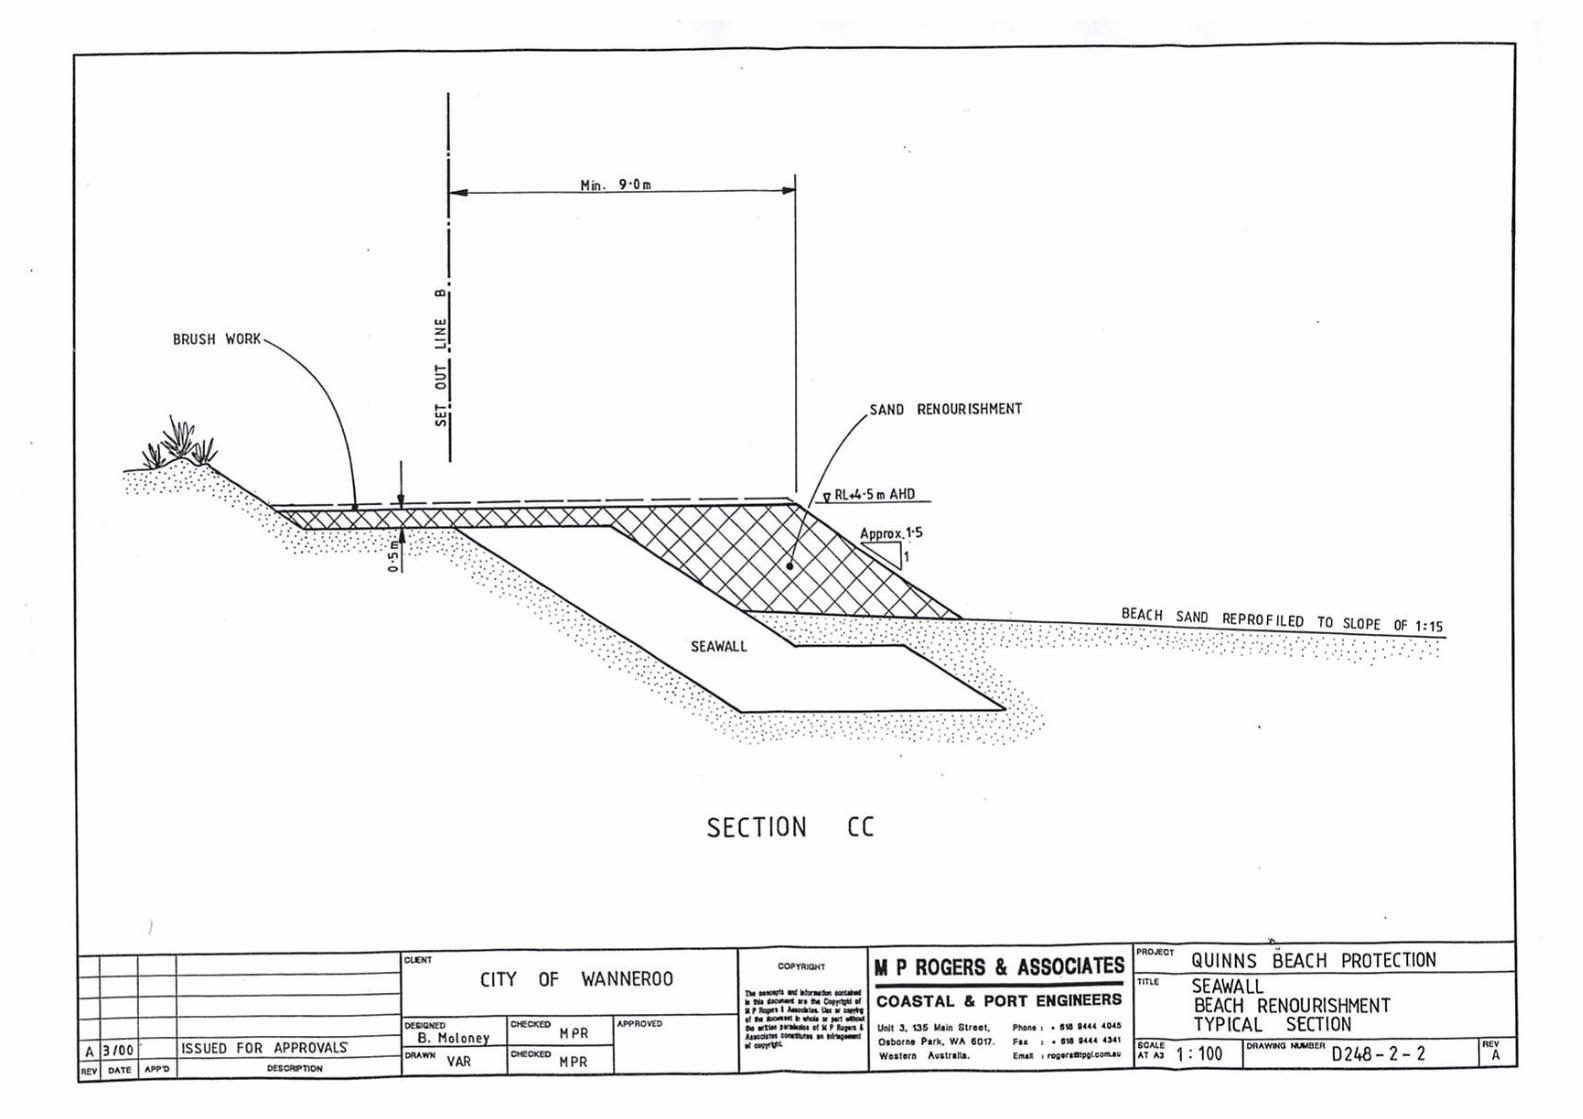
2.3 Seawall Design Review
The preliminary seawall design prepared in Stage 2 was reviewed. The
improvements made were as follows:
It was found that cost savings could be achieved through changing the
slope of the seawall from 1:2 to 1:1.5.
It was also found that a filter layer of 0.4 metres may be insufficient.
This was increase to 0.5 metres and the installation of filter cloth was
also included.
M P ROGERS & ASSOCIATES Quinns Beach Coastal Protection Works
Report R078 Rev 0, Page 8
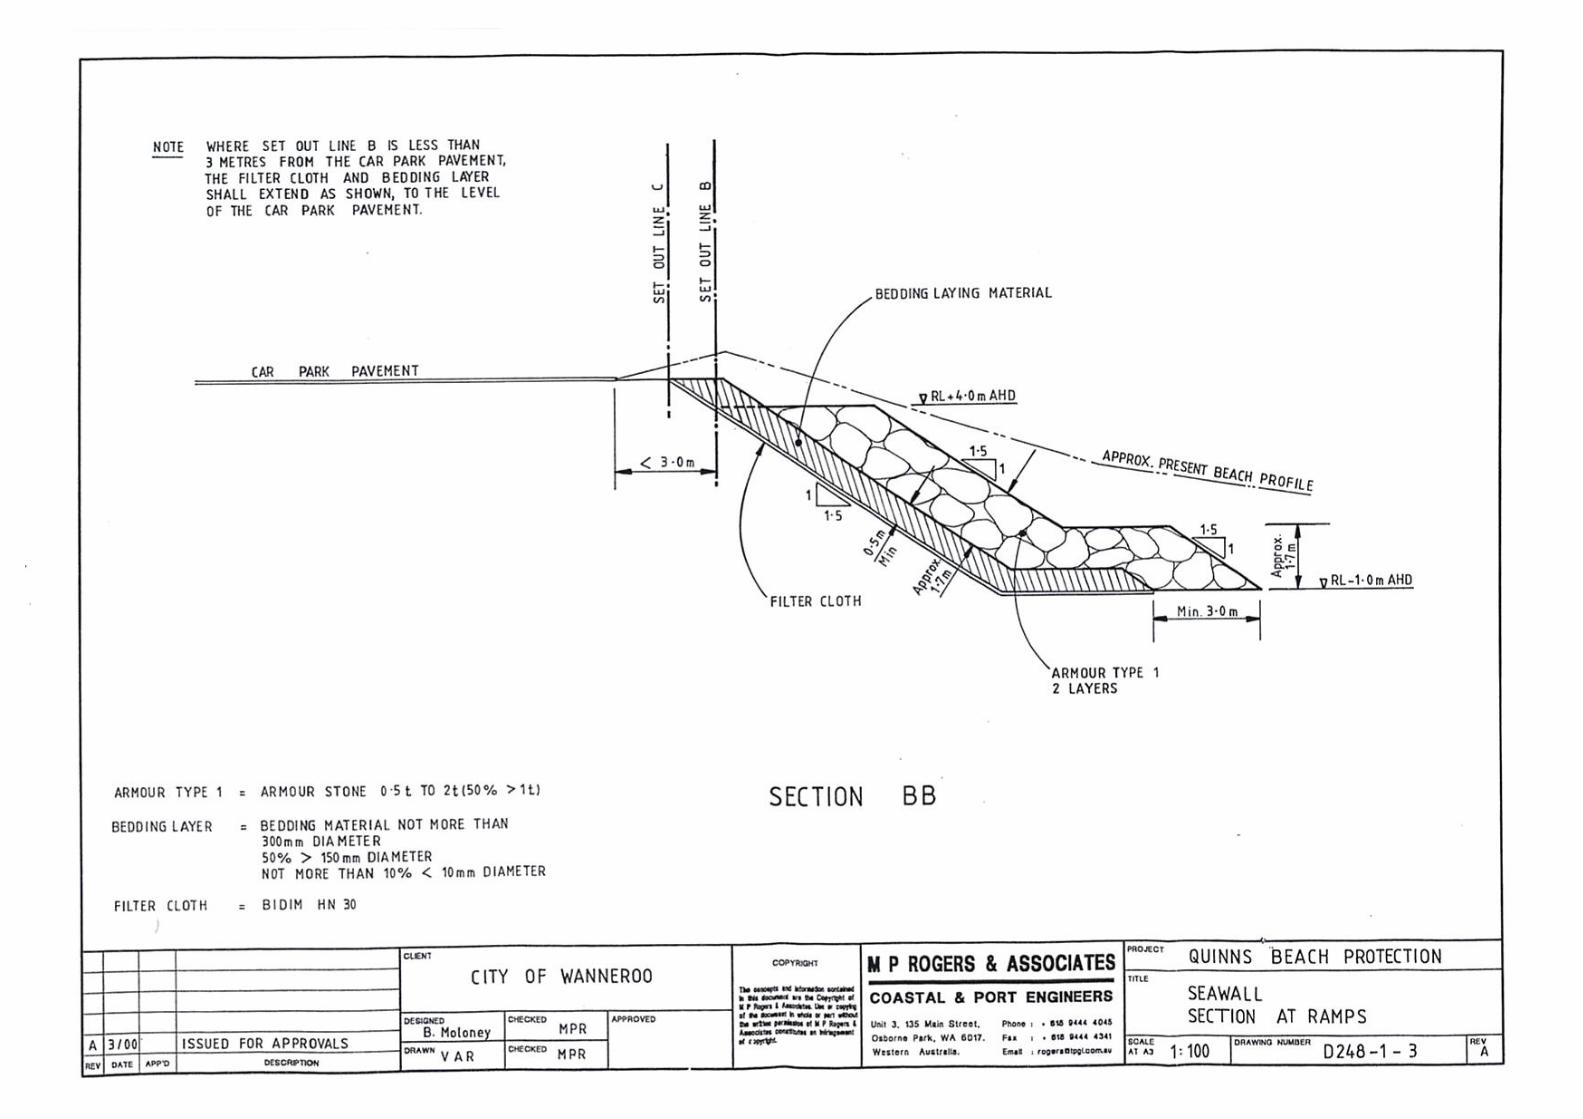
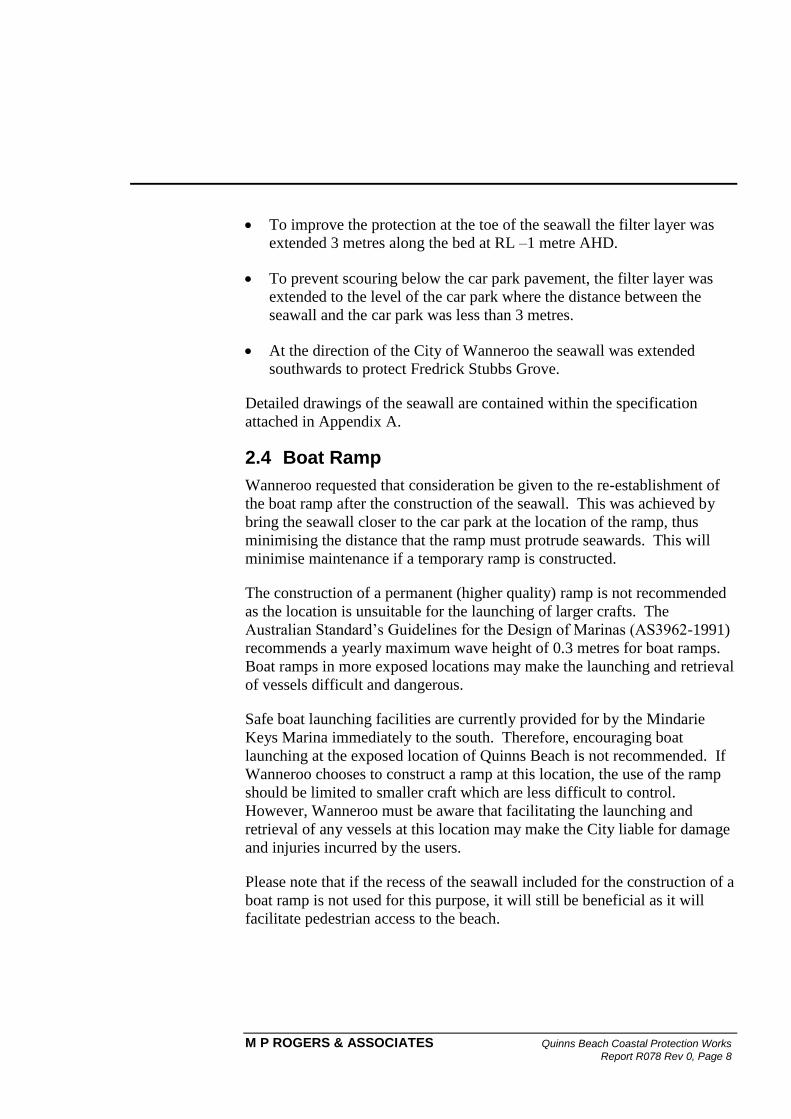
To improve the protection at the toe of the seawall the filter layer was
extended 3 metres along the bed at RL –1 metre AHD.
To prevent scouring below the car park pavement, the filter layer was
extended to the level of the car park where the distance between the
seawall and the car park was less than 3 metres.
At the direction of the City of Wanneroo the seawall was extended
southwards to protect Fredrick Stubbs Grove.
Detailed drawings of the seawall are contained within the specification
attached in Appendix A.
2.4 Boat Ramp
Wanneroo requested that consideration be given to the re-establishment of
the boat ramp after the construction of the seawall. This was achieved by
bring the seawall closer to the car park at the location of the ramp, thus
minimising the distance that the ramp must protrude seawards. This will
minimise maintenance if a temporary ramp is constructed.
The construction of a permanent (higher quality) ramp is not recommended
as the location is unsuitable for the launching of larger crafts. The
Australian Standard’s Guidelines for the Design of Marinas (AS3962-1991)
recommends a yearly maximum wave height of 0.3 metres for boat ramps.
Boat ramps in more exposed locations may make the launching and retrieval
of vessels difficult and dangerous.
Safe boat launching facilities are currently provided for by the Mindarie
Keys Marina immediately to the south. Therefore, encouraging boat
launching at the exposed location of Quinns Beach is not recommended. If
Wanneroo chooses to construct a ramp at this location, the use of the ramp
should be limited to smaller craft which are less difficult to control.
However, Wanneroo must be aware that facilitating the launching and
retrieval of any vessels at this location may make the City liable for damage
and injuries incurred by the users.
Please note that if the recess of the seawall included for the construction of a
boat ramp is not used for this purpose, it will still be beneficial as it will
facilitate pedestrian access to the beach.
3. Renourishment Design
M P ROGERS & ASSOCIATES Quinns Beach Coastal Protection Works Report R078 Rev 0, Page 9
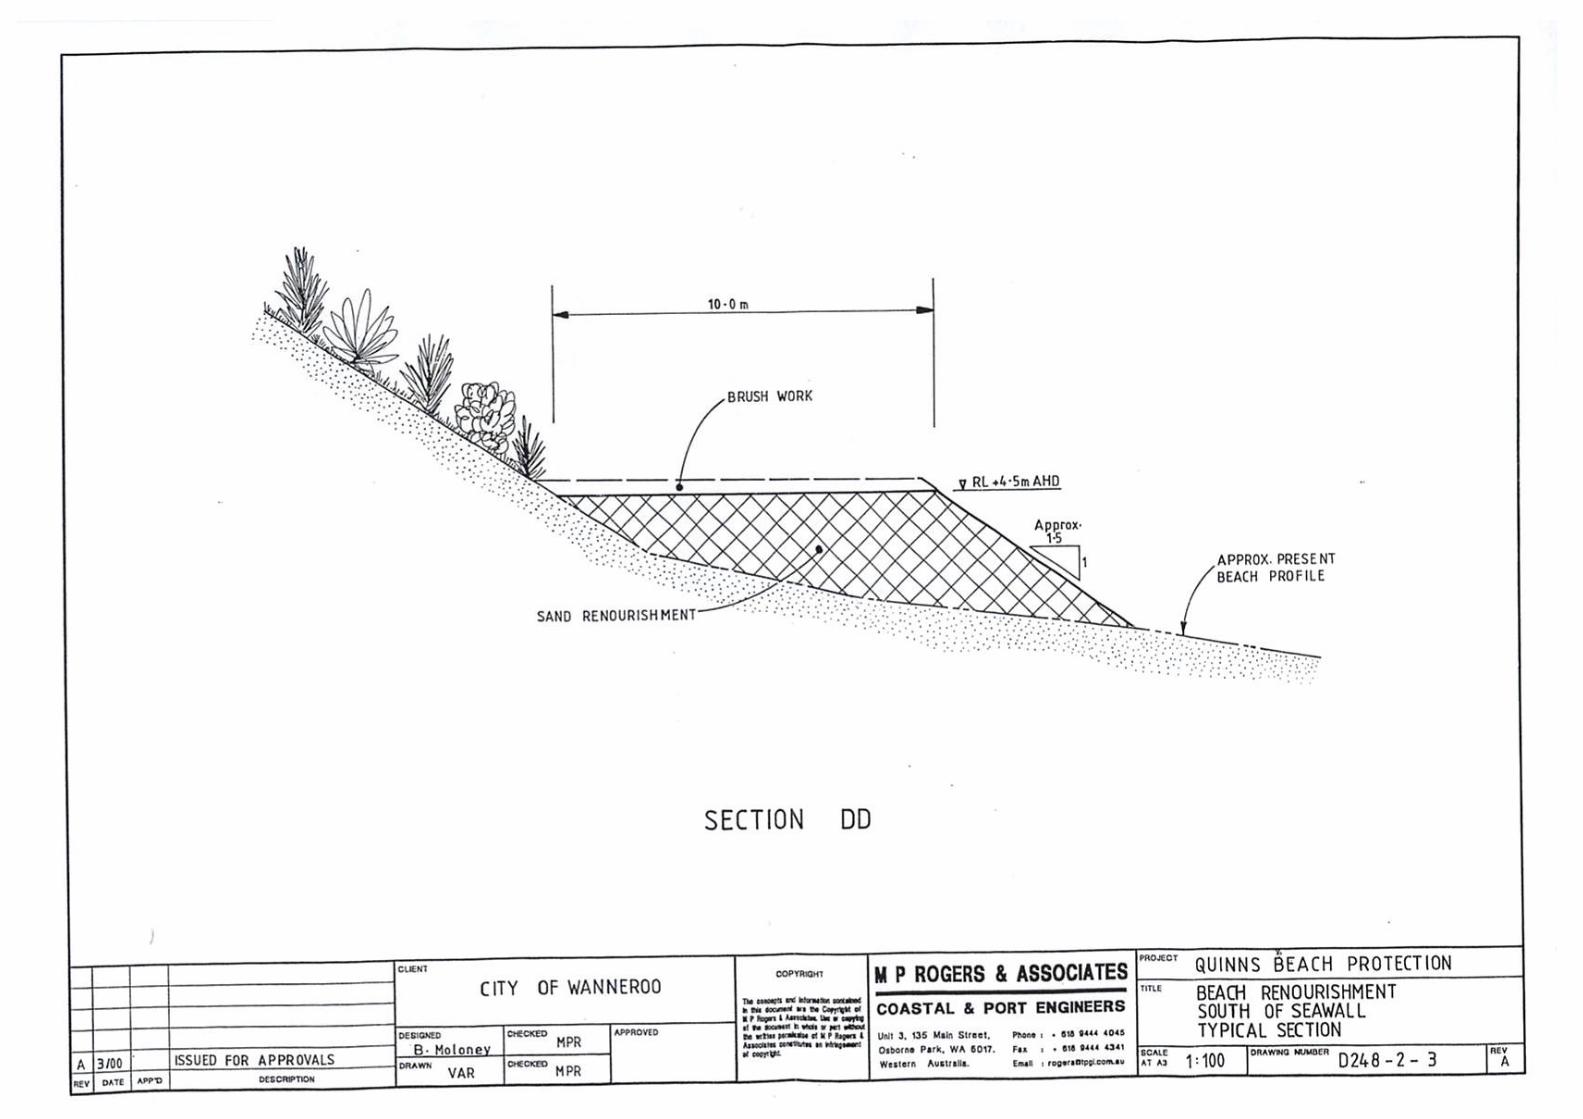
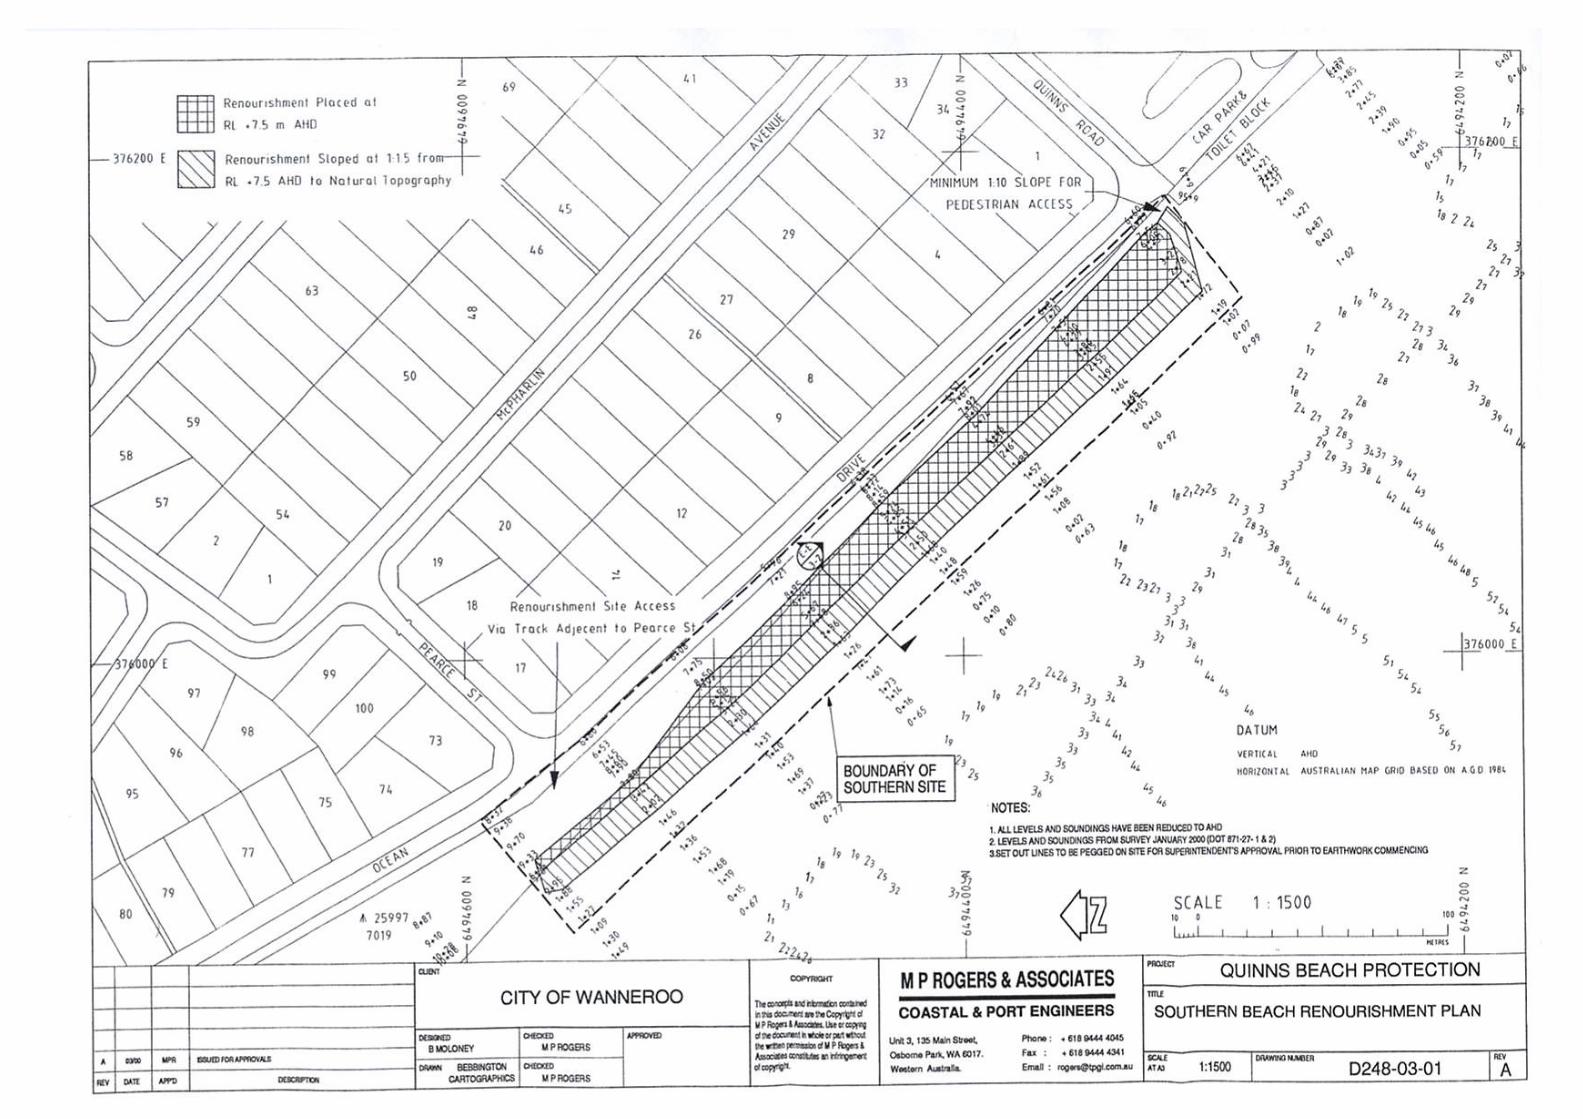
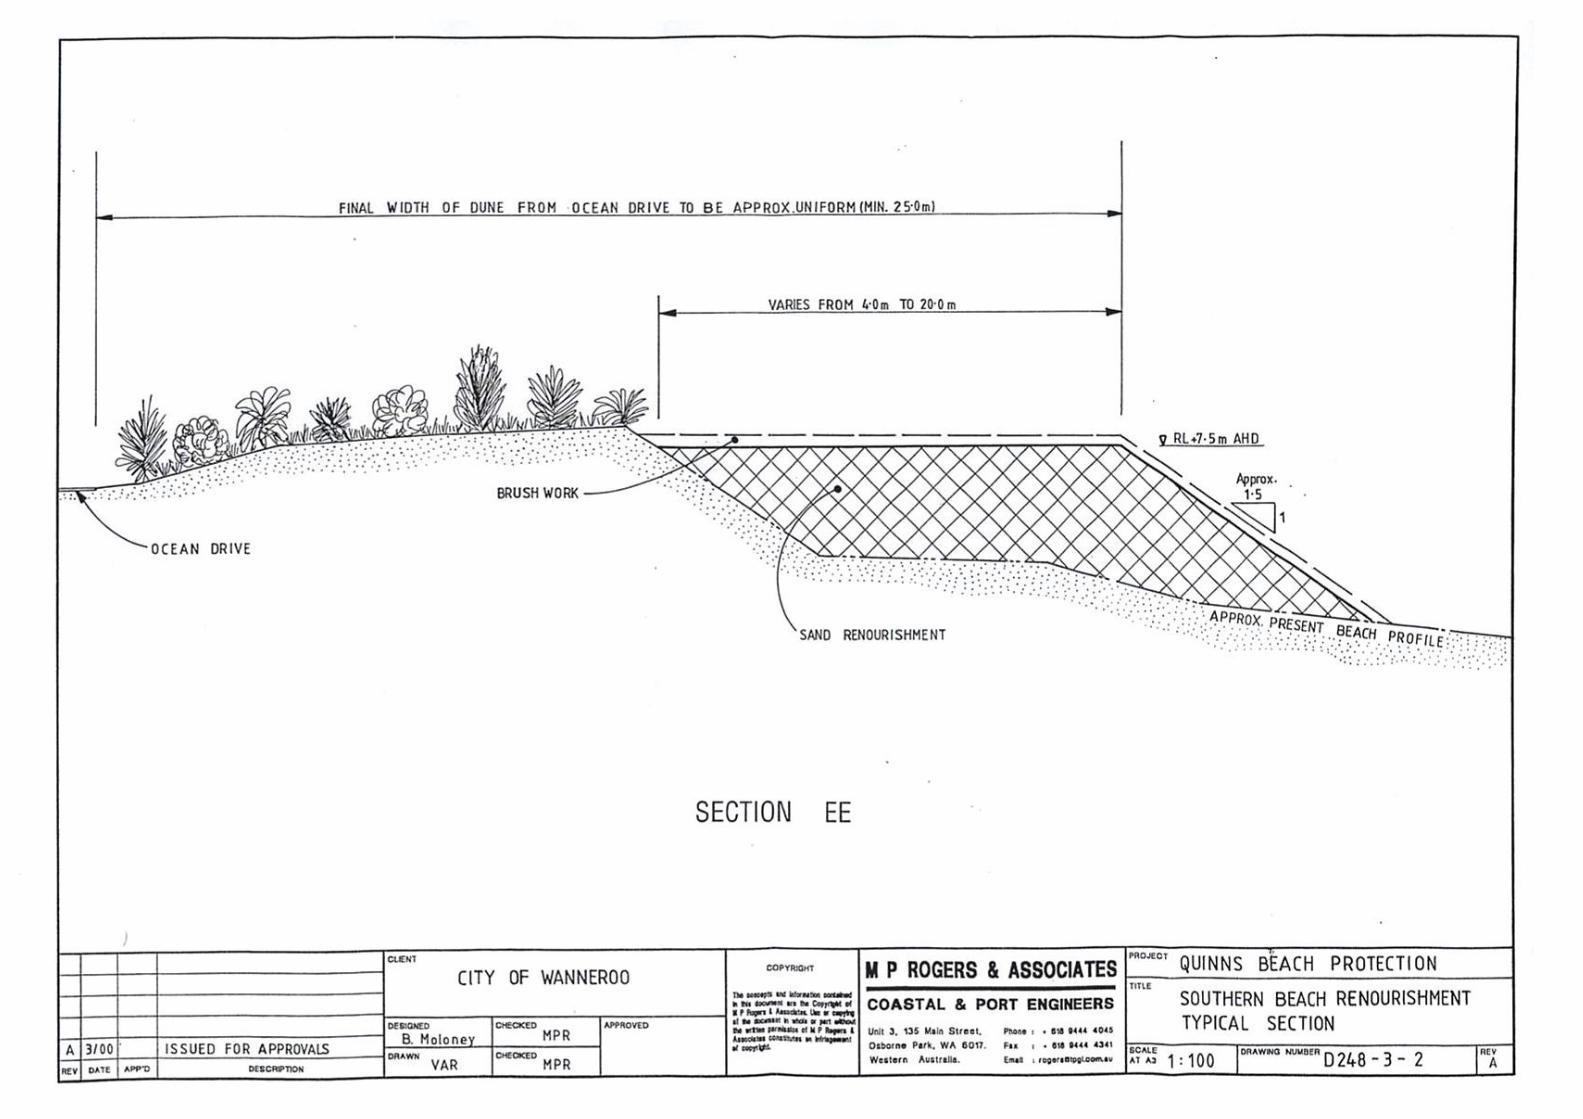
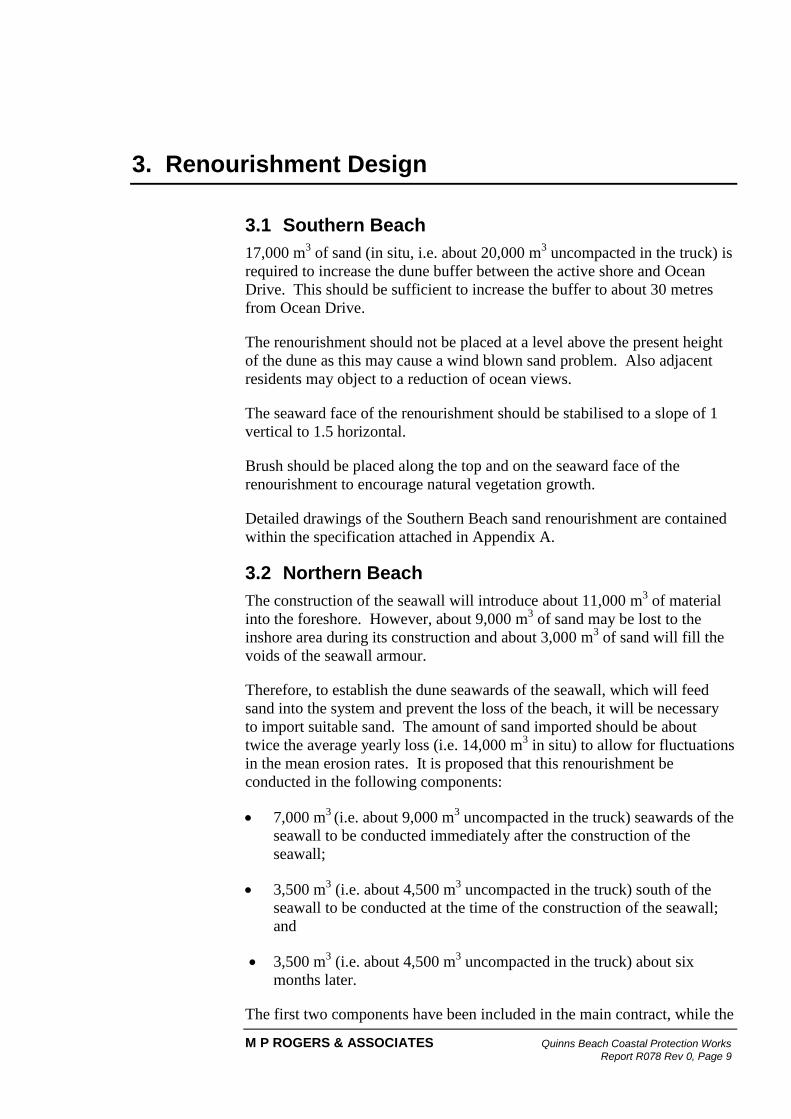
3.1 Southern Beach
17,000 m3 of sand (in situ, i.e. about 20,000 m
3 uncompacted in the truck) is
required to increase the dune buffer between the active shore and Ocean
Drive. This should be sufficient to increase the buffer to about 30 metres
from Ocean Drive.
The renourishment should not be placed at a level above the present height
of the dune as this may cause a wind blown sand problem. Also adjacent
residents may object to a reduction of ocean views.
The seaward face of the renourishment should be stabilised to a slope of 1
vertical to 1.5 horizontal.
Brush should be placed along the top and on the seaward face of the
renourishment to encourage natural vegetation growth.
Detailed drawings of the Southern Beach sand renourishment are contained
within the specification attached in Appendix A.
3.2 Northern Beach
The construction of the seawall will introduce about 11,000 m3 of material
into the foreshore. However, about 9,000 m3 of sand may be lost to the
inshore area during its construction and about 3,000 m3 of sand will fill the
voids of the seawall armour.
Therefore, to establish the dune seawards of the seawall, which will feed
sand into the system and prevent the loss of the beach, it will be necessary
to import suitable sand. The amount of sand imported should be about
twice the average yearly loss (i.e. 14,000 m3 in situ) to allow for fluctuations
in the mean erosion rates. It is proposed that this renourishment be
conducted in the following components:
7,000 m3
(i.e. about 9,000 m3 uncompacted in the truck) seawards of the
seawall to be conducted immediately after the construction of the
seawall;
3,500 m3 (i.e. about 4,500 m
3 uncompacted in the truck) south of the
seawall to be conducted at the time of the construction of the seawall;
and
3,500 m3 (i.e. about 4,500 m
3 uncompacted in the truck) about six
months later.
The first two components have been included in the main contract, while the
M P ROGERS & ASSOCIATES Quinns Beach Coastal Protection Works
Report R078 Rev 0, Page 10
final component will from part of the annual renourishment program.
Detailed drawings of the Northern Beach sand renourishment are contained
within the specification attached in Appendix A.
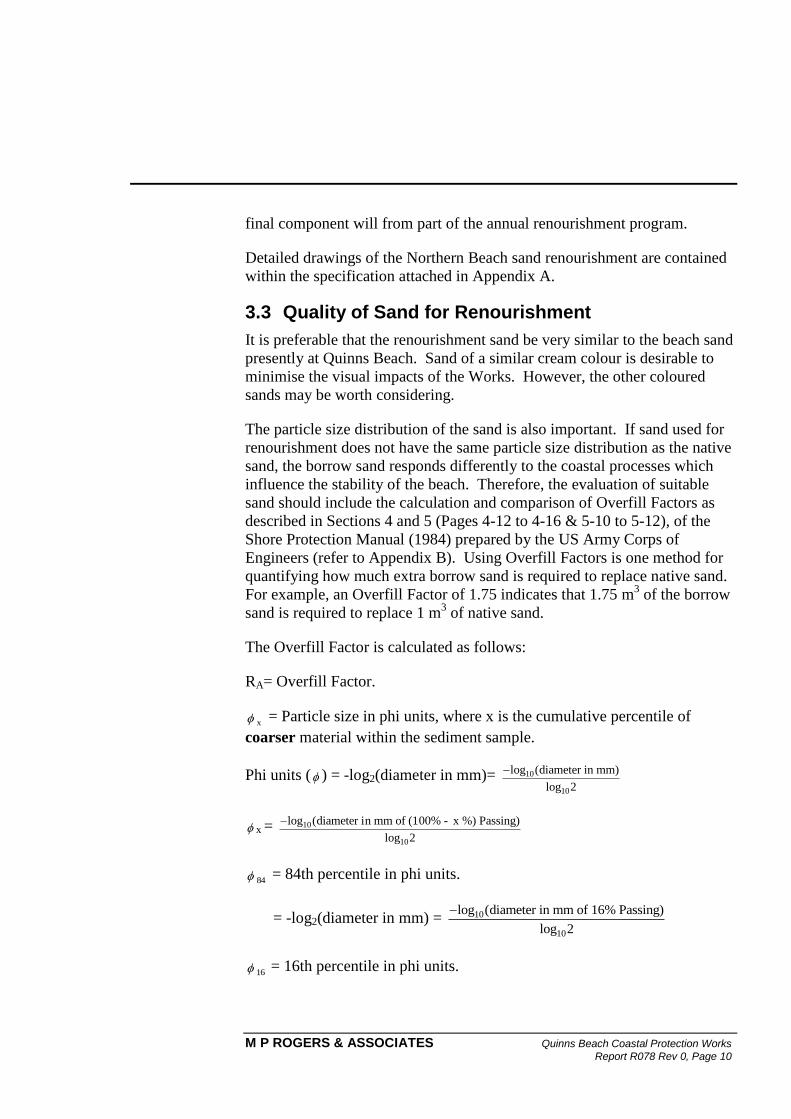
3.3 Quality of Sand for Renourishment
It is preferable that the renourishment sand be very similar to the beach sand
presently at Quinns Beach. Sand of a similar cream colour is desirable to
minimise the visual impacts of the Works. However, the other coloured
sands may be worth considering.
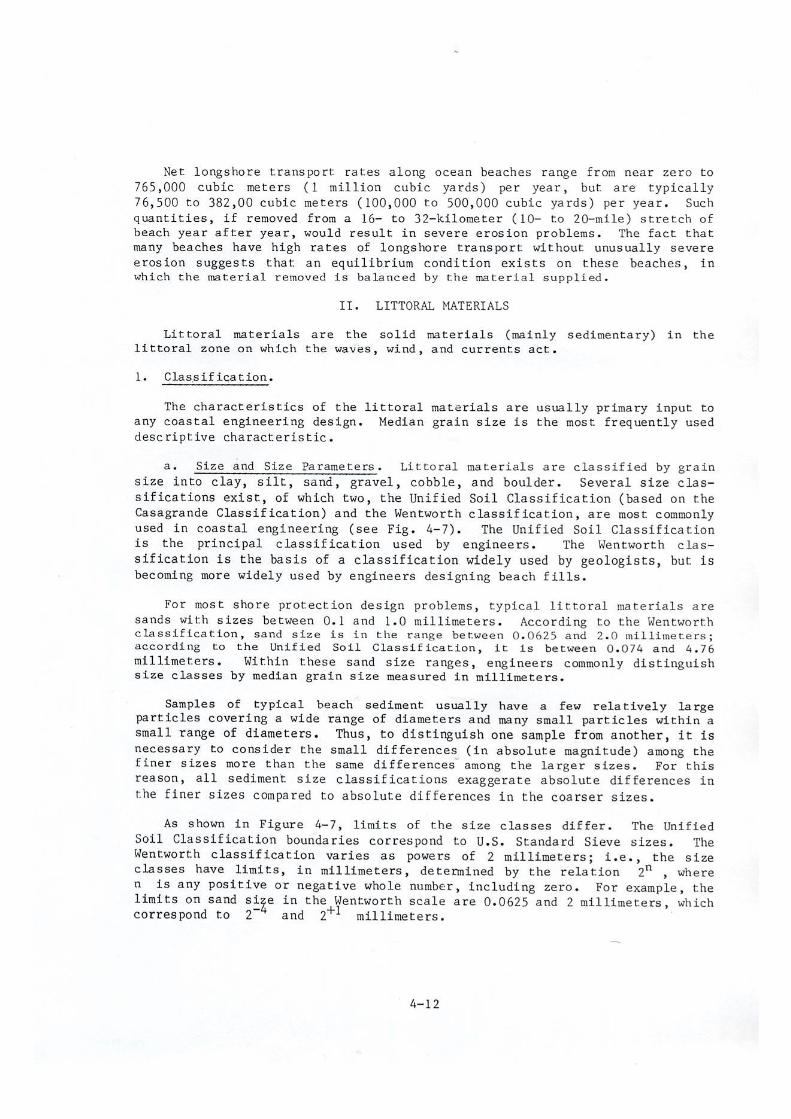
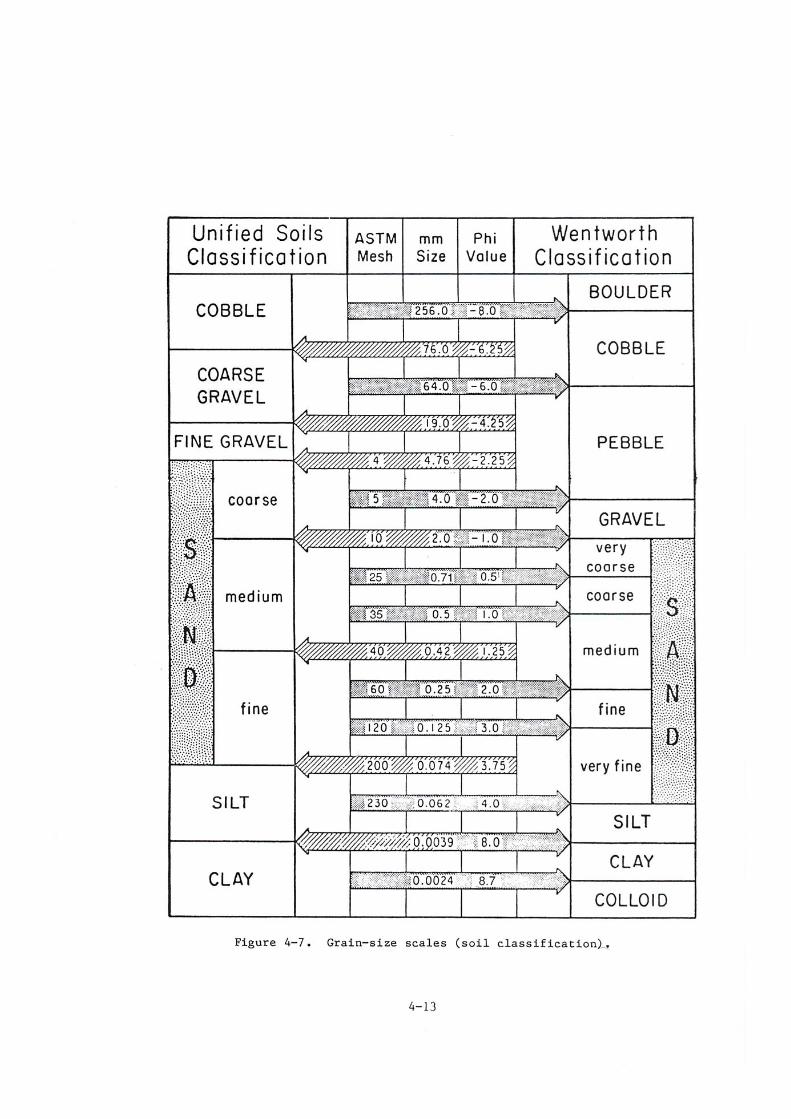
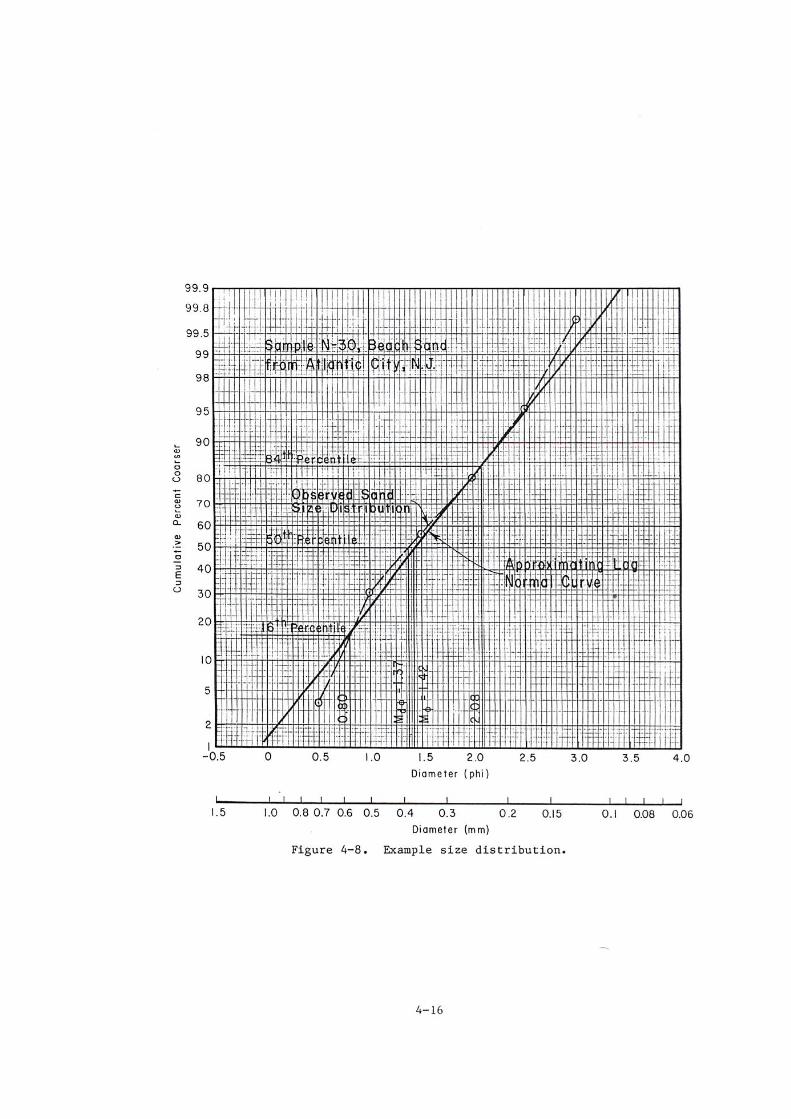
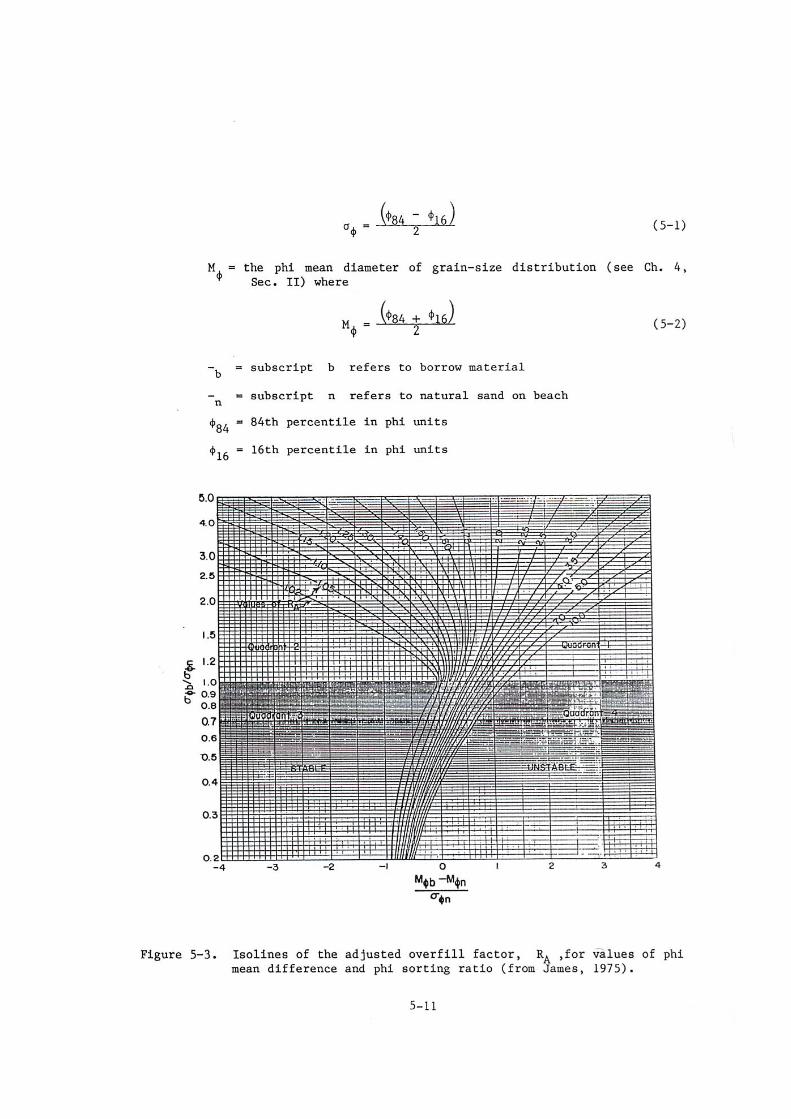
The particle size distribution of the sand is also important. If sand used for
renourishment does not have the same particle size distribution as the native
sand, the borrow sand responds differently to the coastal processes which
influence the stability of the beach. Therefore, the evaluation of suitable
sand should include the calculation and comparison of Overfill Factors as
described in Sections 4 and 5 (Pages 4-12 to 4-16 & 5-10 to 5-12), of the
Shore Protection Manual (1984) prepared by the US Army Corps of
Engineers (refer to Appendix B). Using Overfill Factors is one method for
quantifying how much extra borrow sand is required to replace native sand.
For example, an Overfill Factor of 1.75 indicates that 1.75 m3 of the borrow
sand is required to replace 1 m3 of native sand.
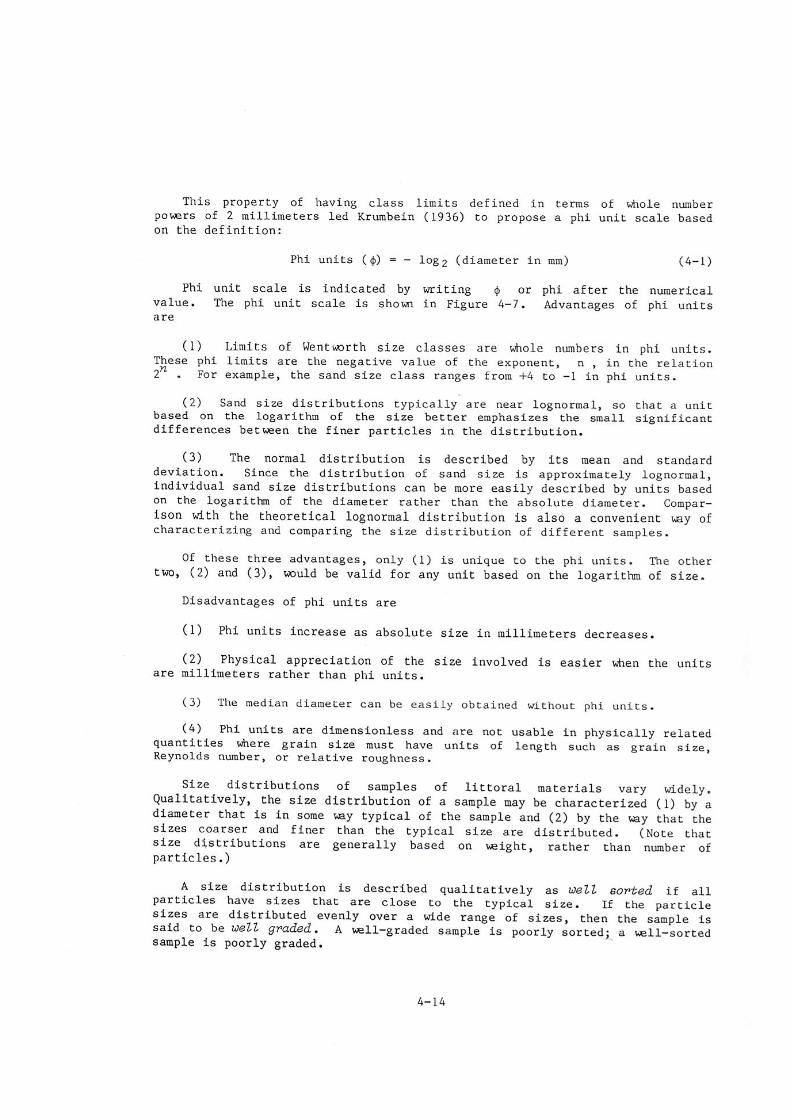
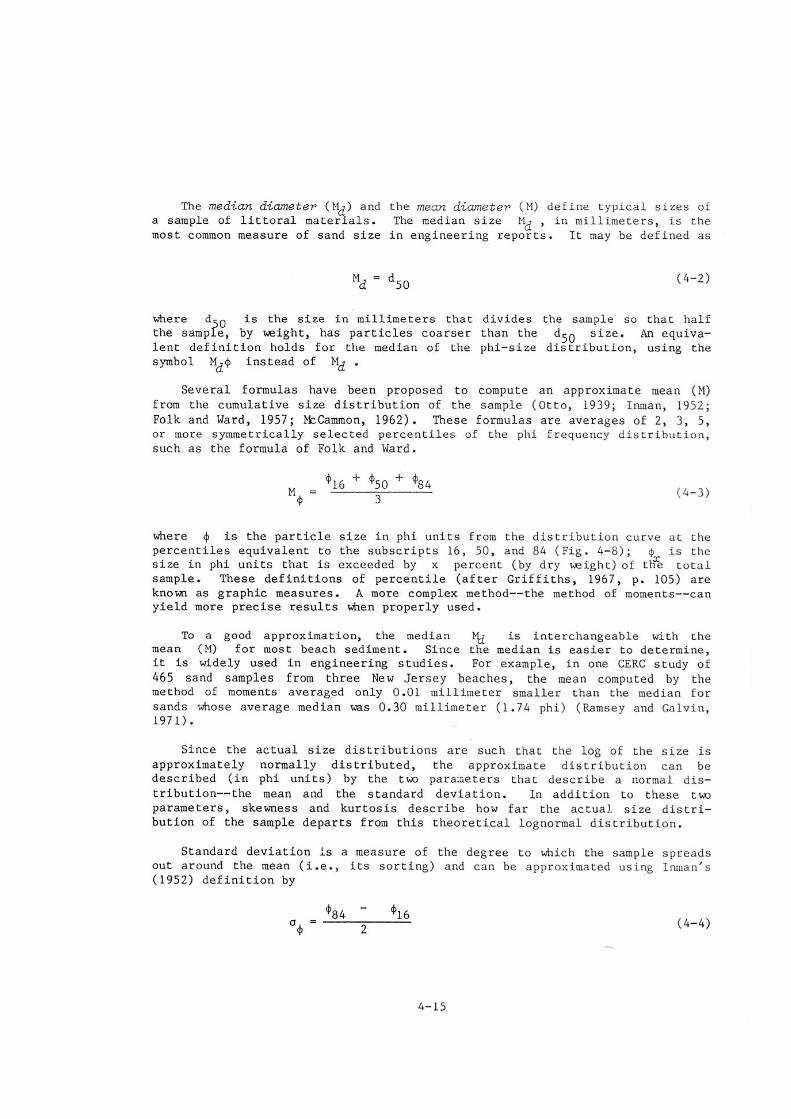
The Overfill Factor is calculated as follows:
RA= Overfill Factor.
x = Particle size in phi units, where x is the cumulative percentile of
coarser material within the sediment sample.
Phi units ( ) = -log2(diameter in mm)= log diameter in mm)
log
10
10
(
2
x = log diameter in mm of (100% - x %) Passing)
log
10
10
(
2
84 = 84th percentile in phi units.
= -log2(diameter in mm) = log diameter in mm of 16% Passing)
log
10
10
(
2
16 = 16th percentile in phi units.
M P ROGERS & ASSOCIATES Quinns Beach Coastal Protection Works
Report R078 Rev 0, Page 11
= -log2(diameter in mm) = log diameter in mm of 84% Passing)
log
10
10
(
2
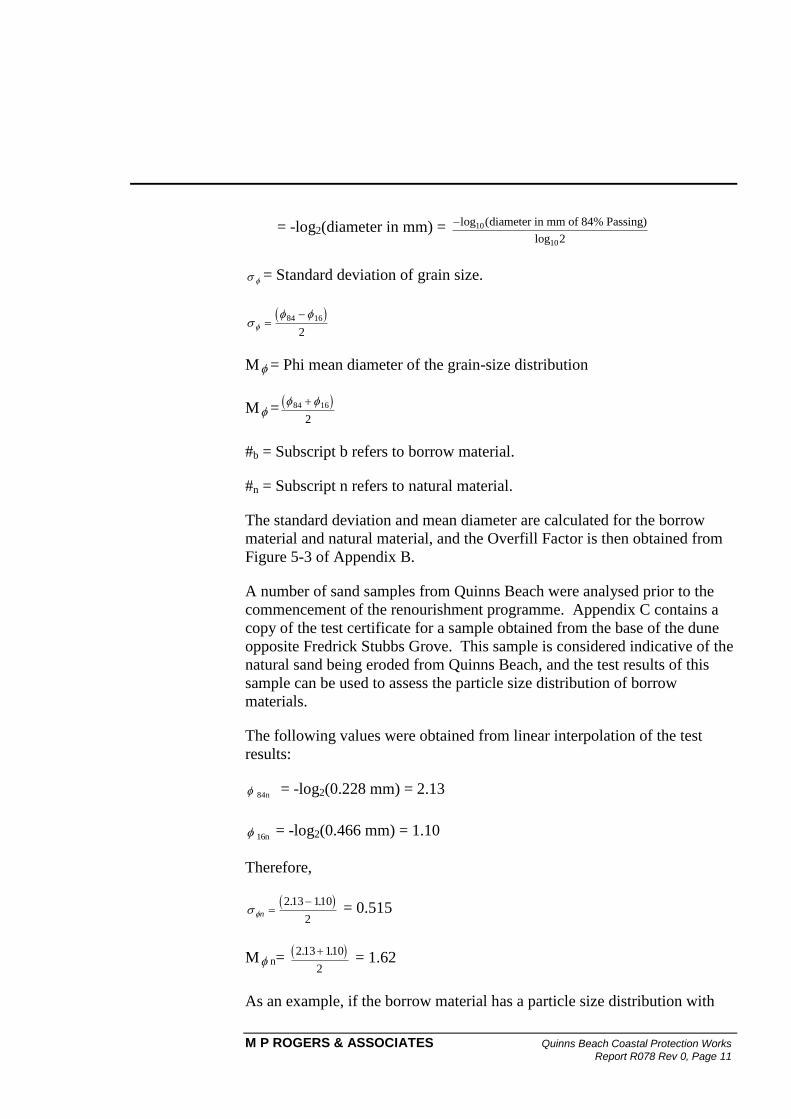
= Standard deviation of grain size.
84 16
2
M = Phi mean diameter of the grain-size distribution
M = 84 16
2
#b = Subscript b refers to borrow material.
#n = Subscript n refers to natural material.
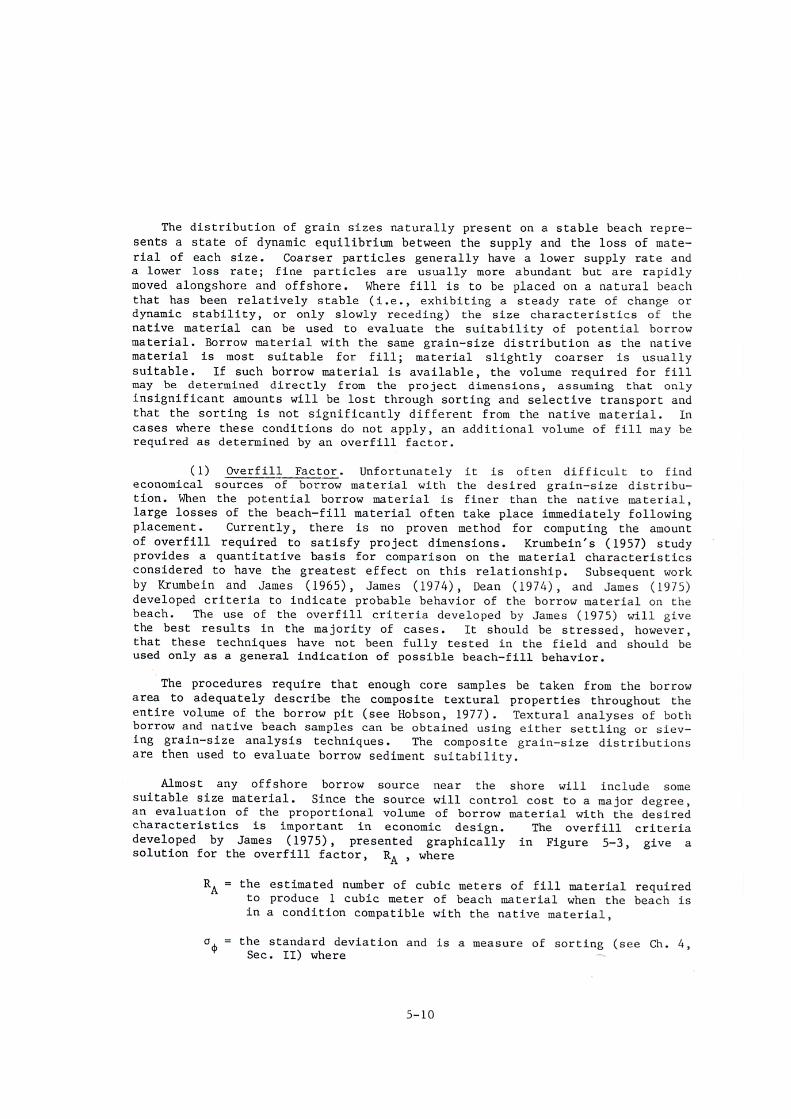
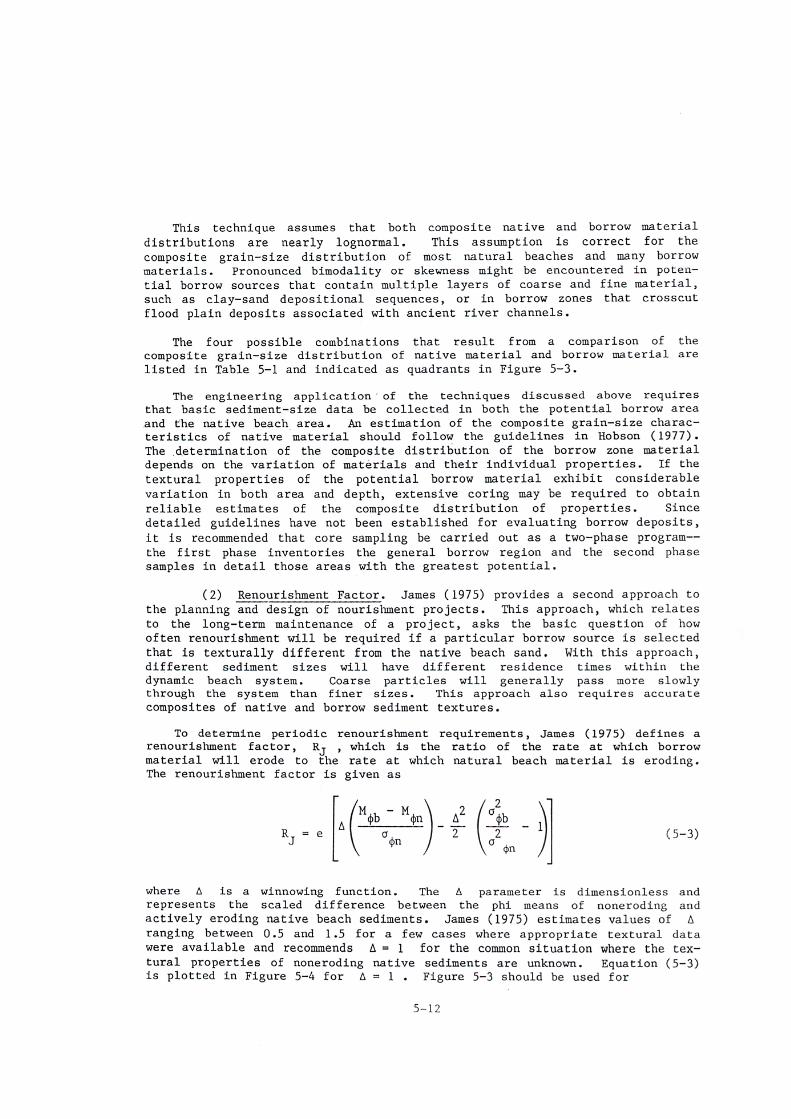
The standard deviation and mean diameter are calculated for the borrow
material and natural material, and the Overfill Factor is then obtained from
Figure 5-3 of Appendix B.
A number of sand samples from Quinns Beach were analysed prior to the
commencement of the renourishment programme. Appendix C contains a
copy of the test certificate for a sample obtained from the base of the dune
opposite Fredrick Stubbs Grove. This sample is considered indicative of the
natural sand being eroded from Quinns Beach, and the test results of this
sample can be used to assess the particle size distribution of borrow
materials.
The following values were obtained from linear interpolation of the test
results:
84n = -log2(0.228 mm) = 2.13
16n = -log2(0.466 mm) = 1.10
Therefore,
n
2 13 110
2
. . = 0.515
M n= 2 13 110
2
. . = 1.62
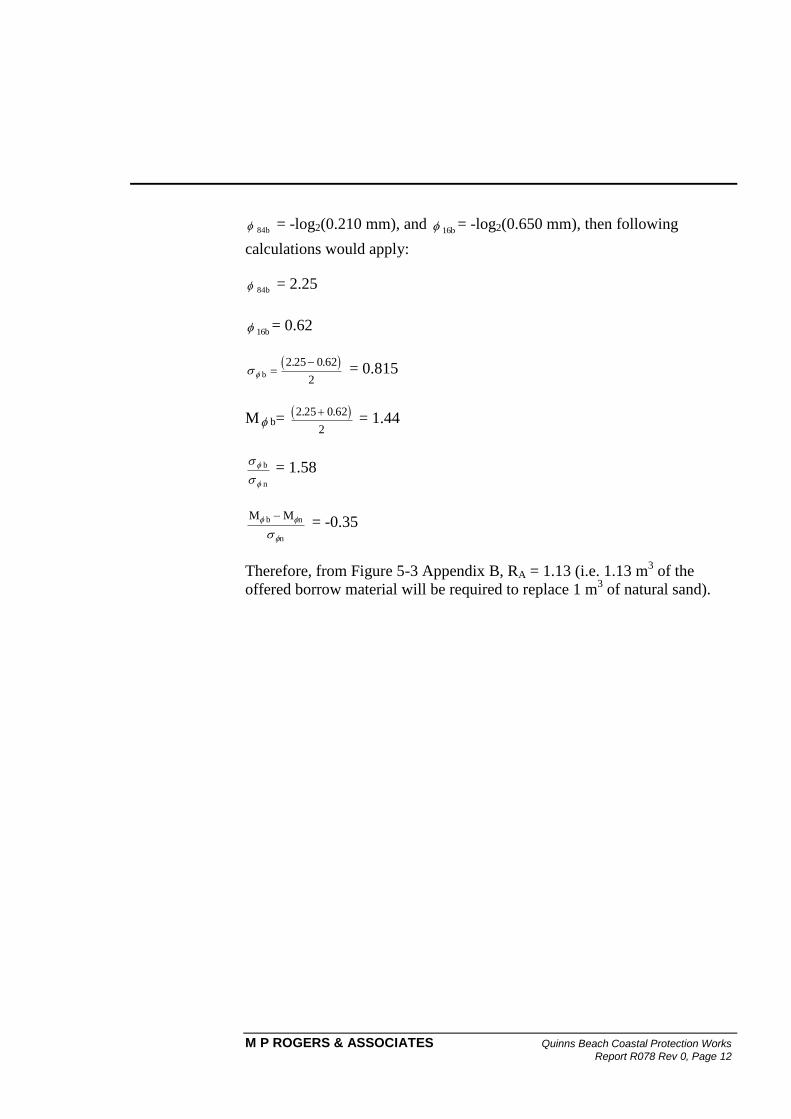
As an example, if the borrow material has a particle size distribution with
M P ROGERS & ASSOCIATES Quinns Beach Coastal Protection Works
Report R078 Rev 0, Page 12
84b= -log2(0.210 mm), and 16b
= -log2(0.650 mm), then following
calculations would apply:
84b= 2.25
16b= 0.62
b
2 25 0 62
2
. . = 0.815
M b= 2 25 0 62
2
. . = 1.44
b
n
= 1.58
M M b n
n
= -0.35
Therefore, from Figure 5-3 Appendix B, RA = 1.13 (i.e. 1.13 m3 of the
offered borrow material will be required to replace 1 m3 of natural sand).
4. Cost Estimates for Designed Works
M P ROGERS & ASSOCIATES Quinns Beach Coastal Protection Works Report R078 Rev 0, Page 13
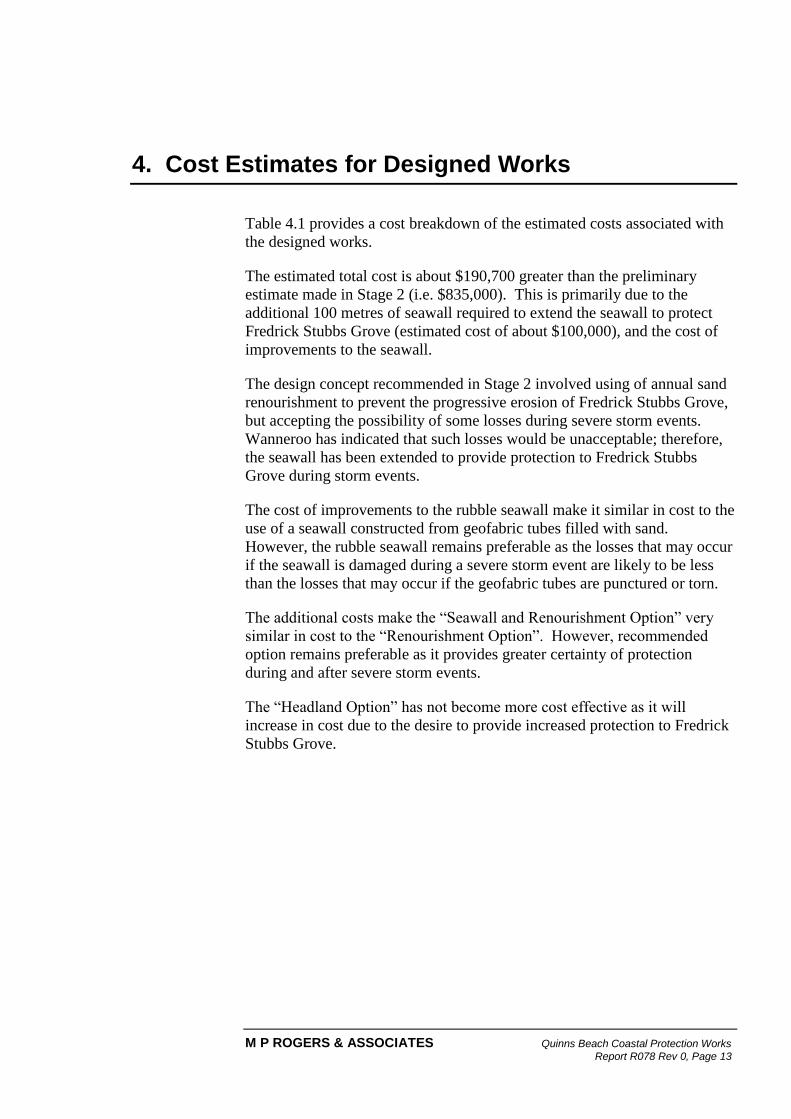
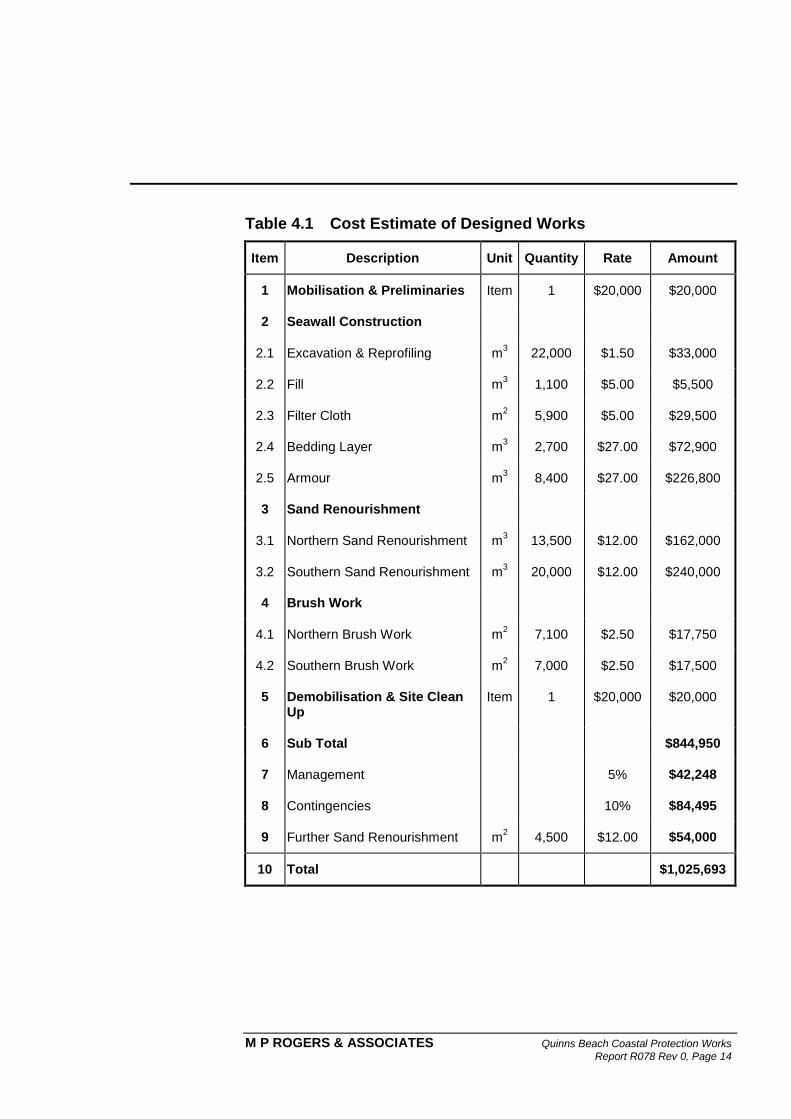
Table 4.1 provides a cost breakdown of the estimated costs associated with
the designed works.
The estimated total cost is about $190,700 greater than the preliminary
estimate made in Stage 2 (i.e. $835,000). This is primarily due to the
additional 100 metres of seawall required to extend the seawall to protect
Fredrick Stubbs Grove (estimated cost of about $100,000), and the cost of
improvements to the seawall.
The design concept recommended in Stage 2 involved using of annual sand
renourishment to prevent the progressive erosion of Fredrick Stubbs Grove,
but accepting the possibility of some losses during severe storm events.
Wanneroo has indicated that such losses would be unacceptable; therefore,
the seawall has been extended to provide protection to Fredrick Stubbs
Grove during storm events.
The cost of improvements to the rubble seawall make it similar in cost to the
use of a seawall constructed from geofabric tubes filled with sand.
However, the rubble seawall remains preferable as the losses that may occur
if the seawall is damaged during a severe storm event are likely to be less
than the losses that may occur if the geofabric tubes are punctured or torn.
The additional costs make the “Seawall and Renourishment Option” very
similar in cost to the “Renourishment Option”. However, recommended
option remains preferable as it provides greater certainty of protection
during and after severe storm events.
The “Headland Option” has not become more cost effective as it will
increase in cost due to the desire to provide increased protection to Fredrick
Stubbs Grove.
M P ROGERS & ASSOCIATES Quinns Beach Coastal Protection Works
Report R078 Rev 0, Page 14
Table 4.1 Cost Estimate of Designed Works
Item Description Unit Quantity Rate Amount
1 Mobilisation & Preliminaries Item 1 $20,000 $20,000
2 Seawall Construction
2.1 Excavation & Reprofiling m3
22,000 $1.50 $33,000
2.2 Fill m3
1,100 $5.00 $5,500
2.3 Filter Cloth m2
5,900 $5.00 $29,500
2.4 Bedding Layer m3
2,700 $27.00 $72,900
2.5 Armour m3
8,400 $27.00 $226,800
3 Sand Renourishment
3.1 Northern Sand Renourishment m3
13,500 $12.00 $162,000
3.2 Southern Sand Renourishment m3
20,000 $12.00 $240,000
4 Brush Work
4.1 Northern Brush Work m2
7,100 $2.50 $17,750
4.2 Southern Brush Work m2
7,000 $2.50 $17,500
5 Demobilisation & Site Clean Up
Item 1 $20,000 $20,000
6 Sub Total $844,950
7 Management 5% $42,248
8 Contingencies 10% $84,495
9 Further Sand Renourishment m2 4,500 $12.00 $54,000
10 Total $1,025,693
5. References
M P ROGERS & ASSOCIATES Quinns Beach Coastal Protection Works Report R078 Rev 0, Page 15
Coastal Engineering Research Centre, 1984. Shore Protection Manual. US
Army Corps of Engineers.
Department of Transport (WA), 1997. Unpublished Data: Plan Set
DOT 871. Department of Transport, Fremantle, Western Australia.
Rogers & Associates, 1999a. Quinns Beach Coastal Protection Works
Stage 1 Report. Prepared for the Shire of Wanneroo by M P Rogers
and Associates Pty Ltd, January 1999.
Rogers & Associates, 1999b. Quinns Beach Coastal Protection Works
Stage 2 Report. Prepared for the Shire of Wanneroo by M P Rogers
and Associates Pty Ltd, May 1999.
Tremarfon, 1997. Quinns Coastal Processes Study. Prepared for the City of
Wanneroo by Tremarfon Pty Ltd, 1997.

Figures
M P ROGERS & ASSOCIATES Quinns Beach Coastal Protection Works Report R078 Rev 0, Page 16
Figure 1.1 Location Diagram
M P ROGERS & ASSOCIATES Quinns Beach Coastal Protection Works
Report R078 Rev 0, Page 17
Figure 1.1 - Location Diagram
Appendix A - Specifications
M P ROGERS & ASSOCIATES Quinns Beach Coastal Protection Works
Report R078 Rev 0, Page 18
S1 Description of Works
The works shall consist of the construction of a seawall adjacent to the Quinns Northern Beach
car park and Fredrick Stubbs Grove located immediately to the south, and the placement and
stabilisation of 33,500 m3 of sand renourishment on the northern and southern flanks of Quinns
Beach.
The Contract includes all operations, labour, plant, materials, supervision, survey, overheads,
profit and everything else required for the construction and completion of the whole of the
Works as described in this Specification, as shown on the Drawings together with any additional
work or variations ordered by the Superintendent.
S2 Site & Access
S2.1 Site
The extent of the northern and southern site areas are detailed in the relevant Setout and
Renourishment plans.
S2.2 Northern Beach
The site of the seawall and associated sand renourishment shall be accessed via the adjacent car
park. This car park shall be closed to the public for the duration of the works and shall be
available for the placement of site sheds and the storage of plant. Plant movements between the
car park and the foreshore shall be limited to the ramps at seaward side of the northern and
southern ends of the car park. Plant and works shall not encroach on the vegetated areas
landwards of Set Out Line A.
S2.3 Southern Beach
The site of the southern beach sand renourishment shall be accessed via a track located adjacent
to the junction of Pearce Street and Ocean Drive. Plant and works shall not encroach on the
vegetated areas landwards of the renourishment area.
S3 Site Preparation
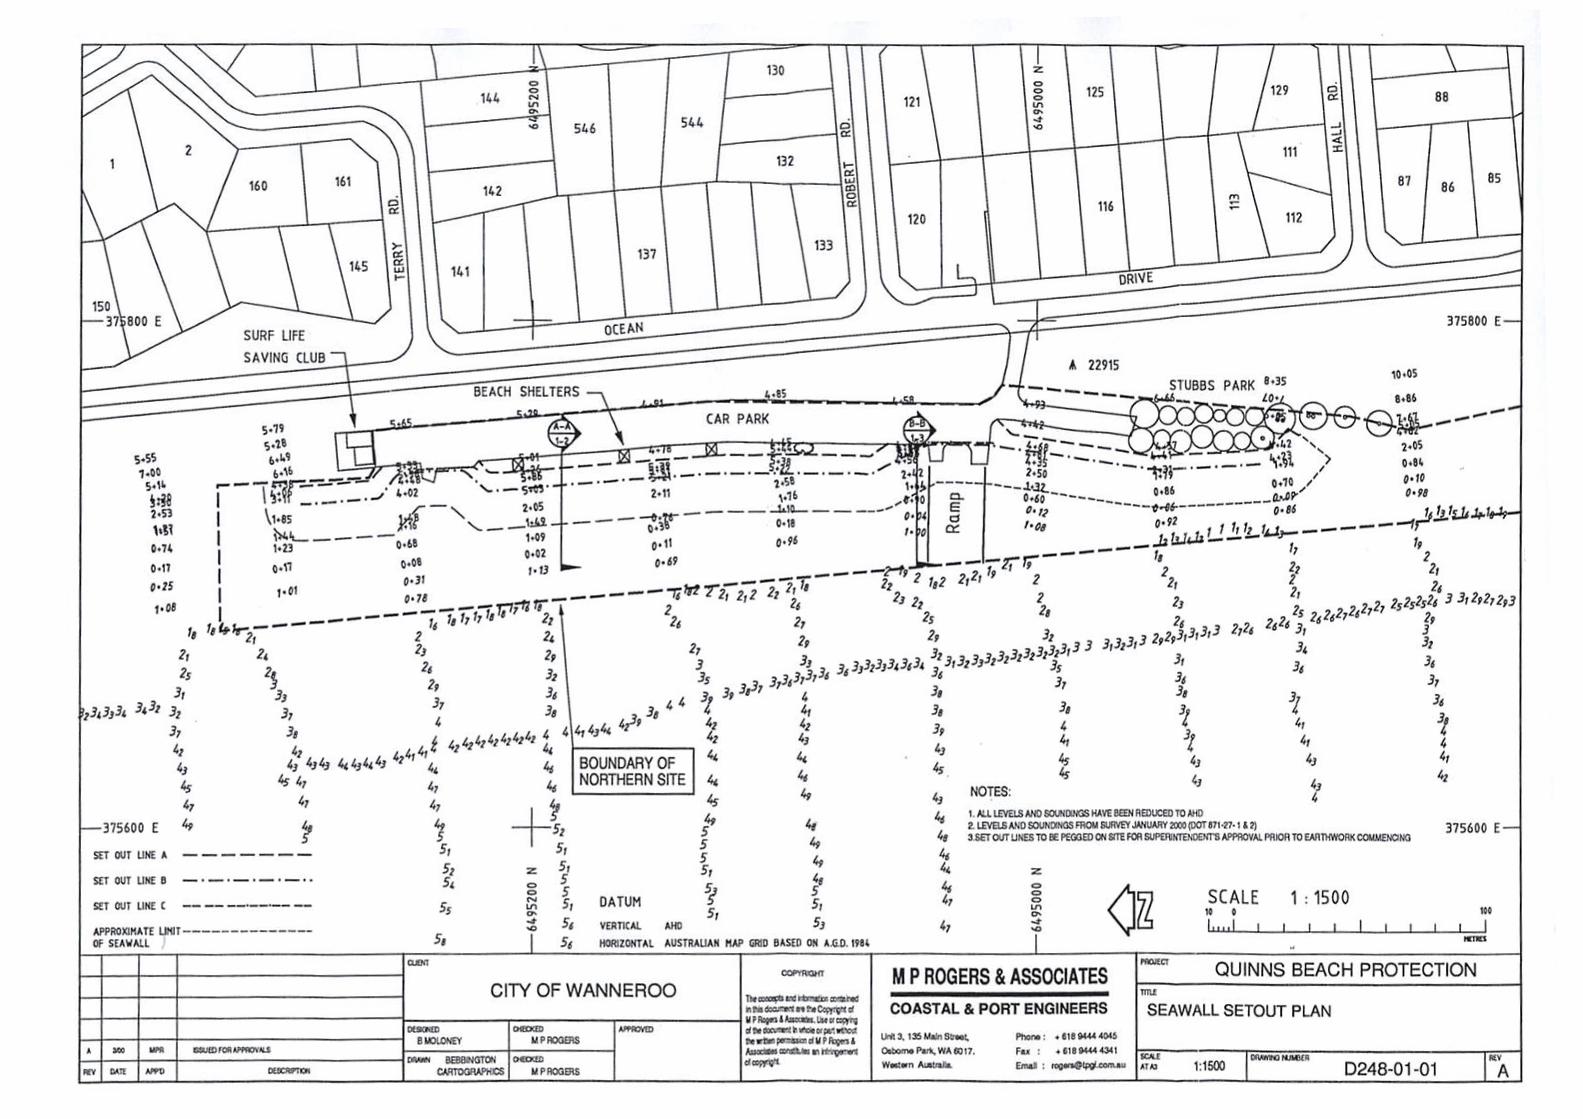
S3.1 Set Out
The Contractor shall clearly mark out Set Out Line A shown on the Seawall Set Out Plan. The
Contractor shall obtain approval of this line from the Superintendent prior to the commencement
of any excavation or construction works. Set Out Line A will remain marked out until the
completion of the works.
S3.2 Protection of Pavements
The works shall be conducted in a controlled manner that minimises damage to all road and car
park pavements. At the completion of the works the pavements shall be returned to their original
state at the cost of the Contractor and to the satisfaction of the Superintendent.
S3.3 Clearing Vegetation
Vegetation seawards of Set Out Line A shall be removed by the Contractor. If appropriate, this
vegetation may stockpiled at locations approved by the Superintendent and later be used for
M P ROGERS & ASSOCIATES Quinns Beach Coastal Protection Works
Report R078 Rev 0, Page 19
brush work on the top portion of the beach renourishment. Otherwise, the Contractor shall
dispose of the vegetation at an appropriate offsite location.
S3.4 Removal of Excess Pavement
Any car park pavement seaward of Set Out Line C shall be removed and disposed of by the
Contractor at an appropriate offsite location.
S3.5 Excavation
The Contractor shall excavate material as necessary to construct of the seawall. If necessary the
Contractor will conduct dewatering.
The Quinns site is a sandy beach and it is not expected that reef or bedrock will be encountered
during the excavation works. However, if during the excavation works loose rock is removed
which is suitable for the construction of the seawall, than it may be incorporated into the Works
to the satisfaction of the Superintendent.
Where other loose rock or foreign objects are removed during the excavation works, they shall
be stockpiled at onsite locations approved by the Superintendent. The removal of this material
from the stockpiles to appropriate offsite locations shall be the responsibility of the Principal.
Excavated sand may be used to form a bund seaward of the excavated area; however, it is
desirable to minimise the amount of sand lost to the ocean. After each section of the seawall is
completed, the sand bund shall be moved landward to form a beach slope of about 1 vertical to
15 horizontal from the swash zone to the seawall. The total amount of sand lost to the ocean
through this process shall be less than half of the quantity of sand excavated.
S3.6 Filling
Where it is necessary to achieve an adequate operational area seaward of Set Out Line A, the
Contractor shall place compacted fill. Sand from the excavation works can be used for this
purpose.
The Fill Material shall be in accordance with Section 5.3
The Fill Material shall be placed in accordance with Section 6.1.
S4 Filter Cloth
Geofabrics Australia Bidim HN30 Filter Cloth or an equivalent approved by the Superintendent
shall be placed as shown on the Drawings. The minimum overlap between sheets shall be 1.0
metre for the full length of the lap, after placement of the rock on top of the Filter Cloth.
The Contractor shall plan and execute the placement of the Filter Cloth to ensure that there is no
damage to the Filter Cloth and that it forms a continuous barrier to the leaching of sand from
beneath the seawall.
All damaged areas of Filter Cloth shall be repaired by overlaying the area with new Filter Cloth
with a minimum overlap of 1.0 metre from the damaged area.
M P ROGERS & ASSOCIATES Quinns Beach Coastal Protection Works
Report R078 Rev 0, Page 20
S5 Quarry Materials
The quarry materials to be supplied, delivered and placed in the construction of the seawall shall
include the following.
S5.1 Armour Type I
Armour Type I shall consist of individual, hard, dense and angular quarry rocks broken out by
explosives, free from weak cleavages and other faults, and of such strength that it will not break
in handling, transporting and placing. Not more than 10% of the armour stones shall have the
greatest dimension more that 2.5 times the smallest dimension. The Armour Type I stones shall
vary in mass from 0.5 t to 2 t. At least 50% of the Armour Type I stones shall have a mass
greater than 1 t.
S5.2 Bedding Layer Material
The Bedding Layer Material shall consist of well graded freshly quarried limestone up to a
maximum size of 300 mm diameter with 50% of the stones being greater than 150 mm diameter.
The proportion of stones less than 10 mm shall not exceed 10%.
S5.3 Fill Material
The compacted fill shall be clean, free draining sand, totally free from organic material and other
foreign matter. Not more than 4% shall pass a 75 µm sieve.
S5.4 Renourishment Sand
It is preferred that the renourishment sand be very similar to the beach sand presently at Quinns
Beach. Sand of a similar cream colour is desirable to minimise the visual impacts of the Works
However, the other coloured sands may considered. To assist with the evaluation of tenders,
each submission must include a sample of the sand offered. The samples should be about 500
mL, securely sealed in a container or bag, and clearly marked with its origin.
The particle size distribution of the offered sand is also important. In general, similar or coarser
grade sands are preferable. The review of tender submissions will include the calculation and
comparison of Overfill Factors as described in Attachment A. To assist with the evaluation of
tenders, each submission must include the analysis of calcium carbonate content (%), average
soil particle density (g/cm3), and sieve analysis of a minimum of three (3) samples from the
source of the offered sand. The Superintendent will calculate the Mean Overfill Ratio of the
offered sand (RO) by averaging the Overfill Ratios of each of the samples, and this ratio will be
used in the comparison of tender submissions and the assessment of supplied sand (refer to
Section 9.2).
Tenderers may offer a number of sand sources and types for the Superintendent to choose from.
However, a sample and the analysis above must be submitted for each type of sand offered.
Where the choice of sand type influences the cost of the project, the submission must include a
completed Table of Rates and Contract Lump Sum for each type of sand offered, with the type of
sand offered clearly identified.
S5.5 Sources of Supply of Quarried Materials
The Contractor shall make his own arrangements for opening up and operating all quarries
M P ROGERS & ASSOCIATES Quinns Beach Coastal Protection Works
Report R078 Rev 0, Page 21
required for the completion of the Works whether they are on Crown Land or privately owned
land. These arrangements shall include payment of royalties, if required, and any other charges
incidental to opening up, excavating, operating and winning from the quarries including the
construction, upgrading and maintenance of any access roads required between the quarries and
public roads. All such costs shall be deemed to be included in the prices submitted in the tender.
S5.6 Type of Rock, Strength and Minimum Density
All Armour Stone shall be limestone with a minimum Saturated Surface Dry Density of 1.9 t/m3.
The Bedding Layer Material shall be limestone with a minimum Saturated Surface Dry Density
of 1.7 t/m3. The Contractor shall arrange and pay for laboratory testing of samples from each
quarry used for the Works to determine the Saturated Surface Dry Density of the rock from that
quarry. The laboratory shall be NATA registered and the density tests shall be completed in
accordance with AS 1141. The Superintendent shall select the samples for the Contractor to
arrange the measurement of the density of the quarry rock at the rate of one sample per 3,000 m3
of armour or part thereof from each quarry used by the Contractor.
All Armour Stone and Bedding Layer Material shall be of sufficient strength that is does not
break in quarry, transport and placement operations. All Armour Stones that break during
transport or placement operations shall be removed from the armour layers at the Contractors
expense.
S5.7 Truck Routes and Traffic
The Contractor shall endeavour to minimise the disruption to the area caused by truck traffic and
other work activities, and is liable for any damage caused to roads and buildings by truck traffic.
The Contractor shall liaise with the Superintendent and the City of Wanneroo to minimise the
disruption to the surrounding areas.
The Contractor shall obtain approval for the proposed truck routes from the Superintendent and
the City of Wanneroo.
S5.8 Samples of Armour Stones
At the commencement of the Works, the Contractor shall supply samples of the Armour stones
to be used in the Works. Armour stones with masses of approximately 0.5 t, 1.0 t, and 2.0 t shall
be provided as samples at the Quinns site as well as the quarry site or sites.
After weighing, the Armour stone samples shall be marked with their masses and retained on site
and at the quarry for visual reference purposes for the duration of the Works. At the completion
of the Works the sample stones shall be removed from the Quinns site or incorporated into the
Works to the satisfaction of the Superintendent.
S6 Placing Quarried Materials
S6.1 Placing of Fill Material
The Contractor shall place and compact the fill in a planned and controlled manner to achieve
the lines and levels shown on the Drawings. The Fill Material shall be placed and compacted in
layers not more than 500 mm thick when compacted. All layers shall extend the full width of the
fill area. The fill shall be compacted to achieve 6 blows with a Perth Sand Penetrometer between
150 and 400 mm below the surface level in accordance with AS1289 F3.3 - 1984.
M P ROGERS & ASSOCIATES Quinns Beach Coastal Protection Works
Report R078 Rev 0, Page 22
S6.2 Placing Bedding Layer Material
The Bedding Layer Material shall be delivered and placed to the dimensions, lines, levels and
slopes shown on the Drawings. The Bedding Layer shall be constructed to the levels shown on
the Drawings plus or minus 0.1 metre and to the widths shown on the Drawings plus 0.1 metre or
minus 0.0 metre.
Any Bedding Layer Material placed beyond the specified limits shall be removed by the
Contractor at his own cost.
The Bedding Material shall not be dropped onto the Filter Cloth from a height greater than
1 metre.
S6.3 Placing Armour Stone
The Armour Stone shall be delivered and placed to the layers, dimensions, lines, levels and
slopes shown on the Drawings. The Armour Stone shall be constructed to the levels shown on
the Drawings plus 0.3 metre or minus 0.0 metre and to the top widths shown on the Drawings
plus 0.3 metre or minus 0.0 metre.
Armour Stone shall be placed by crane or hydraulic excavator or other machine approved by the
Superintendent in a manner that Armour Stone is lifted and them placed firmly on to the
previously placed layer. The Armour Stones shall be in close contact with at least three other
stones of the same layer.
The Contractor is required to remove all Armour Stones which have rolled to the beach/seabed
and are not part of the structure.
S6.4 Rate of Placing
The Armour Stones shall be placed progressively on the side of the Bedding Layer to full height
as soon as is practical. At the end of each working day, the placement of Armour Stones shall
not be more than 5 metres from the end of the underlayers.
S6.5 Placing of Sand Renourishment
The Contractor shall place the sand renourishment in a planned and controlled manner to achieve
the lines, grades, cross-sections and dimensions shown on the Drawings. The finished levels
shall be +/-0.2 metres of that shown on the Drawings.
The Contractor shall place 9,000 m3 of sand renourishment along the length of the seawall. The
width of the sand dune formed seaward of Set Out Line B shall be relatively uniform. A further
4,500 m3 of sand will be placed along the foreshore immediately south of the seawall
The Contractor shall place 20,000 m3 of sand on the southern beach between Pearce Street and
Quinns Road. The width of the sand dune formed seawards of Ocean Drive shall be relatively
uniform.
The quantity of sand specified in the contract and supplied by the Contractor will be identified
and measured in uncompacted cubic metres on the truck. Prior to the commencement of
delivery, the tray dimensions of each delivery truck will be measured to the satisfaction of the
Superintendent. Each truck will then be filled with a normal load of sand and transported to site.
M P ROGERS & ASSOCIATES Quinns Beach Coastal Protection Works
Report R078 Rev 0, Page 23
At site the sand will be levelled, the height of the sand will be measured, and the volume of the
load calculated for each truck. Where delivery trucks are of similar capacity, a single set of
measurements may be use to assign an appropriate load volume, provided it is acceptable to both
the Superintendent and the Contractor.
Throughout the Works, the Superintendent may choose to measure the volume of sand delivered
by any truck at any time. If the supplied volume is found to be less than the agreed volume, the
percentage difference shall be applied in the calculation of the total volume of material supplied
between the time of the volume check and the time of the previous measurement.
The Contractor shall prepare a delivery docket for each load delivered to site. Each docket shall
clearly identify the following;
the date and time of delivery;
the location of delivery;
the registration of the delivery vehicle; and
the estimated volume of sand delivered.
At the point of receipt, the load must be approved and the associated docket signed by the
Superintendent or Superintendent’s Representative prior to unloading. All completed delivery
dockets shall be submitted to the Superintendent with the progress claim. The Contractor shall
only be paid for deliveries which are appropriately documented and signed for by the
Superintendent or Superintendent’s Representative.
S7 Brush Work
To minimise wind blown sand and encourage natural revegetation, the Contractor shall lay
appropriate brush in the areas shown on the Drawings. The works must be conducted under the
direct supervision of personnel experienced in dune stabilisation. The works must be conducted
using proven techniques including placement patterns and types of brush. The density of the
brush should be sufficient to minimise sand loss, while being sparse enough for vegetation
growth and the minimisation of fire hazard.
The following shall be included in the Tender Submission:
the name of the site supervisor (or Subcontractor if applicable) of the brush works;
the relevant experience of the site supervisor (or Subcontractor if applicable);
a brief description of the materials and methods for the works; and
any other relevant information that will enable the Superintendent to better assess the
quality of the proposed works.
For the information of the Tenderers that may have limited experience in this area, Ian
Lovegrove of Coastal Revegetation (08 9921 6739) has recently completed similar works at
Quinns to the satisfaction of the City of Wanneroo, and may be available to conduct the works as
a Subcontractor. Alternatively, Steve Czaba (08 9335 0545) of CALM may be able to assist.
M P ROGERS & ASSOCIATES Quinns Beach Coastal Protection Works
Report R078 Rev 0, Page 24
S8 Damage by Storms
The Contractor shall plan and execute the Works to minimise any damage by storms or other
natural events. Any damage to the partially completed works shall be immediately rectified by
the Contractor at his own cost.
S9 Quality Control and Acceptance Testing
S9.1 General
The Contractor shall continuously monitor the quality, density, size, grading and placement of all
quarry materials used in the Works. The Contractor shall undertake a program of inspection,
testing and supervision that will ensure that all materials incorporated into the Works conform to
the full requirements of these Specifications. Such quality control and acceptance testing shall
be to the satisfaction of the Superintendent.
S9.2 Quality Control of Sand Renourishment
The Contractor is responsible for ensuring that the quality of the supplied sand meets the
requirements specified. The extent of the sand quality monitoring undertaken by the Contractor
is up to the Contractor's discretion, with all associated costs to be incorporated within the
tendered rate.
In addition to monitoring undertaken by the Contractor, the Superintendent will implement the
following monitoring programme.
Prior to the supply of renourishment sand, Superintendent or Superintendent’s Representative
will inspect the borrow site and collect a minimum of three (3) sand samples which will be
analysed for calcium carbonate content (%), average soil particle density (g/cm3), and particle
size distribution. If the test results indicate that the quality of the sand is significantly less than
the quality of the sand offer at the time of the tender submission, the Superintendent may chose
not to accept the sand or may renegotiate with the Contractor an appropriate supply and delivery
price.
During the course of the supply of renourishment sand, the Superintendent or Superintendent’s
Representative will take a minimum of one sample of each 1,000 m3 of sand delivered to Quinns
Beach. Each sample will be analysed for calcium carbonate content (%), average soil particle
density (g/cm3), and particle size distribution. The Mean Overfill Ratio of the supplied sand will
be determined by averaging the Overfill Ratios of each of the samples taken by the
Superintendent or the Superintendent’s Representative during the renourishment session (note:
the properties of the native sand to be used in these calculations are 84n
=2.13, 16n = 1.10)).
If the Mean Overfill Ratio of the supplied sand (RS) is greater than 125% of the Mean Overfill
Ratio of the sand offered during tender submission (RO), the payment will be reduced
proportionally as follows:
Total Payment ($) = (Volume (m )) *(Agreed Rate ($ / m )) *(R )
R
3 3O
S
All sand samples taken by the Superintendent and Superintendent’s Representative will be
analysed by a NATA approved laboratory, with the results available to the Contractor on request.
M P ROGERS & ASSOCIATES Quinns Beach Coastal Protection Works
Report R078 Rev 0, Page 25
The Principal will meet all costs associated with the monitoring undertaken by the
Superintendent.
S9.3 “As Constructed” Contract Drawings
The Contractor shall keep one set of full size prints of the Contract Drawings for "As-
Constructed" purposes. This set of prints shall be maintained in a clean condition on site and
shall be marked up by the Contractor to show the "As-Constructed" Works. "As-Constructed"
measurements shall be made by a qualified surveyor. Deviations to the Plans shall be marked on
the prints in red ink with unchanged dimensions and levels underlined in red ink. Each drawing
shall be certified "As-Constructed" dated and signed by the Contractor and the Superintendent's
Representative as soon as practicable after completion of the work shown on that drawing. In
due course the full set of "As Constructed" Drawings shall be delivered to the Superintendent
who will acknowledge receipt in writing.
The Certificate of Practical Completion of the Works will not be issued until after the
Superintendent has received the full set of approved "As-Constructed" Drawings.
M P ROGERS & ASSOCIATES Quinns Beach Coastal Protection Works
Report R078 Rev 0, Page 26
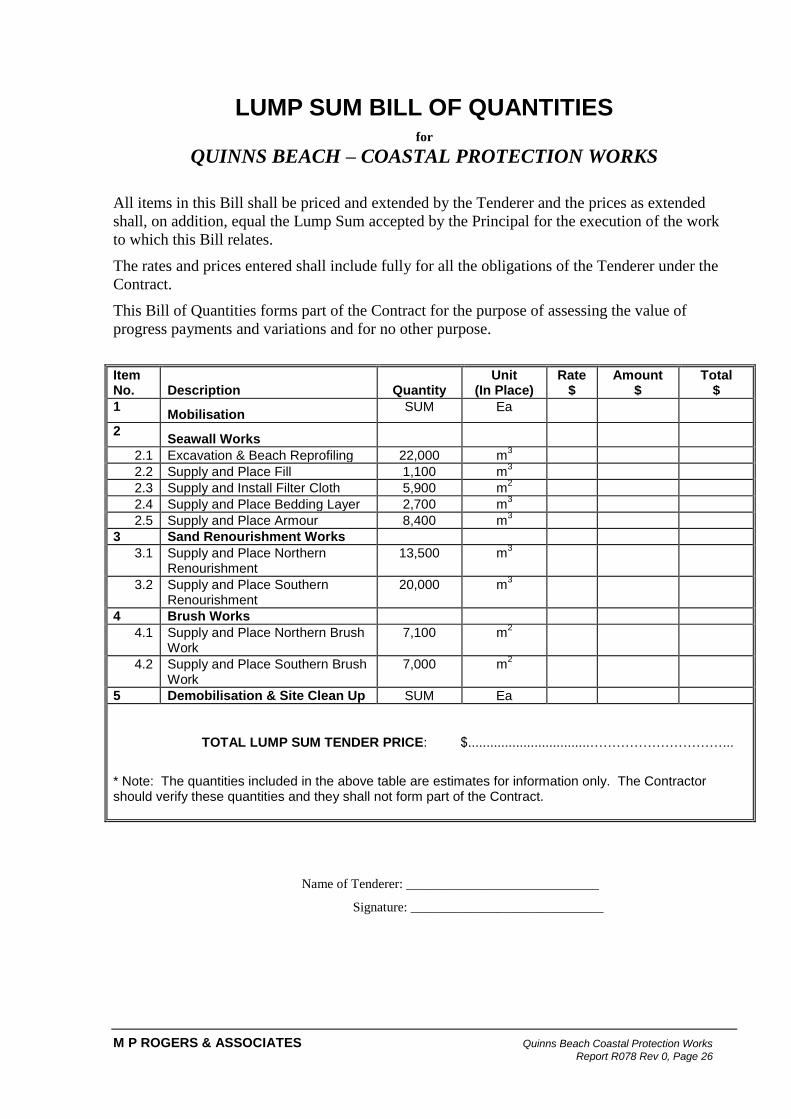
LUMP SUM BILL OF QUANTITIES for
QUINNS BEACH – COASTAL PROTECTION WORKS
All items in this Bill shall be priced and extended by the Tenderer and the prices as extended
shall, on addition, equal the Lump Sum accepted by the Principal for the execution of the work
to which this Bill relates.
The rates and prices entered shall include fully for all the obligations of the Tenderer under the
Contract.
This Bill of Quantities forms part of the Contract for the purpose of assessing the value of
progress payments and variations and for no other purpose.
Item No.
Description
Quantity
Unit (In Place)
Rate $
Amount $
Total $
1 Mobilisation
SUM Ea
2 Seawall Works
2.1 Excavation & Beach Reprofiling 22,000 m3
2.2 Supply and Place Fill 1,100 m3
2.3 Supply and Install Filter Cloth 5,900 m2
2.4 Supply and Place Bedding Layer 2,700 m3
2.5 Supply and Place Armour 8,400 m3
3 Sand Renourishment Works
3.1 Supply and Place Northern Renourishment
13,500 m3
3.2 Supply and Place Southern Renourishment
20,000 m3
4 Brush Works
4.1 Supply and Place Northern Brush Work
7,100 m2
4.2 Supply and Place Southern Brush Work
7,000 m2
5 Demobilisation & Site Clean Up SUM Ea
TOTAL LUMP SUM TENDER PRICE: $.................................…………………………...
* Note: The quantities included in the above table are estimates for information only. The Contractor should verify these quantities and they shall not form part of the Contract.
Name of Tenderer: _____________________________
Signature: _____________________________
M P ROGERS & ASSOCIATES Quinns Beach Coastal Protection Works
Report R078 Rev 0, Page 27
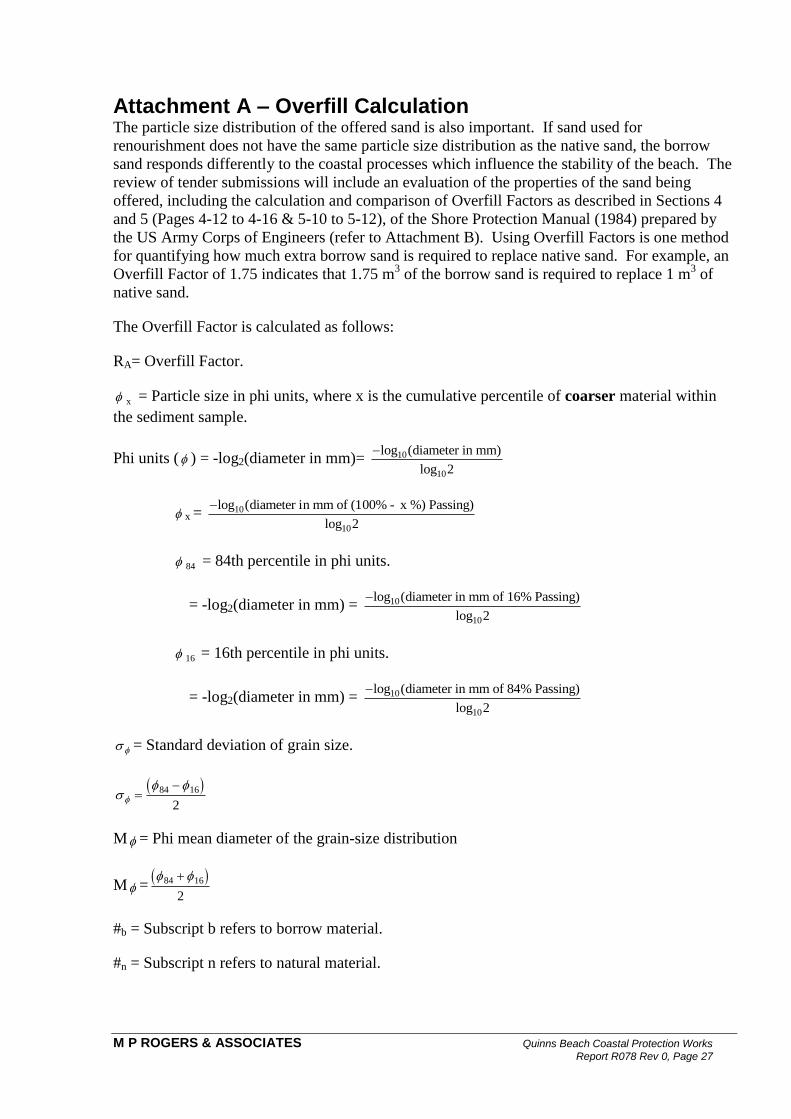
Attachment A – Overfill Calculation The particle size distribution of the offered sand is also important. If sand used for
renourishment does not have the same particle size distribution as the native sand, the borrow
sand responds differently to the coastal processes which influence the stability of the beach. The
review of tender submissions will include an evaluation of the properties of the sand being
offered, including the calculation and comparison of Overfill Factors as described in Sections 4
and 5 (Pages 4-12 to 4-16 & 5-10 to 5-12), of the Shore Protection Manual (1984) prepared by
the US Army Corps of Engineers (refer to Attachment B). Using Overfill Factors is one method
for quantifying how much extra borrow sand is required to replace native sand. For example, an
Overfill Factor of 1.75 indicates that 1.75 m3 of the borrow sand is required to replace 1 m
3 of
native sand.
The Overfill Factor is calculated as follows:
RA= Overfill Factor.
x = Particle size in phi units, where x is the cumulative percentile of coarser material within
the sediment sample.
Phi units ( ) = -log2(diameter in mm)= log diameter in mm)
log
10
10
(
2
x = log diameter in mm of (100% - x %) Passing)
log
10
10
(
2
84 = 84th percentile in phi units.
= -log2(diameter in mm) = log diameter in mm of 16% Passing)
log
10
10
(
2
16 = 16th percentile in phi units.
= -log2(diameter in mm) = log diameter in mm of 84% Passing)
log
10
10
(
2
= Standard deviation of grain size.
84 16
2
M = Phi mean diameter of the grain-size distribution
M = 84 16
2
#b = Subscript b refers to borrow material.
#n = Subscript n refers to natural material.
M P ROGERS & ASSOCIATES Quinns Beach Coastal Protection Works
Report R078 Rev 0, Page 28
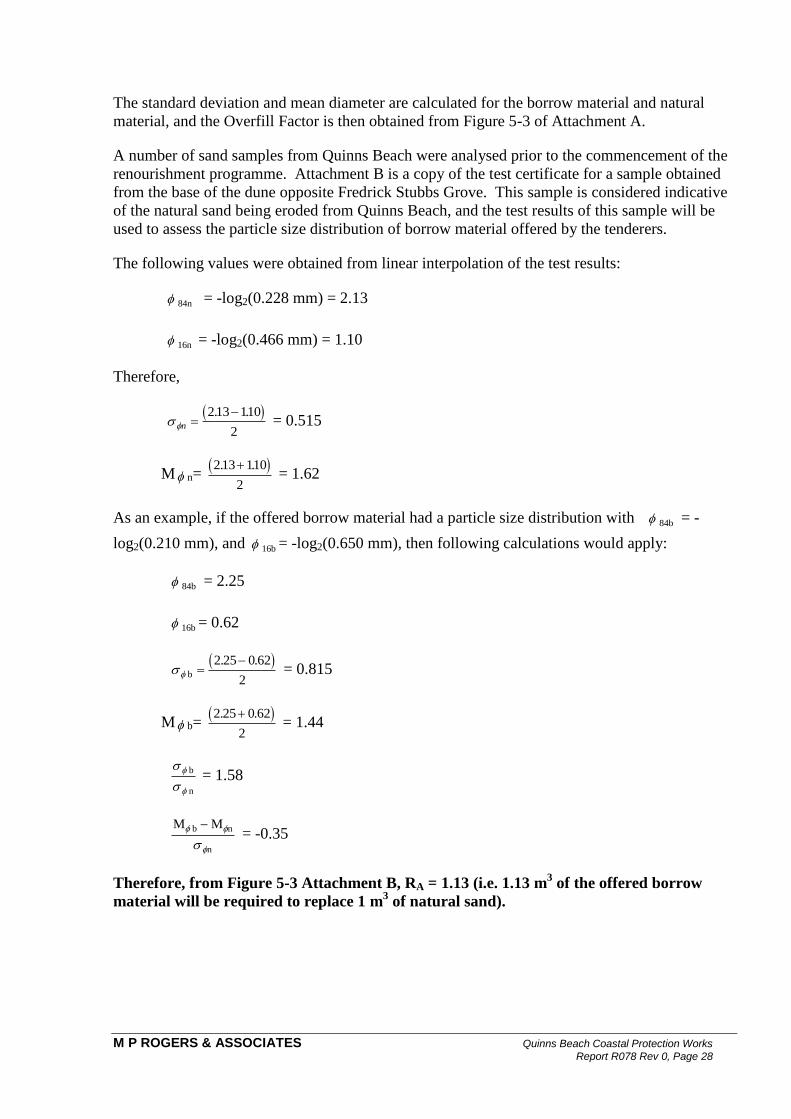
The standard deviation and mean diameter are calculated for the borrow material and natural
material, and the Overfill Factor is then obtained from Figure 5-3 of Attachment A.
A number of sand samples from Quinns Beach were analysed prior to the commencement of the
renourishment programme. Attachment B is a copy of the test certificate for a sample obtained
from the base of the dune opposite Fredrick Stubbs Grove. This sample is considered indicative
of the natural sand being eroded from Quinns Beach, and the test results of this sample will be
used to assess the particle size distribution of borrow material offered by the tenderers.
The following values were obtained from linear interpolation of the test results:
84n = -log2(0.228 mm) = 2.13
16n = -log2(0.466 mm) = 1.10
Therefore,
n
213 110
2
. . = 0.515
M n= 213 110
2
. . = 1.62
As an example, if the offered borrow material had a particle size distribution with 84b = -
log2(0.210 mm), and 16b = -log2(0.650 mm), then following calculations would apply:
84b = 2.25
16b = 0.62
b
2 25 0 62
2
. . = 0.815
M b= 2 25 0 62
2
. . = 1.44
b
n
= 1.58
M M b n
n
= -0.35
Therefore, from Figure 5-3 Attachment B, RA = 1.13 (i.e. 1.13 m3 of the offered borrow
material will be required to replace 1 m3 of natural sand).

M P ROGERS & ASSOCIATES Quinns Beach Coastal Protection Works
Report R078 Rev 0, Page 29
Attachment B - Extracts from Shore Protection Manual (1984)
M P ROGERS & ASSOCIATES Quinns Beach Coastal Protection Works
Report R078 Rev 0, Page 30
M P ROGERS & ASSOCIATES Quinns Beach Coastal Protection Works
Report R078 Rev 0, Page 31
M P ROGERS & ASSOCIATES Quinns Beach Coastal Protection Works
Report R078 Rev 0, Page 32
M P ROGERS & ASSOCIATES Quinns Beach Coastal Protection Works
Report R078 Rev 0, Page 33
M P ROGERS & ASSOCIATES Quinns Beach Coastal Protection Works
Report R078 Rev 0, Page 34
M P ROGERS & ASSOCIATES Quinns Beach Coastal Protection Works
Report R078 Rev 0, Page 35
M P ROGERS & ASSOCIATES Quinns Beach Coastal Protection Works
Report R078 Rev 0, Page 36
M P ROGERS & ASSOCIATES Quinns Beach Coastal Protection Works
Report R078 Rev 0, Page 37
M P ROGERS & ASSOCIATES Quinns Beach Coastal Protection Works
Report R078 Rev 0, Page 38

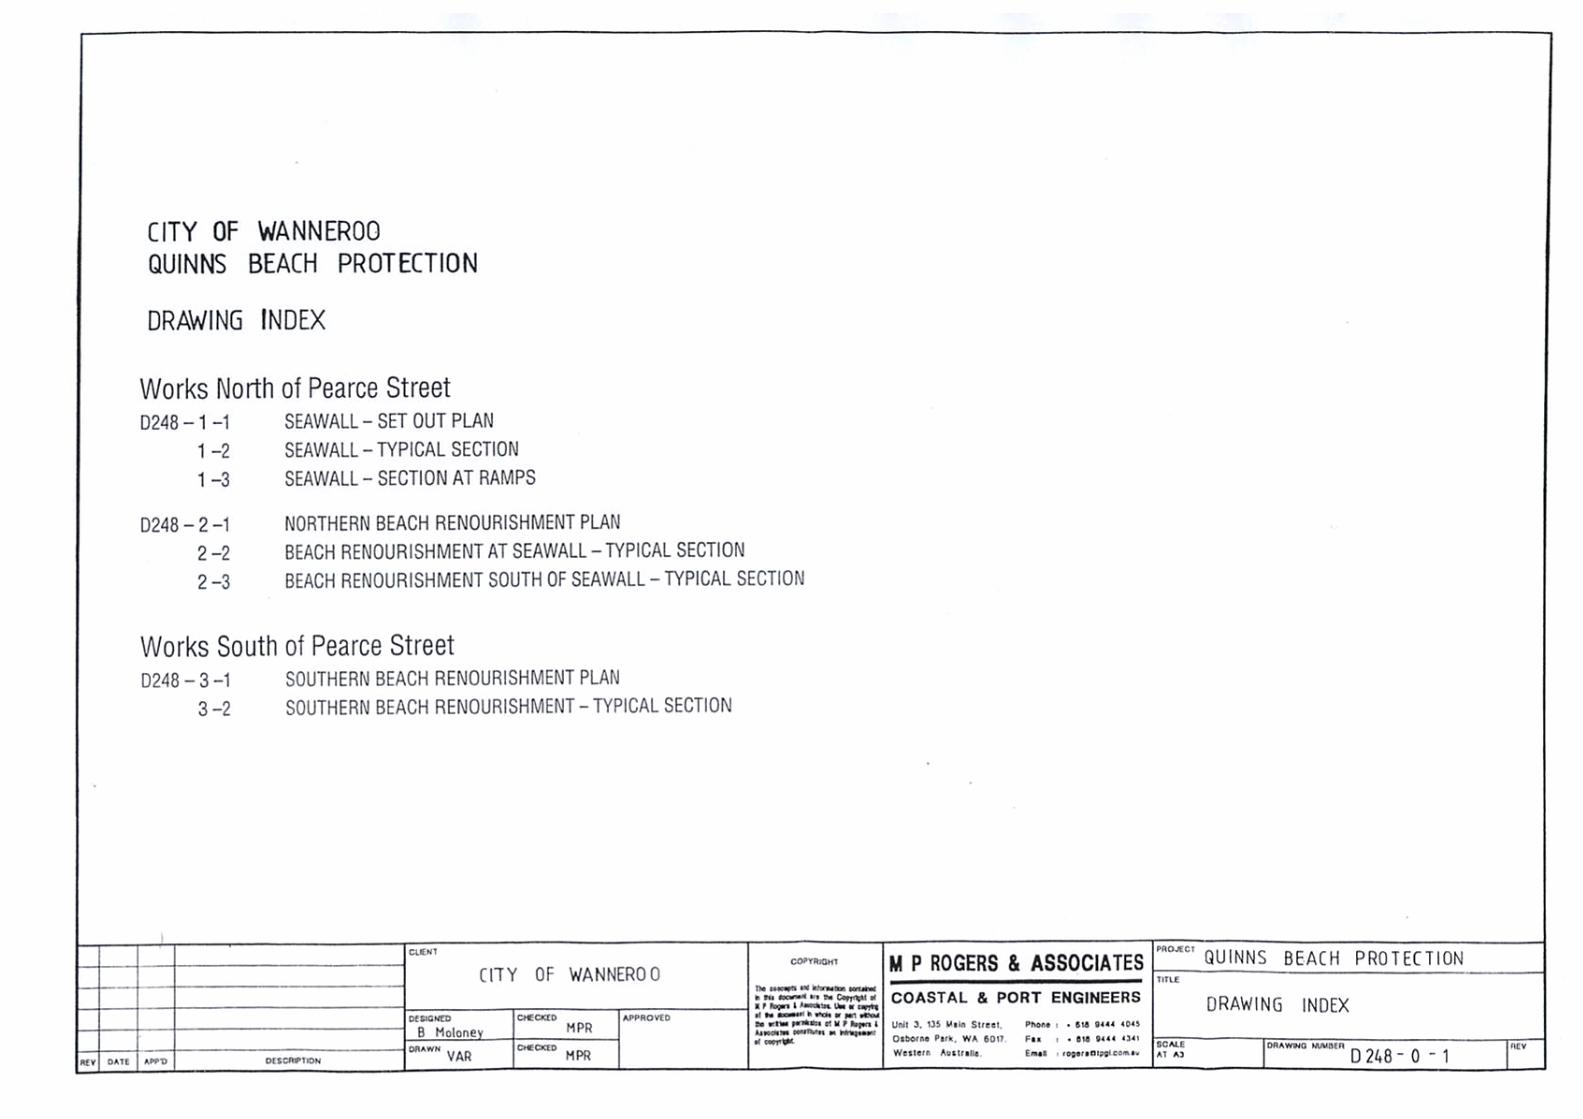
Appendix B – Design Drawings
M P ROGERS & ASSOCIATES Quinns Beach Coastal Protection Works
Report R078 Rev 0, Page 39