Embed Size (px)
Citation preview
Fort Lauderdale-Hollywood International Airport
Prepared by: Broward County Aviation Department
First Quarter 2015 March 2015
Partnership for
Quieter Skies Report
Broward County Aviation Department Partnership for Quieter Skies Quarterly Report
First Quarter 2015
This report was prepared by the Broward County Aviation Department (954-359-6181).
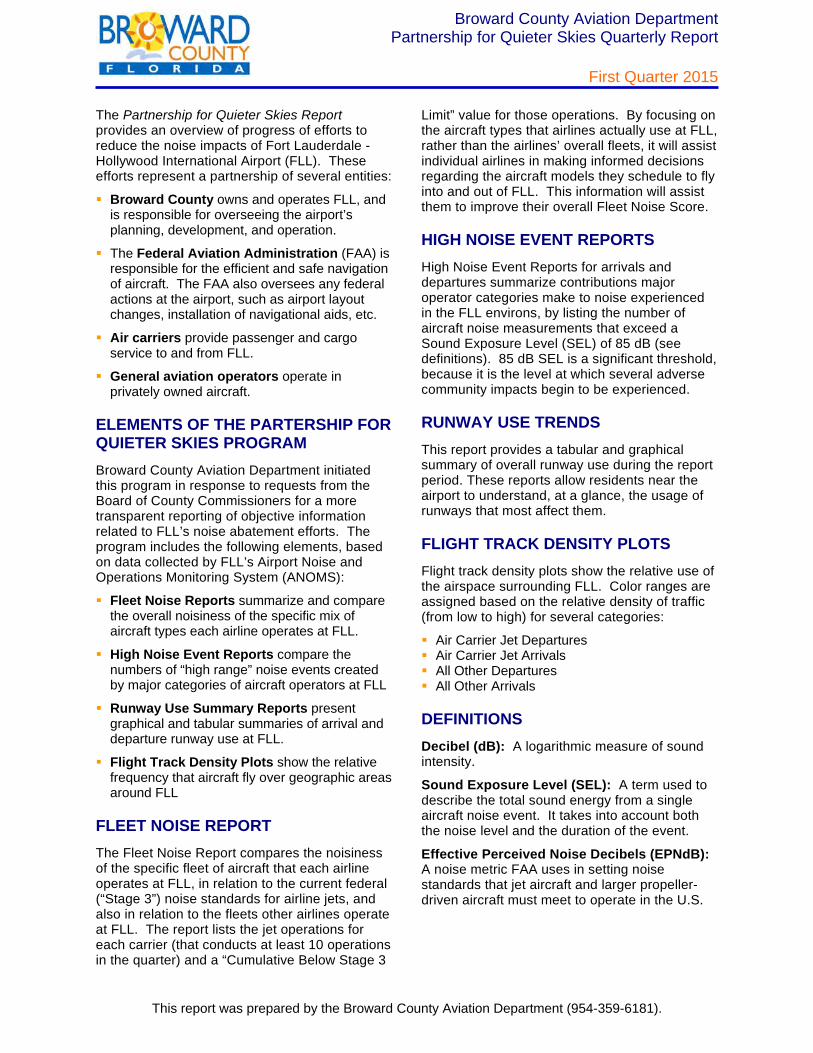
The Partnership for Quieter Skies Report provides an overview of progress of efforts to reduce the noise impacts of Fort Lauderdale -Hollywood International Airport (FLL). These efforts represent a partnership of several entities:
Broward County owns and operates FLL, and is responsible for overseeing the airport’s planning, development, and operation.
The Federal Aviation Administration (FAA) is responsible for the efficient and safe navigation of aircraft. The FAA also oversees any federal actions at the airport, such as airport layout changes, installation of navigational aids, etc.
Air carriers provide passenger and cargo service to and from FLL.
General aviation operators operate in privately owned aircraft.
ELEMENTS OF THE PARTERSHIP FOR QUIETER SKIES PROGRAM Broward County Aviation Department initiated this program in response to requests from the Board of County Commissioners for a more transparent reporting of objective information related to FLL’s noise abatement efforts. The program includes the following elements, based on data collected by FLL’s Airport Noise and Operations Monitoring System (ANOMS):
Fleet Noise Reports summarize and compare the overall noisiness of the specific mix of aircraft types each airline operates at FLL.
High Noise Event Reports compare the numbers of “high range” noise events created by major categories of aircraft operators at FLL
Runway Use Summary Reports present graphical and tabular summaries of arrival and departure runway use at FLL.
Flight Track Density Plots show the relative frequency that aircraft fly over geographic areas around FLL
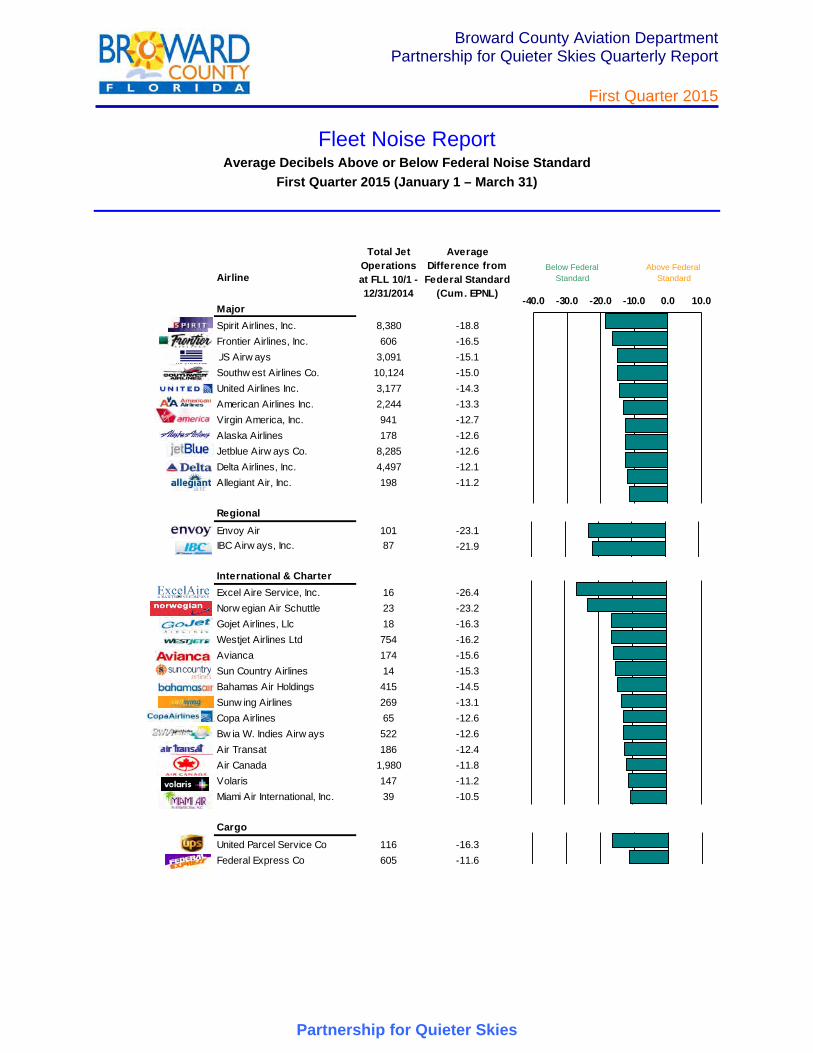
FLEET NOISE REPORT The Fleet Noise Report compares the noisiness of the specific fleet of aircraft that each airline operates at FLL, in relation to the current federal (“Stage 3”) noise standards for airline jets, and also in relation to the fleets other airlines operate at FLL. The report lists the jet operations for each carrier (that conducts at least 10 operations in the quarter) and a “Cumulative Below Stage 3
Limit” value for those operations. By focusing on the aircraft types that airlines actually use at FLL, rather than the airlines’ overall fleets, it will assist individual airlines in making informed decisions regarding the aircraft models they schedule to fly into and out of FLL. This information will assist them to improve their overall Fleet Noise Score.
HIGH NOISE EVENT REPORTS High Noise Event Reports for arrivals and departures summarize contributions major operator categories make to noise experienced in the FLL environs, by listing the number of aircraft noise measurements that exceed a Sound Exposure Level (SEL) of 85 dB (see definitions). 85 dB SEL is a significant threshold, because it is the level at which several adverse community impacts begin to be experienced.
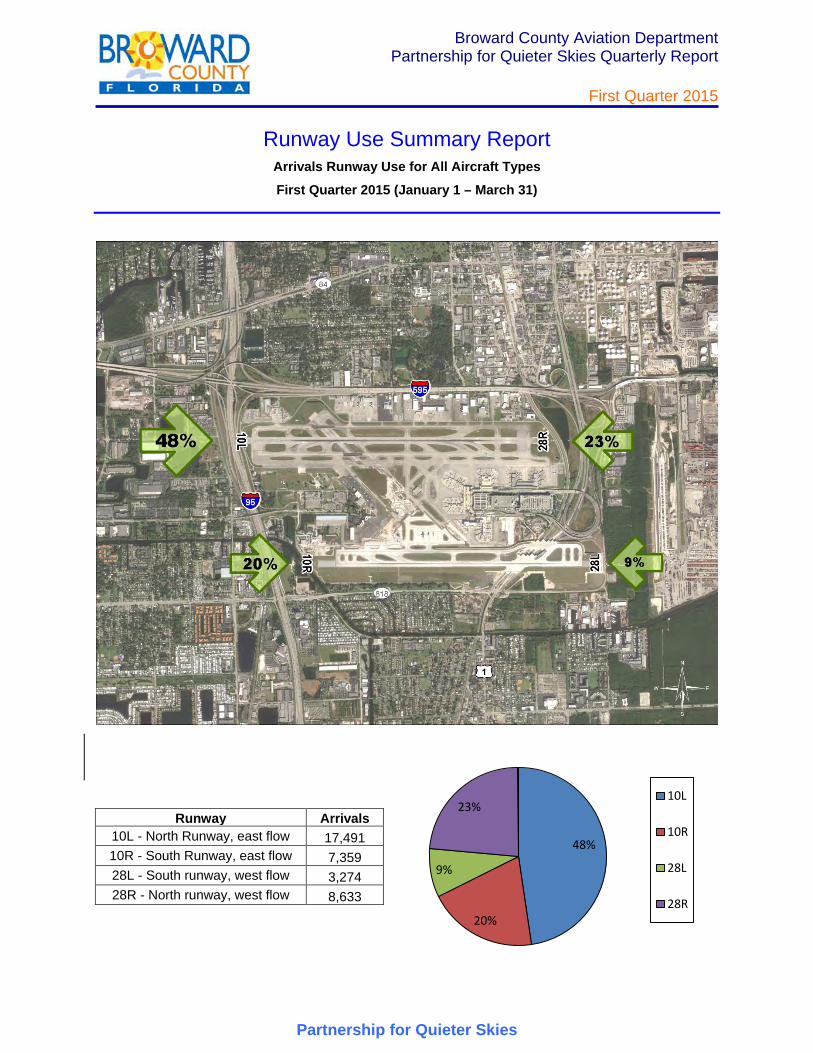
RUNWAY USE TRENDS This report provides a tabular and graphical summary of overall runway use during the report period. These reports allow residents near the airport to understand, at a glance, the usage of runways that most affect them.
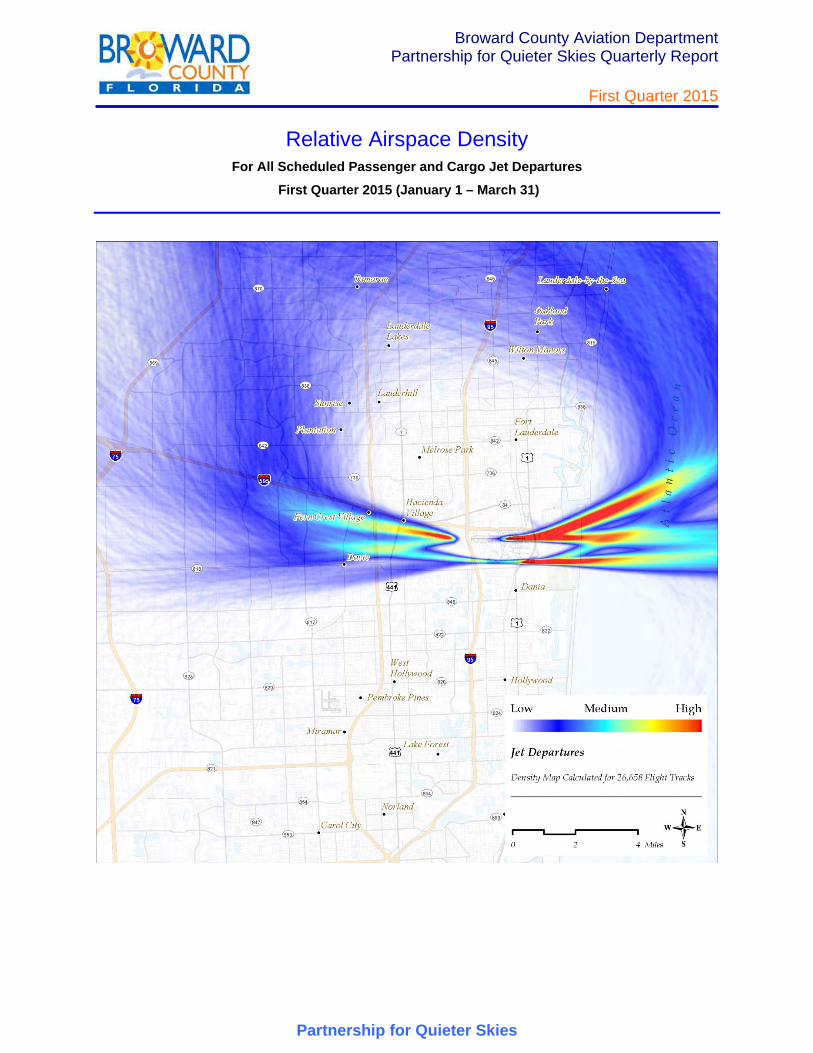
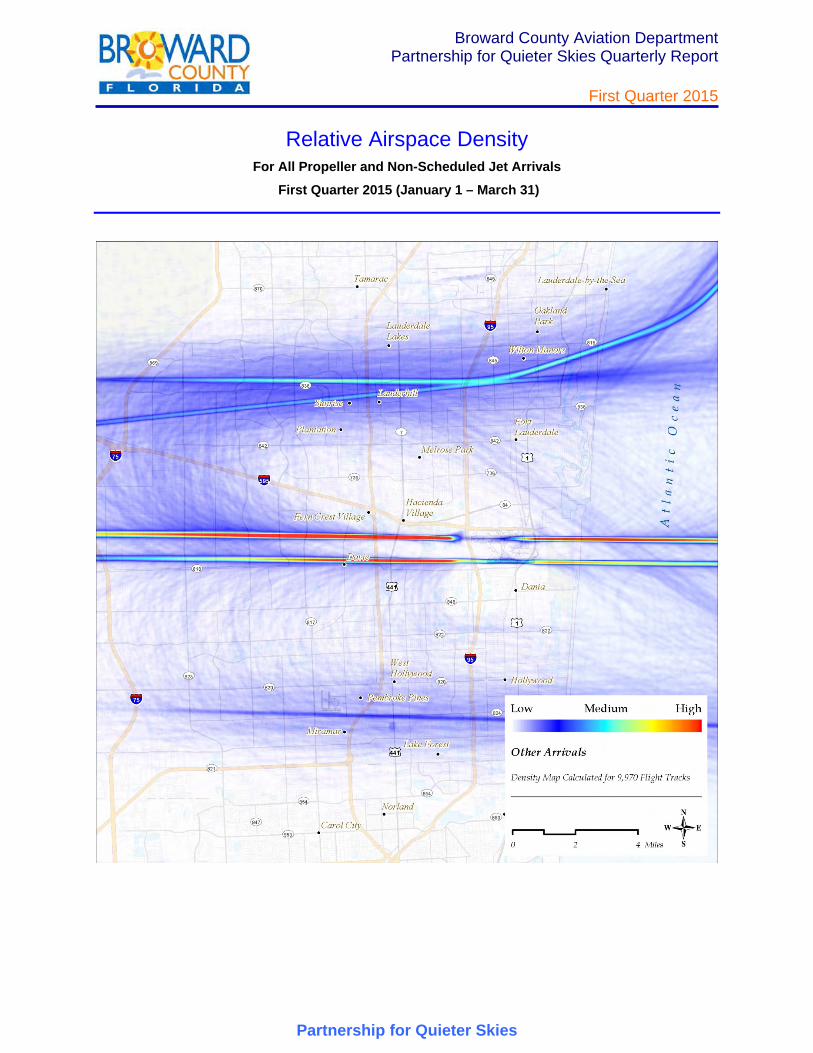
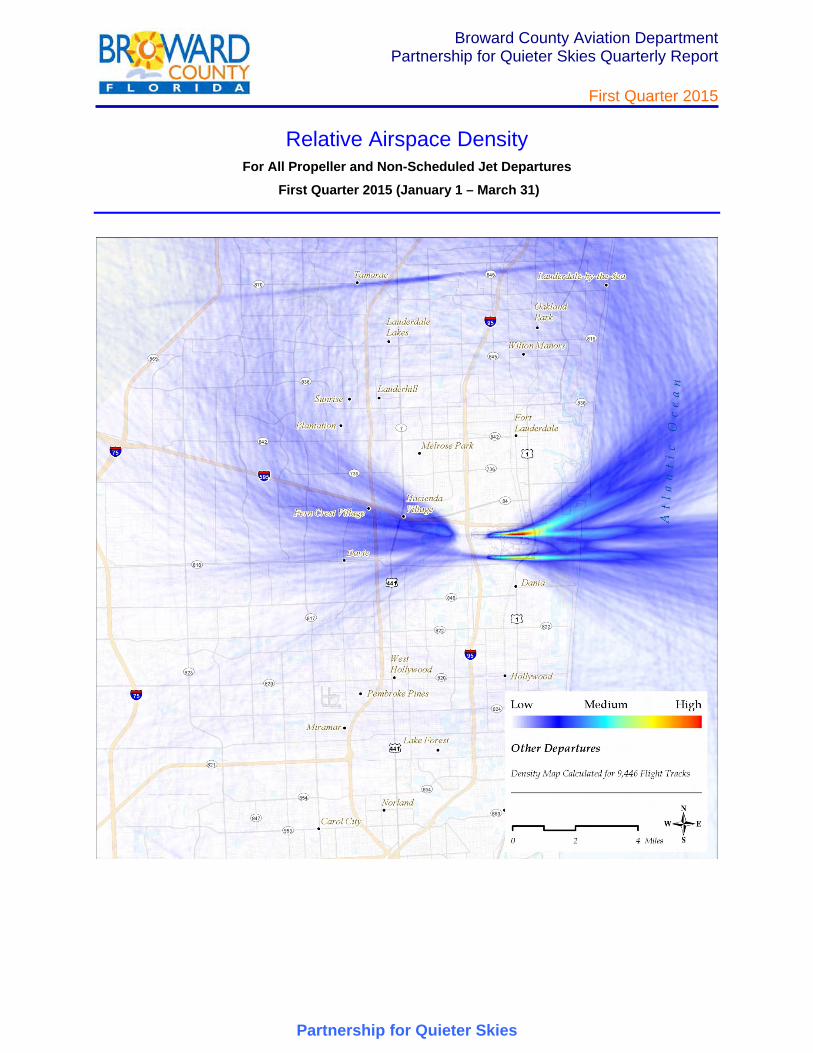
FLIGHT TRACK DENSITY PLOTS Flight track density plots show the relative use of the airspace surrounding FLL. Color ranges are assigned based on the relative density of traffic (from low to high) for several categories:
Air Carrier Jet Departures Air Carrier Jet Arrivals All Other Departures All Other Arrivals
DEFINITIONS Decibel (dB): A logarithmic measure of sound intensity.
Sound Exposure Level (SEL): A term used to describe the total sound energy from a single aircraft noise event. It takes into account both the noise level and the duration of the event.
Effective Perceived Noise Decibels (EPNdB): A noise metric FAA uses in setting noise standards that jet aircraft and larger propeller-driven aircraft must meet to operate in the U.S.
Broward County Aviation Department Partnership for Quieter Skies Quarterly Report
First Quarter 2015
Partnership for Quieter Skies
Fleet Noise Report Average Decibels Above or Below Federal Noise Standard
First Quarter 2015 (January 1 – March 31)
Airline
MajorSpirit Airlines, Inc. 8,380 -18.8Frontier Airlines, Inc. 606 -16.5US Airw ays 3,091 -15.1Southw est Airlines Co. 10,124 -15.0United Airlines Inc. 3,177 -14.3American Airlines Inc. 2,244 -13.3Virgin America, Inc. 941 -12.7Alaska Airlines 178 -12.6Jetblue Airw ays Co. 8,285 -12.6Delta Airlines, Inc. 4,497 -12.1Allegiant Air, Inc. 198 -11.2
RegionalEnvoy Air 101 -23.1IBC Airw ays, Inc. 87 -21.9
International & CharterExcel Aire Service, Inc. 16 -26.4Norw egian Air Schuttle 23 -23.2Gojet Airlines, Llc 18 -16.3Westjet Airlines Ltd 754 -16.2Avianca 174 -15.6Sun Country Airlines 14 -15.3Bahamas Air Holdings 415 -14.5Sunw ing Airlines 269 -13.1Copa Airlines 65 -12.6Bw ia W. Indies Airw ays 522 -12.6Air Transat 186 -12.4Air Canada 1,980 -11.8Volaris 147 -11.2Miami Air International, Inc. 39 -10.5
CargoUnited Parcel Service Co 116 -16.3Federal Express Co 605 -11.6
Total Jet Operations at FLL 10/1 - 12/31/2014
Average Difference from Federal Standard
(Cum. EPNL)
Below Federal Standard
Above Federal Standard
-40.0 -30.0 -20.0 -10.0 0.0 10.0
Broward County Aviation Department Partnership for Quieter Skies Quarterly Report
First Quarter 2015
Partnership for Quieter Skies
48%
20%
9%
23% 10L
10R
28L
28R
48%
20%
9%
23% 10L
10R
28L
28R
Runway Use Summary Report
Arrivals Runway Use for All Aircraft Types
First Quarter 2015 (January 1 – March 31)
Runway Arrivals 10L - North Runway, east flow 17,491 10R - South Runway, east flow 7,359 28L - South runway, west flow 3,274 28R - North runway, west flow 8,633
Broward County Aviation Department Partnership for Quieter Skies Quarterly Report
First Quarter 2015
Partnership for Quieter Skies
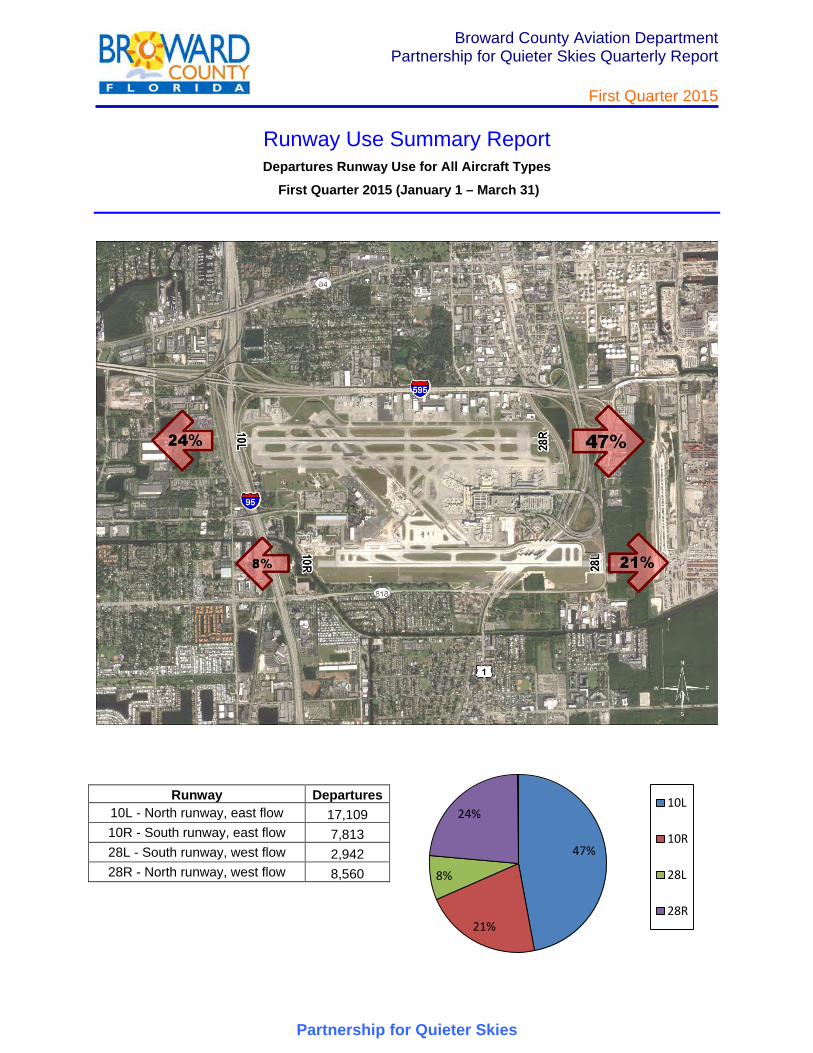
47%
21%
8%
24% 10L
10R
28L
28R
Runway Use Summary Report Departures Runway Use for All Aircraft Types
First Quarter 2015 (January 1 – March 31)
Runway Departures 10L - North runway, east flow 17,109 10R - South runway, east flow 7,813 28L - South runway, west flow 2,942 28R - North runway, west flow 8,560
Broward County Aviation Department Partnership for Quieter Skies Quarterly Report
First Quarter 2015
Partnership for Quieter Skies
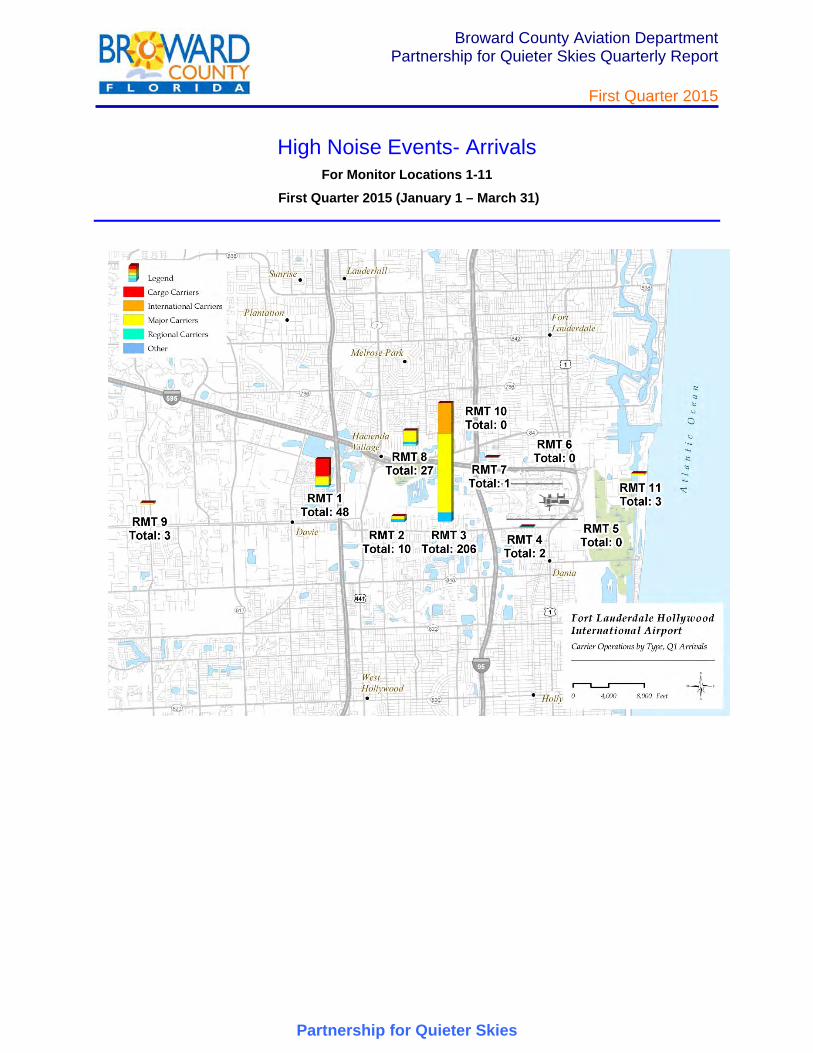
High Noise Events- Arrivals For Monitor Locations 1-11
First Quarter 2015 (January 1 – March 31)
Broward County Aviation Department Partnership for Quieter Skies Quarterly Report
First Quarter 2015
Partnership for Quieter Skies
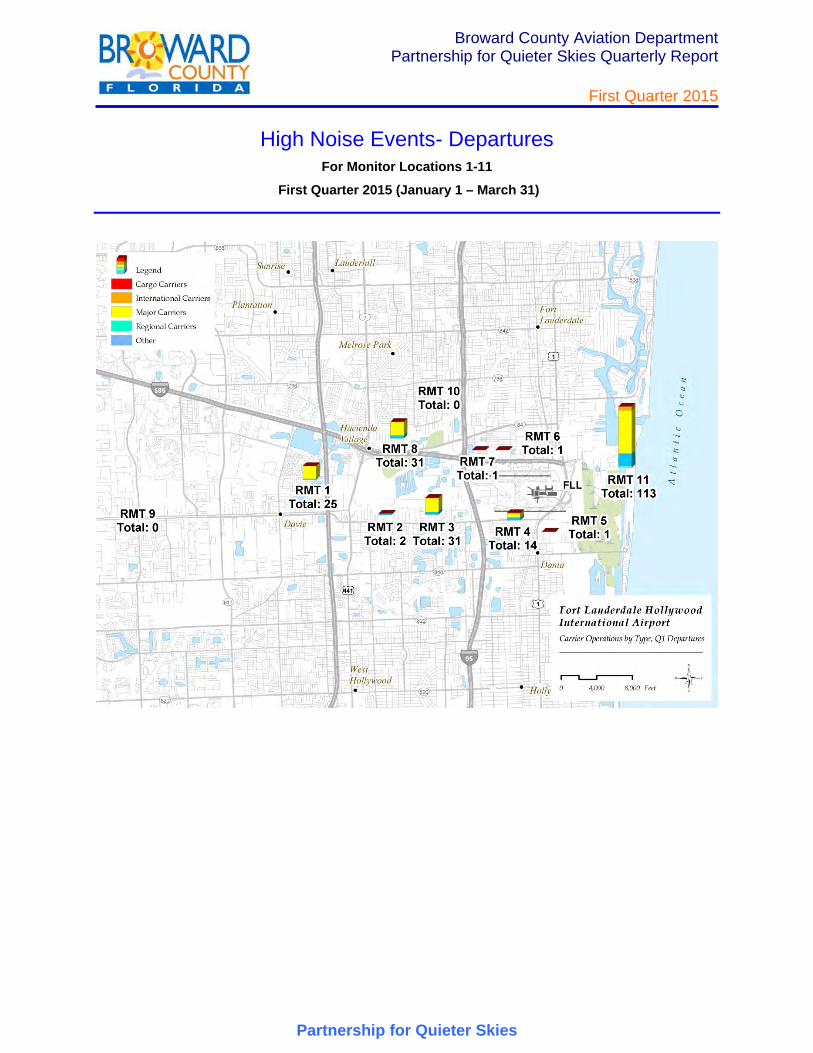
High Noise Events- Departures For Monitor Locations 1-11
First Quarter 2015 (January 1 – March 31)
Broward County Aviation Department Partnership for Quieter Skies Quarterly Report
First Quarter 2015
Partnership for Quieter Skies
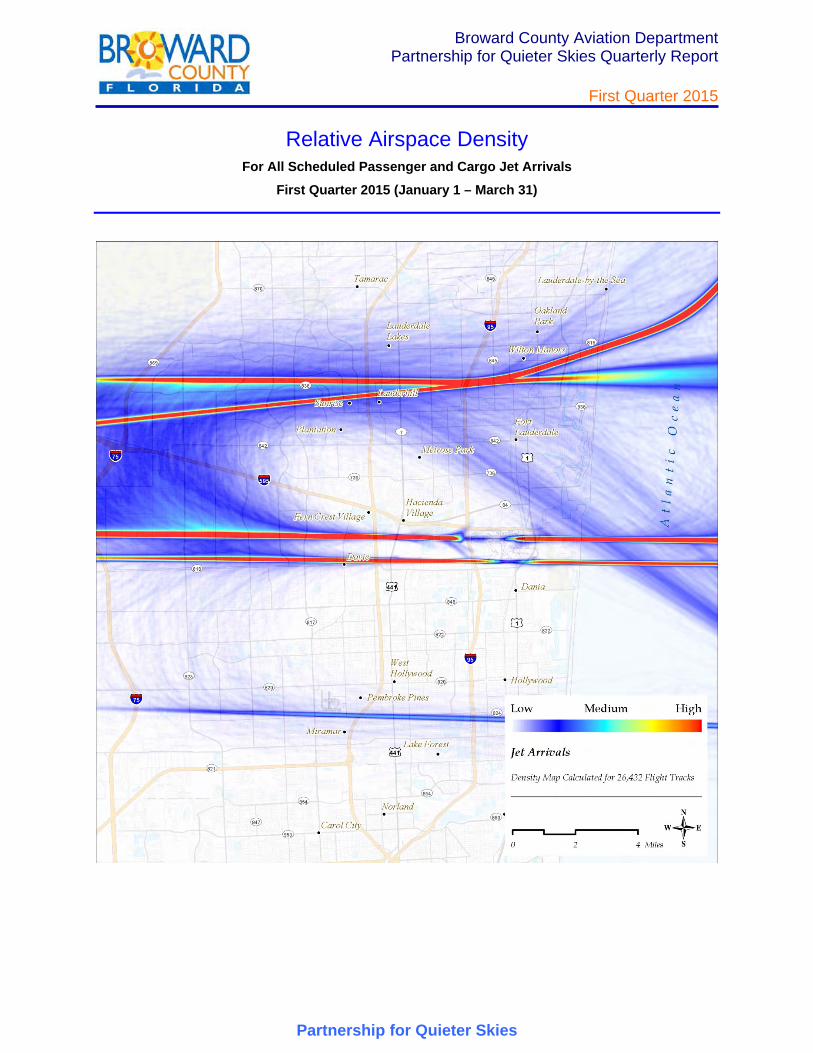
Relative Airspace Density
For All Scheduled Passenger and Cargo Jet Arrivals
First Quarter 2015 (January 1 – March 31)
Broward County Aviation Department Partnership for Quieter Skies Quarterly Report
First Quarter 2015
Partnership for Quieter Skies
Relative Airspace Density For All Scheduled Passenger and Cargo Jet Departures
First Quarter 2015 (January 1 – March 31)
Broward County Aviation Department Partnership for Quieter Skies Quarterly Report
First Quarter 2015
Partnership for Quieter Skies
Relative Airspace Density For All Propeller and Non-Scheduled Jet Arrivals
First Quarter 2015 (January 1 – March 31)
Broward County Aviation Department Partnership for Quieter Skies Quarterly Report
First Quarter 2015
Partnership for Quieter Skies
Relative Airspace Density For All Propeller and Non-Scheduled Jet Departures
First Quarter 2015 (January 1 – March 31)