Embed Size (px)
DESCRIPTION
Muslim : 200 Hindu : 100 Others : 50 3. Let X = age, Y = weight. Then we have: Full marks: 100 (20x5) Time: 50 minutes 5. For the following table, construct a histogram: Quiz examination INTERNATIONAL UNIVERSITY OF BUSINESS AGRICULTURE AND TECHNOLOGY 1. For the following table, construct a line graph: 4. A graph that uses vertical bars to represent data is called a _________ Construct a bar diagram for this data. Construct a scatter diagram for this data. Md. Mortuza Ahmmed
Citation preview
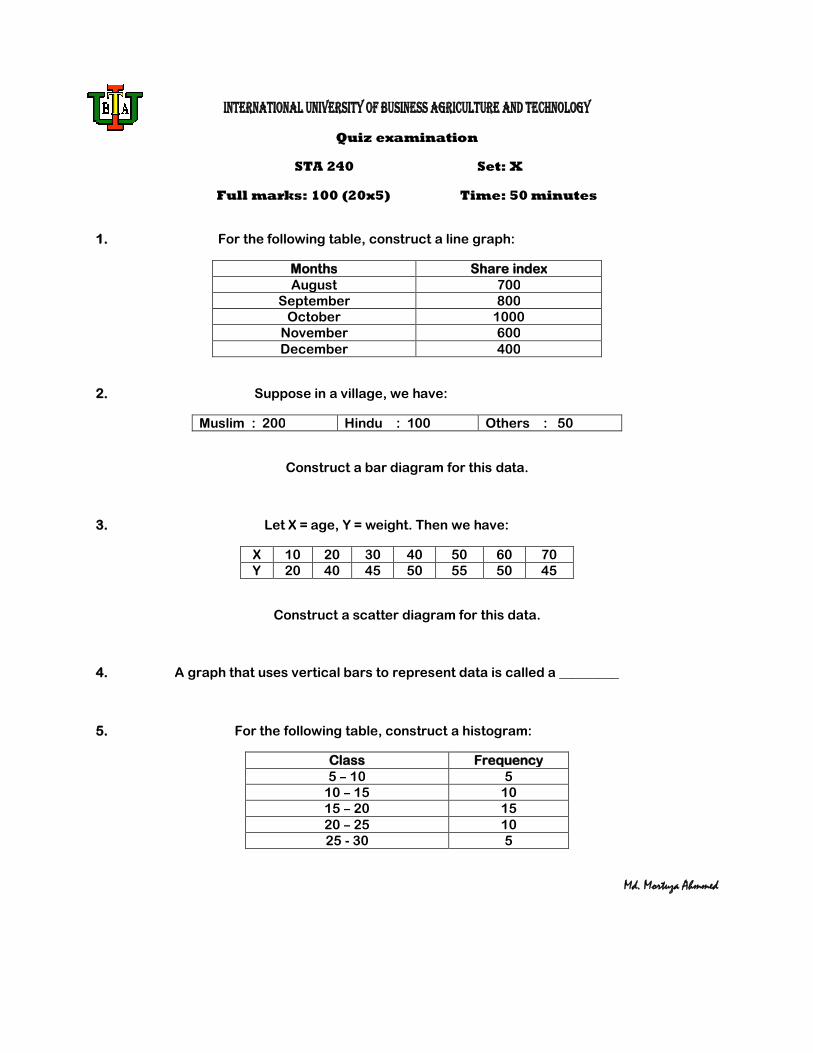
INTERNATIONAL UNIVERSITY OF BUSINESS AGRICULTURE AND TECHNOLOGY
Quiz examination
STA 240 Set: X
Full marks: 100 (20x5) Time: 50 minutes
1. For the following table, construct a line graph:
Months Share index August 700
September 800 October 1000
November 600 December 400
2. Suppose in a village, we have:
Muslim : 200 Hindu : 100 Others : 50
Construct a bar diagram for this data.
3. Let X = age, Y = weight. Then we have:
X 10 20 30 40 50 60 70 Y 20 40 45 50 55 50 45
Construct a scatter diagram for this data.
4. A graph that uses vertical bars to represent data is called a _________
5. For the following table, construct a histogram:
Class Frequency 5 – 10 5
10 – 15 10 15 – 20 15 20 – 25 10 25 - 30 5
Md. Mortuza Ahmmed

![[Digitare qui] [Digitare qui] [Digitare qui] - EwasteR Project · 2. Context and definition of the E-Waste Recycling and Reuse system in Europe Greater use of IT has resulted in an](https://img.pdfslide.us/doc/110x75/5fa84d0a92fa0f348b5e1be1/digitare-qui-digitare-qui-digitare-qui-ewaster-2-context-and-definition.jpg)