Embed Size (px)
Citation preview
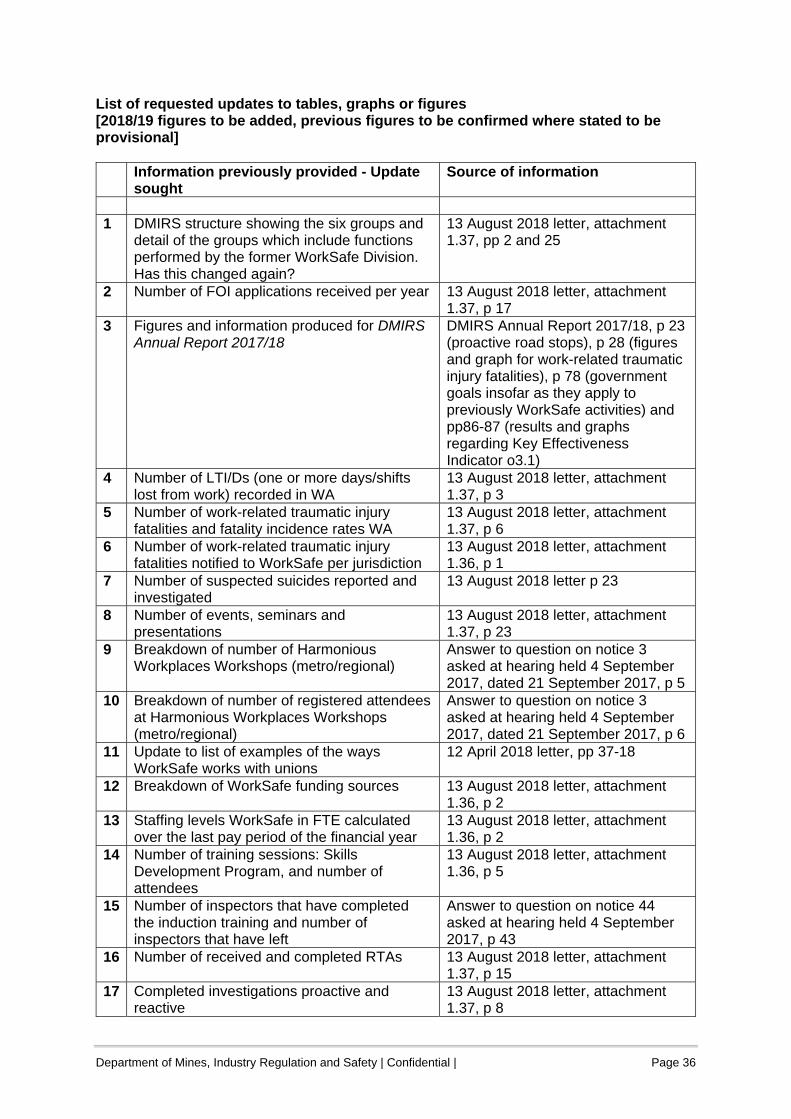
Requested updates to 43 tables, graphs and figures .,.
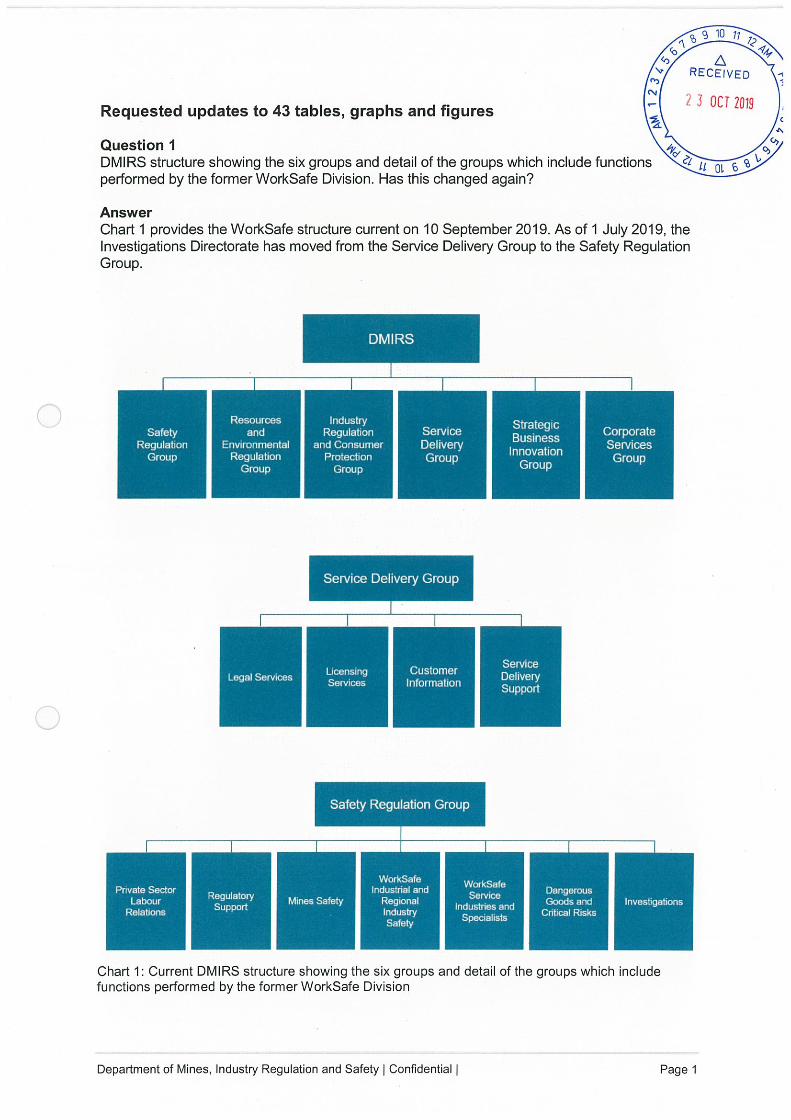
Question , ,DMIRS structure showing the six groups and detail of the groups which include functions C:' 11performed by the former Worksafe Division, Has this changed again?
Answer
Chart , provides the Worksafe structure current on 10 September 2019, As of I July 2019, theInvestigations Directorate has moved from the Service Delivery Group to the Safety RegulationGroup.
SafetyRegulalior,
Group
Resources
and
SriViron"lentBl
RegulationGroup
,, g 10 71^?, ^^ ^
,\RECEIVED
OCT 2119
DMIRS
*>\,
,,>a,
IndustryRegulation
and Consunier
Project!on
Group
^
Service
DeliveryGroup
<*
C
,\
O>
01 6^
Service Delivery Group
^
Legal Services
StrategicBusiness
Innovation
Group
LicensingServices
Private SectorLabour
Relations
CorporateServices
Group
Chart I : Current DMIRS structure showing the six groups and detail of the groups which includefunctions performed by the former Worksafe Division
RegulatorySupport
Safety Regulation Group
Seivice
DellveiySupport
Department of Mines, Industry Regulation and Safety I Confidential I
Mines Safely
WoikSaloIndustrial and
RegionalIndustrySalely
WorksBfeService
Industries grid
Specialists
DangerousGoods and
Critical RisksInvestigations
Page I
Department of Mines, Industry Regulation and Safety | Confidential | Page 2
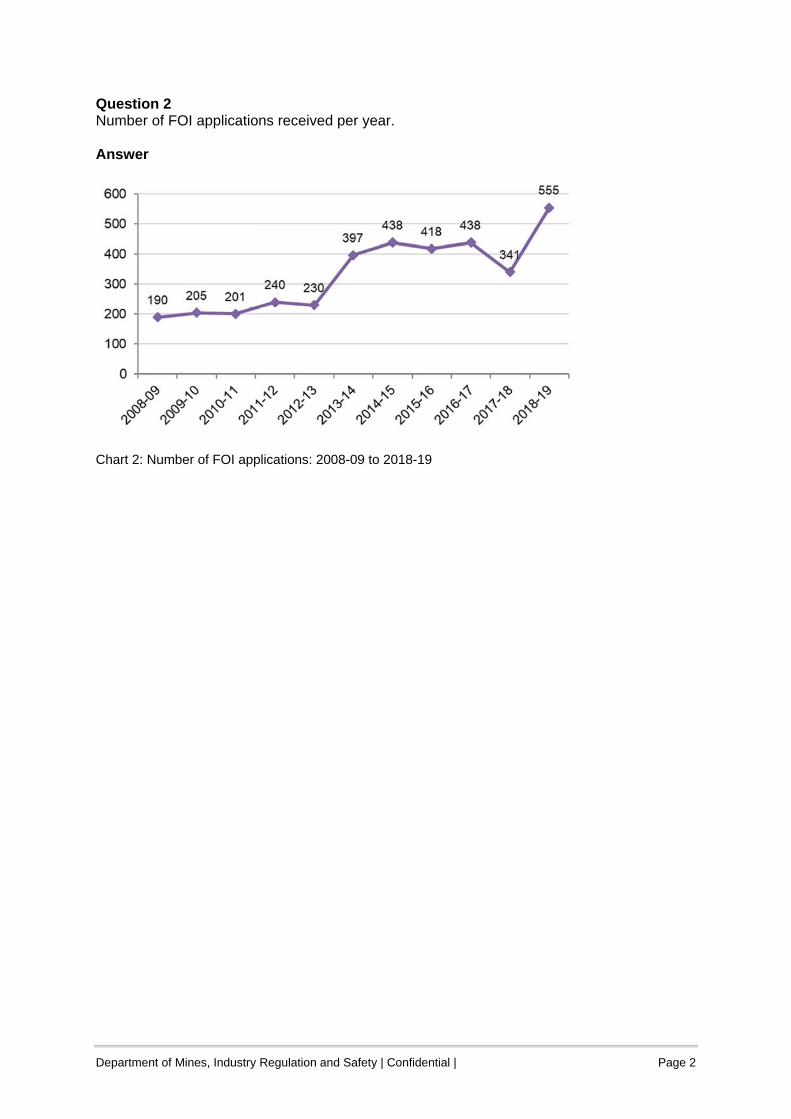
Question 2 Number of FOI applications received per year. Answer
Chart 2: Number of FOI applications: 2008-09 to 2018-19
Department of Mines, Industry Regulation and Safety | Confidential | Page 3
Question 3 Figures and information produced for DMIRS Annual Report 2017/18. Produce updated figures in relation to:
p23 (proactive road stops) p28 (figures and graph for work-related traumatic injury fatalities) p78 (government goals insofar as they apply to previously WorkSafe activities); and pp86-87 (results and graphs regarding Key Effectiveness Indicator o3.1)
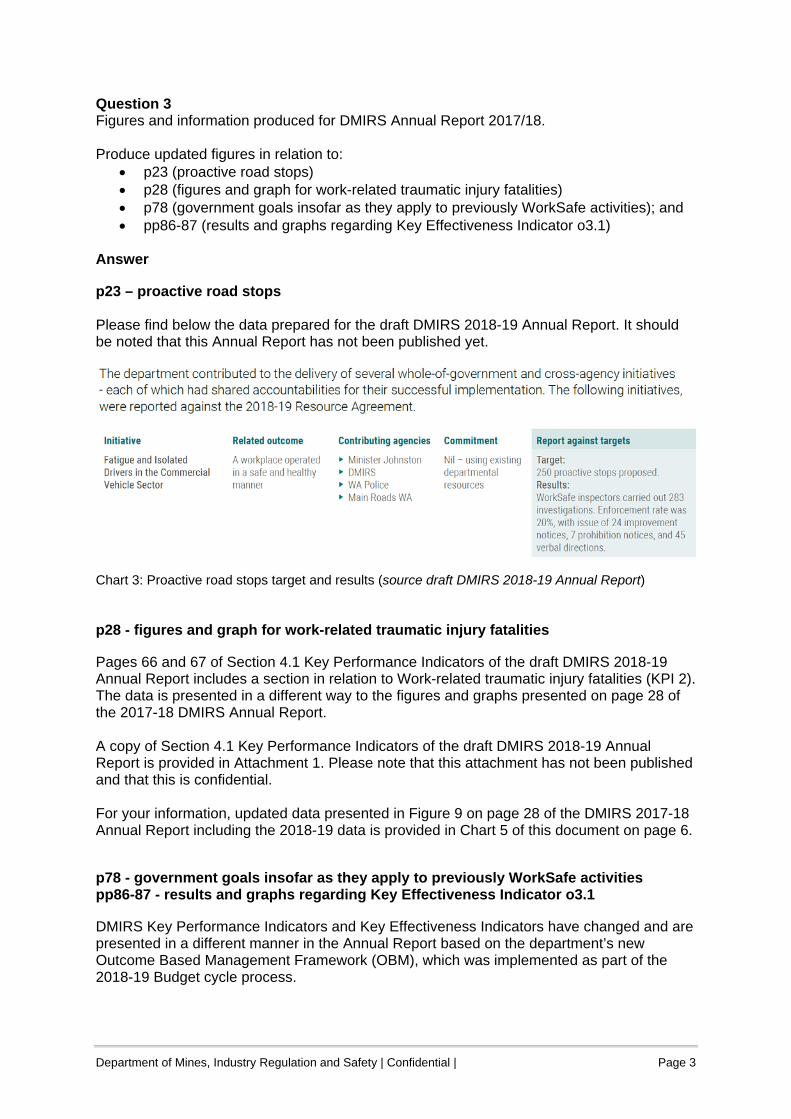
Answer p23 – proactive road stops Please find below the data prepared for the draft DMIRS 2018-19 Annual Report. It should be noted that this Annual Report has not been published yet.
Chart 3: Proactive road stops target and results (source draft DMIRS 2018-19 Annual Report) p28 - figures and graph for work-related traumatic injury fatalities Pages 66 and 67 of Section 4.1 Key Performance Indicators of the draft DMIRS 2018-19 Annual Report includes a section in relation to Work-related traumatic injury fatalities (KPI 2). The data is presented in a different way to the figures and graphs presented on page 28 of the 2017-18 DMIRS Annual Report. A copy of Section 4.1 Key Performance Indicators of the draft DMIRS 2018-19 Annual Report is provided in Attachment 1. Please note that this attachment has not been published and that this is confidential. For your information, updated data presented in Figure 9 on page 28 of the DMIRS 2017-18 Annual Report including the 2018-19 data is provided in Chart 5 of this document on page 6. p78 - government goals insofar as they apply to previously WorkSafe activities pp86-87 - results and graphs regarding Key Effectiveness Indicator o3.1 DMIRS Key Performance Indicators and Key Effectiveness Indicators have changed and are presented in a different manner in the Annual Report based on the department’s new Outcome Based Management Framework (OBM), which was implemented as part of the 2018-19 Budget cycle process.
Department of Mines, Industry Regulation and Safety | Confidential | Page 4
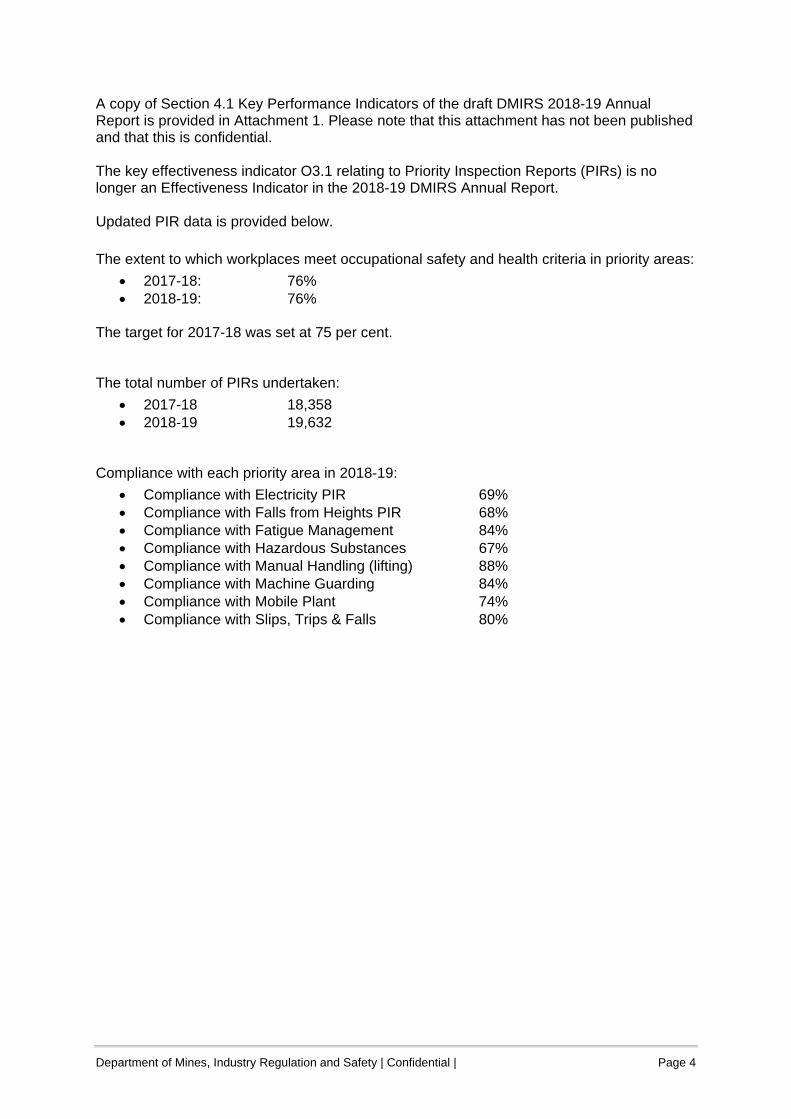
A copy of Section 4.1 Key Performance Indicators of the draft DMIRS 2018-19 Annual Report is provided in Attachment 1. Please note that this attachment has not been published and that this is confidential. The key effectiveness indicator O3.1 relating to Priority Inspection Reports (PIRs) is no longer an Effectiveness Indicator in the 2018-19 DMIRS Annual Report. Updated PIR data is provided below.
The extent to which workplaces meet occupational safety and health criteria in priority areas:
2017-18: 76% 2018-19: 76%
The target for 2017-18 was set at 75 per cent. The total number of PIRs undertaken:
2017-18 18,358 2018-19 19,632
Compliance with each priority area in 2018-19:
Compliance with Electricity PIR 69% Compliance with Falls from Heights PIR 68% Compliance with Fatigue Management 84% Compliance with Hazardous Substances 67% Compliance with Manual Handling (lifting) 88% Compliance with Machine Guarding 84% Compliance with Mobile Plant 74% Compliance with Slips, Trips & Falls 80%
Department of Mines, Industry Regulation and Safety | Confidential | Page 5
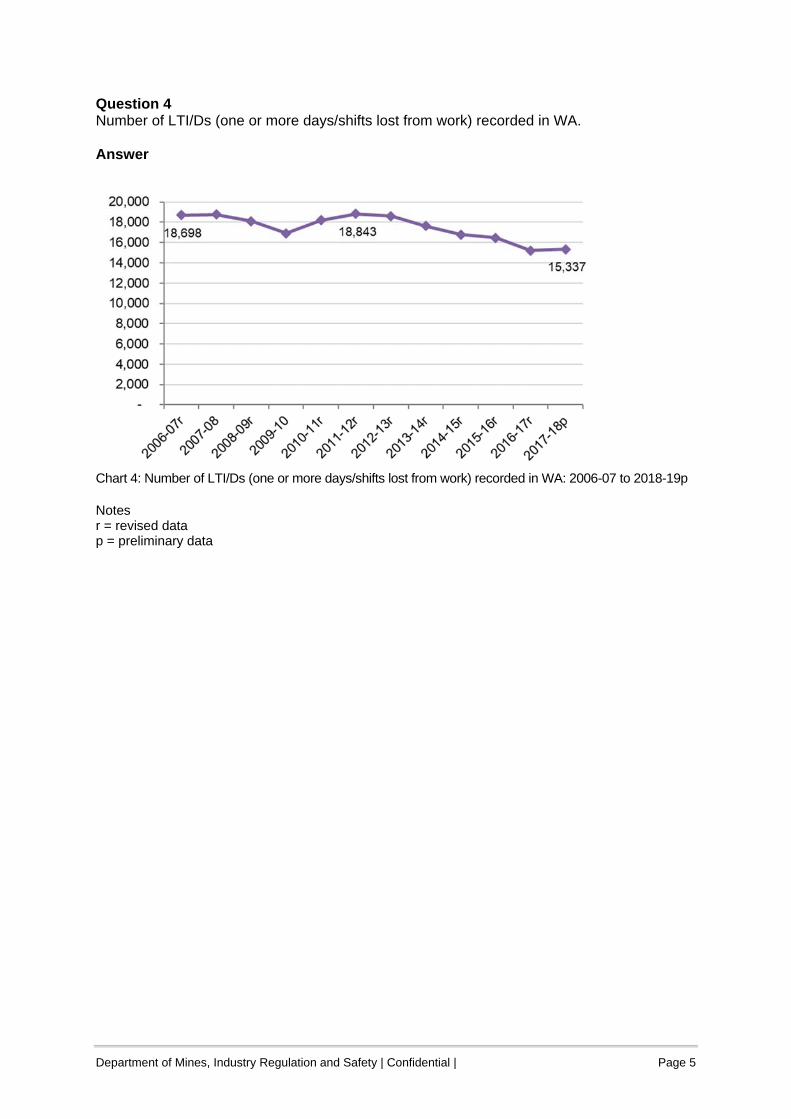
Question 4 Number of LTI/Ds (one or more days/shifts lost from work) recorded in WA. Answer
Chart 4: Number of LTI/Ds (one or more days/shifts lost from work) recorded in WA: 2006-07 to 2018-19p Notes r = revised data p = preliminary data
Department of Mines, Industry Regulation and Safety | Confidential | Page 6
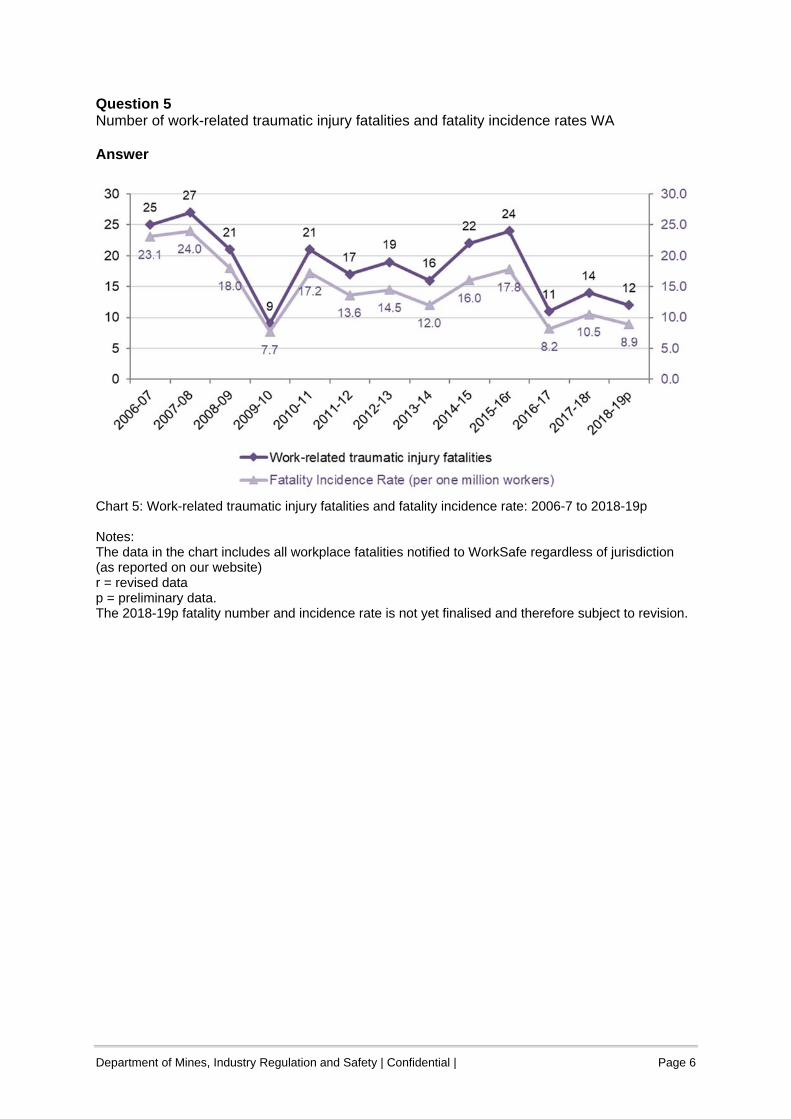
Question 5 Number of work-related traumatic injury fatalities and fatality incidence rates WA Answer
Chart 5: Work-related traumatic injury fatalities and fatality incidence rate: 2006-7 to 2018-19p Notes: The data in the chart includes all workplace fatalities notified to WorkSafe regardless of jurisdiction (as reported on our website) r = revised data p = preliminary data. The 2018-19p fatality number and incidence rate is not yet finalised and therefore subject to revision.
Department of Mines, Industry Regulation and Safety | Confidential | Page 7
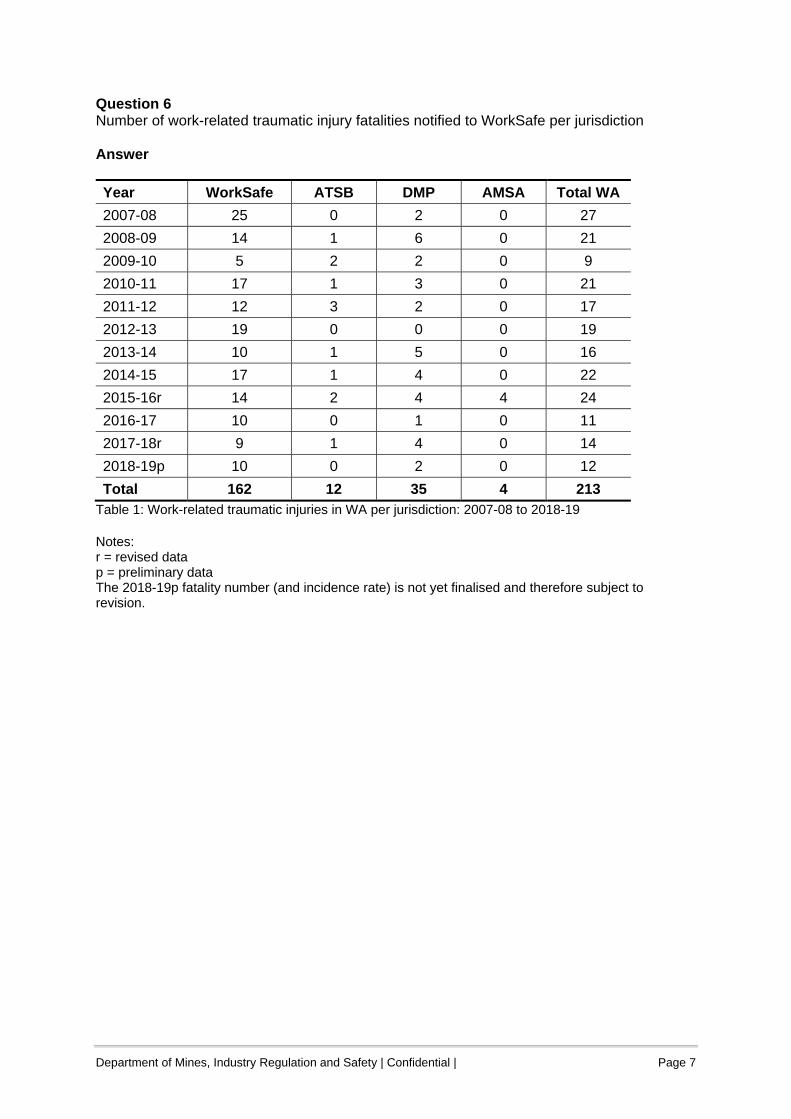
Question 6 Number of work-related traumatic injury fatalities notified to WorkSafe per jurisdiction Answer
Year WorkSafe ATSB DMP AMSA Total WA
2007-08 25 0 2 0 27
2008-09 14 1 6 0 21
2009-10 5 2 2 0 9
2010-11 17 1 3 0 21
2011-12 12 3 2 0 17
2012-13 19 0 0 0 19
2013-14 10 1 5 0 16
2014-15 17 1 4 0 22
2015-16r 14 2 4 4 24
2016-17 10 0 1 0 11
2017-18r 9 1 4 0 14
2018-19p 10 0 2 0 12
Total 162 12 35 4 213 Table 1: Work-related traumatic injuries in WA per jurisdiction: 2007-08 to 2018-19 Notes: r = revised data p = preliminary data The 2018-19p fatality number (and incidence rate) is not yet finalised and therefore subject to revision.
Department of Mines, Industry Regulation and Safety | Confidential | Page 8
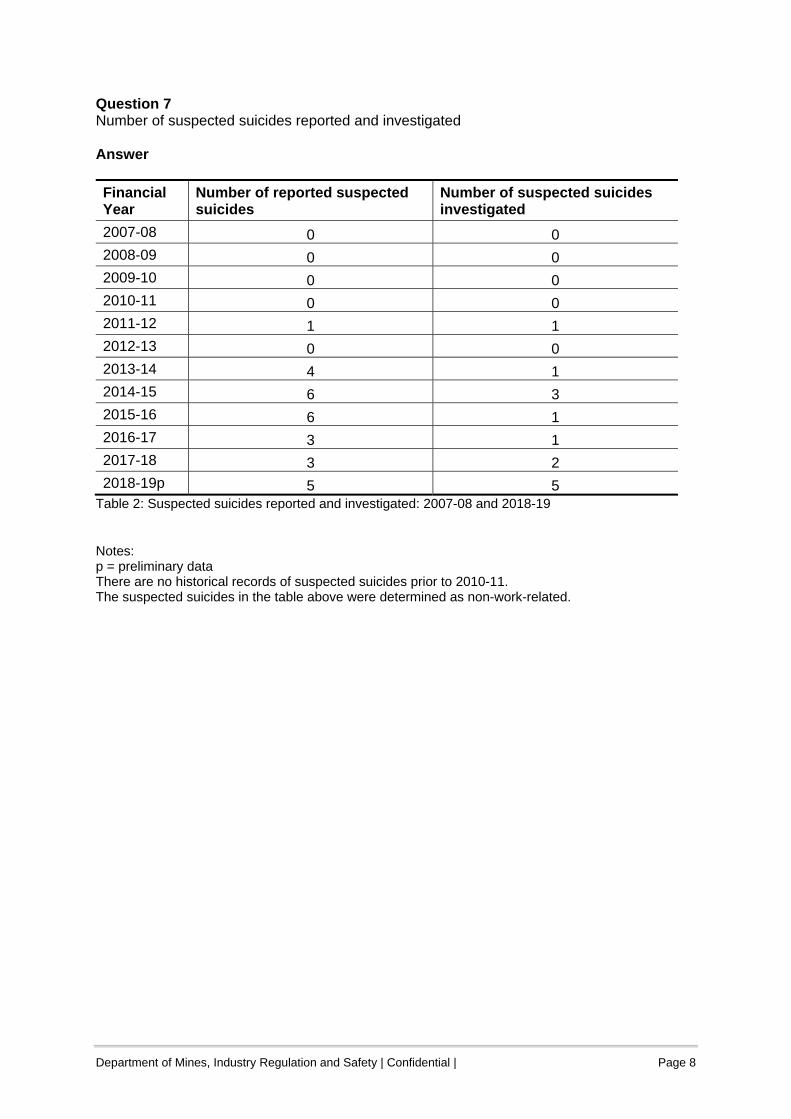
Question 7 Number of suspected suicides reported and investigated Answer
Financial Year
Number of reported suspected suicides
Number of suspected suicides investigated
2007-08 0 0 2008-09 0 0 2009-10 0 0 2010-11 0 0 2011-12 1 1 2012-13 0 0 2013-14 4 1 2014-15 6 3 2015-16 6 1 2016-17 3 1 2017-18 3 2 2018-19p 5 5
Table 2: Suspected suicides reported and investigated: 2007-08 and 2018-19 Notes: p = preliminary data There are no historical records of suspected suicides prior to 2010-11. The suspected suicides in the table above were determined as non-work-related.
Department of Mines, Industry Regulation and Safety | Confidential | Page 9
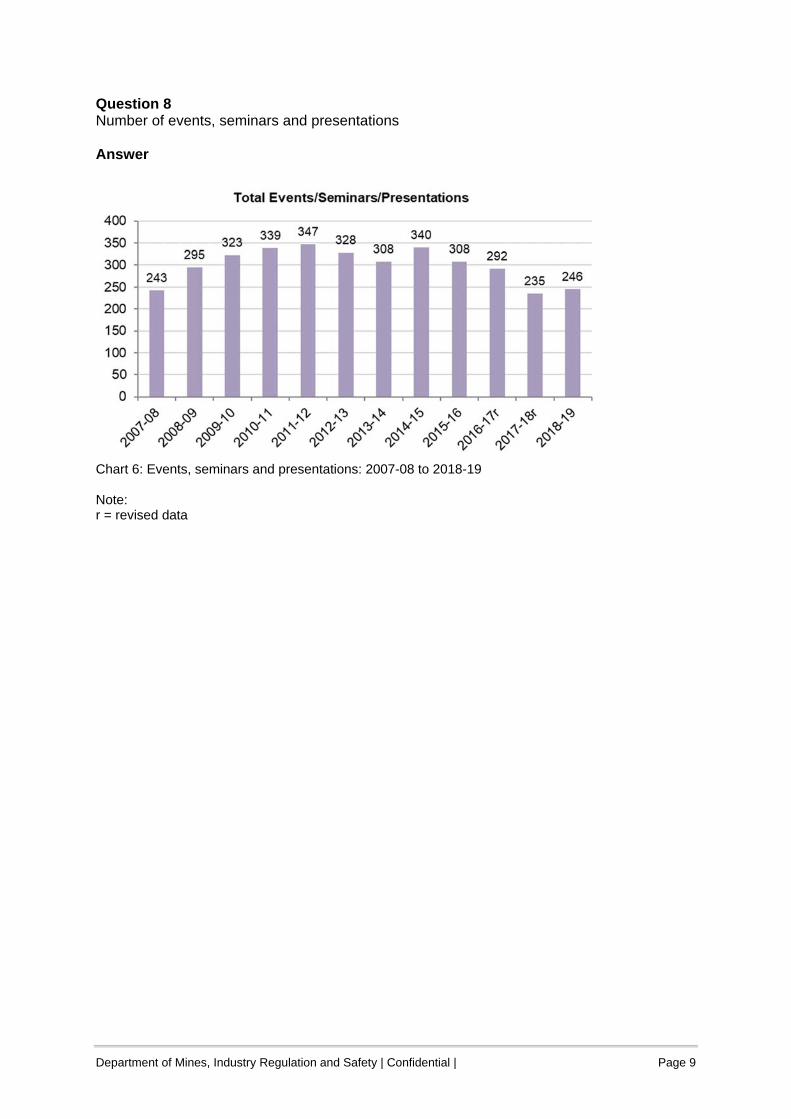
Question 8 Number of events, seminars and presentations Answer
Chart 6: Events, seminars and presentations: 2007-08 to 2018-19 Note: r = revised data
Department of Mines, Industry Regulation and Safety | Confidential | Page 10
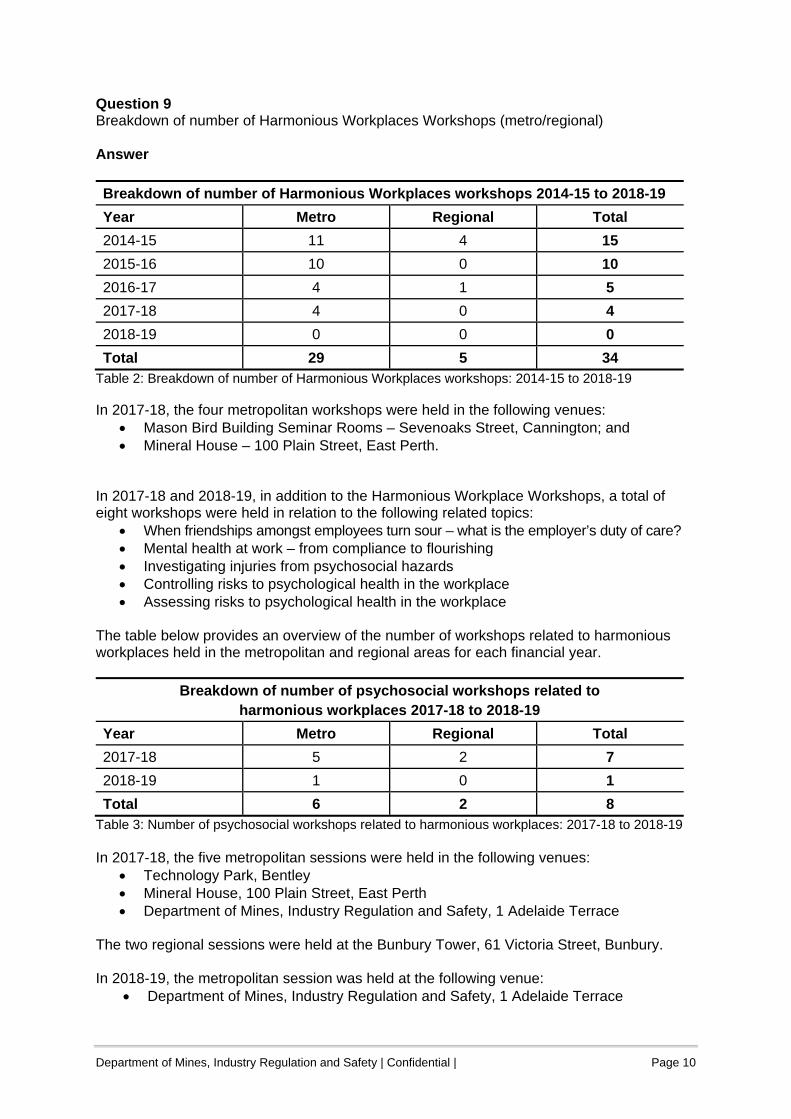
Question 9 Breakdown of number of Harmonious Workplaces Workshops (metro/regional) Answer
Breakdown of number of Harmonious Workplaces workshops 2014-15 to 2018-19
Year Metro Regional Total
2014-15 11 4 15
2015-16 10 0 10
2016-17 4 1 5
2017-18 4 0 4
2018-19 0 0 0
Total 29 5 34 Table 2: Breakdown of number of Harmonious Workplaces workshops: 2014-15 to 2018-19 In 2017-18, the four metropolitan workshops were held in the following venues:
Mason Bird Building Seminar Rooms – Sevenoaks Street, Cannington; and Mineral House – 100 Plain Street, East Perth.
In 2017-18 and 2018-19, in addition to the Harmonious Workplace Workshops, a total of eight workshops were held in relation to the following related topics:
When friendships amongst employees turn sour – what is the employer’s duty of care? Mental health at work – from compliance to flourishing Investigating injuries from psychosocial hazards Controlling risks to psychological health in the workplace Assessing risks to psychological health in the workplace
The table below provides an overview of the number of workshops related to harmonious workplaces held in the metropolitan and regional areas for each financial year.
Breakdown of number of psychosocial workshops related to harmonious workplaces 2017-18 to 2018-19
Year Metro Regional Total
2017-18 5 2 7
2018-19 1 0 1
Total 6 2 8 Table 3: Number of psychosocial workshops related to harmonious workplaces: 2017-18 to 2018-19 In 2017-18, the five metropolitan sessions were held in the following venues:
Technology Park, Bentley Mineral House, 100 Plain Street, East Perth Department of Mines, Industry Regulation and Safety, 1 Adelaide Terrace
The two regional sessions were held at the Bunbury Tower, 61 Victoria Street, Bunbury. In 2018-19, the metropolitan session was held at the following venue:
Department of Mines, Industry Regulation and Safety, 1 Adelaide Terrace
Department of Mines, Industry Regulation and Safety | Confidential | Page 11
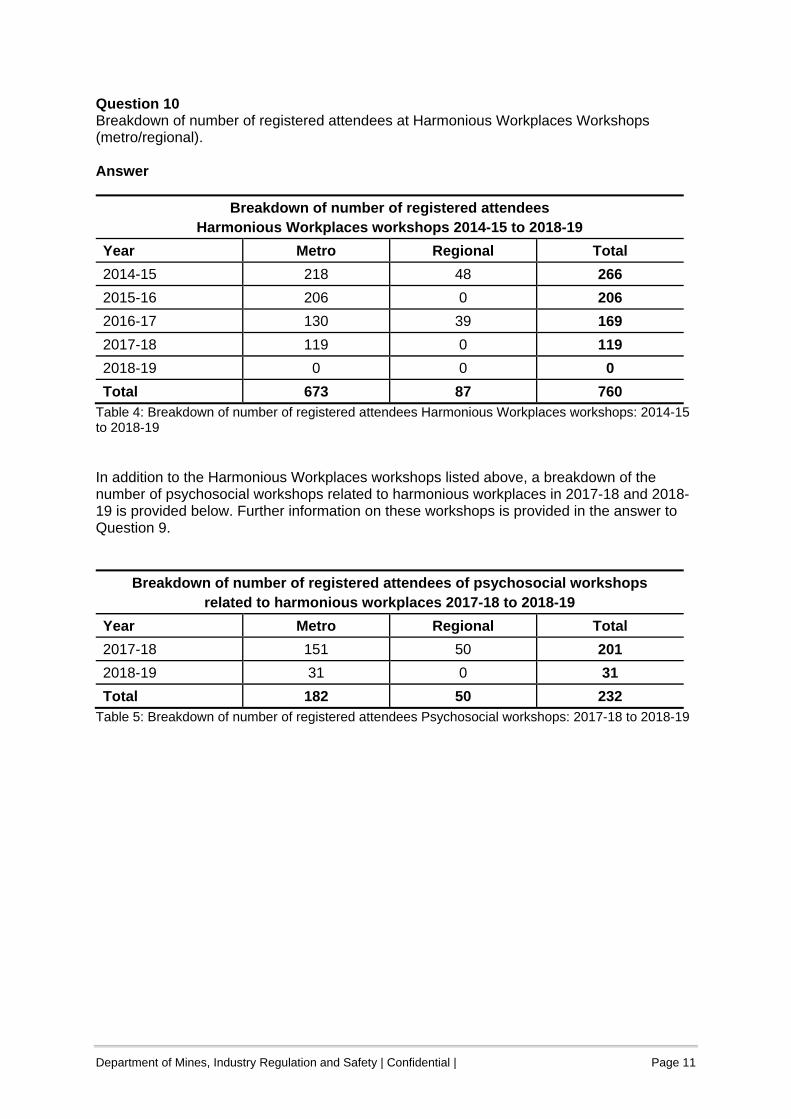
Question 10 Breakdown of number of registered attendees at Harmonious Workplaces Workshops (metro/regional). Answer
Breakdown of number of registered attendees Harmonious Workplaces workshops 2014-15 to 2018-19
Year Metro Regional Total
2014-15 218 48 266
2015-16 206 0 206
2016-17 130 39 169
2017-18 119 0 119
2018-19 0 0 0
Total 673 87 760 Table 4: Breakdown of number of registered attendees Harmonious Workplaces workshops: 2014-15 to 2018-19 In addition to the Harmonious Workplaces workshops listed above, a breakdown of the number of psychosocial workshops related to harmonious workplaces in 2017-18 and 2018-19 is provided below. Further information on these workshops is provided in the answer to Question 9.
Breakdown of number of registered attendees of psychosocial workshops related to harmonious workplaces 2017-18 to 2018-19
Year Metro Regional Total
2017-18 151 50 201
2018-19 31 0 31
Total 182 50 232 Table 5: Breakdown of number of registered attendees Psychosocial workshops: 2017-18 to 2018-19
Department of Mines, Industry Regulation and Safety | Confidential | Page 12
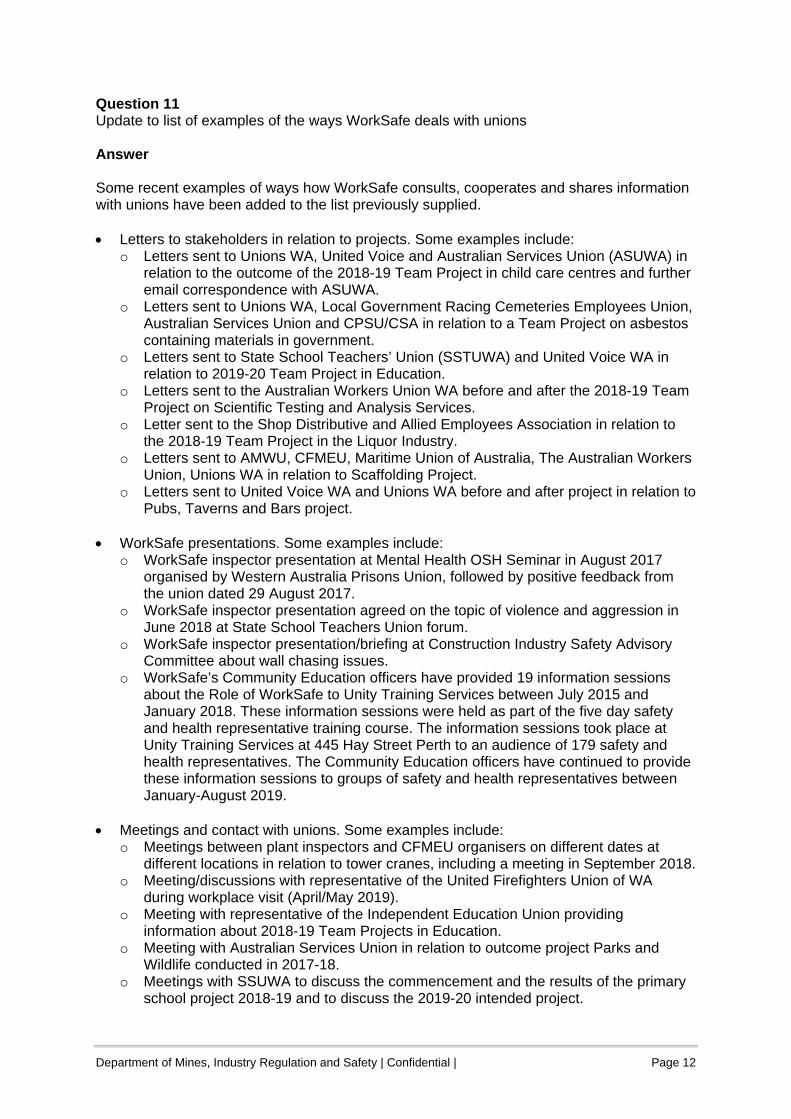
Question 11 Update to list of examples of the ways WorkSafe deals with unions Answer Some recent examples of ways how WorkSafe consults, cooperates and shares information with unions have been added to the list previously supplied. Letters to stakeholders in relation to projects. Some examples include:
o Letters sent to Unions WA, United Voice and Australian Services Union (ASUWA) in relation to the outcome of the 2018-19 Team Project in child care centres and further email correspondence with ASUWA.
o Letters sent to Unions WA, Local Government Racing Cemeteries Employees Union, Australian Services Union and CPSU/CSA in relation to a Team Project on asbestos containing materials in government.
o Letters sent to State School Teachers’ Union (SSTUWA) and United Voice WA in relation to 2019-20 Team Project in Education.
o Letters sent to the Australian Workers Union WA before and after the 2018-19 Team Project on Scientific Testing and Analysis Services.
o Letter sent to the Shop Distributive and Allied Employees Association in relation to the 2018-19 Team Project in the Liquor Industry.
o Letters sent to AMWU, CFMEU, Maritime Union of Australia, The Australian Workers Union, Unions WA in relation to Scaffolding Project.
o Letters sent to United Voice WA and Unions WA before and after project in relation to Pubs, Taverns and Bars project.
WorkSafe presentations. Some examples include:
o WorkSafe inspector presentation at Mental Health OSH Seminar in August 2017 organised by Western Australia Prisons Union, followed by positive feedback from the union dated 29 August 2017.
o WorkSafe inspector presentation agreed on the topic of violence and aggression in June 2018 at State School Teachers Union forum.
o WorkSafe inspector presentation/briefing at Construction Industry Safety Advisory Committee about wall chasing issues.
o WorkSafe’s Community Education officers have provided 19 information sessions about the Role of WorkSafe to Unity Training Services between July 2015 and January 2018. These information sessions were held as part of the five day safety and health representative training course. The information sessions took place at Unity Training Services at 445 Hay Street Perth to an audience of 179 safety and health representatives. The Community Education officers have continued to provide these information sessions to groups of safety and health representatives between January-August 2019.
Meetings and contact with unions. Some examples include:
o Meetings between plant inspectors and CFMEU organisers on different dates at different locations in relation to tower cranes, including a meeting in September 2018.
o Meeting/discussions with representative of the United Firefighters Union of WA during workplace visit (April/May 2019).
o Meeting with representative of the Independent Education Union providing information about 2018-19 Team Projects in Education.
o Meeting with Australian Services Union in relation to outcome project Parks and Wildlife conducted in 2017-18.
o Meetings with SSUWA to discuss the commencement and the results of the primary school project 2018-19 and to discuss the 2019-20 intended project.
Department of Mines, Industry Regulation and Safety | Confidential | Page 13
o Meeting with SSTUWA union organiser in relation to TAFE Team Project. o Email correspondence and phone calls with SSTUWA in relation to investigation into
alleged workplace bullying. o Email correspondence and phone calls with AMWU organiser in relation to an
asbestos issue at a workplace. o Meeting with WA Police Union field officers and WA Police Safety Branch February
2018. o Meeting with State School Teachers Union December 2017 to discuss violence and
aggression in schools. o Meeting with State School Teachers Union December 2016 to discuss project
proactive stress project and the relevance to Education industry. o WorkSafe Commissioner quarterly meeting with the CFMEU. o Regular contact between senior WorkSafe inspector and Transport Workers Union.
Involvement in tripartite Commission and various working groups, for example:
o WorkSafe and CFMEU are both standing invitees to the Western Australian Construction Safety Alliance (WACSA). WACSA is a forum for industry members to get together to discuss OH&S management systems or related matters and to exchange information and new ideas. WACSA meets monthly and WorkSafe provides updates on recent issues and also provides information or clarification on issues raised by the CFMEU and others.
o Senior management of WorkSafe’s involvement in the Commission for Occupational Safety and Health.
o Senior management of WorkSafe’s involvement with the tripartite Construction Industry Safety Advisory Committee (CISAC).
o WorkSafe inspector involvement in CISAC, including presentation and consultation with representatives on manual tasks in the construction industry and the development of guidance material to be published on the WorkSafe website (Manual Tasks in Construction Info Sheets).
o WorkSafe inspector involvement in the tripartite Mental Health Strategies working group that recently developed the Mentally healthy workplaces for fly-in fly-out (FIFO) workers in the resources and construction sectors – code of practice, including involvement from Unions WA, AWU WA, CFMEU.
o WorkSafe’s involvement in the Agricultural Safety Industry Group, which has valuable input from the Australian Workers Union.
o Regular meetings (generally quarterly) between the CFMEU and Commissioner. Involvement in national workplace safety development, for example
o Senior management of WorkSafe’s involvement with tripartite Safe Work Australia.
Department of Mines, Industry Regulation and Safety | Confidential | Page 14
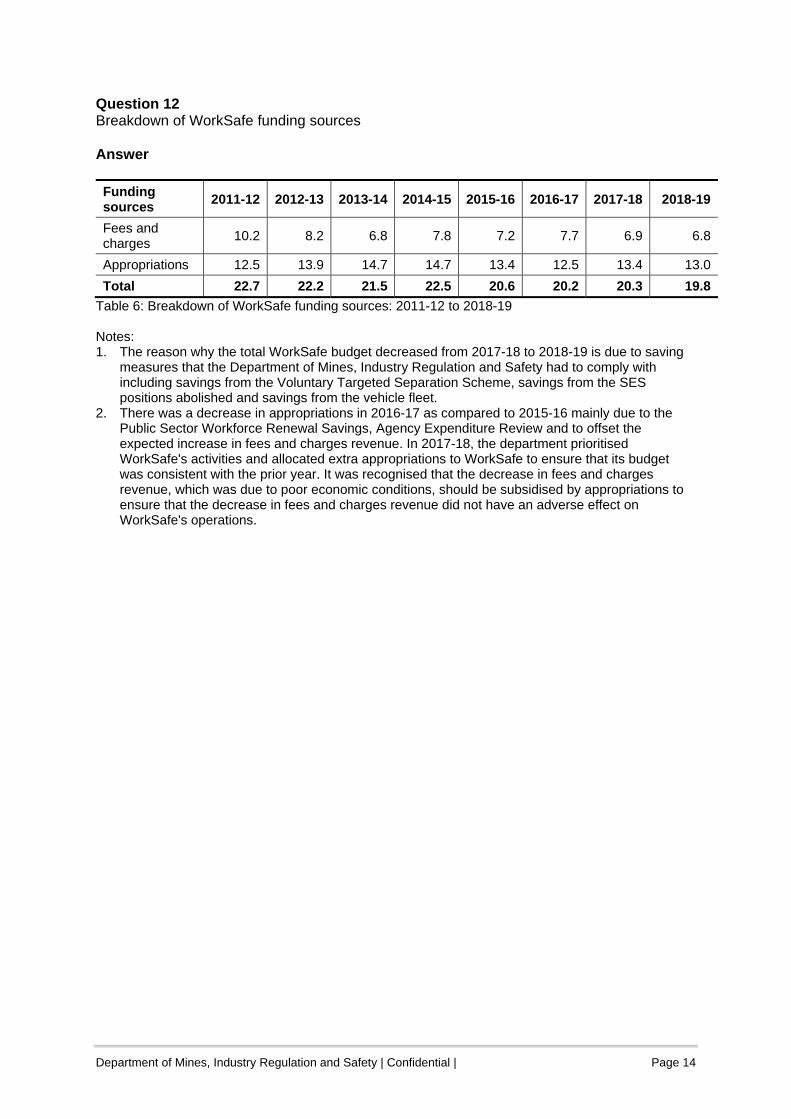
Question 12 Breakdown of WorkSafe funding sources Answer Funding sources
2011-12 2012-13 2013-14 2014-15 2015-16 2016-17 2017-18 2018-19
Fees and charges
10.2 8.2 6.8 7.8 7.2 7.7 6.9 6.8
Appropriations 12.5 13.9 14.7 14.7 13.4 12.5 13.4 13.0
Total 22.7 22.2 21.5 22.5 20.6 20.2 20.3 19.8
Table 6: Breakdown of WorkSafe funding sources: 2011-12 to 2018-19 Notes: 1. The reason why the total WorkSafe budget decreased from 2017-18 to 2018-19 is due to saving
measures that the Department of Mines, Industry Regulation and Safety had to comply with including savings from the Voluntary Targeted Separation Scheme, savings from the SES positions abolished and savings from the vehicle fleet.
2. There was a decrease in appropriations in 2016-17 as compared to 2015-16 mainly due to the Public Sector Workforce Renewal Savings, Agency Expenditure Review and to offset the expected increase in fees and charges revenue. In 2017-18, the department prioritised WorkSafe's activities and allocated extra appropriations to WorkSafe to ensure that its budget was consistent with the prior year. It was recognised that the decrease in fees and charges revenue, which was due to poor economic conditions, should be subsidised by appropriations to ensure that the decrease in fees and charges revenue did not have an adverse effect on WorkSafe's operations.
Department of Mines, Industry Regulation and Safety | Confidential | Page 15
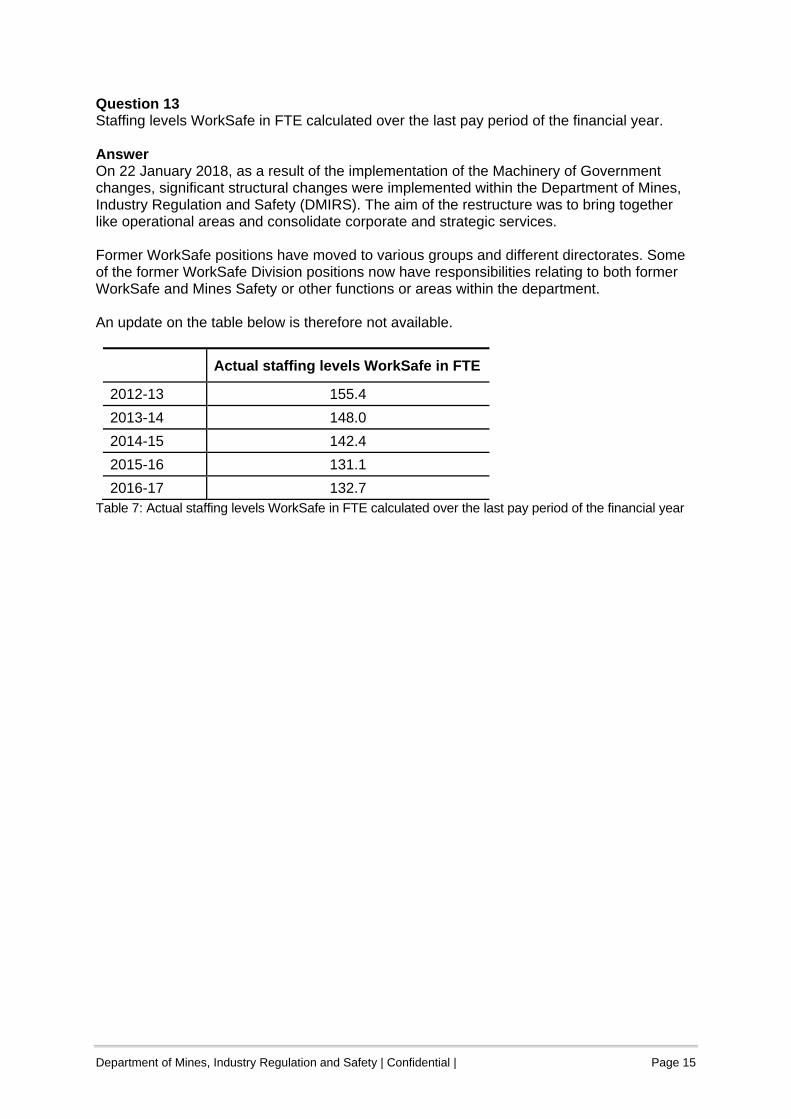
Question 13 Staffing levels WorkSafe in FTE calculated over the last pay period of the financial year. Answer On 22 January 2018, as a result of the implementation of the Machinery of Government changes, significant structural changes were implemented within the Department of Mines, Industry Regulation and Safety (DMIRS). The aim of the restructure was to bring together like operational areas and consolidate corporate and strategic services. Former WorkSafe positions have moved to various groups and different directorates. Some of the former WorkSafe Division positions now have responsibilities relating to both former WorkSafe and Mines Safety or other functions or areas within the department. An update on the table below is therefore not available.
Actual staffing levels WorkSafe in FTE
2012-13 155.4
2013-14 148.0
2014-15 142.4
2015-16 131.1
2016-17 132.7 Table 7: Actual staffing levels WorkSafe in FTE calculated over the last pay period of the financial year
Department of Mines, Industry Regulation and Safety | Confidential | Page 16
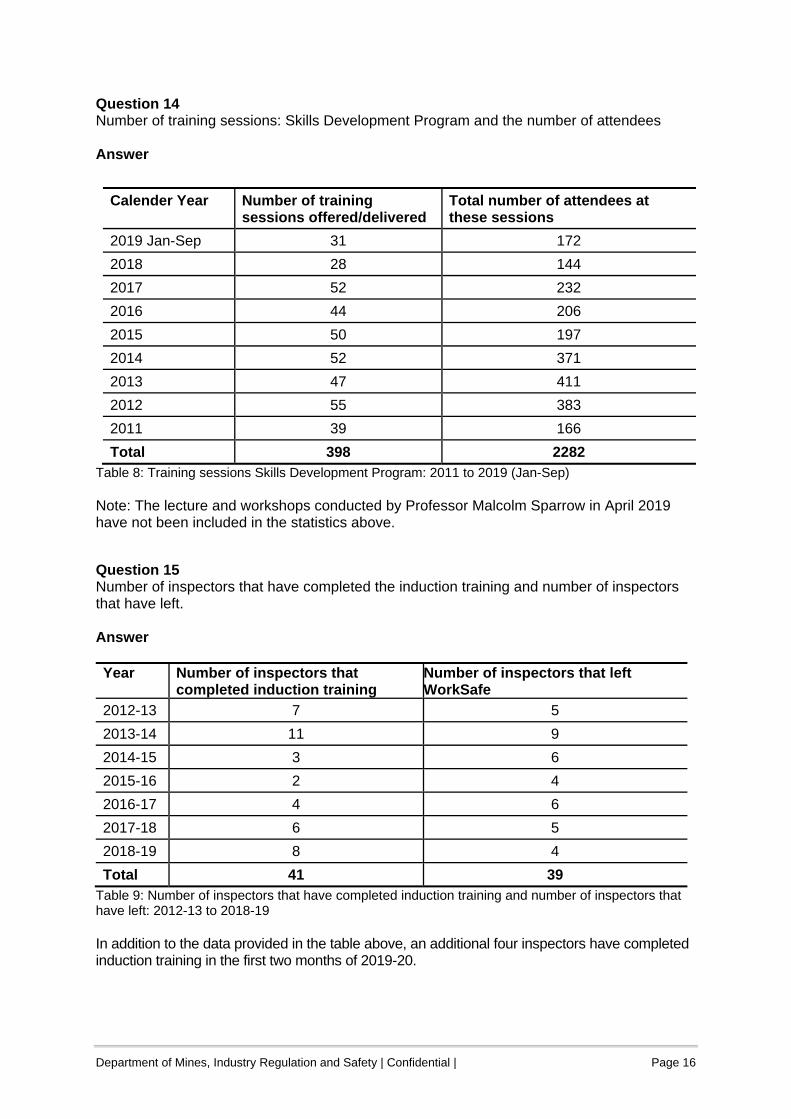
Question 14 Number of training sessions: Skills Development Program and the number of attendees Answer
Calender Year Number of training sessions offered/delivered
Total number of attendees at these sessions
2019 Jan-Sep 31 172
2018 28 144
2017 52 232
2016 44 206
2015 50 197
2014 52 371
2013 47 411
2012 55 383
2011 39 166
Total 398 2282 Table 8: Training sessions Skills Development Program: 2011 to 2019 (Jan-Sep) Note: The lecture and workshops conducted by Professor Malcolm Sparrow in April 2019 have not been included in the statistics above. Question 15 Number of inspectors that have completed the induction training and number of inspectors that have left. Answer Year Number of inspectors that
completed induction training Number of inspectors that left WorkSafe
2012-13 7 5
2013-14 11 9
2014-15 3 6
2015-16 2 4
2016-17 4 6
2017-18 6 5
2018-19 8 4
Total 41 39 Table 9: Number of inspectors that have completed induction training and number of inspectors that have left: 2012-13 to 2018-19 In addition to the data provided in the table above, an additional four inspectors have completed induction training in the first two months of 2019-20.
Department of Mines, Industry Regulation and Safety | Confidential | Page 17
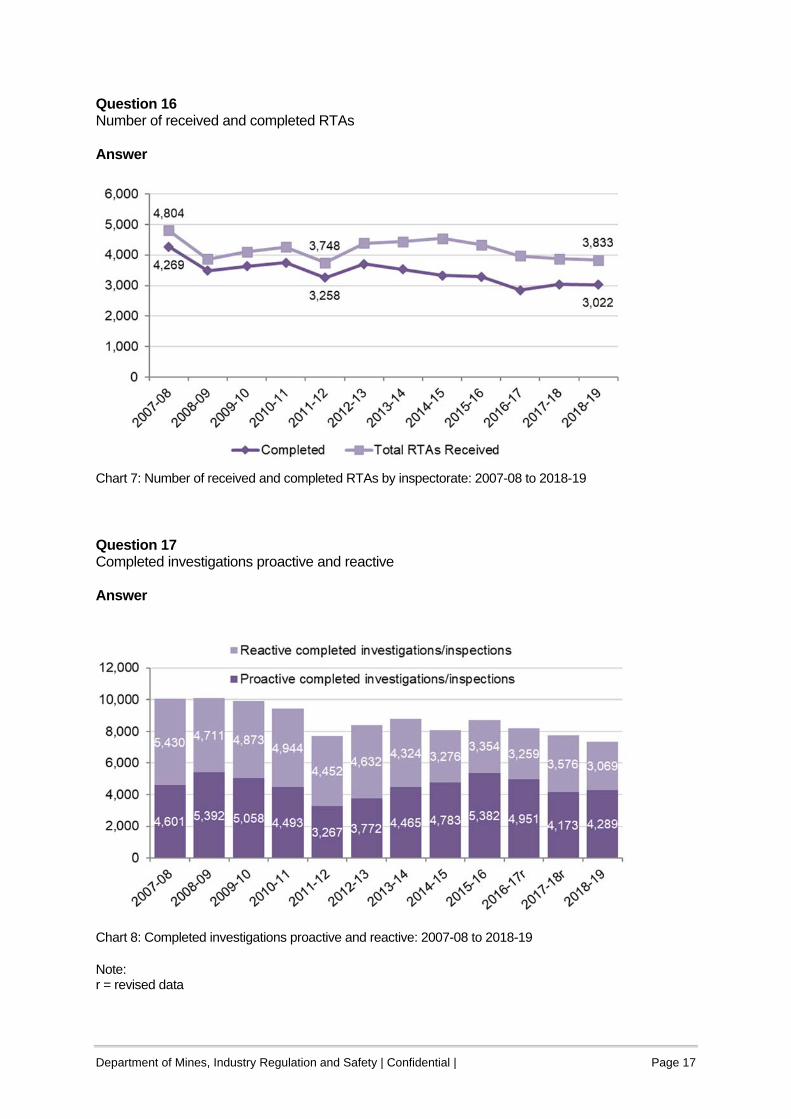
Question 16 Number of received and completed RTAs Answer
Chart 7: Number of received and completed RTAs by inspectorate: 2007-08 to 2018-19 Question 17 Completed investigations proactive and reactive Answer
Chart 8: Completed investigations proactive and reactive: 2007-08 to 2018-19 Note: r = revised data
Department of Mines, Industry Regulation and Safety | Confidential | Page 18
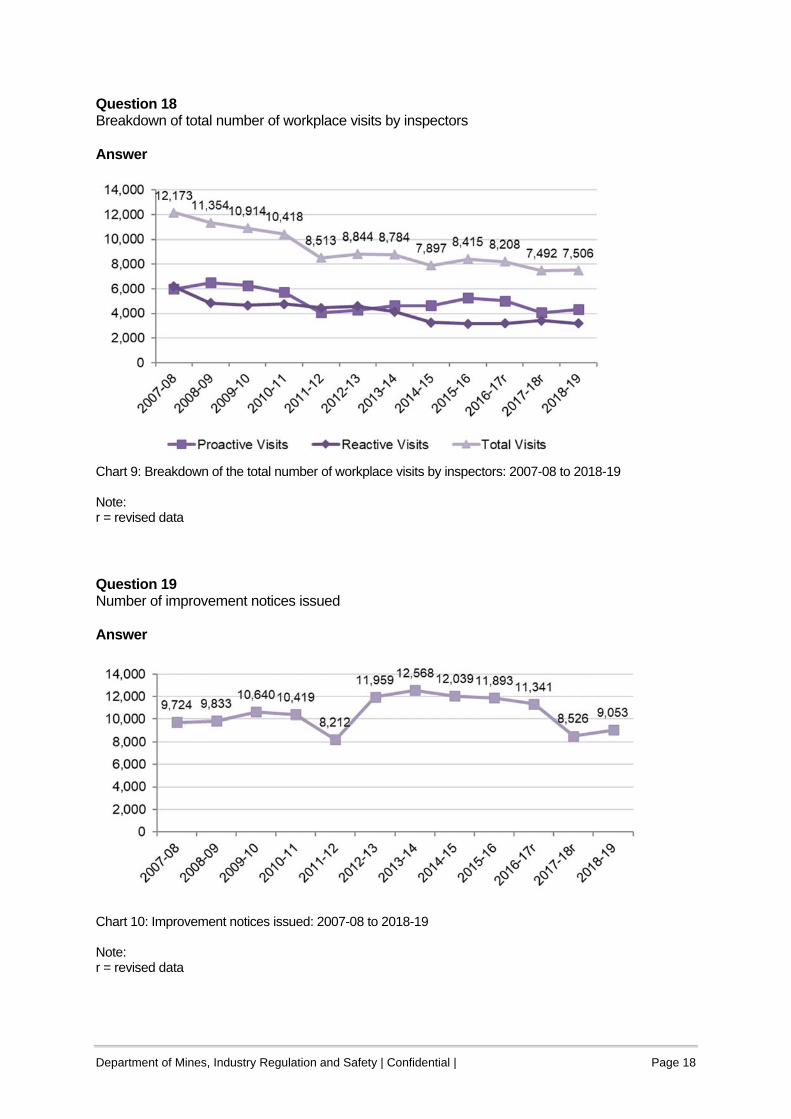
Question 18 Breakdown of total number of workplace visits by inspectors Answer
Chart 9: Breakdown of the total number of workplace visits by inspectors: 2007-08 to 2018-19 Note: r = revised data Question 19 Number of improvement notices issued Answer
Chart 10: Improvement notices issued: 2007-08 to 2018-19 Note: r = revised data

Department of Mines, Industry Regulation and Safety | Confidential | Page 19
Question 20 Number of verified improvement notices Answer
Financial Year
Number of verified improvement notices attached to
investigations of the type Verification
Number of verified improvement notices with a Visit/inspection and/or a Meeting activity in the
verification investigation
2007-08 756 669 2008-09 801 648 2009-10 924 650 2010-11 641 492 2011-12 597 465 2012-13 380 336 2013-14 320 284 2014-15 406 377 2015-16 459 429 2016-17 339 273 2017-18 358 280 2018-19 459 317
Table 10: Number of verified improvement notices attached to investigations of the type Verification and the number of verified improvement notices with a Visit/inspection and/or a Meeting activity in the verification investigation: 2007-08 to 2018-19 Question 21
Chart 11: Prohibition notices issued: 2007-08 to 2018-19 Note: r = revised data
Department of Mines, Industry Regulation and Safety | Confidential | Page 20
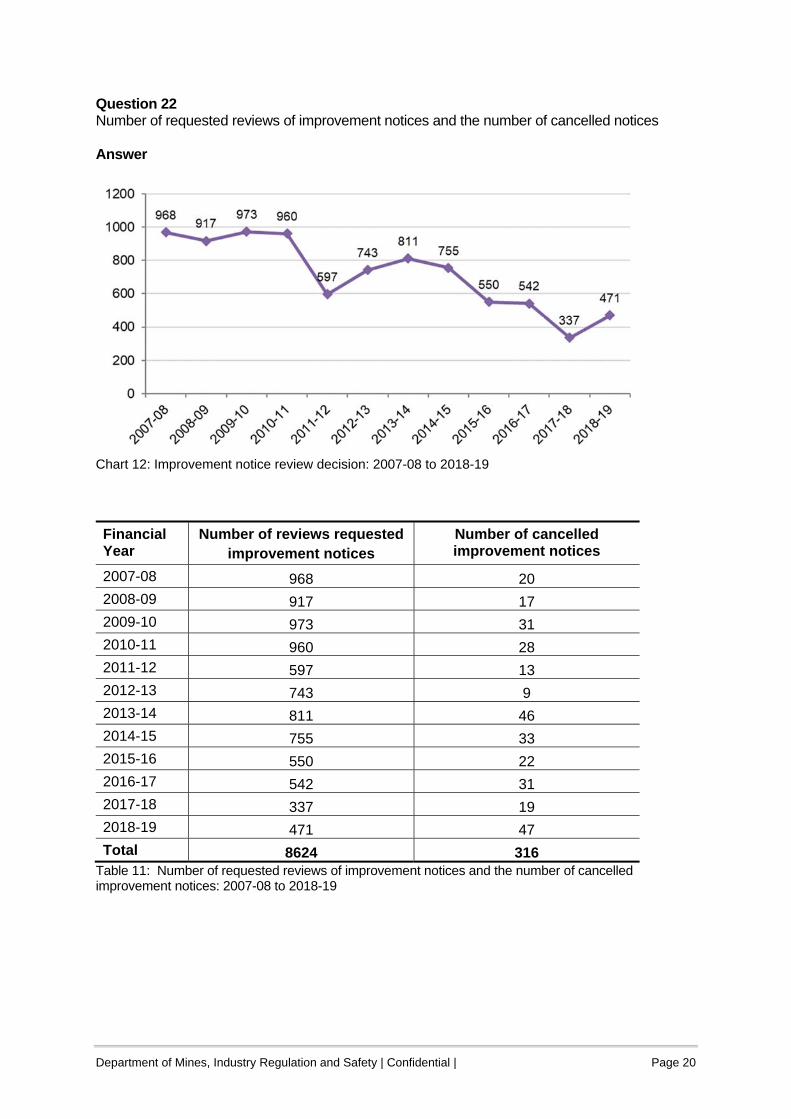
Question 22 Number of requested reviews of improvement notices and the number of cancelled notices Answer
Chart 12: Improvement notice review decision: 2007-08 to 2018-19
Financial Year
Number of reviews requested improvement notices
Number of cancelled improvement notices
2007-08 968 20 2008-09 917 17 2009-10 973 31 2010-11 960 28 2011-12 597 13 2012-13 743 9 2013-14 811 46 2014-15 755 33 2015-16 550 22 2016-17 542 31 2017-18 337 19 2018-19 471 47 Total 8624 316
Table 11: Number of requested reviews of improvement notices and the number of cancelled improvement notices: 2007-08 to 2018-19

Department of Mines, Industry Regulation and Safety | Confidential | Page 21
Question 23 Number of requested reviews of prohibition notices and the number of cancelled notices Answer
Chart 13: Prohibition notices review decisions: 2007-08 to 2018-19
Financial Year
Number of reviews requested prohibition notices
Number of cancelled prohibition notices
2007-08 11 1 2008-09 1 1 2009-10 10 2 2010-11 10 4 2011-12 4 0 2012-13 5 0 2013-14 6 2 2014-15 4 2 2015-16 12 4 2016-17 3 2 2017-18 4 3 2018-19 5 4 Total 75 25
Table 12: Number of requested reviews of prohibition notices and the number of cancelled prohibition notices: 2007-08 to 2018-19
Department of Mines, Industry Regulation and Safety | Confidential | Page 22
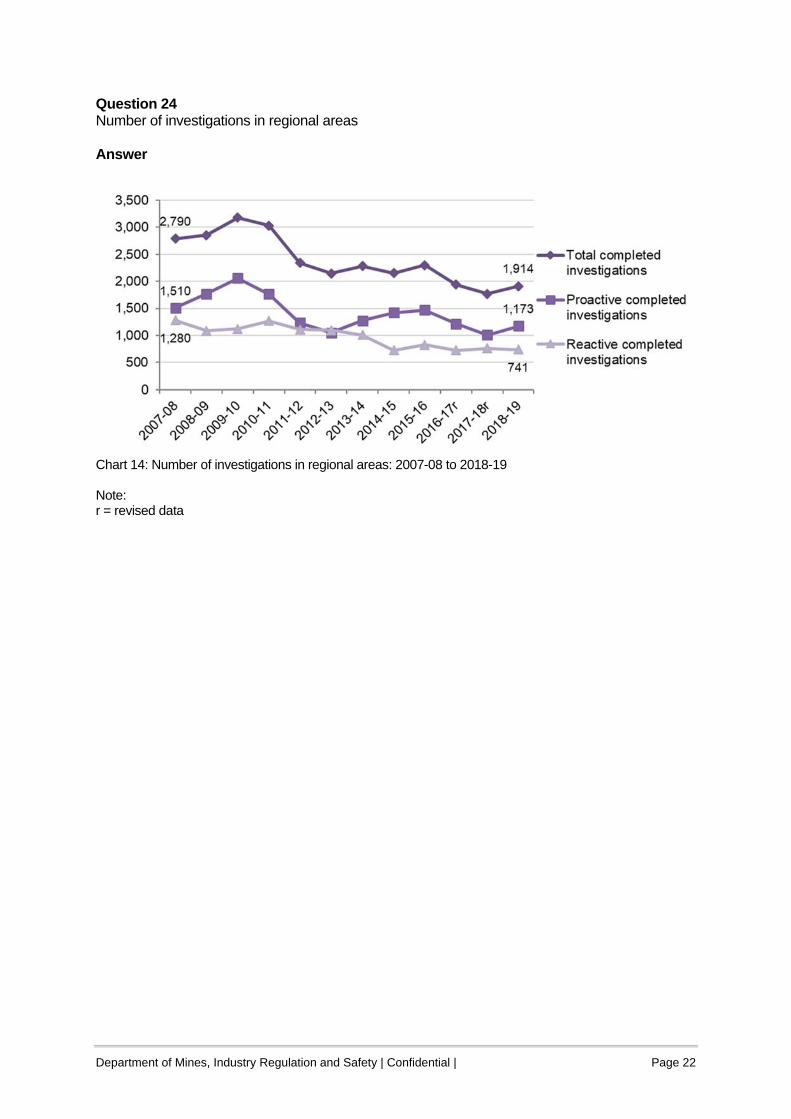
Question 24 Number of investigations in regional areas Answer
Chart 14: Number of investigations in regional areas: 2007-08 to 2018-19 Note: r = revised data
Department of Mines, Industry Regulation and Safety | Confidential | Page 23
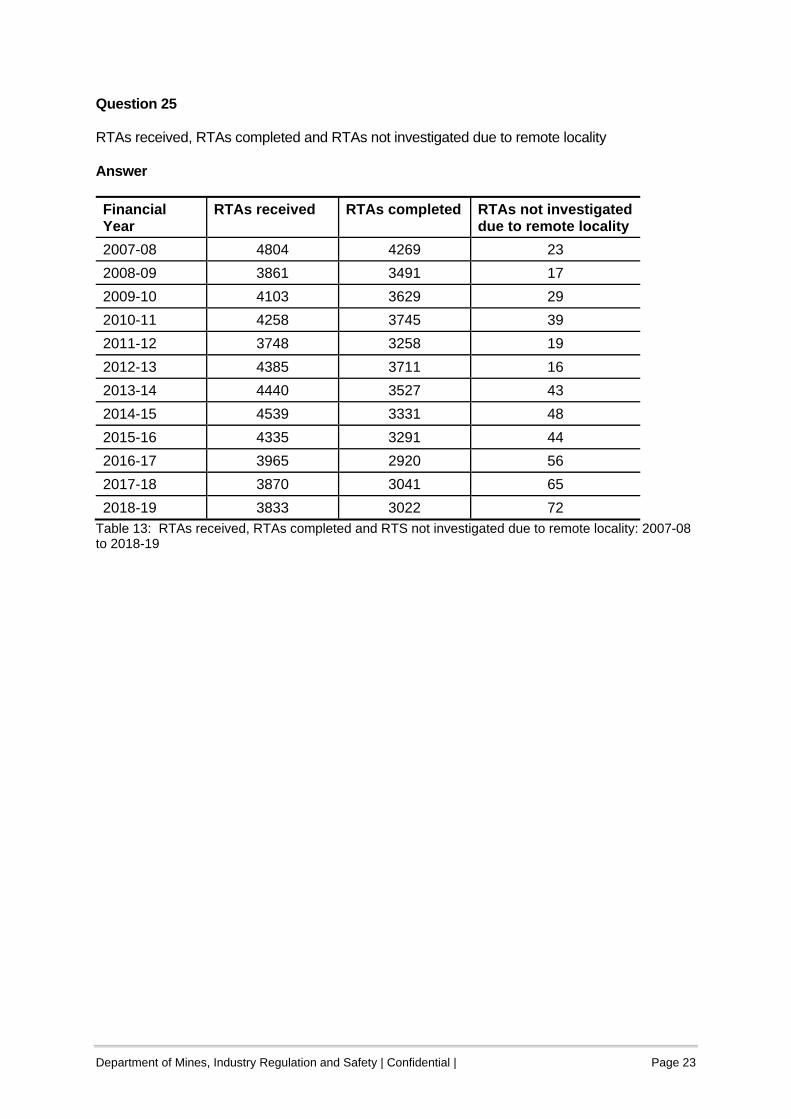
Question 25 RTAs received, RTAs completed and RTAs not investigated due to remote locality Answer
Financial Year
RTAs received RTAs completed RTAs not investigated due to remote locality
2007-08 4804 4269 23
2008-09 3861 3491 17
2009-10 4103 3629 29
2010-11 4258 3745 39
2011-12 3748 3258 19
2012-13 4385 3711 16
2013-14 4440 3527 43
2014-15 4539 3331 48
2015-16 4335 3291 44
2016-17 3965 2920 56
2017-18 3870 3041 65
2018-19 3833 3022 72 Table 13: RTAs received, RTAs completed and RTS not investigated due to remote locality: 2007-08 to 2018-19
Department of Mines, Industry Regulation and Safety | Confidential | Page 24
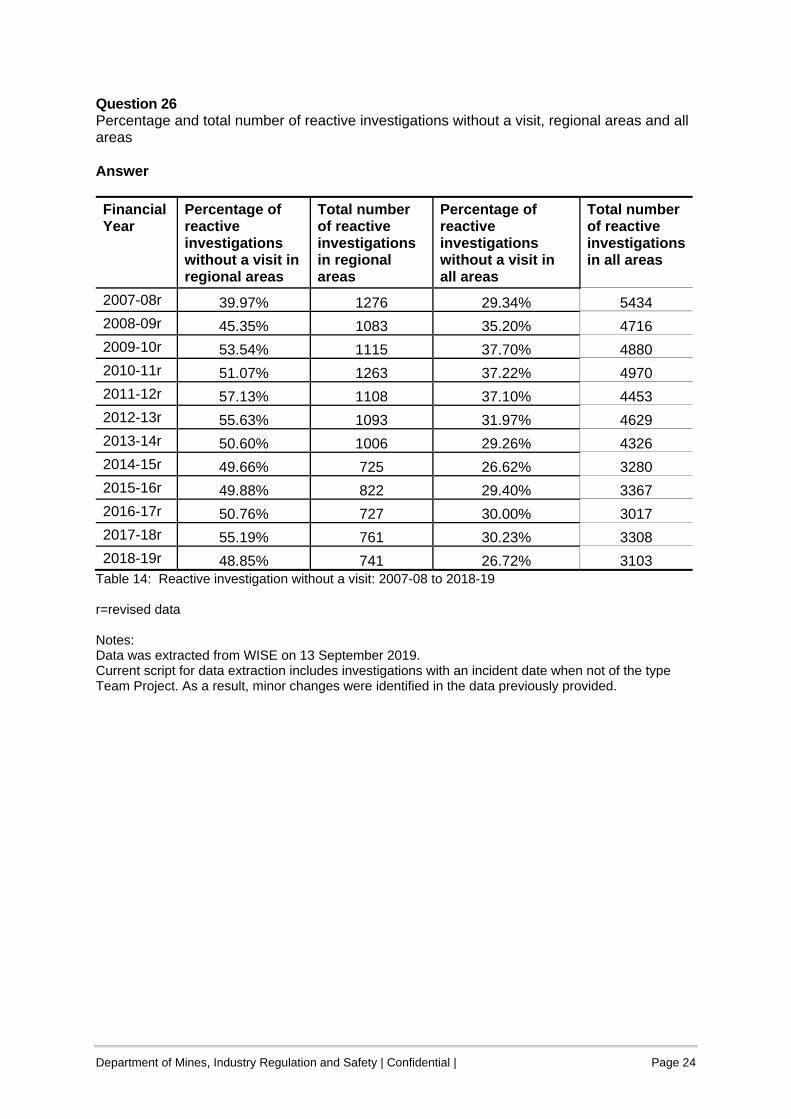
Question 26 Percentage and total number of reactive investigations without a visit, regional areas and all areas Answer
Financial Year
Percentage of reactive investigations without a visit in regional areas
Total number of reactive investigations in regional areas
Percentage of reactive investigations without a visit in all areas
Total number of reactive investigations in all areas
2007-08r 39.97% 1276 29.34% 5434
2008-09r 45.35% 1083 35.20% 4716
2009-10r 53.54% 1115 37.70% 4880
2010-11r 51.07% 1263 37.22% 4970
2011-12r 57.13% 1108 37.10% 4453
2012-13r 55.63% 1093 31.97% 4629
2013-14r 50.60% 1006 29.26% 4326
2014-15r 49.66% 725 26.62% 3280
2015-16r 49.88% 822 29.40% 3367
2016-17r 50.76% 727 30.00% 3017
2017-18r 55.19% 761 30.23% 3308
2018-19r 48.85% 741 26.72% 3103 Table 14: Reactive investigation without a visit: 2007-08 to 2018-19 r=revised data Notes: Data was extracted from WISE on 13 September 2019. Current script for data extraction includes investigations with an incident date when not of the type Team Project. As a result, minor changes were identified in the data previously provided.
Department of Mines, Industry Regulation and Safety | Confidential | Page 25
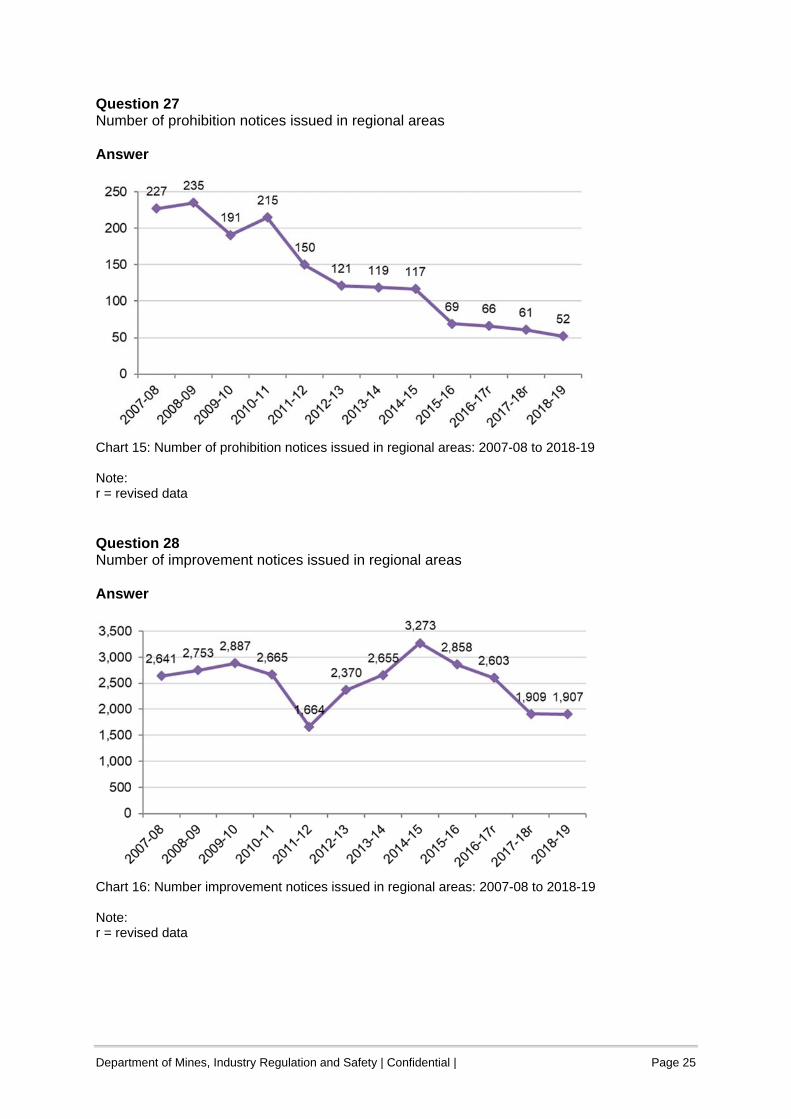
Question 27 Number of prohibition notices issued in regional areas Answer
Chart 15: Number of prohibition notices issued in regional areas: 2007-08 to 2018-19 Note: r = revised data Question 28 Number of improvement notices issued in regional areas Answer
Chart 16: Number improvement notices issued in regional areas: 2007-08 to 2018-19 Note: r = revised data
Department of Mines, Industry Regulation and Safety | Confidential | Page 26
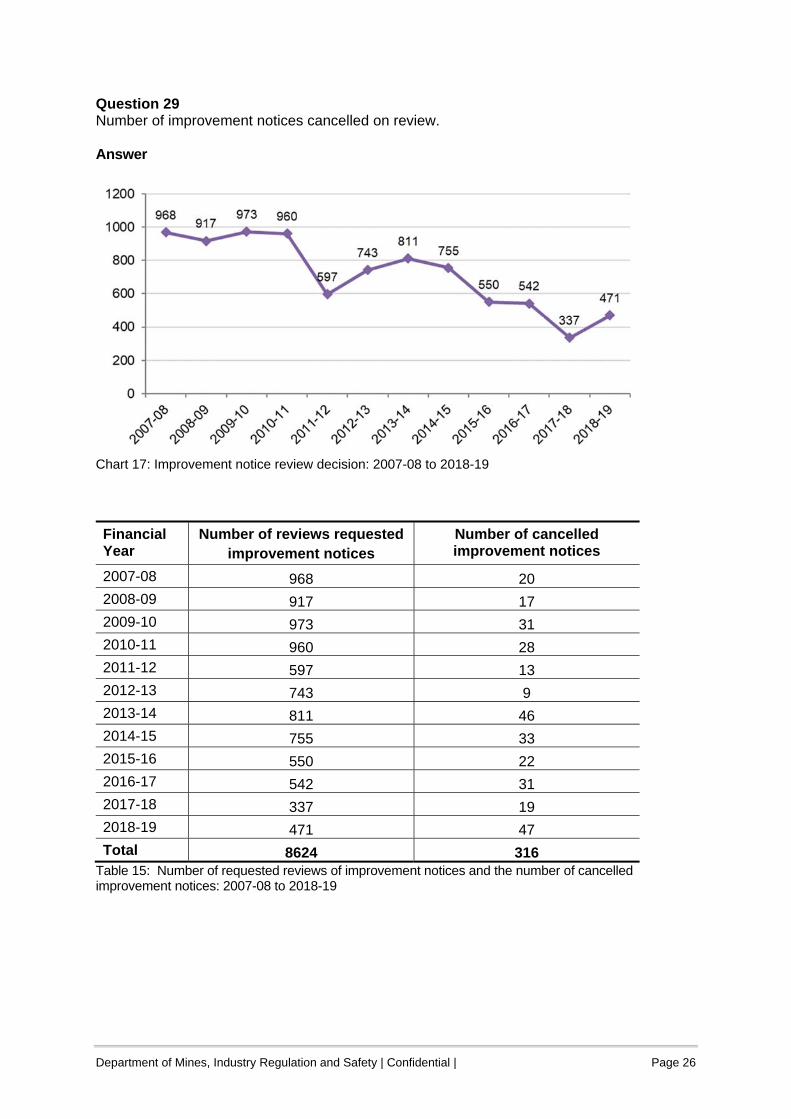
Question 29 Number of improvement notices cancelled on review. Answer
Chart 17: Improvement notice review decision: 2007-08 to 2018-19
Financial Year
Number of reviews requested improvement notices
Number of cancelled improvement notices
2007-08 968 20 2008-09 917 17 2009-10 973 31 2010-11 960 28 2011-12 597 13 2012-13 743 9 2013-14 811 46 2014-15 755 33 2015-16 550 22 2016-17 542 31 2017-18 337 19 2018-19 471 47 Total 8624 316
Table 15: Number of requested reviews of improvement notices and the number of cancelled improvement notices: 2007-08 to 2018-19
Department of Mines, Industry Regulation and Safety | Confidential | Page 27
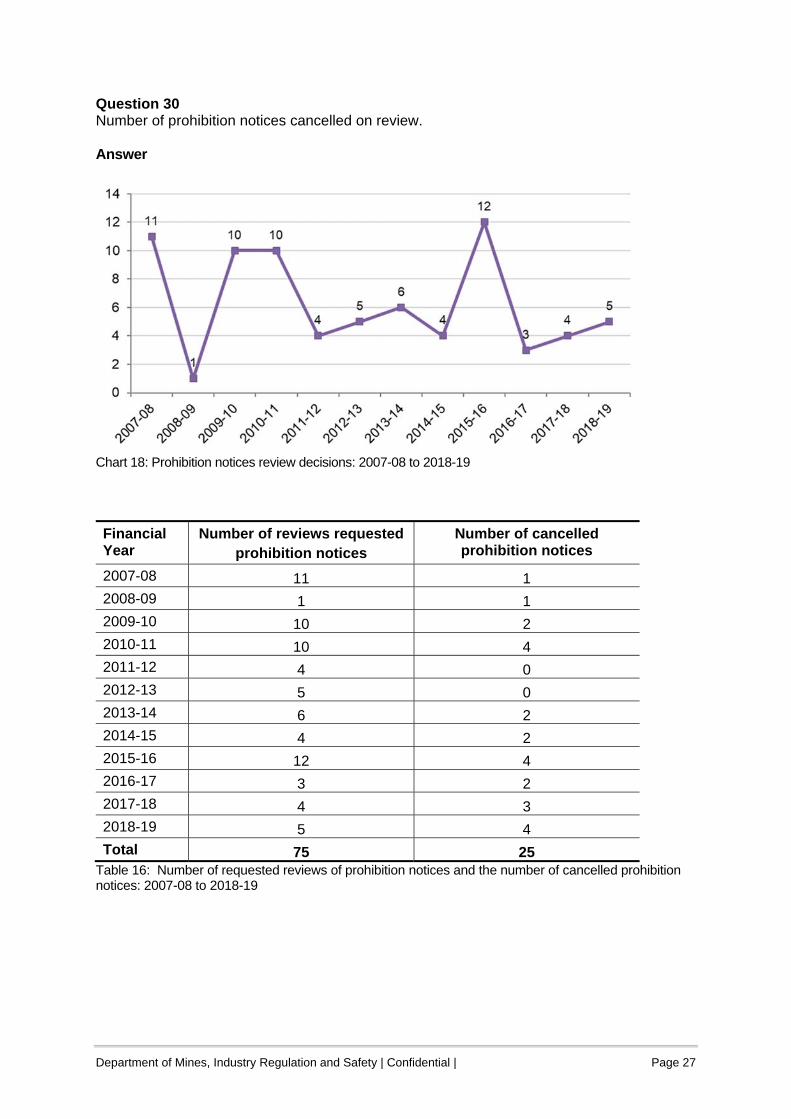
Question 30 Number of prohibition notices cancelled on review. Answer
Chart 18: Prohibition notices review decisions: 2007-08 to 2018-19
Financial Year
Number of reviews requested prohibition notices
Number of cancelled prohibition notices
2007-08 11 1 2008-09 1 1 2009-10 10 2 2010-11 10 4 2011-12 4 0 2012-13 5 0 2013-14 6 2 2014-15 4 2 2015-16 12 4 2016-17 3 2 2017-18 4 3 2018-19 5 4 Total 75 25
Table 16: Number of requested reviews of prohibition notices and the number of cancelled prohibition notices: 2007-08 to 2018-19
Department of Mines, Industry Regulation and Safety | Confidential | Page 28
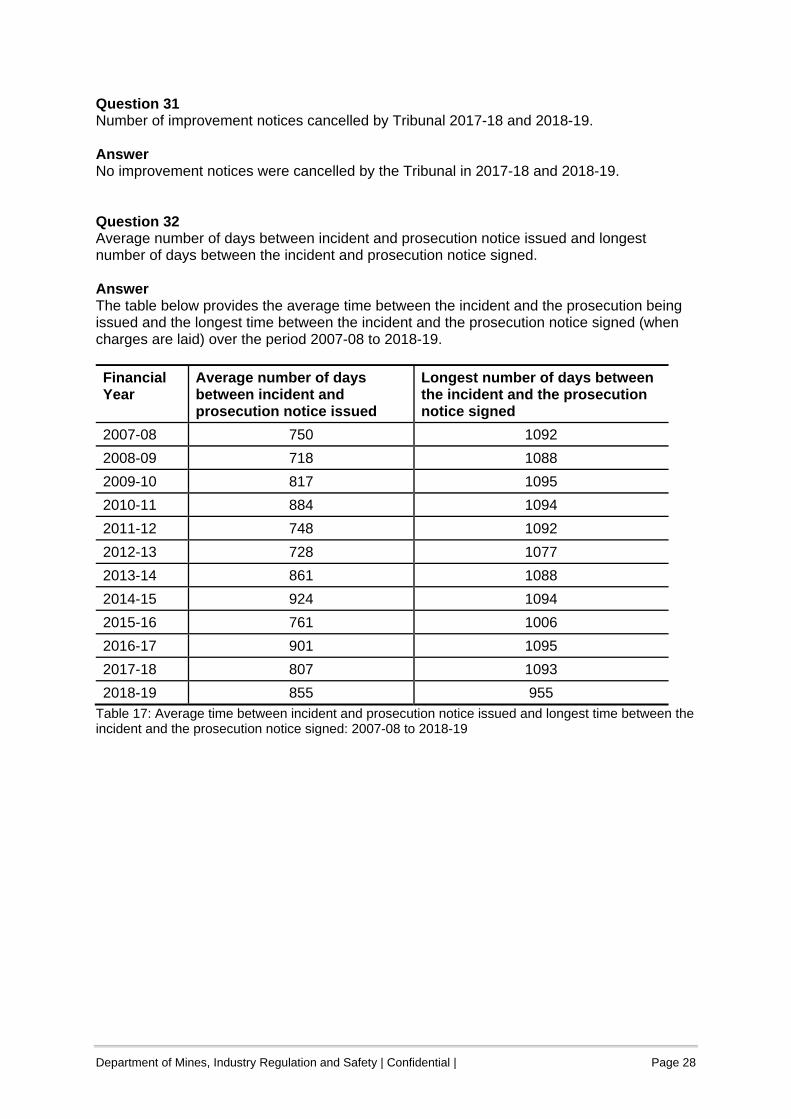
Question 31 Number of improvement notices cancelled by Tribunal 2017-18 and 2018-19. Answer No improvement notices were cancelled by the Tribunal in 2017-18 and 2018-19. Question 32 Average number of days between incident and prosecution notice issued and longest number of days between the incident and prosecution notice signed. Answer The table below provides the average time between the incident and the prosecution being issued and the longest time between the incident and the prosecution notice signed (when charges are laid) over the period 2007-08 to 2018-19.
Financial Year
Average number of days between incident and prosecution notice issued
Longest number of days between the incident and the prosecution notice signed
2007-08 750 1092
2008-09 718 1088
2009-10 817 1095
2010-11 884 1094
2011-12 748 1092
2012-13 728 1077
2013-14 861 1088
2014-15 924 1094
2015-16 761 1006
2016-17 901 1095
2017-18 807 1093
2018-19 855 955 Table 17: Average time between incident and prosecution notice issued and longest time between the incident and the prosecution notice signed: 2007-08 to 2018-19
Department of Mines, Industry Regulation and Safety | Confidential | Page 29
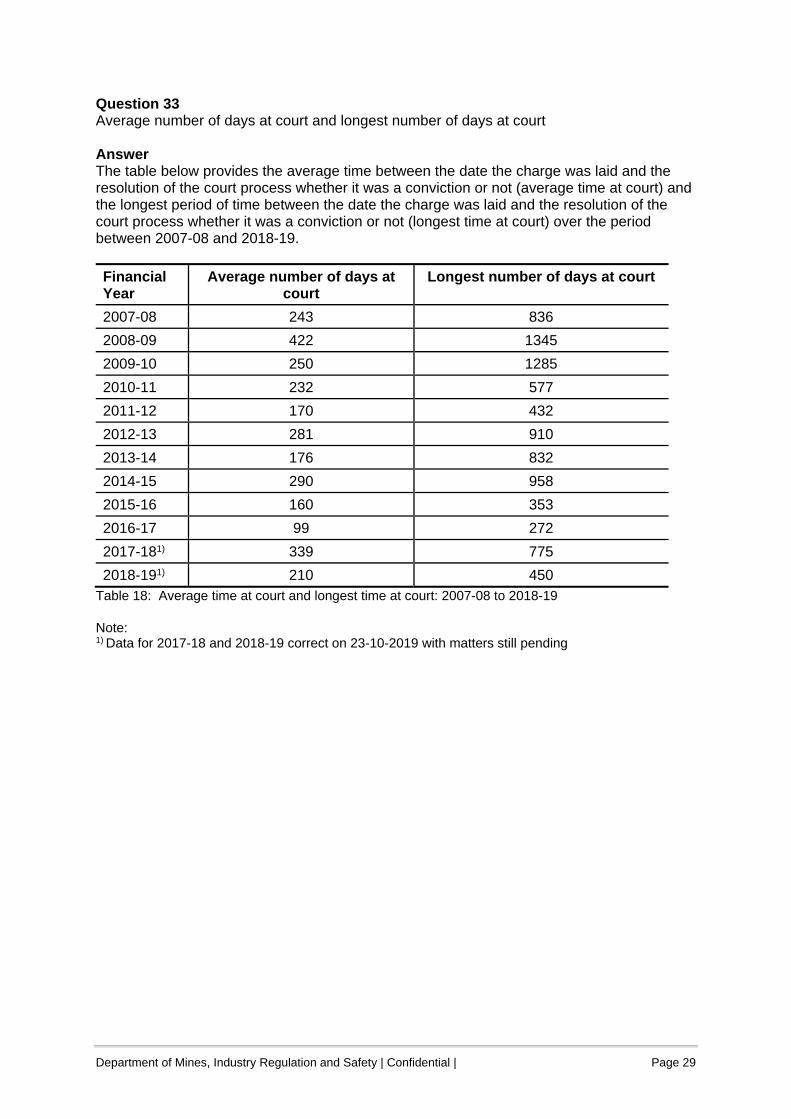
Question 33 Average number of days at court and longest number of days at court Answer The table below provides the average time between the date the charge was laid and the resolution of the court process whether it was a conviction or not (average time at court) and the longest period of time between the date the charge was laid and the resolution of the court process whether it was a conviction or not (longest time at court) over the period between 2007-08 and 2018-19.
Financial Year
Average number of days at court
Longest number of days at court
2007-08 243 836
2008-09 422 1345
2009-10 250 1285
2010-11 232 577
2011-12 170 432
2012-13 281 910
2013-14 176 832
2014-15 290 958
2015-16 160 353
2016-17 99 272
2017-181) 339 775
2018-191) 210 450 Table 18: Average time at court and longest time at court: 2007-08 to 2018-19 Note: 1) Data for 2017-18 and 2018-19 correct on 23-10-2019 with matters still pending
Department of Mines, Industry Regulation and Safety | Confidential | Page 30
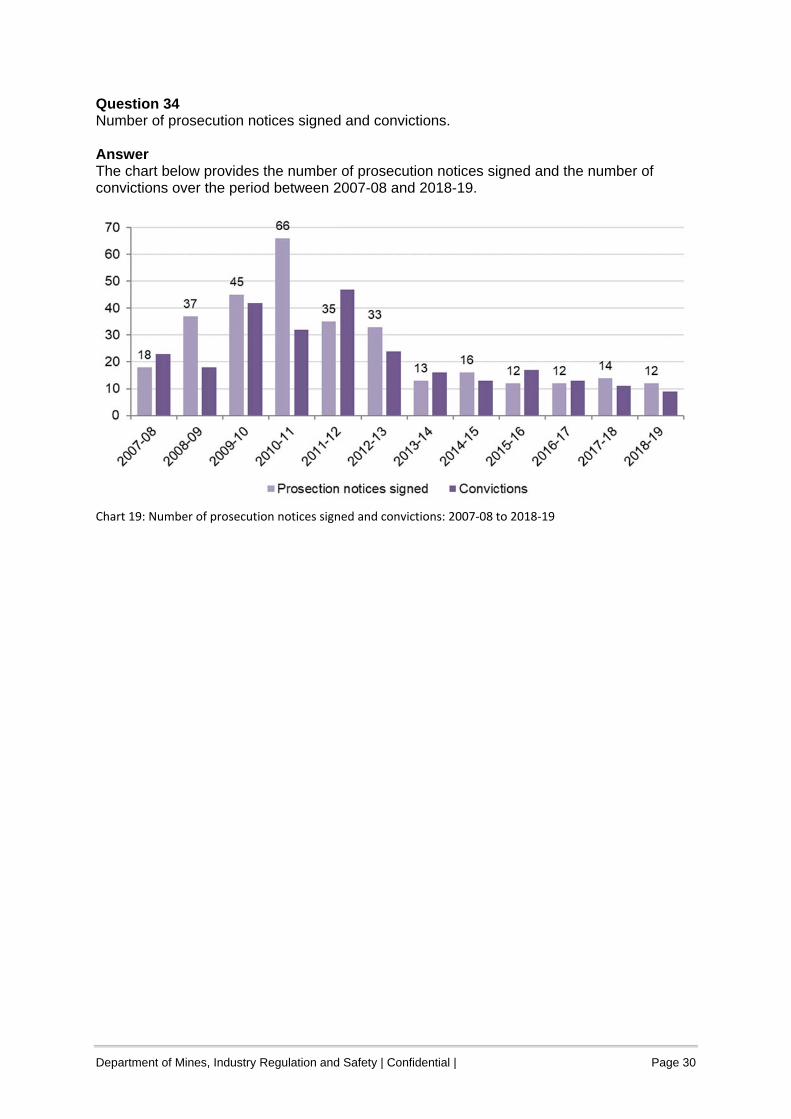
Question 34 Number of prosecution notices signed and convictions. Answer The chart below provides the number of prosecution notices signed and the number of convictions over the period between 2007-08 and 2018-19.
Chart 19: Number of prosecution notices signed and convictions: 2007‐08 to 2018‐19
Department of Mines, Industry Regulation and Safety | Confidential | Page 31
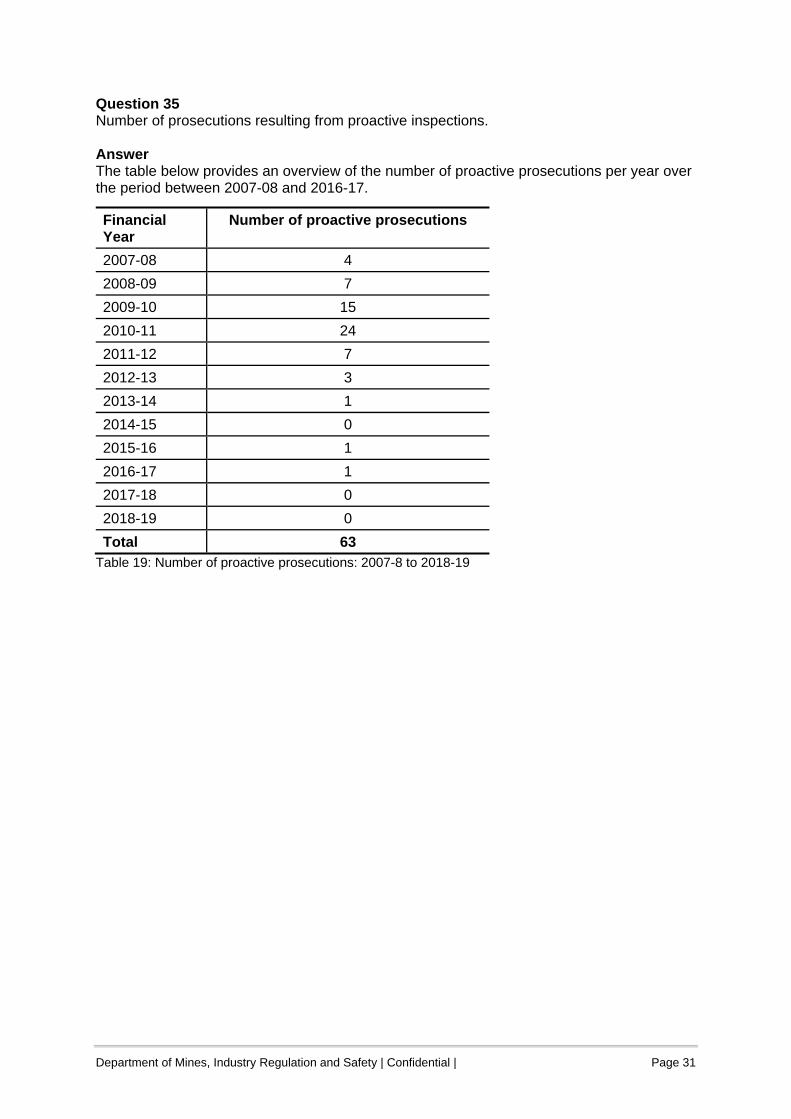
Question 35 Number of prosecutions resulting from proactive inspections. Answer The table below provides an overview of the number of proactive prosecutions per year over the period between 2007-08 and 2016-17.
Financial Year
Number of proactive prosecutions
2007-08 4
2008-09 7
2009-10 15
2010-11 24
2011-12 7
2012-13 3
2013-14 1
2014-15 0
2015-16 1
2016-17 1
2017-18 0
2018-19 0
Total 63 Table 19: Number of proactive prosecutions: 2007-8 to 2018-19
Department of Mines, Industry Regulation and Safety | Confidential | Page 32
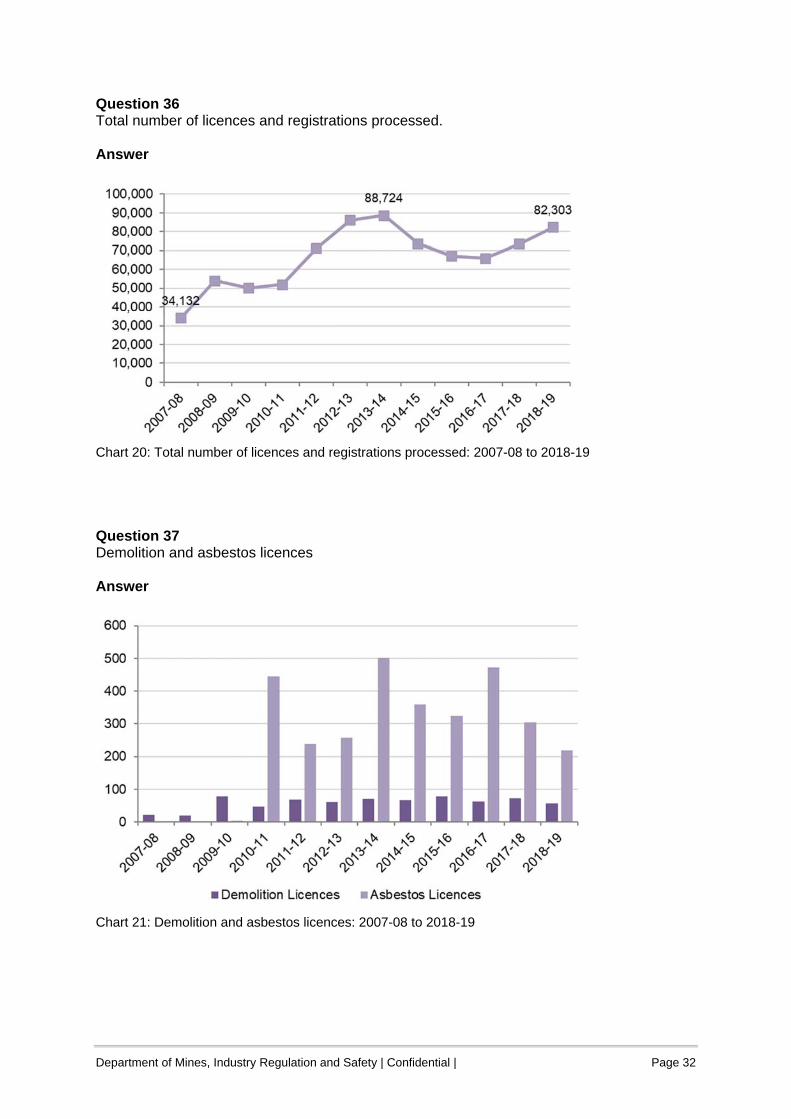
Question 36 Total number of licences and registrations processed. Answer
Chart 20: Total number of licences and registrations processed: 2007-08 to 2018-19 Question 37 Demolition and asbestos licences Answer
Chart 21: Demolition and asbestos licences: 2007-08 to 2018-19
Department of Mines, Industry Regulation and Safety | Confidential | Page 33
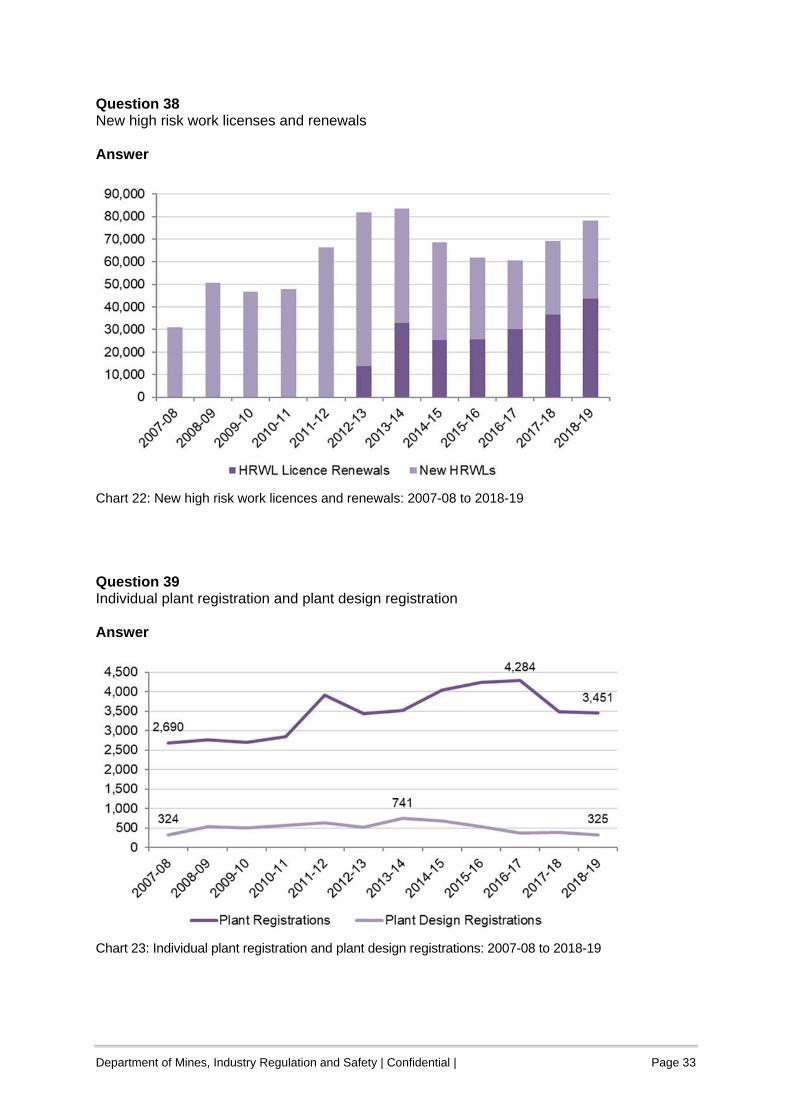
Question 38 New high risk work licenses and renewals Answer
Chart 22: New high risk work licences and renewals: 2007-08 to 2018-19 Question 39 Individual plant registration and plant design registration Answer
Chart 23: Individual plant registration and plant design registrations: 2007-08 to 2018-19
Department of Mines, Industry Regulation and Safety | Confidential | Page 34
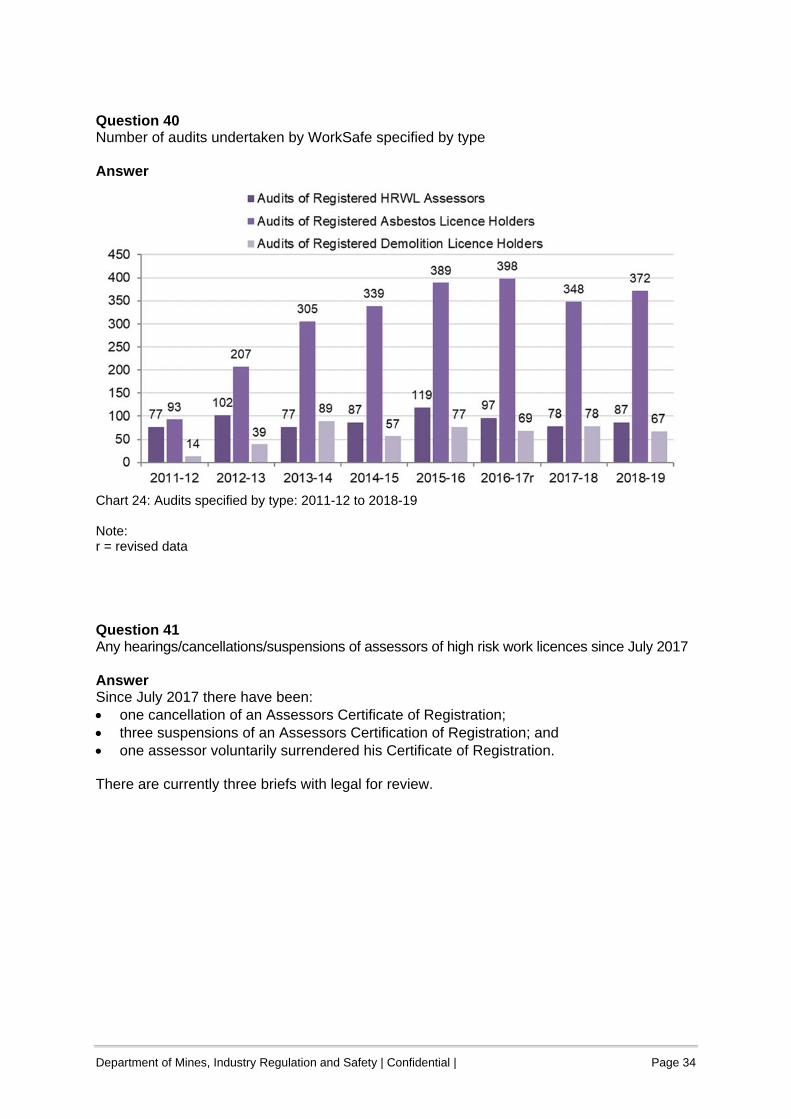
Question 40 Number of audits undertaken by WorkSafe specified by type Answer
Chart 24: Audits specified by type: 2011-12 to 2018-19 Note: r = revised data Question 41 Any hearings/cancellations/suspensions of assessors of high risk work licences since July 2017 Answer Since July 2017 there have been: one cancellation of an Assessors Certificate of Registration; three suspensions of an Assessors Certification of Registration; and one assessor voluntarily surrendered his Certificate of Registration. There are currently three briefs with legal for review.
Department of Mines, Industry Regulation and Safety | Confidential | Page 35
Question 42 Health surveillance notices issued recorded in WISE Answer
Year Number of notices issued for health surveillance under regulation 5.23
2014 18
2015 16
2016 8
2017 10
2018 15
2019*) 29
Table 20: Number of notices issued for health surveillance under regulation 5.23 recorded in WISE on 11 September 2019: 2014 - 2019 *) recorded in WISE between 1 January 2019 and 11 September 2019 Question 43 Number of investigations into bullying/harassment Answer The data provided in the table below is based on the number of bullying/harassment/mental investigations with an RTA attached conducted by the Human Factors and Ergonomics Team in the period 2014-15 to 2018-19.
Financial Year
Bullying/harassment/mental health investigations conducted by the relevant team
2014-15 103
2015-16 121
2016-17 149
2017-18 72
2018-19 53
Total 498
Table 21: Number of bullying/harassment and mental health investigations conducted by the relevant team: 2014-15 to 2018-19
Department of Mines, Industry Regulation and Safety | Confidential | Page 36
List of requested updates to tables, graphs or figures [2018/19 figures to be added, previous figures to be confirmed where stated to be provisional] Information previously provided - Update
sought Source of information
1 DMIRS structure showing the six groups and
detail of the groups which include functions performed by the former WorkSafe Division. Has this changed again?
13 August 2018 letter, attachment 1.37, pp 2 and 25
2 Number of FOI applications received per year 13 August 2018 letter, attachment 1.37, p 17
3 Figures and information produced for DMIRS Annual Report 2017/18
DMIRS Annual Report 2017/18, p 23 (proactive road stops), p 28 (figures and graph for work-related traumatic injury fatalities), p 78 (government goals insofar as they apply to previously WorkSafe activities) and pp86-87 (results and graphs regarding Key Effectiveness Indicator o3.1)
4 Number of LTI/Ds (one or more days/shifts lost from work) recorded in WA
13 August 2018 letter, attachment 1.37, p 3
5 Number of work-related traumatic injury fatalities and fatality incidence rates WA
13 August 2018 letter, attachment 1.37, p 6
6 Number of work-related traumatic injury fatalities notified to WorkSafe per jurisdiction
13 August 2018 letter, attachment 1.36, p 1
7 Number of suspected suicides reported and investigated
13 August 2018 letter p 23
8 Number of events, seminars and presentations
13 August 2018 letter, attachment 1.37, p 23
9 Breakdown of number of Harmonious Workplaces Workshops (metro/regional)
Answer to question on notice 3 asked at hearing held 4 September 2017, dated 21 September 2017, p 5
10 Breakdown of number of registered attendees at Harmonious Workplaces Workshops (metro/regional)
Answer to question on notice 3 asked at hearing held 4 September 2017, dated 21 September 2017, p 6
11 Update to list of examples of the ways WorkSafe works with unions
12 April 2018 letter, pp 37-18
12 Breakdown of WorkSafe funding sources 13 August 2018 letter, attachment 1.36, p 2
13 Staffing levels WorkSafe in FTE calculated over the last pay period of the financial year
13 August 2018 letter, attachment 1.36, p 2
14 Number of training sessions: Skills Development Program, and number of attendees
13 August 2018 letter, attachment 1.36, p 5
15 Number of inspectors that have completed the induction training and number of inspectors that have left
Answer to question on notice 44 asked at hearing held 4 September 2017, p 43
16 Number of received and completed RTAs 13 August 2018 letter, attachment 1.37, p 15
17 Completed investigations proactive and reactive
13 August 2018 letter, attachment 1.37, p 8
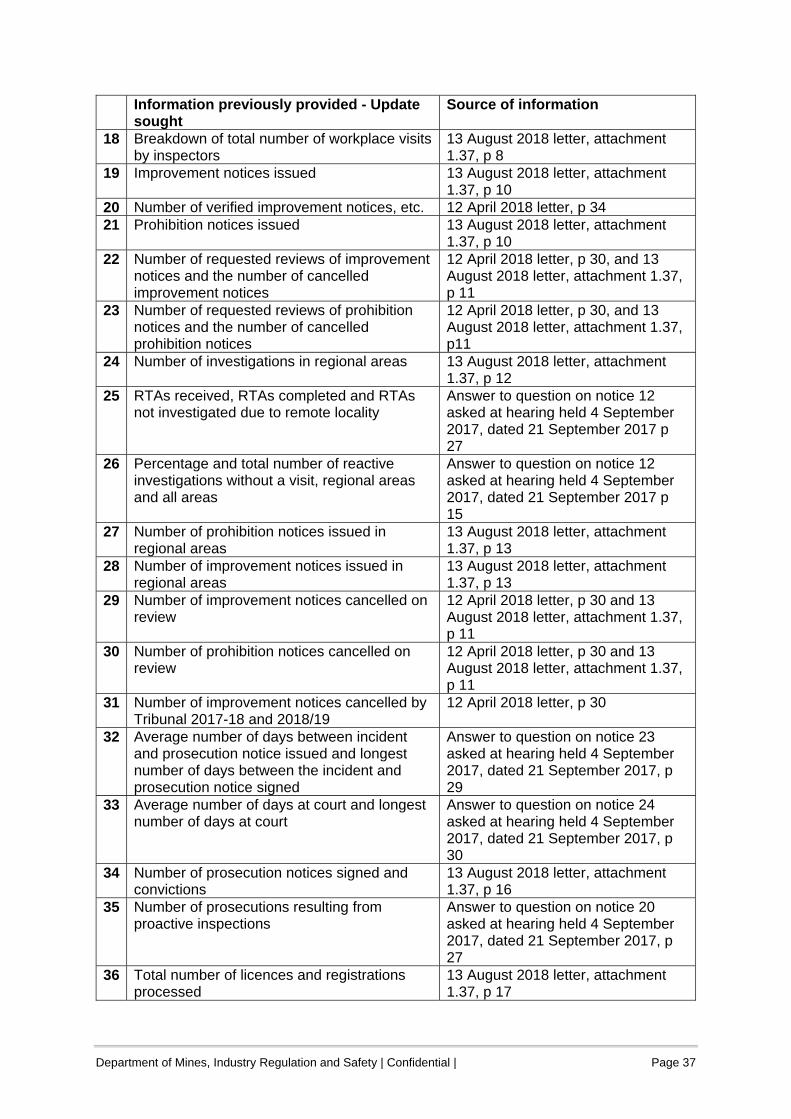
Department of Mines, Industry Regulation and Safety | Confidential | Page 37
Information previously provided - Update sought
Source of information
18 Breakdown of total number of workplace visits by inspectors
13 August 2018 letter, attachment 1.37, p 8
19 Improvement notices issued 13 August 2018 letter, attachment 1.37, p 10
20 Number of verified improvement notices, etc. 12 April 2018 letter, p 34 21 Prohibition notices issued 13 August 2018 letter, attachment
1.37, p 10 22 Number of requested reviews of improvement
notices and the number of cancelled improvement notices
12 April 2018 letter, p 30, and 13 August 2018 letter, attachment 1.37, p 11
23 Number of requested reviews of prohibition notices and the number of cancelled prohibition notices
12 April 2018 letter, p 30, and 13 August 2018 letter, attachment 1.37, p11
24 Number of investigations in regional areas 13 August 2018 letter, attachment 1.37, p 12
25 RTAs received, RTAs completed and RTAs not investigated due to remote locality
Answer to question on notice 12 asked at hearing held 4 September 2017, dated 21 September 2017 p 27
26 Percentage and total number of reactive investigations without a visit, regional areas and all areas
Answer to question on notice 12 asked at hearing held 4 September 2017, dated 21 September 2017 p 15
27 Number of prohibition notices issued in regional areas
13 August 2018 letter, attachment 1.37, p 13
28 Number of improvement notices issued in regional areas
13 August 2018 letter, attachment 1.37, p 13
29 Number of improvement notices cancelled on review
12 April 2018 letter, p 30 and 13 August 2018 letter, attachment 1.37, p 11
30 Number of prohibition notices cancelled on review
12 April 2018 letter, p 30 and 13 August 2018 letter, attachment 1.37, p 11
31 Number of improvement notices cancelled by Tribunal 2017-18 and 2018/19
12 April 2018 letter, p 30
32 Average number of days between incident and prosecution notice issued and longest number of days between the incident and prosecution notice signed
Answer to question on notice 23 asked at hearing held 4 September 2017, dated 21 September 2017, p 29
33 Average number of days at court and longest number of days at court
Answer to question on notice 24 asked at hearing held 4 September 2017, dated 21 September 2017, p 30
34 Number of prosecution notices signed and convictions
13 August 2018 letter, attachment 1.37, p 16
35 Number of prosecutions resulting from proactive inspections
Answer to question on notice 20 asked at hearing held 4 September 2017, dated 21 September 2017, p 27
36 Total number of licences and registrations processed
13 August 2018 letter, attachment 1.37, p 17
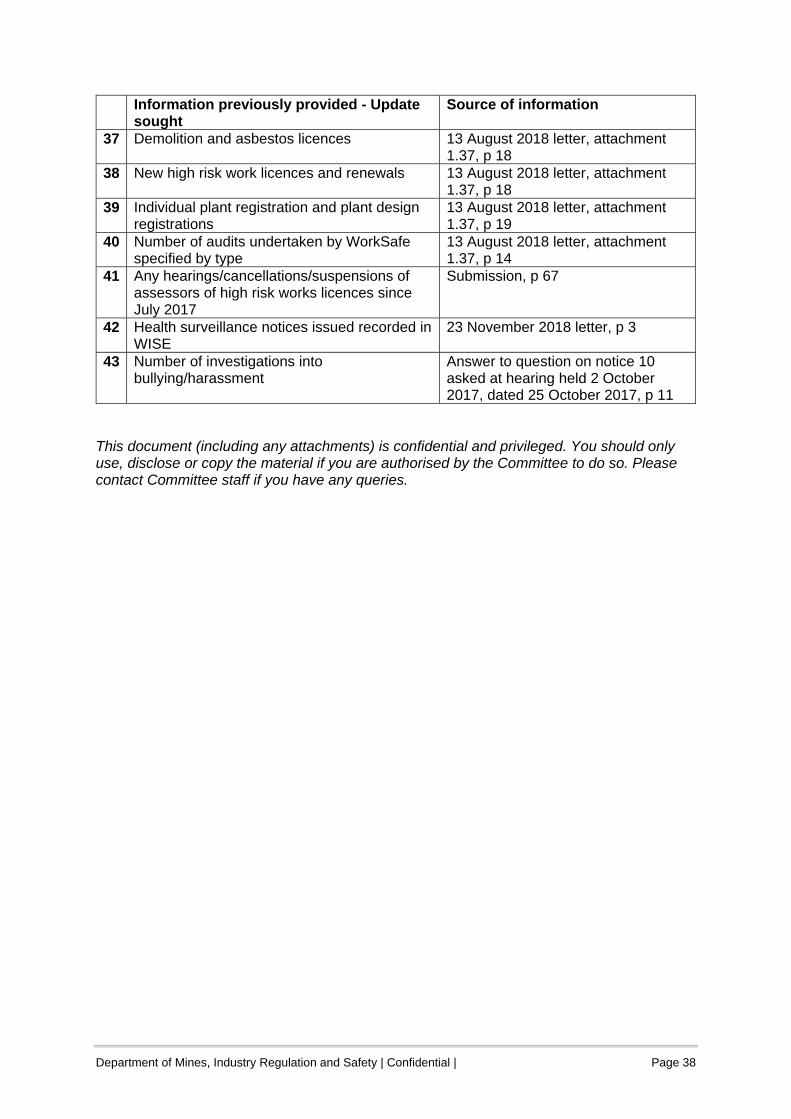
Department of Mines, Industry Regulation and Safety | Confidential | Page 38
Information previously provided - Update sought
Source of information
37 Demolition and asbestos licences 13 August 2018 letter, attachment 1.37, p 18
38 New high risk work licences and renewals 13 August 2018 letter, attachment 1.37, p 18
39 Individual plant registration and plant design registrations
13 August 2018 letter, attachment 1.37, p 19
40 Number of audits undertaken by WorkSafe specified by type
13 August 2018 letter, attachment 1.37, p 14
41 Any hearings/cancellations/suspensions of assessors of high risk works licences since July 2017
Submission, p 67
42 Health surveillance notices issued recorded in WISE
23 November 2018 letter, p 3
43 Number of investigations into bullying/harassment
Answer to question on notice 10 asked at hearing held 2 October 2017, dated 25 October 2017, p 11
This document (including any attachments) is confidential and privileged. You should only use, disclose or copy the material if you are authorised by the Committee to do so. Please contact Committee staff if you have any queries.

KEY
PERF
ORM
ANCE
INDI
CA TO
RS
SECTION 4.1
previous section contents next sectionSECTION 2 SECTION 3 SECTION 4 SECTION 5ABOUT US
63
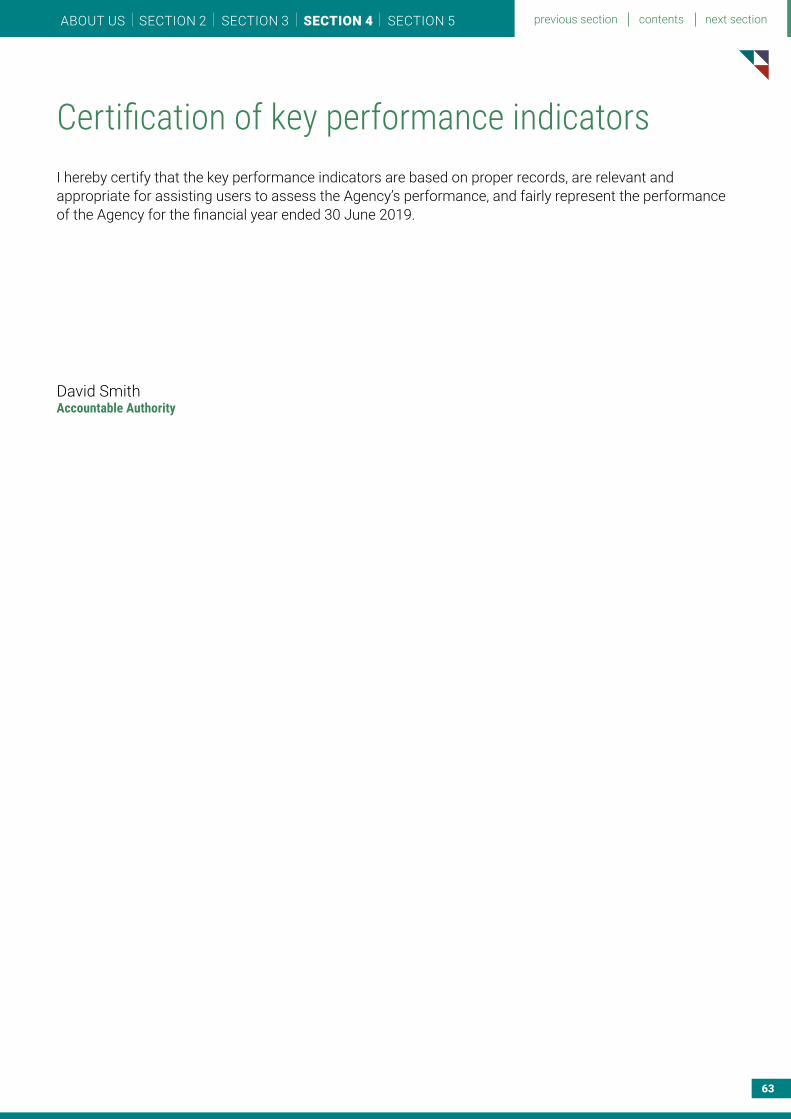
Certification of key performance indicatorsI hereby certify that the key performance indicators are based on proper records, are relevant and appropriate for assisting users to assess the Agency’s performance, and fairly represent the performance of the Agency for the financial year ended 30 June 2019.
David SmithAccountable Authority
SECTION 2 SECTION 3 SECTION 5ABOUT US previous section contents next sectionSECTION 4
64
Services ‣ Service 1 - Resource Advice and Regulation ‣ Service 2 - Safety Advice and Regulation ‣ Service 3 - Industry Advice and Regulation
Key Performance Indicators The department adopted a limited number of high-level, aggregated key performance indicators (KPIs) both in terms of effectiveness in achievement of the outcome and resource efficiency for each of its services.
Figures reported as 2017–18 actuals for each KPI have been recast where possible to allow comparison with 2018–19 results.
The 2018–19 targets were sourced from the ‘2018–19 Budget’ figure published in the 2019–20 Budget Papers.
The department’s new OBM framework was implemented as part of the 2018–19 Budget cycle process. The framework represents our strategic direction and aligns to government goals.
DMIRS has adopted an outward-facing, client-centric approach to the provision of the department’s services. A public-facing service model, when considered in conjunction with a single, integrated outcome statement, is meaningful for external stakeholders as it represents those operational services most easily understood by the community. It is reflected in the department’s name: resources, safety and industry regulation.
OutcomeSupporting a safe, fair and responsible future for the community, industry and resources sector.
Section 4.1: Key performance indicatorsOutcome Based Management Framework (OBM)
SECTION 2 SECTION 3 SECTION 5ABOUT US previous section contents next sectionSECTION 4
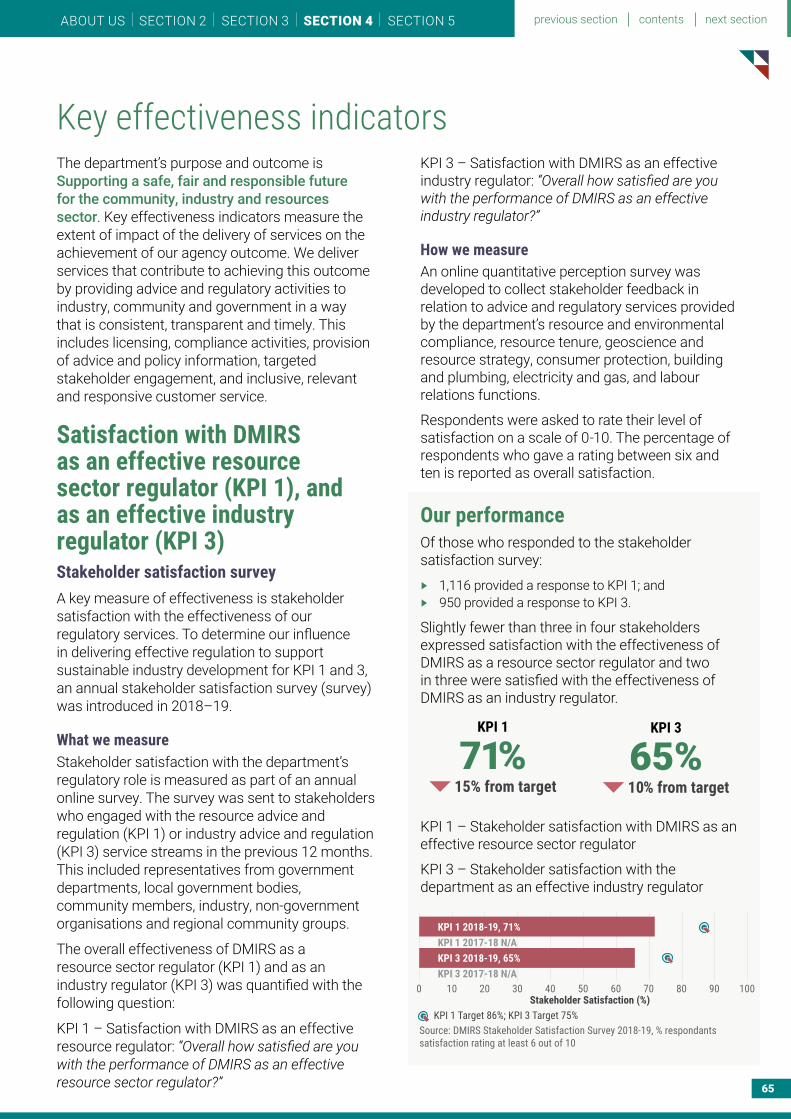
65
Key effectiveness indicatorsKPI 3 – Satisfaction with DMIRS as an effective industry regulator: “Overall how satisfied are you with the performance of DMIRS as an effective industry regulator?”
How we measureAn online quantitative perception survey was developed to collect stakeholder feedback in relation to advice and regulatory services provided by the department’s resource and environmental compliance, resource tenure, geoscience and resource strategy, consumer protection, building and plumbing, electricity and gas, and labour relations functions.
Respondents were asked to rate their level of satisfaction on a scale of 0-10. The percentage of respondents who gave a rating between six and ten is reported as overall satisfaction.
Our performanceOf those who responded to the stakeholder satisfaction survey:
‣ 1,116 provided a response to KPI 1; and ‣ 950 provided a response to KPI 3.
Slightly fewer than three in four stakeholders expressed satisfaction with the effectiveness of DMIRS as a resource sector regulator and two in three were satisfied with the effectiveness of DMIRS as an industry regulator.
KPI 1
71% 15% from target
KPI 3
65% 10% from target
KPI 1 – Stakeholder satisfaction with DMIRS as an effective resource sector regulator
KPI 3 – Stakeholder satisfaction with the department as an effective industry regulator
The department’s purpose and outcome is Supporting a safe, fair and responsible future for the community, industry and resources sector. Key effectiveness indicators measure the extent of impact of the delivery of services on the achievement of our agency outcome. We deliver services that contribute to achieving this outcome by providing advice and regulatory activities to industry, community and government in a way that is consistent, transparent and timely. This includes licensing, compliance activities, provision of advice and policy information, targeted stakeholder engagement, and inclusive, relevant and responsive customer service.
Satisfaction with DMIRS as an effective resource sector regulator (KPI 1), and as an effective industry regulator (KPI 3)Stakeholder satisfaction surveyA key measure of effectiveness is stakeholder satisfaction with the effectiveness of our regulatory services. To determine our influence in delivering effective regulation to support sustainable industry development for KPI 1 and 3, an annual stakeholder satisfaction survey (survey) was introduced in 2018–19.
What we measureStakeholder satisfaction with the department’s regulatory role is measured as part of an annual online survey. The survey was sent to stakeholders who engaged with the resource advice and regulation (KPI 1) or industry advice and regulation (KPI 3) service streams in the previous 12 months. This included representatives from government departments, local government bodies, community members, industry, non-government organisations and regional community groups.
The overall effectiveness of DMIRS as a resource sector regulator (KPI 1) and as an industry regulator (KPI 3) was quantified with the following question:
KPI 1 – Satisfaction with DMIRS as an effective resource regulator: “Overall how satisfied are you with the performance of DMIRS as an effective resource sector regulator?”
92% 47%
0
10
20
30
40
50
0 20 40 60 80 10010 30 50 70 90KPI 3 2017-18 N/A
KPI 1 2017-18 N/AKPI 3 2018-19, 65%
KPI 1 2018-19, 71%
Source: DMIRS Stakeholder Satisfaction Survey 2018-19, % respondants satisfaction rating at least 6 out of 10
Stakeholder Satisfaction (%)KPI 1 Target 86%; KPI 3 Target 75%
0 2 4 6 8 10 11 12 131 3 5 7 9
KPI 2 2017-18, 13(a)
KPI 2 2018-19, 12
(a) Revised figure from that previously published in the State of the Work Environment Report, January 2019.
Number of fatalitiesKPI 2 Target 0
0 2,000 4,0001,000 3,000 5,000KPI 4 2017-18, $4,692
KPI 4 2018-19, $4,172
Cost per live title ($)KPI 4 Target $4,967
0% 40% 80%20% 60% 100%
KPI 6 2017-18, 97%
KPI 6 2018-19, 96%
% determined within 14 days
0 4.00 8.00 10.002.00 6.00 12.00
KPI 5 2017-18, 11.58:1
KPI 5 2018-19, 11.71:1
KPI 5 Target 10.78:1
KPI 6 Target 100%
0 50 150100 200
KPI 7 2017-18, $185
KPI 7 2018-19, $184
Cost per transaction ($)
SECTION 2 SECTION 3 SECTION 5ABOUT US previous section contents next sectionSECTION 4
66
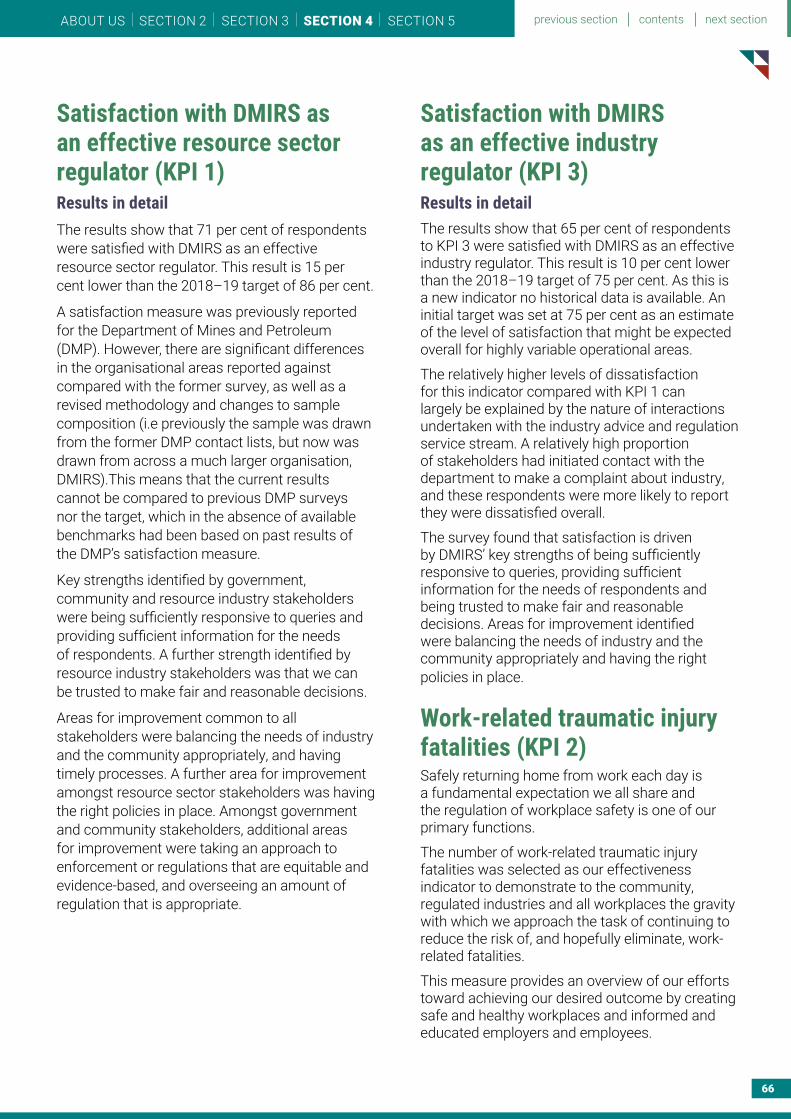
Satisfaction with DMIRS as an effective resource sector regulator (KPI 1) Results in detail The results show that 71 per cent of respondents were satisfied with DMIRS as an effective resource sector regulator. This result is 15 per cent lower than the 2018–19 target of 86 per cent.
A satisfaction measure was previously reported for the Department of Mines and Petroleum (DMP). However, there are significant differences in the organisational areas reported against compared with the former survey, as well as a revised methodology and changes to sample composition (i.e previously the sample was drawn from the former DMP contact lists, but now was drawn from across a much larger organisation, DMIRS).This means that the current results cannot be compared to previous DMP surveys nor the target, which in the absence of available benchmarks had been based on past results of the DMP’s satisfaction measure.
Key strengths identified by government, community and resource industry stakeholders were being sufficiently responsive to queries and providing sufficient information for the needs of respondents. A further strength identified by resource industry stakeholders was that we can be trusted to make fair and reasonable decisions.
Areas for improvement common to all stakeholders were balancing the needs of industry and the community appropriately, and having timely processes. A further area for improvement amongst resource sector stakeholders was having the right policies in place. Amongst government and community stakeholders, additional areas for improvement were taking an approach to enforcement or regulations that are equitable and evidence-based, and overseeing an amount of regulation that is appropriate.
Satisfaction with DMIRS as an effective industry regulator (KPI 3) Results in detail The results show that 65 per cent of respondents to KPI 3 were satisfied with DMIRS as an effective industry regulator. This result is 10 per cent lower than the 2018–19 target of 75 per cent. As this is a new indicator no historical data is available. An initial target was set at 75 per cent as an estimate of the level of satisfaction that might be expected overall for highly variable operational areas.
The relatively higher levels of dissatisfaction for this indicator compared with KPI 1 can largely be explained by the nature of interactions undertaken with the industry advice and regulation service stream. A relatively high proportion of stakeholders had initiated contact with the department to make a complaint about industry, and these respondents were more likely to report they were dissatisfied overall.
The survey found that satisfaction is driven by DMIRS’ key strengths of being sufficiently responsive to queries, providing sufficient information for the needs of respondents and being trusted to make fair and reasonable decisions. Areas for improvement identified were balancing the needs of industry and the community appropriately and having the right policies in place.
Work-related traumatic injury fatalities (KPI 2)Safely returning home from work each day is a fundamental expectation we all share and the regulation of workplace safety is one of our primary functions.
The number of work-related traumatic injury fatalities was selected as our effectiveness indicator to demonstrate to the community, regulated industries and all workplaces the gravity with which we approach the task of continuing to reduce the risk of, and hopefully eliminate, work-related fatalities.
This measure provides an overview of our efforts toward achieving our desired outcome by creating safe and healthy workplaces and informed and educated employers and employees.
SECTION 2 SECTION 3 SECTION 5ABOUT US previous section contents next sectionSECTION 4
67
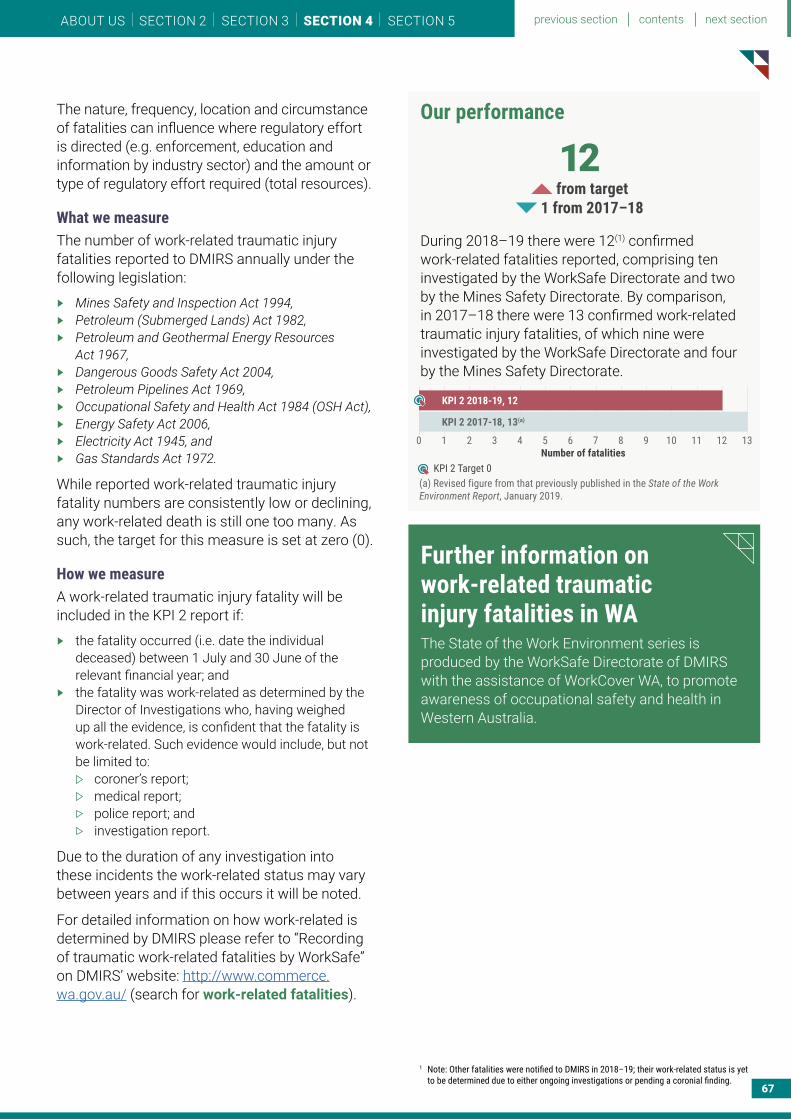
The nature, frequency, location and circumstance of fatalities can influence where regulatory effort is directed (e.g. enforcement, education and information by industry sector) and the amount or type of regulatory effort required (total resources).
What we measureThe number of work-related traumatic injury fatalities reported to DMIRS annually under the following legislation:
‣ Mines Safety and Inspection Act 1994, ‣ Petroleum (Submerged Lands) Act 1982, ‣ Petroleum and Geothermal Energy Resources
Act 1967, ‣ Dangerous Goods Safety Act 2004, ‣ Petroleum Pipelines Act 1969, ‣ Occupational Safety and Health Act 1984 (OSH Act), ‣ Energy Safety Act 2006, ‣ Electricity Act 1945, and ‣ Gas Standards Act 1972.
While reported work-related traumatic injury fatality numbers are consistently low or declining, any work-related death is still one too many. As such, the target for this measure is set at zero (0).
How we measureA work-related traumatic injury fatality will be included in the KPI 2 report if:
‣ the fatality occurred (i.e. date the individual deceased) between 1 July and 30 June of the relevant financial year; and
‣ the fatality was work-related as determined by the Director of Investigations who, having weighed up all the evidence, is confident that the fatality is work-related. Such evidence would include, but not be limited to:
coroner’s report;medical report;police report; andinvestigation report.
Due to the duration of any investigation into these incidents the work-related status may vary between years and if this occurs it will be noted.
For detailed information on how work-related is determined by DMIRS please refer to “Recording of traumatic work-related fatalities by WorkSafe” on DMIRS’ website: http://www.commerce.wa.gov.au/ (search for work-related fatalities).
Our performance
12 from target
1 from 2017–18
During 2018–19 there were 12(1) confirmed work-related fatalities reported, comprising ten investigated by the WorkSafe Directorate and two by the Mines Safety Directorate. By comparison, in 2017–18 there were 13 confirmed work-related traumatic injury fatalities, of which nine were investigated by the WorkSafe Directorate and four by the Mines Safety Directorate.
Further information on work-related traumatic injury fatalities in WAThe State of the Work Environment series is produced by the WorkSafe Directorate of DMIRS with the assistance of WorkCover WA, to promote awareness of occupational safety and health in Western Australia.
1 Note:OtherfatalitieswerenotifiedtoDMIRSin2018–19;theirwork-relatedstatusisyettobedeterminedduetoeitherongoinginvestigationsorpendingacoronialfinding.
92% 47%
0
10
20
30
40
50
0 20 40 60 80 10010 30 50 70 90KPI 3 2017-18 N/A
KPI 1 2017-18 N/AKPI 3 2018-19, 65%
KPI 1 2018-19, 71%
Source: DMIRS Stakeholder Satisfaction Survey 2018-19, % respondants satisfaction rating at least 6 out of 10
Stakeholder Satisfaction (%)KPI 1 Target 86%; KPI 3 Target 75%
0 2 4 6 8 10 11 12 131 3 5 7 9
KPI 2 2017-18, 13(a)
KPI 2 2018-19, 12
(a) Revised figure from that previously published in the State of the Work Environment Report, January 2019.
Number of fatalitiesKPI 2 Target 0
0 2,000 4,0001,000 3,000 5,000KPI 4 2017-18, $4,692
KPI 4 2018-19, $4,172
Cost per live title ($)KPI 4 Target $4,967
0% 40% 80%20% 60% 100%
KPI 6 2017-18, 97%
KPI 6 2018-19, 96%
% determined within 14 days
0 4.00 8.00 10.002.00 6.00 12.00
KPI 5 2017-18, 11.58:1
KPI 5 2018-19, 11.71:1
KPI 5 Target 10.78:1
KPI 6 Target 100%
0 50 150100 200
KPI 7 2017-18, $185
KPI 7 2018-19, $184
Cost per transaction ($)
SECTION 2 SECTION 3 SECTION 5ABOUT US previous section contents next sectionSECTION 4

68
Key efficiency indicatorsAll activities within this ‘lifecycle’ are associated with a mining title; the number and average cost associated with regulating each title forming the basis of this efficiency KPI.
The average cost per live title is an indicator of the efficiency with which the department conducts its resource advice and regulation activities.
How we measureA ‘live title’ is defined as: a title (minerals and petroleum) giving the right to explore for, recover and develop Western Australia’s natural resources.
Live titles include those that:
‣ have been approved during the current year; ‣ are renewed during that year; or ‣ are subject to ongoing regulation by
the department.
The average cost per live title is calculated by:
Total cost of Resource Advice and Regulation Service
--------------------------------------------------------------Number of live titles
Our performance
$4,172 16% from target
11% from 2017–18
The average cost per live title for 2018–19 is $4,172, which is lower than both the target and the 2017–18 actual. This is due largely to a reduction in the cost of service (expenditure) in 2018–19.
Key efficiency indicators are a measure of the value for money we provide by achieving the appropriate balance of resource inputs to service outputs when delivering our services to the community. They demonstrate how efficiently we are conducting our activities and can be represented as an average cost per service or through a measure of timeliness.
Service 1: Resources Advice and Regulation - Average cost of resource regulation per live title (KPI 4) This efficiency indicator measures the department’s Resource Advice and Regulation Service – ensuring that the State’s natural resources are developed and managed responsibly through the provision of resource advice and regulatory services to the Western Australian community.
The resource sector plays a vital role in the State’s economy. The department’s role as a provider of advice and regulation services to the resources sector contributes to making Western Australia a destination of choice for responsible resource exploration and development activities by the resource industry.
What we measureThe amount of resource development and exploration in the State is demonstrated through the number of live resources titles (minerals and petroleum).
Resource development and exploration occurs in the context of the resource management ‘lifecycle’. Activities associated with the resource management ‘lifecycle’ include:
‣ pre-competitive work as per the geoscience and resource strategy;
‣ determination of applications for, and administering, minerals and petroleum tenures;
‣ management of resource tenures over the duration of their operation;
‣ resource, environmental and other technical and administrative compliance;
‣ decommissioning and rehabilitation; and ‣ administration of royalties payments based on
mineral and petroleum sales (commodity sales by industry).
92% 47%
0
10
20
30
40
50
0 20 40 60 80 10010 30 50 70 90KPI 3 2017-18 N/A
KPI 1 2017-18 N/AKPI 3 2018-19, 65%
KPI 1 2018-19, 71%
Source: DMIRS Stakeholder Satisfaction Survey 2018-19, % respondants satisfaction rating at least 6 out of 10
Stakeholder Satisfaction (%)KPI 1 Target 86%; KPI 3 Target 75%
0 2 4 6 8 10 11 12 131 3 5 7 9
KPI 2 2017-18, 13(a)
KPI 2 2018-19, 12
(a) Revised figure from that previously published in the State of the Work Environment Report, January 2019.
Number of fatalitiesKPI 2 Target 0
0 2,000 4,0001,000 3,000 5,000KPI 4 2017-18, $4,692
KPI 4 2018-19, $4,172
Cost per live title ($)KPI 4 Target $4,967
0% 40% 80%20% 60% 100%
KPI 6 2017-18, 97%
KPI 6 2018-19, 96%
% determined within 14 days
0 4.00 8.00 10.002.00 6.00 12.00
KPI 5 2017-18, 11.58:1
KPI 5 2018-19, 11.71:1
KPI 5 Target 10.78:1
KPI 6 Target 100%
0 50 150100 200
KPI 7 2017-18, $185
KPI 7 2018-19, $184
Cost per transaction ($)
SECTION 2 SECTION 3 SECTION 5ABOUT US previous section contents next sectionSECTION 4
69
Results in detail ‣ The 2018–19 actual cost of service is lower than
both the 2017–18 (10 per cent) and the budget cost of service (13 per cent) due to budget repair measures initiated by the government and savings measures by the department. The department initiated savings measures are in response to shortfalls in cash, as revenue streams are volatile and reflect the upturns and downturns experienced by the Industry and Resource Sectors.
Service 2: Safety Advice and Regulation - Cost of work-related lost time injury and disease claims in relation to cost of service (KPI 5)The Safety Advice and Regulation Service has a strong alignment to building safe and resilient communities through its provision of advice and regulatory services in the area of occupational safety and health. The service’s focus is on building capacity and changing behaviours through education, advice and regulation, thus contributing to improved workplace and general community safety and health.
To measure the extent to which the department achieves safety advice and regulation, we have adopted the cost effectiveness indicator ‘Cost of work-related lost time injury and disease claims in relation to the cost of service’.
What we measureThis measure demonstrates the department’s capacity to effectively administer and enforce safety legislation in order to build safe and resilient communities. It reflects the relationship between the total cost of regulatory effort and workplace safety outcomes.
Our focus is on efficiently changing behaviours through regulation, education and building industry and community capacity.
How we measureThe total annual cost of compensable claim payments in Western Australia (WorkCover WA claims data) is divided by the total cost of the Safety Advice and Regulation Service to produce a ratio. This illustrates the relationship between the cost of service and the annual cost to the
community due to workplace injuries or disease i.e. for every dollar DMIRS spent regulating and educating within the sector, ‘x’ is spent on workers’ compensation.
Annual total cost of compensable injury and disease claims
--------------------------------------------------------------Total cost of
Safety Advice and Regulation Service
The target for this indicator was set using the calculated average across five years excluding the latest preliminary data for comparable injury and disease claim costs.
It should be noted that preliminary data is available approximately 12 months after the close of each reporting period, however these data considerably underestimate claim costs due to the shorter development time for claims at the point of extraction. Hence it is preferable to use revised data from prior reporting periods for the calculation of this indicator, as it is more stable and less likely to undergo further substantial revision. This means there is a two-year lag in claims data used (i.e. 2016–17 claims data has been used with the 2018–19 cost of Service 2).
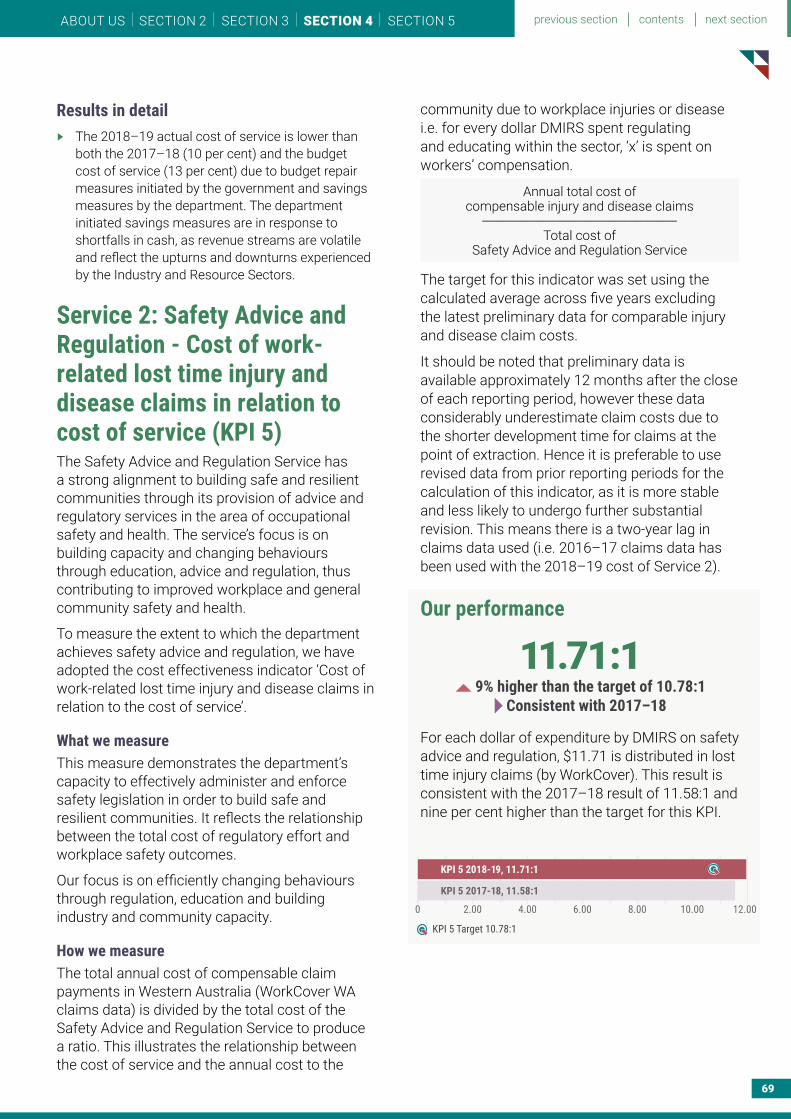
Our performance
11.71:1 9% higher than the target of 10.78:1
Consistent with 2017–18
For each dollar of expenditure by DMIRS on safety advice and regulation, $11.71 is distributed in lost time injury claims (by WorkCover). This result is consistent with the 2017–18 result of 11.58:1 and nine per cent higher than the target for this KPI.
92% 47%
0
10
20
30
40
50
0 20 40 60 80 10010 30 50 70 90KPI 3 2017-18 N/A
KPI 1 2017-18 N/AKPI 3 2018-19, 65%
KPI 1 2018-19, 71%
Source: DMIRS Stakeholder Satisfaction Survey 2018-19, % respondants satisfaction rating at least 6 out of 10
Stakeholder Satisfaction (%)KPI 1 Target 86%; KPI 3 Target 75%
0 2 4 6 8 10 11 12 131 3 5 7 9
KPI 2 2017-18, 13(a)
KPI 2 2018-19, 12
(a) Revised figure from that previously published in the State of the Work Environment Report, January 2019.
Number of fatalitiesKPI 2 Target 0
0 2,000 4,0001,000 3,000 5,000KPI 4 2017-18, $4,692
KPI 4 2018-19, $4,172
Cost per live title ($)KPI 4 Target $4,967
0% 40% 80%20% 60% 100%
KPI 6 2017-18, 97%
KPI 6 2018-19, 96%
% determined within 14 days
0 4.00 8.00 10.002.00 6.00 12.00
KPI 5 2017-18, 11.58:1
KPI 5 2018-19, 11.71:1
KPI 5 Target 10.78:1
KPI 6 Target 100%
0 50 150100 200
KPI 7 2017-18, $185
KPI 7 2018-19, $184
Cost per transaction ($)
SECTION 2 SECTION 3 SECTION 5ABOUT US previous section contents next sectionSECTION 4
70
Results in detail ‣ The variation from target is driven by both a
reduction in lost time injury claims (2016–17) and reduced cost of service.
‣ The 2018–19 actual cost of service is lower than the budget cost of service, due to budget repair measures initiated by the government and savings measures by the department. The department initiated savings measures are in response to shortfalls in cash, as revenue streams are volatile and reflect the upturns and downturns experienced by the Industry and Resources Sectors.
Percentage of high risk work licence applications determined within agreed timeframes (KPI 6) A High Risk Work Licence (HRWL) is a nationally recognised licence required to undertake high risk work, such as to operate a crane or erect scaffolding. The licence is granted for each classification of high risk work the holder has been trained in and assessed as competent. High risk work licensing in Western Australia is conducted by WorkSafe.
HRWL per class issued, renewed or modified equate to approximately 90 per cent of the entire quantity of licences and registrations delivered by the Safety Advice and Regulation Service of DMIRS.
This measure demonstrates the department’s capacity to effectively administer and enforce the primary step in safety regulation in order to build safe and resilient communities – a key focus of the department and government.
What we measureBy providing a comprehensive and timely licensing service to the community, a major barrier to supporting safe and responsible work environments is removed.
The number of HRWL applications finalised within 14 days for each category–new, modification, or renewal–is calculated as a proportion of the total applications finalised during the same reporting period.
New, modified, and renewed HRWL applications are considered to be equivalent in workload but the volume of each category varies so a weighted average is used for this measure.
How we measureThe average is calculated for each category by dividing the number of applications finalised within 14 days by the total number of that category of application finalised during the same period. The average timeliness is then weighted (W) by the per cent volume of that category for the same reporting period, and then adding the three results.
KPI 6 = (Ave New × W1) + (Ave Modification × W2) + (Ave Renewal × W3)(1)
(1) weighting by volume. W = W1 + W2 + W3 = 1
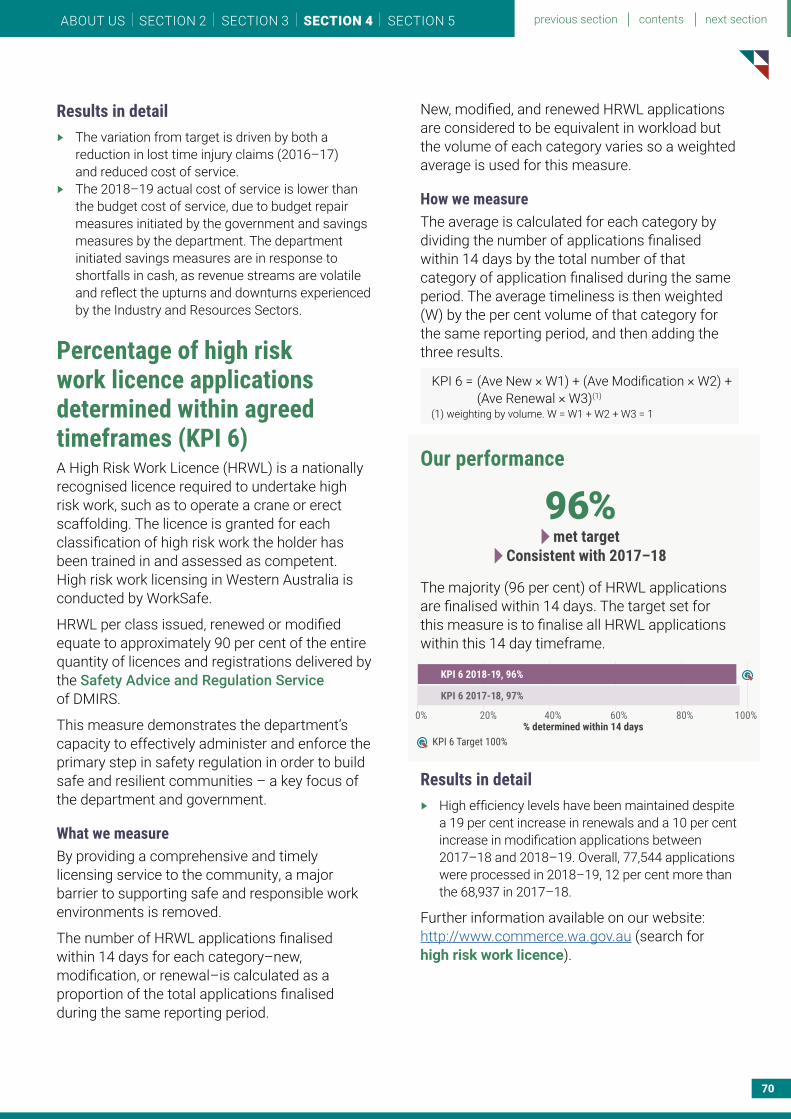
Our performance
96% met target
Consistent with 2017–18
The majority (96 per cent) of HRWL applications are finalised within 14 days. The target set for this measure is to finalise all HRWL applications within this 14 day timeframe.
Results in detail ‣ High efficiency levels have been maintained despite
a 19 per cent increase in renewals and a 10 per cent increase in modification applications between 2017–18 and 2018–19. Overall, 77,544 applications were processed in 2018–19, 12 per cent more than the 68,937 in 2017–18.
Further information available on our website: http://www.commerce.wa.gov.au (search for high risk work licence).
92% 47%
0
10
20
30
40
50
0 20 40 60 80 10010 30 50 70 90KPI 3 2017-18 N/A
KPI 1 2017-18 N/AKPI 3 2018-19, 65%
KPI 1 2018-19, 71%
Source: DMIRS Stakeholder Satisfaction Survey 2018-19, % respondants satisfaction rating at least 6 out of 10
Stakeholder Satisfaction (%)KPI 1 Target 86%; KPI 3 Target 75%
0 2 4 6 8 10 11 12 131 3 5 7 9
KPI 2 2017-18, 13(a)
KPI 2 2018-19, 12
(a) Revised figure from that previously published in the State of the Work Environment Report, January 2019.
Number of fatalitiesKPI 2 Target 0
0 2,000 4,0001,000 3,000 5,000KPI 4 2017-18, $4,692
KPI 4 2018-19, $4,172
Cost per live title ($)KPI 4 Target $4,967
0% 40% 80%20% 60% 100%
KPI 6 2017-18, 97%
KPI 6 2018-19, 96%
% determined within 14 days
0 4.00 8.00 10.002.00 6.00 12.00
KPI 5 2017-18, 11.58:1
KPI 5 2018-19, 11.71:1
KPI 5 Target 10.78:1
KPI 6 Target 100%
0 50 150100 200
KPI 7 2017-18, $185
KPI 7 2018-19, $184
Cost per transaction ($)
SECTION 2 SECTION 3 SECTION 5ABOUT US previous section contents next sectionSECTION 4

71
Service 3: Industry Advice and Regulation - Average cost per transaction to deliver industry advice and regulation services (KPI 7)This indicator measures the average cost per advice or regulatory service transaction provided to the community in the areas of consumer protection, building, plumbing, electricity, gas, and labour relations.
The aim of the Industry Advice and Regulation Service is to find a balance between empowering the business user through education and advice, whilst minimising barriers for businesses to successfully and lawfully trade. This indicator is therefore indicative of the per-unit cost to provide a healthy economy and business environment.
What we measureWhile this indicator is highly aggregated overall, the underpinning elements have been determined by the individual business areas. By using a quantity figure, the department can determine the resource distribution and effort across the industry sector and type of transaction. For example an increase in investigation figures may indicate that a redistribution would be beneficial towards areas of education and advice.
How we measureA transaction is defined for this indicator as: an action by DMIRS to provide a service or regulatory action to an external stakeholder, initiated by either party.
An action refers to community education and media services, addressing an enquiry, determination of an application, licence or registration, resolution of a complaint or conciliation, and finalisation of compliance actions such as an investigation, inspection, audit, and/or legal matter all of which are to only be counted once finalised (e.g. investigations are counted based on the date that the investigation was finalised).
Total cost of the Industry Advice and Regulation Service is divided by the number of transactions.
Total cost of Industry Advice and Regulation Service
--------------------------------------------------------------Number of transactions
Our performance
$184 Consistent with 2017–18
The average cost per transaction to deliver industry advice and regulation services is $184, which is consistent with the 2017–18 result.
The target for this KPI ($158) was based on a methodology which has since been refined. Therefore the 2018–19 result is not comparable to the target due to these changes in the KPI methodology since setting the target.
Results in detail ‣ The average cost per transaction to deliver industry
advice and regulation services is consistent (less than one per cent) with that recorded in 2017–18. This is due to the cost of service being less (four per cent) than 2017–18 as the department initiated savings measures in response to shortfalls in cash, coupled with slightly fewer (four per cent) transactions from 2017–18.
92% 47%
0
10
20
30
40
50
0 20 40 60 80 10010 30 50 70 90KPI 3 2017-18 N/A
KPI 1 2017-18 N/AKPI 3 2018-19, 65%
KPI 1 2018-19, 71%
Source: DMIRS Stakeholder Satisfaction Survey 2018-19, % respondants satisfaction rating at least 6 out of 10
Stakeholder Satisfaction (%)KPI 1 Target 86%; KPI 3 Target 75%
0 2 4 6 8 10 11 12 131 3 5 7 9
KPI 2 2017-18, 13(a)
KPI 2 2018-19, 12
(a) Revised figure from that previously published in the State of the Work Environment Report, January 2019.
Number of fatalitiesKPI 2 Target 0
0 2,000 4,0001,000 3,000 5,000KPI 4 2017-18, $4,692
KPI 4 2018-19, $4,172
Cost per live title ($)KPI 4 Target $4,967
0% 40% 80%20% 60% 100%
KPI 6 2017-18, 97%
KPI 6 2018-19, 96%
% determined within 14 days
0 4.00 8.00 10.002.00 6.00 12.00
KPI 5 2017-18, 11.58:1
KPI 5 2018-19, 11.71:1
KPI 5 Target 10.78:1
KPI 6 Target 100%
0 50 150100 200
KPI 7 2017-18, $185
KPI 7 2018-19, $184
Cost per transaction ($)
SECTION 2 SECTION 3 SECTION 5ABOUT US previous section contents next sectionSECTION 4
116
Department of Mines, Industry Regulation and SafetyGovernment of Western AustraliaMineral House, 100 Plain StreetEast Perth, Western Australia 6004Tel: +61 8 9222 3333Fax: +61 8 9222 3862Website: www.dmirs.wa.gov.auEmail: [email protected]