Embed Size (px)
Citation preview

Annual Report 2019–20DMIRS
Government of Western AustraliaDepartment of Mines, Industry Regulation and Safety
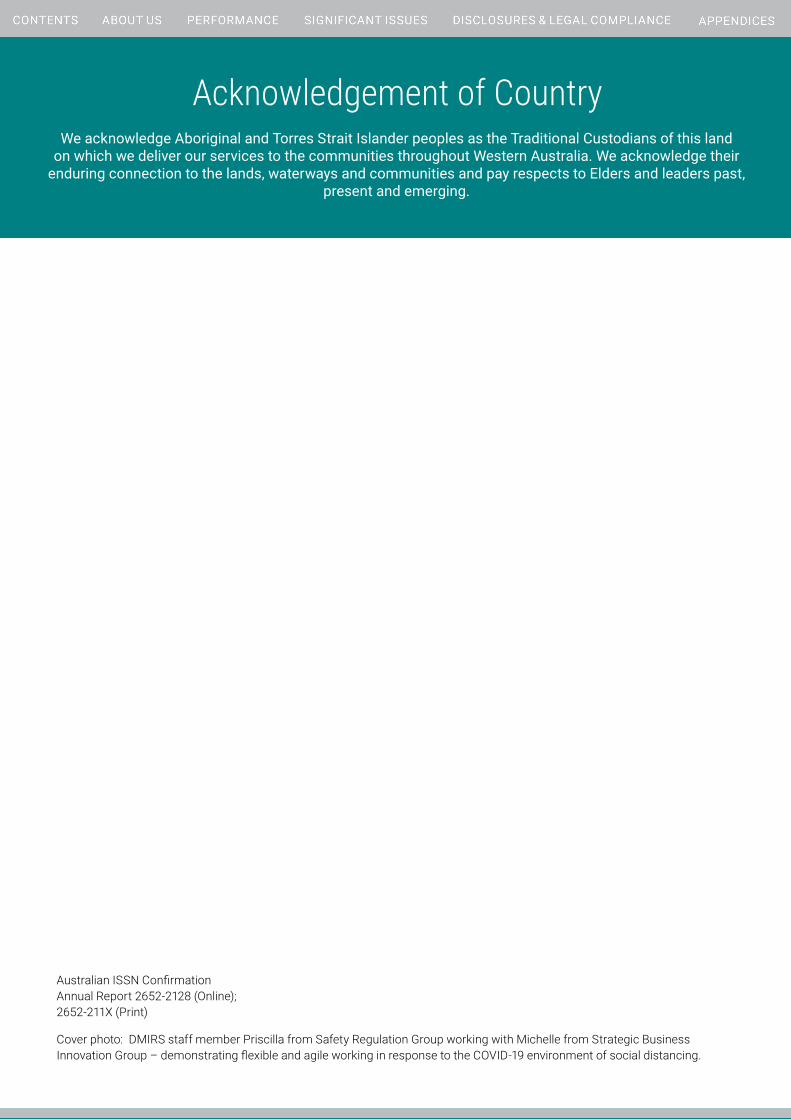
Acknowledgement of CountryWe acknowledge Aboriginal and Torres Strait Islander peoples as the Traditional Custodians of this land
on which we deliver our services to the communities throughout Western Australia. We acknowledge their enduring connection to the lands, waterways and communities and pay respects to Elders and leaders past,
present and emerging.
Australian ISSN Confirmation Annual Report 2652-2128 (Online); 2652-211X (Print)
Cover photo: DMIRS staff member Priscilla from Safety Regulation Group working with Michelle from Strategic Business Innovation Group – demonstrating flexible and agile working in response to the COVID-19 environment of social distancing.

1
CONTENTS
Acknowledgement of Country iiWelcome 2Statement of compliance 3
ABOUT US 5Message from the Director General 6Executive summary 8DMIRS at a glance 10Our values 10Organisational chart 11Our Groups 12Connecting with stakeholders 14Working together across WA 17Administered legislation 18Performance management framework 20Shared responsibilities with other agencies 21
PERFORMANCE 25Snapshot of our performance 26Response to the COVID-19 pandemic 30Our key achievements 32Regulator 32Service provider 38Policy maker 42
SIGNIFICANT ISSUES 45Significant issues impacting DMIRS 46
DISCLOSURES & LEGAL COMPLIANCE 51Ministerial directions 52Other financial disclosures 52Our people 53Government policy requirements 61Governance disclosures 64Other legal requirements 66
FINANCIAL AND NON-FINANCIAL PERFORMANCE 72Independent auditor’s report 73
KEY PERFORMANCE INDICATORS (KPI) 77Audited key performance indicators 78
FINANCIAL 86Financial Statements 87
APPENDICES 128Act specific reporting 129Government policy requirements 136

2
WelcomeThe Department of Mines, Industry Regulation and Safety is
pleased to present our Annual Report for 2019–20
Considered one of the strongest and most efficient shapes, the hexagon appears in many areas of nature and life. Honeycombs created to store honey, interlocking columns of volcanic rock and the bond shape of certain molecules – the shapes within a hexagon perfectly interlock with no gaps. The result of this is that they require less materials to construct and have a lot of compressive strength.
Hex is a Greek prefix which means ‘six’. A regular hexagon has six sides that are all congruent, or equal in measurement and is convex, meaning all the points of the hexagon point outward.
The hexagonal design used throughout this report serves as an analogy of our commitment to ‘working together’ across our six Groups for the betterment of our stakeholders and the community.
It represents our people all working together, towards a shared purpose.
Three-part series
“Coming together is
a beginning,
keeping together is progress,
working together is success”
Edward Everett Hale
Our 2017–18 annual report, the first report after the 2017 Machinery of Government changes, focused on the first part of this quote: coming together is a beginning.
The next installment, our 2018–19 annual report focused on the second part of the quote: Keeping together is progress.
This year, the third part of the quote: working together is success is a celebration of our collaborative achievements.
Enabling legislationThe department was established under the Public Sector Management Act 1994 on 1 July 2017.
AccessibilityWe are committed to providing accessible services to our customers and stakeholders.
This report is available online and in alternative formats upon request.
Translator and Interpreter ServicesFor our customers and stakeholders from culturally and linguistically diverse backgrounds, you may prefer to contact the Translator and Interpreter Service on 13 14 50 and we will arrange an interpreter to communicate the report to you.
FeedbackWe welcome feedback and questions on this annual report and encourage you to do so:
‣ in person: 100 Plain Street, East Perth; ‣ via email: [email protected]; or ‣ via: surveymonkey.com/r/DMIRSAR2019-20

3
Statement of compliance
Hon Bill JOHNSTON MLAMinister for Mines and Petroleum; Energy; Industrial Relations
Hon John QUIGLEY LLB JP MLAAttorney General; Minister for Commerce
In accordance with section 63 of the Financial Management Act 2006, I hereby submit for your information and presentation to Parliament, the Annual Report of the Department of Mines, Industry Regulation and Safety for the year ended 30 June 2020.
The annual report has been prepared in accordance with the provisions of the Financial Management Act 2006 and also fulfils obligations pursuant to section 73(3) of the Building Services (Registration) Act 2011; section 60 of the Credit (Administration) Act 1984; section 12A of the Debt Collectors Licensing Act 1964; section 175ZE Electoral Act 1907; section 33 of the Electricity Act 1945; section 10A of the Employment Agents Act 1976; section 13CA of the Gas Standards Act 1972; section 31 of the Land Valuers Licensing Act 1978; section 51 of the Motor Vehicle Dealers Act 1973; section 59E(7) and 59H(2) of the Plumbers Licensing Act 1995; section 135(2) of the Real Estate and Business Agents Act 1978; section 12 of the Retirement Villages Act 1992; and section 112(2) of the Settlement Agents Act 1981.
David Smith Director General 16 September 2020

4

55
ABOUT US
5
ABOUT US

6
Message from the Director GeneralKaya Wandju
The 2019–20 year has been extraordinary.
Any reflection on the past 12 months will be dominated by the impact that COVID-19 has had on our world, our community and our workplace since its appearance as a global issue from January.
Here at DMIRS, during this period, we have put a high priority on providing a safe workplace and ensuring the protection of our workforce. Like other public service agencies we have aimed to do this while maintaining the key services that the Western Australian community and government expect and need from us.
As evidenced in this annual report on our activities, DMIRS continues to play a unique role in supporting a safe, fair and responsible future for the Western Australian community, industry and resources sector.
To do that, we work together across six diverse Groups: Industry Regulation and Consumer Protection, Safety Regulation, Resource and Environmental Regulation, Strategic Business Innovation, Service Delivery, and Corporate Services.
During the year, our department was expanded further with the establishment of Energy Policy WA, a standalone sub-department of DMIRS.
While we are a diverse and busy department, we all have a shared commitment to our purpose and values – being responsive, forward thinking, fair, ethical, transparent and respectful to enhance the way we work as a regulator, service provider and policy maker.
This has put us in good stead dealing with the impact of the pandemic. Like all Western Australians we were challenged to be more resilient, flexible and responsive to the evolving COVID-19 situation. By adapting our business model, I am happy to report that we have continued safely serving our customers and the community, albeit differently, during this unprecedented time, and kept our workforce safe.
As is well shown in this Annual Report we have continued to perform and deliver our wide range of services, including key regulatory functions, and progressed many Government legislative and other reforms.

7
In recent months, we have also been contributing to the Government’s plan for recovery of the Western Australian economy as COVID restrictions are eased. Our goal here is to lift the prosperity and well-being of all Western Australians, repositioning our State as a thriving and innovative place in which to live, work, visit and do business.
To reflect this changed focus for the department, and allow us to best manage DMIRS’ continued contribution to service delivery and support, response and recovery we have developed a new Strategic Plan – Response to the COVID-19 Environment.
This annual report recognises and celebrates all of our achievements through 2019–20. These achievements that would not have been possible without the hard work and commitment of our people. I am incredibly proud of what we have achieved together – in our teams, across the department, and as part of the broader Western Australian public sector.
Every critical event creates opportunities, and over the coming year we will be focused on enhancing the changes we have made and working together to contribute to Western Australia’s recovery phase.
We look forward to another dynamic year ahead as we continue to serve the Western Australian community in 2020–21.
David Smith Director General

8
Executive summaryWelcome to the 2019–20 annual report for DMIRS. This report details our progress from 1 July 2019 to 30 June 2020 towards the department’s purpose, presented in the context of our role as a regulator, service provider and a policy maker and our aligning government priorities.
We come to work every day to deliver the best outcomes for our customers and our stakeholders, and this report captures our commitment to them through the work we have achieved throughout the year.
We are committed to good governance and being accountable for our actions, and have linked our report to the good governance principles: strategy, culture, relations, performance and compliance and accountability (referenced on the Public Sector Commission’s website).
Our core value statement which describes the way we do our business, is that we lead with integrity, deliver on commitments, strive for excellence, and look for better ways of doing things.
In the About us section, you can find out more about who we are, what we value and what we do, with a synopsis of each business area within the department and how they contribute towards our purpose. You can gain some insight into the department’s 2019–20 year, through a message from our Director General, David Smith, who outlines from his perspective of the year in review.
Cross-agency co-operation and collaboration was a focus during the year, and was particularly integral throughout the COVID-19 pandemic and recovery effort. In this section, we detail how we have continued to build and strengthen our relationships with our diverse stakeholders over the year and the outcomes we have achieved by being committed to collaboration, through our contribution to whole-of-government and cross-agency projects.
We also outline the geographical scope of our activities, which are far reaching across Western Australia metropolitan and regional locations, and details our wide range of administered legislation stretching across departmental business areas, with 96 acts under our responsibility.
We discuss our performance management framework (Outcome Based Management) which is the formal mechanism allowing DMIRS to demonstrate accountability and transparency to Parliament, the public and our stakeholders.
Governance actives in relation to strategy, culture and relations are detailed in this section.
We constantly strive for excellence through anticipating and adapting to new and better ways of working to ensure we are best positioned to deliver on outcomes for our stakeholders.
Our performance details our most notable achievements over the year aligned with the priorities of Government and our approach as regulator, service provider and policy maker. During 2019–20, the COVID-19 pandemic challenged us to introduce new ways of delivering our services to continue to fulfil our commitments to our stakeholders, whilst adhering to advice from Government to protect the health of our staff and the community. Our flexibility, forward thinking approach and ability to respond with urgency
supported the realisation of our key achievements during the year.
Noteworthy matters relating to our performance include the: targeted consultation on a draft bill to provide security of payment reform for the building and construction industry; development of new statutory guidelines for mining proposals and mine closure plans aimed to improve approval processes for mineral and energy resource activities; passing of laws in Parliament to protect children from toppling furniture; and development of new General Orders to assist private sector employment and public sector adaptive response to the COVID-19 environment.
An assessment of our effectiveness and efficiency is contained within a summary of the key performance indicator report, as well as other performance reporting.

9
We aim to be responsive, so that we can react with agility to the needs of our customers, and we are actively forward thinking, to ensure we can identify and support new and emerging trends. Our report this year demonstrates our commitment to these values.
Current and emerging issues and trends that impacted DMIRS during the year are covered in Significant Issues and Trends within this section. During 2019–20, the significant effects of the COVID-19 pandemic were felt across the Western Australian community and public sector, which required agility to adapt to new ways of working to continue to deliver services in an uncertain environment. Our values of being responsive and forward thinking guided us through the significant issues the department faced
during the pandemic, and will continue to guide us on the road to recovery.
Other significant issues included in this section are: hand sanitisers and flammable goods; reforms to the building and construction industry; and asbestos removal licensing.
In everything we do, we lead with integrity and with accountability to ensure our stakeholders can count on us to deliver on our commitments and to fulfil their expectations.
Our key performance indicators, financial statements and other reporting obligations are provided in the Disclosures and Legal Compliance section. We outline our commitment to our people, through our adherence to public sector standards and our ethical, equal opportunity, occupational health and safety and record keeping obligations. You can also read about our strong governance activities in relation to compliance and accountability.
We are guided by our values of being ethical and transparent; the Appendices section outlines our statutory required reporting.
We outline our legislative required Act-specific reporting, as well as membership and remuneration of our boards and committees. The Appendices details our governance accountabilities for statutory reporting and aligns with our commitment to providing accurate information.
We have provided this report online as an interactive document. This approach is in keeping with the department’s focus on maximising digital content delivery to limit the impact to the environment.
To engage with readers, we have also designed an innovative annual report snapshot (contained within Our performance), which summarises the key information from our report in an easily extractable, stand-alone document.
Thank you for taking the time to read about our contributions to the State during 2019–20.

1010
DMIRS at a glance
Who are we?We are the Department of Mines, Industry Regulation and Safety – or DMIRS, formed on 1 July 2017. Our Director General and 1,647 staff are all working towards supporting a safe, fair and responsible future for the Western Australian community, industry and resources sector.
We are comprised of six Groups:
0 100 200 300 400 500
406
394
351
197
119
180 Corporate Services
Industry Regulation and Consumer Protection
Strategic Business Innovation
Safety Regulation
ServiceDelivery
Resource and EnvironmentalRegulation
Number of staff per Group
Our values
Ethical
Fair
Transparent
Responsive
Respectful
Forward thinking
Our Strategic Intent approach: To view the ways we maximised our impact as a regulator, service provider, policy maker refer pages 32 – 44.
Regulator
Service provider
Policy maker
Our focus:Towards 2024, our former Strategic Plan provided the blueprint for our operations for the majority of the year. The strategic themes included: regulatory practice and reform (refer page 27, 32 – 37), customer centric service (refer page 27, 38 – 41) and skilled, diverse and flexible workforce (refer page 53).
During the year, we had a change in focus. In response to COVID-19, the Premier outlined three focus areas for all public sector agencies:1. Delivering critical frontline services and
support functions2. Driving the State’s COVID-19 response3. Preparing for Western Australia’s economic
and social recoveryTo enable us to be dynamic, agile and prepared to respond with urgency, we launched a new DMIRS Strategic Plan – Response to the – COVID-19 Environment (refer page 30).
11
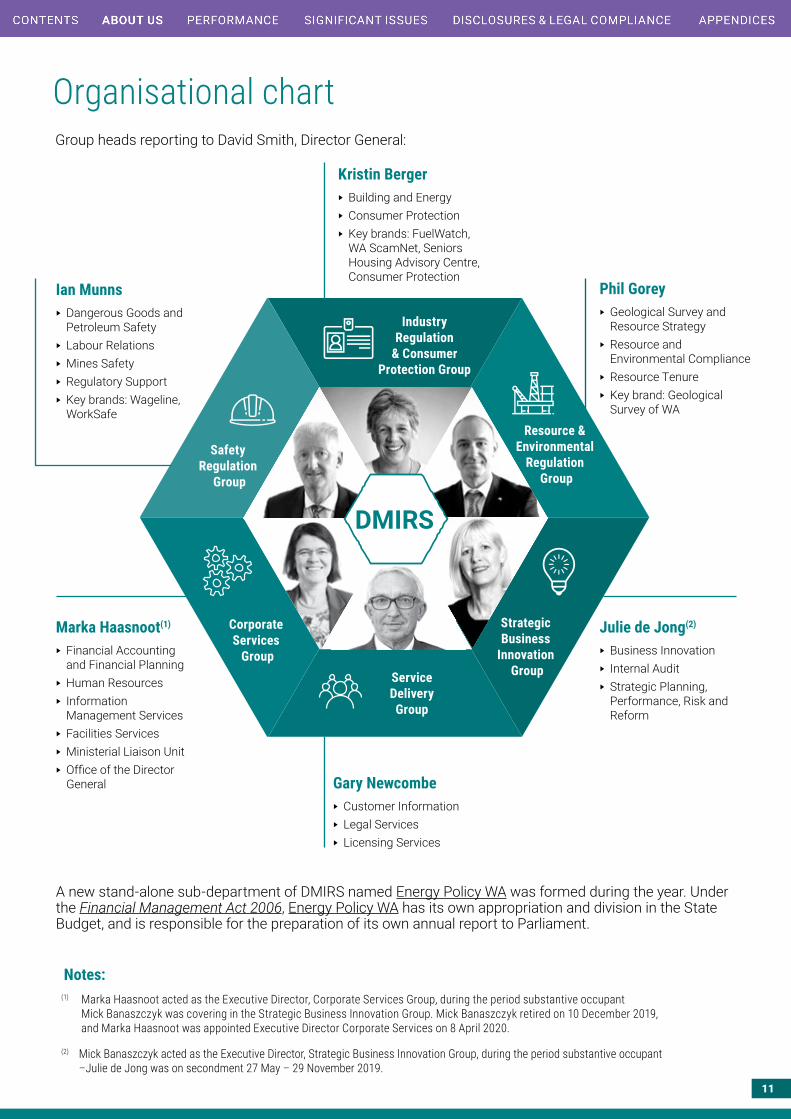
Organisational chartGroup heads reporting to David Smith, Director General:
Safety Regulation
Group
Ian Munns ‣ Dangerous Goods and Petroleum Safety
‣ Labour Relations ‣ Mines Safety ‣ Regulatory Support ‣ Key brands: Wageline, WorkSafe
Industry Regulation
& Consumer Protection Group
Kristin Berger ‣ Building and Energy ‣ Consumer Protection ‣ Key brands: FuelWatch, WA ScamNet, Seniors Housing Advisory Centre, Consumer Protection
Resource & Environmental
Regulation Group
Phil Gorey ‣ Geological Survey and Resource Strategy
‣ Resource and Environmental Compliance
‣ Resource Tenure ‣ Key brand: Geological Survey of WA
Strategic Business
Innovation Group
Julie de Jong(2)
‣ Business Innovation ‣ Internal Audit ‣ Strategic Planning, Performance, Risk and Reform
Service Delivery Group
Gary Newcombe ‣ Customer Information ‣ Legal Services ‣ Licensing Services
Corporate Services Group
Marka Haasnoot(1)
‣ Financial Accounting and Financial Planning
‣ Human Resources ‣ Information Management Services
‣ Facilities Services ‣ Ministerial Liaison Unit ‣ Office of the Director General
DMIRS
A new stand-alone sub-department of DMIRS named Energy Policy WA was formed during the year. Under the Financial Management Act 2006, Energy Policy WA has its own appropriation and division in the State Budget, and is responsible for the preparation of its own annual report to Parliament.
Notes:(1) Marka Haasnoot acted as the Executive Director, Corporate Services Group, during the period substantive occupant
Mick Banaszczyk was covering in the Strategic Business Innovation Group. Mick Banaszczyk retired on 10 December 2019, and Marka Haasnoot was appointed Executive Director Corporate Services on 8 April 2020.
(2) Mick Banaszczyk acted as the Executive Director, Strategic Business Innovation Group, during the period substantive occupant –Julie de Jong was on secondment 27 May – 29 November 2019.

12
Our Groups
Safety Regulation GroupSafety Regulation oversees the regulatory and
policy requirements of workers’ health and safety in the resources and general industries sectors, and
safety legislation for dangerous goods, including the State’s major hazard facilities, and petroleum operations.
Safety Regulation is also responsible for the coordination, governance, and consistent management of public sector
labour relations, and shapes and implements labour relations policy and legislative reform. It assists private sector employers
and employees in understanding and achieving compliance with Western Australian employment laws.
Safety Regulation plays a significant part in building and strengthening Western Australia’s economy, by ensuring that one of the State’s
most significant assets, its workforce, operates in a healthy and safe environment where worker’s rights are protected.
Resource and Environmental Regulation Group
Resource and Environmental Regulation is responsible for the regulation of one of Western Australia’s largest
industry sectors, playing a critical role in building the State’s economy and ensuring resources are developed in a
sustainable and responsible manner.
Resource and Environmental Regulation oversees the regulatory and policy requirements of the resources sector in all areas with
the exception of worker safety. This includes managing a system for mineral titles and approval of mining associated activities. This Group
also delivers the department’s geoscience functions, which provide geoscientific data to understand the States mineral and petroleum
resources, reduce risk for explorers and increase the attractiveness of Western Australia as a destination of choice for resource companies.
Corporate Services GroupCorporate Services offers specialist advice, effective
business systems and internal controls to assist the department in achieving its strategic and operational
objectives. This includes financial services, human resources, corporate information, facilities, ministerial
liaison and Office of the Director General.

13
Our Groups
Industry Regulation and Consumer Protection Group
Industry Regulation and Consumer Protection works towards ensuring that there is a fair trading environment
for Western Australian consumers and traders, and that building, plumbing, gas and electricity services are safe. This
Group ensures there is a fair, safe and equitable marketplace by applying the Australian Consumer Law and other trading
and occupational legislation, as well as setting and enforcing the licensing and technical safety requirements, standards and
legislation for the building, plumbing, gas and electrical industries.
Service Delivery GroupWorking collaboratively across the department,
Service Delivery maintains strong links with operational and industry areas, supplying and sharing relevant
knowledge and information. Service Delivery delivers a range of services on behalf of DMIRS including licensing
functions, legal services and customer information including communications. Service Delivery remains alert to opportunities
to improve and evolve service delivery methods that are efficient, effective and keep pace with the advancement of technology.
Strategic Business Innovation GroupStrategic Business Innovation supports the
department in building a high performance organisation and achieving its strategic and
operational objectives. It does this by focusing on whole-of-department strategic capability, fostering
innovative thinking, and maximising digital delivery. The Group is responsible for: creating vision and strategies;
leading whole-of-government regulatory reform; providing specialist advice to add value and improve the department’s
operations; controls; and risk management.

14
Connecting with stakeholders
DMIRSOUR PEOPLE
Non-government organisations,
including professional/industry
associations & dispute resolution
providersBusiness owners & industry
representative bodiesStatutory
authorities & bodies
Landowners & pastoralists
Consumers & representative
bodies
Traditional owners,
including native title
parties
Unions
Workers
Workplaces including
representative groups & international organisations
Research institutions,
universities & schools
Media
Federal and State Governments &
agencies
Public sector employees
Local Governments
Ministers

15
Strengthening relationships
Our people
Guided by our values of being respectful, responsive, forward thinking, transparent, fair and ethical our 1,648 employees are the department’s most valuable asset in delivering positive stakeholder connection.
Our people ‘lead with integrity, deliver on commitments, strive for excellence, and look for better ways of doing things’.
Ministers
Advising on operations and legislation, labour relations and providing recommendations for action on topics such as: ‣ the public sector response to the COVID-19 environment; ‣ domestic violence reform; and ‣ wage theft.
Federal and State Governments and agencies
Providing better services by addressing industry and market-wide challenges through cooperative action and joint legislative initiatives working collaboratively with agencies such as: ‣ National Transport Commission; ‣ Comcare; ‣ Health and Disability Services Complaints Office; ‣ Department of Water and Environmental Regulation; and ‣ Electrical Regulatory Authorities Council.
Local Governments
Enabling a two-way exchange of information, advice and cooperative action to support building and planning outcomes that benefit the Western Australian community on topics such as: ‣ asbestos removal through conducting presentations to local government authorities; and ‣ development of proposed regulatory reforms for swimming pool safety barriers.
WorkSafe Western Australia CommissionerProviding support to the independent statutory role of WorkSafe Western Australia Commissioner in the completion of a range of functions as prescribed in the Occupational Safety and Health Act 1984.
Public sector employees
Supporting and representing public sector employees to ensure coordination, good governance and management of public sector labour relations and wages policy by: ‣ performing functions outlined in Premier’s Circular 2017/03; ‣ negotiating industrial agreements under Public Sector Wages Policy; and ‣ providing employers with industrial relations advice and support.
Statutory authorities and bodies
Consulting with, and supporting, statutory authorities and bodies in the Minister’s portfolio in the discharging of their statutory role such as: ‣ engagement with UnionsWA on private sector industrial relations issues such as the two
COVID-19 General Orders in 2020 and the State Wage Case; and ‣ provided technical advice and assistance to the Economic Regulation Authority in
the performance of its functions. Similar arrangements are in place with the Energy Ombudsman.
Unions Working closely to support worker safety, understanding and working to resolve issues and concerns, and developing and negotiating industrial agreements.
Non-government organisations, including dispute resolution providers
Consulting to obtain feedback, staying informed and acknowledging joint issues and concerns. Where appropriate, acting jointly to deliver services, support compliance action and address regulatory issues with organisations such as: ‣ Commission for Occupational Safety and Health ‣ Motor Trade Association of WA; and ‣ Tenancy WA.
Consumers and representative bodies
Working with consumers and representative bodies to obtain an understanding of issues and concerns, and assist in the distribution of information to inform and protect consumers on topics such as: ‣ quad bike safety; ‣ gift card laws; ‣ rights when buying a pet; and ‣ tenant options for securing furniture.
Business and industry representative bodies
Working with individual businesses and representative bodies to support the fair and effective administration of laws and policies, and obtaining input to the development of those laws and policies such from the Small Business Development Corporation.
Workers Providing information, advice and conciliation and investigation actions to assist in the achievement of workers’ legal entitlements.

16
Strengthening relationships continued...
Stakeholder Description
Workplaces including representative groups and international organisations
Working closely to promote best practice in safety, environmental protection, heritage conservation and the resources sector demonstrated in our involvement with: ‣ public consultation for guidance material (eg. safety alerts and bulletins); ‣ Work Health and Safety Excellence Awards; and ‣ WorkSafe Plan process - auditors and assessors of safety and health management systems.
Traditional owners, including native title parties
Providing information, advice and mediation services to assist in achieving the best outcomes for all parties.For example, as part of the National Indigenous Consumer Strategy (NICS) the department took part in a working group; delivered a presentation to WA’s financial counsellors; and distributed hundreds of Do Not Knock stickers to regional and remote Aboriginal communities in WA. The department also collaborated with various Aboriginal networks, the Mulga Mail and Noongar Radio to disseminate information to Aboriginal consumers.
Landowners and pastoralists Seek understanding of issues and concerns, and providing feedback on how stakeholder input influences actions and decisions.
Media
Working with media outlets and representatives to distribute information about the department’s activities that are intended to inform, protect and support the community, consumers, businesses and industry.For example, our officers appeared on the ABC Perth Drive radio program each week and on 6PR Perth Live radio each fortnight. There were additional radio segments on smaller commercial and community radio stations across metropolitan Perth and regional WA, including Curtin FM and Noongar Radio, as issues arose such as raising community awareness of the dangers of carbon monoxide poisoning in the regions.
Research institutions, universities and schoolsEmbracing opportunities to support innovation and research into policy and operational issues by collaborating with institutions such as the UWA Business School on delivery of the strategic workplace relations unit. Providing employment and training opportunities.
16

17
629
630
52
174
404
286
189
South West
Goldfields - Esperance
Mid WestGascoyne
Pilbara
Kimberley
Peel
Great Southern
106
232
165
Wheatbelt
226
197
140
41
26
20409
232
117
376
187
288
276
436
4
Tom Price Newman
Carnarvon
Geraldton
Mt Magnet
Meekatharra
Cue
Wiluna
Warburton
LavertonLeonora
Menzies
Norseman
Esperance
Albany
Northam
Bunbury
Broome
Paraburdoo
PERTH
Onslow
Derby
Kununurra
Port Hedland
Marble Bar
Kalgoorlie-Boulder
Hopetoun
Ravensthorpe
Exmouth
Karratha
MargaretRiver
Collie
SouthernCross
3
Working together across WAOur offices are located around Western Australia for the convenience of our customers. One of our priorities in Towards 2024 is to develop strong community partnerships to improve customer satisfaction with our metropolitan, regional and remote services. To demonstrate the widespread provision of our services across the State, the number of visits(1) within the WA regions for Safety Regulation Group, Industry Regulation and Consumer Protection Group and Resource and Environmental Group is shown on the map below(2).
Legend
Safety Regulation GroupIndustry Regulation & Consumer Protection GroupResource and Environmental Regulation GroupRegional offices
100km 300 500400200
Notes(1) Visits include inspections, complaint investigations and audits conducted
in a regional post code by a DMIRS staff member.
(2) Excludes Labour Relations, mineral exploration and petroleum safety. Not all entries had suburb information available for Industry, Regulation and Safety Group. Visits where suburb information was not available were excluded.
18
Administered legislationArchitects Act 2004
Associations Incorporation Act 2015
Auction Sales Act 1973
Barrow Island Royalty Trust Account Act 1985
Barrow Island Royalty Variation Agreement Act 1985
British Imperial Oil Company, Limited (Private) Act 1925
Building Act 2011
Building Services (Complaint Resolution and Administration) Act 2011
Building Services (Registration) Act 2011
Building Services Levy Act 2011
Business Names (Commonwealth Powers) Act 2012
Business Names Act 1962
Charitable Collections Act 1946
Chattel Securities Act 1987
Churches of Christ, Scientist, Incorporation Act 1961
Coal Miners’ Welfare Act 1947
Commercial Tenancies (COVID-19 Response) Act 2020
Commercial Tenancy (Retail Shops) Agreements Act 1985
Competition Policy Reform (Taxing) Act 1996
Competition Policy Reform (Western Australia) Act 1996
Conspiracy and Protection of Property Act of 1900
Construction Contracts Act 2004
Construction Industry Portable Paid Long Service Leave Act 1985
Co-operatives Act 2009
Credit (Administration) Act 1984
Credit (Commonwealth Powers) (Transitional and Consequential Provisions) Act 2010
Credit (Commonwealth Powers) Act 2010
Credit Act 1984
Dangerous Goods Safety Act 2004
Debt Collectors Licensing Act 1964
Decimal Currency Act 1965
Disposal of Uncollected Goods Act 1970
Distress for Rent Abolition Act 1936
Dividing Fences Act 1961
Electricity Act 1945
Employment Agents Act 1976
Employment Dispute Resolution Act 2008
Energy Coordination Act 1994(1)
Energy Safety Act 2006
Energy Safety Levy Act 2006
Fair Trading Act 2010
Finance Brokers Control Act 1975
Fremantle Buffalo Club (Incorporated) Act 1964
Gas Standards Act 1972
Gas Supply (Gas Quality Specifications) Act 2009(2)
Growers Charge Act 1940
Hire-Purchase Act 1959
Home Building Contracts Act 1991
Industrial Relations Act 1979
Land Valuers Licensing Act 1978
Law Reform (Common Employment) Act 1951
Limited Partnerships Act 2016
Long Service Leave Act 1958
Metric Conversion Act 1972
Mines Safety and Inspection Act 1994
Minimum Conditions of Employment Act 1993
Mining (Validation and Amendment) Act 1986
Mining Act 1978
Mining On Private Property Act 1898
Mining Rehabilitation Fund Act 2012
Motor Vehicle Dealers Act 1973
Motor Vehicle Repairers Act 2003
New Tax System Price Exploitation Code (Taxing) Act 1999
New Tax System Price Exploitation Code (Western Australia) Act 1999
(1) Pt. 2 & 3 only; remainder of Act administered by the Minister for Energy principally assisted by Energy Policy WA(2 ) Pt. 5 Div. 2 only; remainder of Act administered by the Minister for Energy principally assisted by Energy Policy WA

19
Occupational Safety and Health Act 1984
Occupational Safety and Health (Validation) Act 1998
Offshore Minerals (Registration Fees) Act 2003
Offshore Minerals Act 2003
Offshore Minerals (Consequential Amendments) Act 2003
Offshore Petroleum (Royalty) Act 2006(3)
Offshore Petroleum and Greenhouse Gas Storage Act 2006(3)
Personal Property Securities (Commonwealth Laws) Act 2011
Petroleum (Submerged Lands) Act 1982
Petroleum (Submerged Lands) Registration Fees Act 1982
Petroleum Act 1936
Petroleum and Geothermal Energy Resources (Registration Fees) Act 1967
Petroleum and Geothermal Energy Resources Act 1967
Petroleum and Geothermal Energy Safety Levies Act 2011
Petroleum Pipelines Act 1969
Petroleum Products Pricing Act 1983
Petroleum Retailers Rights and Liabilities Act 1982
Petroleum Titles (Browse Basin) Act 2014
Plumbers Licensing Act 1995(4)
Public and Bank Holidays Act 1972
Real Estate and Business Agents Act 1978
Residential Parks (Long-Stay Tenants) Act 2006
Residential Tenancies (COVID-19 Response) Act 2020
Residential Tenancies Act 1987
Retail Trading Hours Act 1987
Retirement Villages Act 1992
Sale of Goods (Vienna Convention) Act 1986
Sale of Goods Act 1895
Settlement Agents Act 1981
Street Collections (Regulation) Act 1940
Sunday Entertainments Act 1979
Transfer of Incorporation (HBF and HIF) Act 2009
(3) Administered on behalf of the Commonwealth(4) Part 5A only, remainder of Act administered by the Minister for Water principally
assisted by the Department of Water and Environmental Regulation

20
Performance management frameworkWestern Australia’s public sector performance management framework is referred to as Outcome Based Management (OBM). Our OBM reflects the department’s contribution towards these government goals:
Better Places: A quality environment with liveable and affordable communities and vibrant regions
Strong Communities: Safe communities and supported families
And towards our purpose of: Supporting a safe, fair and responsible future for the Western Australian community, industry and resources sector.
Outcome Based Management structureThe following OBM Framework was endorsed by the Department of Treasury for the department’s budget reporting from 2018–19 and applied in 2019–20.
Government goals
Better Places Strong Communities
OutcomeSupporting a safe, fair and responsible future for the community, industry and resources sector.
Effectiveness ‣ Stakeholder satisfaction with the department as an effective resource sector regulator.
Effectiveness ‣ Number of work-related traumatic injury fatalities.
Effectiveness ‣ Stakeholder satisfaction with the department as an effective industry regulator.
ServicesResources Advice and Regulation ServiceEnsuring the State’s natural resources are developed and managed responsibly through the provision of resource advice and regulatory services to the Western Australian community.
Efficiency ‣ Average cost of resource regulation per live title.
Safety Advice and Regulation ServiceThe provision of advice and regulatory services to the Western Australian community in the area of occupational safety and health.
Cost effectiveness ‣ Cost of work-related lost time injury and disease claims in relation to cost of service.
Efficiency ‣ Percentage of high-risk work licence applications determined within agreed timeframes.
Industry Advice and Regulation ServiceThe provision of advice and regulatory services to the Western Australian community in the areas of consumer protection, building and plumbing, electricity and gas, and labour relations.
Efficiency ‣ Average cost per transaction to deliver industry advice and regulation services.
The OBM structure is designed to be outward-facing, reflecting information that is of value to the public. A single outcome was chosen to provide a shared focus for the department, and the three services are reflective of the department’s functions and substantially align to the department’s organisational structure. Each of the three effectiveness key performance indicators are aligned with one of three services, to ensure the effectiveness of our core business is measured against this one outcome statement. The delivery of our services are measured by three efficiency and one cost effectiveness indicator.
+

21
Shared responsibilities with other agenciesThe department contributed to the delivery of several whole-of-government and cross-agency initiatives - each of which had shared accountabilities for their successful implementation.
Resource Agreement – cross-agency initiatives
Initiative Working together with
Roadmap for Reform – Streamline WA initiativeOutcome: To make it easier to do business in Western Australia by improving all aspects of State regulation including legislation, culture, regulatory practice and administration.
Department of Planning, Lands and Heritage, Department of Water and Environmental Regulation, Department of Treasury and Department of Biodiversity, Conservation and Attractions
Engaged and collaborated: with government, private and community sectors to identify and progress reform initiatives related to improving the mining environmental approvals process, the establishment of tourism attractions and regulatory practice and culture.
Roadmap for Reform – Our Priorities: Sharing Prosperity
DMIRS was part of the cross-agency and portfolio collaboration in three of the six outcome areas of the Government’s Our Priority: Sharing Prosperity reform to deliver better social, economic and environmental outcomes for the State.
Outcome: contributed by providing support and leadership on the outcome activity groups.
The Premier announced on 26 March 2020 that this program would be put on hold indefinitely.
Department of Biodiversity, Conservation and Attractions (DBCA), Department of Training and Workforce Development (DTWD) and other State Government agencies
A liveable environment Collaborated: with DBCA on the 29 areas identified. Work will continue for at least the rest of 2020 on this programRegional prosperityProceeded: with our own program to increase regional employment through the establishment of a Regional Licence Processing Centre in Collie, which will create 10 new, permanent FTEs in Collie.A Strong Economy Participated: in the prioritisation of initiatives to support the creation of jobs and training places for Western Australia. This work is ongoing as part of COVID-19 recovery to facilitate job growth.
Roadmap for Reform – Functional Area Leadership
Outcome: Sector-wide leadership that drives coordination and collaboration for the functions of workplace safety, health and injury management.
Public Sector Commissioner, WorkCover WA, Insurance Commission of WA, Mental Health Commission and UnionsWA Progressed: with the formation of a Public Sector network. Information sessions have been conducted with further outputs being developed. It is planned that this network will play an instrumental role in the upcoming development of a code that will be applicable across many industries but of particular relevance to the Public Sector. Community of practice events were postponed due to COVID-19 however DMIRS has shared its OSH policies and procedures in relation to COVID-19 with PSC and other agencies.
Fatigue and Isolated Drivers in the Commercial Vehicle Sector
Outcome: A workplace operated in a safe and healthy manner.
WA Police and Main Roads WA Enabled: WorkSafe inspectors to carry out 336 inspections (target of 250 proactive stops). Enforcement rate was 22 per cent, with issue of 8 improvement notices, and 74 verbal directions.
Cross matching tenant bond data
Outcome: Improved level of compliance with the Residential Tenancies Act 1987 and improvements in the repayments of bonds loans given to tenants.
Department of Communities (Housing) Conducted: significant education and enforcement action, including numerous infringement notices and a prosecution to date.
Facilitated: bond assistance loans to the value of $301,664.56 lodged with the Bond Administrator as a result of this project.
Identified: additional tenancy bonds that had not been lodged for unrelated properties and a further $186,976.00 in bonds were secured with the Bond Administrator.
DMIRSA futher
$186, 976.00 in bonds
were secured
HOUSING

22
Working together across the Western Australian public serviceAs a continued priority for the department DMIRS has focused throughout the year on cross-agency projects to improve collaboration and deliver better outcomes, through the sharing of knowledge and expertise.
Cross-agency intiatives across the WA Public Service continued...
Initiative Working together with
Premier’s focus areas for COVID-19 response and recoveryOutcome: Preparing for Western Australia’s economic and social recovery.
State Emergency Controller, State Recovery Controller, and Government agencies
Participated: on the State Emergency Coordination Group and the Public Sector Leadership Council in delivering the WA Recovery Plan 2020.
Prepared the Commercial Tenancies (COVID-19) Act 2020; and WA Code of Conduct. Outcome: to ban evictions for commercial tenants during the pandemic and assist commercial tenants and their landlords in their negotiations.
Small Business Development Corporation
Developed: the WA Code of Conduct, an information and education strategy, including dedicated webpages and informational videos, to increase the awareness of the new legislation and code for small business.
State-wide cladding auditOutcome: to assist relevant WA public sector agencies to scope audits of their respective public buildings for identification of combustible cladding.
Several State Government departments, agencies and public universities including the Department of Health, Department of Justice, Curtin University of Technology and VenuesWest
Reviewed: a total of 1,914 publicly owned buildings, with 27 buildings identified as requiring some form of remedial action. We continue to monitor and report on the progress of remediation work on the buildings identified.
Collaborated on bush-fire policy reformOutcome: to implement reforms for bush-fire policy within Western Australia by introducing more nuance and taking a more holistic approach to the designation of bushfire prone areas and the extent of the potential impact on communities.
Department of Planning, Lands and Heritage and Department of Fire and Emergency ServicesImplemented: recommendations from the ‘Bushfire Planning and Policy Review: A Review into the Western Australian Framework for Planning and Development in Bushfire Prone Areas’ and provide DPLH ongoing input to the State’s evidence to the Royal Commission into National Natural Disaster Arrangements.
Investigation into individual claiming to hold a formal psychology qualification and 10 years’ experience.Outcome: reduce the risk to the public of fraudulent behaviour.
WA Police (WAPOL)Conducted: investigation into the individual for making false or misleading statements and public naming by DMIRS. Following the public warning, WAPOL charged the individual with fraud and using evidence acquired by DMIRS gained a successful prosecution outcome including redress for the victim.
Electrical and gas safety inspections of shacks located at Wedge IslandOutcome: to ensure that all properties with stand-alone electricity (exceeding 50 volts ac or 120 volts dc) or gas installations were in a safe condition and met the minimum safety standards of the relevant regulations.
Department of Biodiversity, Conservation and Attractions (DBCA)Conducted: electrical and gas safety inspections of over 120 shacks located at Wedge Island.
DMIRS
Electrical and gas
safety inspections conducted on 120 shacks at Wedge
Island
DBCA

23
Cross-agency intiatives across the WA Public Service continued...
Initiative Working together with
Plan for Our ParksOutcome: to boost Aboriginal jobs, biodiversity, conservation and nature-based and cultural tourism.
Department of Biodiversity, Conservation and Attractions,Department of Premier and Cabinet, Department of Planning, Lands and Heritage, Department of Primary Industries and Regional Development, State Solicitors Office, and Department of TreasuryCreated: five million hectares of new national and marine parks.
Developed and reviewed Administrative AgreementsOutcome: improved interactions between the agencies in relation to mining and petroleum exploration and development activies and public reserves, native flora, fauna and ecological communities.
Department of Biodiversity, Conservation and Attractions (DBCA) and Department of Water and Environmental Regulation (DWER)Under development: an administrative agreement with DBCA. Reviewed: administrative agreements with the DWER.
Abandoned Mines ProgramOutcome: to enable relevant WA public sector agencies to undertake their activities safely
DBCA, Department of Planning, Lands and Heritage (DPLH) and State Solicitors OfficeRemediated: abandoned mines shafts located at Donnybrook and Northampton to enable DBCA and DPLH to undertake activies safely.
Delivered the South West Native Title Settlement Agreement and the Yamatji Nation Southern Regional AgreementOutcome: to provide significant economic and social benefits to the Noongar and Yamatji people.
Department of Planning, Lands and Heritage, State Solicitors Office and Department of the Premier and CabinetAssembled: the land package commitments by Government for the purpose of registration of the Indigenous Land Use Agreements.
Enforced compliance with Part 7 of the Children and Community Services Act (the Act).Outcome: to ensure that children under 15 years of age are only engaged to perform work in accordance with Part 7 of the Act
Department of CommunitiesResulted: in no significant investigations undertaken during the financial year.
Developed the Western Australia Cyclone Preparedness Guide, to inform property owners about tropical cyclones and their effect on buildings.Outcome: to provide recommendations about steps which property owners can undertake before the cyclone season to minimise damage to their property from severe winds and rain during a cyclone.
Department of Fire and Emergency Services and Geoscience AustraliaDeveloped: a guide for property owners.
Plan for our parks 5 million hectares
of new national and marine parks
DMIRS
DBCA
SSO
HOUSING
DPIRD
Treasury
DPC

24
Government of Western AustraliaDepartment of Mines, Industry Regulation and Safety

25
PERFORMANCE

26
Snapshot of our performance
Inputs
$171,480,000(3)
Salary expensesTarget $152,572,000 Variation $18,908,000
$286,405,000 Cost of services
(total)(1)
Target $279,716,000 Variation $6,689,000(2)
1,426 Full time equivalent
employees $490,194,000Total equity
Target $473,731,000 Variation $16,463,000
$1,876,000(3)
Agreed working cash limit Target $13,543,000
q Variation ($11,667,000)
Our business
$9.3 billion record (cash) royalty
receipts
Processed 5,609 ministerials
$711,766 recovered in unpaid wages and
other entitlements for employees
23 public sector industrial agreements
successfully negotiated for 40,655 employees
18,495 subscribers to online safety
newsletters
$6,393,930 total redress achieved for
WA consumers
Staff in Albany, Bunbury, Geraldton,
Kalgoorlie and Broome handled 2,432 counter enquiries, 1,312 emails
and 2,367 telephone calls
5,685 building, painting, plumbing,
electrical and gas inspections
conducted
Notes:(1) Net cost of services – Actual $113,600,000, Target $104,510,000 and Variation ($9,090,000).(2) For explanation of variance between Actual and Target refer to note 8.12 of the Financial Statements.(3) Working cash actuals are reflected in the department’s balance sheet, for explanation of variance refer to note 8.12
of the Financial Statements.

27
Snapshot of our performance
Snapshot of performance:
regulatory practice and reform
Finalised over 117,000 licence applications.
81% were finalised with in agreed time frames
Work Health and Safety Bill 2019 introduced to
WA Parliament
The Ticket Scalping Bill 2018 was
consided by the Standing Committee on Legislation which
reported in September 2019
WA Parliament passes laws to protect children from toppling
furniture
Over 4,000 employees have accessed the WA long service leave
calculator launched in May 2020
Completed audit of privately-owned
buildings with combustible cladding
Accessible guidance on Reporting
wage theft was developed to provide assistance
to employees to resolve underpayment and unpaid
leave, to report these occurrences anonymously
and seek help
There was a significant decrease in late royalty payments due to strict compliance measures resulting in an
additional $280 million being collected during 2019–20
23 late royalty payments q 56% from 30 June 2019
Snapshot of performance: customer
centric service
An accessible campaign “Your house, My home” was run to promote the review period of the Residential Tenancies Act 1987. 245 consultation submissions
were received by members of the community
Launched an online hub with information to protect and
promote positive mentally healthy workplaces for managers and
workers including a self-audit tool and technical guide.
Reviewed how we produced some licensing cards resulting in a
reduction from $10–$15 to $2
per card
Released an online resource to
assist workplaces to understand how human and organisational factors can affect how safely workers are able to do their jobs

28
Performance measures - snapshotThe department measures its performance through key performance indicators within our approved performance management framework. These KPIs assist in assessing achievement of outcomes and efficiency of services. The stakeholder satisfaction was planned to be conducted for the second year, with the main purpose of the survey to ascertain the overall level of satisfaction with the department as an effective regulator in the resource and industry sectors. However, due to the COVID-19 emergency it was not considered appropriate to conduct the survey during a period when many of the department’s stakeholders were being adversely impacted by trading and social restrictions. An exemption from reporting the results of KPI 1 and 3 was approved by the Under Treasurer.
KPI results have been summarised below, and for further information refer to the KPI Report on page 77 – 85.
15Work-related traumatic
injury fatalities
Target 0
$4,340Average cost of resource
regulation per live title
q Target $4,768
10.49:1Ratio of work related lost time injury and disease
claims to cost of service (1)
q 8% lower than Target 11.38:1
83%High risk work licence
applications determined within 14 days
q Target 100%
$206Average cost per transaction
to deliver Industry Advice and Regulation Service
Target $153 (2)
Notes:(1) The cost of Safety Advice and Regulation Service. (2) The target for this KPI was based on a methodology which has since been refined, so the result is not comparable to the target.
Key
Performance indicator results are assessed in relation to a set target. The result is indicated by the colour of the hexagon and the direction of the arrow:
Did not meet target
Exceeded target
or q indicates direction of variance
met target (variance ± 5%)
29
Case study
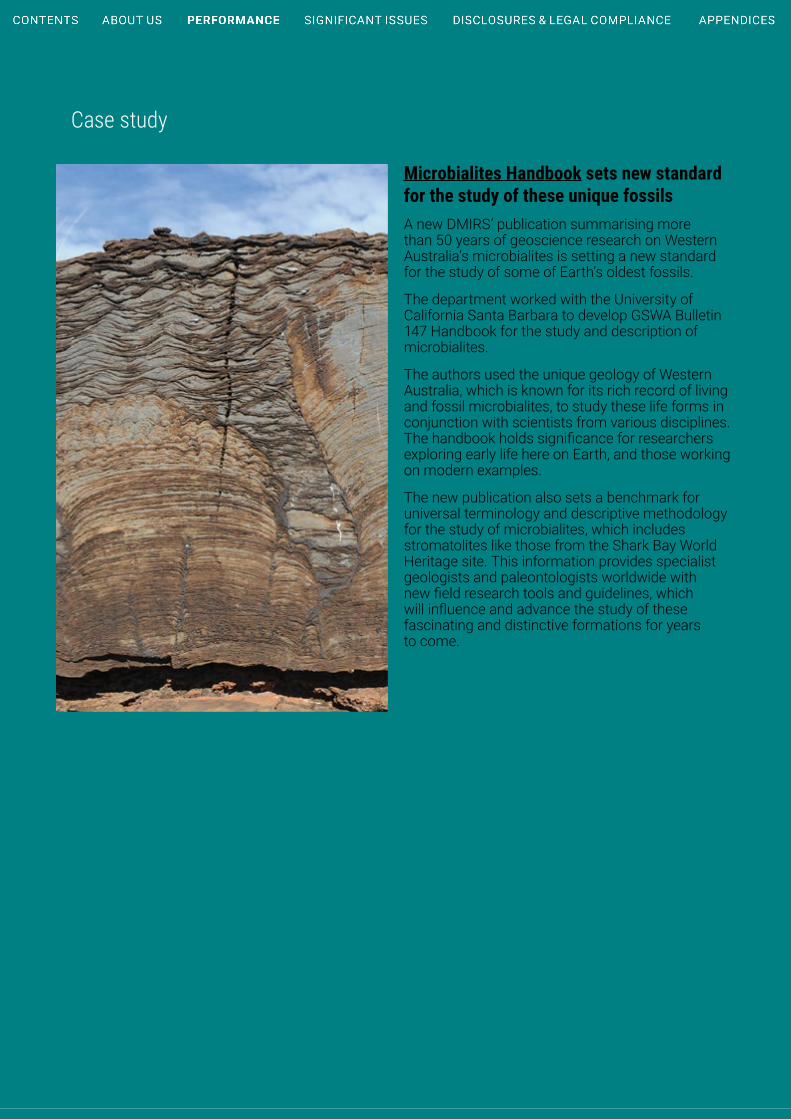
Microbialites Handbook sets new standard for the study of these unique fossilsA new DMIRS’ publication summarising more than 50 years of geoscience research on Western Australia’s microbialites is setting a new standard for the study of some of Earth’s oldest fossils.
The department worked with the University of California Santa Barbara to develop GSWA Bulletin 147 Handbook for the study and description of microbialites.
The authors used the unique geology of Western Australia, which is known for its rich record of living and fossil microbialites, to study these life forms in conjunction with scientists from various disciplines. The handbook holds significance for researchers exploring early life here on Earth, and those working on modern examples.
The new publication also sets a benchmark for universal terminology and descriptive methodology for the study of microbialites, which includes stromatolites like those from the Shark Bay World Heritage site. This information provides specialist geologists and paleontologists worldwide with new field research tools and guidelines, which will influence and advance the study of these fascinating and distinctive formations for years to come.
30
Case study
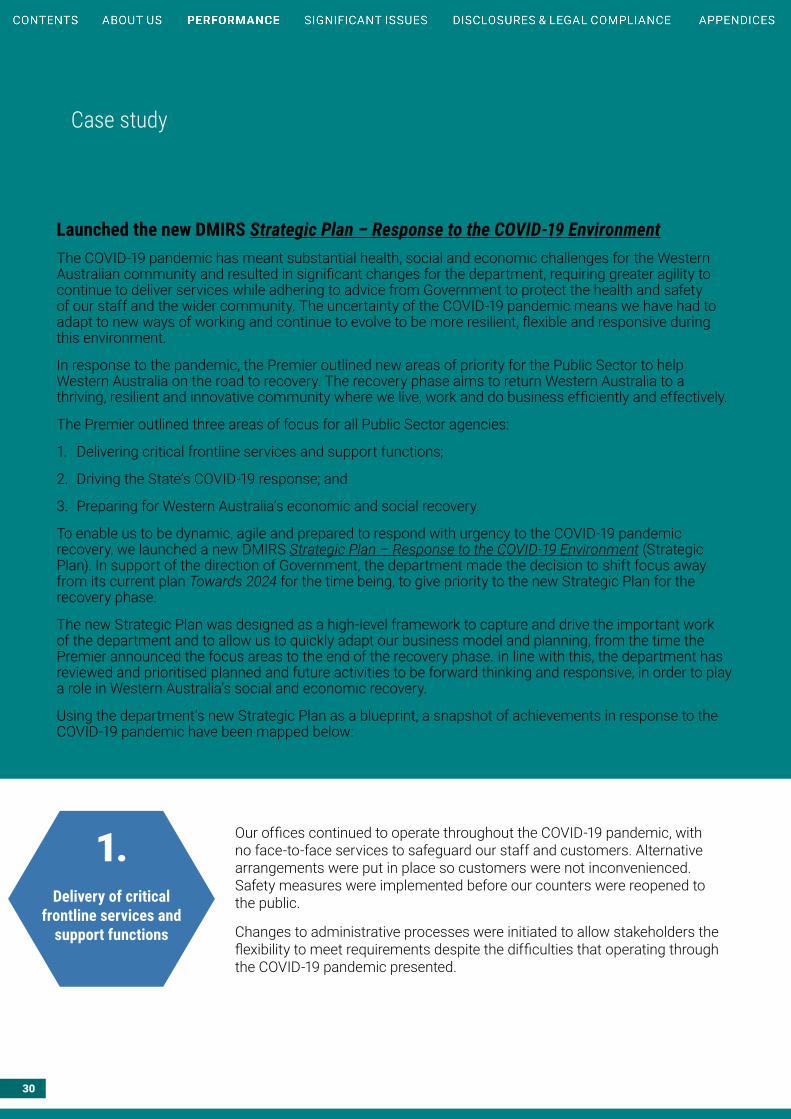
Response to the COVID-19 pandemicLaunched the new DMIRS Strategic Plan – Response to the COVID-19 EnvironmentThe COVID-19 pandemic has meant substantial health, social and economic challenges for the Western Australian community and resulted in significant changes for the department, requiring greater agility to continue to deliver services while adhering to advice from Government to protect the health and safety of our staff and the wider community. The uncertainty of the COVID-19 pandemic means we have had to adapt to new ways of working and continue to evolve to be more resilient, flexible and responsive during this environment.
In response to the pandemic, the Premier outlined new areas of priority for the Public Sector to help Western Australia on the road to recovery. The recovery phase aims to return Western Australia to a thriving, resilient and innovative community where we live, work and do business efficiently and effectively.
The Premier outlined three areas of focus for all Public Sector agencies:
1. Delivering critical frontline services and support functions;
2. Driving the State’s COVID-19 response; and
3. Preparing for Western Australia’s economic and social recovery.
To enable us to be dynamic, agile and prepared to respond with urgency to the COVID-19 pandemic recovery, we launched a new DMIRS Strategic Plan – Response to the COVID-19 Environment (Strategic Plan). In support of the direction of Government, the department made the decision to shift focus away from its current plan Towards 2024 for the time being, to give priority to the new Strategic Plan for the recovery phase.
The new Strategic Plan was designed as a high-level framework to capture and drive the important work of the department and to allow us to quickly adapt our business model and planning, from the time the Premier announced the focus areas to the end of the recovery phase. In line with this, the department has reviewed and prioritised planned and future activities to be forward thinking and responsive, in order to play a role in Western Australia’s social and economic recovery.
Using the department’s new Strategic Plan as a blueprint, a snapshot of achievements in response to the COVID-19 pandemic have been mapped below:
1.Delivery of critical
frontline services and support functions
Our offices continued to operate throughout the COVID-19 pandemic, with no face-to-face services to safeguard our staff and customers. Alternative arrangements were put in place so customers were not inconvenienced. Safety measures were implemented before our counters were reopened to the public.
Changes to administrative processes were initiated to allow stakeholders the flexibility to meet requirements despite the difficulties that operating through the COVID-19 pandemic presented.

31
2. Driving the State’s
COVID-19 response
‣ Adapting our business model by implementing measures to protect employee safety and health and the wider community.
‣ We are continuing to strengthen collaboration with other agencies with the development of two new General Orders (refer page 35) and a new form of COVID-19 leave (refer page 44).
‣ Chaired a National COVID-19 Urgent Response Group (refer page 48). ‣ Supporting Government relief measures such as the response to residential
and commercial tenancies (refer page 37), administered residential rent relief grants (refer page 40) and mandatory conciliation for residential tenancies (refer page 40).
‣ Implementing Government’s COVID-19 initiative to provide 12 months of relief from business and licensing fees for small and medium-sized businesses.
‣ Produced guidance on the safe use of electrical and gas equipment when working from home.
‣ Adopted various temporary measures relating to applications for suspension and extensions to work commitments required on petroleum titles.
‣ Took a supportive and educational approach to enforcing compliance. ‣ Prepared the Commercial Tenancies (COVID-19 Response) Act 2020 and
Residential Tenancies (COVID-19 Response) Act 2020 (refer page 37). ‣ Since January 2020, the WorkSafe and Mines Safety Directorates have
collectively received over 800 COVID-19 related enquiries. ‣ Responding to an increase of 18 per cent of the number of consumer
complaints (refer page 49). ‣ Extending provisions and granting exemptions to assist incorporated
associations and co-operatives (refer page 48).
3. Preparing for Western Australia’s economic and
social recovery
‣ Tenement holders can apply for COVID-19 expenditure exemptions as part of the financial relief measures (refer page 49).
‣ Reviewed the safe operations of companies manufacturing hand sanitisers and highly flammable goods (refer page 34).
‣ Amendments to 22 sets of regulations across DMIRS are being drafted. The amendments are expected to be in place from early October 2020 to allow for the 12 month discount and for proportionate refunds, where fees have already been paid during the 12 month period.
‣ Accelerate exploration investment in the resources sector – additional investment to the Exploration Incentive Scheme to boost exploration opportunities and provide next generation geoscience information for Western Australia’s resources sector.
‣ Other strategic measures to facilitate the long term recovery of the resources sector and the Western Australian economy (refer page 49).

32
Our key achievements
Regulator: The following are key indicators of our success as a regulator:
Regulated entities know
and comply with the rules.
Individuals and businesses
have the confidence to operate
in WA.Better
regulatory outcomes at a
lower cost to the community.
Public confidence is
high in our areas of responsibility.
Work Health and Safety BillDuring 2019–20 progress was made in relation to the adoption of the national model Work Health and Safety (WHS) laws in Western Australia, with the State Government introducing its Work Health and Safety Bill 2019 (WHS Bill) to the Parliament in November 2019.
The Government’s intention is for the WHS Bill to provide a comprehensive and modernised structure for the administration of WHS laws in Western Australia. The underlying duty of care principles in the WHS Bill are consistent with existing occupational safety and health laws.
DMIRS supported the extensive consultation process to develop the WHS Bill. The consultation involved the Ministerial Advisory Panel for Workplace Safety Reform and its tripartite stakeholder representation and public consultation and information sessions. DMIRS officers have continued to provide extensive resources to the Government in refining the WHS Bill during the Parliamentary process.
Community consultation to support the Government develop its proposals for the Western Australia WHS regulations also required considerable DMIRS resources and expertise. To facilitate the three month community consultation process which ended in November 2019, DMIRS developed a consultation package and provided a number of community forums around regional Western Australia and the Perth metropolitan area. The package and forums provided information about the consultation process and encouraged stakeholders to make submissions.
The three sets of regulations proposed in the consultation package apply to workplaces generally in Western Australia, the mines sector, and the petroleum and geothermal energy sector.
The Minister for Mines and Petroleum; Energy; Industrial Relations is now considering the submissions recieved from stakeholders.
69submissions from
stakeholders in response to the
consultation process.

33
Release of new statutory guidelines for mining proposals and mine closure plans New Statutory Guidelines for mining proposals and mine closure plans form part of the Government’s broader range of reform initiatives to improve the approvals process for mining environmental approvals. The department reviewed the mandatory requirements for mining proposals and mine closure plans in response to industry feedback. The information from the existing Mining Proposal Guidelines (2016), Mine Closure Plan Guidelines (2015) and Small Operations Mining Proposal and Mine Closure Plan Pro Forma was restructured into the Statutory Guidelines and supporting guidance material so that each document in the package has a clear purpose and intent of how it is considered in the regulatory process.
The revised statutory guidelines prepared by the department took effect from Tuesday 3 March 2020 and are supported by an Environmental Objectives Policy and two guidance documents that provide further information on how to prepare a mining proposal and mine closure plan.
Parliament passes laws to protect children from toppling furniture In March 2020, laws to allow renters to fix furniture to walls to prevent death or injury to children from toppling furniture passed through State Parliament.
The Consumer Protection Legislation Amendment Act 2019 amends the Residential Tenancies Act 1987 and means landlords must allow tenants who submit a request, to attach furniture to a wall to prevent a child, or a person with a disability, from being hurt or killed.These important changes come after the tragic death of 21-month-old Reef Kite who was killed by a falling chest of drawers at his family’s rental home in 2015. An inquest heard the furniture had not been secured to the wall because permission was not granted.
Amending tenancy law, in light of Reef’s preventable death, was a recommendation of the Western Australian Coroner’s report, delivered in November 2017.
“As well as the tragic death of Reef Kite in a rental home, toppling furniture has resulted in the deaths of at least 22 young children across Australia since 2001. I’m pleased the McGowan Government has been able to get these common-sense changes through Parliament to prevent injury and death in WA rental homes in future,” the Hon. John Quigley MLA, Minister for Commerce stated.
The Act also makes a series of amendments to improve the administration of a range of occupational licensing schemes. These changes will assist real estate and settlement agents to better understand their obligations and manage their licensing applications online, as well as giving consumers improved access to property industry insurance and compensation schemes.
Minister Quigley with Dee Quartermaine, whose nephew Reef Kite was killed by a chest of drawers falling on him at a rental home in Yokine in 2015
34
Completion of Beldon electrical accident investigation DMIRS concluded its investigation into the electrical accident that seriously injured a 12-year-old girl at a Beldon property in March 2018 and publicly released its report detailing the findings on 27 September 2019.
The report found that:
‣ the accident resulted from the failure of a neutral conductor that formed part of the aerial service cable which supplies electricity to the property;
‣ the ‘open circuit neutral’ fault occurred inside the mains connection box (MCB) attached to the roof of the property;
‣ the failure of the neutral conductor caused metallic parts connected to the electrical earthing system at the property, including the garden tap, to become electrically live, up to 230 volts; and
‣ the neutral conductor of the aerial service cable failed after it was subjected to prolonged heating.
Due to the damaged condition of the MCB, the investigation could not determine the exact cause of the heating and whether it started on the aerial service side or the consumer side of the MCB.
The release of the report received significant media coverage. Consumers were reminded about the importance of reporting electric shocks promptly to the network operators. Following the recommendations from the Director of Energy Safety, the Government approved a broader media campaign to urge consumers to report electric shocks (refer shocks and tingles campaign page 36).
Hand sanitisers and flammable goods During the COVID-19 pandemic, hand sanitisers were initially in short supply and businesses, such as breweries, distilleries and cleaning product manufacturers assisted by manufacturing sanitiser products.
Our DMIRS Dangerous Goods inspectors reviewed the safe operations of companies manufacturing these highly flammable goods.
As a result, business received guidance about safe flammable liquids handling which led to an increased understanding of hazardous atmospheres and flammability, building design and electrics necessary for the production of flammable liquids, and compliant packaging and labelling. Consumers were also alerted via the media about the safety hazards of alcohol-based hand sanitiser. Other state and federal safety regulators took similar actions.
State wide cladding auditThis year, we completed our audit of privately-owned buildings with combustible cladding. The audit was in response to the Grenfell Tower fire in London in June 2017 and an earlier fire in 2014 at the Lacrosse building in Melbourne.
The audit covered all Building Code of Australia Class 2, 3, 4 and 9 buildings over two-storeys, built or refurbished after 1 January 2001. These classes of buildings are considered high-risk as they typically include places; where people sleep (apartments, hotels and caretaker accommodation); that house vulnerable occupants (hospitals, nursing homes and child-care centres); or cater for high-occupancy events (entertainment venues and public buildings).
Of the 1,795 private buildings that were initially identified, only 52 required remedial work and these had been referred to the relevant local government permit authorities for enforcement actions. Owners of affected buildings were kept informed of the audit findings and we are continuing to work with local government permit authorities to monitor the progress of remediation work.
DMIRS also assisted State government departments, agencies and public universities with the coordination of assessing and responding to buildings with a combustible façade.

35
Case study
Proactive dangerous goods waste inspections and collaborationThe chemical waste disposal industry presents a range of challenges and came into the spotlight after the discovery of illegally stored chemical waste following a massive industrial fire at a Melbourne warehouse in 2018.
Collaboration with other State Government agencies led to a proactive inspection campaign to improve compliance with dangerous goods waste safety requirements. Joint agency inspections, enforcement actions and the development and review of guidance material raised awareness of dangerous waste safety issues. Key waste industry stakeholders increased their operational knowledge about safe dangerous goods management by attending DMIRS information sessions.
Compliance actions included multiple directions, remediation actions and the issue of infringement notices totalling $15,000. Findings included a lack of dangerous goods awareness, dangerous goods receptacles in poor condition, and unsafe decanting and transfer of dangerous goods and flammable liquids.
A number of hazards can be identified from the two images, including inadequate packaging of corrosives and flammable liquids co-located with ignition sources
General Orders assist private employment in the Western Australian system DMIRS’ worked collaboratively with UnionsWA and the Chamber of Commerce and Industry WA to develop two new General Orders.
These new General Orders, issued by the Western Australian Industrial Relations Commission, implemented additional provisions on a temporary basis to assist State system private sector employers and employees with employment issues relating to the COVID-19 pandemic.

36
Campaigns to create safety awareness around electricity and gasThe department conducted two major safety awareness campaigns to raise public awareness about electrical and gas safety.
Shocks and tingles campaign
The department joined forces with Western Australia’s two public electricity network operators, Western Power and Horizon Power, to launch a public campaign in January 2020 with the key message to encourage consumers to promptly report shocks, however minor, to their network operator. Any metallic surface, not just taps supplied from copper piping, bonded to the earthing system of an installation presents a shock hazard if the electricity supply neutral has a high resistance or is broken. Minor shocks and tingles from touching taps and appliances can be an early indicator of problems with the neutral and, if addressed early, could eliminate potentially fatal outcomes at a later date.
The campaign was conducted using various media including television commercials, billboards and digital and social media. The campaign was successful in gaining a high level of public interest and engagement.
Carbon monoxide safety campaign
This campaign was aimed at educating the public on the dangers of carbon monoxide (CO). While CO cannot be seen or smelt, all gas heaters can spill CO, a gas that can make a person seriously sick or cause a fatality. Leading into the winter months and as part of the CO Awareness Week (27 April to 3 May) the department conducted a campaign to highlight the risks with gas appliances that are not well maintained or not located in a room with adequate ventilation. The campaign promoted the message that all gas appliances should be checked and serviced by a licensed gas fitter or service agent at least every two years and if the appliance was more than 10 years old, it should be checked annually.
This campaign was conducted as a social media campaign through the Consumer Protection social media page. There were also interviews on ABC Radio and Noongar radio to engage with regional consumers.
Compliance with bushfire building requirementsIn December 2015, significant bushfire planning and building reforms were introduced in Western Australia to address recommendations made by Mr Mick Keelty AO APM in his report of the inquiry into the Perth Hills bushfire of February 2011 that destroyed 71 homes and damaged a further 39.
The state-wide designation of bushfire prone areas introduced as part of these reforms, increased the number of dwellings required to comply with the bushfire construction requirements of the Building Code of Australia. For some parts of WA’s building and construction industry, this may have been the first time they had been exposed to the bushfire construction requirements.
We have been monitoring how well the bushfire building standards and regulatory requirements introduced as part the reforms were being applied. The objective of its general inspection was to determine how well new residential buildings (dwellings) in designated bushfire prone areas were complying with the bushfire building requirements.
In March 2020, DMIRS released a report, General Inspection Report Three: Bush fire building requirements in Western Australia, which details its findings. It is continuing to monitor compliance with the bushfire building requirements through its regular inspections and audits. We are also working closely with the Department of Planning, Lands and Heritage and the Department of Fire and Emergency Services to improve the State Government’s bushfire policy framework as part of the Bushfire Framework Review 2019.

37
Ground control guidance supports Western Australian mining operationsThe culmination of 10 years’ research, industry input, public feedback and comment from other regulators resulted in the publishing of a useful code of practice and guideline to improve the safety of mining in Western Australia.
The Ground control for Western Australian mining operations code of practice (code) outlines the regulatory expectations for minimising workforce exposure to hazardous ground movements.
The principles described in the code applies to all mines (e.g. sand mines, rock quarries, open pits, underground) as defined in section 4(1) of the Mines Safety and Inspection Act 1994 (MSI Act).
The Ground control management in Western Australian mining operations guideline (guideline) is structured to support a risk management approach for geotechnical hazards in accordance with the MSI Act and regulations.
The code will assist mine operators when considering geotechnical aspects in the safe design, construction, operation and closure of the mine workings for which they are responsible. Unsafe outcomes from unplanned ground control can cause injury or death, as falling loose rock, wall failure and cave-ins can strike, engulf or trap workers.
Ineffective ground control can also impact a mine’s economic viability by damaging infrastructure, creating cost over runs and causing the dilution or loss of ore.
The code and guideline reflect DMIRS’ ongoing commitment to working with industry and community to improve mine safety knowledge.
Andrew Chaplyn, Director, Mines Safety advised,
“The safety and health of mine workers continues to be a priority for DMIRS, and the ground control code and guideline build upon our recent initiatives such as FIFO mental health and diesel emissions.”
Case study
Response to COVID-19 – residential and commercial tenanciesIn response to the recommendations of the National Cabinet to ban evictions for residential and commercial tenants during the COVID-19 pandemic, in April 2020 the Residential Tenancies (COVID-19 Response) Act 2020 and the Commercial Tenancies (COVID-19 Response) Act 2020 were urgently prepared to implement measures to assist tenants and landlords.
The Residential Tenancies (COVID-19 Response) Act 2020 introduced:
‣ a moratorium on eviction for six months except in limited circumstances; ‣ a prohibition on rent increases during the emergency period; ‣ that any fixed term tenancy agreement due to expire during the emergency period will continue as a
periodic agreement; ‣ relieving lessors of the obligation to conduct ordinary repairs if the reason they cannot do so is
COVID-19 related financial hardship or a lawful restriction on movement; and ‣ enabling a tenant to end a fixed term tenancy prior to its end date without incurring break lease fees.
While tenants were unable to be evicted, they were required to pay rent or come to a negotiated arrangement with their landlord to either defer, make part payments or, if possible, have rent waived. The laws apply equally to tenants in public and private housing, park homes as well as boarders and lodgers.
A WA code of conduct was also implemented to guide commercial tenants and landlords in their negotiations – based on leasing principles of a national code. Each of the new laws provided for mandatory dispute resolution schemes to resolve disputes where agreements could not be reached.
Refer to page 40 for further information on rent relief and mandatory conciliation for residential tenancies.

38
:Service provider The following are key indicators of our success as a service provider:
We know and monitor our
costs and keep them moderate.
Customers have fewer
touchpoints when doing business
with us. Customers and staff find it easier to do
business.
Customers are satisifed with their treatment.
Bonds AdministrationAll residential tenancy bonds relating to Western Australian tenancies and some for tenants living in residential parks must be lodged with the Bond Administrator.
Our department regularly reviews the process for managing residential tenancy bonds and the associated IT systems that support that process. This is to ensure the user experience is enhanced by minimising transactional costs and improving the department’s interaction with landlords, tenants and real estate agents.
Bond Administrator
holding
235,559 bonds with a total
value of
$374,301,203.59 as at 30 June 2020
Agent to Agent project
There have been a range of enhancements but notably in October 2019, changes were deployed which enable licensed agents to transfer bonds completely online and with minimal administrative requirements when management of a rental premises changes.
These changes have reduced processing time and provide an online option for real estate agents.
62%of variations to bonds lodged electronically
Bond Assistance Loans The Department of Communities – Housing Division (Housing Authority) provides approximately $5,000,000 in bond assistance loans (BAL) to eligible tenants annually, to assist in securing tenancies in the private rental market. A review of data held by the Bond Administrator suggested that 10-20% of these bonds are not lodged as required.
The department has been working together with the Housing Authority, to cross match tenant bond data and identify any BAL paid to landlords which were not subsequently lodged with the Bond Administrator.
During 2019–20, 713 enquiries were made into BAL payments, with $262,004.55 subsequently lodged with the Bond Administrator. A number of Landlords identified through the BAL program were also found to be holding additional non-Housing Authority bonds resulting in an additional $186,976.00 in bonds also being lodged with the Bond Administrator.

39
Whole-of-state Generation-2 gravity coverageWith support from Geoscience Australia through a National Collaboration Framework Agreement, in 2005 the former Department of Mines and Petroleum embarked on a systematic program of ‘second-generation’, regional, helicopter-assisted ground gravity surveys at a station spacing of 2.5 km — a 16-fold improvement of resolution over the first-generation Bureau of Mineral Resources data. In the second half of 2019, the department released the airborne gravity of the Pilbara covering 170,000 km2. This represented the final piece of the Generation-2 gravity program for the State.
Second generation gravity map of Western Australia with the inset showing the area where ground-based and airborne acquisition occurred.
Mineral systems on the margins of cratons: Albany–Fraser Orogen/Eucla basement Minerals Research Institute of Western Australia’s (MRIWA) project M0470 was a three year (2017–2020) collaborative project with DMIRS and Curtin University, and was performed and delivered through the completion of three PhD projects.
The project was designed to further enhance and understand the mineral prospectivity of the Albany–Fraser region in the remote, and underexplored southern part of Western Australia.
Through innovative geochemical and isotopic analysis, the researchers have established that the high-grade metamorphic rocks of the Albany–Fraser region share an early history of geological development and mineralisation with the adjacent Yilgarn Craton. Distinctive patterns of sulfur isotopes preserve a record of the evolution and migration of multiple generations of ore fluids.
These insights help to define areas of the Albany–Fraser region that may be more prospective for gold and nickel mineralisation, as well as reducing exploration risk and encouraging investment in this under-explored area of Western Australia.
The results of this study were published as three PhD theses as well as a co-branded MRIWA–DMIRS report, the first of its kind, highlighting the benefits collaborative research.
The project has generated further exploration interest in the region, as well as a new MRIWA–DMIRS–Curtin research project ‘M0470a A multi-scale approach to mineralisation in the Fraser Zone, Western Australia’.

40
Rent reliefThe State Government made $30 million available for Western Australian private residential tenants who lost their jobs and faced financial hardship due to the COVID-19 pandemic on or after 20 March 2020. The Residential Rent Relief Grant Scheme provided grants equivalent to four weeks’ rent up to a maximum of $2000 that was paid direct to landlords to assist tenants who were struggling to pay their rent after losing their jobs due to COVID-19.
Reacting quickly and positively, staff had seven days to develop a new online cloud-based, secure system from scratch that would be able to cope with unknown but suspected high volumes of applications.
The Residential Tenancies (COVID-19 Response) Act 2020 was not intended to relieve tenants of the obligation to pay rent. Rather it was a recognition that in the circumstances some tenants invariably faced difficulties in making rent payments and may have accrued rent arrears. It was in the best interests of all parties, including agents and property managers, that an agreed plan for the payment of any rent and arrears was reached.
A guide covering key issues for consideration when negotiating a rent repayment agreement was made available and DMIRS continued to develop additional resources to assist landlords and tenants negotiate their way through the difficulties faced.
Mandatory conciliation for residential tenanciesThe Residential Tenancies (COVID-19 Response) Act 2020 also provided the Commissioner for Consumer Protection with new powers to conciliate tenancy disputes between landlords and renters during the specified COVID-19 emergency period.
The Residential Tenancies Mandatory Conciliation Service was established to help landlords and tenants who had a dispute arise from financial hardship caused by the economic effects of the COVID-19 pandemic. It was introduced by the WA Government to help landlords and tenants reach agreement about a relevant dispute without going to court.
Any party to such an agreement was able to make a submission to the Service, meaning that the Service was available to tenants, boarders and lodgers and also to landlords, park operators and property owners.
The goal of conciliation was for all sides to reach a fair and achievable solution through informal discussion.
Case study
DMIRS transitioning to a new geodetic datumDMIRS is preparing for the introduction of the new Geocentric Datum of Australia 2020 (GDA2020) which is necessary to account for Australia’s tectonic movement of about seven centimetres north east each year.
Since 2000, Australia has moved approximately 1.8 metres towards Indonesia, which requires the coordinate reference system to be changed. The upgrade will ensure spatial data can be closely aligned to positions observed using Global Navigation Satellite Systems.
DMIRS has been working closely with Landgate, the lead agency for GDA2020 implementation in Western Australia, to deliver systems changes and the appropriate policy and regulatory changes.
The department’s top priorities are managing the update smoothly, maintaining certainty of tenure for all tenement holders, and ensuring our systems and data comply with the new national standard.
Work on streamlining administrative procedures for mining companies has been finalised making it easier for them to do business with us. DMIRS is also committed to drafting legislative amendments to the Mining Act 1978 to introduce a single approval instrument to approve mining project activities across multiple tenements and to further reduce the administrative burden.
DMIRS expects to meet full compliance for the implementation of the GDA2020 on 1 October 2020.

41
Stratigraphic drilling in the Waukarlycarly Embayment, Southern Canning Basin Drilling of the Waukarlycarly 1 stratigraphic drillhole began on 1 September 2019 in the Waukarlycarly Embayment on the south-western margin of the Canning Basin.
The drillhole position was strategically designed on information gathered from the 872 km long Kidson Seismic Survey line completed in 2018, and the drillhole reached a total depth of 2680.53 m on 30 November 2019.
This drilling project was funded by Geoscience Australia’s Exploring for the Future Initiative with DMIRS participating as project operator. The department’s post-well analysis is funded by the Exploration Incentive Scheme.
All the primary objectives of the Waukarlycarly 1 stratigraphic drilling project were successfully achieved. Continuous coring was completed from 580 to 2680.53 m, totalling 2095.09 m of core, with 99.7% recovery.
The predicted and actual formations and boundary depths contrasted markedly, which is not surprising because this was the first well to drill below the Permian in the embayment. A 500m thick sandstone found directly underlying the Permian.
A thick Lower Ordovician interval included 870m of fossiliferous shale containing trilobites, graptolites, brachiopods, bivalves, ostracods, nautiloids. These fossils and sedimentary formations will provide insight into the early deposition of the Canning Basin as well as an understanding of the regional basin tectonics, which is the focus of multiple mineral resource companies in the Paterson Orogen and a Minerals Research Institute of Western Australia M521 project.
Finally, over 50 different volcanic ash beds were intersected and provide a unique opportunity to precisely date the stratigraphy using geochronology which could lead to a change in the numerical age of the internationally recognised paleontological zones identified in the core.
Around the clock DDH1 rig drilling Waukarlycarly 1
A trilobite tail (pygidium) with a prominent tail spine, preserved in part (right) and counterpart (left) from Canning Basin drillhole Waukarlycarly 1 @2111m depth

42
:Policy makerThe following are key indicators of our success as a policy maker:
Business, community and
industry behaviour supports policy
intent.
Disruptors are identified early
enough for pre-emptive
policy action. Intelligence is regularly shared
and used for public benefit.
New ideas on how to address
regulatory challenges are on the policy
agenda.
Regulatory Reform The department has embarked on various reform programs to implement business improvements for the delivery of better services and outcomes for Western Australians. These reform initiatives involve reviewing and improving practices internally, progressing many Government legislative reforms, as well as contributing to broader reform programs in collaboration with other public sector agencies to improve effectiveness and efficiency of service delivery for the community.
Our key reform initiatives included:
‣ cross-sector Regulatory Reform (Streamline WA) (refer right);
‣ security of payment reform for the building and construction industry (refer page 43);
‣ reforms to the building and construction legislation for both residential and commercial building approval process (refer to pages 43);
‣ plumbing registration reform (refer pages 43); ‣ development of new statutory guidelines for
mining proposals and mine closure plans aimed to improve approval processes for mineral and energy resource activities (refer page 33);
‣ legislative reform including the passing of laws in Parliament to protect children from toppling furniture (refer page 33); and
‣ Reform due to COVID-19 included: ‣ The Residential Tenancies (COVID-19
Response) Act 2020 and the Commercial Tenancies (COVID-19 Response) Act 2020 were urgently prepared to implement measures to assist tenants and landlords (refer page 37).
‣ Development of new General Orders to assist private sector employment and public sector adaptive response to the COVID-19 environment (refer page 35).
Cross-sector regulatory reform (Streamline WA)
Mining Environmental Approvals Project
Working together with the Department of Water and Environmental Regulation (DWER) on the Mining Environmental Approvals project, that aims to explore and develop ways to improve the environmental approval process for mining projects. Through a range of collaborative workshops, Streamline WA has worked together with state and local government, industry, business, and community representatives to explore the key issues raised by industry and develop a range of practical and effective reform proposals. Progress on these reforms was achieved in a limited capacity during COVID-19, despite Streamline WA being on hold publicly. The first deliverable is expected in 2020–21.
Regulatory Practice and Culture Project
Lead by the DWER, a working group of representatives of key government regulators, including DMIRS, has explored current regulatory practice and culture, and better ways to develop and apply regulation across the public sector.
The project is currently on hold while the Government focuses its efforts on the COVID-19 recovery initiatives, but it is expected to recommence in the near future.

Streamlining Bill 2020
Building on the work of the Streamline WA Steering Committee, the Government’s post-pandemic economic response included a significant boost to Streamline WA for the purpose of accelerating action to streamline approvals processes and undertake wider regulatory reform. Amongst these immediate measures was Cabinet approval to draft an omnibus Bill of technical amendments to the administration of a number of Acts, including the Mining Act 1978, for the purpose of improved decision-making and business efficiency. The Bill is planned to be introduced to Parliament in 2020.
Security of payment reform for the building and construction industry
An Exposure Draft of the Building and Construction Industry (Security of Payment) Bill 2020 was released for final consultation in June 2020. The Bill will deliver on the Government’s election commitment to provide better protections to subcontractors and suppliers working in Western Australia’s building and construction industry. It is expected to be presented for Parliament to consider in late 2020 and, when passed, will implement many of the remaining recommendations made by Perth barrister Mr John Fiocco in his report to the State Government in October 2018 - Final Report to the Minister for Commerce: Security of Payment Reform in the WA Building and Construction Industry.
Reforms to the building and construction legislation in Western Australia
The Western Australian Government has committed to implement the recommendations from the report Building Confidence – Improving the effectiveness of compliance and enforcement systems for the building and construction industry across Australia (Building Confidence Report) by Professor Peter Shergold AC and Ms Bronwyn Weir.
Public consultation on proposed reforms to the residential building approval process was undertaken by the department in late 2019 and comments were sought on proposed reforms to the commercial building approval process (Building Code of Australia Class 2 to 9 buildings) during the third quarter of 2019–20 .
DMIRS is collating feedback received during this process to advise government on proposals for change to the building legislation framework in Western Australia. The department will be seeking input on other proposed reforms from the Building Confidence Report in 2020–21.
Plumbing Registration Reform
Publication of the Decision Regulatory Impact Statement: Reforms to Plumbing Regulation in Western Australia on 27 November 2019 signals the completion of Building and Energy’s extensive review of Western Australia’s plumbing laws.
The decision paper sets out the legislative changes that are intended to be made and covers 20 separate reforms. The decisions took into account feedback that was provided in the more than 1,000 submissions received in response to a Consultation Regulatory Impact Statement released in May 2018.
The broad areas of reform include:
‣ the funding model for plumbing regulation; ‣ the future role of the Plumbers Licensing Board; ‣ the definition and scope of regulated plumbing
work; ‣ the testing and maintenance of plumbing safety
devices; ‣ minor plumbing repairs by private homeowners
in their own homes; ‣ the requirements for modular plumbing
installations; ‣ the regulation of plumbing designers and
plumbing design verifiers; ‣ the scope of work covered under a restricted
plumbing permit; ‣ the transition from apprentice to tradesperson; ‣ advertising to perform plumbing work; ‣ supervision and general direction and control by
Licensed Plumbing Contractors; ‣ penalties and prosecution; and ‣ compliance notification for ‘minor plumbing work’.
Tenancy reform
During 2019-20 a review of the Residential Tenancies Act 1987 commenced and work continued on implementing the review of the Retirement Villages Act 1992. A consultation paper was released seeking views on how regulation of residential tenancies should adapt to changes in home ownership and the trend to long term renting, with over 350 submissions received. Three consultation regulatory impact statements were released on options to reform the retirement villages legislation. These covered issues around payment of exit entitlements, recurrent budgets, reserve funds and capital works and changes needed to clarify key concepts within the legislation.
The Residential Parks (Long-stay) Tenants Amendment Bill 2018 was passed on 25 June 2020. The Bill implements the recommendations from the statutory review of the residential parks laws.
43

44
Public Sector adaptive response to COVID-19During the COVID-19 pandemic, we collaborated with the Public Sector Commission (PSC) to support public sector employers in managing emerging workforce issues in an environment of uncertainty and rapid change.
In March 2020, the department used its capacity to issue public sector workforce advice to administratively provide a new form of leave – COVID-19 leave – to enable those public sector workers who were sick, required to self-isolate, or otherwise affected by COVID-19 to stay home and limit the potential for the virus to spread. The leave extended to casual employees in keeping with the underlying public health needs. DMIRS is now working with PSC to gather data on COVID-19 leave use patterns to evaluate the effectiveness of the leave and guide future decisions.
Additionally, instructions were developed and issued to guide public sector employers about changed service delivery arrangements, vulnerable workers and other topics to ensure workplaces were safe and healthy and the WA Government was able to continue its day-to-day business.
Pre-paid funerals code of conductConsultation and drafting of a mandatory code of practice was finalised during 2019–20. The code will deliver a Government election commitment and give consumers greater protection and certainty when entering into pre-paid funeral contracts.
The mandatory code will impose a cooling-off period, put in place contractual and investment requirements as well as a register of pre-paid funeral contracts sold for families to verify and check if a pre-paid contract is in place.
Legislation in Parliament During the year, the following Acts commenced after being passed by the Parliament:
The Fair Trading Amendment Act 2019 updated the Australian Consumer Law (ACL) that applies in WA so that it is consistent with the national ACL. This implemented a number of important consumer protections, such as extending unfair contract terms provisions to small businesses entering into standard form consumer contracts.
The Consumer Protection Legislation Amendment Act 2019 implemented laws to enable tenants in rental properties to secure furniture to prevent injuries. It also increased a range of penalties under various consumer protection laws.
The Petroleum Products Pricing Amendment Act 2020 ensures that all WA motor fuel retailers that sell fuel at standard retail prices to members and customers are captured under the FuelWatch scheme. The scheme enables consumers to make informed decisions when seeking to buy fuel through promoting price transparency and by encouraging competition amongst fuel retailers.
The Residential Tenancies (COVID-19 Response) Act 2020 and Commercial Tenancies (COVID-19 Response) Act 2020 were introduced (refer page 37 for further information).
During the year, the following were introduced into the State Parliament:
‣ The Sunday Entertainments Repeal Bill 2019 proposes the repeal of unnecessary and outdated laws that create an administrative burden on certain businesses that have to apply for permits to use premises for paid entertainment on Sundays and designated public holidays.
‣ The Industrial Relations Legislation Amendment Bill 2020 seeks to protect vulnerable workers, tackle wage theft and ensure a level playing field for WA employers.

45
SIGNIFICANT ISSUES

46
Significant issues impacting DMIRSRather than reacting to problems, we aim to keep abreast of change. We adapt and refine ourselves, our systems and practices where necessary, and are agile in responding to the needs of Government and our customers.
During 2019–20, we have continued to identify opportunities across our broad range of regulatory, service provision and policy functions and respond to the challenges of continuing to operate during the pandemic. This work has been significant and has ultimately assisted in us being better placed to respond, across our diverse responsibilities, to the extraordinary emerging issues of 2020.
The following section outlines a number of the significant issues that have impacted the department during 2019–20.
safetyrecovery
unprecedentedgranthealth
incentive guidance
asbe
stos economic
fairresponsive
reformcontemporary
focus
legislationprot
ectio
n
reliefpandemic
regulationworkersCOVID-19
47
The current and emerging issues and trends facing DMIRS have been mapped against our new Strategic Plan, which serves as the blueprint enabling us to be agile and respond with urgency to the COVID-19 pandemic and recovery.
Premier’s focus area: Delivery of critical frontline services and support functions
We are committed to minimising the harm caused by asbestos removal ‣ The Office of the Auditor General’s Regulation
of Asbestos Removal report was tabled in Parliament on 21 May 2020.As DMIRS is responsible for regulating the removal of asbestos, there are recommendations regarding licensing processes from the report for the department to implement.
We strive to shape a contemporary workforce in both public and private sectors ‣ DMIRS worked to support the implementation
of the Government’s public sector workforce priorities. Examples included conversion to permanency arrangements, temporary labour hire, industrial relations support to Government trading enterprises, and wages policy.On 25 June 2020, the Industrial Relations Legislation Amendment Bill 2020 was introduced into the Legislative Assembly. The legislation is the State Government’s response to recommendations made by the 2018 Ministerial Review of the State Industrial Relations System and the 2019 Inquiry into Wage Theft in Western Australia.
The Bill seeks to implement a range of reforms to ensure the State system is modern, fair and accessible and to increase protections for workers.
The Bill amends the Industrial Relations Act 1979, Long Service Leave Act 1958 and Minimum Conditions of Employment Act 1993.
Amendments include removing the exclusions from the definition of employee to ensure the laws apply to all employees in the State industrial relations system, increasing penalties for contraventions of employment laws, increasing the powers of industrial inspectors, introducing stop workplace bullying provisions, modernising the Long Service Leave Act 1958 and taking steps to bring local governments under the State industrial relations system.
We are committed to implementing reforms to the building and construction industry in WA ‣ In 2017 building Ministers from all Australian
states and territories commissioned an expert report by Professor Peter Shergold AC and Ms Bronwyn Weir examining the effectiveness of building compliance and enforcement systems. The final report of that review, entitled Building Confidence – Improving the effectiveness of compliance and enforcement systems for the building and construction industry across Australia (Building Confidence Report) made 24 recommendations and was released in April 2018.The Government has committed to implementing the recommendations from the Building Confidence Report. The department is working with other jurisdictions and the Australian Building Codes Board to implement a nationally consistent model, where possible, and is carrying out three major projects to implement the recommendations:
1. A review of the residential building approval process (BCA Class 1a and 10) – an industry and public consultation process was conducted during late 2019. Collation and analysis of the responses from that process is underway, with the publication of a decision paper for Government’s consideration expected in late 2020.
2. A review of the commercial building approval process (BCA Class 2 to 9) – an industry and public consultation paper was released in December 2019 and closed for comment on 30 June 2020. Collation and analysis of the responses from that process will progress in the second half of 2020, with the publication of a decision paper for Government’s consideration expected in mid-2021.
3. A review of registration requirements for the building industry – significant consultation papers have been developed covering the review of the registration framework for builders and building contractors, and to implement new registration regimes for engineers and fire safety practitioners.

48
Premier’s focus area: Driving the State’s COVID-19 response
We are adapting our business model to the post COVID-19 environment and providing guidance and support to the community, business and other stakeholders ‣ In response to the COVID-19 pandemic, the
State Government implemented measures to protect employee safety and health and the wider community, including travel restrictions, suspension of heritage surveys and protocols for minimising non-essential personal contact.
‣ In May 2020, the department adopted various temporary measures relating to applications for suspension and extensions to work commitments required on petroleum titles.
We are continuing to strengthen collaboration with other agencies to contribute to better social and economic outcomes ‣ In response to the widespread impacts
of COVID-19 the department instigated, and subsequently chaired, a national consumer affairs response group, made up of Commonwealth and State and Territory Australian Consumer Law (ACL) regulators which was established to share information and coordinate regulatory responses to the myriad of consumer issues that were arising as a result of the pandemic.The Urgent Response Group, which met at least once a week from mid-March 2020, enabled timely discussion and the consideration of complex issues relating to the application of the ACL and other legislation in the context of the pandemic.
The Urgent Response Group facilitated active and robust discussion and ensured ACL regulators took a largely consistent, coordinated and complementary approach to consumer issues arising nationally and in each state and territory.
We are providing guidance and support to the community, business and other stakeholders ‣ The measures taken to help stop the spread
of COVID-19 impacted the management of the affairs of incorporated associations, charities and co-operatives, including the ability to hold statutory meetings and submit annual and financial information. The department responded by taking a supportive and educational approach to enforcing compliance with certain statutory obligations affected as a direct result of COVID-19.
We are supporting Government relief measures for individuals and business in a transparent, fair and ethical manner ‣ The State Government made $30 million
available for Western Australian private residential tenants who lost their jobs and faced financial hardship due to the COVID-19 pandemic on or after 20 March 2020. The Residential Rent Relief Grant Scheme provided grants equivalent to four weeks rent up to a maximum of $2,000 that was paid direct to landlords to assist tenants who were struggling to pay their rent after losing their jobs due to COVID-19.
A guide covering key issues for consideration when negotiating a rent repayment agreement was made available and DMIRS continued to develop additional resources to assist landlords and tenants negotiate their way through the difficulties faced (refer page 40).
We deliver regulatory and other reforms to support economic recovery and protect the community ‣ In response to the recommendations of the
National Cabinet to ban evictions for residential and commercial tenants during the COVID-19 pandemic, in April 2020 the Residential Tenancies (COVID-19 Response) Act 2020 and the Commercial Tenancies (COVID-19 Response) Act 2020 were urgently prepared to implement measures to assist tenants and landlords. A WA Code of Conduct was also implemented to guide commercial tenants and landlords in their negotiations (refer to page 37).

49
Premier’s focus area: Preparing for Western Australia’s economic and social recovery
We are preparing for and being responsive to increased activities ‣ An increase of 18 per cent of the number of
consumer complaints received was seen in the February to June period in 2020 (6,163 complaints) compared to the same period in 2019 (5,219 complaints). COVID-19 was specifically referred to in 19 per cent of the complaints received in the 2020 period.
We are actively involved in identifying and supporting new and emerging industries ‣ During the COVID-19 pandemic, hand sanitisers
were initially in short supply and businesses such as breweries, distilleries and cleaning product manufacturers assisted by manufacturing sanitiser products. DMIRS Dangerous Goods inspectors reviewed the safe operations of companies manufacturing highly flammable goods (refer to page 34).
We are supporting Government relief measures for individuals and business in a transparent, fair and ethical manner ‣ As part of the financial relief measures
introduced by the State Government, DMIRS is considering COVID-19 related impacts when exploration tenement holders apply for expenditure exemptions under section 102 of the – Mining Act 1978 until 31 March 2021, unless rescinded earlier.Exemption from exploration expenditure is considered if tenement holders are unable to meet the tenement’s expenditure requirements as a direct result of COVID-19 or because of restrictions imposed by the State and Federal governments. The measures will help provide relief to companies and help support the State’s economy to respond to COVID-19.
‣ The State Government provided the DMIRS-managed Exploration Incentive Scheme with $5 million dollars of additional funding for the 2020–21 financial year as part of its WA Recovery Plan. To help invigorate the resources industry, $3 million dollars of the funding will be allocated to Western Australian explorers via the co-funded drilling program.
The additional funding will also accelerate the acquisition of airborne electromagnetic data from the southern half of the State, which is testing for the presence of critical battery minerals (such as nickel) and water.
We are forward thinking in our approach to regulatory reform and assisting in transforming social, industry and economic recovery ‣ The Residential Tenancies Mandatory
Conciliation Service was established to help landlords and tenants who had a dispute arise from financial hardship caused by the economic effects of the COVID-19 pandemic. It was introduced by the WA Government to help landlords and tenants reach agreement about a relevant dispute without going to court (refer page 40 for further information).
‣ Strategic measures to facilitate the long term recovery of the resources sector and the Western Australian economy. For example, DMIRS worked across policy areas in the State and National Governments to develop recovery measures within the resources sector.After a comprehensive community consultation process, in November 2019 the Government introduced its Work Health and Safety Bill 2019 (WHS Bill) to the Parliament. After passing the Legislative Assembly, the WHS Bill had its Second Reading in the Legislative Council on 20 February 2020. The WHS Bill has been considered by the Standing Committee on Uniform Legislation and Statutes Review and the Standing Committee on Legislation. It is expected that the WHS Bill will be progressed through Parliament by the end of the 2020 Spring Session of Parliament.
The Act will be supported by three separate sets of regulations applying to workplaces generally in Western Australia, the mines sector, and the petroleum and geothermal sectors. Widespread state-wide consultation has been undertaken to provide recommendations for consideration by the Minister for Industrial Relations to develop the three sets of regulations.
The introduction of new legislation will have implications for existing industry guidance, inspector training, online systems, notification processes and other functions.
50
51
DISCLOSURES & LEGAL COMPLIANCE

52
Ministerial directions There were no ministerial directives issued by either Minister during 2019–20.
Other financial disclosuresPricing policies of services providedStatutory fees are charged to the public for various services provided by the department. These fees and charges are reviewed annually in accordance with the government’s policy on the costing and pricing of government services. A robust costing methodology is used to determine the projected costs of service delivery, with particular attention to the level of cost recovery being achieved. Any increases in fees and charges are limited to the extent of cost recovery.
The department’s fee changes for 2019–20 were published in the WA Government Gazette on the following dates:
18 June 2019:
‣ No. 84 of 2019: Mines and Petroleum Regulations Amendment (Fees and Charges) Regulations 2019; and
‣ No. 85 of 2019: Commerce Regulations Amendment (Fees and Charges) Regulations 2019.
21 June 2019:
‣ No. 86 of 2019: Occupational Safety and Health Amendment Regulations (No. 3) 2019.
The changes came into effect on 1 July 2019. Details regarding the fees are available on the department’s website.
Capital worksThere were no capital works projects during 2019–20.

53
Our peopleA capable, high performing workforce that delivers on Government and community priorities.
We recognise that the Western Australian community relies on us, and that our people contribute every day to our performance.
This year, our people have been challenged like never before. Alignment to our values of being respectful, responsive, forward thinking, transparent, fair and ethical remained particularly relevant and vital. The health and wellbeing of our people was communicated as being our number one priority, alongside the focus on providing safe workplaces, while we tried to maintain our essential services.
Through commitment to our purpose, corporate values and safety, the message that ‘we are all in this together and we will get through this together’ was reflected.
Understanding just how critical our people are, our Corporate Executive ensured a strategic theme on a skilled, diverse and flexible workforce. Progress against the following priorities for this strategic theme has been addressed in this section:
‣ 3.1 build talent and leadership capacity (refer page 54); ‣ 3.2 build and strengthen a workplace culture with a focus on our values, safety and wellness
(refer page 61); ‣ 3.3 implement recruitment and selection practices that enable and inclusive, mobile and flexible
workplace (refer page 59); and ‣ 3.4 improve diversity profile and opportunities for women in leadership (refer page 55).
The importance of our staff was also reflected in our new Strategic Plan which was developed to respond to the COVID-19 environment, with the inclusion of the response theme: ‘supporting and managing a flexible and inclusive workforce, and providing a safe workplace with a strong focus on our values, health and wellness’. This commitment will be echoed across every part of our business as we are involved in driving the State’s COVID-19 response and preparing for Western Australia’s economic and social recovery.
Our staff profile
Full time equivalents 2018–19 2019–20
Full time 1,277.49 1,425.93
Part time 121.35 127.93
Secondment 27 33.80
The DMIRS workforce has a strong representation of people who are culturally and linguistically diverse. We at DMIRS, strive to embrace the skills, knowledge, experiences and perspectives that culturally and linguistically diverse people bring to our workforce.
66different countries
identified by our employees as their ‘country of origin’.
Representation of staff who are culturally and linguistically
diverse
15.91%

54
Build talent and leadership capacityWe recognise that our business is always learning and evolving through continuous investment in developing our people, allowing us to be responsive to our varied stakeholders, and the Western Australian community.
Staff development
We invest in our staff by providing learning and development opportunities as part of the Leadership Development Framework. Staff have completed training in accountable and ethical decision making, conflict of interest, performance development, cultural awareness, disability awareness, diversity and inclusion, Aboriginal cultural awareness, and critical thinking. Managers were also provided with training in occupational safety, health and injury management, managing performance, recruitment and selection, resolving workplace issues, and Management Accountabilities – Understanding Your Role.
This investment in staff also extended to building leadership capacity by offering specialised opportunities such as involvement with the Learn Explore and Do program, the Management Excellence Development Program, and the Public Sector Management Program.
Opportunities to participate in further customised in-house programs and sponsored external public sector-wide programs were also available.
Workforce planning
The department continues to focus on strengthening the skills, diversity and flexibility of our workforce to meet the needs of the community both now and in the future.
This year, the department launched a Succession Planning Pilot Program to strengthen and maintain a strong talent pipeline, improve the diversity profile in leadership positions, and mitigate workforce risk.
Work has also continued on the development of the department’s workforce planning framework. The new framework, which has a strong focus on the promotion of diversity, is being developed to align to the department’s operational planning process and the Leadership Development Framework.
Performance development
My Performance and Development (MyPD) is the department’s performance development process which promotes ongoing discussions between the employee and their manager regarding the employee’s role responsibilities, standard of performance and their development. MyPD training is included as part of the induction program for all new employees when commencing at the department.
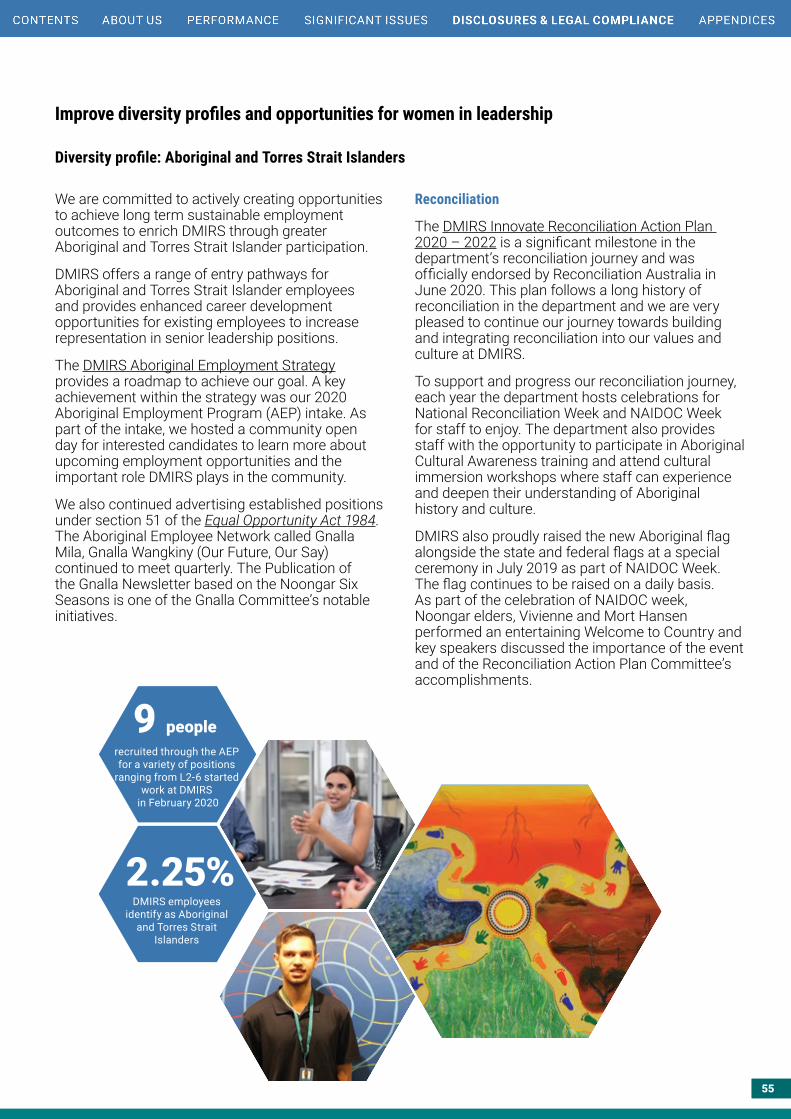
5555
Improve diversity profiles and opportunities for women in leadership
Diversity profile: Aboriginal and Torres Strait Islanders
We are committed to actively creating opportunities to achieve long term sustainable employment outcomes to enrich DMIRS through greater Aboriginal and Torres Strait Islander participation.
DMIRS offers a range of entry pathways for Aboriginal and Torres Strait Islander employees and provides enhanced career development opportunities for existing employees to increase representation in senior leadership positions.
The DMIRS Aboriginal Employment Strategy provides a roadmap to achieve our goal. A key achievement within the strategy was our 2020 Aboriginal Employment Program (AEP) intake. As part of the intake, we hosted a community open day for interested candidates to learn more about upcoming employment opportunities and the important role DMIRS plays in the community.
We also continued advertising established positions under section 51 of the Equal Opportunity Act 1984. The Aboriginal Employee Network called Gnalla Mila, Gnalla Wangkiny (Our Future, Our Say) continued to meet quarterly. The Publication of the Gnalla Newsletter based on the Noongar Six Seasons is one of the Gnalla Committee’s notable initiatives.
Reconciliation
The DMIRS Innovate Reconciliation Action Plan 2020 – 2022 is a significant milestone in the department’s reconciliation journey and was officially endorsed by Reconciliation Australia in June 2020. This plan follows a long history of reconciliation in the department and we are very pleased to continue our journey towards building and integrating reconciliation into our values and culture at DMIRS.
To support and progress our reconciliation journey, each year the department hosts celebrations for National Reconciliation Week and NAIDOC Week for staff to enjoy. The department also provides staff with the opportunity to participate in Aboriginal Cultural Awareness training and attend cultural immersion workshops where staff can experience and deepen their understanding of Aboriginal history and culture.
DMIRS also proudly raised the new Aboriginal flag alongside the state and federal flags at a special ceremony in July 2019 as part of NAIDOC Week. The flag continues to be raised on a daily basis. As part of the celebration of NAIDOC week, Noongar elders, Vivienne and Mort Hansen performed an entertaining Welcome to Country and key speakers discussed the importance of the event and of the Reconciliation Action Plan Committee’s accomplishments.
9 peoplerecruited through the AEP for a variety of positions
ranging from L2-6 started work at DMIRS
in February 2020
2.25%DMIRS employees
identify as Aboriginal and Torres Strait
Islanders

56
Diversity profile: People with disability
Employment outcomes for people with disability
Over the past two years, we have focused on ensuring people with disability have equal access to employment and development opportunities.
Our achievements were highlighted this year with the inclusion of two articles in the Disability Access and Inclusion Plan, Minister’s Progress Report 2018–19 under Outcome 7 achievements – Employment.
One article detailed the experience of a DMIRS employee, who was initially hosted as a trainee from the Public Sector Commission’s Adult People with Disability Trainee Program to achieve a Certificate III in Government (Public Administration) and complete their training. Once the program was completed, the trainee was nominated for appointment to a permanent position within DMIRS through the Commission’s traineeship transition to employment, recruitment and referral service. Soon after, this staff member was identified for a higher-level acting opportunity and then achieved a promotion as the successful applicant of a recruitment process.
Supportive and inclusive culture
In 2019, the department’s International Day of People with Disability celebrations featured guest speaker Prue Hawkins, Western Australia’s ambassador for disability discrimination matters, who shared with participants the challenges of accessibility restrictions imposed on her by certain workplaces, and how she took the initiative to found Empire Barristers and Solicitors.
Following the talk, participants also heard from a Project Assistant and their General Manager who shared their perspectives on what it takes to create an inclusive workplace culture. They also represented the department as panel members at the Autism West’s Neurodiversity in the Workplace forums in 2020 which inspired managers to break down communication barriers, accept people for who they are, and be flexible in the workplace.
Executive partnership with National Disability Services Western Australia
At the beginning of 2020, DMIRS established a partnership with National Disability Services Western Australia (NDS WA) to increase work opportunities within the department for people with disability.
The NDS WA partnership continues to assist DMIRS to enhance and strengthen our recruitment practices, provide resources and initiatives, and support the development of initiatives that improve the employment outcomes of people with disability. This also includes workshops to increase staff awareness and increase our capacity to attract, recruit and support people with disability.
2.37%DMIRS employees identify as having
disability

57
Disability access and inclusion plan outcomesThe DMIRS Disability Access and Inclusion Committee was established in 2018 and has 12 members from across the department, including three members with a disability. During the year, the committee met on a number of occasions to prioritise the development and implementation of the DMIRS Disability Access and Inclusion Plan (DAIP) 2019–2023, which was endorsed in early 2019 in accordance with section 29 of the Disability Services Act 1993 and schedule 3 of the Disability Services Regulations 2004.
The following table outlines key achievements in 2019–20 relating to the seven outcomes.
Outcome Achievements
Outcome 1:People with disability have the same opportunities as other people to access the services of, and any events organised by DMIRS.
‣ Celebrated International Day of People with Disability. More than 150 staff took part in this awareness event and the catering was provided by Workpower, a not-for-profit organisation dedicated to creating opportunities for people with disability, their families and carers.
‣ Successfully supported a range of fundraising events resulting in greater staff awareness about disability via promotion and engagement. Events included regular casual dress days which raised money for a range of disability charities including the Muscular Dystrophy Association of WA and Wheelchair for Kids.
Outcome 2: People with disability have the same opportunities as other people to access the buildings and other facilities of DMIRS.
‣ Developed a five year Strategic Accommodation Plan that once implemented is expected to deliver improved accessibility outcomes and services within a consolidated building for the whole of DMIRS with accessible kiosks, public counters and direction signage.
‣ Continued to consider accessibility and inclusiveness in all improvements and maintenance to the department’s facilities with options being reviewed for an accessible ramp for presentations within the Theatrette and a unisex accessible toilet for events at Mineral House.
Outcome 3: People with disability receive information from DMIRS in a format that will enable them to access the information as readily as other people are able to access it.
‣ Ensured that publications comply with the requirements of the Disability Services Act 1993. ‣ Continuously improved and updated the department’s policies with a focus on creating clear and
easy-to-read documents in alternative formats. ‣ Ensured the new Intranet was being developed to conform with web content accessibility guidelines and
other Government policies so that people with disability can access relevant information.
Outcome 4:People with disability receive the same level and quality of service from the staff as other people receive from the staff of DMIRS.
‣ Placed notices at all customer-facing counters requesting customers with hearing impairments to make themselves known so staff were able to provide appropriate assistance.
‣ Retained use of the National Relay Service. ‣ Disability Access and Inclusion Committee members to take responsibility for encouraging colleagues
and workgroups to provide a safe and inclusive environment for people with a disability by way of completing equal employment opportunity and diversity data within employee services kiosk information.
Outcome 5: People with disability have the same opportunities as other people to make complaints to DMIRS.
‣ Developed complaint forms in a number of formats, specific to matters concerning disability access and inclusivity. These forms are automatically directed to a specific email address that is monitored by the Disability Access and Inclusion Committee for review and response.
Outcome 6: People with disability have the same opportunities as other people to participate in any public consultation by DMIRS.
‣ Continued to promote the [email protected] inbox as a convenient and direct way for people to raise matters related to disability and inclusion.
Outcome 7:People with disability have the same opportunities as other people to obtain and maintain employment with DMIRS.
‣ Established a partnership with NDS WA in November 2019, to increase employment opportunities at DMIRS for people with disability. We were one of eight agencies whom entered into an initial six-month partnership which has been extended further until March 2021.
‣ Funded nine tickets for employees to attend Autism West's Neurodiversity in the Workplace Forums ‣ Hosted a Lunch and Learn session for International Day of People with Disability. During this period the
department also offered corporately-funded training on disability awareness. ‣ Promoted diversity activities in which the department took part in our social media platforms to increase
our inclusive employer branding with the community.
Diversity profile: Youth and young professionals Refer to page 60.

58
Women in leadershipDMIRS believes a gender-balanced leadership team has the ability to improve operational effectiveness and deliver better outcomes for the WA community.
Over the past year, DMIRS has been working towards increasing the workforce representation of women in leadership positions through a number of strategies including:
‣ encouraging equal numbers of women and men participating in internal leadership development programs and mentoring programs;
‣ promoting flexible working arrangements available for all DMIRS staff; ‣ providing women with opportunities to gain experience in senior-level positions; ‣ ensuring corporate funding is made available for women to attend programs and conferences to
develop their leadership capabilities and progress their careers; ‣ supporting the development of women in the leadership talent pipeline by creating a register for mineral
and petroleum resource leadership roles. The register promoted the priority to improve gender diversity within the leadership group, and specifically encouraged female leaders to register; and
‣ launched the DMIRS Succession Planning Pilot Program. One of the outcomes of the program is to create gender balance and increase the diversity profile of the department’s leadership talent pipeline.
In our last annual report, Director General David Smith expressed a commitment “to promoting gender equality by working on increasing the visibility and contribution of its female leaders and improving opportunities for women in leadership”. Even though we recognise more needs to be done to increase the representation of women in leadership, our Corporate Executive Group currently has achieved parity, and this is something we are proud of.

59
Implement recruitment and selection practices that enable an inclusive, mobile and flexible workforceWe continuously review our recruitment and selection practices, and make changes to enable an inclusive, mobile and flexible workforce.
The department coordinates a number of formal and informal methods to fill vacancies – from our award winning interagency Graduate Program through to undertaking targeted recruitment in accordance with the Equal Opportunity Act 1984. The department’s best practice standards include requiring hiring managers to undertake training in recruitment and selection, and using Human Resources skills and knowledge to promote contemporary recruitment and selection practices that consider inclusive and flexible workforce outcomes.
Work commenced to review the department’s job advertisements to improve attraction and facilitate engagement of a diverse range of applicants. Our job advertisements are designed to include contemporary and simplified language to appeal to all – including Equal Employment Opportunity (EEO) target groups, while ensuring compliance with the industrial instruments. Where mobile and flexible opportunities exist – for example, part-time opportunities, the department aims to be explicit in the job adverts to encourage all to apply.
Breaking down our workforce by age
0 5 10 15 20 25 30 35
27% 45 - 54 years
15% 25 - 34 years
24% 35 - 44 years
2% 24 years and under
32% 55 years and over
Percentage of staff by age
Tracking our progess towards employment targets
2.25%Aboriginal and Torres
Strait Islander employees
q Target 2.6% 35.6%Women Substantively
appointed to L7/SCL4 and above positions
q Target 36.1%
18.64%Young professionals
(35 and under)
q Target 21.1%50%
Women occupying tier 2
and 3 positions
Target 43.2%
2.37%Employees
with disability
q Target 2.8% 2.25%Youth (24 and under)
q Target 2.3%

60
Diversity profile: Youth and young professionals
During the year, DMIRS supported the development and career progression of our youth and young professionals, focusing on our goal to increase our numbers of staff aged 24 and under (currently 2.25 per cent) and young professionals being 35 and under (currently 18.64 per cent).
The department participated in the Public Sector Commission’s School-Based Traineeship program, coordinated an Interagency Graduate Program and Public Sector Industrial Relations Graduate Program, and funded attendance at youth and young professional networking events and conferences.
Traineeships
During the year, the department welcomed a new school-based trainee who joined the program alongside the department’s current trainee, who will graduate from the program in late 2020.
Graduate program
The award-winning 18-month graduate program, coordinated in partnership with the Department of Jobs, Tourism, Science and Innovation, focuses on attracting talented university graduates to a career in the public sector.
In January 2020, the department welcomed six new graduate officers. Through the program, these graduates will gain experience, build networks and improve their understanding of State Government through rotational opportunities in different business areas and departments.
Mobile, flexible workforceThroughout the COVID-19 pandemic, DMIRS employees have shown through their actions that they are an inclusive, mobile and flexible workforce. The pandemic accelerated the department’s rollout of innovative technologies to allow staff to work remotely.
The technological transformation we went through, has not only changed the way we work and collaborate both in and outside of the office, it will ensure the department’s services will continue contributing to the State’s recovery.
Not only did we share our resources and work together across DMIRS during the pandemic, we also assisted other public sector agencies in their response. An example of this was our involvement in the initiative Switch (WA Public Sector) – Supporting the mobilisation of WA public sector staff being trialled to support response and recovery.
Inclusive workforce
Refer to page 55 – 60.
7 graduates permanently
appointed from the 2019 program to
commence July 2020
68% our people were
working from home as at 15 May
2020
37employees
24 and under

61
Government policy requirementsBuild and strengthen a workplace culture with a focus on our values, safety and wellnessLiving our values
Alignment with our corporate values is vital to us reaching our purpose of supporting a safe, fair and responsible future for the Western Australian community, industry and resources sector. An initiative to better embed them across the department is underway, with further progress planned for next financial year.
The safety of our people
We are constantly striving to be an employer of choice by leading the way for public sector safety and injury management. The mental and physical safety of our staff is paramount and as the regulator for Occupational Safety and Health (OSH) in Western Australia, the department is committed to setting an example as a safety leader within the field of occupational safety and health.
In accordance with the Public Sector Commissioner’s Circular 2018-03, DMIRS complies with the occupational safety and health (OSH) reporting obligations by outlining OSH performance, policies and initiatives as well as other requirements, including reporting against targets.
Commitment
The Director General and Corporate Executive have confirmed the department’s commitment to OSH and injury management, by ensuring we works collaboratively to improve OSH. This goal has been included as a priority in the DMIRS Strategic Plan – Towards 2024 – to build and strengthen a workplace culture with a focus on our values, safety and wellness.
This top-down commitment to OSH and injury management is further demonstrated by the Corporate Executive being represented and actively involved on the OSH Committee – in particular in the consultation and approval process for the regular review of the department’s OSH policies and procedures. The Corporate Executive has also approved the purchase and development of an online OSH Incident Management system, given its ongoing support for the department’s extensive Working on Wellness program, and approved the newly developed Mental Health for Managers and Employees training.
OSH is a standing agenda item for Corporate Executive and other management meetings. This provides an opportunity for the leadership teams to discuss any local issues, recent incidents, new procedures or upcoming events. The Work Health and Safety (WHS) team assists with this by sending out a monthly communication called Safety on the Agenda to all DMIRS managers with a list of the current saftey issues and alerts relevant to the majority of staff.
Consultation
The department’s formal mechanism for consultation with employees on OSH matters is through the OSH Committee. The committee is accountable to the Director General through the Corporate Executive and is highly consultative with employees represented by their elected Safety and Health Representatives (SHRs). The committee consists of five employer representatives (managers) and all SHRs who attend meetings on a rostered basis. The committee is chaired on a rotational basis by a corporate executive member and an employee representative.
The committee meets quarterly to discuss and resolve OSH issues, review hazards and incident statistics and trend reports, and endorse new initiatives for the continued safety, health and wellbeing of the department’s employees, contractors and visitors. The committee meeting is preceded by a quarterly SHR meeting where SHRs are given the opportunity to network with each other and raise OSH issues that concern the staff that they represent. The SHRs discuss and decide which of these OSH issues should be raised at the committee meeting.
The committee minutes are tabled with the Corporate Executive and made available to staff through SHRs, departmental newsflashes, intranet, and on safety notice boards. Each quarter, the WHS manager presents current OSH data including hazards, incident/accidents, injury management and emerging trends to the Corporate Executive.
Our values
Forward thinking
Fair
Ethical Transparent
Responsive
Respectful

62
Injury management
In line with our duty of care under the Occupational Safety and Health Act 1984 (OSH Act), the department provided our employees with a safe work environment focused on the prevention of accidents, injury or harm. Where a work-related injury or disease occurred, we managed workers’ compensation claims fairly and effectively in accordance with the Workers’ Compensation and Injury Management Act 1981.
The department aims to assist injured employees back to meaningful, productive and appropriate work through graduated return-to-work programs in regular consultation with doctors, managers and the employee concerned.
During 2019–20 there were 10 workers’ compensation claims lodged, with eight resulting in one day or more off work. There were no severe claims reported in this period.
Safety management system
To support the commitment to OSH and injury management, the department’s safety management system aims to exceed the requirements of the OSH Act. During the year, this commitment was communicated to staff by the annual review and publication of the department’s OSH Policy and the OSH Policy Statement which is displayed in each of the department’s offices. The OSH Policy is covered in the OSH induction and managers’ OSH training. OSH is embedded in departmental systems like the departmental personal development system (called MyPD) and in the departmental Job Description Forms.
The development and implementation of the department’s online OSH reporting and management system (called MyWHS) will complete the amalgamation of the two safety management systems of its legacy departments. It will provide the capacity for all staff to be able to report hazards and incidents easily. It will also enable managers to effectively and efficiently manage their OSH responsibilities through assessment and resolution of hazards, and investigation and risk assessment of incidents. The MyWHS system will ensure the Corporate Executive is able to keep track of OSH trends within their own areas of responsibility.
There is a comprehensive and scheduled review process for all OSH policies, procedures, guidelines and supporting documentation. These are reviewed and continuously improved by extensive consultation with user groups and experts in their field throughout the department, including SHRs and the OSH Committee. This process ensures improvements to systems and processes, such as first aid procedures and training, reasonable adjustments and modifications for staff in need, reporting, assessment and investigation processes, and ergonomics procedures – particularly related to working-from-home and installation of sit-to-stand desks where medically appropriate.

63
Audit of safety management system
The two safety management systems of the legacy departments were assessed against the WorkSafe Plan audit and assessment (we received platinum certification in 2017, and gold in 2015) and all audit recommendations having been implemented.
During the year, the department was also audited by the Industrial Foundation for Accident Prevention (IFAP) in 2019, and received a Gold Safe Way Achiever Award for a best practice safety management system.
Report on performance
Measure Actual results Results against target
2017—18 2018—19 2019–20 Target Comment on result
Number of fatalities 0 0 0 0 Target achieved
Lost time injury and/or disease incidence rate(1)
0.44 0.35 0.50 0 or 10% reduction
This is a 43% increase but numbers of claims remain low
(see note)
Lost time injury and/or disease severity rate
50.0 40.0 0 0 or 10% reduction
Target exceeded
% of injured workers returned to work:i) within 13 weeksii) within 26 weeks
i) 100%ii) 100%
i) 100%ii) 100%
i) 100%ii) 100%
Greater than or equal to
80%
Target exceeded
% of managers trained in OSH management responsibilities including refresher training within 3 years
86% 93% 92% Greater than or equal to
80%
Target exceeded
Note:(1) there were eight lost time injury claims. These injuries are attributable to six musculoskeletal injuries, one superficial injury and one
attributable to mental stress. It should be noted that despite a 43 per cent increase, our numbers of claims remain low– six in 2017–18 and five in 2018–19.
Working on Wellness
The department’s Working on Wellness (WOW) program, continues to be popular and well-utilised by employees. It has won multiple awards through the Institute of Public Administration Australia. Participation rates are up on the last financial year, with 2,743 instances of employees attending various events and initiatives, such as the annual flu vaccinations, skin cancer and health checks and an onsite gym.
Events such as the WOW Expo continue to be popular, with other examples being R U OK Day, walking tours and guided meditation, and presentations on diet and cardiovascular health. Come and Try sessions for yoga, Konga and boxing have been well attended. More recently, in response to the COVID-19 pandemic, webinars have been organised on subjects such as supporting children through coronavirus, self-care for mental and physical wellbeing and helping children with heightened emotions.

64
Governance disclosures
Corporate Executive Subcommittees
The Corporate Executive has established six subcommittees to ensure the governance for DMIRS is timely and strategic decisions are made on critical issues that affect the department.
They will focus on audit and risk, performance, finance, digital technology, reform, and one working group that will focus on equal employment opportunities and diversity.
These subcommittees will assist the Director General and the Corporate Executive by providing expert guidance and recommendations on each area.
In accordance with the revised Treasurer’s Instruction 1201, released in December 2019, the Audit and Risk Committee was replaced by a new, fully independent Audit and Risk Committee. For further information refer to page 141.
Audit and Risk Subcommittee
Met three times during the year to provide
oversight of the department’s governance, risk management
and internal control practices to provide confidence in the integrity
of these practices and enable achievement of government and organisational strategic
objectives.
Key achievement: ‣ DMIRS reviewed its Audit
and Risk Committee structure in line with revised Treasurer’s Instruction 1201 and appointed a qualified, independent Chair. The Committee is also comprised of four independent members from other state government agencies.
‣ All legacy recommendations from the Minus 100 project were implemented resulting in mitigation of a number of outstanding risks.
Digital Technology Subcommittee
Met monthly to provide an opportunity
for leadership to consider and discuss
new and strategic approaches to DMIRS
technology.
Key achievement: ‣ Finalised the DMIRS
Machinery of Government suite of IT Projects – SOE Platform, VDI, Follow-me Printing, Service Now, Objective Upgrade and Open Practice (Legal).
‣ Implemented a Risk Management System across all of DMIRS.
‣ Modernised the DMIRS Payment Gateway via the Payment Portal Project.
‣ Met the Legislative deadline for Dangerous Goods Security Cards – Licence Renewal – Photo Requirements.
Finance Subcommittee
Met monthly to monitor and discuss the budget of DMIRS.
Key achievement: ‣ Closely monitored DMIRS
expenditure in relation to budget.

65
Governance disclosures | Corporate Executive Subcommittees
Reform Subcommittee
Met five times during the year to
monitor reform recommendations
from the Government’s Roadmap for Reform
initiatives.
Key achievement: ‣ Improved the process
for dealing with reform submissions received by the department which have been referred by Streamline WA, to ensure the submissions are dealt with expeditiously.
Performance Subcommittee
Met five times during the year to assist leadership with governance
and oversight responsibilities.
Key achievement: ‣ Proposed changes to
the department’s OBM structure and auditable KPIs approved by the Department of Treasury to apply for 2020—21.
‣ Model for internal corporate performance reporting and management prepared and endorsed by the Performance subcommittee. The model provides a framework for selecting a suite of indicators that will provide the Executive with an overview of the department’s performance in key areas to support its corporate governance role.
Diversity and Inclusion
SubcommitteeMet quarterly to monitor
and progress the implementation of the department’s Diversity and
Inclusion Plan 2019–2023. Through robust discussions, the subcommittee ensured strategic
decision-making and accountability on diversity and inclusion matters,
aligned to priorities of the department and the
Public Sector.
Key achievement: ‣ Oversaw the implementation
of a number of the diversity employment programs and initiatives including the development of the Reconciliation Action Plan.

66
Public interest disclosures
The department is committed to the objectives of the Public Interest Disclosure Act 2003. It does not tolerate corrupt or improper conduct, and strongly supports disclosures being made by employees, contractors and community members that could stop or prevent wrongdoing. We recognise the value and importance of staff contributions to enhance administrative and management practices.
In accordance with section 23(f) of the Public Interest Disclosure Act 2003, the department is required to report to the Public Sector Commissioner on the number of Public Interest Disclosures received, the results and any action taken during the reporting period.
In 2019–20, there were no Public Interest Disclosures received or managed.
Other legal requirementsAct of grace paymentsIn response to Treasurer’s Instruction 319: Act of Grace Payments, all act of grace payments are to be disclosed in the annual report. Requests for an act of grace payment arise from many and varied situations and each request is assessed on the circumstances associated with that particular request. Act of grace payments are linked to the services delivered by the department.
Section 80(1) and (2) of the Financial Management Act 2006 and Financial Management Regulation 8 provide that the Treasurer may approve an act of grace payment of up to $250,000, and where the payment exceeds that amount prior approval of the Governor must be sought.
This year, the departments act of grace payments relate to royalty rebates as per the financial assistance agreement for the Koolyanobbing Iron Ore Mine.
Act of grace payments 2019–20
Administered funds
Payments Payment amount $ Purpose of payment
Sep-19 10,264, 590.43 Royalty refund
Dec-19 10,002,002.42 Royalty refund
Feb-20 12,264,557.17 Royalty refund
May-20 12,205,448.50 Royalty refund
44,736,598.52

67
Unauthorised use of credit cardsThe DMIRS adheres to Treasurer’s Instruction - 321 Credit Cards – Authorised Use regarding card expenditure and the table below will also be submitted under the reporting requirements of this Instruction.
Officers whose functions warrant usage of this facility hold corporate credit cards. Despite all cardholders being reminded of their obligations annually under the department’s credit card policy, there were 59 instances of personal usage, by 54 individual cardholders (Five people had two occurrences).
These matters were not referred for disciplinary action because the Chief Finance Officer noted prompt advice and settlement of the personal use amount, and, that the nature of the expenditure was immaterial and characteristic of an honest mistake.
An internal review is being carried out on credit cards by our Internal Audit team.
Instances of unauthorised credit card use
Number of instances the Western Australian Government Purchasing Cards have been used for personal purposes 59
Aggregate amount of personal use expenditure for the reporting period $5,541.17
Aggregate amount of personal use expenditure settled by the due date (within 5 working days) $5,498.21
Aggregate amount of personal use expenditure settled after the period (after 5 working days) $55.96
Aggregate amount of personal use expenditure remaining unpaid at the end of the reporting period 0
Number of referrals for disciplinary action by the notifiable authority during the reporting period 0
Disability Access and Inclusion
Refer to people with disability section on page 56.
Compliance with public sector standards and ethical codes
The department is committed to maintaining an ethical, transparent and accountable workforce and actively encourages employees to uphold the highest standard of conduct and integrity at all times, as well as in accordance with Commissioner’s Instructions No. 7 and 8.
Accountable and Ethical Decision Making (AEDM) and Conflict of Interest (COI) form part of the department’s induction program for all new employees. As at 30 June 2020, 98 per cent of employees have completed the AEDM training and 89 per cent of employees have completed the COI training.

68
Expenditure on advertising, market research, polling and direct mailIn accordance with section 175ZE of the Electoral Act 1907, the department incurred the following expenditure in advertising, market research, polling, direct mail and media advertising. Total expenditure for 2019–20 was $658,338.89. Expenditure was incurred in the following areas (detailed below).
Expenditure on advertising, market research, polling and direct mail
Expenditure Organisation Amount TotalAdvertising (1)
Initiative $511,680.93Mintox Media $43,095.00Optimise Online $11,540.93Lush - The Content Agency Pty Ltd $11,489.00Redwave Media $9,000.00Angry Chicken Publishing Pty Ltd $6,000.00Shire of Christmas Island $3,643.09Farm Guide Pty Ltd $3,060.00Noongar Media Enterprises $2,940.00Platform Communications $1,900.00Mailing Lists Online $1,612.31Kununurra Visitor Centre $1,600.00Cocos (K) Islands Community Resource Centre $1,565.00Spatial Jobs On-line $1,354.50Geological Society of Australia Inc $1,000.00Construction, Forestry, Mining & Energy Union W.A. Directory
$995.00
Mulga Mail $843.00Facebook Inc $837.22Derby Visitor Centre $800.00The Law Society WA $732.00The Magazine Works Pty Ltd $600.00Australian Institute of Health and Safety $500.00Access Community Engagement Services $300.00Other Advertising Expenditure $1,395.60 $618,483.58
Market Research Organisations (2)
Survey Monkey $4,704.03Polity Pty Ltd $3,751.82Links Surveying $1,722.10Other Market Research Organisations Expenditure $385.00 $10,562.95
Polling Organisations Mentimeter $631.08
Facebook Inc $88.44 $719.52Direct Mail Organisations
Quickmail $13,279.76Australia Post $10,491.52
Createsend.com $3,207.74Campaign Monitor $1,091.66Other Direct Mail Organisations Expenditure $502.25 $28,572.93
Total $658,339.98
Notes:(1) Expenditure for advertising increased from 2018–19 due to the Shocks and tingles campaign and the advertising that related to the
increased recruitment activity.(2) Gartner Australasia Pty Ltd has been excluded as it is may be categorised as IT consultancy.

69
Recordkeeping plans
Evaluation of record keeping systems
In January 2020, DMIRS made the decision to consolidate/migrate the former Department of Mines and Petroleum Electronic Document and Records Management System (EDRMS) repository, OurDocs/Records Manager into a single source of truth information management solution, Objective EDRMS.
The project will be delivered in a phased approach and is anticipated to be completed in 2023.
DMIRS continuously monitors and evaluates the performance of its EDRMS, ensuring compliance with both legislative standards and operational business requirements.
Unstructured information created by our internal users, and structured information submitted by our customers and uploaded into our EDRMS (via integration with departmental business systems) is regularly monitored, audited, verified and reviewed for both quality assurance and data integrity. This includes qualitative and quantitative system checks that analyse information, providing accountability and transparency.
During 2019–20, additional EDRMS application features were developed to provide enhanced user experience and promote best practice recordkeeping within the department.
Training programs
All new employees are required to complete mandatory information management and recordkeeping training.
An online, self-paced recordkeeping awareness session is available to staff covering: government employee accountability and compliance standards; legislative requirements including the State Records Act 2000 and the Freedom of Information Act 1992; benefits of best practice recordkeeping; consequences of inadequate record keeping; and the creation, access, storage and disposal of government records.
Training in the use of EDRMS is provided to all staff in either, a face-to-face classroom environment or in a virtual format using Microsoft Teams. The course provides an overview of the application of foundational information management principles that guide system use and information management, document creation and storage.
Online mandatory Objective training is also provided and all learning modules must be completed and passed prior to gaining access to the Objective EDRMS. All departmental staff recordkeeping training information is recorded and saved within DMIRS’ applications.
In addition to the mandatory training, other training options and resources include:
‣ one-on-one coaching sessions; ‣ direct support from record keeping consultants; ‣ training sessions created to meet the specific needs of individual operational areas (includes options for
advanced EDRMS training modules); and ‣ online EDRMS help guides.
Our employees regularly attend workshops and presentations offered by the State Records Office, Records and Information Management Professionals Australasia and the Institute for Information Management to ensure their skills and knowledge remain current and relevant.
The table below outlines the number of employees who participated in corporate information management and recordkeeping training for 2019–20.

70
Training Course Number of employees trained
Total Recordkeeping Awareness Course (online) 758
EDRMS Basics (OurDocs) (Classroom inc MS Teams) 220
Objective (Online) 229
Objective (Classroom inc MS Teams) 70
One-on-One (OurDocs) Coaching 37
One-on-One (Objective) Coaching 46
Business Folder Owner (OurDocs) 60
E-Signatures 12
Industry training attended by IMS Branch 46
International Labour Organization Convention 81: Labour inspections Australia is a member nation of the International Labour Organization (ILO). The ILO is the peak international organisation responsible for setting international labour standards through the development and monitoring of international conventions and recommendations. The Australian Government ratified International Labour Organization Convention 81 - Labour inspections on 24 June 1975. Article 21 of Convention 81 requires certain information to be published in annual reports for each of the central inspection authorities.
In Western Australia, the department is the central authority responsible for conducting inspections for wages and conditions of employment, and workplace safety.
Relevant laws and regulations
The reporting in this section relates to inspection services delivered by the department during 2019–20 for:
‣ workplace safety under the Occupational Safety and Health Act 1984 (OSH Act), Mines Safety and Inspection Act 1994 (MS&I Act), Petroleum (Submerged Lands) Act 1982, Petroleum and Geothermal Energy Resources Act 1967, and Petroleum Pipelines Act 1969 (Petroleum Acts); and
‣ wages and conditions of employment under the Industrial Relations Act 1979 (IR Act).
Inspection staff
During 2019–20 , the department employed the full-time equivalent of 160 workplace safety inspectors and eight industrial relations inspectors.
Workplaces liable for inspection in WA
At the beginning of the reporting period the total number of businesses operating in WA was 232,967.
During 2019–20, a total of 1.35 million people were employed in WA.
It should be noted that workplaces covered by the Comcare system for workers’ compensation are subject to the Commonwealth’s work health and safety legislation, and are therefore outside of the jurisdiction of the State system for occupational safety and health.
It should also be that the WA industrial relations system applies only to unincorporated businesses and the State public sector. It is estimated that between one third and one fifth of WA employees are covered by the State system.
Inspections conducted
Inspections conducted during 2019–20 relating to workplace safety totalled 7982. Also during the period, 372 employer activities were inspected under the IR Act.

71
Type of inspection No. of inspections
Employers inspected under the IR Act 372
Sites inspected under the OSH Act 7224
Sites audits under the Petroleum Acts 15
Site inspections and audits under the MS&I Act 743
Inspection outcomes
During 2019–20, workplace safety enforcement proceedings resulted in 10 convictions. Fines imposed totalled $836,000.
Of the 372 employer inspections conducted under the Industrial Relations Act 1979, conducted, 616 separate breaches of awards, agreements or legislation were identified. Seven enforcement proceedings were finalised during the period, resulting in the recovery of $71,848 in employee entitlements and pecuniary penalties of $15,750.
Industrial accidents and occupational diseases
In WA, a lost time injury or disease (LTI/D) is defined as one day/shift lost or more. Unless specified otherwise, lost time injury and disease data are based on workers’ compensation claims for work-related injuries and diseases supplied by WorkCover WA that involve one or more days off work as a result of the work-related incident.
The LTI/D frequency and incidence rate are the principal measure of safety performance in WA, and are used to monitor performance against national targets.
‣ Frequency rate = number of LTI/Ds / number of hours worked x 1,000,000 ‣ Incidence rate = number of LTI/Ds / number of workers x 100
According to the most recent preliminary workers’ compensation claims data, work-related LTI/Ds in Western Australia recorded a 1.2 per cent reduction in frequency rate, from 7.30 LTI/Ds per one million hours worked in 2017–18 (revised data) to 7.21 in 2018–19 (preliminary data). The five-year trend (2014–15 to 2018–19) shows a reduction of 8.6 per cent.
There was a 1.1 per cent reduction in the incidence rate, from 1.23 LTI/Ds per one hundred employees in 2017–18 (revised data) to 1.21 in 2018–19 (preliminary data). The five-year trend (2014–15 to 2018–19) shows a 10.2 per cent reduction.
Note: The LTI/D figures have been rounded up to two decimal places.
Information on disease groups that are being monitored at a national level can be accessed on the Safe Work Australia website: www.safeworkaustralia.gov.au

DISCLOSURES & LEGAL COMPLIANCE | FINANCIAL AND NON-FINANCIAL PERFORMANCE
72
DISCLOSURES & LEGAL COMPLIANCE
FINANCIAL AND NON-FINANCIAL PERFORMANCE
Page 1 of 4

73
Auditor GeneralINDEPENDENT AUDITOR’S REPORT
To the Parliament of Western Australia
DEPARTMENT OF MINES, INDUSTRY REGULATION AND SAFETY
Report on the financial statements
OpinionI have audited the financial statements of the Department of Mines, Industry Regulation and Safety which comprise the Statement of Financial Position as at 30 June 2020, the Statement of Comprehensive Income, Statement of Changes in Equity, Statement of Cash Flows and Summary of Consolidated Account Appropriations for the year then ended, and Notes comprising a summary of significant accounting policies and other explanatory information, including administered transactions and balances.
In my opinion, the financial statements are based on proper accounts and present fairly, in all material respects, the operating results and cash flows of the Department of Mines, Industry Regulation and Safety for the year ended 30 June 2020 and the financial position at the end of that period. They are in accordance with Australian Accounting Standards, the Financial Management Act 2006 and the Treasurer’s Instructions.
Basis for opinionI conducted my audit in accordance with the Australian Auditing Standards. My responsibilities under those standards are further described in the Auditor’s Responsibility for the Audit of the Financial Statements section of my report. I am independent of the Department in accordance with the Auditor General Act 2006 and the relevant ethical requirements of the Accounting Professional and Ethical Standards Board’s APES 110 Code of Ethics for Professional Accountants (the Code) that are relevant to my audit of the financial statements. I have also fulfilled my other ethical responsibilities in accordance with the Code. I believe that the audit evidence I have obtained is sufficient and appropriate to provide a basis for my opinion.
Responsibility of the Director General for the financial statementsThe Director General is responsible for keeping proper accounts, and the preparation and fair presentation of the financial statements in accordance with Australian Accounting Standards, the Financial Management Act 2006 and the Treasurer’s Instructions, and for such internal control as the Director General determines is necessary to enable the preparation of financial statements that are free from material misstatement, whether due to fraud or error.
In preparing the financial statements, the Director General is responsible for assessing the entity’s ability to continue as a going concern, disclosing, as applicable, matters related to going concern and using the going concern basis of accounting unless the Western Australian Government has made policy or funding decisions affecting the continued existence of the Department.
Auditor’s responsibility for the audit of the financial statementsAs required by the Auditor General Act 2006, my responsibility is to express an opinion on the financial statements. The objectives of my audit are to obtain reasonable assurance about whether the financial statements as a whole are free from material misstatement, whether due to fraud or error, and to issue an auditor’s report that includes my opinion. Reasonable assurance is a high level of assurance, but is not a guarantee that an audit conducted in accordance with Australian Auditing Standards will always detect a material misstatement when it exists. Misstatements can arise from fraud or error and are considered material if, individually or in the aggregate, they could reasonably be expected to influence the economic decisions of users taken on the basis of the financial statements.
Page 1 of 4

DISCLOSURES & LEGAL COMPLIANCE | FINANCIAL AND NON-FINANCIAL PERFORMANCE
74
A further description of my responsibilities for the audit of the financial statements is located on the Auditing and Assurance Standards Board website at https://www.auasb.gov.au/auditors_responsibilities/ar4.pdf. This description forms part of my auditor’s report.
Report on controls
OpinionI have undertaken a reasonable assurance engagement on the design and implementation of controls exercised by the Department of Mines, Industry Regulation and Safety. The controls exercised by the Department are those policies and procedures established by the Director General to ensure that the receipt, expenditure and investment of money, the acquisition and disposal of property, and the incurring of liabilities have been in accordance with legislative provisions (the overall control objectives).
My opinion has been formed on the basis of the matters outlined in this report.
In my opinion, in all material respects, the controls exercised by the Department of Mines, Industry Regulation and Safety are sufficiently adequate to provide reasonable assurance that the receipt, expenditure and investment of money, the acquisition and disposal of property and the incurring of liabilities have been in accordance with legislative provisions during the year ended 30 June 2020.
The Director General’s responsibilitiesThe Director General is responsible for designing, implementing and maintaining controls to ensure that the receipt, expenditure and investment of money, the acquisition and disposal of property, and the incurring of liabilities are in accordance with the Financial Management Act 2006, the Treasurer’s Instructions and other relevant written law.
Auditor General’s responsibilitiesAs required by the Auditor General Act 2006, my responsibility as an assurance practitioner is to express an opinion on the suitability of the design of the controls to achieve the overall control objectives and the implementation of the controls as designed. I conducted my engagement in accordance with Standard on Assurance Engagements ASAE 3150 Assurance Engagements on Controls issued by the Australian Auditing and Assurance Standards Board. That standard requires that I comply with relevant ethical requirements and plan and perform my procedures to obtain reasonable assurance about whether, in all material respects, the controls are suitably designed to achieve the overall control objectives and were implemented as designed.
An assurance engagement to report on the design and implementation of controls involves performing procedures to obtain evidence about the suitability of the design of controls to achieve the overall control objectives and the implementation of those controls. The procedures selected depend on my judgement, including the assessment of the risks that controls are not suitably designed or implemented as designed. My procedures included testing the implementation of those controls that I consider necessary to achieve the overall control objectives.
I believe that the evidence I have obtained is sufficient and appropriate to provide a basis for my opinion.
Limitations of controlsBecause of the inherent limitations of any internal control structure, it is possible that, even if the controls are suitably designed and implemented as designed, once the controls are in operation, the overall control objectives may not be achieved so that fraud, error, or non-compliance with laws and regulations may occur and not be detected. Any projection of the outcome of the evaluation of the suitability of the design of controls to future periods is subject to the risk that the controls may become unsuitable because of changes in conditions.
Page 2 of 4 Page 3 of 4

75
Report on the key performance indicators
OpinionI have undertaken a reasonable assurance engagement on the key performance indicators of the Department of Mines, Industry Regulation and Safety for the year ended 30 June 2020. The key performance indicators are the Under Treasurer-approved key effectiveness indicators and key efficiency indicators that provide performance information about achieving outcomes and delivering services.
In my opinion, in all material respects, the key performance indicators of the Department of Mines, Industry Regulation and Safety are relevant and appropriate to assist users to assess the agency’s performance and fairly represent indicated performance for the year ended 30 June 2020.
Matter of SignificanceThe Department received an exemption from the Under Treasurer from reporting the following key performance indicators for the year ended 30 June 2020:
• Satisfaction with DMIRS as an effective resource sector regulator (KPI 1), and• Satisfaction with DMIRS as an effective industry regulator (KPI 3).
The exemption was approved because of the impacts of the COVID-19 pandemic on the Department’s data collection. The Department did not carry out its stakeholder satisfaction survey planned for April 2020 to reduce the administrative burden on the Department’s stakeholders facing a climate of restricted business activity. Consequently, these indicators have not been reported. My opinion is not modified in respect of this matter.
The Director General’s responsibility for the key performance indicatorsThe Director General is responsible for the preparation and fair presentation of the key performance indicators in accordance with the Financial Management Act 2006 and the Treasurer’s Instructions and for such internal control as the Director General determines necessary to enable the preparation of key performance indicators that are free from material misstatement, whether due to fraud or error.
In preparing the key performance indicators, the Director General is responsible for identifying key performance indicators that are relevant and appropriate, having regard to their purpose in accordance with Treasurer’s Instruction 904 Key Performance Indicators.
Auditor General’s responsibilityAs required by the Auditor General Act 2006, my responsibility as an assurance practitioner is to express an opinion on the key performance indicators. The objectives of my engagement are to obtain reasonable assurance about whether the key performance indicators are relevant and appropriate to assist users to assess the entity’s performance and whether the key performance indicators are free from material misstatement, whether due to fraud or error, and to issue an auditor’s report that includes my opinion. I conducted my engagement in accordance with Standard on Assurance Engagements ASAE 3000 Assurance Engagements Other than Audits or Reviews of Historical Financial Information issued by the Australian Auditing and Assurance Standards Board. That standard requires that I comply with relevant ethical requirements relating to assurance engagements.
An assurance engagement involves performing procedures to obtain evidence about the amounts and disclosures in the key performance indicators. It also involves evaluating the relevance and appropriateness of the key performance indicators against the criteria and guidance in Treasurer’s Instruction 904 for measuring the extent of outcome achievement and the efficiency of service delivery. The procedures selected depend on my judgement, including the assessment of the risks of material misstatement of the key performance indicators. In making these risk assessments I obtain an understanding of internal control relevant to the engagement in order to design procedures that are appropriate in the circumstances.
Page 3 of 4

DISCLOSURES & LEGAL COMPLIANCE | FINANCIAL AND NON-FINANCIAL PERFORMANCE
76
I believe that the evidence I have obtained is sufficient and appropriate to provide a basis for my opinion.
My independence and quality control relating to the reports on controls and key performance indicatorsI have complied with the independence requirements of the Auditor General Act 2006 and the relevant ethical requirements relating to assurance engagements. In accordance with ASQC 1 Quality Control for Firms that Perform Audits and Reviews of Financial Reports and Other Financial Information, and Other Assurance Engagements, the Office of the Auditor General maintains a comprehensive system of quality control including documented policies and procedures regarding compliance with ethical requirements, professional standards and applicable legal and regulatory requirements.
Matters relating to the electronic publication of the audited financial statements and key performance indicatorsThis auditor’s report relates to the financial statements and key performance indicators of the Department of Mines, Industry Regulation and Safety for the year ended 30 June 2020 included on the Department’s website. The Department’s management is responsible for the integrity of the Department’s website. This audit does not provide assurance on the integrity of the Department’s website. The auditor’s report refers only to the financial statements and key performance indicators described above. It does not provide an opinion on any other information which may have been hyperlinked to/from these financial statements or key performance indicators. If users of the financial statements and key performance indicators are concerned with the inherent risks arising from publication on a website, they are advised to contact the entity to confirm the information contained in the website version of the financial statements and key performance indicators.
CAROLINE SPENCERAUDITOR GENERALFOR WESTERN AUSTRALIAPerth, Western Australia September 2020
Page 4 of 4

7777
DISCLOSURES & LEGAL COMPLIANCE
KEY PERFORMANCE INDICATORS (KPI)

78
Audited key performance indicators
Certification of key performance indicators for the year ended 30 June 2020
I hereby certify that the key performance indicators are based on proper records, are relevant and appropriate for assisting users to assess the Department of Mines, Industry Regulation and Safety’s performance, and fairly represent the performance of the Department of Mines, Industry Regulation and Safety for the financial year ended 30 June 2020.
David Smith Accountable Authority 16 September 2020

79
Audited key performance indicators Outcome Based Management FrameworkThe department’s Outcome Based Management (OBM) framework was implemented as part of the 2018–19 Budget cycle process. The framework represents DMIRS strategic direction and aligns to government goals.
DMIRS has adopted an outward-facing, client-centric approach to the provision of our services. A public-facing service model, when considered in conjunction with a single, integrated outcome statement, is meaningful for external stakeholders as it represents those operational services most easily understood by the community and reflected in our name: resources, safety and industry regulation.
OutcomeSupporting a safe, fair and responsible future for the community, industry and resources sector.
Services ‣ Service 1 – Resources Advice and Regulation ‣ Service 2 – Safety Advice and Regulation ‣ Service 3 – Industry Advice and Regulation
Key Performance Indicators We use seven high-level indicators to measure our performance:
‣ Three effectiveness indicators to measure our achievement of the desired outcome; and
‣ Three efficiency and one cost effectiveness indicator to measure our three key services.
The 2019–20 results are compared to targets and previous years’ results, where they are available and appropriate. Results from previous years may be re-cast, to enable fair comparisons, and this is indicated in the notes related to each KPI.
The 2019–20 targets are those published in the 2019–20 State Government Budget Papers.
It should be noted that the cost effectiveness indicator used to measure Service 2 will change to an efficiency indicator in 2020–21, as approved by the Under Treasurer.

80
Key effectiveness indicatorsKey effectiveness indicators measure the extent to which our department achieves its outcome. We achieve our outcome by providing consistent transparent and timely advice and regulatory services to industry, community and government agencies. Services provided include licensing and other forms of legislated ‘approvals’, policy advice, targeted stakeholder information and engagement, compliance activities including inspections and investigations, and consumer advice.
Effectiveness as a resource sector regulator (KPI 1) and Effectiveness as an industry regulator (KPI 3)
To determine our influence in delivering effective regulation to support sustainable industry development an annual stakeholder satisfaction survey (survey) was introduced in 2018–19.
This survey was planned to be conducted during April/May 2020.
However, due to the COVID-19 emergency, it was not considered appropriate to conduct the survey during a period when many of our stakeholders were being adversely impacted by trading and social restrictions. An exemption from reporting the results of KPI 1 and 3 was approved by the Under Treasurer.
What we measure
Stakeholder satisfaction with our regulatory role is measured as part of a survey. The survey is usually sent to stakeholders who engaged with the resource advice and regulation, and/or industry advice and regulation services in the previous 12 months. This includes representatives from industry bodies, private firms, unions, community groups, individuals as well as government agencies including local governments.
How we measure
An online quantitative perception survey provides stakeholder feedback.
Respondents are asked to rate their level of satisfaction on a scale of 0–10. The percentage of respondents who gave a rating between six and ten is reported as overall satisfaction.
Our performance
An exemption was obtained and no survey was conducted during 2019–20. It is intended that such a survey will be conducted for 2020–21.
Work-related traumatic injury fatalities (KPI 2)
Safely returning home from work each day is a fundamental expectation we all share and the regulation of workplace safety is one of our primary functions.
This measure provides an overview of our efforts towards achieving its desired outcome by encouraging the establishment of safe and healthy workplaces and informed employers and employees.
The nature, frequency, location and circumstances surrounding fatalities can influence our regulatory efforts in terms of form and resources.
What we measure
The number of work-related traumatic injury fatalities reported to DMIRS annually under the following legislation:
‣ Dangerous Goods Safety Act 2004; ‣ Electricity Act 1945; ‣ Energy Safety Act 2006; ‣ Gas Standards Act 1972; ‣ Mines Safety and Inspection Act 1994; ‣ Occupational Safety and Health Act 1984; ‣ Petroleum (Submerged Lands) Act 1982; ‣ Petroleum and Geothermal Energy
Resources Act 1967; and ‣ Petroleum Pipelines Act 1969.
While reported work-related traumatic injury fatality numbers are relatively low, any work-related death is considered unacceptable. Therefore, the target for this indicator is set at zero (0).

81
How we measure
A work-related traumatic injury fatality will be included if:
‣ the fatality occurred (i.e. date the individual deceased) between 1 July and 30 June of the relevant financial year; and
‣ the fatality was work-related as determined by the Director of Investigations who, having weighed up all the evidence, is confident that the fatality is work-related. Such evidence would include, but not be limited to:
‣ coroner’s report; ‣ medical report; ‣ police report; and ‣ investigation report.
Due to the duration of any investigation into these fatalities, the work related status in any given year may be amended retrospectively(1). For detailed information on how a work-related traumatic injury fatality is determined by DMIRS please refer to “Recording of traumatic work-related fatalities by WorkSafe” on DMIRS’ website: commerce.wa.gov.au/ (search for work-related fatalities).
Our performance
15 from target 3 from 2018–19
During 2019–20 there were 15 confirmed work-related fatalities reported, comprising 13 investigated by the WorkSafe Directorate and two by the Mines Safety Directorate. By comparison, in 2018–19 there were 12 confirmed work-related traumatic injury fatalities, of which ten were investigated by the WorkSafe Directorate and two by the Mines Safety Directorate.
$206
2017-18
2019-20
2018-19
15
12
132017-18
2019-20
2018-19
$ Cost of resource regulation per live title
$1,000$0 $2,000 $3,000 $4,000 $5,000
Work-related traumatic injury fatalities
0Target
5 10 15
83%
96%
97%
% High Risk Work Licenses finalised within 14 days
20%0% 40% 60% 80% 100%
n/aTarget
$184
$185
$50$0 $100 $150 $200
100%Target
$4,768Target
10.49 : 1
11.71 : 1
11.58 : 1
Cost per work-related lost time injury and disease claims in relation to the cost of service
- 2 4 6 8 10 12
Target11.38 : 1
Cost per transaction to deliver Industry Advice and Regulation Service
2017-18
2019-20
2018-19
2017-18
2019-20
2018-19
2017-18
2019-20
2018-19
2017-18
2019-20
2018-19
2017-18
2019-20
2018-19
$4,692
$4,340
$4,172
Further information on work-related traumatic injury fatalities in WA.
The State of the Work Environment series is produced by the WorkSafe Directorate of DMIRS with the assistance of WorkCover WA, to provide awareness of occupational safety and health in Western Australia.
1 No change to previously reported results confirmed (2017–18 and 2018–19).

82
Key efficiency indicatorsKey efficiency indicators are a measure of the value for money we provide by achieving the appropriate balance of resource inputs to service outputs when delivering our services to the community. They demonstrate how efficiently we are conducting our activities and can be represented as an average cost per service or through a measure of timeliness.
Service 1: Resources Advice and Regulation – Average cost of resource regulation per live title (KPI 4)
This efficiency indicator measures our Resources Advice and Regulation Service – ensuring that the State’s natural resources are developed and managed responsibly through the provision of resources advice and regulatory services to the Western Australian community.
The resource sector plays a vital role in the State’s economy. Our role as a provider of advice and regulation services to the resources sector contributes to making Western Australia a ‘destination of choice’ for responsible resource exploration and development activities.
What we measure
The amount of resource development and exploration in the State is indicated by the number of ‘live’ resource titles (minerals and petroleum).
Resource development and exploration occurs in the context of the resource management ‘lifecycle’. Activities associated with the resource management ‘lifecycle’ include:
‣ pre-competitive work as per the geoscience and resource strategy;
‣ determination of applications for, and administering, minerals and petroleum tenures;
‣ management of resource tenures over the duration of their operation;
‣ resource, environmental and other technical and administrative compliance;
‣ decommissioning and rehabilitation; and ‣ administration of royalty payments based on
mineral and petroleum sales (commodity sales by industry).
All activities within this ‘lifecycle’ are associated with a mining title; the number and cost associated with regulating these titles comprise the basis for calculating this KPI.
The average cost per live title is an indicator of the efficiency with which DMIRS conducts its Resources Advice and Regulation activities.
How we measure
A ‘live title’ is defined as: a title (minerals and petroleum) giving the right to explore for, recover and develop Western Australia’s natural resources.
Live titles include those that:
‣ have been approved during the current year; ‣ are renewed during that year; or ‣ are subject to ongoing regulation by the department.
The average cost per active title is calculated by:
Our performance
Total cost of Resources Advice and Regulation Service
Number of live titles
$4,340q 9% less than target Consistent with
2018–19
The average cost per live title for 2019–20 is $4,340 which is lower than the target ($4,768). This is due largely to a reduction in the cost of the service and a modest increase in the number of titles.
$206
2017-18
2019-20
2018-19
15
12
132017-18
2019-20
2018-19
$ Cost of resource regulation per live title
$1,000$0 $2,000 $3,000 $4,000 $5,000
Work-related traumatic injury fatalities
0Target
5 10 15
83%
96%
97%
% High Risk Work Licenses finalised within 14 days
20%0% 40% 60% 80% 100%
n/aTarget
$184
$185
$50$0 $100 $150 $200
100%Target
$4,768Target
10.49 : 1
11.71 : 1
11.58 : 1
Cost per work-related lost time injury and disease claims in relation to the cost of service
- 2 4 6 8 10 12
Target11.38 : 1
Cost per transaction to deliver Industry Advice and Regulation Service
2017-18
2019-20
2018-19
2017-18
2019-20
2018-19
2017-18
2019-20
2018-19
2017-18
2019-20
2018-19
2017-18
2019-20
2018-19
$4,692
$4,340
$4,172

83
Service 2: Safety Advice and Regulation – Cost of work-related lost time injury and disease claims in relation to cost of service (KPI 5)
The Safety Advice and Regulation Service has a strong alignment to building safe and resilient communities through its provision of advice and regulatory services in the area of occupational safety and health. The service’s focus is on building capacity and changing behaviours through education, advice and regulation, thus contributing to improved workplace and general community safety and health. To measure the extent to which the department achieves safety advice and regulation, we have adopted the cost effectiveness indicator ‘Cost of work-related lost time injury and disease claims in relation to the cost of service’.
What we measure
This KPI measures the cost of the service compared to total value of work-related lost time injury and disease claims. Only events and people covered by the legislation administered by DMIRS are included. The result is presented as a ratio where the base or consequent is the cost of service.
How we measure
The total annual cost of compensable claim payments in Western Australia (WorkCover WA claims data) is divided by the total cost of the Safety, Advice and Regulation Service to produce a ratio. This illustrates the relationship between the cost of service and the annual cost to the community due to workplace injuries or disease i.e. for every dollar DMIRS spent regulating and educating within the sector, ‘x’ is spent on workers’ compensation.
Annual total cost of compensable injury and disease claims
Total cost of Safety Advice and Regulation Service
The target for this indicator was set using the calculated average across five years excluding the latest preliminary data for comparable injury and disease claim costs.
It should be noted that preliminary data is available approximately 12 months after the close of each reporting period, however this data considerably underestimates claim costs due to the shorter development time for claims at the point of extraction. Hence it is preferable to use the ‘revised
data’ from the prior reporting period to calculate the result, as it is more stable and less likely to undergo further substantial revision. This means there is a two-year lag in claims data used (i.e. 2017–18 claims data has been used with the 2019–20 cost of Service 2).
Our performance
10.49 : 1q 8% lower than the
target 11.38:1
q 10% lower
than 2018–19
For each dollar of expenditure by DMIRS on safety advice and regulation, $10.49 is distributed in lost time injury claims (by WorkCover). This result is within ± ten per cent of the target and ten per cent of the 2018–19 result (11.71:1).
Comment on results
The result was lower than the target of 11.38:1. The variation from target is driven by a slightly higher cost of the service (8%) than target due to a post budget decision by the Expenditure Review Committee (ERC) to increase WorkSafe resources and the treatment of lease accommodation expenses.
$206
2017-18
2019-20
2018-19
15
12
132017-18
2019-20
2018-19
$ Cost of resource regulation per live title
$1,000$0 $2,000 $3,000 $4,000 $5,000
Work-related traumatic injury fatalities
0Target
5 10 15
83%
96%
97%
% High Risk Work Licenses finalised within 14 days
20%0% 40% 60% 80% 100%
n/aTarget
$184
$185
$50$0 $100 $150 $200
100%Target
$4,768Target
10.49 : 1
11.71 : 1
11.58 : 1
Cost per work-related lost time injury and disease claims in relation to the cost of service
- 2 4 6 8 10 12
Target11.38 : 1
Cost per transaction to deliver Industry Advice and Regulation Service
2017-18
2019-20
2018-19
2017-18
2019-20
2018-19
2017-18
2019-20
2018-19
2017-18
2019-20
2018-19
2017-18
2019-20
2018-19
$4,692
$4,340
$4,172
2019–20 is the final year this cost effectiveness indicator will be reported.

84
Percentage of high-risk work licence applications determined within agreed timeframes (KPI 6)
A High Risk Work Licence (HRWL) is a nationally recognised licence required to undertake high risk work, such as operating a crane or erecting scaffolding. The licence is granted for each classification of high risk work to a person who has been trained and assessed as competent for a specific high risk occupational activity. High risk work licensing in Western Australia is performed by the legislated body WorkSafe.
HRWLs – newly issued, renewed, and modified comprise the majority of licences and registrations delivered by the Safety Advice and Regulation Service of DMIRS.
This measure demonstrates our capacity to effectively administer and enforce the primary step in safety regulation that supports a safe and responsible community.
What we measure
The number of HRWL applications finalised within 14 days for each new, modified, and renewed licence is calculated as a proportion of the total applications finalised during the same reporting period.
New, modified, and renewed HRWL applications are considered to be equivalent in workload but the volume within these categories varies so a weighted average by category is used to calculate the overall average.
How we measure
An average is calculated for each category by dividing the number of applications finalised within 14 calendar days by the total number of that category of applications finalised during the same period.
The average timeliness is then weighted by the per cent volume of that category for the same reporting period.
The weighted average for the three categories are combined, as demonstrated in this formula:
Total Average = (Ave New x W1) +
(Ave Modified x W2) + (Ave Renewed x W3) (1)
(1) Weighting by volume. W = W1 + W2 + W3 = 1
Our performance
83%q 17% less than target
q 13% less than 2018–19
The majority (83%) of HRWL applications were finalised within 14 days. The target is to finalise all HRWL applications within the 14-day timeframe.
$206
2017-18
2019-20
2018-19
15
12
132017-18
2019-20
2018-19
$ Cost of resource regulation per live title
$1,000$0 $2,000 $3,000 $4,000 $5,000
Work-related traumatic injury fatalities
0Target
5 10 15
83%
96%
97%
% High Risk Work Licenses finalised within 14 days
20%0% 40% 60% 80% 100%
n/aTarget
$184
$185
$50$0 $100 $150 $200
100%Target
$4,768Target
10.49 : 1
11.71 : 1
11.58 : 1
Cost per work-related lost time injury and disease claims in relation to the cost of service
- 2 4 6 8 10 12
Target11.38 : 1
Cost per transaction to deliver Industry Advice and Regulation Service
2017-18
2019-20
2018-19
2017-18
2019-20
2018-19
2017-18
2019-20
2018-19
2017-18
2019-20
2018-19
2017-18
2019-20
2018-19
$4,692
$4,340
$4,172
Comment on results
The level of performance fell short of the challenging 100% target.
Staff resourcing and procedural issues affected the timeliness of application processing early in 2019–20, and were quickly rectified. However, fluctuating resource levels and adapting to changed work practices as a result of our response to COVID-19 resulted in further delays in processing applications.
‣ Overall, 65,434 applications were processed in 2019–20, 16 per cent fewer than the 77,544 in 2018–19.
Further information on high risk work licensing is available on our website: commerce.wa.gov.au (search for high risk work licence)

85
Service 3: Industry Advice and Regulation – Average cost per transaction to deliver industry advice and regulation services (KPI 7)
This indicator measures the average cost per advice or regulatory service transaction provided to the community in the areas of the building and energy, consumer protection and labour relations.
The aim of the Industry Advice and Regulation Service is to find a balance between empowering the business user through education and advice, whilst minimising barriers for businesses to successfully and lawfully trade. This indicator is therefore indicative of the per-unit cost to provide a fair and responsible trading environment.
What we measure
While this indicator is highly aggregated overall, the underpinning elements have been determined by the individual business areas. By using a quantitative figure, we can determine the resource distribution and effort across the industry sector and type of transaction. For example an increase in investigation figures may indicate that a redistribution would be beneficial towards areas of education and advice.
How we measure
A transaction is defined for this indicator as: an action by DMIRS to provide a service or regulatory action to an external stakeholder, initiated by either party.
Actions include: community education and media services, addressing an enquiry, determination of an application, licence or registration, resolution of a complaint or conciliation, and finalisation of compliance actions such as an investigation, inspection, audit, and/or legal matter all of which are to only be counted once finalised (e.g. investigations are counted based on the date that the investigation was finalised).
Total cost of the Industry Advice and Regulation Service is divided by the number of transactions, as indicated in the following formula:
Total cost of Industry Advice and Regulation Service
Number of transactions
Our performance
$206 12% more than 2018–19
The target for this KPI was based on a methodology which has since been amended after the targets were published in 2019–20 State Government Budget, and therefore the 2019–20 result is not comparable to the target ($153). Some forms of transactions were added or removed from the measure. For example new activities were delivered as part of the State Government’s COVID-19 response.
$206
2017-18
2019-20
2018-19
15
12
132017-18
2019-20
2018-19
$ Cost of resource regulation per live title
$1,000$0 $2,000 $3,000 $4,000 $5,000
Work-related traumatic injury fatalities
0Target
5 10 15
83%
96%
97%
% High Risk Work Licenses finalised within 14 days
20%0% 40% 60% 80% 100%
n/aTarget
$184
$185
$50$0 $100 $150 $200
100%Target
$4,768Target
10.49 : 1
11.71 : 1
11.58 : 1
Cost per work-related lost time injury and disease claims in relation to the cost of service
- 2 4 6 8 10 12
Target11.38 : 1
Cost per transaction to deliver Industry Advice and Regulation Service
2017-18
2019-20
2018-19
2017-18
2019-20
2018-19
2017-18
2019-20
2018-19
2017-18
2019-20
2018-19
2017-18
2019-20
2018-19
$4,692
$4,340
$4,172
Comment on results
This efficiency indicator is highly aggregated. Many of the transaction categories included were affected by industry, community and our response to COVID-19. Some of our activities were paused, as they were deemed non-essential, while others increased in demand, such as our consumer advisory and conciliation services.
The average cost per transaction to deliver industry advice and regulation services was higher (12 per cent) than that recorded in 2018–19. This is driven by a higher cost of the service (9 per cent) and fewer transactions (2 per cent) than in the previous year.

86
DISCLOSURES & LEGAL COMPLIANCE
FINANCIAL

87
Financial StatementsCertification of Financial Statements
For the reporting period ended 30 June 2020
Department of Mines, Industry Regulation and Safety
The accompanying financial statements of the Department of Mines, Industry Regulation and Safety have been prepared in compliance with the provisions of the Financial Management Act 2006 from proper accounts and records to present fairly the financial transactions for the reporting period ended 30 June 2020 and the financial position as at 30 June 2020.
At the date of signing we are not aware of any circumstances which would render the particulars included in the financial statements misleading or inaccurate.
David Smith Ralph De GiorgioDirector General Chief Finance Officer16 September 2020 16 September 2020

88
Statement of comprehensive income For the year ended 30 June 2020
2020 2019Notes $000 $000
COST OF SERVICESExpensesEmployee benefits expense 2.1(a) 187,744 153,002Supplies and services 2.3 57,005 60,209Depreciation and amortisation expenses 4.1.1, 4.2.1, 4.3.1 5,225 5,112Finance costs 6.3 91 –Accommodation expenses 2.3 17,320 15,586Grants and subsidies 2.2 14,864 17,248Loss on disposal of non-current assets 3.6 316 5Other expenses 2.3 3,840 9,616Total cost of services 286,405 260,778
Revenue and IncomeRevenue User charges and fees 3.2 164,232 162,641Sales 3.2 69 110Interest revenue 3.3 3,075 6,343Commonwealth grants and contributions 3.4 83 134Other revenue 3.5 5,346 1,219Total Revenue 172,805 170,447
Total income other than income from State Government 172,805 170,447NET COST OF SERVICES 113,600 90,331
Income from State GovernmentService appropriation 3.1 136,410 123,006Services received free of charge 3.1 5,541 3,120State grants and subsidies 3.1 100 100Royalties for Regions Fund 3.1 209 5,224Total income from State Government 142,260 131,450SURPLUS/(DEFICIT) FOR THE PERIOD 28,660 41,119
OTHER COMPREHENSIVE INCOMEItems not reclassified subsequently to profit or lossChanges in asset revaluation surplus (569) (3,654)Total other comprehensive income (569) (3,654)TOTAL COMPREHENSIVE INCOME FOR THE PERIOD 28,091 37,465
The Statement of Comprehensive Income should be read in conjunction with the accompanying notes.

89
Statement of financial positionAs at 30 June 2020
2020Restated*
2019Notes $000 $000
ASSETSCurrent AssetsCash and cash equivalents 6.4 1,876 1,345 Restricted cash and cash equivalents 6.4 390,132 355,572 Receivables 5.1 17,473 19,884 Amounts receivable for services 5.2 914 3,816 Other current assets 5.3 2,402 2,264 Total Current Assets 412,797 382,881
Non-Current AssetsRestricted cash and cash equivalents 6.4 2,228 1,539 Amounts receivable for services 5.2 36,022 32,303 Property, plant and equipment 4.1 122,610 124,903 Right-of-use assets 4.2 3,236 –Intangible assets 4.3 3,054 4,361 Total Non-Current Assets 167,150 163,106 TOTAL ASSETS 579,947 545,987
LIABILITIESCurrent LiabilitiesPayables 5.4 9,638 10,723 Amounts due to the Treasurer 5.5 2,000 10,000 Revenue received in advance 5.6 22,069 24,240 Provisions 2.1.b 37,447 25,958 Lease liabilities 6.1 1,213 –Other current liabilities 5.7 1,512 1,240 Total Current Liabilities 73,879 72,161
Non-Current LiabilitiesPayables 5.4 538 1,684 Provisions 2.1.b 7,820 6,614 Lease liabilities 6.1 2,172 –Other non-current liabilities 5.7 5,344 4,916 Total Non-Current Liabilities 15,874 13,214 TOTAL LIABILITIES 89,753 85,375
NET ASSETS 490,194 460,612
EQUITY 8.10Contributed equity 235,636 234,145 Reserves 104,019 104,588 Accumulated surplus/(deficit) 150,539 121,879 TOTAL EQUITY 490,194 460,612
The Statement of Financial Position should be read in conjunction with the accompanying notes.* Restated 2019 balance – Please see note 5.6 ‘Revenue received in advance’ for further explanation.

90
Statement of changes in equityFor the year ended 30 June 2020
Contributed equity Reserves
Accumulatedsurplus/ (deficit)
Totalequity
Note $000 $000 $000 $000Balance at 1 July 2018 8.10 233,971 108,242 80,760 422,973
Surplus/(deficit) – – 41,119 41,119Other comprehensive income – (3,654) – (3,654)
Total comprehensive income for the period – (3,654) 41,119 37,465Transactions with owners in their capacity as owners:
Other contributions by owners 8.10 174 – – 174Total 174 – – 174Balance at 30 June 2019 234,145 104,588 121,879 460,612
Balance at 1 July 2019 8.10 234,145 104,588 121,879 460,612Surplus/(deficit) – – 28,660 28,660Other comprehensive income – (569) – (569)
Total comprehensive income for the period – (569) 28,660 28,091Transactions with owners in their capacity as owners:
Capital appropriations 1,491 – – 1,491Total 1,491 – – 1,491Balance at 30 June 2020 235,636 104,019 150,539 490,194
The Statement of Changes in Equity should be read in conjunction with the accompanying notes.

91
Statement of cash flowsFor the year ended 30 June 2020
2020 2019Note $000 $000
CASH FLOWS FROM STATE GOVERNMENTService appropriation 132,016 123,006Capital appropriations 1,491 –Holding account drawdown 3,577 1,887Royalties for Regions Fund 209 5,224Net cash provided by State Government 137,293 130,117
Utilised as follows:CASH FLOWS FROM OPERATING ACTIVITIESPaymentsEmployee benefits (170,067) (162,837)Supplies and services (47,569) (54,741)Accommodation (18,974) (16,986)Grants and subsidies (14,792) (17,248)Other payments (10,893) (6,875)GST payments on purchases (12,552) (10,263)ReceiptsSale of goods and services 99 147User charges and fees 160,277 169,536Grants and contributions 184 234GST receipts on user charges and fees 5,539 3,615GST receipts from taxation authority 7,064 6,340Other receipts 10,619 7,118Net cash (used in) operating activities (91,065) (81,960)
CASH FLOWS FROM INVESTING ACTIVITIESPaymentsPurchase of non-current physical assets (2,450) (4,461)ReceiptsProceeds from sale of non-current assets 2 5Net cash (used in) investing activities (2,448) (4,456)
CASH FLOWS FROM FINANCING ACTIVITIESPaymentsRepayment of borrowings (8,000) (15,330)Net cash provided by/(used in) financing activities (8,000) (15,330)
Net increase in cash and cash equivalents 35,780 28,371Cash and cash equivalents at the beginning of the period 358,456 330,085CASH AND CASH EQUIVALENTS AT THE END THE PERIOD 6.4 394,236 358,456
The Statement of Cash Flows should be read in conjunction with the accompanying notes.

92
Summary of consolidated account appropriationsFor the year ended 30 June 2020
2020 2020 2020Budget
EstimateSupplementary
FundingRevised Budget Actual Variance
$000 $000 $000 $000 $000Delivery of ServicesItem 86 Net amount appropriated to deliver services 108,435 10,571 119,006 119,006 –Service appropriation – Service to industry component 15,910 – 15,910 15,910 –Amount authorised by Other Statutes –
– Salaries and Allowances Act 1975 1,494 – 1,494 1,494 –Total appropriations provided to deliver services 125,839 10,571 136,410 136,410 –
CapitalCapital appropriations 8,403 (6,823) 1,580 1,491 (89)
Administered TransactionsItem 87 Administered grants, subsidies and other transfer payments 87,398 – 87,398 87,398 –Amount authorised by other statutes
– Petroleum (Submerged Lands) Act 1982 215 96 311 215 (96)Total administered transactions 87,613 96 87,709 87,613 (96)GRAND TOTAL 221,855 3,844 225,699 225,514 (185)
Capital ExpenditurePurchase of non-current physical assets – – – – –Repayment of borrowings – – – 8,000 8,000Adjustment for other funding sources 8,403 (6,823) 1,580 (6,509) (8,089)Adjustment for section 25 transfer of Capital appropriation – – – – –Capital appropriations 8,403 (6,823) 1,580 1,491 (89)
Adjustments comprise movements in cash balances and other accrual items such as receivables, payables and superannuation.

93
Summary of consolidated account appropriationsFor the year ended 30 June 2020
Details of Income EstimatesIncome disclosed as Administered Income
2020 2020 2020Budget
EstimateBudget
AdjustmentsRevised Budget Actual Variance
$000 $000 $000 $000 $000
RoyaltiesPetroleum – State 7,734 (49) 7,685 6,648 (1,037)Iron Ore 5,433,466 2,011,806 7,445,272 7,632,428 187,156Alumina 119,842 (14,831) 105,011 104,659 (352)Lithium 157,132 (103,230) 53,902 58,913 5,011Copper 81,060 (20,922) 60,138 59,140 (998)Nickel 76,551 869 77,420 77,624 204Gold 343,574 56,545 400,119 388,487 (11,632)Other 155,369 (32,691) 122,678 121,913 (765)Lease rentals 105,154 8,622 113,776 114,888 1,112Total Royalties 6,479,882 1,906,119 8,386,001 8,564,700 178,699
Regulatory FeesRegulatory Fees and Fines 254 – 254 175 (79)
254 – 254 175 (79)
Special Purpose AccountsHome Indemnity Insurance 28,732 (3,839) 24,893 22,244 (2,649)Rental Accommodation Account 7,499 (1,939) 5,560 5,288 (272)
36,231 (5,778) 30,453 27,532 (2,921)OtherAppropriations 87,613 – 87,613 87,613 –Commonwealth Grants – 4,218 4,218 4,374 156Other Revenue 290 – 290 576 286GRAND TOTAL 6,604,270 1,904,559 8,508,829 8,684,970 176,141
Adjustment comprise movements in cash balances and other accrual items such as receivables, payables and superannuation.
Note 9.1 ‘Disclosure of administered income and expenses by service’ and Note 9.2 ‘Explanatory statement for Administered Items’ provides details of any significant variations between estimates and actual results for 2020 and between the actual results for 2020 and 2019.

94
NOTES TO THE FINANCIAL STATEMENTS
Notes to the financial statements
1. Basis of preparationThe department is a WA Government entity and is controlled by the State of Western Australia, which is the ultimate parent. The department is a not–for–profit entity (as profit is not its principal objective).
A description of the nature of its operations and its principal activities have been included in the ‘Overview’ which does not form part of these financial statements.
These annual financial statements were authorised for issue by the Director General of the department on 16 September 2020.
Statement of ComplianceThese general purpose financial statements have been prepared in accordance with:1. The Financial Management Act 2006 (FMA)
2. The Treasurer’s Instructions (TI’s)
3. Australian Accounting Standards (AASs) – Reduced Disclosure Requirements
4. Where appropriate, those AAS paragraphs applicable for not-for-profit entities have been applied.
The Financial Management Act 2006 and the Treasurer’s Instructions take precedence over AASs. Several AASs are modified by TI’s to vary application, disclosure format and wording. Where modification is required and has had a material or significant effect upon the reported results, details of that modification and the resulting financial effect are disclosed in the notes to the financial statements.Basis of preparationThese financial statements are presented in Australian dollars applying the accrual basis of accounting and using the historical cost convention. Certain balances will apply a different measurement basis (such as the fair value basis). Where this is the case the different measurement basis is disclosed in the associated note. All values are rounded to the nearest thousand dollars ($’000).
Judgement and estimatesJudgements, estimates and assumptions are required to be made about financial information being presented. The significant judgements and estimates made in the preparation of these financial statements are disclosed in the notes where amounts affected by those judgements and/or estimates are disclosed. Estimates and associated assumptions are based on professional judgements derived from historical experience and various other factors that are believed to be reasonable under the circumstances.
Contributed EquityAASB Interpretation 1038 Contributions by Owners Made to Wholly–Owned Public Sector Entities requires transfers in the nature of equity contributions, other than as a result of a restructure of administrative arrangements, to be designated by the Government (the owner) as contributions by owners (at the time of, or prior, to transfer) before such transfers can be recognised as equity contributions. Capital appropriations have been designated as contributions by owners by TI 955 Contributions by Owners made to Wholly–Owned Public Sector Entities and have been credited directly to Contributed Equity.
2.Use of our fundingExpenses incurred in the delivery of servicesThis section provides additional information about how the department’s funding is applied and the accounting policies that are relevant for an understanding of the items recognised in the financial statements. The primary expenses incurred by the department in achieving its objectives and the relevant notes are:
2020 2019Notes $000 $000
Employee benefits expenses 2.1 (a) 187,744 153,002Employee benefits provisions 2.1 (b) 45,267 32,572Grants and subsidies 2.2 14,864 17,248Other expenditure 2.3 78,165 85,411
2.1(a) Employee benefits expenses
Employee benefits 171,480 138,441Termination benefits 902 168Superannuation – defined contribution plans (a) 15,362 14,393Total employee benefits expenses 187,744 153,002Add: AASB 16 Non–monetary benefits 1,683 –Less: Employee Contributions (451) –
188,976 153,002

95
NOTES TO THE FINANCIAL STATEMENTS
(a) Defined contribution plans include West State Superannuation Scheme (WSS), Gold State Superannuation Scheme (GSS), Government Employees Superannuation Board Schemes (GESBs) and other eligible funds.
Employee benefits: Include wages, salaries and social contributions, accrued and paid leave entitlements and paid sick leave, profit–sharing and bonuses; and non–monetary benefits (such as medical care, housing, cars and free or subsidised goods or services) for employees.
Termination benefits: Payable when employment is terminated before normal retirement date, or when an employee accepts an offer of benefits in exchange for the termination of employment. Termination benefits are recognised when the department is demonstrably committed to terminating the employment of current employees according to a detailed formal plan without possibility of withdrawal or providing termination benefits as a result of an offer made to encourage voluntary redundancy. Benefits falling due more than 12 months after the end of the reporting period are discounted to present value.
Superannuation: The amount recognised in profit or loss of the Statement of Comprehensive Income comprises employer contributions paid to the GSS (concurrent contributions), the WSS, the GESBs, or other superannuation funds. The employer contribution paid to the Government Employees Superannuation Board (GESB) in respect of the GSS is paid back into the Consolidated Account by the GESB.
AASB 16 Non–monetary benefits: Non–monetary employee benefits, that are employee benefits expenses, predominately relate to the provision of vehicle and housing benefits are measured at the cost incurred by the department.
2.1(b) Employee related provisionsProvision is made for benefits accruing to employees in respect of wages and salaries, annual leave and long service leave for services rendered up to the reporting date and recorded as an expense during the period the services are delivered.
2020 2019$000 $000
CurrentEmployee benefits provisionsAnnual leave (a) 17,026 7,716Long service leave (b) 19,758 17,754Deferred salary scheme (c) 236 265Purchased leave (d) 197 85
37,217 25,820
Other provisionsEmployment on-costs (e) 230 138Total current employee benefits provisions 37,447 25,958
Non-currentEmployee benefits provisionsLong service leave (b) 7,772 6,579
Other provisionsEmployment on-costs (e) 48 35Total non-current employee benefits provisions 7,820 6,614Total employee benefits provisions 45,267 32,572
(a) Annual leave liabilities: Classified as current as there is no unconditional right to defer settlement for at least 12 months after the end of the reporting period. Assessments indicate that actual settlement of the liabilities is expected to occur as follows:
2020 2019$000 $000
Within 12 months of the end of the reporting period 11,745 5,246More than 12 months after the end of the reporting period 5,281 2,470
17,026 7,716
The provision for annual leave is calculated at the present value of expected payments to be made in relation to services provided by employees up to the reporting date.

96
NOTES TO THE FINANCIAL STATEMENTS
(b) Long service leave liabilities: Unconditional long service leave provisions are classified as current liabilities as the department does not have an unconditional right to defer settlement of the liability for at least 12 months after the end of the reporting period.
Pre-conditional and conditional long service leave provisions are classified as non-current liabilities because the department has an unconditional right to defer the settlement of the liability until the employee has completed the requisite years of service.
Assessments indicate that actual settlement of the liabilities is expected to occur as follows:2020 2019$000 $000
Within 12 months of the end of the reporting period 7,151 6,601More than 12 months after the end of the reporting period 20,379 17,733
27,530 24,334
The provision for the long service leave is calculated at present value as the department does not expect to wholly settle the amounts within 12 months. The present value is measured taking into account the present value of expected future payments to be made in relation to services provided by employees up to the reporting date. These payments are estimated using the remuneration rate expected to apply at the time of settlement, discounted using market yields at the end of the reporting period on national government bonds with terms to maturity that match, as closely as possible, the estimated future cash outflows.
(c) Deferred salary scheme liabilities: Classified as current where there is no unconditional right to defer settlement for at least 12 months after the end of the reporting period.
2020 2019$000 $000
More than 12 months after the end of the reporting period 236 265236 265
(d) Purchased leave liabilities: are classified as current where there is no unconditional right to defer settlement for at least 12 months after the end of the reporting period. Actual settlement of the liabilities is expected to occur as follows:
2020 2019$000 $000
Within 12 months of the end of the reporting period 197 85197 85
(e) Employment on-costs: The settlement of annual and long service leave liabilities gives rise to the payment of employment on-costs including workers’ compensation insurance. The provision is the present value of expected future payments.
Employment on-costs, including workers’ compensation insurance, are not employee benefits and are recognised separately as liabilities and expenses when the employment to which they relate has occurred. Employment on-costs are included as part of Other expenses, Note 2.3 (apart from the unwinding of the discount (finance cost)) and are not included as part of the departments ‘employee benefits expense’. The related liability is included in ‘Employment on-costs provision’.
2020 2019$000 $000
Employment on-costs provisionCarrying amount at the start of period 174 147 Additional provisions recognised 294 204 Payments/other sacrifices of economic benefits (190) (177)Carrying amount at end of period 278 174
Key sources of estimation uncertainty – long service leave
Key estimates and assumptions concerning the future are based on historical experience and various other factors that have a significant risk of causing a material adjustment to the carrying amount of assets and liabilities within the next financial year.
Several estimates and assumptions are used in calculating the department’s long service leave provision. These include:
‣ Expected future salary rates ‣ Discount rates ‣ Employee retention rates; and ‣ Expected future payments
Changes in these estimations and assumptions may impact on the carrying amount of the long service leave provision. Any gain or loss following revaluation of the present value of long service leave liabilities is recognised as employee benefits expense.

97
NOTES TO THE FINANCIAL STATEMENTS
2.2 Grants and subsidies2020 2019$000 $000
RecurrentCo-Funded Drilling Scheme (Exploration Incentive Scheme) 4,654 5,490 Mineral Research Institute of WA (MRIWA) 655 2,550 Farmsafe WA 70 70 Asbestos Diseases Society 100 100 Employment Law Centre Western Australia 330 395 Property Industry Grants 6,887 6,476 Australian Building Codes Board 649 580 Building Commission – 100 Other Miscellaneous Grants – contributions to Commonwealth and others 1,519 1,487 Total grants and subsidies 14,864 17,248
Grants and subsidies
Transactions in which the department provides goods, services, assets or labour to another party without receiving approximately equal value in return are categorised as ‘Grant expenses’. Grants can either be operating or capital in nature.
Grants can be paid as general purpose grants which refer to grants that are not subject to conditions regarding their use. Alternatively, they may be paid as specific purpose grants which are paid for a particular purpose and/or have conditions attached regarding their use.
Grants and other transfers to third parties (other than contribution to owners) are recognised as an expense in the reporting period in which they are paid or payable. They include transactions such as: grants, subsidies, personal benefit payments made in cash to individuals, other transfer payments made to public sector agencies, local government, non-government schools, and community groups.
2.3 Other expenditure2020 2019$000 $000
Supplies and servicesConsultants and contractors 38,660 41,031Advertising and promotion 725 710Travel 1,475 1,862Communication 952 975Consumables 1,974 2,161Maintenance 849 1,130Insurance 704 727Lease rent and hire costs 2,302 2,983Utilities 1,260 1,291Other 8,104 7,339Total supplies and services expenses 57,005 60,209
Accommodation expensesRental (a) 14,149 13,089Repairs and maintenance 2,221 1,415Cleaning 950 1,082Total accommodation expenses 17,320 15,586
Other expensesAudit Fees 414 588Doubtful debts expense 847 –Employment On Costs 103 27Industry Fidelity claims 1,325 3,390Minor Plant and Equipment 1,442 2,115Refunds of prior years revenues 52 46Other expenses (343) 3,450Total other expenses 3,840 9,616
Total other expenditure 78,165 85,411

98
NOTES TO THE FINANCIAL STATEMENTS
Supplies and services expenses are recognised as an expense in the reporting period in which they are incurred. The carrying amounts of any materials held for distribution are expensed when the materials are distributed.
Accommodation expenses:
(a) Rental Expenses include:
i) Short-term leases with a lease term of 12 months or less;ii) Low-value leases with an underlying value of $5,000 or less; andiii) Variable lease payments, recognised in the periods in which the event or condition that triggers those payments occurs.
Repairs, maintenance and cleaning costs are recognised as expenses as incurred.
Other operating expenses generally represent the day-to-day running costs incurred in normal operations.
Audit Fees: an expense is recognised for external audit services received during the 2019–20 reporting period.
Doubtful debts expense was recognised as the movement in the allowance for doubtful debts. From 2019–20, expected credit losses expense is recognised as the movement in the allowance for expected credit losses. The allowance for expected credit losses of trade receivables is measured at the lifetime expected credit losses at each reporting date. The department has established a provision matrix that is based on its historical credit loss experience, adjusted for forward-looking factors specific to the debtors and the economic environment. Refer to note 5.1 Movement in the allowance for impairment of receivables.
Employee on-cost includes workers’ compensation insurance and other employment on-costs. The on costs liability associated with the recognition of annual and long service leave liabilities is included at Note 2.1(a) Employee benefit provision. Superannuation contributions accrued as part of the provision for leave are employee benefits and are not included in employment on-costs.
Industry Fidelity Claims are paid as a reimbursement to people who suffer pecuniary or property loss through defalcation by a licensee or employee of a real estate agent or settlement agent.
Minor Plant and Equipment: items identified as portable and attractable that do not meet the criteria of an asset are expensed in the year the item is acquired.
Other Expenses: this includes items recorded as prior period expenses and various other minor other miscellaneous expense items.
3. Our funding sourcesHow we obtain our fundingThis section provides additional information about how the department obtains its funding and the relevant accounting policy notes that govern the recognition and measurement of this funding. The primary income received by the department and the relevant notes are:
2020 2019Notes $000 $000
Income from State Government 3.1 142,260 131,450User charges and fees and sales 3.2 164,301 162,751Interest revenue 3.3 3,075 6,343Commonwealth grants and contributions 3.4 83 134Other revenue 3.5 5,346 1,219Gains/(Losses) 3.6 (316) (5)
3.1 Income from State Government2020 2019$000 $000
Appropriation received during the period:Service appropriation (a) 136,410 123,006
136,410 123,006
Services received free of charge from other State government agencies during the period:State Solicitors Office– legal services 2,770 1,762Department of Treasury and Finance – procurement and accommodation services 640 607Landgate– land dealings, land information, valuation services and products 2,104 740Department of Primary Industries and Regional Development– to support the Accountable Authority of the Commission to fulfill its statutory obligations 27 11Total services received 5,541 3,120

99
NOTES TO THE FINANCIAL STATEMENTS
2020 2019$000 $000
State grants and subsidies – Specific Purpose 100 100 100 100Royalties for Regions Fund:District allowance 209 224Royalties for Regions funding agreement (b) – 5,000Total Royalties for Regions Fund 209 5,224Total Income from State Government 142,260 131,450
(a) Service Appropriations are recognised as income at the fair value of consideration received in the period in which the department gains control of the appropriated funds. The department gains control of appropriated funds at the time those funds are deposited in the bank account or credited to the ‘Amounts receivable for services’ (holding account) held at Treasury.
Service appropriations fund the net cost of services delivered (as set out in note 3.1). Appropriation revenue comprises the following: ‣ Cash component; and ‣ A receivable (asset).
(b) The Regional Infrastructure and Headworks Account, funding agreement and, Regional Community Services Accounts are sub-funds within the over-arching ‘Royalties for Regions Fund’. The recurrent funds are committed to projects and programs in WA regional areas and are recognised as revenue when the department gains control on receipt of the funds.
The application of AASB 15 and AASB 1058 from July 1 2019 has had no impact on the treatment of income from State Government.
3.2 User fees and charges and Sales2020 2019$000 $000
User fees and chargesPetroleum annual licenses 4,237 4,407Mining, prospecting and exploration licenses 9,098 6,837Explosives and dangerous goods licenses and fees 7,431 6,683Mining Safety Levy 44,631 41,709Petroleum Safety 4,299 4,352Mining Rehabilitation Fund 33,371 30,608WorkSafe 5,530 6,944EnergySafety 14,375 15,834Motor Vehicle Dealers and Repairers 2,238 2,340Consumer Protection 8,560 14,153Building Commission 24,192 21,482Rental Accommodation Account 5,427 5,329Other fees 843 1,963Total User Fees and Charges 164,232 162,641
SalesGeneral Sales 69 110Total Sales 69 110Total User fees and charges and Sales 164,301 162,751
User fees and chargesUntil June 30 2019, revenue was recognised and measured at the fair value of consideration received or receivable.
From July 1 2019, revenue is recognised at the transaction price when the department transfers control of the services to customers. Revenue is recognised for the major activities as follows:
Revenue is recognised at a point in time for user fees and charges. The performance obligations for these user fees and charges are satisfied when services have been provided to the customer.
Revenue is recognised by reference to the stage of completion of the transaction for relevant services.
Sales Up to June 30 2019, revenue was recognised from the sale of goods when the significant risks and rewards of ownership transfer to the purchaser and can be measured reliably.
From July 1 2019, revenue is recognised at the transaction price when the department transers control of the goods to customers.

100
NOTES TO THE FINANCIAL STATEMENTS
3.3 Interest revenue2020 2019$000 $000
Mining Rehabilitation Fund Interest 1,644 3,094Other Interest Revenue 1,431 3,249Total interest revenue 3,075 6,343
3.4 Commonwealth grants and contributions2020 2019$000 $000
Other funding contributions 83 134
Until June 30 2019 Income from Commonwealth grants is recognised at fair value when the grant is receivable.
From July 1 2019 Current grants are recognised as income when the grants are receivable.
3.5 Other Revenue2020 2019$000 $000
Miscellaneous revenue 3,141 –Other Revenue – Recoups 2,205 1,219
5,346 1,219
3.6 Gains/(Losses) on Disposal2020 2019$000 $000
Net proceeds from disposal of non-current assets (316) (5)
Realised and unrealised gains are usually recognised on a net basis. These include gains arising on the disposal of non-current assets.
Gains and losses on the disposal of non-current assets are presented by deducting from the proceeds on disposal of the carrying amount of the asset and related selling expenses. Gains and losses are recognised in the profit or loss in the statement of comprehensive income.
4. Key assetsAssets the Department utilises for economic benefit or service potential
This section includes information regarding the key assets the department utilises to gain economic benefits or provide service potential. This section sets out both the key accounting policies and financial information about the performance of these assets:
2020 2019Notes $000 $000
Property, plant and equipment 4.1 122,610 124,903Right-of-use assets 4.2 3,236 –Intangibles 4.3 3,054 4,361Total key assets 128,900 129,264

101
NOTES TO THE FINANCIAL STATEMENTS
4.1 Property, plant and equipment
Year ended 30 June 2020
Land Buildings Leasehold Improvements
Furniture, plant,
equipment and vehicles
Computer hardware and
software
Scientific equipment Total
$000 $000 $000 $000 $000 $000 $000At June 30 2019Opening net book amount 71,164 46,884 731 5,604 341 179 124,903
1 July 2019Gross Carrying Amount 71,164 46,886 1,068 13,519 10,387 446 143,470Accumulated Depreciation – (2) (337) (7,915) (10,046) (267) (18,567)Carrying amount at start of period 71,164 46,884 731 5,604 341 179 124,903Additions 325 – – 175 26 144 670Revaluation increments/(decrements) (a) (429) (140) – – – – (569)Transfers from work in progress – – – – – – –Other Disposals – – – (286) – (2) (288)Depreciation – (1,021) (107) (632) (291) (55) (2,106)Carrying amount at 30 June 2020 71,060 45,723 624 4,861 76 266 122,610Gross carrying amount 71,060 46,358 1,068 12,542 10,371 579 141,978Accumulated depreciation – (635) (444) (7,681) (10,295) (313) (19,368)Accumulated impairment loss – – – – – – –
(a) Recognised in the Statement of Comprehensive Income. Where an asset measured at cost is written-down to recoverable amount, an impairment loss is recognised in profit or loss. Where a previously revalued asset is written down to recoverable amount, the loss is recognised as a revaluation decrement in other comprehensive income.
The Department of Planning, Lands and Heritage (DPLH) is the only department with the power to sell Crown land. The land is transferred to DPLH for sale and the agency accounts for the transfer as a distribution to owner.
Initial recognitionItems of property, plant and equipment, costing $5,000 or more are measured initially at cost. Where an asset is acquired for no cost or significantly less than fair value, the cost is valued at its fair value at the date of acquisition. Items of property, plant and equipment costing less than $5,000 are immediately expensed direct to the Statement of Comprehensive Income (other than where they form part of a group of similar items which are significant in total).
Assets transferred as part of a machinery of government change are transferred at their fair value.
The cost of a leasehold improvement is capitalised and depreciated over the shorter of the remaining term of the lease or the estimated useful life of the leasehold improvement.
Subsequent measurementSubsequent to initial recognition of an asset, the revaluation model is used for the measurement of:
‣ land; and ‣ buildings
Land is carried at fair value.
Buildings are carried at fair value less accumulated depreciation and accumulated impairment losses.
All other property, plant and equipment are stated at historical cost less accumulated depreciation and accumulated impairment losses.
Land and buildings are independently valued annually by the Western Australian Land Information Authority (Valuations and Property Analytics) and recognised annually to ensure that the carrying amount does not differ materially from the asset’s fair value at the end of the reporting period.
Land and buildings were revalued as at 1 July 2019 by the Western Australian Land Information Authority (Valuations and Property Analytics). The valuations were performed during the year ended 30 June 2020 and recognised at 30 June 2020. In undertaking the revaluation, fair value was determined by reference to market values for land: $36,208,000 (2019: $36,206,000) and buildings: $27,785,000 (2019: $27,785,000). For the remaining balance, fair value of buildings was determined on the basis of current replacement cost and fair value of land was determined on the basis of comparison with market evidence for land with low level utility (high restricted use land).
Revaluation model:
1. Fair Value where market-based evidence is available:
The fair value of land and buildings is determined on the basis of current market values determined by reference to recent market transactions.

102
NOTES TO THE FINANCIAL STATEMENTS
When buildings are revalued by reference to recent market transactions, the accumulated depreciation is eliminated against the gross carrying amount of the asset and the net amount restated to the revalued amount.
2. Fair value in the absence of market-based evidence:
Buildings are specialised or where land is restricted: Fair value of land and buildings is determined on the basis of existing use.
Existing use buildings: Fair value is determined by reference to the cost of replacing the remaining future economic benefits embodied in the asset, i.e. the current replacement cost. Where the fair value of buildings is determined on the current replacement cost basis, the gross carrying amount and the accumulated depreciation are restated proportionately with the change in the carrying amount of the asset.
Restricted use land: air value is determined by comparison with market evidence for land with similar approximate utility (high restricted use land) or market value of comparable unrestricted land (low restricted use land).
Significant assumptions and judgements: The most significant assumptions and judgements in estimating fair value are made in assessing whether to apply the existing use basis to assets and in determining estimated economic life. Professional judgement by the valuer is required where the evidence does not provide a clear distinction between market type assets and existing use assets.
4.1.1 Depreciation and impairmentCharge for the period
2020 2019Notes $000 $000
DepreciationBuildings 4.1 1,021 1,191Leasehold Improvements 4.1 107 126Furniture, plant, equipment and vehicles 4.1 632 855Computer hardware and software 4.1 291 811Scientific equipment 4.1 55 54Total depreciation for the period 2,106 3,037
As of 30 June 2020 there were no indications of impairment to property, plant and equipment.
All surplus assets at 30 June 2020 have either been classified as assets held for sale or have been written-off.
Finite useful livesAll property, plant and equipment having a limited useful life are systematically depreciated over their estimated useful lives in a manner that reflects the consumption of their future economic benefits. The exceptions to this rule include assets held for sale, and land.
Depreciation is generally calculated on a straight line basis, at rates that allocate the asset’s value, less any estimated residual value, over its estimated useful life. Typical estimated useful lives for the different asset classes for current and prior years are included in the table below:
Asset Useful Life: yearsBuildings 33 to 50 yearsLease Improvements 10 yearsFurniture 5 to 10 yearsOffice Equipment 3 to 5 yearsComputer Servers 3 yearsSoftware (a) 3 to 5 yearsScientific Equipment 7 yearsMotor Vehicles 3 to 5 yearsPlant and Equipment 5 to 25 years
(a) Software that is integral to the operation of related hardware.
The estimated useful lives, residual values and depreciation method are reviewed at the end of each annual reporting period, and adjustments should be made where appropriate.
Leasehold improvements are depreciated over the shorter of the lease term and their useful lives.
Land, which is considered to have an indefinite life, is not depreciated. Depreciation is not recognised in respect of these assets because their service potential has not, in any material sense, been consumed during the reporting period.
ImpairmentNon-financial assets, including items of property, plant and equipment and intangibles are tested for impairment whenever there is an indication that the asset may be impaired. Where there is an indication of impairment, the recoverable amount is estimated. Where the recoverable amount is less than the carrying amount, the asset is considered impaired and is written down to the recoverable amount and an impairment loss is recognised.
Where an asset measured at cost is written down to its recoverable amount, an impairment loss is recognised through profit or loss. Where a previously revalued asset is written down to its recoverable amount, the loss is recognised as a revaluation decrement through other comprehensive income.

103
NOTES TO THE FINANCIAL STATEMENTS
As the department is a not-for-profit entity, the recoverable amount of regularly revalued specialised assets is anticipated to be materially the same as fair value.
If there is an indication that there has been a reversal in impairment, the carrying amount shall be increased to its recoverable amount. However this reversal should not increase the asset’s carrying amount above what would have been determined, net of depreciation or amortisation, if no impairment loss had been recognised in prior years.
The risk of impairment is generally limited to circumstances where an asset’s depreciation is materially understated, where the replacement cost is falling or where there is a significant change in useful life. Each relevant class of assets is reviewed annually to verify that the accumulated depreciation/amortisation reflects the level of consumption or expiration of the asset’s future economic benefits and to evaluate any impairment risk from declining replacement costs.
4.2 Right-of-use assets2020 2019
Right-of-use assets Notes $000 $000Vehicles 2,946 –Government Regional Officers Housing 290 –
3,236 –
Additions to right-of-use assets during the 2020 financial year were $877,221.
Initial recognition
Right-of-use assets are measured at cost including the following:
‣ the amount of the initial measurement of lease liability ‣ any lease payments made at or before the commencement date less any lease incentives received ‣ any initial direct costs; and ‣ restoration costs, including dismantling and removing the underlying asset.
This includes all leased assets other than investment property ROU assets, which are measured in accordance with AASB 140 ‘Investment Property’.
The department has elected not to recognise right-of-use assets and lease liabilities for short-term leases (with a lease term of 12 months or less) and low value leases (with an underlying value of $5,000 or less). Lease payments associated with these leases are expensed over a straight-line basis over the lease term.
Subsequent measurement
The cost model is applied for subsequent measurement of right-of-use assets, requiring the asset to be carried at cost less any accumulated depreciation and accumulated impairment losses and adjusted for any re-measurement of lease liability.
Depreciation and impairment of right-of-use assets
Right-of-use assets are depreciated on a straight-line basis over the shorter of the lease term and the estimated useful lives of the underlying assets.
If ownership of the leased asset transfers to the department at the end of the lease term or the cost reflects the exercise of a purchase option, depreciation is calculated using the estimated useful life of the asset.
Right-of-use assets are tested for impairment when an indication of impairment is identified. The policy in connection with testing for impairment is outlined in note 4.1.1.
The following amounts relating to leases have been recognised in the statement of comprehensive income:
2020 2019$000 $000
Vehicles 1,324 –Government Regional Officers Housing 267 –Total right-of-use asset depreciation 1,592 –Lease interest expense 91 –
The total cash outflow for leases in 2020 was $1,591,111.
The department has leases for vehicles, office and residential accommodations.
The department has also entered into a Memorandum of Understanding Agreements (MOU) with the Department of Finance for the leasing of office accommodation which is considered out of scope. As such this is accounted for as an expense as incurred.
Up to 30 June 2019, the Agency classified leases as either finance leases or operating leases. From 1 July 2019, at 1 July 2019, the Agency recognises leases as right-of-use assets and associated lease liabilities in the Statement of Financial Position.
The corresponding lease liabilities in relation to these right-of-use assets have been disclosed in note 6.1.

104
NOTES TO THE FINANCIAL STATEMENTS
4.3 Intangible assets
Year ended 30 June 2020
Software in Progress
$000Licences
$000
Computer Software
$000Total $000
1 July 2019Gross carrying amount 211 – 25,589 25,800Accumulated amortisation – – (21,439) (21,439)Carrying amount at start of period 211 – 4,150 4,361
Additions – – 250 250Transfer completed software (211) – 211 –Reclassification – – – –Impairment losses – – – –Asset write down – – (30) (30)Amortisation expense – – (1,527) (1,527)Carrying amount at 30 June 2020 – – 3,054 3,054
Initial recognition
Intangible assets are initially recognised at cost. For assets acquired at no cost or for nominal cost, the cost is their fair value at the date of acquisition.
An internally generated intangible asset arising from development (or from the development phase of an internal project) is recognised if, and only if, all of the following are demonstrated:
(a) The technical feasibility of completing the intangible asset so that it will be available for use or sale;(b) An intention to complete the intangible asset and use or sell it;(c) The ability to use or sell the intangible asset;(d) The intangible asset will generate probable future economic benefit;(e) The availability of adequate technical, financial and other resources to complete the development and to use or sell the intangible asset; and(f) The ability to measure reliably the expenditure attributable to the intangible asset during its development.Acquisition of intangible assets costing $5,000 or more and internally generated intangible assets costing $200,000 or more that comply with the recognition criteria as per AASB 138.57 (as noted below), are capitalised.
Costs incurred below these thresholds are immediately expensed directly to the Statement of Comprehensive Income.
Costs incurred in the research phase of a project are immediately expensed.
Subsequent measurementThe cost model is applied for subsequent measurement of intangible assets, requiring the asset to be carried at cost less any accumulated amortisation and accumulated impairment losses.
4.3.1 Amortisation and impairment
Charge for the period2020 2019$000 $000
Computer Software 1,527 2,075Total amortisation for the period 1,527 2,075
As at 30 June 2020, there were no indications of impairment to intangible assets.
The department held no goodwill or intangible assets with an indefinite useful life during the reporting period. At the end of the reporting period there were no intangible assets not yet available for use.
Amortisation of finite life intangible assets is calculated on a straight line basis at rates that allocate the asset’s value over its estimated useful life. All intangible assets controlled by the department have a finite useful life and zero residual value. Estimated useful lives are reviewed annually.
The estimated useful lives for each class of intangible asset are:
Asset Useful Life: yearsComputer Software (a) 3 yearsLicences 3 years
(a) Software that is not integral to the operation of any related hardware.

105
NOTES TO THE FINANCIAL STATEMENTS
Impairment of intangible assets
Intangible assets with finite useful lives are tested for impairment annually or when an indication of impairment is identified.
The policy in connection with testing for impairment is outlined in note 4.1.1.
Licences
Licences have a finite useful life and are carried at cost less accumulated amortisation and accumulated impairment losses.
Development Costs
Research costs are expensed as incurred. Development costs incurred for an individual project are carried forward when the future economic benefits can be reasonably regarded as assured and the total project costs are likely to exceed $200,000. Other development costs are expensed as incurred.
Computer Software Software that is an integral part of the related hardware is recognised as part of the tangible asset. Software that is not an integral part of the related hardware is recognised as an intangible asset. Software costing less than $5,000 is expensed in the year of acquisition.
5. Other assets and liabilitiesThis section sets out those assets and liabilities that arose from the department’s controlled operations and includes other assets utilised for economic benefits and liabilities incurred during normal operations:
Notes2020 2019$000 $000
Receivables 5.1 17,473 19,884Amounts receivable for service 5.2 36,936 36,119Other assets 5.3 2,402 2,264Payables 5.4 10,176 12,407Amounts due to the Treasurer 5.5 2,000 10,000Revenue received in advance 5.6 22,069 24,240Other liabilities 5.7 6,856 6,156
5.1 Receivables2020 2019$000 $000
CurrentTrade receivables 15,878 14,924 Allowance for impairment of trade receivables (1,470) (834)Accrued interest revenue 434 1,406 GST receivable 934 884 Accrued Revenue 1,697 3,504 Total current 17,473 19,884
Receivables are recognised at original invoice amount less any allowances for uncollectible amounts (i.e. impairment). The carrying amount of net trade receivables is equivalent to fair value as it is due for settlement within 30 days.
The department does not hold any collateral as security or other credit enhancements for receivables.
The collectability of receivables is reviewed on an ongoing basis and any receivables identified as uncollectible are written-off against the allowance account.
5.2 Amounts receivable for services (Holding Account)2020 2019$000 $000
Current 914 3,816Non-current 36,022 32,303Balance at end of period 36,936 36,119
Amounts receivable for services represent the non-cash component of service appropriations. It is restricted in that it can only be used for asset replacement or payment of leave liability.
Amounts receivable for services are not considered to be impaired (i.e. there is no expected credit loss of the holding accounts).

106
NOTES TO THE FINANCIAL STATEMENTS
5.3 Other assets2020 2019$000 $000
CurrentPrepayments 2,402 2,264Total current 2,402 2,264Balance at end of period 2,402 2,264
Other non-financial assets include prepayments which represent payments in advance of receipt of goods or services or that part of expenditure made in one accounting period covering a term extending beyond that period.
5.4 Payables2020 2019$000 $000
CurrentTrade payables 4,224 6,952Other payables 3,341 3,457Accrued salaries 2,073 291Accrued expenses – 23Total current 9,638 10,723Non-currentTrust accountsConsumer Credit Act (WA) 9 80Real Estate and Business Agents Supervisory Board 529 487Co-operatives – Companies Liquidation Account – 11Other Miscellaneous – 1,106Total non-current 538 1,684Balance at end of period 10,176 12,407
Payables are recognised at the amounts payable when the department becomes obliged to make future payments as a result of a purchase of assets or services. The carrying amount is equivalent to fair value, as settlement is generally within 30 days.
Accrued salaries represent the amount due to staff but unpaid at the end of the reporting period. Accrued salaries are settled within a fortnight of the reporting period end. The department considers the carrying amount of accrued salaries to be equivalent to its fair value.
The accrued salaries suspense account (See Note 6.4 ‘Restricted cash and cash equivalents’) consists of amounts paid annually, from department appropriations for salaries expense, into a Treasury suspense account to meet the additional cash outflow for employee salary payments in reporting periods with 27 pay days instead of the normal 26. No interest is received on this account.
5.5 Amounts due to the Treasurer2020 2019$000 $000
CurrentMining Safety Levy – 8,000Petroleum and Geothermal Safety Levy 2,000 2,000Total amounts due to the Treasurer 2,000 10,000
The amount due to the Treasurer is in respect of a Treasurer’s Advance. This amount is payable within 12 months after the reporting period. Although no interest is charged on the outstanding amount, the carrying amount is equivalent to fair value.
5.6 Revenue received in advance
2020Restated
2019$000 $000
CurrentLicences and fees (a) 22,069 24,240Total Current 22,069 24,240
Total revenue received in advance 22,069 24,240
(a) Revenue received in advance – Licence and fees are revenues received for multiple year licences. This balance represents the unearned revenue of the multiple year licence, that will be recognised incrementally over the remaining term of the licence.

107
NOTES TO THE FINANCIAL STATEMENTS
Restatement of classification of revenue received in advancePrior to Machinery of Government (MoG) changes, both former departments applied differing accounting treatments to revenues received in advance. For consistency and to enhance transparency, all revenues received in advance are now jointly reported as Current Liabilities. Accounting standards require consistent accounting policies be applied across similar transactions. Management have assessed that the most appropriate treatment of revenue received in advance with a refund obligation is current. Applying this policy, non-current revenue received in advance and total non-current liabilities has been reduced at 30 June 2019 by $10.400 million (1 July 2018: $10.845 million) and current revenue received in advance and total current liabilities have been increased at 30 June 2019 by $10.400 million (1 July 2018: $10.845 million). This had no impact on the department’s Statement of comprehensive income or their Statement of Cash Flows.
The has been corrected by restating each of the affected financial statement line items for prior year.
5.7 Other liabilities2020 2019$000 $000
CurrentUnclaimed monies 1,512 1,240Total Current 1,512 1,240
Non CurrentLease payable 5,344 4,916Total Non Current 5,344 4,916Total other liabilities 6,856 6,156
6. FinancingThis section sets out the material balances and disclosures associated with the financing and cashflows of the department.
NotesLease liabilities 6.1Assets pledged as security 6.2Finance costs 6.3Cash and cash equivalents 6.4
6.1 Lease liabilities2020 2019$000 $000
Current 1,213 –Non-current 2,172 –
3,385 –
The department measures a lease liability, at the commencement date, at the present value of the lease payments that are not paid at that date. The lease payments are discounted using the interest rate implicit in the lease. If that rate cannot be readily determined, the department uses the incremental borrowing rate provided by Western Australia Treasury Corporation.
Lease payments included by the department as part of the present value calculation of lease liability include:
‣ Fixed payments (including in-substance fixed payments), less any lease incentives receivable; ‣ Variable lease payments that depend on an index or a rate initially measured using the index rate or rate as at the commencement date; ‣ Amounts expected to be payable by the lessee under residual value guarantees; ‣ The exercise price of purchase options (where these are reasonably certain to be realised) ‣ Payments for penalties for terminating a lease, where the lease term reflects the agency exercising an option to terminate the lease.
The interest on the lease liability is recognised in profit or loss over the lease term so as to produce a constant periodic rate of interest on the remaining balance of the liability for each period. Lease liabilities do not include any future changes in variable lease payments (that depend on an index or rate) until they take effect, in which case the lease liability is reassessed and adjusted against the right-of-use asset.
Periods covered by extension or termination options are only included in the lease term by the department if the lease is reasonably certain to be extended (or not terminated).
This section should be read in conjunction with note 4.2.

108
NOTES TO THE FINANCIAL STATEMENTS
Subsequent Measurement
Lease liabilities are measured by increasing the carrying amount to reflect interest on the lease liabilities; reducing the carrying amount to reflect the lease payments made; and remeasuring the carrying amount at amortised cost, subject to adjustments to reflect any reassessment or lease modifications.
6.2 Assets pledged as security2020 2019$000 $000
Assets pledged as securityThe carrying amounts of non-current assets pledged as security are:Right-of-use asset vehicles 2,946 –Total assets pledged as security 2,946 –
The department has secured the right-of-use assets against the related lease liabilities. In the event of default, the rights to the leased assets will revert to the lessor.
6.3 Finance Costs2020 2019$000 $000
Finance CostsLease interest expense 91 –Finance costs expensed 91 –
‘Finance cost’ includes the interest component of lease liability repayments.
6.4 Cash and cash equivalents2020 2019$000 $000
Cash and cash equivalents 1,876 1,345Restricted cash and cash equivalents– Current Special Purpose Funds 390,132 355,572– Accrued salaries suspense account (a) 2,228 1,539Balance at end of period 394,236 358,456
(a) Funds held in the suspense account for the purpose of meeting the 27th pay in a reporting period that occurs every 11th year. This account is classified as non-current for 10 out of 11 years.
Restricted cash and cash equivalentsCurrentSpecial puropse accounts
Building Services Account 7,575 12,253Consumer Credit Act 6 54Co-operatives Companies Liquidation Account – 11Departmental Receipts in Suspense – 28EnergySafety Account 14,967 15,489Mines Safety Levy (a) 27,916 16,520Mining Rehabilitation Fund (b) 185,237 150,473Motor Vehicle Repair (MVR) Industry Compensation Account 144 144Motor Vehicle Repair (MVR) Industry Education and Research Account 152 157Petroleum and Geothermal Energy Safety Levy (a) 4,207 3,327Real Estate – Education and General Purpose Account 16,083 20,560Real Estate – Fidelity Guarantee Account 46,276 46,743Real Estate – Home Buyers Assistance Account 8,706 12,174Real Estate and Business Agents Supervisory Board Trust Account 529 488Settlement Agents – Education and General Purpose Account 29,097 28,661Settlement Agents – Fidelity Guarantee Account 48,169 47,314

109
NOTES TO THE FINANCIAL STATEMENTS
State Trading Concerns 969 1,176Indian Ocean Territories – Commonwealth Government – –Royalties for Regions 99 –
Total Current restricted cash and cash equivalents 390,132 355,572Non current
Accrued salaries suspense account (c) 2,228 1,539Total non current restricted cash and cash equivalents 2,228 1,539
Balance at end of period 392,360 357,111
(a) The recoup of the costs of administering the Safety reforms cannot be invoiced until after the end of the financial year. See Note 8.7 for further information.
(b) These funds are applied for regulatory services under the Mining Rehabilitation Fund Act 2012. See Note 8.7 for further information.(c) Funds held in the suspense account for the purpose of meeting the 27th pay in a reporting period that occurs every 11th year. This account is
classified as non-current for 10 out of 11 years.
For the purpose of the statement of cash flows, cash and cash equivalent (and restricted cash and cash equivalent) assets comprise cash on hand and short-term deposits with original maturities of three months or less that are readily convertible to a known amount of cash and which are subject to insignificant risk of changes in value.
7 Financial instruments and contingenciesNote
Financial instruments 7.1Contingent assets and liabilities 7.2
Contingent Litigation Assets and Liabilities 7.2.1Contingent Fidelity Claims 7.2.2
7.1 Financial instrumentsThe carrying amounts of each of the following categories of financial assets and financial liabilities at the end of the reporting period are:
2020 2019$000 $000
Financial assetsCash and cash equivalents 1,876 1,345Restricted cash and cash equivalents 392,360 357,112Financial assets at amortised cost (a) 53,475 55,261Total financial assets 447,711 413,718
Financial liabilitiesFinancial liabilities measured at amortised cost 13,688 23,647Total financial liability 13,688 23,647
(a) The amount of Financial assets at amortised costs excludes GST recoverable from the ATO (statutory receivable).
7.2 Contingent assets and liabilitiesContingent assets and contingent liabilities are not recognised in the statement of financial position but are disclosed and, if quantifiable, are measured at the best estimate.
Contingent assets and liabilities are presented inclusive of GST receivable or payable respectively.

110
NOTES TO THE FINANCIAL STATEMENTS
7.2.1 Contingent Litigation Assets and LiabilitiesThe following contingent assets are excluded from the assets included in the financial statements:
Litigation in progress
The departments legal matters reported as having a contingent liability or benefit at the corresponding time in the previous financial year have been reviewed, and where appropriate, updated or removed from consideration. All legal matters commenced on or after July 1, 2019 have been reviewed, and where appropriate, have been included in the report. A materiality factor of $65,000 has been adopted.
The department currently has two legal matters in progress, one recognising a potential benefit, the other a potential liability. The contingent liability for $150,000 is being pursued under the legislation of the Mines Safety and Inspection Act 1994, and the contingent benefit of $3,000,000 relates to subrogation action by the state.
7.2.2 Contingent Fidelity Guarantee Account (FGA) ClaimsA total of 36 claims against the Fidelity Guarantee Accounts with a total value of $1,361,031 consisting of:
a) 36 claims against the Real Estate Agents FGA yet to be decided and with a total value of $1,361,031.
These figures do not include legal costs or any interest claims. Reasonable legal costs are claimable. Claims for interest are not allowable, as per proceedings in the Supreme Court after the State Administrative Tribunal decided that interest wasn’t allowable.
Contaminated sites
Under the Contaminated Sites Act 2003, the department is required to report known and suspected contaminated sites to the Department of Water and Environmental Regulation (DWER). In accordance with the Act, DWER classifies these sites on the basis of the risk to human health, the environment and environmental values. Where sites are classified as contaminated – remediation required or possibly contaminated – investigation required, the department may have a liability in respect of investigation or remediation expenses.
Three sites are still identified as known or “suspected “of being contaminated”. These three sites are still yet to be classified by the Department of Water and Environmental Regulation. The department is unable to assess the likely outcome of the classification process, and accordingly, it is not practicable to estimate the potential financial effect or to identify the uncertainties relating to the amount or timing of any outflows.
Whilst there is no possibility of reimbursement of any future expenses that may be incurred in the remediation of these sites, the department may apply for funding from the Contaminated Sites Management Account (2015) to undertake further investigative work or to meet remediation costs that may be required.
8. Our disclosuresThis section includes additional material disclosures required by accounting standards or other pronouncements, for the understanding of this financial report.
NotesEvents occurring after the end of the reporting period 8.1Initial application of Australian Accounting Standards 8.2Key management personnel 8.3Related party transactions 8.4Related bodies 8.5Affiliated bodies 8.6Special purpose accounts 8.7Remuneration of auditors 8.8Act of Grace (and ex-gratia) payments 8.9Equity 8.10Supplementary financial information 8.11Explanatory statement 8.12
8.1 Events occurring after the end of the reporting periodThe department has not recognised any significant events that have occurred after the end of the reporting period.

111
NOTES TO THE FINANCIAL STATEMENTS
8.2 Initial application of Australian Accounting Standards(a) AASB 15 Revenue from Contract with Customers and AASB 1058 Income of Not-for-Profit EntitiesAASB 15 Revenue from Contracts with Customers replaces AASB 118 Revenue and AASB 111 Construction Contracts for annual reporting periods on or after 1 January 2019. Under the new model, an entity shall recognise revenue when (or as) the entity satisfies a performance obligation by transferring a promised good or service to a customer and is based upon the transfer of control rather than transfer of risks and rewards.
AASB 15 focuses on providing sufficient information to the users of financial statements about the nature, amount, timing and uncertainty of revenue and cash flows arising from the contracts with customers. Revenue is recognised by applying the following five steps:
‣ Identifying contracts with customers ‣ Identifying separate performance obligations ‣ Determining the transaction price of the contract ‣ Allocating the transaction price to each of the performance obligations ‣ Recognising revenue when or as each performance obligation is satisfied.
Revenue is recognised either over time or at a point in time. Any distinct goods or services are separately identified and any discounts or rebates in the contract price are allocated to the separate elements.
In addition, income other than from contracts with customers are subject to AASB 1058 Income of Not-for-Profit Entities. Income recognition under AASB 1058 depends on whether such a transaction gives rise to liabilities or a contribution by owners related to an asset (such as cash or another asset) recognised by the department.
The department adopts the modified retrospective approach on transition to AASB 15 and AASB 1058. No comparative information is restated under this approach, and the agency recognises the cumulative effect of initially applying the Standards as an adjustment to the opening balance of accumulated surplus/(deficit) at the date of initial application (1 July 2019).
Under this transition method, the department elects not to apply the standards retrospectively to non-completed contracts at the date of initial application.
Refer to Note 3.1, 3.2 and 3.3 for the revenue and income accounting policies adopted from 1 July 2019.
The effect of adopting AASB 15 and AASB 1058 are as follows:
30 June 2020 Adjustments 30 June 2020 under AASB 118 and 1004User fees and charges 164,232 – 164,232Sale of goods 69 – 69Commonwealth Grants 83 – 83Net result 164,384 – 164,384
(b) AASB 16 LeasesAASB 16 Leases supersedes AASB 117 Leases and related Interpretations. AASB 16 primarily affects lessee accounting and provides a comprehensive model for the identification of lease arrangements and their treatment in the financial statements of both lessees and lessors.
The department applies AASB 16 Leases from 1 July 2019 using the modified retrospective approach. As permitted under the specific transition provisions, comparatives are not restated. The cumulative effect of initially applying this Standard is recognised as an adjustment to the opening balance of accumulated surplus/(deficit).
The main changes introduced by this Standard include identification of lease within a contract and a new lease accounting model for lessees that require lessees to recognise all leases (operating and finance leases) on the Statement of Financial Position as right-of-use assets and lease liabilities, except for short term leases (lease terms of 12 months or less at commencement date) and low-value assets (where the underlying asset is valued less than $5,000). The operating lease and finance lease distinction for lessees no longer exists.
Under AASB 16, the department takes into consideration all operating leases that were off balance sheet under AASB 117 and recognises:
a) right of use assets and lease liabilities in the Statement of Financial Position, initially measured at the present value of future lease payments, discounted using the incremental borrowing rate (2.5%) on 1 July 2019;
b) depreciation of right-of-use assets and interest on lease liabilities in the Statement of Comprehensive Income; and
c) the total amount of cash paid as principal amount, which is presented in the cash flows from financing activities, and interest paid, which is presented in the cash flows from operating activities, in the Statement of Cash Flows.
In relation to leased vehicles that were previously classified as finance leases, their carrying amount before transition is used as the carrying amount of the right-of-use assets and the lease liabilities as of 1 July 2019.
The department measures concessionary leases that are of low value terms and conditions at cost at inception. There is no financial impact as the department is not in possession of any concessionary leases at the date of transition.
The right-of-use assets are assessed for impairment at the date of transition and the department has not identified any impairments to its right-of-use assets.

112
NOTES TO THE FINANCIAL STATEMENTS
On transition, the department has elected to apply the following practical expedients in the assessment of their leases that were previously classified as operating leases under AASB 117:
a) A single discount rate has been applied to a portfolio of leases with reasonably similar characteristics;
b) Where the lease term at initial application ended within 12 months, the department has accounted for these as short-term leases;
c) Initial direct costs have been excluded from the measurement of the right-of-use asset;
d) Hindsight has been used to determine if the contracts contained options to extend or terminate the lease.
The department has not reassessed whether existing contracts are, or contained a lease at 1 July 2019. The requirements of paragraphs 9-11 of AASB 16 are applied to contracts that came into existence post 1 July 2019.
a) Measurement of lease liabilities
Operating Lease Commitments disclosed as at 30 June 2019 108,757Less:Government Office Accommodation to be reported by Department of Finance (105,792)Restated balance at 30 June 2019 2,965Discounted using incremental borrowing rate at date of initial application (1) 2,891Add:Finance lease liabilities recognised as at 30 June 2019 –Less:Short-term leases not recognised as liability –Low value leases not recognised as liability –Lease liability recognised at 1 July 2019 2,891
Current lease liabilities 1,052Non-current lease liabilities 1,839
1 The WATC incremental borrowing rate was used for the purposes of calculating the lease transition opening balance.
8.3 Key management personnelThe department has determined key management personnel include cabinet ministers and senior officers of the department. The department does not incur expenditures to compensate Ministers and those disclosures may be found in the Annual Report on State Finances.
The total fees, salaries, superannuation, non-monetary benefits and other benefits for senior officers of the Department for the reporting period are presented within the following bands:
Compensation Band $ 2020 20190 to 10,000 – 120,001 to 30,000 – 230,001 to 40,000 – 240,001 to 50,000 – 270,001 to 80,000 – 1100,001 to 110,000 1 –130,001 to 140,000 – 1140,001 to 150,000 2 –150,001 to 160,000 1 –160,001 to 170,000 1 2170,001 to 180,000 1 2180,001 to 190,000 4 3190,001 to 200,000 5 7210,001 to 220,000 – 1220,001 to 230,000 1 –240,001 to 250,000 2 3250,001 to 260,000 3 3270,001 to 280,000 1 –340,001 to 350,000 1 –400,001 to 410,000 1 –670,001 to 680,000 – 1

113
NOTES TO THE FINANCIAL STATEMENTS
2020 2019$000 $000
Short-term employee benefits 4,648 4,911Other long-term benefits 273 431Termination benefits 202 –Total compensation of senior officers 5,123 5,342
Total compensation includes the superannuation expense incurred by the department in respect of senior officers.
8.4 Related party transactionsThe department is a wholly owned and controlled entity of the State of Western Australia.
Related parties of the department include:
‣ all cabinet ministers and their close family members, and their controlled or jointly controlled entities; ‣ all senior officers and their close family members, and their controlled or jointly controlled entities; ‣ other departments and public sector entities, including related bodies included in the whole of government consolidated financial statements (i.e. wholly-owned public sector entities);
‣ associates and joint ventures of a whooly-owned public sector entity; and ‣ the Government Employees Superannuation Board (GESB).
Significant transactions with Government-related entities
In conducting its activities, the department is required to transact with the State and entities related to the State. These transactions are generally based on the standard terms and conditions that apply to all agencies. Such transactions include:
‣ Income from State Government (Note 3.1); ‣ Services received free of charge (Note 3.1); ‣ Equity contributions (Note 8.10); ‣ Royalties for Regions Fund (Note 3.1); ‣ Superannuation payments to GESB (Note 2.1(a)); ‣ Lease rental payments to the Department of Finance (Government Office Accommodation and State Fleet) and the Housing Authority (Government Regional Officer Housing) (Note 2.3) and related outstanding balances;
‣ Amounts due to the Treasurer (Note 5.5); ‣ Insurance payments to the Insurance Commission and Riskcover fund (Note 2.3); ‣ Remuneration for services provided by the Auditor General (Note 8.8).
Material transactions with other related parties
Outside of normal citizen type transactions with the department, there were no other related party transactions that involved key management personnel and/or their close family members and/or their controlled (or jointly controlled) entities.
8.5 Related bodiesThe department had no related bodies as defined in the ‘Financial Management Act 2006’ and Treasurer’s Instruction 951.
8.6 Affiliated bodiesThe department has no affiliated bodies.
8.7 Special Purpose AccountsControlled 2020 2019Special Purpose Accounts section 16 of Financial Management Act 2006 $000 $000Building Services Account 7,575 12,253Consumer Credit Act (WA) 6 54Co-operatives Companies Liquidation Account – 11Departmental Receipts in Suspense – 28EnergySafety Account 14,967 15,489Indian Ocean Territories – Commonwealth Government – –Mines Safety Levy 27,916 16,520Mining Rehabilitation Fund Levy 185,237 150,473

114
NOTES TO THE FINANCIAL STATEMENTS
Controlled 2020 2019Special Purpose Accounts section 16 of Financial Management Act 2006 $000 $000Motor Vehicle Repair (MVR) Industry Compensation Account 144 144Motor Vehicle Repair (MVR) Industry Education and Research Account 152 157Petroleum and Geothermal Energy Safety Levy 4,207 3,327Real Estate – Education and General Purpose Account 16,083 20,560Real Estate – Fidelity Guarantee Account 46,276 46,743Real Estate – Home Buyers Assistance Account 8,706 12,174Real Estate and Business Agents Supervisory Board Trust Account 529 488Settlement Agents – Education and General Purpose Account 29,097 28,661Settlement Agents – Fidelity Guarantee Account 48,169 47,314Royalties for Regions 99 –State Trading Concerns 969 1,176
390,132 355,572
2020 2019Administered $000 $000Environmental Called-In Performance Bond Money Fund 5,061 5,061Special Projects Fund 744 3,848
5,805 8,909
Building Services AccountHolds funds used for the provision of functions and services in accordance with building services acts.
2020 2019$000 $000
Balance at start of period 12,253 16,986Add Receipts 23,319 26,146Less Payments (27,997) (30,879)Balance at end of period 7,575 12,253
Consumer Credit Act (WA)Holds funds pending distribution in accordance with the Consumer Credit (WA) Act 1996 or court direction.
2020 2019$000 $000
Balance at start of period 54 103Add Receipts – 52Less Payments (48) (101)Balance at end of period 6 54
Co-operatives Companies Liquidation AccountHolds unclaimed funds pending redistribution in accordance with the Companies (Co-operative) Act 1943 section 290(1).
2020 2019$000 $000
Balance at start of period 11 11Add Receipts – –Less Payments (11) –Balance at end of period – 11
Departmental Receipts in Suspense This account is to hold monies temporarily, pending identification of the purpose for which the funds were received.
2020 2019$000 $000
Balance at start of period 28 2Add Receipts – 55Less Payments (28) (29)Balance at end of period – 28

115
NOTES TO THE FINANCIAL STATEMENTS
EnergySafety AccountHolds funds used for the provision of functions and services in accordance with the Energy Safety Act 2006.
2020 2019$000 $000
Balance at start of period 15,489 14,903Add Receipts 14,734 20,101Less Payments (15,256) (19,515)Balance at end of period 14,967 15,489
Environmental Called-In Performance Bond Money FundThe account is to hold called-in performance bond monies received in respect to section 126 of the Mining Act (1978). Funds are to be used to provide for the rehabilitation of mining sites.
2020 2019$000 $000
Balance at start of period 5,061 5,093Add Receipts – –Less Payments – (32)Balance at end of period 5,061 5,061
Indian Ocean Territories – Commonwealth GovernmentThe Department has a service delivery agreement with the Commonwealth Government to undertake to provide its normal service to the Christmas and Cocos Islands.
Following Machinery of Government (MOG) changes, the balance of the Indian Ocean Territories account has been transferred to the Special Projects Fund, which is outlined further below.
2020 2019$000 $000
Balance at start of period – 31Balance transferred in/(out) – (31)Add Receipts – –Less Payments – –Balance at end of period – –
Mines Safety LevyThis fund is to hold all levies received from mining companies and is to be applied to the cost of administering the Mines Safety and Inspection Act 1994.
2020 2019$000 $000
Balance at start of period 16,520 10,226Add Receipts 37,234 41,304Less Payments (25,838) (35,010)Balance at end of period 27,916 16,520
Mining Rehabilitation Fund LevyThis fund is to hold all levies which are applied to the cost of administering the Mining Rehabilitation Fund Levies for regulatory services under the Mining Rehabilitation Fund Act 2012.
2020 2019$000 $000
Balance at start of period 150,473 122,616Add Receipts 35,546 33,817Less Payments (782) (5,960)Balance at end of period 185,237 150,473
Motor Vehicle Repair (MVR) Industry Compensation Account Holds funds used for the Motor Vehicle Repairers Industry in accordance with the Motor Vehicle Repairers Act 2003.
2020 2019$000 $000
Balance at start of period 144 138Add Receipts – 27Less Payments – (21)Balance at end of period 144 144

116
NOTES TO THE FINANCIAL STATEMENTS
Motor Vehicle Repair (MVR) Industry Education and Research Account Holds funds used for the Motor Vehicle Repairers Industry in accordance with the Motor Vehicle Repairers Act 2003.
2020 2019$000 $000
Balance at start of period 157 147Add Receipts – 25Less Payments (5) (15)Balance at end of period 152 157
Petroleum and Geothermal Energy Safety LevyThis fund is to hold all levies which are applied to the cost of administering the Petroleum and Geothermal Energy Safety Levies for regulatory services under the Petroleum and Geothermal Energy Resource –––67 (PGERA67) and the Petroleum Pipelines Act 1969 (PPA69).
2020 2019$000 $000
Balance at start of period 3,327 1,539Add Receipts 4,305 4,540Less Payments (3,425) (2,752)Balance at end of period 4,207 3,327
Real Estate – Education and General Purpose AccountHolds funds used for the operation of the Education and General Purpose Account in accordance with the Real Estate and Business Agents Act 1978.
2020 2019$000 $000
Balance at start of period 20,560 22,734Add Receipts 4,813 9,418Less Payments (9,290) (11,592)Balance at end of period 16,083 20,560
Real Estate – Fidelity Guarantee AccountHolds funds used for the operation of the Fidelity Guarantee Account in accordance with the Real Estate and Business Agents Act 1978.
2020 2019$000 $000
Balance at start of period 46,743 46,426Balance transferred in – –Add Receipts 483 2,193Less Payments (950) (1,876)Balance at end of period 46,276 46,743
Real Estate – Home Buyers Assistance AccountHolds funds used for the operation of the Home Buyers Assistance Account in accordance with the Real Estate and Business Agents Act 1978.
2020 2019$000 $000
Balance at start of period 12,174 13,865Add Receipts 2,059 5,837Less Payments (5,527) (7,528)Balance at end of period 8,706 12,174
Real Estate and Business Agents Supervisory Board Trust AccountHolds funds as a result of legal proceedings and liquidations of agencies in accordance with the Trust Statement.
2020 2019$000 $000
Balance at start of period 488 432Add Receipts 42 58Less Payments (1) (2)Balance at end of period 529 488

117
NOTES TO THE FINANCIAL STATEMENTS
Royalties for RegionsThis is a sub-fund within the over-arching ‘Royalties for Regions Fund’. The recurrent funds are committed to projects and programs in WA regional areas.
2020 2019$000 $000
Balance at start of period – (444)Add Receipts 205 5,000Less Payments (106) (4,556)Balance at end of period 99 –
Settlement Agents – Education and General Purpose AccountHolds funds used for the operation of the Education and General Purpose Account in accordance with the Settlement Agents Act 1981.
2020 2019$000 $000
Balance at start of period 28,661 27,649Add Receipts 875 1,941Less Payments (439) (929)Balance at end of period 29,097 28,661
Settlement Agents – Fidelity Guarantee AccountHolds funds used for the operation of the Fidelity Guarantee Account in accordance with the Settlement Agents Act 1981.
2020 2019$000 $000
Balance at start of period 47,314 47,595Add Receipts 1,231 2,682Less Payments (376) (2,963)Balance at end of period 48,169 47,314
Special Projects Fund The account was created to hold funds for the purpose of participating in significant projects with other countries, the Commonwealth and the private sector to the mutual benefit of the other participants and the State of Western Australia.
This account includes an agreement between the Commonwealth and the department to carry out inspection services at Christmas Island. With an opening balance of $108,776, receipts of $374,309 and payments of $259,416, the closing balance is $223,669.
2020 2019$000 $000
Balance at start of period 3,848 2,494Add Receipts 4,407 2,501Less Payments (7,511) (1,147)Balance at end of period 744 3,848
State Trading ConcernsThe fund was created under the State Trading Concerns Act 1916 and controls income received in respect of the provisions of copyright materials and relevant trade mark advertising opportunities or similar arrangements.
2020 2019$000 $000
Balance at start of period 1,176 1,173Add Receipts 32 183Less Payments (239) (180)Balance at end of period 969 1,176
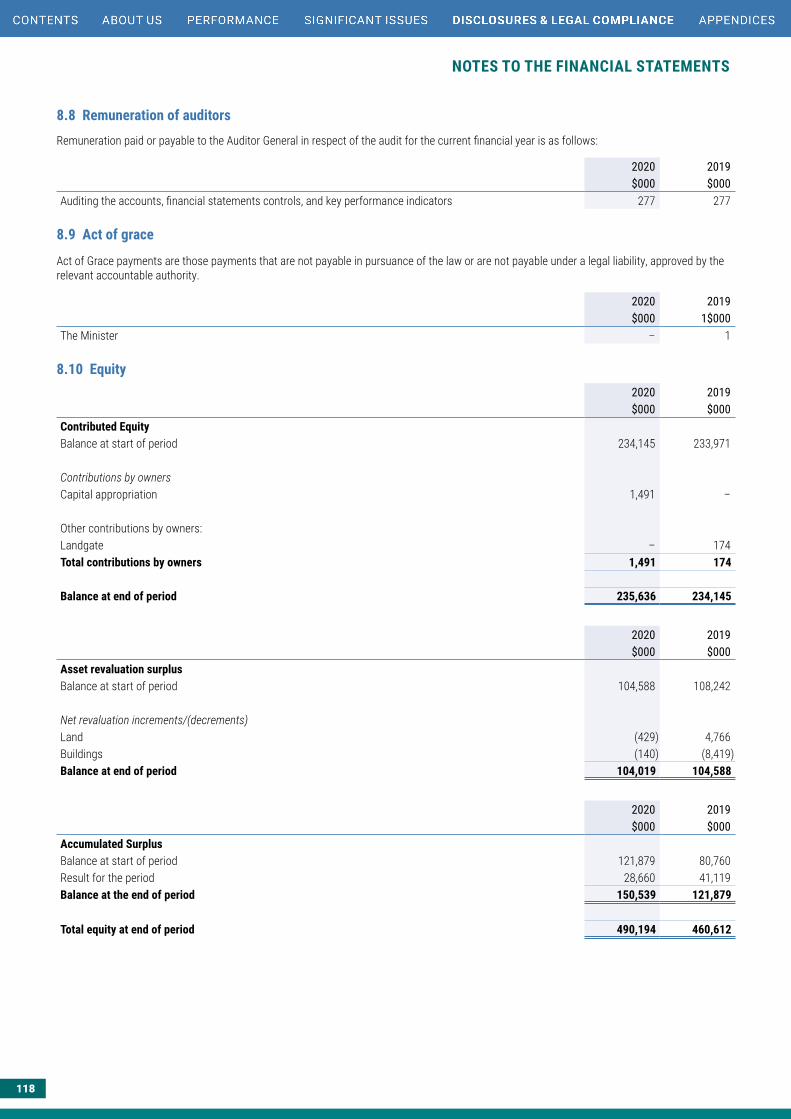
118
NOTES TO THE FINANCIAL STATEMENTS
8.8 Remuneration of auditors
Remuneration paid or payable to the Auditor General in respect of the audit for the current financial year is as follows:
2020 2019$000 $000
Auditing the accounts, financial statements controls, and key performance indicators 277 277
8.9 Act of grace
Act of Grace payments are those payments that are not payable in pursuance of the law or are not payable under a legal liability, approved by the relevant accountable authority.
2020 2019$000 1$000
The Minister – 1
8.10 Equity2020 2019$000 $000
Contributed EquityBalance at start of period 234,145 233,971
Contributions by ownersCapital appropriation 1,491 –
Other contributions by owners: Landgate – 174Total contributions by owners 1,491 174
Balance at end of period 235,636 234,145
2020 2019$000 $000
Asset revaluation surplusBalance at start of period 104,588 108,242
Net revaluation increments/(decrements)Land (429) 4,766Buildings (140) (8,419)Balance at end of period 104,019 104,588
2020 2019$000 $000
Accumulated SurplusBalance at start of period 121,879 80,760Result for the period 28,660 41,119Balance at the end of period 150,539 121,879
Total equity at end of period 490,194 460,612

119
NOTES TO THE FINANCIAL STATEMENTS
8.11 Supplementary financial information(a) Write-offsDuring the financial year, $21,890 (2019: $43,765) was written off the department’s asset register under the authority of:
2020 2019$000 $000
The Director General 22 44 22 44
8.12 Explanatory statement (Controlled Operations)All variances between estimates (original budget) and actual results for 2020, and between the actual results for 2020 and 2019 are shown below. Narratives are provided for key major variances, which are generally greater than:–10% and $10.0 million for the Statements of Comprehensive Income and Cash Flows; and,–10% and $10.0 million for the Statement of Financial Position.Statement of Comprehensive Income Variances
Variance Note
Estimate Actual Actual Variance between
estimate and actual
Variance between actual
results for 2020 and 2019
2020 2020 2019$000 $000 $000 $000 $000
ExpensesEmployee benefits expenses 1 a 174,562 187,744 153,002 (13,182) 34,742Supplies and services 2 48,281 57,005 60,209 (8,724) (3,204)Depreciation and amortisation expense 3 16,673 5,225 5,112 11,448 113Finance costs 3 2,901 91 – 2,810 91Accommodation expenses 3 9,067 17,320 15,586 (8,253) 1,734Grants and subsidies 4 13,236 14,864 17,248 (1,628) (2,384)Other expenses 5 b 14,996 3,840 9,616 11,156 (5,776)Loss on disposal of other assets – 316 5 (316) 311Total cost of services 279,716 286,405 260,778 (6,689) 25,627
IncomeRevenueUser charges and fees 160,208 164,232 162,641 (4,024) 1,591Sales 855 69 110 786 (41)Commonwealth Grants received 624 83 134 541 (51)Interest revenue 6 – 3,075 6,343 (3,075) (3,268)Other revenue 7 c 13,519 5,346 1,219 8,173 4,127Total Revenue 175,206 172,805 170,447 2,401 2,358
GainsGain on disposal of non-current assets – – – – –Total Gains – – – – –Total income other than income from State Government 175,206 172,805 170,447 2,401 2,358NET COST OF SERVICES (104,510) (113,600) (90,331) (9,090) 23,269

120
NOTES TO THE FINANCIAL STATEMENTS
Statement of Comprehensive Income Variances
Variance Note
Estimate Actual Actual Variance between
estimate and actual
Variance between actual
results for 2020 and 2019
2020 2020 2019$000 $000 $000 $000 $000
Income from State GovernmentService appropriation 8 d 125,839 136,410 123,006 (10,571) 13,404Services received free of charge 2,846 5,541 3,120 (2,695) 2,421State Grant and Subsidies – 100 100 (100) –Royalties for Regions Fund 223 209 5,224 14 (5,015)Total income from State Government 128,908 142,260 131,450 (13,352) 10,810SURPLUS/(DEFICIT) FOR THE PERIOD 24,398 28,660 41,119 (4,262) (12,459)
Variance Note
Estimate Actual Actual Variance between
estimate and actual
Variance between actual
results for 2020 and 2019
2020 2020 2019$000 $000 $000 $000 $000
OTHER COMPREHENSIVE INCOMEItems not reclassified subsequently to profit or lossChanges in asset revaluation surplus – (569) (3,654) 569 3,085Total other comprehensive income – (569) (3,654) 569 3,085TOTAL COMPREHENSIVE INCOME FOR THE PERIOD 24,398 28,091 37,465 (3,693) (9,374)
Variances between estimate and actual
1) Employee benefits expenses are higher than the estimate by $13.2 million (8%) due to increased provisions for annual leave and long service leave which reflect a reduction in leave utilised during Covid-19 restrictions and a change in parameters used within the Actuarial report and increased head count.
2) Supplies and services expenses are higher than the estimate by $8.7 million (18%) due to higher than expected demands resulting in a higher use of contractors and increased I.T. costs as machinery of government changes continue to be progressed.
3) The directive to scope out accounting standard AASB 16 for GOA leased accommodation significantly impacts the statement of comprehensive income as previous interest expense for the lease obligation and a depreciation cost for the right of use asset are replaced with rental expenses for operating leases. Also refer to point (13) below.
4) Grants and subsidies are higher than the estimate by $1.6 million (12%) due to an increased number of First Home Buyers grants provided as falling housing prices increase the eligibility of the grant.
5) Other expenses are lower than estimate by $11.2 million (74%) as administration, repairs and service delivery costs decreased due to volatile revenue and lower cash balances.
6) Interest revenues are under the estimate by $2.1 million (100%) due to a reduction in interest rates.7) Other revenues are under the estimate by $8.2 million (60%) due to the Covid-19 affected economy contracting.8) Service Appropriations are higher than the estimate by $10.6 million (8%) due to continued unrestricted revenue shortfalls, increasing demand
to internally fund Government initiatives, and a 12-month waiver of a range of business and occupational licence and registration fees paid by businesses affected by Covid-19.
Variances between actual results for 2020 and 2019
a) Employee benefits expenses are higher in 2020 in comparison to 2019 by $34.74 million (23%) due to increased provisions for annual leave and long service leave which reflect a reduction in leave utilised during Covid-19 restrictions and a change in parameters used within the Actuarial report and increased head count.
b) Other expenses are lower in 2020 than 2019 by $5.77 million (60%) as administration, repairs and service delivery costs reflect volatile revenue and lower cash balances in the 2020 financial year when compared to the 2019 financial year.
c) Other revenues are higher in 2020 in comparison to 2019 by $4.13 million (339%) as a result of higher recoups of salary for work performed in line with various project agreements, which is partially offset due to the Covid-19 affected economy contracting.
d) Service Appropriations are higher in 2020 when compared to 2019 by $13.4 million (11%) as a result of additional funding received due to continued unrestricted revenue shortfalls, increasing demand to internally fund Government initiatives, and a 12-month waiver of a range of business and occupational licence and registration fees paid by businesses affected by Covid-19.
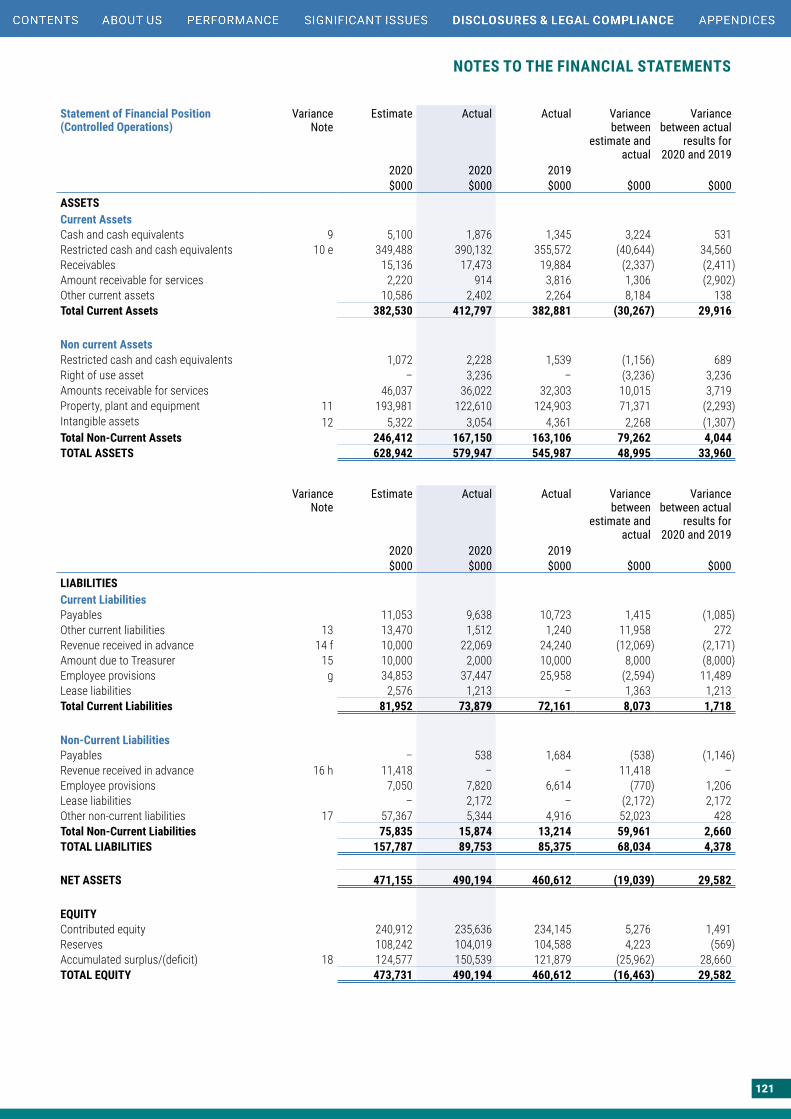
121
NOTES TO THE FINANCIAL STATEMENTS
Statement of Financial Position (Controlled Operations)
Variance Note
Estimate Actual Actual Variance between
estimate and actual
Variance between actual
results for 2020 and 2019
2020 2020 2019$000 $000 $000 $000 $000
ASSETSCurrent AssetsCash and cash equivalents 9 5,100 1,876 1,345 3,224 531Restricted cash and cash equivalents 10 e 349,488 390,132 355,572 (40,644) 34,560Receivables 15,136 17,473 19,884 (2,337) (2,411)Amount receivable for services 2,220 914 3,816 1,306 (2,902)Other current assets 10,586 2,402 2,264 8,184 138Total Current Assets 382,530 412,797 382,881 (30,267) 29,916
Non current AssetsRestricted cash and cash equivalents 1,072 2,228 1,539 (1,156) 689Right of use asset – 3,236 – (3,236) 3,236Amounts receivable for services 46,037 36,022 32,303 10,015 3,719Property, plant and equipment 11 193,981 122,610 124,903 71,371 (2,293)Intangible assets 12 5,322 3,054 4,361 2,268 (1,307)Total Non-Current Assets 246,412 167,150 163,106 79,262 4,044TOTAL ASSETS 628,942 579,947 545,987 48,995 33,960
Variance Note
Estimate Actual Actual Variance between
estimate and actual
Variance between actual
results for 2020 and 2019
2020 2020 2019$000 $000 $000 $000 $000
LIABILITIESCurrent LiabilitiesPayables 11,053 9,638 10,723 1,415 (1,085)Other current liabilities 13 13,470 1,512 1,240 11,958 272Revenue received in advance 14 f 10,000 22,069 24,240 (12,069) (2,171)Amount due to Treasurer 15 10,000 2,000 10,000 8,000 (8,000)Employee provisions g 34,853 37,447 25,958 (2,594) 11,489 Lease liabilities 2,576 1,213 – 1,363 1,213 Total Current Liabilities 81,952 73,879 72,161 8,073 1,718
Non-Current LiabilitiesPayables – 538 1,684 (538) (1,146)Revenue received in advance 16 h 11,418 – – 11,418 –Employee provisions 7,050 7,820 6,614 (770) 1,206Lease liabilities – 2,172 – (2,172) 2,172Other non-current liabilities 17 57,367 5,344 4,916 52,023 428Total Non-Current Liabilities 75,835 15,874 13,214 59,961 2,660TOTAL LIABILITIES 157,787 89,753 85,375 68,034 4,378
NET ASSETS 471,155 490,194 460,612 (19,039) 29,582
EQUITYContributed equity 240,912 235,636 234,145 5,276 1,491Reserves 108,242 104,019 104,588 4,223 (569)Accumulated surplus/(deficit) 18 124,577 150,539 121,879 (25,962) 28,660TOTAL EQUITY 473,731 490,194 460,612 (16,463) 29,582

122
NOTES TO THE FINANCIAL STATEMENTS
Variances between estimate and actual
9) Cash and cash equivalents are under the estimate by $3.2 million (83%) reflecting the volatile nature of the departments revenue streams as they respond to industry activity and a 12-month waiver of a range of business and occupational licence and registration fees paid by businesses affected by Covid-19. This results in reduced collections of unrestricted revenue, which subsequently causes cash balances to be drawn upon during the year.
10) Restricted Cash and cash equivalents are higher than the estimate by $40.6 million (12%) due to increases in the Mines Safety and Inspection Levy, Mining Rehabilitation Fund and Property Industry accounts.
11) The directive to scope out accounting standard AASB 16 for GOA and GROH periodic leased accommodation significantly impacts the Statement of Financial Position by removing arrangements previously classified as Right of use assets – accommodation leased from the balance sheet. Refer to point (13) below.
12) Intangible assets are $2.3 million (43%) under the estimate due to the rescheduling of the purchase and acquisition of information and communication technology capital assets under the Department’s Strategic Information Plan.
13) The directive to scope out accounting standard AASB 16 for GOA and GROH periodic leased accommodation significantly impacts the Statement of Financial Position by removing arrangements previously classified as Right of use lease liabilities from the balance sheet. Refer to point (11) above.
14) A reclassification of current and non current revenue received in advance has caused offsetting differences when compared to the estimates.15) Amounts due to the Treasurer are $8 million (80%) under the estimate due to the Mines Safety and Inspection Levy actuals increasing as the
number of hours worked by the industry increases. This enabled the earlier than planned repayment of the Treasurers Advance previously provided in 2018-19.
16) Revenue received in advance is under by $11.4 million (100%) due to a reclassification of this from non-current liability to current liability.17) The directive to scope out accounting standard AASB 16 for GOA and GROH periodic leased accommodation significantly impacts the
Statement of Financial Position by removing arrangements previously classified as Right of use – lease liabilities from the balance sheet. Refer to points (11) and (13) above.
18) Accumulated surplus is over the estimate by $26 million (21%) due to the accumulation of funds in special purpose accounts, like the Mines Safety and Inspection Levy and Mining Rehabilitation Fund, over a number of years.
Variances between actual results for 2020 and 2019
e) Restricted cash and cash equivalents has increased by $34.6 million (10%) as a result of increases in Mining Rehabilitation Fund and property industry accounts.
f) Revenue received in advance has increased by $8.2 million (59%) in 2020 in comparison to 2019 due to a reclassification of current and non current revenue received in advance. Refer to point (14) above.
g) Employee provisions are higher in 2020 compared to 2019 by $11.5 million (44%) due to increased provisions for annual leave and long service leave which reflect a reduction in leave utilised during Covid-19 restrictions and a change in parameters used within the Actuarial report. Refer to points (1) and (18) above.
h) Revenue received in advance has decreased by $10.4 million (100%) in 2020 due to a reclassification of current and non current revenue received in advance. Refer to points (14) and (F) above.
Variance Note
Estimate Actual Actual Variance between
estimate and actual
Variance between actual
results for 2020 and 2019
2020 2020 2019$000 $000 $000 $000 $000
Statement of Cash Flows (Controlled Operations)CASH FLOWS FROM STATE GOVERNMENTService appropriation 19 i 110,124 132,016 123,006 (21,892) 9,010Capital appropriations 8,403 1,491 – 6,912 1,491Holding account drawdown 3,577 3,577 1,887 – 1,690Royalties for Regions Fund 223 209 5,224 14 (5,015)Net cash provided by State Government 122,327 137,293 130,117 (14,966) 7,176

123
NOTES TO THE FINANCIAL STATEMENTS
Variance Note
Estimate Actual Actual Variance between
estimate and actual
Variance between actual
results for 2020 and 2019
2020 2020 2019$000 $000 $000 $000 $000
CASH FLOWS FROM OPERATING ACTIVITIESPaymentsEmployee benefits 20 j (174,810) (170,067) (162,837) (4,743) (7,230)Supplies and services (44,555) (47,569) (54,741) 3,014 7,172Accommodation 21 (8,997) (18,974) (16,986) 9,977 (1,988)Grants and subsidies (13,236) (14,792) (17,248) 1,556 2,456Other payments (15,951) (10,893) (6,875) (5,058) (4,018)GST payments on purchases (7,507) (12,552) (10,263) 5,045 (2,289)Finance costs (2,901) – – (2,901) –
ReceiptsSale of goods and services 3,927 99 147 3,828 (48)User charges and fees k 160,208 160,277 169,536 (69) (9,259)Grants and contributions 624 184 234 440 (50)GST receipts on sales – 5,539 3,615 (5,539) 1,924GST receipts from ATO 7,507 7,064 6,340 443 724Other receipts l 9,894 10,619 7,118 (725) 3,501Net cash provided by/(used in) operating activities (85,797) (91,065) (81,960) 5,268 (9,105)
CASH FLOWS FROM INVESTING ACTIVITIESPaymentsProceeds from sale of non-current assets – 2 5 (2) (3)ReceiptsPurchase of non-current physical assets (4,722) (2,450) (4,461) (2,272) 2,011Net cash provided by/(used in) investing activities (4,722) (2,448) (4,456) (2,274) 2,008
CASH FLOWS FROM FINANCING ACTIVITIESReceiptsProceeds from borrowings – – – – –Repayments of borrowings (10,403) (8,000) (15,330) (2,403) 7,330Net cash from financing activities (10,403) (8,000) (15,330) (2,403) 7,330
Variance Note
Estimate Actual Actual Variance between
estimate and actual
Variance between actual
results for 2020 and 2019
2020 2020 2019$000 $000 $000 $000 $000
Net increase/(decrease) in cash and cash equivalents 21,405 35,780 28,371 (14,375) 7,409Cash balances transferred in – – – – –Cash balances transferred out – – – – –Cash and cash equivalents at the beginning of the period 22 m 334,255 358,456 330,085 (24,201) 28,371CASH AND CASH EQUIVALENTS AT THE END OF THE PERIOD 355,660 394,236 358,456 (38,576) 35,780

124
NOTES TO THE FINANCIAL STATEMENTS
Major Variance Narratives (Controlled Operations)
Variances between estimate and actual
19) Service Appropriations are higher than the estimate by $21.9 million (20%) due to continued unrestricted revenue shortfalls, increasing demand to internally fund Government initiatives, and a 12-month waiver of a range of business and occupational licence and registration fees paid by businesses affected by Covid-19. Refer to point (8) above.
20) Employee benefits expenses are lower than the estimate by $4.7 million (2.7%) due to increased provisions for annual leave and long service leave which reflect a reduction in leave utilised during Covid-19 restrictions and a change in parameters used within the Actuarial report. Refer to point (1) above.
21) The directive to scope out accounting standard AASB 16 for leased accommodation significantly impacts the statement of cash flow as previous accommodation expense for the lease obligation are replaced with rental expenses for operating leases. Also refer to point (13 ) above.
22) Overall cash held by the department has increased due to the accumulation of funds in special purpose accounts, like the Mines Safety and Inspection Levy and Mining Rehabilitation Fund, over a number of years.
Variances between actual results for 2020 and 2019
i) Service appropriations has increased in 2020 by $9.0 million (7%) in comparison to 2019 due to additional funding received as a result of continued unrestricted revenue shortfalls, increasing demand to internally fund Government initiatives, and a 12-month waiver of a range of business and occupational licence and registration fees paid by businesses affected by Covid-19. Refer to points (8) and (17) above.
j) Employee benefits expenses are higher in 2020 in comparison to 2019 by $7.2 million (4%) as a result of the conversion of contracted staff to permanent employees, and their associated on-costs for the financial year.
k) User charges and fees has decreased in 2020 by $9.3 million (5%) when compared to 2019 due to unrestricted revenue shortfalls and a 12-month waiver of a range of business and occupational licence and registration fees paid by businesses affected by Covid-19. Refer to point (8) above.
l) Other receipts has increased by $3.5 million (49%) in comparison to 2019 as a result of higher recoups of salary for work performed in line with various project agreements, which is partially offset due to the Covid-19 affected economy contracting. Refer point (c) above.
m) Cash and cash equivalents has increased by $28.4 million in 2020 compared to 2019 due to overall cash held by the department as a result of the accumulation of funds in special purpose accounts, like the Mines Safety and Inspection Levy and Mining Rehabilitation Fund, over a number of years.
9. Administered disclosuresThis section sets out all of the statutory disclosures regarding the financial performance of the department.
NoteAdministered income and expenses 9.1Explanatory statement for administered items 9.2Administered assets and liabilities 9.3Supplementary financial Information 9.4
9.1 Administered income and expenses
2020 2019$000 $000
IncomeFor transfer:Royalties and Rentals (a) 8,564,700 6,820,241Regulatory fees and fines 175 136Commonwealth Grants 4,374 2,491Appropriations 87,613 89,669Other revenue 28,108 28,940Total administered income 8,684,970 6,941,477
Expenses Petroleum (Submerged Lands) Act 1982 – 339Refunds of previous years' revenue 34,679 82,336Services and contracts 34,487 33,235Receipts paid into Consolidated Account (b) 8,721,261 5,773,642Grants and subsidies 62,205 3,708Total administered expenses 8,852,632 5,893,260
(b) Receipts paid into the Consolidated Account represent the transfer of non-retainable regulatory fees, fines and penalties and royalties to the Consolidated Account.
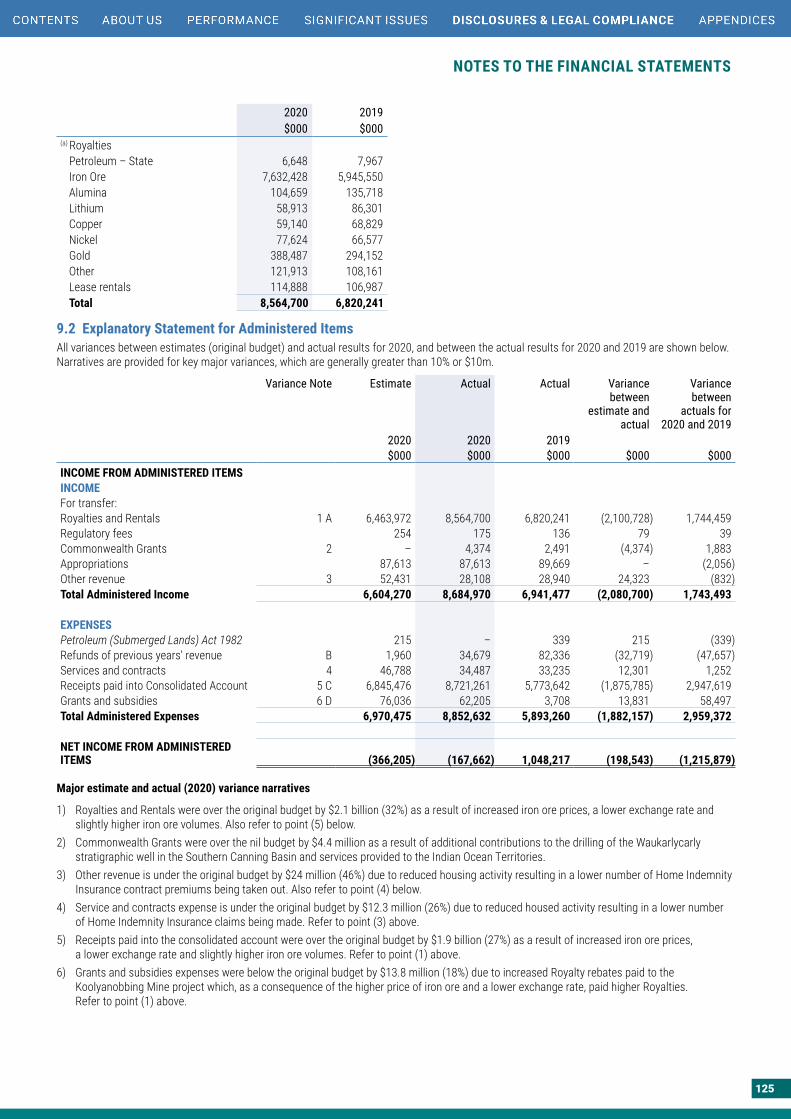
125
NOTES TO THE FINANCIAL STATEMENTS
2020 2019$000 $000
(a) RoyaltiesPetroleum – State 6,648 7,967Iron Ore 7,632,428 5,945,550Alumina 104,659 135,718Lithium 58,913 86,301Copper 59,140 68,829Nickel 77,624 66,577Gold 388,487 294,152Other 121,913 108,161Lease rentals 114,888 106,987Total 8,564,700 6,820,241
9.2 Explanatory Statement for Administered ItemsAll variances between estimates (original budget) and actual results for 2020, and between the actual results for 2020 and 2019 are shown below. Narratives are provided for key major variances, which are generally greater than 10% or $10m.
Variance Note Estimate Actual Actual Variance between
estimate and actual
Variance between
actuals for 2020 and 2019
2020 2020 2019$000 $000 $000 $000 $000
INCOME FROM ADMINISTERED ITEMSINCOMEFor transfer:Royalties and Rentals 1 A 6,463,972 8,564,700 6,820,241 (2,100,728) 1,744,459Regulatory fees 254 175 136 79 39Commonwealth Grants 2 – 4,374 2,491 (4,374) 1,883Appropriations 87,613 87,613 89,669 – (2,056)Other revenue 3 52,431 28,108 28,940 24,323 (832)Total Administered Income 6,604,270 8,684,970 6,941,477 (2,080,700) 1,743,493
EXPENSESPetroleum (Submerged Lands) Act 1982 215 – 339 215 (339)Refunds of previous years' revenue B 1,960 34,679 82,336 (32,719) (47,657)Services and contracts 4 46,788 34,487 33,235 12,301 1,252Receipts paid into Consolidated Account 5 C 6,845,476 8,721,261 5,773,642 (1,875,785) 2,947,619Grants and subsidies 6 D 76,036 62,205 3,708 13,831 58,497Total Administered Expenses 6,970,475 8,852,632 5,893,260 (1,882,157) 2,959,372
NET INCOME FROM ADMINISTERED ITEMS (366,205) (167,662) 1,048,217 (198,543) (1,215,879)
Major estimate and actual (2020) variance narratives
1) Royalties and Rentals were over the original budget by $2.1 billion (32%) as a result of increased iron ore prices, a lower exchange rate and slightly higher iron ore volumes. Also refer to point (5) below.
2) Commonwealth Grants were over the nil budget by $4.4 million as a result of additional contributions to the drilling of the Waukarlycarly stratigraphic well in the Southern Canning Basin and services provided to the Indian Ocean Territories.
3) Other revenue is under the original budget by $24 million (46%) due to reduced housing activity resulting in a lower number of Home Indemnity Insurance contract premiums being taken out. Also refer to point (4) below.
4) Service and contracts expense is under the original budget by $12.3 million (26%) due to reduced housed activity resulting in a lower number of Home Indemnity Insurance claims being made. Refer to point (3) above.
5) Receipts paid into the consolidated account were over the original budget by $1.9 billion (27%) as a result of increased iron ore prices, a lower exchange rate and slightly higher iron ore volumes. Refer to point (1) above.
6) Grants and subsidies expenses were below the original budget by $13.8 million (18%) due to increased Royalty rebates paid to the Koolyanobbing Mine project which, as a consequence of the higher price of iron ore and a lower exchange rate, paid higher Royalties. Refer to point (1) above.

126
NOTES TO THE FINANCIAL STATEMENTS
Major actual (2020) and comparative data (2019) variance narratives
A) Royalties and Rentals increased by $1.7 billion (26%) as a result of increased iron ore prices, a lower exchange rate and slightly higher iron ore volumes. Refer to point (1) above.
B) Refunds of previous year’s revenue decreased by $47.7 million (58%) as a result of decreased Royalty rebates paid to Magnetite producers.C) Receipts paid into the consolidated account increased by $2.95 billion (51%) as a result of increased iron ore prices and a marginally lower
exchange rate. Refer to points (1) and (A) above.D) Grants and subsidies increased by $58.5m (1,578%) as a result of Royalty Rebate for the Koolyanobbing Mine Financial Assistance project.
The increase in the rebate amounts is also due to increased iron ore prices, a lower exchange rate and slightly higher iron ore volumes. Refer to points (1) and (A) above.
9.3. Administered assets and liabilities2020 2019$000 $000
Current AssetsCash and cash equivalents 7,975 28,319Restricted cash and cash equivalents 430,880 423,970Receivables (a) 2,251,518 2,408,869Finance Lease Receivable 735 693Total Administered Current Assets 2,691,108 2,861,851
Non-Current AssetsFinance Lease Receivables 3,406 4,141Total Administered Non-Current Assets 3,406 4,141TOTAL ADMINISTERED ASSETS 2,694,514 2,865,992
Current LiabilitiesPayables 3,933 20,559Other liabilities 853 863Payments received in advance – –Other current liabilities 412,312 399,490Total Current Liabilities 417,098 420,912
TOTAL ADMINISTERED ASSETS 417,098 420,912
(a) This mainly represents royalties not collected as at 30 June 2020 on production which occurred prior to balance date.
Other matters of uncertainty
Mining companies owing royalties of approximately $5.4 million (2019: $5.5 million) are currently under administration and action is being taken to recover the funds that were due in the quarter that they went into administration. In the event that these funds are not collected, a bad debt may arise.
Home Indemnity Insurance
The contingent liability for Home Indemnity Insurance (HII) has been assessed to be the future claims liability (FCL) as at 30 June 2020. The FCL is an estimation of the future claims costs which will arise as a result of events which will occur in the future for currently in-force HII policies. In accordance with the PricewaterhouseCoopers actuarial report, the future claims liability has been assessed at an approximate value of $18,700,000 (2019: $20,012,000).

127
NOTES TO THE FINANCIAL STATEMENTS
9.4. Supplementary financial information(a) Write-offs
During the financial year, $586,883 (2019: $279,091) was written off the department’s asset register under the authority of:
2020 2019$000 $000
Director General 165 279The Minister 422 –
587 279
51 individually recognised debts which were written-off during the period related to lease rentals and licences recognised under The Mining Act.
(b) Act of grace payments
During the financial year, four (4) payments totalling $44.7 million (2019 $16.6 million from six payments) were paid out as act of grace payments for circumstances relating to and returned royalties under the authority of:
2020 2019$000 $000
The Minister – 5The Governor 44,737 16,613
44,737 16,618
Approval from the Governor was granted for payment of a royalty rebate on Iron Ore royalty revenue relating to the Koolyanobbing Mine.

128
APPENDICES
128

129
Act specific reportingThe department is required by some of the Acts that it administers to report details in the annual report concerning the performance of functions under that Act. Required details include the number, nature and outcome of compliance activities conducted under the powers of the Act, and other general issues relating to administration of the Act by the responsible person or body. E.g. Commissioner for Consumer Protection or the Plumbers Licensing Board.
Please note, some figures relating to ongoing complaints, investigations or inquiries for the start of the current financial year (2019–20), differ slightly to the ongoing figures for the end of the previous financial year (2018–19) provided within the department’s 2018–19 Annual Report. This is due to the data within the Complaints and Licensing System (CALS) and the Compliance Management System (CMS) used by the department being dynamic in nature.
Details and classifications of certain types of complaints, investigations or inquiries are updated as further information regarding these complaints, investigations or inquiries is obtained. The updates and potential reclassification can result in different ‘ongoing’ figures. Investigations may also result in multiple outcomes which may occur before the investigation is completed, therefore, the outcome total may not be consistent with the number of investigations undertaken.
Credit (Administration) Act 1984Regulation of consumer credit was referred to the Commonwealth pursuant to the Credit (Commonwealth Powers) Act 2010 (WA). The Credit (Administration) Act 1984 has not been repealed, but the department no longer carries out any regulatory operations in respect of it.
Debt Collectors Licensing Act 1964 Employment Agents Act 1976 Land Valuers Licensing Act 1978
a) The number, nature and outcomes of: i) investigations and inquiries undertaken by, or by the direction of, the Commissioner for the purposes of this Act
Outstanding as at 1 July 2019 0 Outstanding as at 1 July 2019 9 Outstanding as at 1 July 2019 1Alleged unlicensed activities 0 Alleged unlicensed activities 9 Valuation practices 1General compliance issues 0 General compliance issues 0 Licensing issues 0Conciliations 0 Conciliations 0 Issues with fees and charges 0Commenced 2019–20 5 Commenced 2019–20 10 Commenced 2019–20 2Alleged unlicensed activities 1 Alleged unlicensed activities 7 Valuation practices 2General compliance issues 1 General compliance issues 0 Licensing issues 0Conciliations 3 Conciliations 3 Issues with fees and charges 0Concluded 2019–20 3 Concluded 2019–20 17 Concluded 2019–20 2Alleged unlicensed activities 0 Alleged unlicensed activities 15 Valuation practices 2General compliance issues 0 General compliance issues 0 Licensing issues 0Conciliations 3 Conciliations 2 Issues with fees and charges 0Outcomes 3 Outcomes 17 Outcomes 2Complaint referred to another body 2 Admin warning accepted 9 Investigation – no breach identified 1
Education, advice or information given 4 Investigation – education, advice or information provided
1Education, advice or information given
1 No offence identified in complaint 2Corrective advice accepted 1No offence detected 1
ii) matters that have been brought before the State Administrative Tribunal (SAT)
No matters were brought before the SAT. No matters were brought before the SAT. No matters were brought before the SAT.
b) the number and nature of matters referred to in paragraph (a) that are outstandingThere were two matters outstanding as at 1 July 2020. One matter related to alleged unlicensed activities and one matter related to a failure to comply with licence or conditions.
There were two matters outstanding as at 1 July 2020. One related to alleged unlicensed activities and the other matter was related to refunds.
There was one matter outstanding as at 1 July 2020 alleging the land valuer failed to exercise due care, diligence and skill when providing a valuation report.
c) any trends or special problems that may have emergedThere were no trends of special problems that emerged.
The main cause of complaints continued to be allegations of persons operating as an employment agent without the necessary licence. There were no trends of special problems that emerged.
There were no trends of special problems that emerged.
d) forecasts of the workload of the Commissioner in performing functions under this Act in the year after to which this report relatesThere are no changes anticipated. There are no changes anticipated. There are no changes anticipated.
e) any proposals for improving the performance of the Commissioner’s functions under this ActThere were no recommendations for improving the performance of the Commissioner’s functions.
The proposals to amend the Employment Agents Act 1976 have received Ministerial approval, however due to the current COVID-19 pandemic this is not a key government priority at this time.
There were no recommendations for improving the performance of the Commissioner’s functions.

130
Motor Vehicle Dealers Act 1973 1 Settlements Agents Act 1981
a) The number, nature and outcomes of: i) investigations and inquiries undertaken by, or by the direction of, the Commissioner for the purposes of this Act
Outstanding as at 1 July 2019 74 Outstanding as at 1 July 2019 9Alleged unlicensed activities 29 Alleged unlicensed activities 8General compliance issues 22 General compliance issues 1Inquiries 23 Inquiries 0Commenced 2019–20 443 Commenced 2019–20 109Alleged unlicensed activities 31 Alleged unlicensed activities 66General compliance issues 51 General compliance issues 43Inquiries 361 Inquiries 0Concluded 2019–20 459 Concluded 2019–20 104Alleged unlicensed activities 38 Alleged unlicensed activities 61General compliance issues 59 General compliance issues 43Inquiries 362 Inquiries 0Investigation Outcomes 97 Outcomes 104Other outcome 25 Education, advice or information 56Education, advice or information given 24 No offence detected 15No action taken – other reason 19 Admin warning accepted 15No offence detected 15 No action taken 14Corrective advice accepted 14 Referred for investigation 3Inquiry Outcomes 362 Fidelity claim partially paid 1Agreement reached to settle 172Education, advice or information given 137Other outcome 26Complaint lapsed or withdrawn 15Sufficient evidence – consumer did notaccept resolution
12
ii) matters that have been brought before the State Administrative Tribunal (SAT)1
SAT Outcome 1 No matters were brought before the SAT.Respondent was disqualified from holding or obtaining a motor vehicle dealers licence in Western Australia and disqualified from being concerned in the management of a motor vehicle dealership until further order of the SAT.
b) the number and nature of matters referred to in paragraph (a) that are outstandingInvestigation matters outstanding as at 1 July 2020 36 Outstanding at 1 July 2020 14Unlicensed activity 23 Sale of a residential property 3General breach of legislation or regulation 11 Settlement of a real estate transaction 3Misrepresentation by sales staff 2 Settlement agents real estate licence 3Inquiry matters outstanding as at 1 July 2020 22 Settlement of a real estate sale 2Dispute cause unavailable at 1July 2020 13 Other 3Dispute about the extent of the problem 5Unreasonable delay by a trader 1On amount or type of redress 1Poor communication between trader and consumer 1Trader did not acknowledge that problem exists 1
c) any trends or special problems that may have emergedThe COVID-19 restrictions impacted the ability for proactive compliance officers to undertake physical inspections between April – June 2020.
Trust account issues and qualified audits continue to be the dominant issue for settlement agents.
1 Due to a change in reporting methodology regarding matters dealt with by Consumer Protection relating to the Motor Vehicle Dealers Act 1973, numbers reported in this section are lower than those reported in previous years. While the overall number of matters dealt with by Consumer Protection relating to motor vehicle dealers remains similar to previous years, matters relating solely to Australian Consumer Law complaints have been excluded from the 2019–20 figures.
2 The Motor Vehicle Dealers Act 1973 refers to “matters that have been brought before the State Administrative Tribunal by the Commissioner”. As a result, the Motor Vehicle Dealers Act 1973 only includes those with the Commissioner as the applicant.
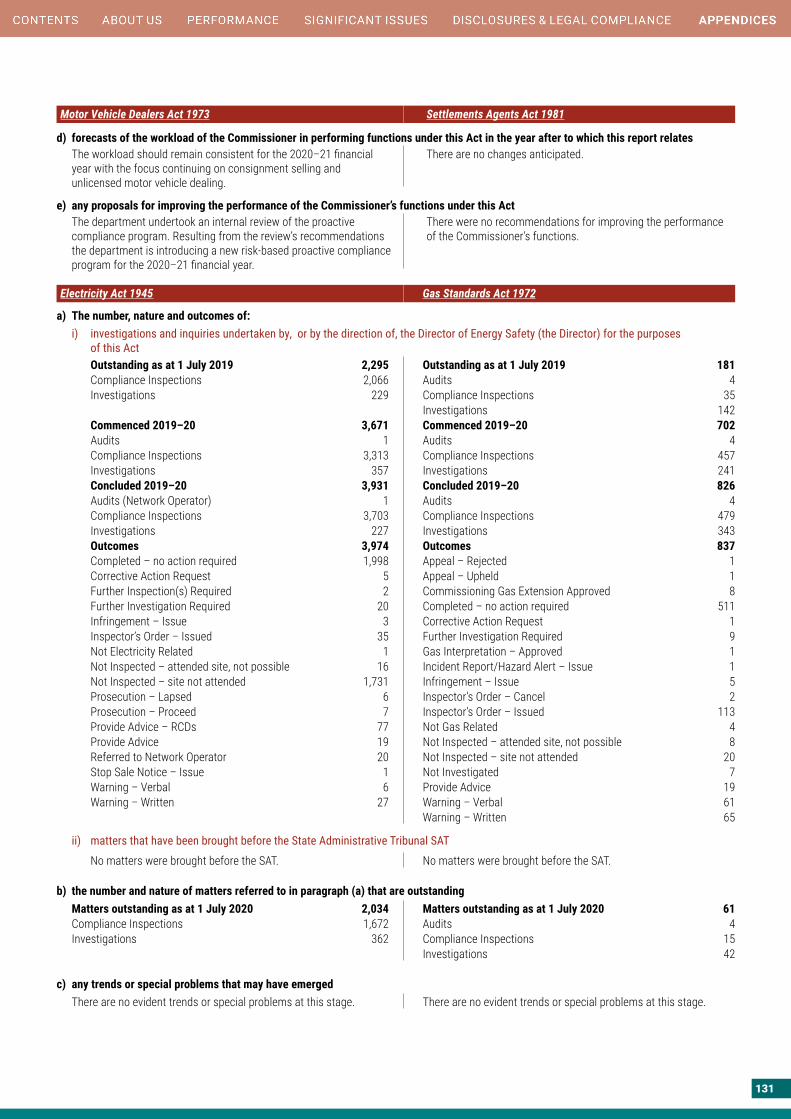
131
Motor Vehicle Dealers Act 1973 Settlements Agents Act 1981
d) forecasts of the workload of the Commissioner in performing functions under this Act in the year after to which this report relatesThe workload should remain consistent for the 2020–21 financial year with the focus continuing on consignment selling and unlicensed motor vehicle dealing.
There are no changes anticipated.
e) any proposals for improving the performance of the Commissioner’s functions under this ActThe department undertook an internal review of the proactive compliance program. Resulting from the review’s recommendations the department is introducing a new risk-based proactive compliance program for the 2020–21 financial year.
There were no recommendations for improving the performance of the Commissioner’s functions.
Electricity Act 1945 Gas Standards Act 1972
a) The number, nature and outcomes of: i) investigations and inquiries undertaken by, or by the direction of, the Director of Energy Safety (the Director) for the purposes
of this ActOutstanding as at 1 July 2019 2,295 Outstanding as at 1 July 2019 181Compliance Inspections 2,066 Audits 4Investigations 229 Compliance Inspections 35
Investigations 142Commenced 2019–20 3,671 Commenced 2019–20 702Audits 1 Audits 4Compliance Inspections 3,313 Compliance Inspections 457Investigations 357 Investigations 241Concluded 2019–20 3,931 Concluded 2019–20 826Audits (Network Operator) 1 Audits 4Compliance Inspections 3,703 Compliance Inspections 479Investigations 227 Investigations 343Outcomes 3,974 Outcomes 837Completed – no action required 1,998 Appeal – Rejected 1Corrective Action Request 5 Appeal – Upheld 1Further Inspection(s) Required 2 Commissioning Gas Extension Approved 8Further Investigation Required 20 Completed – no action required 511Infringement – Issue 3 Corrective Action Request 1Inspector’s Order – Issued 35 Further Investigation Required 9Not Electricity Related 1 Gas Interpretation – Approved 1Not Inspected – attended site, not possible 16 Incident Report/Hazard Alert – Issue 1Not Inspected – site not attended 1,731 Infringement – Issue 5Prosecution – Lapsed 6 Inspector’s Order – Cancel 2Prosecution – Proceed 7 Inspector’s Order – Issued 113Provide Advice – RCDs 77 Not Gas Related 4Provide Advice 19 Not Inspected – attended site, not possible 8Referred to Network Operator 20 Not Inspected – site not attended 20Stop Sale Notice – Issue 1 Not Investigated 7Warning – Verbal 6 Provide Advice 19Warning – Written 27 Warning – Verbal 61
Warning – Written 65
ii) matters that have been brought before the State Administrative Tribunal SAT
No matters were brought before the SAT. No matters were brought before the SAT.
b) the number and nature of matters referred to in paragraph (a) that are outstandingMatters outstanding as at 1 July 2020 2,034 Matters outstanding as at 1 July 2020 61Compliance Inspections 1,672 Audits 4Investigations 362 Compliance Inspections 15
Investigations 42
c) any trends or special problems that may have emergedThere are no evident trends or special problems at this stage. There are no evident trends or special problems at this stage.

132
Electricity Act 1945 Gas Standards Act 1972
d) forecasts of the workload of the Director’s in performing functions under this Act in the year after to which this report relatesThe department is currently carrying out a review of the Inspection System Plan Guidelines for Network Operators, which were last reviewed in 2013. Under Regulation 253 of the Electricity Regulations 1947 (Regulations), Network Operators are required to establish and maintain an effective system of inspection for consumer installations to their network. To enable the network operators to develop adequate Inspection System Plans (ISPs) the Director of Energy Safety is required under the same set of Regulations to issue guidelines setting out the technical, investigative, reporting, administrative and other requirements for network operators’ ISPs.
The department is working towards Inspection Policy Statement and Plan Guidelines in accordance with s.13J of the Act. These plans allow gas suppliers dispensation from 100 per cent inspection requirement (s.13) before commencing gas supply to consumer installations. The Guidelines will be implemented after stakeholder consultation and the plans activated after an appropriate implementation period. Although gas suppliers currently work to an approved plan, guidelines for their production aims to promote a consistent approach to inspection across the Western Australian gas industry including methods to identify and rectify defects, investigative conduct and incident reporting.
e) any proposals for improving the performance of the Director’s functions under this ActThere are no proposed changes at this stage. Information sharing powers between gas and plumbing inspectors
will be streamlined through regulation. Availing this information will enable greater identification of defects and unlicensed gas and plumbing work. The aim is to increase public safety and maintain safe workplaces.
Retirement Villages Act 1992
a) As soon as practicable after 30 June, but on or before 31 December, in each year, the Commissioner shall prepare and forward to the Minister a report on the operation of this Act during that year
i) Number ii) Nature iii) OutcomeOutstanding as at 1 July 2019 12 Outstanding as at 1 July 2019 12 Concluded 2019–20 48Compliance 4 Tenant enquiry 6 No action taken – other reason 23Investigation 2 General breach of legislation 3 No offence detected 9Conciliation 6 Trust account 1 Education, advice or information
given7
Commenced 2019–20 43 Conduct – other 1Compliance 6 Failure to act in the best interests
of the principal1 Agreement reached to settle 4
Investigation 3 Referred to other 3Conciliation 34 Other 2Concluded 2019–20 48 Concluded 2019–20 48Compliance 9 Tenant enquiry 26Investigation 2 Other 9Conciliation 37 General breach of legislation 6
Fees 4Landlord enquiry 3
b) matters that have been brought before the State Administrative Tribunal (SAT)No matters were brought before the SAT.
c) any trends or special problems that may have emergedIn many instances, complaints cannot be substantiated or are contractual.
d) forecasts of the workload of the Commissioner in performing functions under this Act in the year after to which this report relatesThere are no changes anticipated.
e) any proposals for improving the performance of the Commissioner’s functions under this ActThere are no proposed changes at this stage, however, a review of the Act is being conducted and will propose a number of reforms following consultation with operators and the community.
A number of consultation regulatory impact statement (CRIS) papers have been released proposing reform options relating to the Act, including the establishment of a public database of retirement villages to assist consumers and the administration of the Act. A final CRIS to be released in 2021 will consider options to improve the enforcement processes and dispute resolution.
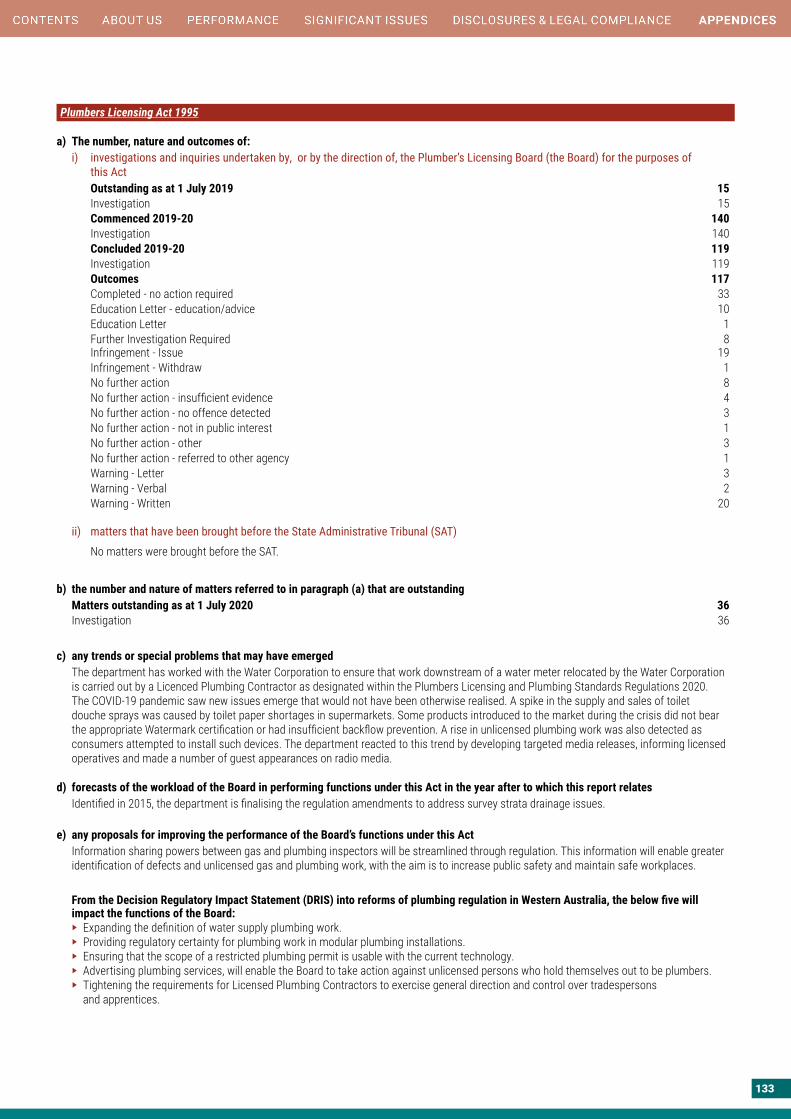
133
Plumbers Licensing Act 1995
a) The number, nature and outcomes of: i) investigations and inquiries undertaken by, or by the direction of, the Plumber’s Licensing Board (the Board) for the purposes of
this ActOutstanding as at 1 July 2019 15Investigation 15Commenced 2019-20 140Investigation 140Concluded 2019-20 119Investigation 119Outcomes 117Completed - no action required 33Education Letter - education/advice 10Education Letter 1Further Investigation Required 8Infringement - Issue 19Infringement - Withdraw 1No further action 8No further action - insufficient evidence 4No further action - no offence detected 3No further action - not in public interest 1No further action - other 3No further action - referred to other agency 1Warning - Letter 3Warning - Verbal 2Warning - Written 20
ii) matters that have been brought before the State Administrative Tribunal (SAT)
No matters were brought before the SAT.
b) the number and nature of matters referred to in paragraph (a) that are outstandingMatters outstanding as at 1 July 2020 36Investigation 36
c) any trends or special problems that may have emergedThe department has worked with the Water Corporation to ensure that work downstream of a water meter relocated by the Water Corporation is carried out by a Licenced Plumbing Contractor as designated within the Plumbers Licensing and Plumbing Standards Regulations 2020. The COVID-19 pandemic saw new issues emerge that would not have been otherwise realised. A spike in the supply and sales of toilet douche sprays was caused by toilet paper shortages in supermarkets. Some products introduced to the market during the crisis did not bear the appropriate Watermark certification or had insufficient backflow prevention. A rise in unlicensed plumbing work was also detected as consumers attempted to install such devices. The department reacted to this trend by developing targeted media releases, informing licensed operatives and made a number of guest appearances on radio media.
d) forecasts of the workload of the Board in performing functions under this Act in the year after to which this report relatesIdentified in 2015, the department is finalising the regulation amendments to address survey strata drainage issues.
e) any proposals for improving the performance of the Board’s functions under this ActInformation sharing powers between gas and plumbing inspectors will be streamlined through regulation. This information will enable greater identification of defects and unlicensed gas and plumbing work, with the aim is to increase public safety and maintain safe workplaces.
From the Decision Regulatory Impact Statement (DRIS) into reforms of plumbing regulation in Western Australia, the below five will impact the functions of the Board: ‣ Expanding the definition of water supply plumbing work. ‣ Providing regulatory certainty for plumbing work in modular plumbing installations. ‣ Ensuring that the scope of a restricted plumbing permit is usable with the current technology. ‣ Advertising plumbing services, will enable the Board to take action against unlicensed persons who hold themselves out to be plumbers. ‣ Tightening the requirements for Licensed Plumbing Contractors to exercise general direction and control over tradespersons
and apprentices.

134
Real Estate and Business Agents Act 1978
a) The number, nature and outcomes of: i) investigations and inquiries undertaken by, or by the direction of, the Commissioner for the purposes of this Act
Outstanding as at 1 July 2019 359General compliance 185Financial compliance 174Commenced 2019–20 1,218General compliance 628Financial compliance 590Concluded 2019–20 1,384General compliance 706Financial compliance 678Investigation Outcomes 1,384Education, advice or information given 783No offence detected 236Admin warning accepted 154No action taken 105Other outcome 49Referred for investigation 20No jurisdiction/referred externally 20Fidelity claim approved/partially approved 17
ii) matters that have been brought before the State Administrative Tribunal (SAT)
SAT Outcome 19Commissioner’s Decision Affirmed Application to review the Commissioner’s decision to refuse granting of a real estate and business agent’s licence.Disqualified ‣ Failure to act fairly and honestly in his dealings as a registered Sales Representative. ‣ Misconduct and unfit to hold a certificate of registration.
Reprimanded ‣ Carrying out the functions of a real estate and business sales representative without holding a valid certificate of registration. ‣ Failed to pay the bond administrator the bonds received in relation to residential tenancy agreements. ‣ Person in bona fide control at all material times failed to take all reasonable steps to ensure that every person employed in the business
complied with the provisions of the Code. ‣ Failing to hold a certificate of registration while carrying out the functions of a real estate sales representative. ‣ Employing a person as sales representative without that person been registered as a sales representative. ‣ Giving commission, reward or other valuable consideration to a person who was not a registered sales representative. ‣ Failing to take reasonable steps to ensure that every person employed in the agency business complied with the provisions of the Act. ‣ Failed to carry out any title and strata plan searches prior to or after the Selling Agreement had been entered into. ‣ Being the director and person in bona fide control of the business and failure to exercise due skill, care and diligence. ‣ Failed to complete the compulsory professional development requirements requirements outlined in his registration. ‣ Demanded or received a commission, reward greater than the amount agreed in writing. ‣ Failed to exercise due care, diligence and skill when acting for a client. ‣ On three occasions failed to exercise due care, diligence and skill in that it failed to pay the bond administrator the amounts of the
bond received. ‣ Person in bona fide control of the business failed to take all reasonable steps to ensure that every person employed in the business
complied with the provisions of the Code.Supervision order granted ‣ Liquidator to the company advised monies in trust accounts would not form part of company’s assets and refused to take control of
those monies. ‣ Employee of the Agency made unauthorised withdrawals from the Agency’s trust account.
iii) matters that have been dealt with through the conciliation process1
Outstanding as at 1 July 2019 0
Commenced 2019–20 75Tenant enquiry 25Landlord enquiry 10Other nature 17Sale of property 14Advertising/marketing 6Rental bonds 3
1 Unlike the other Acts, the Real Estate and Business Agents Act 1978 specifically states that the number, nature and outcome of matters that have been dealt with through the conciliation process under this Act are required to be included in the Annual Report.

135
Real Estate and Business Agents Act 1978Concluded 2019–20 75Tenant enquiry 25Landlord enquiry 10Other nature 17Sale of property 14Advertising/marketing 6Rental bonds 3
Conciliation outcomes 75No offence detected 24Education, advice or information given 17No jurisdiction/referred to other 13Other outcome 9Agreement reached to settle 6No action taken 6
b) the number and nature of matters referred to in paragraph (a) that are outstandingInvestigation Matters Outstanding at 1 July 2020 192Audit Matters 47Other Nature 36Misappropriation of funds 28Failure to act in the best interests of the principal 22Trust Account 18Unlicensed, unregistered 16Registration, licensing requirement 14Property Management 11
Conciliation Matters Outstanding at 1 July 2020 0There were no outstanding conciliation matters.
c) any trends or special problems that may have emergedThere were no trends or special problems identified.
d) forecasts of the workload of the Commissioner in performing functions under this Act in the year after to which this report relatesThere are no changes anticipated.
e) any proposals for improving the performance of the Commissioner’s functions under this ActThere were no recommendations for improving the performance of the Commissioner’s functions.

136
Government policy requirementsBoards and committees remunerationThe department is required to report on the individual and aggregate costs of remunerating all positions on boards and committees as defined in Premier’s Circular 2019/07 – State Government Boards and Committees.
BOARD OF EXAMINERS
Board of Examiners – Mine Managers and Underground Supervisors Certificate Board
Position NameType of
remunerationPeriod of
membership
Gross / actual remuneration
2019–20 FYChair Mr Andrew Chaplyn
DMIRS RepresentativeIneligible 12 months $0
Member Mr Anil AtriDMIRS Representative
Ineligible 12 months $0
Member Mr Russell Cole Representing Chamber of Mines and Energy of WA
Did not apply 12 months $0
Member Ms Holly AlldayRepresenting Chamber of Mines and Energy of WA
Did not apply 12 months $0
Total $0
Board of Examiners – Quarry Managers Certificate Board
Position NameType of
remunerationPeriod of
membership
Gross / actual remuneration
2019–20 FYChair Mr Andrew Chaplyn
DMIRS RepresentativeIneligible 12 months $0
Member Mr Anil AtriDMIRS Representative
Ineligible 12 months $0
Member Mr John SoubotianRepresenting Department of Technical and Further Education (TAFE)
Did not apply 12 months $0
Member Mr Andrew HaslamRepresenting Chamber of Mines and Energy of WA
Did not apply 12 months $0
Member Mr Robert MurdochRepresenting Chamber of Mines and Energy of WA
Did not apply 12 months $0
Total $0
Board of Examiners – Winding Engine Drivers Certificate Board
Position NameType of
remunerationPeriod of
membership
Gross / actual remuneration
2019–20 FYChair Mr Andrew Chaplyn
DMIRS RepresentativeIneligible 12 months $0
Member Mr Jose SanchezDMIRS Representative
Ineligible 12 months $0
Total $0

137
BUILDING SERVICES BOARD
Position NameType of
remunerationPeriod of
membership
Gross / actual remuneration
2019–20 FYChair Ms Genevieve Cleary Full/half day 12 months $5,8041
Deputy Chair / Member
Mr Helmut Schwanke Full/half day Full/half day
12 months $8,6841
Member Ms Faye Stewart Full/half day 12 months $6,626Member Mr Laurence Kruize Full/half day 12 months $5,630Member Ms Joanne Motteram Full/half day 12 months $6,301Member Mr Jack Mast Full/half day 12 months $6,799Member Ms Serena Giudice Full/half day 12 months $5,803Member Ms Angela Lefante Full/half day 12 months $6,301Member Ms Deborah Smith Full/half day 12 months $6,799Total $58,747
1 Ms Cleary was an apology for six meetings during 2019–20 and Deputy Chair Mr Schwanke acted as Chair. As such he was remunerated at the Chair rate for these meetings.
CHARITABLE COLLECTIONS ADVISORY COMMITTEE
Position NameType of
remunerationPeriod of
membership
Gross / actual remuneration
2019–20 FYChair Ms Annette Frazer Half day 12 months $4,810Member Ms Helen Grzyb Half day 12 months $3,000Member Mr Henry Thong Half day 12 months $3,000Member Dr Jane Hutchison Half day 12 months $3,000Member Ms Rachelle Spyker Half day 12 months $3,000Total $16,810
COMMISSION FOR OCCUPATIONAL SAFETY AND HEALTH
Position NameType of
remunerationPeriod of
membership
Gross / actual remuneration
2019–20 FYChair Ms Stephanie Mayman Annual1 12 months $29,9442
Member Mr Darren Kavanagh Ineligible 12 months $0Member Mr Andrew Chaplyn Ineligible 12 months $0Member Dr Julia Norris Half day 9 months $1,188Member Dr Matthew Davies Half day 12 months $3,960Member Dr Lin Fritschi Half day 12 months $2,376Member Dr Barry Chesson Half day 3 months $1,584 Member Ms Adrienne LaBombard Half day 12 months $3,168Member Ms Andrea Roelofs Half day 12 months $3,168Member Mr Paul Moss Did not apply 9 months $0Member Mr Owen Whittle Did not apply 12 months $0Member Mr Glenn McLaren Did not apply 12 months $0Member Ms Joy Barrett Did not apply 12 months $0Total $45,388
1 The appointment of the Ms Mayman as Chair, Commission for Occupational Safety and Health (COSH), concluded on 5 June 2020.2 The Chair, COSH, is paid a stipend of $22,691 per annum. This stipend covers the sitting fee payable for chairing COSH committees and
working groups. Effective 9 October 2018, the Chair, COSH, is also paid an allowance of $9,059 per annum. This allowance covers the additional and strategic functions undertaken in association with the Work Health and Safety Bill. The allowance is in place for a period of two years or until the Bill is passed by Parliament, whichever is the sooner.

138
Agricultural Working Group
Position NameType of
remunerationPeriod of
membership
Gross / actual remuneration
2019–20 FYChair Ms Stephanie Mayman Annual1 12 months $0 Member Mr Darren Kavanagh Ineligible 12 months $0Member Mr Owen Whittle, UnionsWA Half day 12 months $02 Member Mr Antony Pearson, UnionsWA Half day 12 months $1,992Member Ms Margaret Hector,
Country Women’s Association of Western AustraliaHalf day 5 months $598
Member Ms Nicola Kelliher, Country Women’s Association of Western Australia
Half day 7 months $896
Member Trevor Naughton, Chamber of Commerce and Industry of Western Australia
Half day 12 months $1,145
Member Melanie Windust, Chamber of Commerce and Industry of Western Australia
Half day 2 months $598
Member Mr Peter Nunn, Chamber of Commerce and Industry of Western Australia
Half day 12 months $996
Member Mr Darren Spencer, WA Shearing Industry Association
Half day 12 months $1,494
Member Mr Doug Hall, Pastoralists and Graziers Association of Western Australia
Half day 12 months $1,245
Member Mr Trevor Whittington, WA Farmers Federation
Half day 12 months $498
Total $9,462
1 Included within COSH remuneration.2 Due to non-attendance during 2019–20 , a sitting fee was not paid.
Construction Industry Safety Advisory Committee
Position NameType of
remunerationPeriod of
membership
Gross / actual remuneration
2019–20 FYChair Mr Darren Kavanagh Ineligible 12 months $0Member Mr Chris Kirwin Ineligible 12 months $0Member Mr Bob Benkesser
Construction, Forestry, Mining and Energy UnionHalf day 12 months $1,992
Member Mr Owen Whittle, UnionsWA Half day 12 months $1,245Member Mr Steve McCartney,
Australian Manufacturing Workers’ UnionHalf day 12 months $1,494
Member Mr Kim Drew, Chamber of Commerce and Industry of Western Australia
Half day 12 months $1,245
Member Mr Kim Richardson, Master Builders Association of Western Australia
Did not apply 9 months $0
Member Ms Michelle DeGalt-Rohlf, Master Builders Association of Western Australia
Did not apply 3 months $0
Member Ms Rachelle Gill, Housing Industry Association
Did not apply 3 months $0
Member Ms Kiran Kaur, Housing Industry Association
Did not apply 9 months $0
Total $5,976

139
Mining Industry Advisory Committee
Position NameType of
remunerationPeriod of
membership
Gross / actual remuneration
2019–20 FYChair Mr Andrew Chaplyn Ineligible 12 months $0Member Ms Christina Folley Ineligible 12 months $0Member Dr Gary Bryant Did not apply 12 months $0Member Ms Meagan Smart Half day 12 months $1,305Member Ms Helen Anderson Half day 12 months $783Member Mr Peter Burton Did not apply 12 months $0Member Mr Gregory Busson Did not apply 12 months $0Member Mr Glenn McLaren Did not apply 12 months $0Member Mr Gregory Stagbouer Did not apply 12 months $0Member Mr Robert Watson Did not apply 12 months $0Member Ms Pearl Lim Did not apply 12 months $0Member Ms Elysha Millard Did not apply 12 months $0Total $2,088
Occupational Diving Working Group The Occupational Diving Working Group first met in August 2019, with its final meeting in May 2019. These sitting fees were paid during 2019–20 .
Position NameType of
remunerationPeriod of
membership
Gross / actual remuneration
2019–20 FYChair Mr Darren Kavanagh Ineligible N/A $0Member Mr Owen Whittle,
UnionsWAHalf day N/A $249
Member Mr Jack McCabe, UnionsWA
Half day N/A $249
Member Mr Aaron Irving, Chamber of Commerce and Industry of Western Australia
Half day N/A $249
Member Mr Arnold Piccoli, Chamber of Commerce and Industry of Western Australia
Half day N/A $249
Member Mr Warren Starr, University of Western Australia (Expert member)
Ineligible N/A $0
Member Mr Anthony Hart, Department of Primary Industries and Regional Development (Expert member)
Ineligible N/A $0
Total $996
CONSUMER ADVISORY COMMITTEE
Position NameType of
remunerationPeriod of
membership
Gross / actual remuneration
2019–20 FYChair Mr Scott Phillips Half day 12 months $2,280Member Ms Linda Castle Half day 12 months $1,000Member Dr Jennie Gray Did not apply 6 months $0Member Ms Bev Jowle Half day 9 months $1,000Member Ms Bronwyn Kitching Half day 12 months $1,460Member Ms Kathryn Lawrence Half day 12 months $1,000Member Ms Chrisandra Lukjanowski Half day 6 months $250Total $6,990

140
ELECTRICAL LICENSING BOARD
Position NameType of
remunerationPeriod of
membership1
Gross / actual remuneration
2019–20 FYChair2 Mr Kevan McGill Full/half day 7 months $5,820Chair3 /Member Mr Peter Beveridge Full/half day 11 months $5,630Member Mr Momcilo Andric Full/half day 11 months $3,420Member Mr Geoff Kelly Full/half day 11 months $4,980Member Mr Don Saunders Ineligible 7 months $0Member Ms Fiona McGaughey Full/half day 12 months $4,080Member Mr John Ripp Full/half day 11 months $2,120Member Mr Peter Carter Full/half day 11 months $3,880Member Ms Natalia Kostecki-Baranski Full/half day 4 months $1,760Member Mr Christopher Sweeting Full/half day 4 months $1,760Member Ms Melissa Mammone Ineligible 4 months $0Total $33,450
1 There was no Electrical Licensing Board meeting for the month of February 2020 as Board appointments were in progress. As a result, the maximum membership for 2019–20 is 11 months.
2 Mr McGill was Chair from June 2019 to end of January 2020. 3 Mr Beveridge was a member prior to being appointed Chair from March 2020.
LEGISLATIVE ADVISORY COMMITTEE (WORK HEALTH AND SAFETY)
Position NameType of
remunerationPeriod of
membership
Gross / actual remuneration
2019–20 FYChair Ms Stephanie Mayman Annual 12 months $01 Member Dr Ivor Roberts Ineligible 12 months $0Member Mr Anil Atri Ineligible 12 months $0Member Mr Owen Whittle,
UnionsWAHalf day 12 months $2,241
Member Ms Elysha Millard, Chamber of Minerals and Energy of Western Australia
Half day 9 months $1,992
Member Mr Paul Moss, Chamber of Commerce and Industry of Western Australia
Half day 12 months $1,743
Total $5,976
1 Included within COSH remuneration.
MINE SURVEY BOARD
Position NameType of
remunerationPeriod of
membership
Gross / actual remuneration
2019–20 FYChair Mr Andrew Chaplyn
DMIRS RepresentativeIneligible 12 months $0
Member Mr Martin Robinson Representing Curtin University and TAFE
Did not apply 12 months $0
Member Mr Anthony Snow Representing Surveyor General
Did not apply 7 months $0
Member Mr Leigh Coaker Representing Institution of Surveyors Australia
Did not apply 5 months $0
Member Mr Russell Haigh Representing Institution of Surveyors Australia
Did not apply 2 months $0
Member Mr Shane Watson Representing Institution of Engineering and Mining Surveyors Australia
Did not apply 12 months $0
Total $0

141
MOTOR VEHICLES ADVISORY COMMITTEE
Position NameType of
remunerationPeriod of
membership
Gross / actual remuneration
2019–20 FYChair Ms Lanie Chopping Ineligible 5 months $0Chair (former) Mr David Hillyard Ineligible 7 Months $0Member Mr Stephen Moir Did not apply 12 months $0Member Ms Julie Wadley Did not apply 12 months $0Member Ms Robyn Cook Did not apply 12 months $0Member Mr Patrick Browne Did not apply 12 months $0Member Mr Phillip Lytton Did not apply 12 months $0Member Ms Sarah Macaulay Did not apply 12 months $0Member Ms Lesley Yates Did not apply 12 months $0Total $0
PLUMBERS LICENSING BOARD
Position NameType of
remunerationPeriod of
membership
Gross / actual remuneration
2019–20 FYChair Ms Shona Zulsdorf Full/half day 12 months $9,170Member Ms Sonia McKeiver Full/half day 12 months $6,008Member Mr Murray Thomas Full/half day 12 months $5,557Member Mr Brian Bintley Full/half day 12 months $4,961Member Mr Michael Wynne Full/half day 12 months $4,510Member Ms Gladys Demissie Full/half day 12 months $4,510Member Ms Diane Massara Full/half day 9 months $4,059Member Ms Tehani Mahony Full day 1 month $451Total $39,226
PROPERTY INDUSTRY ADVISORY COMMITTEE
Position NameType of
remunerationPeriod of
membership
Gross / actual remuneration
2019–20 FYChair Ms Lanie Chopping Ineligible 5 months $0Chair (former) Mr David Hillyard Ineligible 7 months $0Member Ms Fran Andrews Did not apply 12 months $0Member Mr Dion Dosualdo Did not apply 12 months $0Member Ms Andrea Constable Did not apply 12 months $0Member Ms Kara Grant Did not apply 3 months $0Member Ms Rachel Cosentino Did not apply 5 months $0Member Ms Lisa Joyce Did not apply 12 months $0Member Mr Patrick Lilburne Did not apply 12 months $0Member Mr Brad Potter Did not apply 12 months $0Member Mr Neville Pozzi Did not apply 12 months $0Total $0
Audit and Risk Committee
Following the release of the revised Treasurer’s Instruction 1201, in December 2019, fully independent Audit and Risk Committee was established. During 2019–20 Mr Andrew Cox was remunerated $4,565 as Chair (and $2,460 as member of the former Audit and Risk Subcommittee) and all other members were ineligible for payment.

Department of Mines, Industry Regulation and Safety
Mineral House, 100 Plain Street, East Perth, Whadjuk Noongar Country Western Australia 6004
Telephone: 1300 136 237 National Relay Service: 13 36 77
[email protected] dmirs_wa
www.dmirs.wa.gov.au