Embed Size (px)
Citation preview

Quellen- und Literaturverzeichnis
Abbott, Andrew (1990): Conceptions of Time and Events in Social Science Methods. Historical Meth-ods & Research 23(4): 140-150.
Abbott, Andrew (1992): From causes to events notes on narrative positivism. Sociological Methods & Research 20(4): 428-455.
Abbott, Andrew (1995): Sequence Analysis - New Methods for Old Ideas. Annual Review of Sociology 21(1): 93-113.
Abbott, Andrew/Forrest, John (1986): Optimal Matching Methods for Historical Sequences. Journal of Interdisciplinary History 16(3): 471-94.
Abbott, Andrew/Hrycak, Alexandra (1990): Measuring resemblance in sequence data: an optimal matching analysis of musician’s careers. American Journal of Sociology 96(1): 144–185.
Abbott, Andrew/Tsay, Angela (2000): Sequence Analysis and Optimal Matching Methods in Sociology: Review and Prospect. Sociological Methods & Research 29(1): 3-33.
Aisenbrey, Silke (2000): Optimal Matching Analyse. Anwendungen in den Sozialwissenschaften. Wies-baden: VS Verlag für Sozialwissenschaften.
Aisenbrey, Silke/Fasang, Anette Eva (2010): New life for old ideas. The ‘Second Wave’ of Sequence Analysis. Sociological Methods & Research 38(3): 420-462.
Antonini, Matteo/Bühlmann, Dr. Felix/Heeb, Jean-Luc (2016): Trajectories of vulnerability: A multi-dimensional approach. How are employment, cohabitation and health related? In: Ritschard, Gilbert/Studer, Matthias (Hrsg.): Proceedings of the International Conference on Sequence Analysis and Related Methods, Lausanne, June 8-10, 2016, S. 561-569.
Anyadike-Danes, Michael/McVicar, Duncan (2010): My Brilliant Career - Characterizing the Early La-bor Market Trajectories of British Women From Generation X. Sociological Methods & Re-search 38(3): 482-512.
Asendorpf, Jens B. (2008): Living Apart Together: Alters- und Kohortenabhängigkeit einer heteroge-nen Lebensform. Kölner Zeitschrift für Soziologie und Sozialpsychologie 60(4): 749-764.
Aust, Folkert/Gilberg, Reiner/Hess, Doris/Kleudgen, Martin/Steinwede, Angelika (2011): Methoden-bericht NEPS Etappe 8: Befragung von Erwachsenen - Haupterhebung 1. Welle 2009/2010. Bonn: infas.
Backes, Gertrud (2014): Grundlagen der soziologischen Lebenslaufforschung. In: Wahl, Hans-Wer-ner/Kruse, Andreas (Hrsg.): Lebensläufe im Wandel. Stuttgart: Kohlhammer, S. 39-50.
Beck, Ulrich (1986): Risikogesellschaft: Auf dem Weg in eine andere Moderne. Frankfurt am Main: Suhrkamp.
Beck-Gernsheim, Elisabeth (1983): Vom "Dasein für andere" zum Anspruch auf "ein Stück eigenes Leben": Individualisierungsprozesse im weiblichen Lebenszusammenhang. Soziale Welt 34(3): 307-340.
Bernhardt, Eva/Hoem, Britta (1985). Cohabitation and social background: Trends observed for Swe-dish women born between 1936 and 1960. European Journal of Population 1(4): 375-395.
© Springer Fachmedien Wiesbaden GmbH 2018O. Zimmermann, Dimensionen von Destandardisierung,https://doi.org/10.1007/978-3-658-19949-4
324 Quellen- und Literaturverzeichnis
Biemann, Torsten (2009): Sequenzdatenanalyse. In: Albers, Sonke/Klapper, Daniel/Konradt, Udo/Walter, Achim/Wolf, Joachim (Hrsg.): Methodik der empirischen Forschung. Wiesba-den: Springer Gabler.
Biemann, Torsten (2011): A transition-oriented approach to optimal matching. Sociological Method-ology 41(1): 195-221.
Billari, Francesco C./Piccarreta, Raffaella (2007): Clustering work and family trajectories by using a divisive algorithm. Journal of the Royal Statistical Society: Series A (Statistics in Society) 170(4): 1061-1078.
Billari, Francesco C./Piccarreta, Raffaella (2005): Analyzing Demographic Life Courses Through Se-quence Analysis. Mathematical Population Studies 12(2): 81-106.
Blair-Loy, Mary (1997): Career patterns of executive women in finance: An optimal matching analysis. American Journal of Sociology 104(5): 1346-1397.
Blossfeld, Hans-Peter/Klijzing, Erik/Mills, Melinda/Kurz, Karin (2005): Globalization, uncertainty and youth in society: The losers in a globalizing world. London: Routledge.
Blossfeld, Hans-Peter/ Buchholz, Sandra/ Hofäcker, Dirk/ Hofmeister, Heather/Kurz, Karin/Mills, Me-linda (2007): Globalisierung und die Veränderung sozialer Ungleichheiten in modernen Ge-sellschaften. Eine Zusammenfassung der Ergebnisse des GLOBALIFE-Projektes. Kölner Zeit-schrift für Soziologie und Sozialpsychologie 59(4): 667-691.
Blossfeld, Hans-Peter/Hofäcker, Dirk/Raab, Marcel/Ruland, Michael/Buchholz, Sandra (2009): Globa-lisierungsprozesse in modernen Gesellschaften. In: Pfau-Effinger, Birgit/Magdalenić, Slađana Sakač/Wolf, Christof (Hrsg.): International vergleichende Sozialforschung. Wiesbaden: VS Verlag für Sozialwissenschaften, S. 19-39.
Blossfeld, Hans-Peter/Huinink, Johannes (1991): Human Capital Investments or Norms of Role Tran-sition? How Women's Schooling and Career Affect the Process of Family Formation. Ameri-can Journal of Sociology 97(1): 143-168.
Blossfeld, Hans-Peter/Huinink, Johannes (2001): Lebensverlaufsforschung als sozialwissenschaftliche Forschungsperspektive. Themen, Konzepte, Methoden und Probleme. BIOS : Zeitschrift für Biographieforschung, Oral History und Lebensverlaufsanalysen 14(2): 5-31.
Blossfeld, Hans-Peter/Roßbach, Hans-Günther/von Maurice, Jutta (Hrsg.) (2011): Education as a Life-long Process - The German National Educational Panel Study (NEPS). Zeitschrift für Erzie-hungswissenschaft, Sonderheft 14: 19-34.
Bundesministerium für Familie, Soziales, Frauen und Jugend (2012): Geburten und Geburtenverhal-ten in Deutschland. http://www.bmfsfj.de/RedaktionBMFSFJ/Abteilung2/Pdf-Anlagen/Ge-burten-und-geburtenverhalten-in-D,property=pdf,bereich=bmfsfj,sprache=de,rwb=true.pdf (zuletzt eingesehen am 03.03.2017)
Böhnke, Petra/Zeh, Janina/Link, Sebastian (2015): Atypische Beschäftigung im Erwerbsverlauf: Ver-laufstypen als Ausdruck sozialer Spaltung? Zeitschrift für Soziologie 44(4): 234-252.
Boll, Christina/Bonin, Holger/Gerlach, Irene/Hank, Karsten/Laß, Inga/Nehrkorn-Ludwig, Marc-André/Reich, Nora/Reuß, Karsten/Schnabel, Reinhold/Schneider, Ann Kristin/Stichnoth, Hol-ger/Wilke, Christina B. (2013): Geburten und Kinderwünsche in Deutschland: Bestandsauf-nahme, Einflussfaktoren und Datenquellen - Gutachten im Auftrag der Prognos AG für das Bundesministerium der Finanzen und das Bundesministerium für Familie, Senioren, Frauen und Jugend. http://ftp.zew.de/pub/zew-docs/gutachten/TeilstudieFertilitaet2013.pdf (Zu-letzt eingesehen am 25.04.2017).
Born, Claudia (2001): Modernisierungsgap und Wandel. Angleichung geschlechterspezifischer Le-bensführungen? In: Born, Claudia/Krüger, Helga (Hrsg.): Individualisierung und Verflechtung.
Quellen- und Literaturverzeichnis 325
Geschlecht und Lebenslauf im deutschen Lebenslaufregime. Weinheim/München: Juventa, S. 29-54.
Bourdieu, Pierre (1983): Ökonomisches Kapital – Kulturelles Kapital – Soziales Kapital. In: Bourdieu, Pierre (Hrsg.): Die verborgenen Mechanismen der Macht. Hamburg: VSA, S. 49-80.
Breiman, Leo (2001a): Statistical Modeling: The Two Cultures. Statistical Science 16(3): 199-215. Breiman, Leo (2001b): Statistical Modeling: The Two Cultures: Rejoinder. Statistical Science 16(3):
226-31. Brückner, Hannah/Mayer, Karl Ulrich (2005): Destandardization of the Life Course: What it Might
Mean? And if it Means Anything, Whether it Actually Took Place? Advances in Life Course Research 9(1): 27-53.
Brüderl, Josef/Klein, Thomas (2003): Die Pluralisierung partnerschaftlicher Lebensformen in West-deutschland, 1960-2000. In: Bien, Walter/Marbach, Jan H. (Hrsg.): Partnerschaft und Famili-engrundung. Ergebnisse der dritten Welle des Familien-Survey. Opladen: Leske + Budrich, S. 189-217.
Brüderl, Josef (2004): Die Pluralisierung partnerschaftlicher Lebensformen in Westdeutschland und Europa. Aus Politik und Zeitgeschichte 19(1): 3-10.
Brüderl, Josef/Scherer, Stefani (2006a): Sequenzdatenanalyse. In: Wolf, Christof/Best, Henning (Hrsg.) (2010): Handbuch der sozialwissenschaftlichen Datenanalyse. Wiesbaden: VS Verlag für Sozialwissenschaften, S. 1031-1051.
Brüderl, Josef/Scherer, Stefani (2006b): Methoden zur Analyse von Sequenzdaten. In: Kölner Zeit-schrift fur Soziologie und Sozialpsychologie. Sonderheft 44/2004: 330-347.
Brzinsky-Fay, Christian/Kohler, Ulrich/Luniak, Magdalena (2006): Sequence Analysis Using Stata. The Stata Journal 6(4): 435-460.
Buchholz, Sandra/Blossfeld, Hans-Peter/Hofäcker, Dirk/Kurz, Karin/Hofmeister, Heather (2009): Life Courses in the Globalization Process: The Development of Social Inequalities in Modern So-cieties. European Sociological Review 25(1): 53-71.
Buchholz, Sandra/Kolb, Kathrin/Hofäcker, Dirk/Blossfeld, Hans-Peter (2011): Globalized Labour Mar-kets and Social Inequality in Europe: Theoretical Framework. In Blossfeld, Hans-Peter/Buch-holz, Sandra/Hofäcker, Dirk/Kolb, Kathrin (Hrsg.): Globalized Labour Markets and Social Ine-quality in Europe. Basingstoke: Palgrave Macmillan, S. 3-22.
Bundesinstitut für Bevölkerungsforschung (2014): Durchschnittliches Heiratsalter nach dem bisheri-gen Familienstand der Ehepartner in Deutschland, 1971 bis 2012. http://www.bib-demogra-fie.de/DE/ZahlenundFakten/04/Abbildungen/a_04_14_durchschnittl_heiratsalter_familien-stand_d_ab1971.html (zuletzt eingesehen am 03.03.2017)
Calinski, Tadeusz/Harabasz, Joachim (1974): A dendrite method for cluster analysis. Communications in Statistics 3(1): 1-27.
Courgeau, Daniel/Lelièvre, Eva (1988): Estimation of transition rates in dynamic house-hold models. In: Keilman, Nico/Kuysten, Anton/Vossen, Ad (Hrsg.): Modeling household formation and dissolution. Oxford: Oxford University Press, S. 160-176.
Cox, David R. (2001): Statistical Modeling: The Two Cultures: Comment. Statistical Science 16(3): 216-18.
Dekker, Arne/Matthiesen, Silja (2004): Beziehungsformen im Lebensverlauf dreier Generationen. Se-quenzmusteranalyse von Beziehungsbiographien 30-, 45- und 60-jahriger Männer und Frauen in Hamburg und Leipzig. Kölner Zeitschrift fur Soziologie und Sozialpsychologie 16(1): 38-55.
Efron, Brad (2001): Statistical Modeling: The Two Cultures: Comment. Statistical Science 16(3): 218-19.
326 Quellen- und Literaturverzeichnis
Efron, Bradley/Tibshirani, Rob J. (1992): An Introduction to the Bootstrap. New York: Chapman & Hall. Elder, Glen Holl, Jr. (1974): The Children of The Great Depression: Social Change in Life Experience.
Chicago: University of Chicago Press. Elder, Glen Holl, Jr. (1985): Preface. In: Elder, Glen Holl, Jr. (Hrsg.): Life Course Dynamics: Trajectories
and Transitions, 1968-1980. Ithaca: Cornell University Press, S. 15-19. Elder, Glen Holl, Jr./Kirkpatrick Johnson, Monica/Crosnoe, Robert (2003): The Emergence and Devel-
opment of Life Course Theory. In: Mortimer, Jeylan T./Shanahan, Michael J. (Hrsg.): Hand-book of the Life Course. New York: Kluwer Academic/Plenum Publishers, S. 3-19.
Elzinga, Cees H. (2003): Sequence Similarity - A Non-Aligning Technique. Sociological Methods & Re-search 31(4): 3-29.
Elzinga, Cees H. (2007): Sequence analysis: Metric representations of categorical time series. Amster-dam: Free University of Amsterdam.
Elzinga, Cees H. (2009): CHESA 3.1 User Manual. http://home.fsw.vu.nl/ch.el-zinga/CHESA%203.1%20pack.zip (eingesehen am 14.1.2013).
Elzinga, Cees H./Liefbroer, Aart C. (2007): Destandardization of Family-Life Trajectories of Young Adults. European Journal of Population 23(3): 225-250.
Elzinga, Cees H./Studer, Matthias (2015): Spell Sequences, State Proximities and Distance Metrics. Sociological Methods & Research 44(1): 3-47.
Epanechnikov, V. A. (1969): Non-Parametric Estimation of a Multivariate Probability Density. Theory of Probability and Its Applications 14(1): 153-158.
Erlinghagen, Marcel (2004): Die Restrukturierung des Arbeitsmarktes. Arbeitsmarktmobilität und Be-schäftigungsstabilität im Zeitverlauf. Wiesbaden: VS Verlag für Sozialwissenschaften.
Erlinghagen, Marcel/Lübke, Christiane (2015): Arbeitsplatzunsicherheit im Erwerbsverlauf. Eine Se-quenzmusteranalyse westdeutscher Paneldaten. Zeitschrift für Soziologie 44(6): 407-425.
Esping-Andersen, Gøsta (1990): The Three Worlds of Welfare Capitalism. Princeton: Princeton Uni-versity Press.
Esping-Andersen, Gøsta (1999): Social Foundations of Postindustrial Economies. New York : Oxford University Press.
Falk, Susanne (2005): Geschlechtsspezifische Ungleichheit im Erwerbsverlauf. Analysen für den deut-schen Arbeitsmarkt. Wiesbaden: VS Verlag für Sozialwissenschaften.
Fasang, Anette Eva (2012): Retirement patterns and income inequality. Social Forces 90(3): 685-711. Fasang, Anette Eva (2014): New Perspectives on Family Formation: What can we learn from Sequence
Analysis? In: Blanchard, Philippe/Bühlmann, Felix/Gauthier, Jacques-Antoine (Hrsg.): Ad-vances in Sequence Analysis: Methods, Theories and Applications. New York, Heidelberg, Dordrecht, London: Springer, S. 107-128.
Fasang, Anette Eva/Liao, Tim Futing (2013): Visualizing Sequences in the Social Sciences Relative Fre-quency Sequence Plots. Sociological Methods & Research 43(4): 643-676.
Festy, Patrick (1980): On the New Context of Marriage in Western Europe. Population and Develop-ment Review 6(2): 311-315.
Frick, Joachim R./Grabka, Markus M./Rasner, Anika/Schmidt, Marian/Schuth, Morten/Westermeier, Christian (2012): Familienbiographische Verläufe im Kohortenvergleich. Berlin: DIW.
Friedman, Debra/Hechter, Michael/Kanazawa, Satoshi (1994): A Theory of the Value of Children. De-mography 31(3) 375-401.
Friese, Marianne/Anslinger, Eva/Brenner, Ilka/Piening, Dorothea/Pregitzer, Sabine/Thiessen, Bar-bara/Walter, Michael (2008): Kompetenzentwicklung für junge Mütter. Förderansätze der beruflichen Bildung. Bielefeld: Bertelsmann.
Quellen- und Literaturverzeichnis 327
Gabaldinho, Alexis/Ritschard, Gilbert/Mueller, Nicolas Séverin/Studer, Matthias (2011): Analyzing and visualizing state sequences in R with TraMineR. Journal of Statistical Software 40(4): 1-37.
Gauthier, Jacques-Antoine/Widmer, Eric D./Bucher, Philipp/Notredame, Cédric (2010): Multichannel sequence Analysis applied to social science data. Sociological Methodology 40(1): 1-38.
Geißler, Rainer (2014): Ungleichheiten zwischen Frauen und Männern. Bundeszentrale für politische Bildung. https://www.bpb.de/izpb/198038/ungleichheiten-zwischen-frauen-und-maen-nern?p=all (zuletzt eingesehen am 01.02.2017).
Grobecker, Claire/Pötzsch, Olga/Sommer, Bettina (2016): Bevölkerungsstand und Bevölkerungsent-wicklung. Auszug aus dem Datenreport 2016. Wissenschaftszentrum Berlin für Sozialfor-schung (WZB): Statistisches Bundesamt (Destatis).
Guetto, Raffaele/Mancosu, Moreno/Scherer, Stefani/Torricelli, Giulia (2016): The Spreading of Co-habitation as a Diffusion Process: Evidence from Italy. European Journal of Population 32(5): 661-686.
Hadjar, Andreas/Becker, Rolf (Hrsg.) (2006): Die Bildungsexpansion: Erwartete und unerwartete Fol-gen. Wiesbaden: VS Verlag für Sozialwissenschaften.
Hagestad, Gunhild O./Neugarten, Bernice L. (1985): Age and the life course. In: Binstock, Robert H./Shanas, Ethel (Hrsg.): Handbook of Aging and the Social Sciences. New York: Van Nos-trand, S. 36-61.
Halpin, Brendan (2010): Optimal Matching Analysis and Life-Course Data. The Importance of Dura-tion. Sociological Methods & Research 38(3): 365-388.
Halpin, Brendan (2014a): Three Narratives of Sequence Analysis. In: In: Blanchard, Philippe/Bühl-mann, Felix/Gauthier, Jacques-Antoine (Hrsg.): Advances in Sequence Analysis: Methods, Theories and Applications. New York, Heidelberg, Dordrecht, London: Springer, S. 75-103.
Halpin, Brendan (2014b): SADI: Sequence Analysis Tools for Stata. University of Limerick: Department of Sociology Working Paper Series WP2014-03. http://www.ul.ie/sociology/pubs/wp2014-03.pdf (eingesehen am 24.01.2017).
Halpin, Brendan (2017): 'SADI: Sequence Analysis Tools for Stata'. The Stata Journal: Online First. Hamming, Richard Wesley (1950): Error-detecting and error-correcting codes. Bell System Technical
Journal 29(2): 147-160. Hamming, Richard Wesley (1980): Coding and Information Theory. Englewood Cliffs: Prentice Hall. Hiekel, Nicole/Liefbroer, Aart C./Poortman, Anne-Rigt (2014): Understanding Diversity in the Mean-
ing of Cohabitation Across Europe. European Journal of Population 30(4): 391-410. Hillmann, Karl-Heinz (1994): Wörterbuch der Soziologie. Stuttgart: Kröner. Hoadley, Bruce (2001): Statistical Modeling: The Two Cultures: Comment. Statistical Science 16(3):
220-24. Hoem, Britta/Hoem, Jan M. (1988): The Swedish Family: Aspects of Contemporary Developments.
Journal of Family Issues 9(3): 397-424. Hogan, Dennis P. (1978): The Variable Order of Events in the Life Course. American Sociological Re-
view 43(4): 573-586. Hollister, Matissa (2009): Is Optimal Matching Suboptimal? Sociological Methods & Research 38(2):
235-264. Höpflinger, Francois/Fux, Beat (2007): Familien - Intereuropäische Perspektive. In: Ecarius, Jutta
(Hrsg.): Handbuch Familie. Wiesbaden: VS Verlag für Sozialwissenschaften, S. 57-77. Hoppmann, Isabella/Zimmermann, Okka (2017): Different meanings of ‘Living-Apart-Together’
among youth? A sequence analysis approach. TU Braunschweig: Working paper.
328 Quellen- und Literaturverzeichnis
Huinink, Johannes (1995): Warum noch Familie? Zur Attraktivität von Partnerschaft und Elternschaft in unserer Gesellschaft. Frankfurt am Main/New York: Campus.
Huinink, Johannes (2013): De-Standardisation or Changing Life Course Patterns? Transition to Adult-hood from a Demographic Perspective. In: Neyer, Gerda/Andersson, Gunnar/Kulu, Hill/Ber-nardi, Laura/Bühler, Christoph (Hrsg.): The Demography of Europe. New York: Springer, S. 99-118.
Inglehart, Ronald (1977): The Silent Revolution: Changing Values and Political Styles among Western Publics. Princeton: Princeton University Press.
Inglehart, Ronald (1990): Culture Shift in Advanced Industrial Society. Princeton: Princeton University Press.
Inglehart, Ronald (1997): Modernization and postmodernization: cultural, economic, and political change in 43 societies. Princeton: Princeton University Press.
Inglehart, Ronald (1934/1998): Modernisierung und Postmodernisierung. Kultureller, wirtschaftlicher und politischer Wandel in 43 Gesellschaften. Frankfurt am Main: Campus.
Kalmijn, Matthijs (2011): The influence of men’s income and employment on marriage and cohabita-tion: Testing Oppenheimer’s theory in Europe. European Journal of Population 27(3): 269-293.
Keith, Jennie/Fry, Christine L./Glascock, Anthony P./Ikels, Charlotte/Dickerson-Putman, Jean-ette/Harpending, Henry C./Draper, Patricia (1994): The Aging Experience: Diversity and Com-monality. Across Cultures. Newbury Park, CA: Sage.
Kiernan, Kathleen (2001): The rise of cohabitation and childbearing outside marriage in western Eu-rope. International Journal of Law, Policy and the Family 15(1): 1-21.
Kim, Kihong (2014): Discrepancy Analysis of Activity Sequences: What Explains the Complexity of Peo-ple's Daily Activity-Travel Patterns? 24 Transportation Research Record. Journal of the Trans-portation Research Board 2413(1): 24-33.
Kohler, Ulrich/Kreuter, Frauke (2008): Datenanalyse mit Stata. München: Oldenbourg. Kohli, Martin (1985): Die Institutionalisierung des Lebenslaufs. Kölner Zeitschrift für Soziologie und
Sozialpsychologie 37(1): 1-29. Kohli, Martin (1986): The world we forgot: A historical review of the life course. In: Marshall, Victor
W. (Hrsg.): Later life. The social psychology of aging. London: Sage, S. 271-303. Kohli Martin (1994): Work and retirement: a comparative perspective. In: Riley, Matilda W./Kahn,
Robert L./Foner, Anne (Hrsg): Age and Structural Lag. New York, NY: Wiley, S. 80-106. Kohli, Martin (2007): The institutionalization of the life course. Human Development 4(3-4): 253-271. Konietzka, Dirk (2010): Zeiten des Übergangs. Sozialer Wandel des Übergangs in das Erwachsenenal-
ter. Wiesbaden: VS Verlag für Sozialwissenschaften. Konietzka, Dirk/Huinink, Johannes (2003): Die Destandardisierung einer Statuspassage? Soziale Welt
54(3): 285-311. Konietzka, Dirk/Kreyenfeld, Michaela (2007): Ein Leben ohne Kinder: Kinderlosigkeit in Deutschland.
Kindle Edition. König, Wolfgang/Lüttinger, Paul/Müller, Walter (1988): A Comparative Analysis of the Development
and Structure of Educational Systems. Methodological Foundations and the Construction of a Comparative Educational Scale. CASMIN Working Paper No. 12. Mannheim: Universität Mannheim.
Kreyenfeld, Michaela/Hornung, Anne/Kubisch, Karolin (2013): Der deutsche Generations and Gender Survey: Einige kritische Betrachtungen zur Validität der Fertilitätsverläufe. Comparative Po-pulation Studies - Zeitschrift für Bevölkerungswissenschaft 38(1): 29-58.
Quellen- und Literaturverzeichnis 329
Kreyenfeld, Michaela/Konietzka, Dirk (2013): Die Sozialstruktur nichtehelicher Elternschaft in Ost- und Westdeutschland. Berlin, 6.-8. März 2013: Paper vorgestellt auf der Jahrestagung der deutschen Gesellschaft für Demographie.
Krüger, Judith (2014): Erwerbsverläufe von FacharbeiterInnen. Untersuchung eines Automobilunter-nehmens unter besonderer Berücksichtigung der Vereinbarkeit von Beruf und Privatleben. Berlin: Logos.
Kruse, Andreas/Wahl, Hans-Werner (2014): Lebenslaufforschung - Ein altes und neues interdiszipli-näres Forschungsthema. In: Kruse, Andreas/Wahl, Hans-Werner (Hrsg.): Lebensläufe im Wandel. Entwicklung über die Lebensspanne aus Sicht verschiedener Disziplinen. Stuttgart: Kohlhammer, S. 16-38.
Lengerer, Andrea (2011): Gleiches Ausmaß, unterschiedliche Formen des partnerschaftlichen Zusam-menlebens: Eine Kohortenanalyse für Ost- und Westdeutschland. Informationsdienst Soziale Indikatoren 45 (1): 11-15.
Lengerer, Andrea/Klein, Thomas (2007): Der langfristige Wandel partnerschaftlicher Lebensformen im Spiegel des Mikrozensus. Wirtschaft und Statistik 2007(4): 433-447.
Lenze, Anne/Funcke, Antje (2016): Alleinerziehende unter Druck. Rechtliche Rahmenbedingungen, finanzielle Lage und Reformbedarf. Gütersloh: Bertelsmann Stiftung.
Lesnard, Laurent (2006): Optimal Matching in Social Sciences. Série des Documents de Travail du CREST 1: 25.
Lesnard, Laurent (2008): Off-scheduling within dual-earner couples: an unequal and negative exter-nality for family time. American Journal of Sociology 114(2): 447-490.
Lesnard, Laurent (2010): Cost Setting in Optimal Matching to Uncover Contemporaneous Socio-Tem-poral Patterns. Sociological Methods & Research 38(3): 389-419.
Lesnard, Laurent/Cousteaux, Anne-Sophie/Chanvril, Flora/Le Hay, Viviane (2016): Do Transitions to Adulthood Converge in Europe? An Optimal Matching Analysis of Work-Family Trajectories of Men and Women from 20 European Countries. European Sociological Review 32(3): 355-369.
Lesthaeghe, Ron J. (2010): The Unfolding Story of the Second Demographic Transition. PSC Research Report 10-696: 1-46.
Lesthaeghe, Ron L./Van De Kaa, Dirk J. (1986): Twee demografische transities? In: Van De Kaa, Dirk J./Lesthaeghe Ron K. (Hrsg.): Bevolking: groei en krimp. Deventer: Van Loghum Slaterus, S. 9-24.
Levecke, Bettina (2004): 'Empty Nest' - wenn die Kinder das Haus verlassen. http://www.familien-handbuch.de/familienforschung/kinder-in-der-familie/empty-nest-wenn-die-kinder-das-haus-verlassen#wann (zuletzt eingesehen am 03.03.2017).
Levene, Howard (1960): Robust Tests for Equality of Variances. In: Olkin, Ingram/Ghurye, Sudhish G./Hoeffding, Wassily/Madow, William G./Mann, Henry B. (Hrsg.): Contributions to Proba-bility and Statistics: Essays in Honor of Harold Hotelling. Menlo Park, CA: Stanford University Press, S. 278-292.
Levenshtein, Vladimir Iosifovich (1966): Binary codes capable of correcting deletions, insertions and reversals. In: Soviet Phsyics Doklady 10(8): 845-848.
Levine, Joel H. (2000): But What Have You Done for Us Lately? Commentary on Abbott and Tsay. Sociological Methods & Research 29(1): 34-40.
Levy, René (1977): Der Lebenslauf als Statusbiographie. Die weibliche Normalbiographie in makroso-ziologischer Perspektive. Stuttgart: Ferdinand Enke Verlag.
Lewis, Jane (1992): Gender and the Development of Welfare Regimes. Journal of European Social Policy 2(3): 159-173.
330 Quellen- und Literaturverzeichnis
Billari, Francesco C./Liefbroer, Aart C. (2010): Towards a new pattern of transition to adulthood? Ad-vances in Life Course Research 15(2-3): 59-75.
Lois, Nadia (2012): „Living apart together“: sechs Typen einer heterogenen Lebensform. Zeitschrift für Familienforschung 24(3): 247-268.
Lois, Daniel/Arránz Becker, Oliver/Kunz, Christina (2009): Fördernde und hemmende Einflüsse der Kohabitation auf die Heiratsabsicht – Eine nutzen- und kostentheoretische Analyse. Zeit-schrift für Familienforschung, 21(1): 30-53.
Ludwig-Mayerhofer, Wolfgang (2012): Ungleichheiten. Bundeszentrale für politische Bildung. http://www.bpb.de/politik/grundfragen/deutsche-verhaeltnisse-eine-sozial-kunde/138681/ungleichheiten?p=all (eingesehen am 01.02.2017).
MacIndoe, Heather/Abbott, Andrew (2004): Sequence Analysis and Optimal Matching Techniques for Social Science Data. In: Hardy, Melissa/Bryman, Alan (Hrsg.): Handbook of Data Analysis. New York: SAGE, S. 387-406.
Mannheim, Karl (1928): Das Problem der Generationen. Kölner Vierteljahrshefte für Soziologie 7(2/3): 157-185; 309-330.
Mannheim, Karl (1952): The Problem of Generations. In: Kecskemeti, Paul (Hrsg.) Essays on the Soci-ology of Knowledge: Collected Works. New York: Routledge, S. 276-322.
Mantel, Nathan (1967): The detection of disease clustering and a generalized regression approach. Cancer Research 27(2): 209–220.
Marteau, Pierre-Francois (2009): Time Warp Edit Distance with Stiffness Adjustment for Time Series Matching. In: IEEE Transactions on Pattern Analysis and Machine Intelligence 31(2): 306-318.
Maslow, Abraham Harold (1943): A Theory of Human Motivation. Psychological Review 50(4): 370-396.
Mayer, Karl Ulrich (1990): Lebensläufe und sozialer Wandel. Kölner Zeitschrift für Soziologie und So-zialpsychologie Sonderheft 31: 7-21.
Mayer, Karl Ulrich (1995): Gesellschaftlicher Wandel, Kohortenungleichheit und Lebensverläufe. In: Berger, Peter A./Sopp, Peter (Hrsg.): Sozialstruktur und Lebenslauf. Opladen: Leske + Budrich, S. 27-47.
Mayer, Karl Ulrich (2001a): The paradox of global social change and national path dependencies. In: Woodward, Alison E./Kohli, Martin (Hrsg.): Inclusions and Exclusions in European Societies. London: Routledge, S. 89-110.
Mayer, Karl Ulrich (2001b): Lebensverlauf. In: Schäfers, Bernhard/Zapf, Wolfang (Hrsg.): Handwörter-buch zur Gesellschaft Deutschlands. Opladen: Springer, S. 446-460.
Mayer, Karl Ulrich (2009): New Directions in Life Course Research. Annual Review of Sociology 35: 413-433.
Mayer, Karl Ulrich/Huinink, Johannes (1990): Alters-, Perioden- und Kohorteneffekte in der Analyse von Lebensverläufen, oder: Lexis adé? Kölner Zeitschrift für Soziologie und Sozialpsycholo-gie, Sonderheft 31: 442-459.
McArdle, Brian H./Anderson, Marti J. (2001): Fitting Multivariate Models to Community Data: A Com-ment on Distance-Based Redundancy Analysis. Ecology 82(1): 290-297.
Modell, John/Furstenberg, Frank/Hershberg, Theodore (1976): Social Change and Transition to Adult-hood in Historical Perspective. Journal of Family History 1(1): 7-32.
Marini, Margaret Mooney (1984): The Order of Events in the Transition to Adulthood. Sociology of Education 57(2): 63-84.
Nave-Herz, Rosemarie (2002): Wandel und Kontinuität in der Bedeutung, in der Struktur und Stabilität von Ehe und Familie. In: Nave-Herz, Rosemarie (Hrsg.): Kontinuität und Wandel der Familie in Deutschland. Stuttgart: Lucius & Lucius, S. 45-70.
Quellen- und Literaturverzeichnis 331
Nave-Herz, Rosemarie (2004): Ehe- und Familiensoziologie: Eine Einführung in Geschichte, theoreti-sche Ansätze und empirische Befunde. Weinheim: Juventa.
Nazio, Tiziana/Blossfeld, Hans-Peter (2003): The Diffusion of Cohabitation among Young Women in West Germany, East Germany and Italy. European Journal of Population 19(1): 47-82.
Oppenheimer, Valerie K. (2000): The continuing importance of men's economic position in marriage formation. In: Waite, Linda J./Bachrach, Christine/Hindin, Michelle/Thomson, Eliza-beth/Thornton, Arland (Hrsg.): The ties that bind: perspectives on marriage and cohabita-tion. New York: Transaction Publishers, S. 283-301.
Parzen, Emanuel (2001): Statistical Modeling: The Two Cultures: Comment. Statistical Science 16(3): 224-26.
Peuckert, Rüdiger (2008): Familienformen im sozialen Wandel. Wiesbaden: Springer Fachmedien. Pfau-Effinger, Birgit (2000): Kultur und Frauenerwerbstätigkeit in Europa. Theorie und Empirie des
internationalen Vergleichs. Opladen: Leske + Budrich. Pollock, Gary (2007): Holistic trajectories: a study of combined employment, housing and family ca-
reers by using multiple-sequence analysis. Journal of the Royal Statistical Society 170(1): 167-183.
Pötzsch, Olga (2013): Wie wirkt sich der Geburtenaufschub auf die Kohortenfertilität in West und Ost aus? Statistisches Bundesamt: Wirtschaft und Statistik.
Reis, Claus (2011): Alleingelassen? Arbeitslose junge Alleinerziehende und die Notwendigkeit vernetz-ter Hilfeangebote. In: Informationsdienst der Bundeszentrale für gesundheitliche Aufkärung (Hrsg.): Alleinerziehend im Lebensverlauf. FORUM Sexualaufkärung und Familienplanung. Frankfurt: Redaktion FORUM.
Robette, Nicolas (2010): The diversity of pathways to adulthood in France. Advances in Life Course Research 15(2-3): 89-96.
Robette, Nicolas/Bry, Xavier (2012): Harpoon or Bait? A Comparison of Various Metrics in Fishing for Sequence Patterns. Bulletin of Sociological Methodology 116(1): 5-24.
Rogers, Everett M. (1995): Diffusion of Innovations. New York: Free Press. Rupp, Marina (1999): Die nichteheliche Lebensgemeinschaft als Bindungsphase. Paarkonstellationen
und Bindungsprozesse. Hamburg: Kovac. Blossfeld, Hans-Peter/Rupp, Marina (2008): Familiale Übergänge: Eintritt in nichteheliche Lebensge-
meinschaften, Heirat, Trennung und Scheidung, Elternschaft. In: Schneider, Norbert F. (Hrsg.): Lehrbuch Moderne Familiensoziologie: Theorien, Methoden, empirische Befunde. Opladen: UTB, S. 139-166.
Ryder, Norman B. (1965): The Cohort as a Concept in the Study of Social Change. American Sociolog-ical Review 30(6): 843-861.
Sauer, Lenore/Ruckdeschel, Kerstin/Naderi, Robert (2012): Reliability of retrospective event histories within the German Generations and Gender Survey. BiB Working Paper 1/2012.
Scherer, Stefani (2001): Early career patterns: A comparison of Great Britain and West Germany. Eu-ropean Sociological Review 17(2): 119-144.
Scherger, Simone (2007): Destandardisierung, Differenzierung, Individualisierung. Wiesbaden: VS Verlag für Sozialwissenschaften.
Scherger, Simone (2014): Neue Lebenslaufmuster im Wechselspiel von Standardisierung und De-Standardisierung. In: Wahl, Hans-Werner/Kruse, Andreas (Hrsg.): Lebensläufe im Wandel. Stuttgart: Kohlhammer, S. 358-371.
Schneider, Norbert F. (2015): Familie in Westeuropa. Von der Institution zur Lebensform. In: Hill, Paul B./Kopp, Johannes (Hrsg.): Handbuch Familiensoziologie. Wiesbaden: Springer, S. 21-53.
332 Quellen- und Literaturverzeichnis
Schneider, Norbert F./Rüger, Heiko (2008): Beziehungserfahrungen und Partnerschaftsverläufe vor der Heirat. Zeitschrift für Familienforschung, 20(2): 131-156.
Schulz, Martin (1989): Sequenzmusteranalyse von familienrelevanten Ereignissen. In: Herlth, Alois/Strohmeier, Klaus Peter (Hrsg.): Lebenslauf und Familienentwicklung. Mikroanalysen des Wandels familialer Lebensformen. Opladen: Leske + Budrich.
Smesler, Neil J./Halpern, Sydney (1978): Historical triangulation of family, economy, and education. American Journal of Sociology 84(3): 288-315.
Settersten, Richard A./Hagestad, Gunhild O. (1996): What's the latest? Cultural age deadlines for fam-ily transitions. Gerontologist 36(2): 178-188.
Settersten, Richard A./Mayer, Karl Ulrich (1997): The Measurement of Age, Age Structuring, and the Life Course. Annual Review of Sociology 23(1): 233-261.
Spéder, Zsolt/Kapitány, Balázs (2014): Influences on the Link Between Fertility Intentions and Behav-ioural Outcomes. In: Philipov, Dimiter/Liefbroer, Aart C./Klobas, Jane E. (Hrsg.): Reproductive Decision-Making in a Macro-Micro Perspective. Berlin/Heidelberg: Springer, S. 79-112.
StataCorp (2009): Stata: Release 11. Statistical Software. College Station, TX: StataCorp LP. Statista (2015): Durchschnittliches Alter der Männer und Frauen bei der Scheidung im Jahr 1990 und
2008. http://de.statista.com/statistik/daten/studie/180485/umfrage/alter-der-maenner-und-frauen-bei-der-scheidung/ (zuletzt eingesehen am 05.03.2017).
Statista (2017): Anteil der nichtehelich geborenen Kinder an allen Lebendgeborenen in Deutschland von 1970 bis 2015. https://de.statista.com/statistik/daten/studie/1324/umfrage/uneheli-che-kinder-anteil-an-allen-geburten/ (eingesehen am 23.01.2017).
Statistisches Bundesamt (2012a): Statistik der rechtskräftigen Beschlüsse in Eheauflösungssachen (Scheidungsstatistik) 2010. Wiesbaden: Statistisches Bundesamt.
Statistisches Bundesamt (2012b): Geburten in Deutschland. Wiesbaden: Statistisches Bundesamt. Statistisches Bundesamt (2013): Geburtentrends und Familiensituation in Deutschland 2012. Wies-
baden: Statistisches Bundesamt. Statistisches Bundesamt (2015): Eheschließungen, Ehescheidungen im früheren Bundes-gebiet.
https://www.destatis.de/DE/ZahlenFakten/GesellschaftStaat/Bevoelkerung/Ehescheidun-gen/Tabellen_/lrbev06.html?cms_gtp=151960_list%253D3&https=1 (zuletzt eingesehen am 03.03.2017).
Struffolino, Emanuela/Studer , Matthias/Fasang, Anette Eva (2016): Gender, education, and family life courses in East and West Germany: Insights from new sequence analysis techniques. Ad-vances in Life Course Research 29(1): 66-79.
Studer, Matthias (2013): WeightedCluster library manual: A practical guide to creating typologies of trajectories in the social sciences with R. LIVES Working Papers 2013(24): 1-34.
Studer, Matthias/Ritschard, Gilbert/Gabadinho, Alexis/Müller, Nicolas S. (2010): Discrepancy Analysis of Complex Objects Using Dissimilarities. In: Guillet, Fabrice/Ritschard, Gilbert/Zighed, Dja-mel A./Briand, Henri (Hrsg.): Advances in Knowledge Discovery and Management. Berlin: Springer. S. 3-19.
Studer, Matthias/Ritschard, Gilbert/Gabadinho, Alexis/Müller, Nicolas S. (2011): Discrepancy analysis of state sequences. Sociological Methods & Research 40(3): 471-510.
Studer, Matthias/Ritschard, Gilbert (2016): What matters in differences between life trajectories: a comparative review of sequence dissimilarity measures. Journal of the Royal Statistical Soci-ety: Series A (Statistics in Society) 179(2): 481-511.
Studer, Matthias/Struffolino, Emanuela/Fasang, Anette Eva (2016): New Tool for Old Questions: The Sequence-Analysis Multistate Model to Study Relationships Between Time-Varying Covari-
Quellen- und Literaturverzeichnis 333
ates and Trajectories. In: Ritschard, Gilbert/Studer, Matthias (Hrsg.): Proceedings of the In-ternational Conference on Sequence Analysis and Related Methods, Lausanne, June 8-10, 2016, S. 429-432.
Wagner, Michael (1985): Räumliche Mobilität im Lebenslauf. Johann Wolfgang Goethe-Universität Frankfurt/Universität Mannheim: Arbeitspapier Sonderforschungsbereich 3, Mikroanalyti-sche Grundlagen der Gesellschaftspolitik.
Wagner, Michael/Cifuentes, Michaela Valdés (2014): Pluralisierung der Lebensformen - ein fortlau-fender Trend? Comparative Population Studies 39(1): 73-98.
Walther, Andreas (2009): "It Was not my Choice, You Know?" Young people's subjective views and decision making processes in biographical transitions. In: Schoon, Ingrid/Silbereisen, Rainer K. (Hrsg.): Transitions from School to Work: Globalisation, Individualisation, and Patterns of Diversity. Cambridge: Cambridge University Press, S. 121-145.
Ward, Joe H., Jr. (1963): Hierarchical grouping to optimize an objective function. Journal of the Ame-rican Statistical Association 58(301): 236-244.
Wenzelburger, Georg/Jäckle, Sebastian/König, Pascal (2014): Weiterführende statistische Methoden für Politikwissenschaftler. München: Oldenbourg.
Windzio, Michael (2013): Regressionsmodelle für Zustände und Ereignisse. Wiesbaden: Springer VS. Wu, Lawrence L. (2000): Some Comments on ‘Sequence Analysis and Optimal Matching Methods in
Sociology: Review and Prospect’. Sociological Methods and Research 29(1): 41-64. Zimmermann, Okka (2013): Temporary destandardisation of partnership formation and continuous
standardisation of fertility in three GGS countries. Demográfia English Edition 56(5): 62-88. Zimmermann, Okka (2016): A Simple but Useful Approach? Comparative Analysis of Episode Orders
of Changing Family Formation in Europe. TU Braunschweig: Working Paper. Zimmermann, Okka/Konietzka, Dirk (2017): Destandardisation of the life course: privilege or depriva-
tion? Evidence from sequence analysis of six GGS countries. Aufsatz vorgestellt auf der GGP User Conference. Berlin, 06.-07. Juli 2017.
Anhang
Tabellen
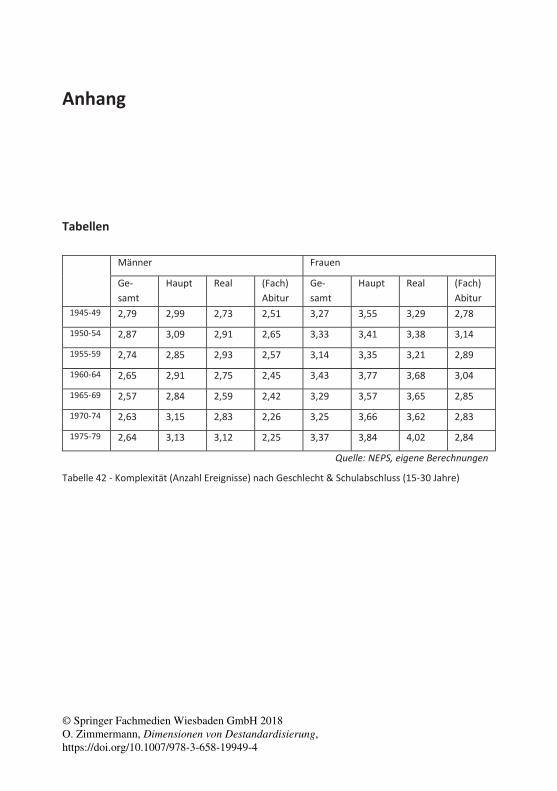
Männer Frauen
Ge-samt
Haupt Real (Fach) Abitur
Ge-samt
Haupt Real (Fach) Abitur
1945-49 2,79 2,99 2,73 2,51 3,27 3,55 3,29 2,78
1950-54 2,87 3,09 2,91 2,65 3,33 3,41 3,38 3,14
1955-59 2,74 2,85 2,93 2,57 3,14 3,35 3,21 2,89
1960-64 2,65 2,91 2,75 2,45 3,43 3,77 3,68 3,04
1965-69 2,57 2,84 2,59 2,42 3,29 3,57 3,65 2,85
1970-74 2,63 3,15 2,83 2,26 3,25 3,66 3,62 2,83
1975-79 2,64 3,13 3,12 2,25 3,37 3,84 4,02 2,84
Quelle: NEPS, eigene Berechnungen
Tabelle 42 - Komplexität (Anzahl Ereignisse) nach Geschlecht & Schulabschluss (15-30 Jahre)
© Springer Fachmedien Wiesbaden GmbH 2018O. Zimmermann, Dimensionen von Destandardisierung,https://doi.org/10.1007/978-3-658-19949-4

336 Anhang
Männer Frauen
Ge-samt
Haupt Real (Fach) Abitur
Ge-samt
Haupt Real (Fach) Abitur
1945-49
2,49 2,32 2,19 2,95 1,35 0,79 1,25 2,36
1950-54
4,40 2,92 4,58 5,66 3,73 3,04 4,16 4,36
1955-59
5,86 6,28 5,33 5,88 5,99 4,32 5,56 7,79
1960-64
6,25 6,10 6,34 6,29 7,35 5,84 7,54 7,78
1965-69
6,42 6,63 6,13 6,50 8,32 6,84 9,51 7,67
1970-74
6,74 6,78 7,65 6,27 8,87 9,24 9,95 7,92
1975-79
8,18 8,03 9,98 7,45 9,56 9,42 10,95 8,71
Quelle: NEPS, eigene Berechnungen
Tabelle 43 - Anzahl Quartale in NEL nach Geschlecht & Schulabschluss (15-30 Jahre)
Männer Frauen
Ge-samt
Haupt Real (Fach) Abitur
Ge-samt
Haupt Real (Fach) Abitur
1945-49
1,29 1,68 1,01 0,84 2,67 3,23 2,42 2,02
1950-54
0,90 1,11 1,41 0,47 2,74 4,05 2,65 0,66
1955-59
0,52 1,01 0,48 0,25 1,25 1,91 0,96 1,05
1960-64
0,79 1,11 0,57 0,70 1,05 1,65 1,30 0,55
1965-69
0,55 1,36 0,34 0,26 1,62 2,75 1,50 1,36
1970-74
0,88 1,51 0,99 0,51 2,59 6,36 2,19 1,60
1975-79
0,90 1,78 1,09 0,51 2,65 5,96 3,92 0,99
Quelle: NEPS, eigene Berechnungen
Tabelle 44 - Anzahl Quartale mit nichtehelichen Kindern nach Geschlecht & Schulabschluss (15-30 Jahre)
Anhang 337
Männer Frauen
Gesamt Haupt-schul-ab-schluss
Real-schul-ab-schluss
(Fach) Abitur
Gesamt Haupt-schul-ab-schluss
Real-schul-ab-schluss
(Fach) Abitur
1945-49 0,88 1,27 0,66 0,38 2,57 3,17 2,25 1,92
1950-54 0,55 0,77 0,64 0,32 2,26 3,46 1,99 0,58
1955-59 0,24 0,53 0,26 0,04 0,91 1,42 0,62 0,83
1960-64 0,42 0,76 0,33 0,26 0,80 1,46 0,96 0,37
1965-69 0,27 0,85 0,19 0,01 1,05 2,13 0,86 0,87
1970-74 0,36 0,90 0,09 0,23 1,73 4,07 1,42 1,15
1975-79 0,24 0,75 0,38 0,00 1,54 4,31 2,15 0,44
Quelle: NEPS, eigene Berechnungen
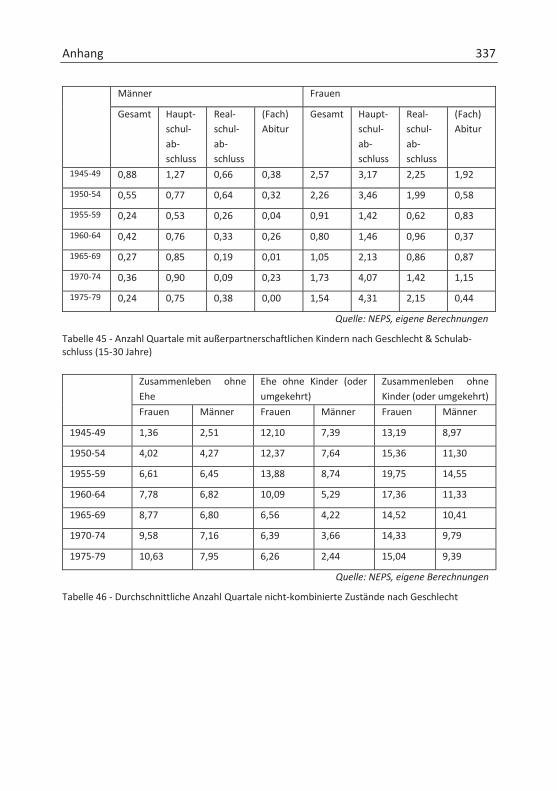
Tabelle 45 - Anzahl Quartale mit außerpartnerschaftlichen Kindern nach Geschlecht & Schulab-schluss (15-30 Jahre)
Zusammenleben ohne Ehe
Ehe ohne Kinder (oder umgekehrt)
Zusammenleben ohne Kinder (oder umgekehrt)
Frauen Männer Frauen Männer Frauen Männer
1945-49 1,36 2,51 12,10 7,39 13,19 8,97
1950-54 4,02 4,27 12,37 7,64 15,36 11,30
1955-59 6,61 6,45 13,88 8,74 19,75 14,55
1960-64 7,78 6,82 10,09 5,29 17,36 11,33
1965-69 8,77 6,80 6,56 4,22 14,52 10,41
1970-74 9,58 7,16 6,39 3,66 14,33 9,79
1975-79 10,63 7,95 6,26 2,44 15,04 9,39
Quelle: NEPS, eigene Berechnungen
Tabelle 46 - Durchschnittliche Anzahl Quartale nicht-kombinierte Zustände nach Geschlecht
338 Anhang
Frau
en
Zeile
nkoh
orte
sig
nifik
ant
nied
riger
(st
anda
rdisi
erte
r)
als S
palte
nkoh
orte
Fr
auen
sig
nifik
ant
nied
riger
er W
ert
U
G
ø O
G (1
) (2
) (3
) (4
) (5
) (6
) (7
)
1945
-49
(1)
0,49
4 0,
510
0,52
5 x
1 0
0 0
0 0
0
1950
-54
(2)
0,53
3 0,
547
0,56
1 0
x 0
0 0
0 0
0
1955
-59
(3)
0,50
9 0,
521
0,53
3 0
0 x
0 0
0 0
0
1960
-64
(4)
0,48
2 0,
493
0,50
4 0
1 1
x 0
0 0
0
1965
-69
(5)
0,43
8 0,
451
0,46
4 1
1 1
1 x
0 0
0
1970
-74
(6)
0,44
5 0,
464
0,48
3 1
1 1
0 0
x 0
0
1975
-79
(7)
0,45
5 0,
480
0,50
5 0
1 1
0 0
0 x
0
Män
ner
[s.o
.] M
änne
r sig
nifik
ant
nied
riger
er W
ert
U
G
ø O
G (1
) (2
) (3
) (4
) (5
) (6
) (7
)
1945
-49
(1)
0,37
2 0,
391
0,40
9 x
0 0
0 0
0 0
1
1950
-54
(2)
0,39
6 0,
414
0,43
1 0
x 0
0 0
0 0
1
1955
-59
(3)
0,37
6 0,
390
0,40
3 0
0 x
0 0
0 0
1
1960
-64
(4)
0,32
9 0,
344
0,35
9 1
1 1
x 0
0 0
1
1965
-69
(5)
0,31
4 0,
330
0,34
7 1
1 1
0 x
0 0
1
1970
-74
(6)
0,29
4 0,
318
0,34
2 1
1 1
0 0
x 0
1
1975
-79
(7)
0,26
9 0,
296
0,32
2 1
1 1
1 0
0 x
1
0 =
kein
sig
nifik
ante
r Unt
ersc
hied
; 1 =
sig
nifik
ante
r Unt
ersc
hied
; UG
= U
nter
e Gr
enze
Kon
fiden
zinte
rval
l, O
G =
Obe
re G
renz
e Ko
nfid
en-
zinte
rval
l
Q
uelle
: NEP
S, e
igen
e Be
rech
nung
en
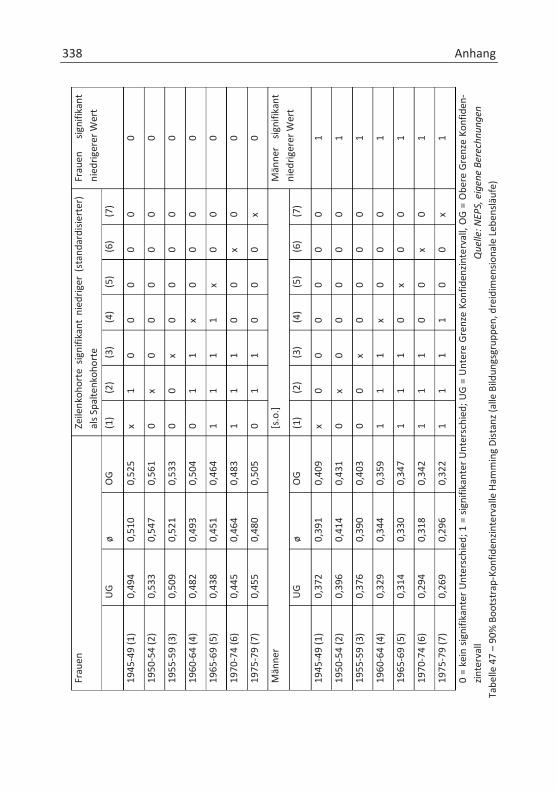
Tabe
lle 4
7 –
90%
Boo
tstr
ap-K
onfid
enzin
terv
alle
Ham
min
g Di
stan
z (al
le B
ildun
gsgr
uppe
n, d
reid
imen
siona
le L
eben
släuf
e)
Anhang 339
Frau
en
Zeile
nkoh
orte
sig
nifik
ant
nied
riger
(st
anda
rdisi
erte
r)
als S
palte
nkoh
orte
Fr
auen
sig
nifik
ant
nied
riger
er W
ert
U
G
ø O
G (1
) (2
) (3
) (4
) (5
) (6
) (7
)
1945
-49
(1)
0,32
7 0,
347
0,36
6 x
0 0
0 1
1 1
1
1950
-54
(2)
0,36
3 0,
379
0,39
5 0
x 0
0 0
0 1
0
1955
-59
(3)
0,36
0 0,
372
0,38
3 0
0 x
0 0
1 1
0
1960
-64
(4)
0,36
0 0,
371
0,38
3 0
0 0
x 0
1 1
0
1965
-69
(5)
0,37
5 0,
387
0,39
8 0
0 0
0 x
0 1
0
1970
-74
(6)
0,39
3 0,
407
0,42
2 0
0 0
0 0
x 0
0
1975
-79
(7)
0,40
7 0,
425
0,44
2 0
0 0
0 0
0 x
0
Män
ner
[s.o
.] M
änne
r sig
nifik
ant
nied
riger
er W
ert
U
G
ø O
G (1
) (2
) (3
) (4
) (5
) (6
) (7
)
1945
-49
(1)
0,37
2 0,
387
0,40
1 x
0 0
0 0
0 0
0
1950
-54
(2)
0,38
0 0,
392
0,40
4 0
x 0
0 0
0 0
0
1955
-59
(3)
0,35
4 0,
363
0,37
3 0
1 x
0 0
0 0
0
1960
-64
(4)
0,37
2 0,
381
0,39
0 0
0 0
x 0
0 0
0
1965
-69
(5)
0,35
8 0,
368
0,37
7 0
1 0
0 x
0 0
0
1970
-74
(6)
0,36
0 0,
375
0,38
9 0
0 0
0 0
x 0
1
1975
-79
(7)
0,34
9 0,
365
0,38
1 0
0 0
0 0
0 x
1
0 =
kein
sig
nifik
ante
r Unt
ersc
hied
; 1 =
sig
nifik
ante
r Unt
ersc
hied
; UG
= U
nter
e Gr
enze
Kon
fiden
zinte
rval
l, O
G =
Obe
re G
renz
e Ko
nfid
en-
zinte
rval
l
Q
uelle
: NEP
S, e
igen
e Be
rech
nung
en
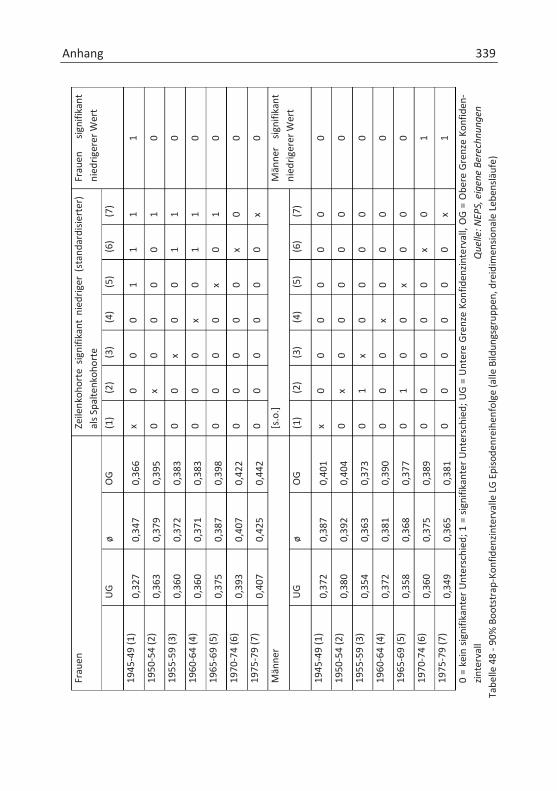
Tabe
lle 4
8 - 9
0% B
oots
trap
-Kon
fiden
zinte
rval
le L
G E
piso
denr
eihe
nfol
ge (a
lle B
ildun
gsgr
uppe
n, d
reid
imen
siona
le L
eben
släuf
e)
340 Anhang
Frau
en
Zeile
nkoh
orte
sig
nifik
ant
nied
riger
(st
anda
rdisi
erte
r)
als S
palte
nkoh
orte
Fr
auen
sig
nifik
ant
nied
riger
er W
ert
U
G
ø O
G (1
) (2
) (3
) (4
) (5
) (6
) (7
)
1945
-49
(1)
0,27
5 0,
290
0,30
5 x
0 1
1 0
0 1
0
1950
-54
(2)
0,29
7 0,
310
0,32
3 0
x 0
0 0
0 0
0
1955
-59
(3)
0,31
1 0,
322
0,33
2 0
0 x
0 0
0 0
0
1960
-64
(4)
0,31
2 0,
320
0,32
9 0
0 0
x 0
0 0
0
1965
-69
(5)
0,30
4 0,
313
0,32
1 0
0 0
0 x
0 1
0
1970
-74
(6)
0,30
4 0,
316
0,32
7 0
0 0
0 0
x 0
0
1975
-79
(7)
0,32
2 0,
335
0,34
7 0
0 0
0 0
0 x
0
Män
ner
[s.o
.] M
änne
r sig
nifik
ant
nied
riger
er W
ert
U
G
ø O
G (1
) (2
) (3
) (4
) (5
) (6
) (7
)
1945
-49
(1)
0,26
2 0,
273
0,28
4 x
0 0
0 0
0 0
0
1950
-54
(2)
0,28
3 0,
294
0,30
4 0
x 0
0 0
0 0
0
1955
-59
(3)
0,27
2 0,
280
0,28
9 0
0 x
0 0
0 0
1
1960
-64
(4)
0,25
9 0,
269
0,27
8 0
1 0
x 0
0 0
1
1965
-69
(5)
0,25
1 0,
262
0,27
2 0
1 0
0 x
0 0
1
1970
-74
(6)
0,24
0 0,
257
0,27
3 0
1 0
0 0
x 0
1
1975
-79
(7)
0,22
9 0,
248
0,26
8 0
1 1
0 0
0 x
1
0 =
kein
sig
nifik
ante
r Unt
ersc
hied
; 1 =
sig
nifik
ante
r Unt
ersc
hied
; UG
= U
nter
e Gr
enze
Kon
fiden
zinte
rval
l, O
G =
Obe
re G
renz
e Ko
nfid
en-
zinte
rval
l
Q
uelle
: NEP
S, e
igen
e Be
rech
nung
en
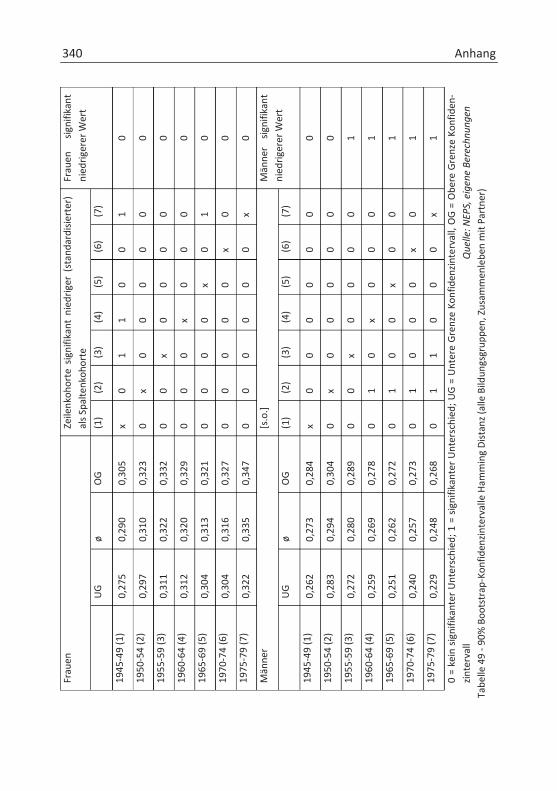
Tabe
lle 4
9 - 9
0% B
oots
trap
-Kon
fiden
zinte
rval
le H
amm
ing
Dist
anz (
alle
Bild
ungs
grup
pen,
Zus
amm
enle
ben
mit
Part
ner)
Anhang 341
Frau
en
Zeile
nkoh
orte
sig
nifik
ant
nied
riger
(st
anda
rdisi
erte
r)
als S
palte
nkoh
orte
Fr
auen
sig
nifik
ant
nied
riger
er W
ert
U
G
ø O
G (1
) (2
) (3
) (4
) (5
) (6
) (7
)
1945
-49
(1)
0,28
7 0,
301
0,31
4 x
1 1
0 0
0 0
0
1950
-54
(2)
0,32
1 0,
331
0,34
2 0
x 0
0 0
0 0
0
1955
-59
(3)
0,31
6 0,
324
0,33
2 0
0 x
0 0
0 0
0
1960
-64
(4)
0,28
0 0,
288
0,29
7 0
1 1
x 0
0 0
0
1965
-69
(5)
0,22
8 0,
238
0,24
8 1
1 1
1 x
0 0
0
1970
-74
(6)
0,22
0 0,
235
0,25
1 1
1 1
1 0
x 0
0
1975
-79
(7)
0,20
8 0,
230
0,25
2 1
1 1
1 0
0 x
0
Män
ner
[s.o
.] M
änne
r sig
nifik
ant
nied
riger
er W
ert
U
G
ø O
G (1
) (2
) (3
) (4
) (5
) (6
) (7
)
1945
-49
(1)
0,25
1 0,
260
0,26
9 x
0 0
0 0
0 0
1
1950
-54
(2)
0,25
9 0,
269
0,28
0 0
x 0
0 0
0 0
1
1955
-59
(3)
0,22
9 0,
240
0,25
0 1
1 x
0 0
0 0
1
1960
-64
(4)
0,17
2 0,
184
0,19
6 1
1 1
x 0
0 0
1
1965
-69
(5)
0,15
8 0,
172
0,18
6 1
1 1
0 x
0 0
1
1970
-74
(6)
0,12
2 0,
138
0,15
5 1
1 1
1 1
x 0
1
1975
-79
(7)
0,09
0 0,
108
0,12
7 1
1 1
1 1
0 x
1
0 =
kein
sig
nifik
ante
r Unt
ersc
hied
; 1 =
sig
nifik
ante
r Unt
ersc
hied
; UG
= U
nter
e Gr
enze
Kon
fiden
zinte
rval
l, O
G =
Obe
re G
renz
e Ko
nfid
en-
zinte
rval
l
Q
uelle
: NEP
S, e
igen
e Be
rech
nung
en
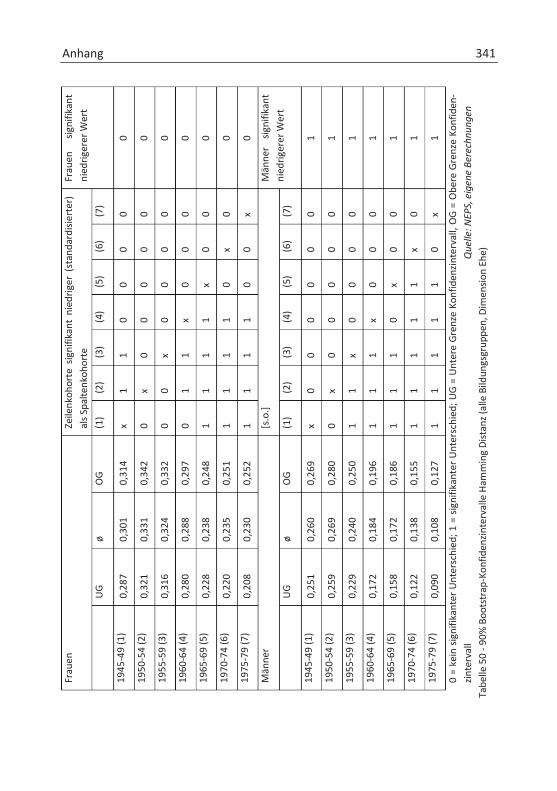
Tabe
lle 5
0 - 9
0% B
oots
trap
-Kon
fiden
zinte
rval
le H
amm
ing
Dist
anz (
alle
Bild
ungs
grup
pen,
Dim
ensio
n Eh
e)
342 Anhang
Frau
en
Zeile
nkoh
orte
sig
nifik
ant
nied
riger
(st
anda
rdisi
erte
r)
als S
palte
nkoh
orte
Fr
auen
sig
nifik
ant
nied
riger
er W
ert
U
G
ø O
G (1
) (2
) (3
) (4
) (5
) (6
) (7
)
1945
-49
(1)
0,34
5 0,
366
0,38
7 x
0 0
0 0
0 0
0
1950
-54
(2)
0,33
8 0,
358
0,37
8 0
x 0
0 0
0 0
0
1955
-59
(3)
0,20
5 0,
224
0,24
2 1
1 x
0 0
0 0
0
1960
-64
(4)
0,18
5 0,
198
0,21
2 1
1 0
x 0
0 0
0
1965
-69
(5)
0,17
4 0,
188
0,20
3 1
1 1
0 x
0 0
0
1970
-74
(6)
0,19
8 0,
221
0,24
3 1
1 0
0 0
x 0
0
1975
-79
(7)
0,19
5 0,
229
0,26
2 1
1 0
0 0
0 x
0
Män
ner
[s.o
.] M
änne
r sig
nifik
ant
nied
riger
er W
ert
U
G
ø O
G (1
) (2
) (3
) (4
) (5
) (6
) (7
)
1945
-49
(1)
0,21
8 0,
237
0,25
7 x
0 0
0 0
0 0
1
1950
-54
(2)
0,18
8 0,
208
0,22
8 0
x 0
0 0
0 0
1
1955
-59
(3)
0,09
9 0,
113
0,12
8 1
1 x
0 0
0 0
1
1960
-64
(4)
0,08
8 0,
101
0,11
3 1
1 0
x 0
0 0
1
1965
-69
(5)
0,09
0 0,
104
0,11
8 1
1 0
0 x
0 0
1
1970
-74
(6)
0,08
3 0,
103
0,12
3 1
1 0
0 0
x 0
1
1975
-79
(7)
0,06
2 0,
081
0,10
1 1
1 0
0 0
0 x
1
0 =
kein
sig
nifik
ante
r Unt
ersc
hied
; 1 =
sig
nifik
ante
r Unt
ersc
hied
; UG
= U
nter
e Gr
enze
Kon
fiden
zinte
rval
l, O
G =
Obe
re G
renz
e Ko
nfid
en-
zinte
rval
l
Q
uelle
: NEP
S, e
igen
e Be
rech
nung
en
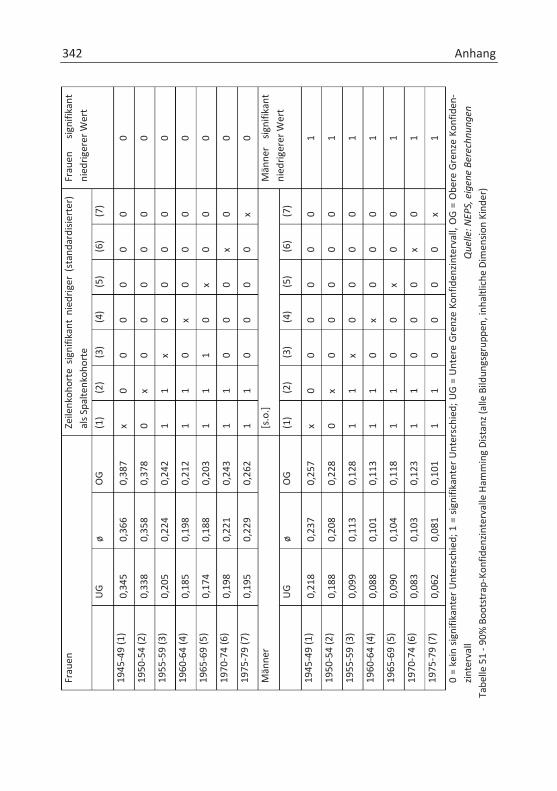
Tabe
lle 5
1 - 9
0% B
oots
trap
-Kon
fiden
zinte
rval
le H
amm
ing
Dist
anz (
alle
Bild
ungs
grup
pen,
inha
ltlic
he D
imen
sion
Kind
er)
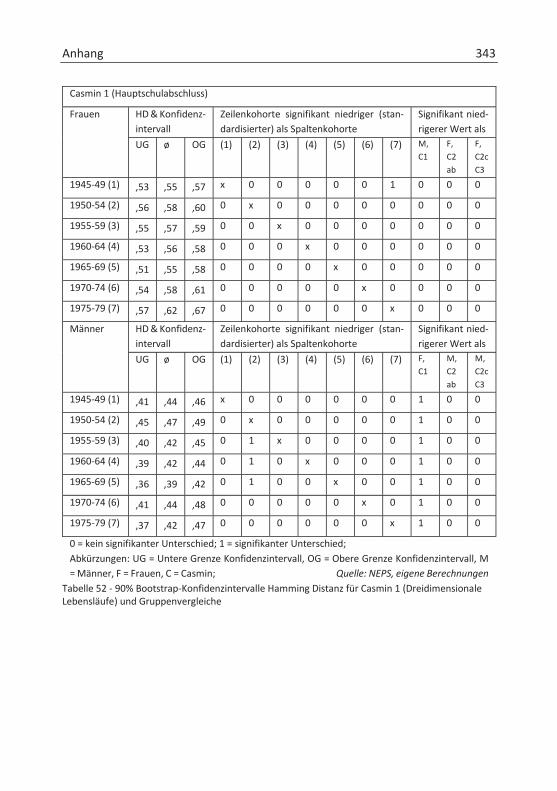
Anhang 343
Casmin 1 (Hauptschulabschluss)
Frauen HD & Konfidenz-intervall
Zeilenkohorte signifikant niedriger (stan-dardisierter) als Spaltenkohorte
Signifikant nied-rigerer Wert als
UG ø OG (1) (2) (3) (4) (5) (6) (7) M, C1
F, C2ab
F, C2c C3
1945-49 (1) ,53 ,55 ,57 x 0 0 0 0 0 1 0 0 0
1950-54 (2) ,56 ,58 ,60 0 x 0 0 0 0 0 0 0 0
1955-59 (3) ,55 ,57 ,59 0 0 x 0 0 0 0 0 0 0
1960-64 (4) ,53 ,56 ,58 0 0 0 x 0 0 0 0 0 0
1965-69 (5) ,51 ,55 ,58 0 0 0 0 x 0 0 0 0 0
1970-74 (6) ,54 ,58 ,61 0 0 0 0 0 x 0 0 0 0
1975-79 (7) ,57 ,62 ,67 0 0 0 0 0 0 x 0 0 0
Männer HD & Konfidenz-intervall
Zeilenkohorte signifikant niedriger (stan-dardisierter) als Spaltenkohorte
Signifikant nied-rigerer Wert als
UG ø OG (1) (2) (3) (4) (5) (6) (7) F, C1
M,C2ab
M,C2c C3
1945-49 (1) ,41 ,44 ,46 x 0 0 0 0 0 0 1 0 0
1950-54 (2) ,45 ,47 ,49 0 x 0 0 0 0 0 1 0 0
1955-59 (3) ,40 ,42 ,45 0 1 x 0 0 0 0 1 0 0
1960-64 (4) ,39 ,42 ,44 0 1 0 x 0 0 0 1 0 0
1965-69 (5) ,36 ,39 ,42 0 1 0 0 x 0 0 1 0 0
1970-74 (6) ,41 ,44 ,48 0 0 0 0 0 x 0 1 0 0
1975-79 (7) ,37 ,42 ,47 0 0 0 0 0 0 x 1 0 0
0 = kein signifikanter Unterschied; 1 = signifikanter Unterschied; Abkürzungen: UG = Untere Grenze Konfidenzintervall, OG = Obere Grenze Konfidenzintervall, M = Männer, F = Frauen, C = Casmin; Quelle: NEPS, eigene Berechnungen
Tabelle 52 - 90% Bootstrap-Konfidenzintervalle Hamming Distanz für Casmin 1 (Dreidimensionale Lebensläufe) und Gruppenvergleiche

344 Anhang
Casmin 2a+b (Realschulabschluss)
Frauen HD & Konfidenz-intervall
Zeilenkohorte signifikant niedriger (stan-dardisierter) als Spaltenkohorte
Signifikant nied-rigerer Wert als
UG ø OG (1) (2) (3) (4) (5) (6) (7) M, C2ab
F, C1
F, C3
1945-49 (1) ,46 ,49 ,51 x 1 0 0 0 0 1 0 1 0
1950-54 (2) ,52 ,54 ,57 0 x 0 0 0 0 0 0 0 0
1955-59 (3) ,51 ,53 ,54 0 0 x 0 0 0 1 0 1 0
1960-64 (4) ,51 ,53 ,54 0 0 0 x 0 0 1 0 0 0
1965-69 (5) ,48 ,49 ,51 0 1 1 1 x 0 1 0 0 0
1970-74 (6) ,50 ,53 ,55 0 0 0 0 0 x 1 0 0 0
1975-79 (7) ,55 ,59 ,62 0 0 0 0 0 0 x 0 0 0
Männer HD & Konfidenz-intervall
Zeilenkohorte signifikant niedriger (stan-dardisierter) als Spaltenkohorte
Signifikant nied-rigerer Wert als
UG ø OG (1) (2) (3) (4) (5) (6) (7) F, C2ab
M,C1
M,C3
1945-49 (1) ,35 ,39 ,42 x 0 0 0 0 0 0 1 0 0
1950-54 (2) ,40 ,43 ,46 0 x 0 0 0 0 0 1 0 0
1955-59 (3) ,39 ,41 ,43 0 0 x 0 0 0 0 1 0 0
1960-64 (4) ,34 ,37 ,41 0 0 0 x 0 0 0 1 0 0
1965-69 (5) ,33 ,36 ,39 0 1 1 0 x 0 0 1 0 0
1970-74 (6) ,32 ,37 ,41 0 0 0 0 0 x 0 1 1 0
1975-79 (7) ,36 ,40 ,45 0 0 0 0 0 0 x 1 0 0
0 = kein signifikanter Unterschied; 1 = signifikanter Unterschied; Abkürzungen: UG = Untere Grenze Konfidenzintervall, OG = Obere Grenze Konfidenzintervall, M = Männer, F = Frauen, C = Casmin Quelle: NEPS, eigene Berechnungen
Tabelle 53 - 90% Bootstrap-Konfidenzintervalle Hamming Distanz für Casmin 2a+b (Dreidimensio-nale Lebensläufe) und Gruppenvergleiche

Anhang 345
Casmin 2c+3 (Abitur oder Fachabitur)
Frauen HD & Konfidenz-intervall
Zeilenkohorte signifikant niedriger (stan-dardisierter) als Spaltenkohorte
Signifikant nied-rigerer Wert als
UG ø OG (1) (2) (3) (4) (5) (6) (7) M, 3
F, C1
F, C2ab
1945-49 (1) ,37 ,41 ,44 x 0 0 0 0 0 0 0 1 1
1950-54 (2) ,41 ,44 ,47 0 x 0 0 0 0 0 0 1 1
1955-59 (3) ,41 ,43 ,45 0 0 x 0 0 0 0 0 1 1
1960-64 (4) ,40 ,41 ,43 0 0 0 x 0 0 0 0 1 1
1965-69 (5) ,34 ,36 ,38 0 1 1 1 x 0 0 0 1 1
1970-74 (6) ,37 ,39 ,42 0 0 0 0 0 x 0 0 1 1
1975-79 (7) ,37 ,40 ,43 0 0 0 0 0 0 x 0 1 1
Männer HD & Konfidenz-intervall
Zeilenkohorte signifikant niedriger (stan-dardisierter) als Spaltenkohorte
Signifikant nied-rigerer Wert als
UG ø OG (1) (2) (3) (4) (5) (6) (7) F, 3
M, C1
M, C2ab
1945-49 (1) ,29 ,32 ,35 x 0 0 0 0 0 0 1 1 1
1950-54 (2) ,34 ,36 ,39 0 x 0 0 0 0 0 1 1 1
1955-59 (3) ,33 ,36 ,38 0 0 x 0 0 0 0 1 1 1
1960-64 (4) ,28 ,30 ,32 0 1 1 x 0 0 0 1 1 1
1965-69 (5) ,26 ,28 ,30 0 1 1 0 x 0 0 1 1 1
1970-74 (6) ,23 ,26 ,28 1 1 1 0 0 x 0 1 1 1
1975-79 (7) ,22 ,25 ,28 1 1 1 1 0 0 x 1 1 1
0 = kein signifikanter Unterschied; 1 = signifikanter Unterschied; Abkürzungen: UG = Untere Grenze Konfidenzintervall, OG = Obere Grenze Konfidenzintervall, M = Männer, F = Frauen, C = Casmin Quelle: NEPS, eigene Berechnungen
Tabelle 54 - 90% Bootstrap-Konfidenzintervalle Hamming Distanz für Casmin 2c+3 (Dreidimensio-nale Lebensläufe) und Gruppenvergleiche
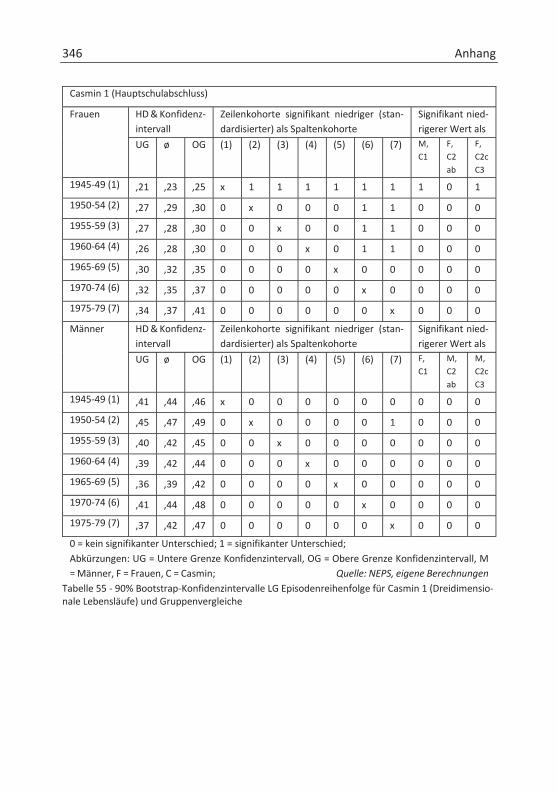
346 Anhang
Casmin 1 (Hauptschulabschluss)
Frauen HD & Konfidenz-intervall
Zeilenkohorte signifikant niedriger (stan-dardisierter) als Spaltenkohorte
Signifikant nied-rigerer Wert als
UG ø OG (1) (2) (3) (4) (5) (6) (7) M, C1
F, C2ab
F, C2c C3
1945-49 (1) ,21 ,23 ,25 x 1 1 1 1 1 1 1 0 1
1950-54 (2) ,27 ,29 ,30 0 x 0 0 0 1 1 0 0 0
1955-59 (3) ,27 ,28 ,30 0 0 x 0 0 1 1 0 0 0
1960-64 (4) ,26 ,28 ,30 0 0 0 x 0 1 1 0 0 0
1965-69 (5) ,30 ,32 ,35 0 0 0 0 x 0 0 0 0 0
1970-74 (6) ,32 ,35 ,37 0 0 0 0 0 x 0 0 0 0
1975-79 (7) ,34 ,37 ,41 0 0 0 0 0 0 x 0 0 0
Männer HD & Konfidenz-intervall
Zeilenkohorte signifikant niedriger (stan-dardisierter) als Spaltenkohorte
Signifikant nied-rigerer Wert als
UG ø OG (1) (2) (3) (4) (5) (6) (7) F, C1
M,C2ab
M,C2c C3
1945-49 (1) ,41 ,44 ,46 x 0 0 0 0 0 0 0 0 0
1950-54 (2) ,45 ,47 ,49 0 x 0 0 0 0 1 0 0 0
1955-59 (3) ,40 ,42 ,45 0 0 x 0 0 0 0 0 0 0
1960-64 (4) ,39 ,42 ,44 0 0 0 x 0 0 0 0 0 0
1965-69 (5) ,36 ,39 ,42 0 0 0 0 x 0 0 0 0 0
1970-74 (6) ,41 ,44 ,48 0 0 0 0 0 x 0 0 0 0
1975-79 (7) ,37 ,42 ,47 0 0 0 0 0 0 x 0 0 0
0 = kein signifikanter Unterschied; 1 = signifikanter Unterschied; Abkürzungen: UG = Untere Grenze Konfidenzintervall, OG = Obere Grenze Konfidenzintervall, M = Männer, F = Frauen, C = Casmin; Quelle: NEPS, eigene Berechnungen
Tabelle 55 - 90% Bootstrap-Konfidenzintervalle LG Episodenreihenfolge für Casmin 1 (Dreidimensio-nale Lebensläufe) und Gruppenvergleiche
Anhang 347
Casmin 2a+b (Realschulabschluss)
Frauen HD & Konfidenz-intervall
Zeilenkohorte signifikant niedriger (stan-dardisierter) als Spaltenkohorte
Signifikant nied-rigerer Wert als
UG ø OG (1) (2) (3) (4) (5) (6) (7) M, C2ab
F, C1
F, C3
1945-49 (1) ,25 ,27 ,29 x 0 0 0 0 0 1 0 0 0
1950-54 (2) ,27 ,29 ,31 0 x 0 0 0 0 1 0 0 0
1955-59 (3) ,26 ,27 ,29 0 0 x 0 0 1 1 0 0 0
1960-64 (4) ,26 ,28 ,29 0 0 0 x 0 0 1 0 0 0
1965-69 (5) ,27 ,28 ,29 0 0 0 0 x 0 1 0 1 0
1970-74 (6) ,29 ,30 ,32 0 0 0 0 0 x 0 0 1 0
1975-79 (7) ,31 ,33 ,35 0 0 0 0 0 0 x 0 0 0
Männer HD & Konfidenz-intervall
Zeilenkohorte signifikant niedriger (stan-dardisierter) als Spaltenkohorte
Signifikant nied-rigerer Wert als
UG ø OG (1) (2) (3) (4) (5) (6) (7) F, C2ab
M,C1
M,C3
1945-49 (1) ,25 ,27 ,29 x 0 0 0 0 0 1 0 0 0
1950-54 (2) ,28 ,30 ,32 0 x 0 0 0 0 0 0 0 0
1955-59 (3) ,27 ,28 ,29 0 0 x 0 0 0 1 0 0 0
1960-64 (4) ,28 ,29 ,31 0 0 0 x 0 0 0 0 0 0
1965-69 (5) ,26 ,27 ,28 0 0 0 0 x 0 1 0 0 0
1970-74 (6) ,26 ,28 ,30 0 0 0 0 0 x 0 0 0 0
1975-79 (7) ,29 ,31 ,33 0 0 0 0 0 0 x 0 0 0
0 = kein signifikanter Unterschied; 1 = signifikanter Unterschied; Abkürzungen: UG = Untere Grenze Konfidenzintervall, OG = Obere Grenze Konfidenzintervall, M = Männer, F = Frauen, C = Casmin Quelle: NEPS, eigene Berechnungen
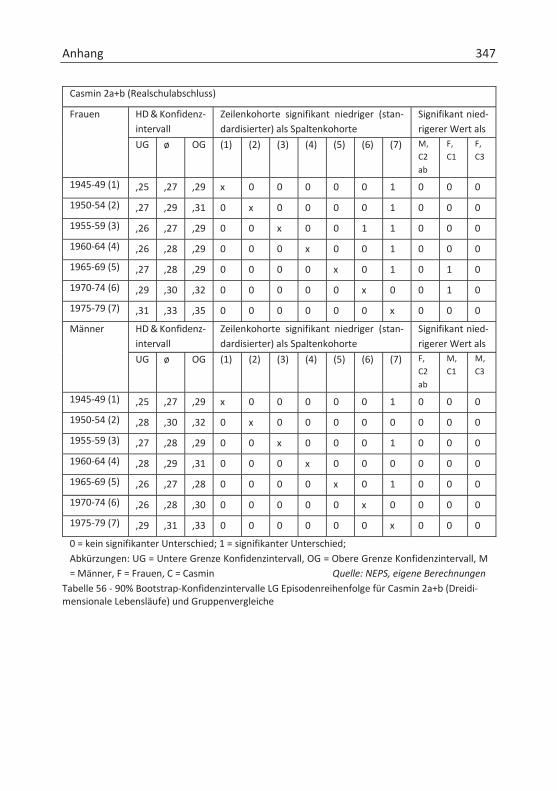
Tabelle 56 - 90% Bootstrap-Konfidenzintervalle LG Episodenreihenfolge für Casmin 2a+b (Dreidi-mensionale Lebensläufe) und Gruppenvergleiche
348 Anhang
Casmin 2c+3 (Abitur oder Fachabitur)
Frauen HD & Konfidenz-intervall
Zeilenkohorte signifikant niedriger (stan-dardisierter) als Spaltenkohorte
Signifikant nied-rigerer Wert als
UG ø OG (1) (2) (3) (4) (5) (6) (7) M, 3
F, C1
F, C2ab
1945-49 (1) ,26 ,28 ,30 x 0 0 0 0 0 0 0 0 0
1950-54 (2) ,28 ,30 ,31 0 x 0 0 0 0 0 0 0 0
1955-59 (3) ,27 ,28 ,30 0 0 x 0 0 0 0 0 0 0
1960-64 (4) ,27 ,28 ,29 0 0 0 x 0 0 0 0 0 0
1965-69 (5) ,28 ,30 ,31 0 0 0 0 x 0 0 0 0 0
1970-74 (6) ,28 ,29 ,30 0 0 0 0 0 x 0 0 1 0
1975-79 (7) ,27 ,28 ,30 0 0 0 0 0 0 x 0 1 1
Männer HD & Konfidenz-intervall
Zeilenkohorte signifikant niedriger (stan-dardisierter) als Spaltenkohorte
Signifikant nied-rigerer Wert als
UG ø OG (1) (2) (3) (4) (5) (6) (7) F, 3
M, C1
M, C2ab
1945-49 (1) ,26 ,27 ,29 x 0 0 0 0 0 0 0 0 0
1950-54 (2) ,27 ,29 ,30 0 x 0 0 0 0 0 0 0 0
1955-59 (3) ,26 ,27 ,28 0 0 x 0 0 0 0 0 0 0
1960-64 (4) ,26 ,27 ,28 0 0 0 x 0 0 0 0 1 0
1965-69 (5) ,24 ,25 ,26 0 1 1 1 x 0 0 1 1 0
1970-74 (6) ,24 ,26 ,27 0 1 0 0 0 x 0 1 1 0
1975-79 (7) ,23 ,24 ,25 1 1 1 1 0 0 x 1 1 1
0 = kein signifikanter Unterschied; 1 = signifikanter Unterschied; Abkürzungen: UG = Untere Grenze Konfidenzintervall, OG = Obere Grenze Konfidenzintervall, M = Männer, F = Frauen, C = Casmin Quelle: NEPS, eigene Berechnungen
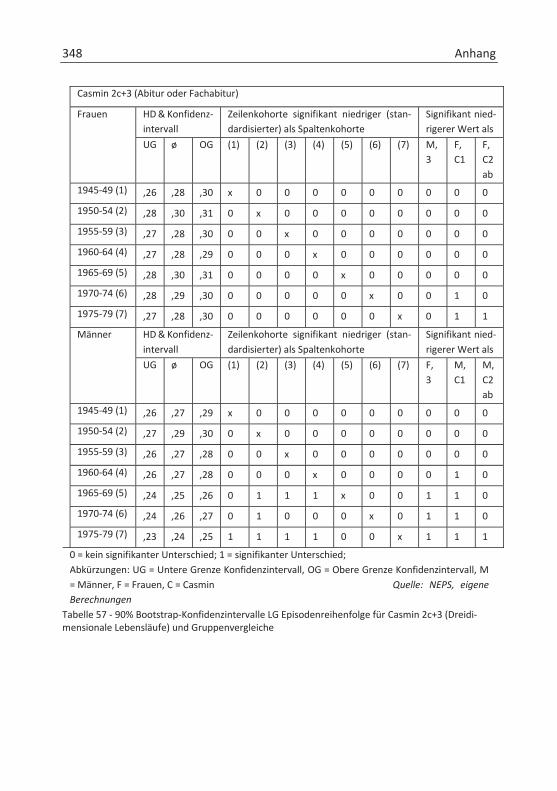
Tabelle 57 - 90% Bootstrap-Konfidenzintervalle LG Episodenreihenfolge für Casmin 2c+3 (Dreidi-mensionale Lebensläufe) und Gruppenvergleiche
Anhang 349
Kopplung Ehe und Zusammenleben mit Partner (1) (2) (3) (4) (5) (6) (7)
1945-49 (1) - *** *** *** *** *** *** 1950-54 (2) n.s. - *** *** *** ** ** 1955-59 (3) n.s. n.s. - n.s. n.s. n.s. ** 1960-64 (4) n.s. n.s. * - n.s. ** *** 1965-69 (5) n.s. n.s. n.s. n.s. - n.s. * 1970-74 (6) n.s. n.s. n.s. n.s. n.s. - n.s. 1975-79 (7) n.s. n.s. n.s. n.s. n.s. n.s. - Kopplung Ehe und Zusammenleben mit eigenen Kindern
(1) (2) (3) (4) (5) (6) (7) 1945-49 (1) - n.s. *** ** n.s. n.s. n.s. 1950-54 (2) n.s. - *** n.s. n.s. n.s. n.s. 1955-59 (3) n.s. n.s. - n.s. n.s. n.s. n.s. 1960-64 (4) n.s. *** *** - n.s. n.s. n.s. 1965-69 (5) *** *** *** *** - n.s. n.s. 1970-74 (6) *** *** *** *** n.s. - n.s. 1975-79 (7) *** *** *** *** n.s. n.s. - Kopplung Zusammenleben mit Partner und mit eigenen Kindern
(1) (2) (3) (4) (5) (6) (7) 1945-49 (1) - n.s. *** ** n.s. n.s. n.s. 1950-54 (2) n.s. - *** n.s. n.s. n.s. n.s. 1955-59 (3) n.s. n.s. - n.s. n.s. n.s. n.s. 1960-64 (4) n.s. n.s. *** - n.s. n.s. n.s. 1965-69 (5) n.s. n.s. *** ** - n.s. * 1970-74 (6) n.s. n.s. *** * n.s. - n.s. 1975-79 (7) n.s. n.s. ** n.s. n.s. n.s. - 0 = kein signifikanter Unterschied; 1 = signifikanter Unterschied; Angabe in den Zellen dazu, ob Zeilenkohorte signifikant niedrigere Streuung (standardisierter) als Spaltenkohorte (n.s. - nicht sig-nifikant / * p<,05 / ** p<,01 / *** p<,001, auf der F-Verteilung).
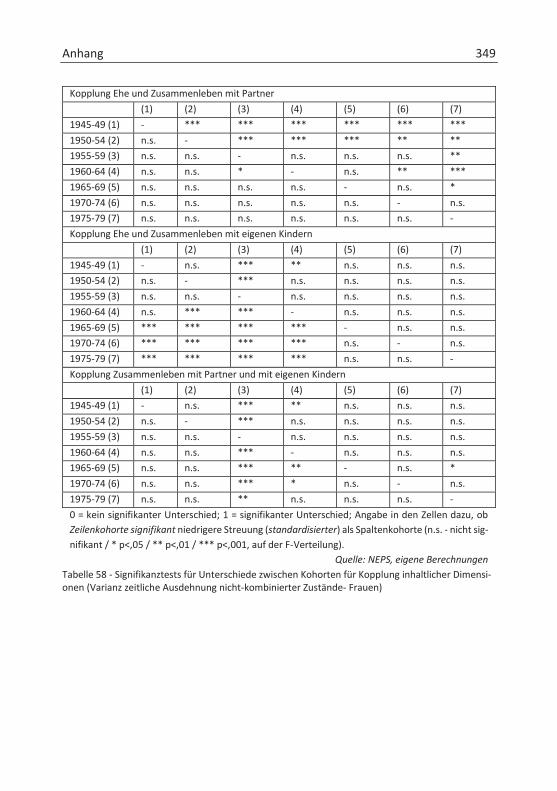
Quelle: NEPS, eigene Berechnungen Tabelle 58 - Signifikanztests für Unterschiede zwischen Kohorten für Kopplung inhaltlicher Dimensi-onen (Varianz zeitliche Ausdehnung nicht-kombinierter Zustände- Frauen)
350 Anhang
Kopplung Ehe und Zusammenleben mit Partner (1) (2) (3) (4) (5) (6) (7)
1945-49 (1) - *** *** *** *** *** *** 1950-54 (2) n.s. - *** *** *** ** ** 1955-59 (3) n.s. n.s. - n.s. n.s. n.s. n.s. 1960-64 (4) n.s. n.s. n.s. - n.s. n.s. n.s. 1965-69 (5) n.s. n.s. n.s. n.s. - n.s. n.s. 1970-74 (6) n.s. n.s. n.s. n.s. n.s. - n.s. 1975-79 (7) n.s. n.s. n.s. n.s. n.s. n.s. - Kopplung Ehe und Zusammenleben mit eigenen Kindern
(1) (2) (3) (4) (5) (6) (7) 1945-49 (1) - n.s. *** n.s. n.s. n.s. n.s. 1950-54 (2) n.s. - *** n.s. n.s. n.s. n.s. 1955-59 (3) n.s. n.s. - n.s. n.s. n.s. n.s. 1960-64 (4) ** *** *** - n.s. n.s. n.s. 1965-69 (5) *** *** *** *** - n.s. n.s. 1970-74 (6) *** *** *** *** n.s. - n.s. 1975-79 (7) *** *** *** *** *** *** - Kopplung Zusammenleben mit Partner und mit eigenen Kindern
(1) (2) (3) (4) (5) (6) (7) 1945-49 (1) - * *** ** n.s. n.s. n.s. 1950-54 (2) n.s. - *** n.s. n.s. n.s. n.s. 1955-59 (3) n.s. n.s. - n.s. n.s. n.s. n.s. 1960-64 (4) n.s. n.s. ** - n.s. n.s. n.s. 1965-69 (5) n.s. n.s. *** n.s. - n.s. n.s. 1970-74 (6) n.s. n.s. *** ** n.s. - n.s. 1975-79 (7) n.s. * *** ** n.s. n.s. - 0 = kein signifikanter Unterschied; 1 = signifikanter Unterschied; Angabe in den Zellen dazu, ob Zeilenkohorte signifikant niedrigere Streuung (standardisierter) als Spaltenkohorte (n.s. - nicht sig-nifikant / * p<,05 / ** p<,01 / *** p<,001, auf der F-Verteilung).
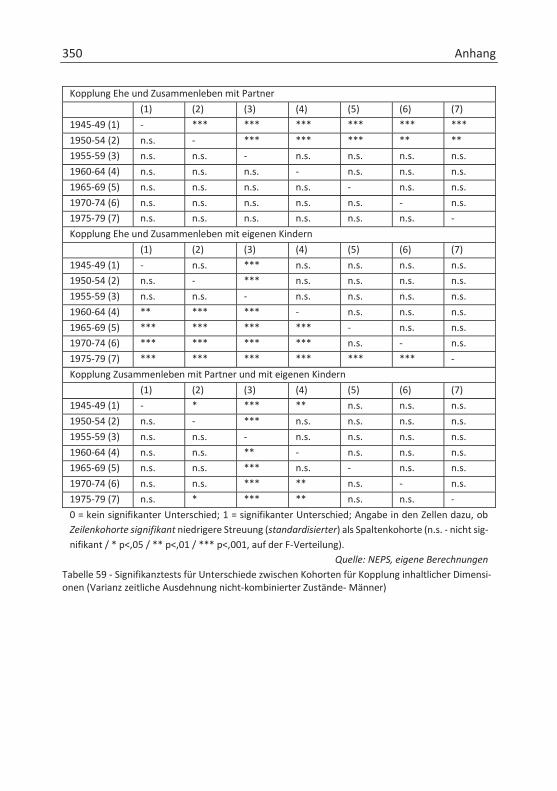
Quelle: NEPS, eigene Berechnungen Tabelle 59 - Signifikanztests für Unterschiede zwischen Kohorten für Kopplung inhaltlicher Dimensi-onen (Varianz zeitliche Ausdehnung nicht-kombinierter Zustände- Männer)
Anhang 351
Datennutzung und Förderungen
Diese Arbeit nutzt die Daten des Nationalen Bildungspanels (NEPS): Startkohorte Erwachsene, doi:10.5157/NEPS:SC6:7.0.0. Die Daten des NEPS wurden von 2008 bis 2013 als Teil des Rahmenprogramms zur Förderung der empirischen Bildungs-forschung erhoben, welches vom Bundesministerium für Bildung und Forschung (BMBF) finanziert wurde. Seit 2014 wird NEPS vom Leibniz-Institut für Bildungs-verläufe e.V. (LIfBi) an der Otto-Friedrich-Universität Bamberg in Kooperation mit einem deutschlandweiten Netzwerk weitergeführt.
Die in dieser Arbeit dargestellten Analysen wurden teilweise im Rahmen des Projektes „Neue Wege der Analyse der (De)Standardisierung von Lebensläufen - Überprüfung, Entwicklung und Vereinfachung von Methoden der Sequenzdaten-analyse“ erstellt, welches von der Deutschen Forschungsgemeinschaft (DFG) ge-fördert wird.
Teilaspekte, die in dieser Ausarbeitung ausgeführt werden, wurden von der Autorin auf der Konferenz der ‚International Sociological Association‘ (ISA) 2016 in Yokohama zur Diskussion gestellt. Die Teilnahme der Autorin an der Konferenz wurde vom Deutschen Akademischen Austauschdienst (DAAD) mit einem Stipen-dium gefördert.


![Reaktionen und Nebenwirkungen nach Impfungen · Tetanus 0,13 Mio. 13 Quellen: [2,3], hier zitiert nach [4] POSITION PAPER Reaktionen und Nebenwirkungen nach Impfungen: Erläuterungen](https://img.pdfslide.us/doc/110x75/5d307fe588c9933f438c8583/reaktionen-und-nebenwirkungen-nach-tetanus-013-mio-13-quellen-23-hier.jpg)