Embed Size (px)
Citation preview

lable at ScienceDirect
Quaternary Science Reviews 116 (2015) 72e94
Contents lists avai
Quaternary Science Reviews
journal homepage: www.elsevier .com/locate/quascirev
2700 years of Mediterranean environmental change in central Italy:a synthesis of sedimentary and cultural records to interpret pastimpacts of climate on society
Scott A. Mensing a, *, Irene Tunno b, Leonardo Sagnotti c, Fabio Florindo c, Paula Noble d,Claire Archer d, Susan Zimmerman e, Francisco Javier Pav�on-Carrasco c, Gabriele Cifani f,Susanna Passigli f, Gianluca Piovesan b
a Department of Geography, University of Nevada, Reno, NV, USAb Dendrology Lab, DAFNE Universit�a degli Studi della Tuscia, Viterbo, Italyc Istituto Nazionale di Geofisica e Vulcanologia, Rome, Italyd Department of Geosciences, University of Nevada, Reno, NV, USAe Center for Accelerator Mass Spectrometry, Lawrence Livermore National Laboratory, CA, USAf Universit�a degli Studi di Roma Tor Vergata, Rome, Italy
a r t i c l e i n f o
Article history:Received 20 October 2014Received in revised form21 March 2015Accepted 23 March 2015Available online
Keywords:Central ItalyMediterranean environmentsSociety and climatePaleoenvironmental changePollenPaleomagnetismGeochemistryHistorical documentsLate HoloceneRoman Empire
* Corresponding author.E-mail address: [email protected] (S.A. Mensing)
http://dx.doi.org/10.1016/j.quascirev.2015.03.0220277-3791/© 2015 Elsevier Ltd. All rights reserved.
a b s t r a c t
Abrupt climate change in the past is thought to have disrupted societies by accelerating environmentaldegradation, potentially leading to cultural collapse. Linking climate change directly to societal disrup-tion is challenging because socioeconomic factors also play a large role, with climate being secondary orsometimes inconsequential. Combining paleolimnologic, historical, and archaeological methods providesfor a more secure basis for interpreting the past impacts of climate on society. We present pollen, non-pollen palynomorph, geochemical, paleomagnetic and sedimentary data from a high-resolution 2700 yrlake sediment core from central Italy and compare these data with local historical documents andarcheological surveys to reconstruct a record of environmental change in relation to socioeconomichistory and climatic fluctuations. Here we document cases in which environmental change is stronglylinked to changes in local land management practices in the absence of clear climatic change, as well asexamples when climate change appears to have been a strong catalyst that resulted in significantenvironmental change that impacted local communities. During the Imperial Roman period, despite along period of stable, mild climate, and a large urban population in nearby Rome, our site shows onlylimited evidence for environmental degradation. Warm and mild climate during the Medieval Warmperiod, on the other hand, led to widespread deforestation and erosion. The ability of the Romans toutilize imported resources through an extensive trade network may have allowed for preservation of theenvironment near the Roman capital, whereas during medieval time, the need to rely on local resourcesled to environmental degradation. Cool wet climate during the Little Ice Age led to a breakdown in localland use practices, widespread land abandonment and rapid reforestation. Our results present a high-resolution regional case study that explores the effect of climate change on society for an under-documented region of Europe.
© 2015 Elsevier Ltd. All rights reserved.
1. Introduction
The extent to which past abrupt climate change has directlyresulted in societal disruption or cultural collapse, and the ability of
.
societies to adapt to these changes is strongly debated (Berglund,2003; Diamond, 2005; Munoz et al., 2010), but is potentially sig-nificant for modern communities facing future climate change(Büntgen et al., 2011). Studies concerned with the link betweenclimate and human affairs have increasingly recognized the need toexamine societal change in parallel with climate change (Dearinget al., 2008; Coombes et al., 2009; Munoz et al., 2010; McCormicket al., 2012), although the tendency persists among physical
S.A. Mensing et al. / Quaternary Science Reviews 116 (2015) 72e94 73
scientists to link cultural shifts directly to climate change(O'Sullivan, 2008; Aimers, 2011). Detailed historical analyses basedon precisely dated documents have identified instances whenclimate has led to significant societal disruption or ‘collapse’, butthese analyses also detail multiple examples in which socioeco-nomic factors played the larger role in environmental change, withclimate being secondary or inconsequential (Ladurie, 1971). For thisreason, it is critical that studies attempting to elucidate the impactof climate on society closely couple paleoecologic methods withhistorical and archaeological methods (Dearing et al., 2008;O'Sullivan, 2008; Coombes et al., 2009; Harris, 2013).
The relationship between climate change and cultural responsecan be addressed in areas where multi-proxy studies of cores fromlakes with very high sediment accumulation rates can be examinedwithin the context of awell-documentedwritten history (Berglund,2003). Such a history may provide insights into human adaptivestrategies that allowed societies to cope with past climate change(Fraser, 2011). Several recent high-resolution syntheses have drawna link between climate stability and the expansion, and eventualcontraction, of the Roman Empire (Büntgen et al., 2011; McCormicket al., 2012). These studies note that focused regional case studieswith highly resolved datasets are still needed to test the potentialeffect of rapid climate change on human societies. Such datasets areparticularly needed in under-documented regions of the RomanEmpire, including southern Europe, and the regions near Rome.
In central Italy, archival materials are nearly continuouslyavailable from ~700 CE (common era) in the records of the FarfaAbbey (Leggio, 1995a) in northern Lazio, Central Italy, with somewritten records extending back to the Roman period (De Santis andCoarelli, 2009). These documents provide a written environmentalhistory that can be compared with physical paleoecologic re-constructions. Paleoecologic reconstructions for the last 3000 yearsare still underrepresented in Italy (Roberts et al., 2004; Magri,2007) with studies from the southern Alps and North Italy(Kaltenrieder et al., 2010; Joannin et al., 2014), the northern andcentral Apennines (e.g. Mercuri et al., 2002; Brown et al., 2013;Branch and Marini, 2014), the Tiber Delta (Di Rita et al., 2010),and southern Italy, Sicily and Sardinia (e.g. Russo Ermolli and diPasquale, 2002; Di Rita and Magri, 2009; Tinner et al., 2009; DiRita and Melis, 2013; Sadori et al., 2013). These studies record themajor changes in vegetation in relation to human activity duringthis time period but present very different impacts depending onsites and historical periods. In addition, the sampling resolution isgenerally at the centennial or millennial scale and cannot be easilycompared with historical records. The last 3000 years are ofparticular interest because they encompass several important cli-matic changes often associated with cultural change, including theRoman Optimum (100 BCE e 200 CE; BCE e before common era),the Medieval Warm Period (MWP), ~950 to 1250 CE, and the LittleIce Age (LIA) ~1250 to 1850 CE, (Büntgen et al., 2011; Christiansenand Ljungqvist, 2012; McCormick et al., 2012).
In this paper, we present multiple physical proxies (pollen, non-pollen palynomorphs, paleomagnetism, sedimentology, geochem-istry and charcoal) from a small lake in the Rieti Basin, Central Italy,to reconstruct a high-resolution record of environmental historyfrom the present through the pre-Roman period. The basin, locatedapproximately 80 km north of Rome, has a well-documentedarcheological record from pre-Roman times (Coccia et al., 1992)and historical documents from early Roman times (Coccia et al.,1992; Leggio, 1995a). We compare our physical proxies with thewell-documented historical record of human activity and culturalchange, and with independent climate records to explore the linkbetween the timing of climate change, environmental change, andhistorical events. This study complements previous high-resolutionregional syntheses from central and northern Europe (Ladurie,
1971; Büntgen et al., 2011; McCormick et al., 2012) by providing anew site in southern Europe at the center of the Roman Empire. Theresults contribute to our understanding of Mediterranean forestdynamics and can be used to verify recent efforts to model thehistory of deforestation in Europe (Kaplan et al., 2009).
2. Study area
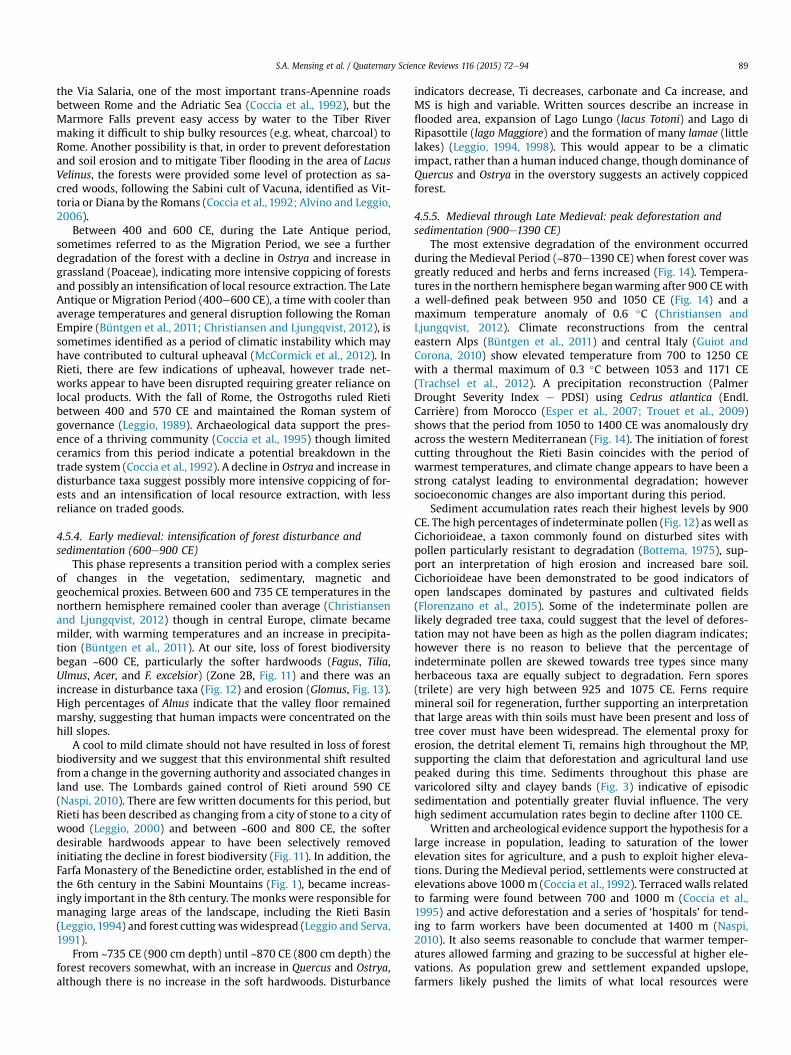
Lago Lungo (369m abovemean sea level) is one of four remnantlakes of ancient Lacus Velinus in the Rieti Basin (Fig. 1), an inter-montane depression in the Central Apennines that locally reach anelevation of 2217 m at Monti Reatini (Calderoni et al., 1994). TheVelino, Salto and Turano Rivers flow into the basin, which is thendrained by the Velino River, which plummets over a travertine sillat Marmore Falls. Other sources of inflow into the basin arenumerous artesian springs that lie along the eastern edge of thebasin. Water level in the basin is controlled by the elevation of thetravertine sill (Calderoni et al., 1994). During prehistoric time,travertine built up during warm periods, raising the sill andexpanding wetlands, and alternatively eroded during cold periodsdraining the valley (Calderini et al., 1998; Soligo et al., 2002). Be-tween ~6000 and 3000 yr BP a large shallow lake (Lacus Velinus)filled the basin (Calderoni et al., 1994). Written documents suggestthat the Romans cut a channel through the travertine sill to drainthe land in ~270 BCE (Coccia et al., 1992). Since that time, waterlevel in the basin has been controlled periodically by maintainingexisting channels and cutting new channels (Lorenzetti, 1989).Historical maps suggest that the size and shape of lakes, theirproximity to the Velino River, and the extent of wetlands in thebasin has changed through time. Today, Lago Lungo has amaximumdepth of up to 7 mwith a surface area of 0.78 km2 and surface levelmaintained at 369m above sea level (Riccardi, 2006). Inflow is froma network of ditches that drain surrounding wetlands, springs, andfarmland. Lago Lungo is protected within Riserva Naturale dei LaghiLungo e Ripasottile (Riccardi, 2006).
The geology of the region is characterized by recently upliftedmarine sediments. The Central Apennines are primarily composedof Upper Triassic to Middle Miocene carbonates (Parotto andPraturlon, 1975; Cosentino et al., 2010). Rieti is a seismicallyactive extensional basin within the Apennine thrust system and ispartially filled with Upper Pliocene and Holocene continental andmarine sediments (Cavinato and De Celles, 1999; Soligo et al.,2002). Travertine outcrops are present across the basin, associ-ated with past periods of warm wet climate. Seismic activity hasinfluenced the location and discharge of springs responsible fordepositing the travertines (Soligo et al., 2002). The largest spring inthe basin, Santa Susanna Spring, has a discharge of 4.1 m3 s�1 and islocated ~3 km northeast of Lago Lungo (Spadoni et al., 2010).
Modern vegetation is dominated by agriculture in the basin andheavily managed forest on the surrounding slopes. Phragmites andSalix species grow in a narrow (~15 m) band of protected landwithin the reserve, while beyond the reserve border the basin flooris nearly entirely devoted to agriculture (Casella et al., 2009). Forestvegetation at lower elevations within the basin is characterized bytemperate deciduous forest (e.g. Carpinus betulus L., Fraxinus spp.,Ulmus campestris Auct.) with an important submediterraneancomponent (Quercus pubescens Willd., Quercus cerris L.; CarpinusorientalisMiller; Ostrya carpinifolia Scop.); in the foothills on steep/shallow soils some patches of Mediterranean trees and shrubs(Quercus ilex L., Phyllirea variabilis L., Pinus halepensis Miller) arepresent while in the mountain belt (above 800e900 m) beech(Fagus sylvatica L.) forests are common. Climatically the area iswithin a transition zone between warm and cool temperate cli-mates with a Mediterranean precipitation pattern characterized bylow precipitation during summer. Mean annual temperature varies
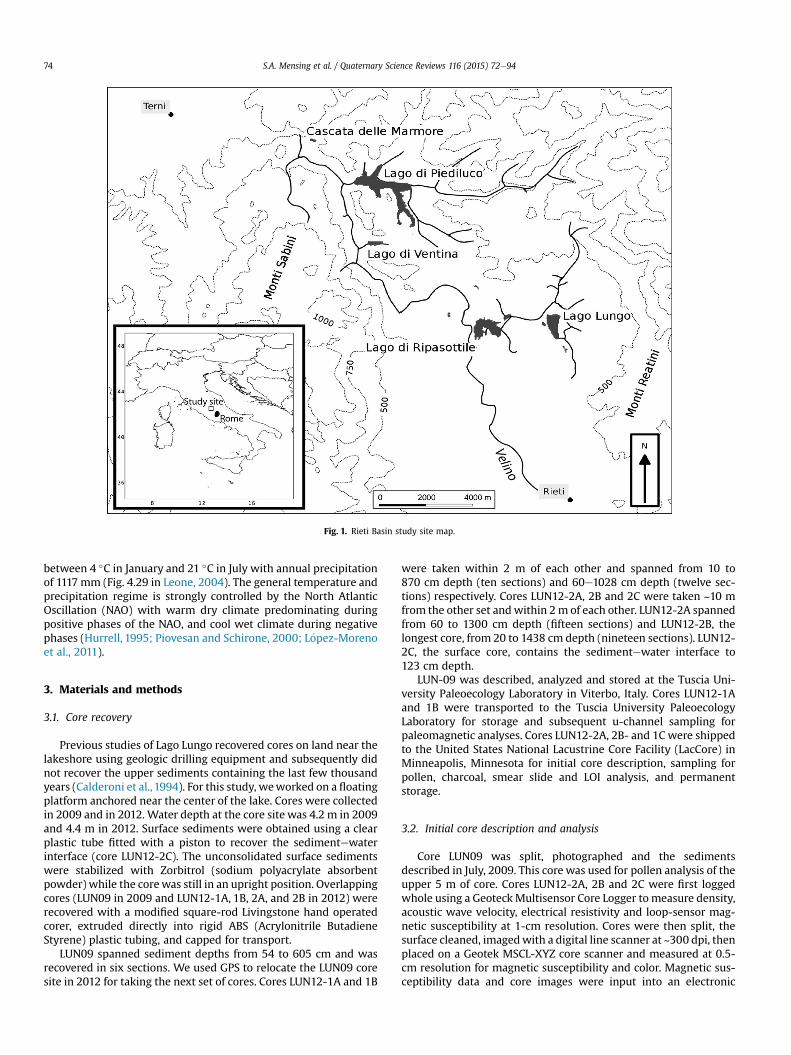
Fig. 1. Rieti Basin study site map.
S.A. Mensing et al. / Quaternary Science Reviews 116 (2015) 72e9474
between 4 �C in January and 21 �C in July with annual precipitationof 1117 mm (Fig. 4.29 in Leone, 2004). The general temperature andprecipitation regime is strongly controlled by the North AtlanticOscillation (NAO) with warm dry climate predominating duringpositive phases of the NAO, and cool wet climate during negativephases (Hurrell, 1995; Piovesan and Schirone, 2000; L�opez-Morenoet al., 2011).
3. Materials and methods
3.1. Core recovery
Previous studies of Lago Lungo recovered cores on land near thelakeshore using geologic drilling equipment and subsequently didnot recover the upper sediments containing the last few thousandyears (Calderoni et al., 1994). For this study, weworked on a floatingplatform anchored near the center of the lake. Cores were collectedin 2009 and in 2012. Water depth at the core site was 4.2 m in 2009and 4.4 m in 2012. Surface sediments were obtained using a clearplastic tube fitted with a piston to recover the sedimentewaterinterface (core LUN12-2C). The unconsolidated surface sedimentswere stabilized with Zorbitrol (sodium polyacrylate absorbentpowder) while the corewas still in an upright position. Overlappingcores (LUN09 in 2009 and LUN12-1A, 1B, 2A, and 2B in 2012) wererecovered with a modified square-rod Livingstone hand operatedcorer, extruded directly into rigid ABS (Acrylonitrile ButadieneStyrene) plastic tubing, and capped for transport.
LUN09 spanned sediment depths from 54 to 605 cm and wasrecovered in six sections. We used GPS to relocate the LUN09 coresite in 2012 for taking the next set of cores. Cores LUN12-1A and 1B
were taken within 2 m of each other and spanned from 10 to870 cm depth (ten sections) and 60e1028 cm depth (twelve sec-tions) respectively. Cores LUN12-2A, 2B and 2C were taken ~10 mfrom the other set andwithin 2m of each other. LUN12-2A spannedfrom 60 to 1300 cm depth (fifteen sections) and LUN12-2B, thelongest core, from 20 to 1438 cm depth (nineteen sections). LUN12-2C, the surface core, contains the sedimentewater interface to123 cm depth.
LUN-09 was described, analyzed and stored at the Tuscia Uni-versity Paleoecology Laboratory in Viterbo, Italy. Cores LUN12-1Aand 1B were transported to the Tuscia University PaleoecologyLaboratory for storage and subsequent u-channel sampling forpaleomagnetic analyses. Cores LUN12-2A, 2B- and 1C were shippedto the United States National Lacustrine Core Facility (LacCore) inMinneapolis, Minnesota for initial core description, sampling forpollen, charcoal, smear slide and LOI analysis, and permanentstorage.
3.2. Initial core description and analysis
Core LUN09 was split, photographed and the sedimentsdescribed in July, 2009. This core was used for pollen analysis of theupper 5 m of core. Cores LUN12-2A, 2B and 2C were first loggedwhole using a GeoteckMultisensor Core Logger tomeasure density,acoustic wave velocity, electrical resistivity and loop-sensor mag-netic susceptibility at 1-cm resolution. Cores were then split, thesurface cleaned, imagedwith a digital line scanner at ~300 dpi, thenplaced on a Geotek MSCL-XYZ core scanner and measured at 0.5-cm resolution for magnetic susceptibility and color. Magnetic sus-ceptibility data and core images were input into an electronic

S.A. Mensing et al. / Quaternary Science Reviews 116 (2015) 72e94 75
standard core description sheet and the sheets annotated forstratigraphy, sedimentology and correlation points between coresusing both the images and the freshly split cores. Smear slides,taken every 20 cm and from selected strata, were used to aid in coredescription and to identify the major sedimentologic components.
The observed sedimentologic features and magnetic suscepti-bility data were used to correlate cores LUN12 2A, 2B, and 2C, oftenallowing for a visual match of individual suites of bands and layersbetween cores (Figs. 2 and 3). Areas of core distortion, caused bycoring artifacts, and sections with no core recovery were identified,and a continuous ‘master core,’ hereafter referred to as LUN12-2,was constructed from the three cores, that spans a total sedimen-tary thickness of 14.4 m. Magnetic susceptibility was further usedto correlate between core LUN12-2 and LUN12-1A and 1B, andLUN09, which were neither photographed nor logged in detail.
Samples (1.25 cm3) were taken every 10 cm (3e5 cm in sedi-ment transition zones) from LUN12-2 for measuring percent totalorganic matter (%organic) and percent carbonate (%CaCO3) usingthe loss on ignition method protocols at LacCore based on Dean(1974) and Heiri et al. (2001). Samples were weighed, dried at100 �C for 24 h, then combusted at 550 �C for four hours followedby combustion at 1000 �C for two hours.
Core LUN12-2 was transported to the Large Lakes Laboratory inDuluth, Minnesota for analysis using the ITRAX x-ray fluorescence
Fig. 2. Correlation of cores 2A, 2B, and 2C based distinctive sedimentologic features.Livingston core sections are denoted for cores 2A and 2B. Shaded areas denote sectionsused in composite core, pictured in Fig. 3. 1 ¼ oxidized band; 2 ¼ discontinuouslylaminated dark silty marl; 3 ¼ varicolored banded clay, silt, and carbonate; 4 ¼ grayclay; 5 ¼ organic-rich marl with calcite stringers.
(XRF) scanner (Cox Analytical Instruments) to provide elementalgeochemistry data. The LUN12-2 core was scanned at a resolutionof 0.5 cm throughout, except for the middle 7 sections (2B-5Lthrough 11L), which were scanned at a resolution of 0.2 cm to pickup observed variations in sedimentary banding. The top section(LUN12-2C) was also scanned at a 0.2 cm resolution. The scannerwas operated using a molybdenum source, 30 s dwell-time, avoltage of 30 kV and an x-ray current of 30 mA to obtain peak areasfor elements SiePb. A principal component analysis using the rdafunction in the vegan 2.0-6 package in R, version 2.1.5.2 (RDevelopment Core Team, 2012) was performed on the raw XRFdata output, on both the whole core and on individual sections asan initial data analysis step to determine gross distribution patternsand co-variance of elements. Time series plots for core LUN12-2were then generated for a subset of elements determined to be ofinterest as sedimentologic and lake chemistry proxies (Ti, Fe, Mn,Ca, and Sr). Raw counts of the element subset were normalized bycentering and standardizing the data (raw data-mean of data/standard deviation), allowing for the comparison of the minima,maxima, and trends of major elements with very different ranges ofcounts within the core.
3.3. Rock magnetism and paleomagnetism
Natural and artificial magnetizations were measured at roomtemperature at the paleomagnetic laboratory of the IstitutoNazionale di Geofisica e Vulcanologia (INGV) in Rome, on a narrow-access (45 mm diameter) automated pass through ‘2G Enterprises’DC 755 superconducting rock magnetometer (SRM), housed in aLodestar Magnetics shielded room. The cryogenic magnetometer isequipped with in-line orthogonal alternating field (AF) demagne-tization coils, with optional application of a single-axis direct cur-rent (DC) field for production of an anhysteretic remanentmagnetization (ARM). Rock magnetic and paleomagnetic proper-ties were measured at 1-cm spacing on u-channel samplescollected from 4 distinct and partly overlapping cores (LUN09,LUN12-1A, LUN12-1B and the lower 5.4 m of LUN12-2B).
To minimize sample dehydration and alteration, u-channelsamples were stored in a refrigerated room until they were pro-cessed. For each u-channel, we first measured both the low-fieldmagnetic susceptibility (k), using a Bartington magnetic suscepti-bility probe MS2C in-line with the rock magnetometer, and thenatural remanent magnetization (NRM). Then, all u-channels wereAF demagnetized in 10 steps (using peak fields of 5, 10, 15, 20, 30,40, 50, 60, 80 and 100 milliTesla (mT), with remanence vectorsmeasured after each demagnetization step, in order to investigatethe stability of the NRM and to reveal possible secondaryoverprints.
Finally, an ARM was imparted using a 0.05 mT direct current(DC) bias field and an axial 100 mT peak AF, and translating the u-channel through the AF and dc coil system at a speed of 10 cm/s, thelowest speed allowed by the software running the measurements.The adopted procedure equals an AF decay rate of ca 67 mT/half-cycle and results in the highest ARM intensity achievable with theemployed instrumental setting and management software(Sagnotti et al., 2003; Sagnotti, 2013). The ARMwas then measuredand stepwise AF demagnetized using the procedure applied to theNRM.
From the AF demagnetization data of both the NRM and theARM we computed the median destructive field (MDF), which isdefined as the value of the peak AF necessary to reduce theremanence intensity to half of its initial value.
The raw magnetic moment data measured by the threeorthogonal SQUID sensors of the SRM system were automaticallycorrected by compensating for the different shape and widths of

Fig. 3. High resolution images of the Lago Lungo Master core (LUN 12-2). Individual cores sections used in the master are labelled. White boxes represent core sections with norecovery. Running depth is a continuous measure (m) of the total core length.
S.A. Mensing et al. / Quaternary Science Reviews 116 (2015) 72e9476
the response function curves of the three SQUID pick-up coils(Roberts, 2006). Moreover, we took particular care in avoidingeventual disturbance effects that may be introduced during thecoring, cutting and sampling procedures and could result inremanence deflections due to plastic deformation of the soft sedi-ments. We also disregarded the paleomagnetic data for ~5 cm atboth ends of each u-channel to avoid disturbances linked to edgeeffects.
3.4. 210PB, 137CS, and 14C AMS analysis
Continuous 1-cm3 samples were taken from the full length ofthe surface core (LUN12-2C), freeze dried and sent to Flett ResearchLtd. for 210Pb and 137CS analysis. Plant macrofossils for 14C AMSdating were not found during the initial core description, thereforeextensive efforts were made to obtain datable materials. To findplant macrofossils and macroscopic charcoal, we sieved a total of525 cm of core (90 samples, 5 from LUN09 and 85 from LUN12). ForLUN09 we subsampled 20-cm long sections of half the core(~200 cm3 per sample), soaked the sediments in a 5% solution ofsodium metaphosphate for 12 h, and then sieved at 250 mm. Wefollowed the same process for LUN12 but decreased the sample sizeto 5-cm long sections (~50 cm3). Twomicroscopic charcoal sampleswere picked by hand from samples that appeared to be richer incharcoal. We concentrated pollen from a 20 cm section of core for14C AMS dating, following Newnham et al. (2007) then purified theconcentrate using flow cytometry (Tennant et al., 2013).
One macrofossil (LTL 4680A) was submitted for AMS analysis atCEDAD at the University of Salento, Brindisi, Italy; all others weresubmitted to the Center for Accelerator Mass Spectrometry (CAMS)at Lawrence Livermore National Laboratory, USA. All macrofossilswere chemically pretreated with the standard acid-base-acid (ABA)treatment before being combusted under vacuum and graphitizedaccording to standard procedures (Vogel et al., 1984).
To test for the magnitude of a potential aquatic reservoir effect, aPhragmites plant growing in the lake was uprooted and pieces ofthe roots, stem, and leaves were rinsed in deionized water beforetransport to LLNL for radiocarbon analysis. All samples were pre-treated, graphitized, and measured according to the same protocolsas the fossil samples; dates on the roots and leaves were replicated.
3.5. Tephra analysis
Italy has a history of active volcanic eruptions, although mostare well to the south of our site and no tephras from the last threemillennia have been confirmed for our region (Giaccio et al., 2009;Sulpizio et al., 2014). Nevertheless, to test the potential for teph-rochronology, twelve 10e40 cm thick samples were collected fromLUN12-1B at age intervals, based on the paleomagnetic secularvariation age model, discussed below, corresponding to periods oferuptions from Vesuvius, Phlegrean Fields, Ischia Island, Vulcanoand the Lipari Islands. Eight samples were prepared on alloy stubsfor morphological and textural observations and qualitativechemical analysis of components using a Zeiss EVOMA 10 scanning
Fig. 4. Plot of all 14C AMS radiocarbon and 210Pb dates (Table 2) and PSV age model andcultigen dates (Table 1) used in this study. Black line represents the age model derivedfrom PSV tie points including rock magnetic variables (RPI, inclination and declination)and cultigens (Cannabis, Zea mays and forest transition) described in Table 1. Green linerepresents the age model derived from 14C on leaf fragments from LUN12 and 210Pbbasal date (Table 2). PSV uncertainties represent the 65% and 95% of confidence levelsaccording to the SCHA.DIF.3k model predictions (Pav�on-Carrasco et al., 2009). 14Cuncertainties represent the 2 sigma range of the mean probability using Calib 7.1(Reimer et al., 2013). (For interpretation of the references to colour in this figurelegend, the reader is referred to the web version of this article.)
S.A. Mensing et al. / Quaternary Science Reviews 116 (2015) 72e94 77
electron microscope (SEM) equipped with an Oxford ISIS micro-analysis system at INGV in Pisa. No tephra were recovered and thisline of investigation was not pursued further.
3.6. Pollen and charcoal analysis
A total of one hundred samples (0.625 cc volume) were pro-cessed for pollen analysis using acid digestion procedures (Faegriand Iversen, 1985); two samples from the surface core (LUN12-2C), forty from LUN09 (40e605 cm depth), and fifty-eight fromLUN12-2B (460e1438 cm depth). A known quantity of an exotictracer (Lycopodium) was added to each sample during processing(Stockmarr, 1971) and counted along with pollen for calculatingpollen concentration. Pollen counts for LUN09 (6 m in length) werecompleted before recovering LUN12-2B (14.4 m in length), there-fore we counted duplicate samples from each core for the over-lapping section from 460 to 605 cm depth. Duplicate counts weresimilar, and in the overlapping section we used only the countsfrom LUN12-2B, which were done at a later date, for a total ofninety-one samples in the final pollen diagram. A minimum of 400terrestrial pollen grains were counted per sample (mean ¼ 441)except for samples with very low concentration rates (n ¼ 23), inwhich case a sum of 200e300 grains were counted (mean ¼ 222).Pollen count totals excluded aquatic pollen types, such as Typha,Nuphar and Potamogeton, algae, and non-pollen palynomorphs.
Pollen and non-pollen palynomorphs were identified usingreference material in the Tuscia University Paleoecology Lab, pub-lished keys and manuscripts (Punt and Malotaux, 1984; Punt et al.,1991; Chester and Raine, 2001; Blackmore et al., 2003; Beug, 2004;van Geel and Aptroot, 2006; Cugny et al., 2010; van Geel et al.,2011). TC pollen (Taxaceae and Cupressaceae) was assumed to beJuniperus, a native taxa. Species of Quercuswere identified as eitherQ. pubescens e robur L. type, or Q. cerris L. (deciduous) or Q. ilex L.(evergreen) following Van Benthem et al. (1984). For plotting pur-poses Quercus is represented as deciduous or evergreen (Q. ilextype). Members of the family Poaceae were identified as cereals ifgrains were >37 mm, pore diameter was >2.7 mm and annulusthickness was >2.0 mm, following K€ohler and Lange (1979). Pollenpercentages were calculated from the sum of terrestrial pollen,excluding indeterminate grains and Cannabis type (which wasretted in the lake at certain periods). Accumulation rates(grains cm�2 yr�1) were calculated by dividing concentration(grains cm�3) by the number of years per sample (yr cm�1) andnormalizing by number of Lycopodium counted. Aquatic taxa, algae,and non-pollen palynomorphs are presented as accumulation rates,since they appear intermittently in the record and total quantityrepresents actual abundance better than does percentage. Zonationwas interpreted from a constrained single-link dendrogram createdusing CONISS in the PolPal plotting program (Nalepka andWalanus,2003). Data input included the fifty-three terrestrial taxa with atleast one strata of >1% of the pollen sum, excluding Cannabis typeand indeterminate grains.
Charcoal particles were counted on pollen slides in two sizefractions, 50e125 um and >125 um elongest dimension (Sadoriand Guardini, 2007). All fragments that met the criteria of beingblack and having a visible cellular structure were counted.
3.7. Archaeological, historical and archival documents
The bulk of the archaeological documentation is represented bytwo surveys carried out in the area in the 1980s by the University ofPerugia and in the 1990s by the British School at Rome (Coccia et al.,1992, 1995).
The earlymedieval phase is well documented by one of themostimportant collections of Europe: the archive of the Farfa Abbey,
which contains a body of documents concerning the history of theterritory between the 8th and the 12th century AD. The late me-dieval phase (13the15th century) is well documented through thearchive of the Comune of Rieti and that of Rieti cathedral(Caciorgna, 1998, 2000; Leggio, 1998). The history from 16th cen-tury onward has been analyzed in detail by means of additionalarchive (Dupr�e, 1939; Lorenzetti, 1989) and map collections in theArchivio di Stato in Rome and Rieti (Lorenzetti, 1990,1994, 2009). Incorrelating the sedimentary evidence with historical evidence wehave provided names and time periods following the systemdeveloped by Coccia et al. (1995) based on changes in archeologicceramics in the Rieti Basin.
4. Results and discussion
4.1. Chronology
Developing a core chronology based largely on 14C datingproved challenging given that the carbonate bedrock introducesthe potential for significant old-carbon effects and plant macro-fossils were hard to find and not well-distributed throughout thecore. We therefore developed two independent age models, one
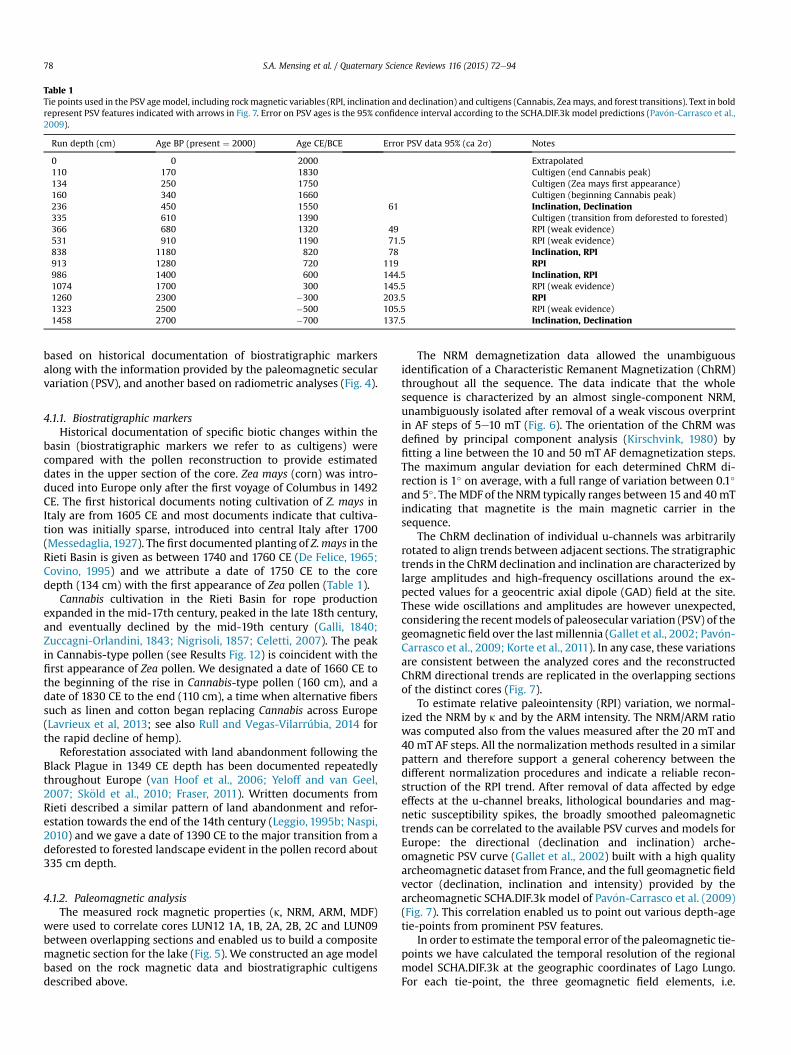
Table 1Tie points used in the PSV agemodel, including rockmagnetic variables (RPI, inclination and declination) and cultigens (Cannabis, Zeamays, and forest transitions). Text in boldrepresent PSV features indicated with arrows in Fig. 7. Error on PSV ages is the 95% confidence interval according to the SCHA.DIF.3k model predictions (Pav�on-Carrasco et al.,2009).
Run depth (cm) Age BP (present ¼ 2000) Age CE/BCE Error PSV data 95% (ca 2s) Notes
0 0 2000 Extrapolated110 170 1830 Cultigen (end Cannabis peak)134 250 1750 Cultigen (Zea mays first appearance)160 340 1660 Cultigen (beginning Cannabis peak)236 450 1550 61 Inclination, Declination335 610 1390 Cultigen (transition from deforested to forested)366 680 1320 49 RPI (weak evidence)531 910 1190 71.5 RPI (weak evidence)838 1180 820 78 Inclination, RPI913 1280 720 119 RPI986 1400 600 144.5 Inclination, RPI1074 1700 300 145.5 RPI (weak evidence)1260 2300 �300 203.5 RPI1323 2500 �500 105.5 RPI (weak evidence)1458 2700 �700 137.5 Inclination, Declination
S.A. Mensing et al. / Quaternary Science Reviews 116 (2015) 72e9478
based on historical documentation of biostratigraphic markersalong with the information provided by the paleomagnetic secularvariation (PSV), and another based on radiometric analyses (Fig. 4).
4.1.1. Biostratigraphic markersHistorical documentation of specific biotic changes within the
basin (biostratigraphic markers we refer to as cultigens) werecompared with the pollen reconstruction to provide estimateddates in the upper section of the core. Zea mays (corn) was intro-duced into Europe only after the first voyage of Columbus in 1492CE. The first historical documents noting cultivation of Z. mays inItaly are from 1605 CE and most documents indicate that cultiva-tion was initially sparse, introduced into central Italy after 1700(Messedaglia,1927). The first documented planting of Z. mays in theRieti Basin is given as between 1740 and 1760 CE (De Felice, 1965;Covino, 1995) and we attribute a date of 1750 CE to the coredepth (134 cm) with the first appearance of Zea pollen (Table 1).
Cannabis cultivation in the Rieti Basin for rope productionexpanded in the mid-17th century, peaked in the late 18th century,and eventually declined by the mid-19th century (Galli, 1840;Zuccagni-Orlandini, 1843; Nigrisoli, 1857; Celetti, 2007). The peakin Cannabis-type pollen (see Results Fig. 12) is coincident with thefirst appearance of Zea pollen. We designated a date of 1660 CE tothe beginning of the rise in Cannabis-type pollen (160 cm), and adate of 1830 CE to the end (110 cm), a time when alternative fiberssuch as linen and cotton began replacing Cannabis across Europe(Lavrieux et al, 2013; see also Rull and Vegas-Vilarrúbia, 2014 forthe rapid decline of hemp).
Reforestation associated with land abandonment following theBlack Plague in 1349 CE depth has been documented repeatedlythroughout Europe (van Hoof et al., 2006; Yeloff and van Geel,2007; Sk€old et al., 2010; Fraser, 2011). Written documents fromRieti described a similar pattern of land abandonment and refor-estation towards the end of the 14th century (Leggio, 1995b; Naspi,2010) and we gave a date of 1390 CE to the major transition from adeforested to forested landscape evident in the pollen record about335 cm depth.
4.1.2. Paleomagnetic analysisThe measured rock magnetic properties (k, NRM, ARM, MDF)
were used to correlate cores LUN12 1A, 1B, 2A, 2B, 2C and LUN09between overlapping sections and enabled us to build a compositemagnetic section for the lake (Fig. 5). We constructed an age modelbased on the rock magnetic data and biostratigraphic cultigensdescribed above.
The NRM demagnetization data allowed the unambiguousidentification of a Characteristic Remanent Magnetization (ChRM)throughout all the sequence. The data indicate that the wholesequence is characterized by an almost single-component NRM,unambiguously isolated after removal of a weak viscous overprintin AF steps of 5e10 mT (Fig. 6). The orientation of the ChRM wasdefined by principal component analysis (Kirschvink, 1980) byfitting a line between the 10 and 50 mT AF demagnetization steps.The maximum angular deviation for each determined ChRM di-rection is 1� on average, with a full range of variation between 0.1�
and 5�. TheMDF of the NRM typically ranges between 15 and 40mTindicating that magnetite is the main magnetic carrier in thesequence.
The ChRM declination of individual u-channels was arbitrarilyrotated to align trends between adjacent sections. The stratigraphictrends in the ChRM declination and inclination are characterized bylarge amplitudes and high-frequency oscillations around the ex-pected values for a geocentric axial dipole (GAD) field at the site.These wide oscillations and amplitudes are however unexpected,considering the recentmodels of paleosecular variation (PSV) of thegeomagnetic field over the last millennia (Gallet et al., 2002; Pav�on-Carrasco et al., 2009; Korte et al., 2011). In any case, these variationsare consistent between the analyzed cores and the reconstructedChRM directional trends are replicated in the overlapping sectionsof the distinct cores (Fig. 7).
To estimate relative paleointensity (RPI) variation, we normal-ized the NRM by k and by the ARM intensity. The NRM/ARM ratiowas computed also from the values measured after the 20 mT and40 mT AF steps. All the normalization methods resulted in a similarpattern and therefore support a general coherency between thedifferent normalization procedures and indicate a reliable recon-struction of the RPI trend. After removal of data affected by edgeeffects at the u-channel breaks, lithological boundaries and mag-netic susceptibility spikes, the broadly smoothed paleomagnetictrends can be correlated to the available PSV curves and models forEurope: the directional (declination and inclination) arche-omagnetic PSV curve (Gallet et al., 2002) built with a high qualityarcheomagnetic dataset from France, and the full geomagnetic fieldvector (declination, inclination and intensity) provided by thearcheomagnetic SCHA.DIF.3k model of Pav�on-Carrasco et al. (2009)(Fig. 7). This correlation enabled us to point out various depth-agetie-points from prominent PSV features.
In order to estimate the temporal error of the paleomagnetic tie-points we have calculated the temporal resolution of the regionalmodel SCHA.DIF.3k at the geographic coordinates of Lago Lungo.For each tie-point, the three geomagnetic field elements, i.e.
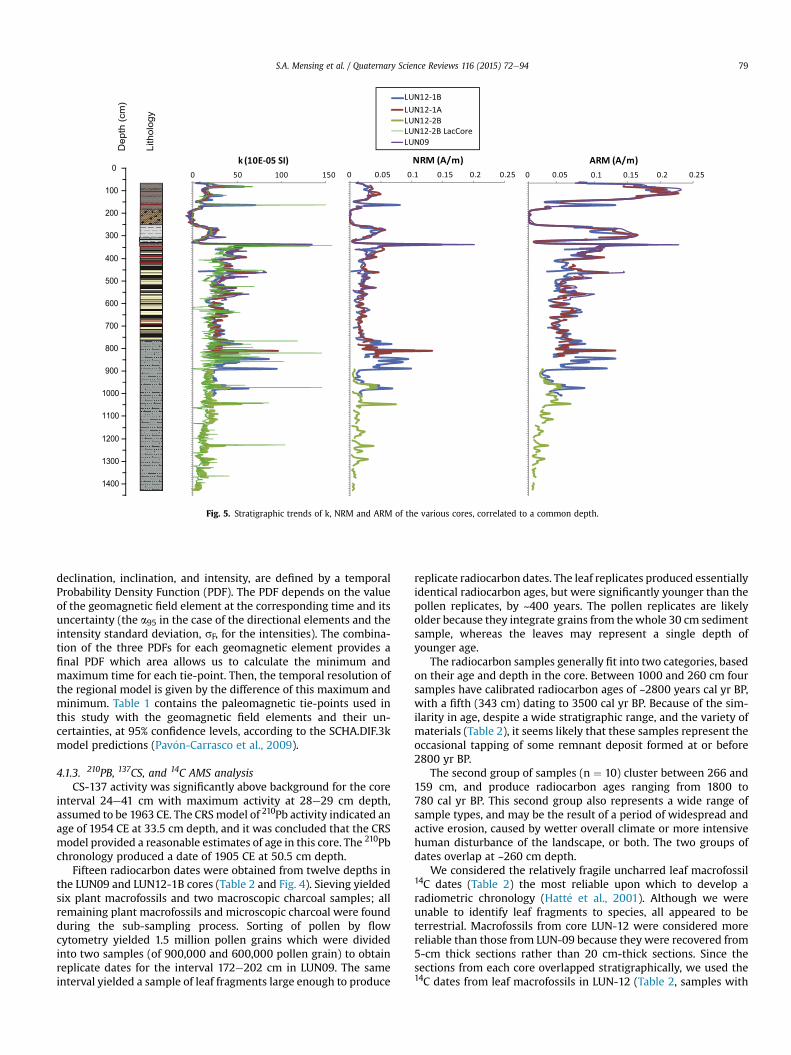
Fig. 5. Stratigraphic trends of k, NRM and ARM of the various cores, correlated to a common depth.
S.A. Mensing et al. / Quaternary Science Reviews 116 (2015) 72e94 79
declination, inclination, and intensity, are defined by a temporalProbability Density Function (PDF). The PDF depends on the valueof the geomagnetic field element at the corresponding time and itsuncertainty (the a95 in the case of the directional elements and theintensity standard deviation, sF, for the intensities). The combina-tion of the three PDFs for each geomagnetic element provides afinal PDF which area allows us to calculate the minimum andmaximum time for each tie-point. Then, the temporal resolution ofthe regional model is given by the difference of this maximum andminimum. Table 1 contains the paleomagnetic tie-points used inthis study with the geomagnetic field elements and their un-certainties, at 95% confidence levels, according to the SCHA.DIF.3kmodel predictions (Pav�on-Carrasco et al., 2009).
4.1.3. 210PB, 137CS, and 14C AMS analysisCS-137 activity was significantly above background for the core
interval 24e41 cm with maximum activity at 28e29 cm depth,assumed to be 1963 CE. The CRSmodel of 210Pb activity indicated anage of 1954 CE at 33.5 cm depth, and it was concluded that the CRSmodel provided a reasonable estimates of age in this core. The 210Pbchronology produced a date of 1905 CE at 50.5 cm depth.
Fifteen radiocarbon dates were obtained from twelve depths inthe LUN09 and LUN12-1B cores (Table 2 and Fig. 4). Sieving yieldedsix plant macrofossils and two macroscopic charcoal samples; allremaining plant macrofossils and microscopic charcoal were foundduring the sub-sampling process. Sorting of pollen by flowcytometry yielded 1.5 million pollen grains which were dividedinto two samples (of 900,000 and 600,000 pollen grain) to obtainreplicate dates for the interval 172e202 cm in LUN09. The sameinterval yielded a sample of leaf fragments large enough to produce
replicate radiocarbon dates. The leaf replicates produced essentiallyidentical radiocarbon ages, but were significantly younger than thepollen replicates, by ~400 years. The pollen replicates are likelyolder because they integrate grains from thewhole 30 cm sedimentsample, whereas the leaves may represent a single depth ofyounger age.
The radiocarbon samples generally fit into two categories, basedon their age and depth in the core. Between 1000 and 260 cm foursamples have calibrated radiocarbon ages of ~2800 years cal yr BP,with a fifth (343 cm) dating to 3500 cal yr BP. Because of the sim-ilarity in age, despite a wide stratigraphic range, and the variety ofmaterials (Table 2), it seems likely that these samples represent theoccasional tapping of some remnant deposit formed at or before2800 yr BP.
The second group of samples (n ¼ 10) cluster between 266 and159 cm, and produce radiocarbon ages ranging from 1800 to780 cal yr BP. This second group also represents a wide range ofsample types, and may be the result of a period of widespread andactive erosion, caused by wetter overall climate or more intensivehuman disturbance of the landscape, or both. The two groups ofdates overlap at ~260 cm depth.
We considered the relatively fragile uncharred leaf macrofossil14C dates (Table 2) the most reliable upon which to develop aradiometric chronology (Hatt�e et al., 2001). Although we wereunable to identify leaf fragments to species, all appeared to beterrestrial. Macrofossils from core LUN-12 were considered morereliable than those from LUN-09 because they were recovered from5-cm thick sections rather than 20 cm-thick sections. Since thesections from each core overlapped stratigraphically, we used the14C dates from leaf macrofossils in LUN-12 (Table 2, samples with
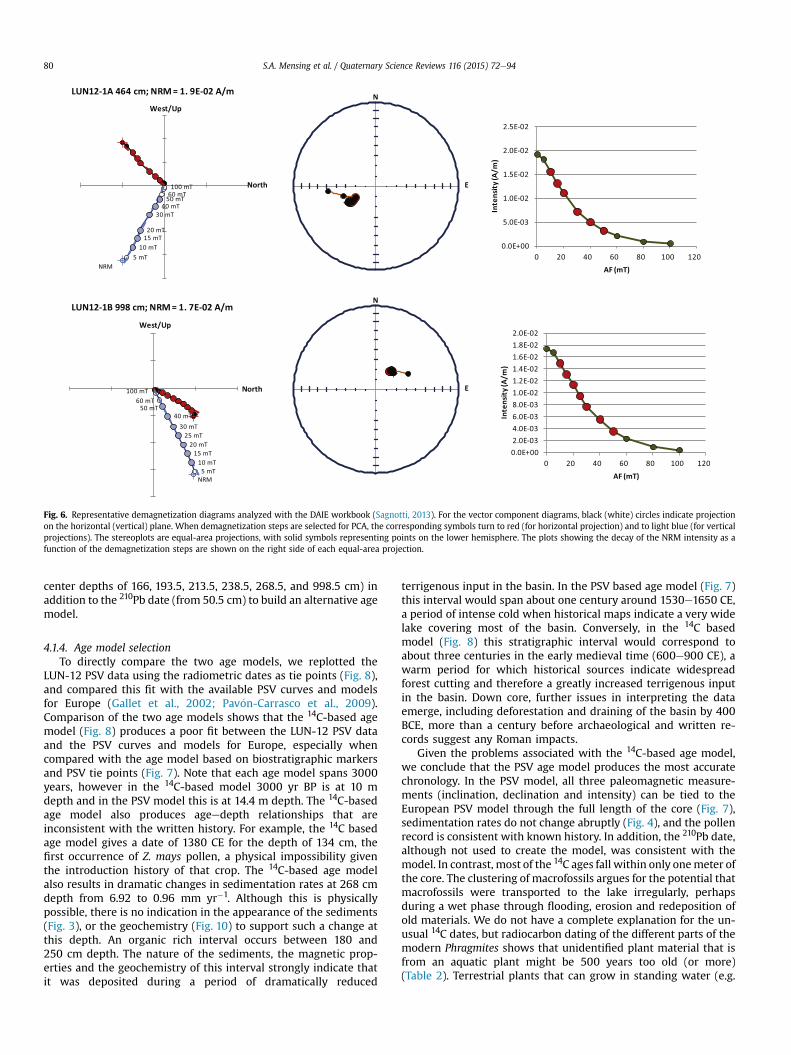
Fig. 6. Representative demagnetization diagrams analyzed with the DAIE workbook (Sagnotti, 2013). For the vector component diagrams, black (white) circles indicate projectionon the horizontal (vertical) plane. When demagnetization steps are selected for PCA, the corresponding symbols turn to red (for horizontal projection) and to light blue (for verticalprojections). The stereoplots are equal-area projections, with solid symbols representing points on the lower hemisphere. The plots showing the decay of the NRM intensity as afunction of the demagnetization steps are shown on the right side of each equal-area projection.
S.A. Mensing et al. / Quaternary Science Reviews 116 (2015) 72e9480
center depths of 166, 193.5, 213.5, 238.5, 268.5, and 998.5 cm) inaddition to the 210Pb date (from 50.5 cm) to build an alternative agemodel.
4.1.4. Age model selectionTo directly compare the two age models, we replotted the
LUN-12 PSV data using the radiometric dates as tie points (Fig. 8),and compared this fit with the available PSV curves and modelsfor Europe (Gallet et al., 2002; Pav�on-Carrasco et al., 2009).Comparison of the two age models shows that the 14C-based agemodel (Fig. 8) produces a poor fit between the LUN-12 PSV dataand the PSV curves and models for Europe, especially whencompared with the age model based on biostratigraphic markersand PSV tie points (Fig. 7). Note that each age model spans 3000years, however in the 14C-based model 3000 yr BP is at 10 mdepth and in the PSV model this is at 14.4 m depth. The 14C-basedage model also produces ageedepth relationships that areinconsistent with the written history. For example, the 14C basedage model gives a date of 1380 CE for the depth of 134 cm, thefirst occurrence of Z. mays pollen, a physical impossibility giventhe introduction history of that crop. The 14C-based age modelalso results in dramatic changes in sedimentation rates at 268 cmdepth from 6.92 to 0.96 mm yr�1. Although this is physicallypossible, there is no indication in the appearance of the sediments(Fig. 3), or the geochemistry (Fig. 10) to support such a change atthis depth. An organic rich interval occurs between 180 and250 cm depth. The nature of the sediments, the magnetic prop-erties and the geochemistry of this interval strongly indicate thatit was deposited during a period of dramatically reduced
terrigenous input in the basin. In the PSV based age model (Fig. 7)this interval would span about one century around 1530e1650 CE,a period of intense cold when historical maps indicate a very widelake covering most of the basin. Conversely, in the 14C basedmodel (Fig. 8) this stratigraphic interval would correspond toabout three centuries in the early medieval time (600e900 CE), awarm period for which historical sources indicate widespreadforest cutting and therefore a greatly increased terrigenous inputin the basin. Down core, further issues in interpreting the dataemerge, including deforestation and draining of the basin by 400BCE, more than a century before archaeological and written re-cords suggest any Roman impacts.
Given the problems associated with the 14C-based age model,we conclude that the PSV age model produces the most accuratechronology. In the PSV model, all three paleomagnetic measure-ments (inclination, declination and intensity) can be tied to theEuropean PSV model through the full length of the core (Fig. 7),sedimentation rates do not change abruptly (Fig. 4), and the pollenrecord is consistent with known history. In addition, the 210Pb date,although not used to create the model, was consistent with themodel. In contrast, most of the 14C ages fall within only onemeter ofthe core. The clustering of macrofossils argues for the potential thatmacrofossils were transported to the lake irregularly, perhapsduring a wet phase through flooding, erosion and redeposition ofold materials. We do not have a complete explanation for the un-usual 14C dates, but radiocarbon dating of the different parts of themodern Phragmites shows that unidentified plant material that isfrom an aquatic plant might be 500 years too old (or more)(Table 2). Terrestrial plants that can grow in standing water (e.g.
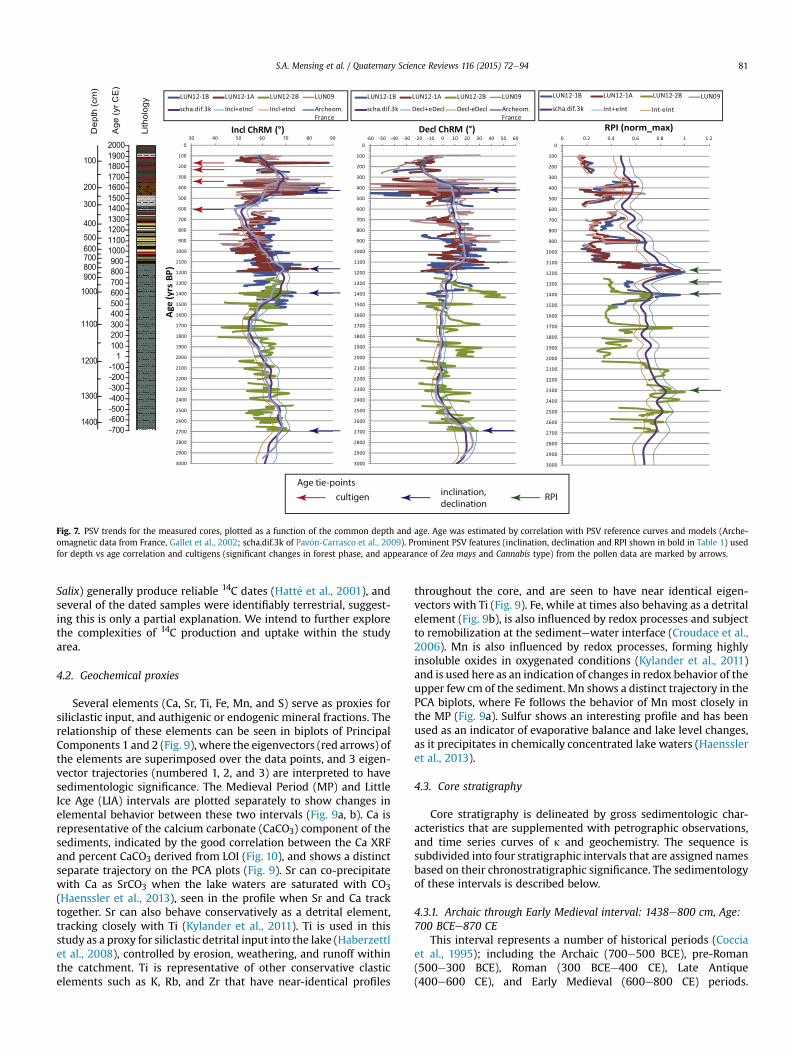
Fig. 7. PSV trends for the measured cores, plotted as a function of the common depth and age. Age was estimated by correlation with PSV reference curves and models (Arche-omagnetic data from France, Gallet et al., 2002; scha.dif.3k of Pav�on-Carrasco et al., 2009). Prominent PSV features (inclination, declination and RPI shown in bold in Table 1) usedfor depth vs age correlation and cultigens (significant changes in forest phase, and appearance of Zea mays and Cannabis type) from the pollen data are marked by arrows.
S.A. Mensing et al. / Quaternary Science Reviews 116 (2015) 72e94 81
Salix) generally produce reliable 14C dates (Hatt�e et al., 2001), andseveral of the dated samples were identifiably terrestrial, suggest-ing this is only a partial explanation. We intend to further explorethe complexities of 14C production and uptake within the studyarea.
4.2. Geochemical proxies
Several elements (Ca, Sr, Ti, Fe, Mn, and S) serve as proxies forsiliclastic input, and authigenic or endogenic mineral fractions. Therelationship of these elements can be seen in biplots of PrincipalComponents 1 and 2 (Fig. 9), where the eigenvectors (red arrows) ofthe elements are superimposed over the data points, and 3 eigen-vector trajectories (numbered 1, 2, and 3) are interpreted to havesedimentologic significance. The Medieval Period (MP) and LittleIce Age (LIA) intervals are plotted separately to show changes inelemental behavior between these two intervals (Fig. 9a, b). Ca isrepresentative of the calcium carbonate (CaCO3) component of thesediments, indicated by the good correlation between the Ca XRFand percent CaCO3 derived from LOI (Fig. 10), and shows a distinctseparate trajectory on the PCA plots (Fig. 9). Sr can co-precipitatewith Ca as SrCO3 when the lake waters are saturated with CO3
(Haenssler et al., 2013), seen in the profile when Sr and Ca tracktogether. Sr can also behave conservatively as a detrital element,tracking closely with Ti (Kylander et al., 2011). Ti is used in thisstudy as a proxy for siliclastic detrital input into the lake (Haberzettlet al., 2008), controlled by erosion, weathering, and runoff withinthe catchment. Ti is representative of other conservative clasticelements such as K, Rb, and Zr that have near-identical profiles
throughout the core, and are seen to have near identical eigen-vectors with Ti (Fig. 9). Fe, while at times also behaving as a detritalelement (Fig. 9b), is also influenced by redox processes and subjectto remobilization at the sedimentewater interface (Croudace et al.,2006). Mn is also influenced by redox processes, forming highlyinsoluble oxides in oxygenated conditions (Kylander et al., 2011)and is used here as an indication of changes in redox behavior of theupper few cm of the sediment. Mn shows a distinct trajectory in thePCA biplots, where Fe follows the behavior of Mn most closely inthe MP (Fig. 9a). Sulfur shows an interesting profile and has beenused as an indicator of evaporative balance and lake level changes,as it precipitates in chemically concentrated lake waters (Haenssleret al., 2013).
4.3. Core stratigraphy
Core stratigraphy is delineated by gross sedimentologic char-acteristics that are supplemented with petrographic observations,and time series curves of k and geochemistry. The sequence issubdivided into four stratigraphic intervals that are assigned namesbased on their chronostratigraphic significance. The sedimentologyof these intervals is described below.
4.3.1. Archaic through Early Medieval interval: 1438e800 cm, Age:700 BCEe870 CE
This interval represents a number of historical periods (Cocciaet al., 1995); including the Archaic (700e500 BCE), pre-Roman(500e300 BCE), Roman (300 BCEe400 CE), Late Antique(400e600 CE), and Early Medieval (600e800 CE) periods.
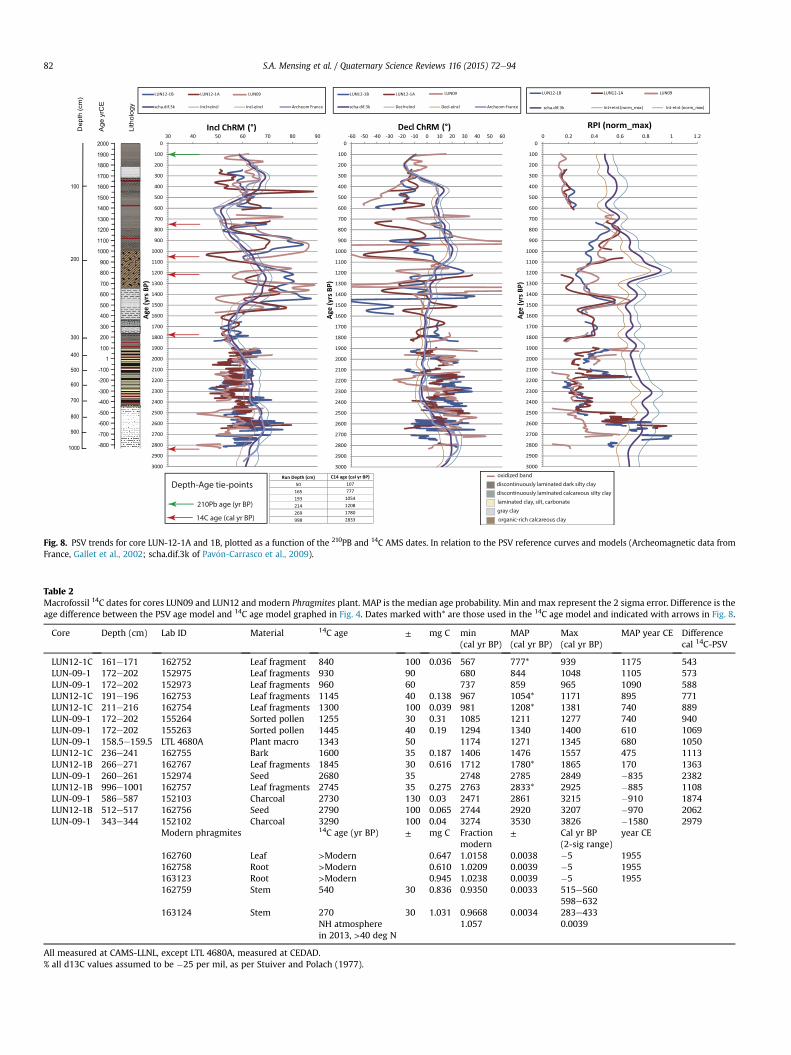
Fig. 8. PSV trends for core LUN-12-1A and 1B, plotted as a function of the 210PB and 14C AMS dates. In relation to the PSV reference curves and models (Archeomagnetic data fromFrance, Gallet et al., 2002; scha.dif.3k of Pav�on-Carrasco et al., 2009).
Table 2Macrofossil 14C dates for cores LUN09 and LUN12 and modern Phragmites plant. MAP is the median age probability. Min and max represent the 2 sigma error. Difference is theage difference between the PSV age model and 14C age model graphed in Fig. 4. Dates marked with* are those used in the 14C age model and indicated with arrows in Fig. 8.
Core Depth (cm) Lab ID Material 14C age ± mg C min(cal yr BP)
MAP(cal yr BP)
Max(cal yr BP)
MAP year CE Differencecal 14C-PSV
LUN12-1C 161e171 162752 Leaf fragment 840 100 0.036 567 777* 939 1175 543LUN-09-1 172e202 152975 Leaf fragments 930 90 680 844 1048 1105 573LUN-09-1 172e202 152973 Leaf fragments 960 60 737 859 965 1090 588LUN12-1C 191e196 162753 Leaf fragments 1145 40 0.138 967 1054* 1171 895 771LUN12-1C 211e216 162754 Leaf fragments 1300 100 0.039 981 1208* 1381 740 889LUN-09-1 172e202 155264 Sorted pollen 1255 30 0.31 1085 1211 1277 740 940LUN-09-1 172e202 155263 Sorted pollen 1445 40 0.19 1294 1340 1400 610 1069LUN-09-1 158.5e159.5 LTL 4680A Plant macro 1343 50 1174 1271 1345 680 1050LUN12-1C 236e241 162755 Bark 1600 35 0.187 1406 1476 1557 475 1113LUN12-1B 266e271 162767 Leaf fragments 1845 30 0.616 1712 1780* 1865 170 1363LUN-09-1 260e261 152974 Seed 2680 35 2748 2785 2849 �835 2382LUN12-1B 996e1001 162757 Leaf fragments 2745 35 0.275 2763 2833* 2925 �885 1108LUN-09-1 586e587 152103 Charcoal 2730 130 0.03 2471 2861 3215 �910 1874LUN12-1B 512e517 162756 Seed 2790 100 0.065 2744 2920 3207 �970 2062LUN-09-1 343e344 152102 Charcoal 3290 100 0.04 3274 3530 3826 �1580 2979
Modern phragmites 14C age (yr BP) ± mg C Fractionmodern
± Cal yr BP(2-sig range)
year CE
162760 Leaf >Modern 0.647 1.0158 0.0038 �5 1955162758 Root >Modern 0.610 1.0209 0.0039 �5 1955163123 Root >Modern 0.945 1.0238 0.0039 �5 1955162759 Stem 540 30 0.836 0.9350 0.0033 515e560
598e632163124 Stem 270 30 1.031 0.9668 0.0034 283e433
NH atmospherein 2013, >40 deg N
1.057 0.0039
All measured at CAMS-LLNL, except LTL 4680A, measured at CEDAD.% all d13C values assumed to be �25 per mil, as per Stuiver and Polach (1977).
S.A. Mensing et al. / Quaternary Science Reviews 116 (2015) 72e9482
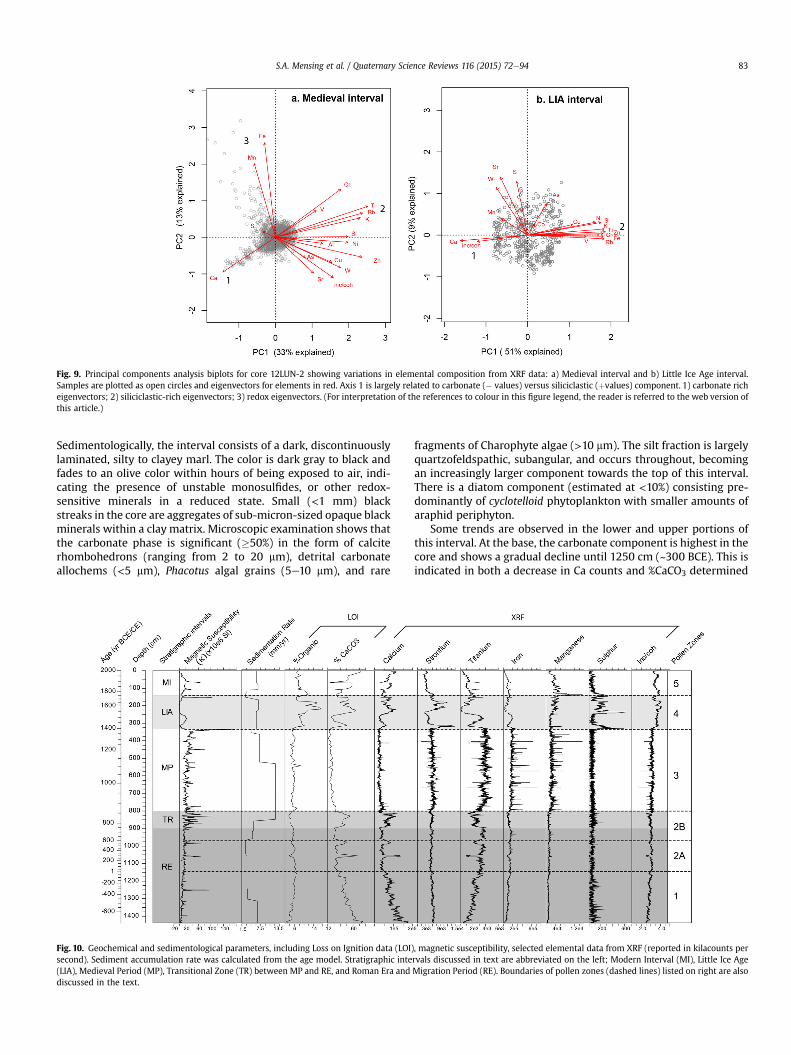
Fig. 9. Principal components analysis biplots for core 12LUN-2 showing variations in elemental composition from XRF data: a) Medieval interval and b) Little Ice Age interval.Samples are plotted as open circles and eigenvectors for elements in red. Axis 1 is largely related to carbonate (� values) versus siliciclastic (þvalues) component. 1) carbonate richeigenvectors; 2) siliciclastic-rich eigenvectors; 3) redox eigenvectors. (For interpretation of the references to colour in this figure legend, the reader is referred to the web version ofthis article.)
S.A. Mensing et al. / Quaternary Science Reviews 116 (2015) 72e94 83
Sedimentologically, the interval consists of a dark, discontinuouslylaminated, silty to clayey marl. The color is dark gray to black andfades to an olive color within hours of being exposed to air, indi-cating the presence of unstable monosulfides, or other redox-sensitive minerals in a reduced state. Small (<1 mm) blackstreaks in the core are aggregates of sub-micron-sized opaque blackminerals within a clay matrix. Microscopic examination shows thatthe carbonate phase is significant (�50%) in the form of calciterhombohedrons (ranging from 2 to 20 mm), detrital carbonateallochems (<5 mm), Phacotus algal grains (5e10 mm), and rare
Fig. 10. Geochemical and sedimentological parameters, including Loss on Ignition data (LOI)second). Sediment accumulation rate was calculated from the age model. Stratigraphic inte(LIA), Medieval Period (MP), Transitional Zone (TR) between MP and RE, and Roman Era anddiscussed in the text.
fragments of Charophyte algae (>10 mm). The silt fraction is largelyquartzofeldspathic, subangular, and occurs throughout, becomingan increasingly larger component towards the top of this interval.There is a diatom component (estimated at <10%) consisting pre-dominantly of cyclotelloid phytoplankton with smaller amounts ofaraphid periphyton.
Some trends are observed in the lower and upper portions ofthis interval. At the base, the carbonate component is highest in thecore and shows a gradual decline until 1250 cm (~300 BCE). This isindicated in both a decrease in Ca counts and %CaCO3 determined
, magnetic susceptibility, selected elemental data from XRF (reported in kilacounts perrvals discussed in text are abbreviated on the left; Modern Interval (MI), Little Ice AgeMigration Period (RE). Boundaries of pollen zones (dashed lines) listed on right are also
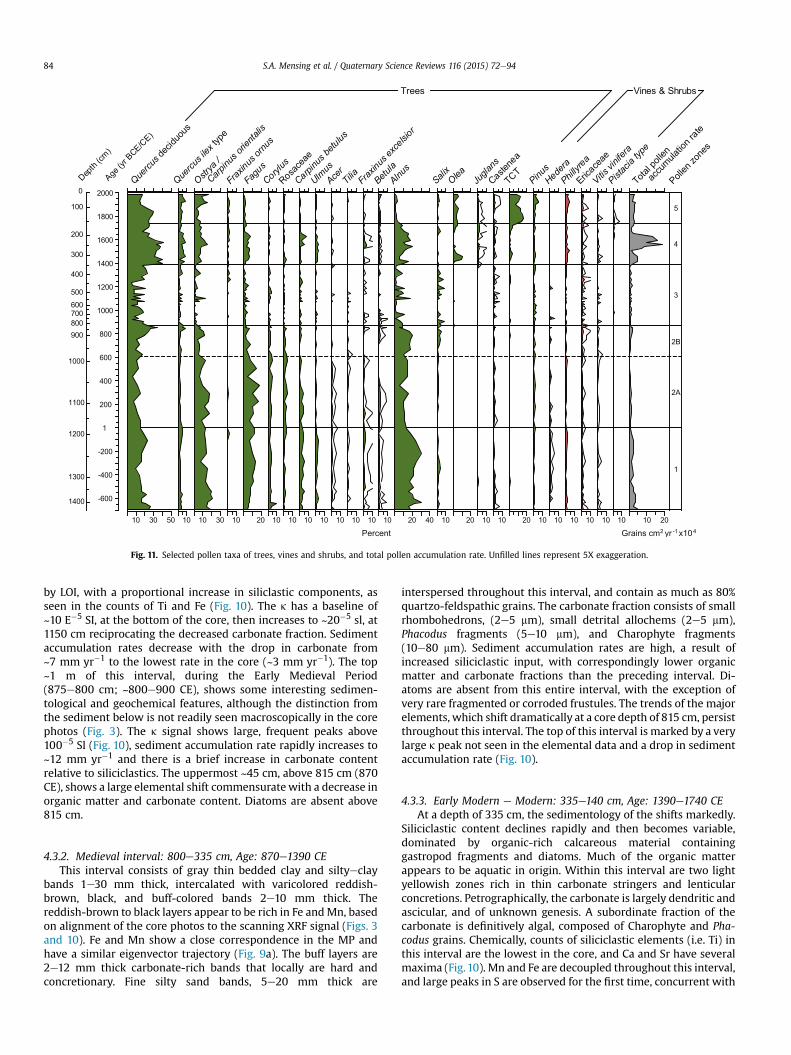
Fig. 11. Selected pollen taxa of trees, vines and shrubs, and total pollen accumulation rate. Unfilled lines represent 5X exaggeration.
S.A. Mensing et al. / Quaternary Science Reviews 116 (2015) 72e9484
by LOI, with a proportional increase in siliclastic components, asseen in the counts of Ti and Fe (Fig. 10). The k has a baseline of~10 E�5 SI, at the bottom of the core, then increases to ~20�5 sl, at1150 cm reciprocating the decreased carbonate fraction. Sedimentaccumulation rates decrease with the drop in carbonate from~7 mm yr�1 to the lowest rate in the core (~3 mm yr�1). The top~1 m of this interval, during the Early Medieval Period(875e800 cm; ~800e900 CE), shows some interesting sedimen-tological and geochemical features, although the distinction fromthe sediment below is not readily seen macroscopically in the corephotos (Fig. 3). The k signal shows large, frequent peaks above100�5 Sl (Fig. 10), sediment accumulation rate rapidly increases to~12 mm yr�1 and there is a brief increase in carbonate contentrelative to siliciclastics. The uppermost ~45 cm, above 815 cm (870CE), shows a large elemental shift commensuratewith a decrease inorganic matter and carbonate content. Diatoms are absent above815 cm.
4.3.2. Medieval interval: 800e335 cm, Age: 870e1390 CEThis interval consists of gray thin bedded clay and siltyeclay
bands 1e30 mm thick, intercalated with varicolored reddish-brown, black, and buff-colored bands 2e10 mm thick. Thereddish-brown to black layers appear to be rich in Fe andMn, basedon alignment of the core photos to the scanning XRF signal (Figs. 3and 10). Fe and Mn show a close correspondence in the MP andhave a similar eigenvector trajectory (Fig. 9a). The buff layers are2e12 mm thick carbonate-rich bands that locally are hard andconcretionary. Fine silty sand bands, 5e20 mm thick are
interspersed throughout this interval, and contain as much as 80%quartzo-feldspathic grains. The carbonate fraction consists of smallrhombohedrons, (2e5 mm), small detrital allochems (2e5 mm),Phacodus fragments (5e10 mm), and Charophyte fragments(10e80 mm). Sediment accumulation rates are high, a result ofincreased siliciclastic input, with correspondingly lower organicmatter and carbonate fractions than the preceding interval. Di-atoms are absent from this entire interval, with the exception ofvery rare fragmented or corroded frustules. The trends of the majorelements, which shift dramatically at a core depth of 815 cm, persistthroughout this interval. The top of this interval is marked by a verylarge k peak not seen in the elemental data and a drop in sedimentaccumulation rate (Fig. 10).
4.3.3. Early Modern e Modern: 335e140 cm, Age: 1390e1740 CEAt a depth of 335 cm, the sedimentology of the shifts markedly.
Siliciclastic content declines rapidly and then becomes variable,dominated by organic-rich calcareous material containinggastropod fragments and diatoms. Much of the organic matterappears to be aquatic in origin. Within this interval are two lightyellowish zones rich in thin carbonate stringers and lenticularconcretions. Petrographically, the carbonate is largely dendritic andascicular, and of unknown genesis. A subordinate fraction of thecarbonate is definitively algal, composed of Charophyte and Pha-codus grains. Chemically, counts of siliciclastic elements (i.e. Ti) inthis interval are the lowest in the core, and Ca and Sr have severalmaxima (Fig.10). Mn and Fe are decoupled throughout this interval,and large peaks in S are observed for the first time, concurrent with
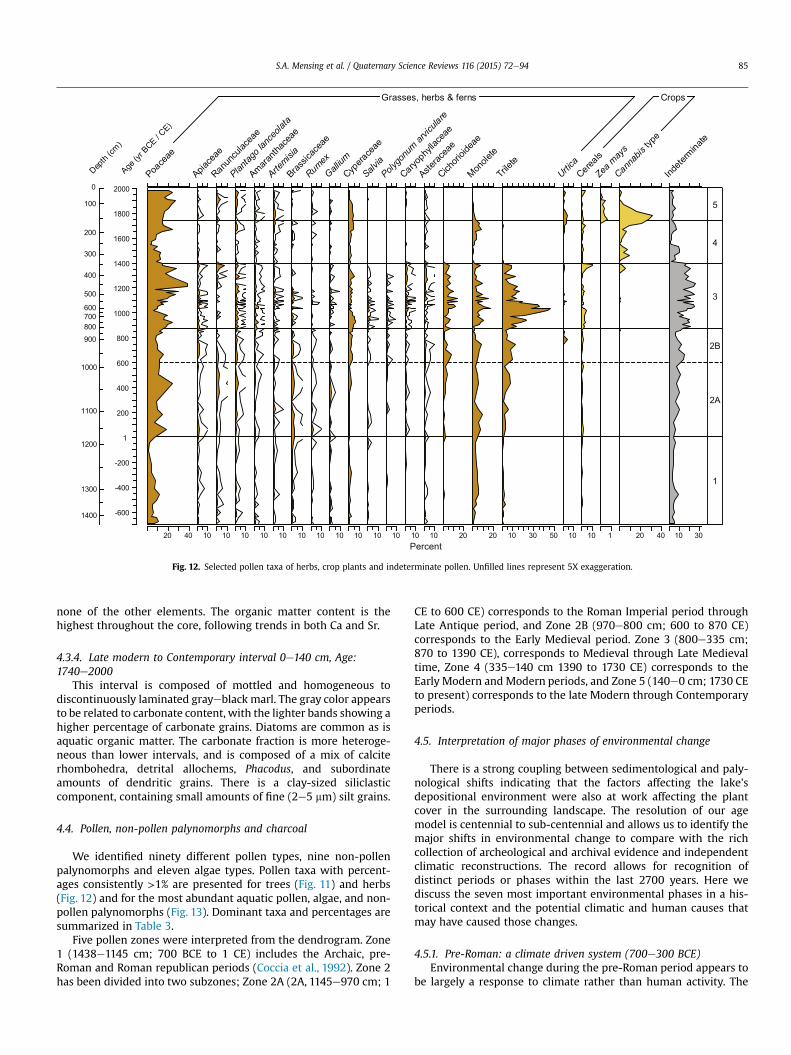
Fig. 12. Selected pollen taxa of herbs, crop plants and indeterminate pollen. Unfilled lines represent 5X exaggeration.
S.A. Mensing et al. / Quaternary Science Reviews 116 (2015) 72e94 85
none of the other elements. The organic matter content is thehighest throughout the core, following trends in both Ca and Sr.
4.3.4. Late modern to Contemporary interval 0e140 cm, Age:1740e2000
This interval is composed of mottled and homogeneous todiscontinuously laminated grayeblack marl. The gray color appearsto be related to carbonate content, with the lighter bands showing ahigher percentage of carbonate grains. Diatoms are common as isaquatic organic matter. The carbonate fraction is more heteroge-neous than lower intervals, and is composed of a mix of calciterhombohedra, detrital allochems, Phacodus, and subordinateamounts of dendritic grains. There is a clay-sized siliclasticcomponent, containing small amounts of fine (2e5 mm) silt grains.
4.4. Pollen, non-pollen palynomorphs and charcoal
We identified ninety different pollen types, nine non-pollenpalynomorphs and eleven algae types. Pollen taxa with percent-ages consistently >1% are presented for trees (Fig. 11) and herbs(Fig. 12) and for the most abundant aquatic pollen, algae, and non-pollen palynomorphs (Fig. 13). Dominant taxa and percentages aresummarized in Table 3.
Five pollen zones were interpreted from the dendrogram. Zone1 (1438e1145 cm; 700 BCE to 1 CE) includes the Archaic, pre-Roman and Roman republican periods (Coccia et al., 1992). Zone 2has been divided into two subzones; Zone 2A (2A, 1145e970 cm; 1
CE to 600 CE) corresponds to the Roman Imperial period throughLate Antique period, and Zone 2B (970e800 cm; 600 to 870 CE)corresponds to the Early Medieval period. Zone 3 (800e335 cm;870 to 1390 CE), corresponds to Medieval through Late Medievaltime, Zone 4 (335e140 cm 1390 to 1730 CE) corresponds to theEarly Modern and Modern periods, and Zone 5 (140e0 cm; 1730 CEto present) corresponds to the late Modern through Contemporaryperiods.
4.5. Interpretation of major phases of environmental change
There is a strong coupling between sedimentological and paly-nological shifts indicating that the factors affecting the lake'sdepositional environment were also at work affecting the plantcover in the surrounding landscape. The resolution of our agemodel is centennial to sub-centennial and allows us to identify themajor shifts in environmental change to compare with the richcollection of archeological and archival evidence and independentclimatic reconstructions. The record allows for recognition ofdistinct periods or phases within the last 2700 years. Here wediscuss the seven most important environmental phases in a his-torical context and the potential climatic and human causes thatmay have caused those changes.
4.5.1. Pre-Roman: a climate driven system (700e300 BCE)Environmental change during the pre-Roman period appears to
be largely a response to climate rather than human activity. The
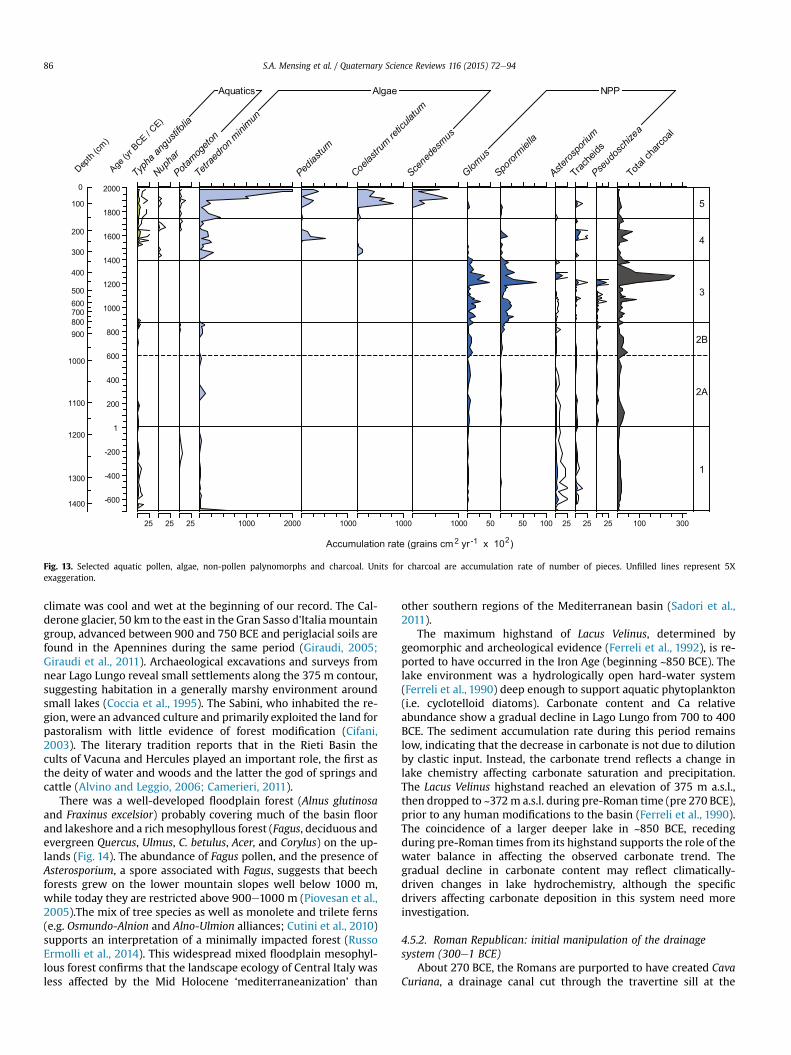
Fig. 13. Selected aquatic pollen, algae, non-pollen palynomorphs and charcoal. Units for charcoal are accumulation rate of number of pieces. Unfilled lines represent 5Xexaggeration.
S.A. Mensing et al. / Quaternary Science Reviews 116 (2015) 72e9486
climate was cool and wet at the beginning of our record. The Cal-derone glacier, 50 km to the east in the Gran Sasso d'Italia mountaingroup, advanced between 900 and 750 BCE and periglacial soils arefound in the Apennines during the same period (Giraudi, 2005;Giraudi et al., 2011). Archaeological excavations and surveys fromnear Lago Lungo reveal small settlements along the 375 m contour,suggesting habitation in a generally marshy environment aroundsmall lakes (Coccia et al., 1995). The Sabini, who inhabited the re-gion, were an advanced culture and primarily exploited the land forpastoralism with little evidence of forest modification (Cifani,2003). The literary tradition reports that in the Rieti Basin thecults of Vacuna and Hercules played an important role, the first asthe deity of water and woods and the latter the god of springs andcattle (Alvino and Leggio, 2006; Camerieri, 2011).
There was a well-developed floodplain forest (Alnus glutinosaand Fraxinus excelsior) probably covering much of the basin floorand lakeshore and a richmesophyllous forest (Fagus, deciduous andevergreen Quercus, Ulmus, C. betulus, Acer, and Corylus) on the up-lands (Fig. 14). The abundance of Fagus pollen, and the presence ofAsterosporium, a spore associated with Fagus, suggests that beechforests grew on the lower mountain slopes well below 1000 m,while today they are restricted above 900e1000 m (Piovesan et al.,2005).The mix of tree species as well as monolete and trilete ferns(e.g. Osmundo-Alnion and Alno-Ulmion alliances; Cutini et al., 2010)supports an interpretation of a minimally impacted forest (RussoErmolli et al., 2014). This widespread mixed floodplain mesophyl-lous forest confirms that the landscape ecology of Central Italy wasless affected by the Mid Holocene ‘mediterraneanization’ than
other southern regions of the Mediterranean basin (Sadori et al.,2011).
The maximum highstand of Lacus Velinus, determined bygeomorphic and archeological evidence (Ferreli et al., 1992), is re-ported to have occurred in the Iron Age (beginning ~850 BCE). Thelake environment was a hydrologically open hard-water system(Ferreli et al., 1990) deep enough to support aquatic phytoplankton(i.e. cyclotelloid diatoms). Carbonate content and Ca relativeabundance show a gradual decline in Lago Lungo from 700 to 400BCE. The sediment accumulation rate during this period remainslow, indicating that the decrease in carbonate is not due to dilutionby clastic input. Instead, the carbonate trend reflects a change inlake chemistry affecting carbonate saturation and precipitation.The Lacus Velinus highstand reached an elevation of 375 m a.s.l.,then dropped to ~372m a.s.l. during pre-Roman time (pre 270 BCE),prior to any human modifications to the basin (Ferreli et al., 1990).The coincidence of a larger deeper lake in ~850 BCE, recedingduring pre-Roman times from its highstand supports the role of thewater balance in affecting the observed carbonate trend. Thegradual decline in carbonate content may reflect climatically-driven changes in lake hydrochemistry, although the specificdrivers affecting carbonate deposition in this system need moreinvestigation.
4.5.2. Roman Republican: initial manipulation of the drainagesystem (300e1 BCE)
About 270 BCE, the Romans are purported to have created CavaCuriana, a drainage canal cut through the travertine sill at the
Table 3Description of key pollen taxa, non-pollen palynomorphs, algae, and charcoal results, summarized by pollen zonation. Percentages and accumulation rates are averages for thezone unless indicated otherwise.
Zone Key taxa Description of pollen, non-pollen palynomorphs, algae, and charcoal
Zone 5140e0 cm1740e2000 CELate Modern &
Contemporary
PoaceaeQuercus (decid.)TC (Juniperus)OstryaOlea
Modern landscape established. Poaceae (22% is the most common single pollen type and herbs (10.3%) haveincreased. Tree pollen (60.2%) is dominated by deciduous Quercus (19.7%), Juniperus (13.3%) and Ostrya (9.2%)with minor amounts of Fagus, Fraxiunus ornus and Corylus (each <1.5%). Alnus (1.5%) is nearly absent. Olea(3.8%) is important and shrubs (Phillyrea 2.9%) are now more abundant. Total pollen accumulation rate is54,800 grains cm�2 yr�1.
Zone 4335e140 cm1390e1740 CEModern
Quercus (decid.)PoaceaeAlnusOstryaFagusJuglansOleaTC (Juniperus)
Abrupt return to a forest phase. Percentage of tree pollen (73.0%) nearly as high as pre-Roman, althoughQuercus (30.2%) now much more common than other taxa; Alnus 10.8%), Ostrya (9.4%), Fagus 3.9%, Ulmus,Fraxinus ornus, Corylus and Carpinus betulus (each <1.6%). Tree crops emerge; Olea (1.4%) and Juglans (1.8%).Poaceae (11.9% and herbs (7.2%) decrease, ferns (2.1%) nearly disappear. TC (Juniperus) increases to 10.0%at 134 cm and Cannabis type peaks at 31.4%. Highest pollen accumulation rate (137,500 grains cm�2 yr�1).
Zone 3800e335 cm870e1390 CEMedieval
Trilete/MonoletePoaceaeQuercus (decid.)CichorioideaeCerealsSporormiellaGlomus
Abrupt transition to a deforested phase. Pollen of Poaceae (19.1%), herbs (21.0%) and fern (24.2%) moreabundant than trees (31.7%). Trilete ferns average 17.7% and reach 55.7%. Cereals increase (1.6%) andassociated weeds of cultivated land increase; Cichorioideae (6.2%), Plantago, Amaranthaceae, Asteraceae,Caryophyllaceae and Apiaceae (all >1%). Sporormiella (1130 grains cm�2 yr�1) and Glomus(780 grains cm�2 yr�1) increase. Charcoal (1380 grains cm�2 yr�1) remains high. Quercus (13.6%)and Alnus (4.1%) decrease dramatically. Total pollen accumulation rate at lowest level(9800 grains cm�2 yr�1).
Zone 2B970e800 cm870e600 CEEarly Medieval
Quercus (decid.)AlnusOstryaFagusPoaceaeTrilete/MonoleteGlomus
Total forest pollen remains stable (60.5%) but diversity decreases. Poaceae (11.6%), herbs (15.6%) and totalferns (10.4%) also change little, but trilete ferns increase. Deciduous Quercus (20.9%), Alnus (13.4%) andSalix (2.0%) increase but all other tree taxa decline; Ostrya (7.3%), Fagus 4.5%), Corylus (2.6%), Carpinusbetulus (<1%). Glomus (500 grains cm�2 yr�1) and charcoal (1325 grains cm�2 yr�1) both increase. Totalpollen accumulation rate decreases (14,800 grains cm�2 yr�1).
Zone 2A1145e970 cm1e600 CERoman imperialand Late Antique
OstryaAlnusQuercus (decid.)FagusCorylusCarpinus betulusPoaceaeTrilete/MonoleteGlomus
Forest taxa, particularly Alnus, decrease but remain dominant (63.1%) and grasses (12.9%), herbs (12.7%) %)and ferns (9.1%) increase. Main tree pollen types are Ostrya (12.3%), Alnus (12.0%), deciduousQuercus (11.5%), Fagus (11.3%), Corylus (3.6%) and Carpinus betulus (2.1%). Herbs typical of disturbancebegin to increase, including Cichorioideae (1.8%), Brassicaceae (1.5%), Ranunculaceae (1.4%) andPlantago (1.0%). Cereals (0.6%) increase and are consistently present. Glomus, an indicator of erosion,increases (380 grains cm�2 yr�1) and charcoal reaches a peak (900 grains cm�2 yr�1) in the 1st to2nd centuries.
Zone 11438e1145 cm700 BCEe1 CEArchaic,Pre-Roman &Roman Republic
AlnusQuercus (decid.)OstryaFagusCarpinus betulusAsterosporium
Forest phase dominated by tree pollen (81.3%). Herbs (5.9%), Poaceae (6.2%) and ferns (4.4%) are a smallcomponent of the pollen. Tree pollen is diverse composed of Alnus (21.2%), deciduous Quercus (18%),Ostrya (15.3%) and Fagus (8.6%) with small quantities of Corylus (3.3%), Carpinus betulus (3.2%),Ulmus (1.6%) and Fraxinus excelsior (1.3%). Asterosporium is at a maximum (260 grains cm�2 yr�1).Total pollen accumulation rate is high (55,000 grains cm�2 yr�1)
S.A. Mensing et al. / Quaternary Science Reviews 116 (2015) 72e94 87
location of the Marmore Falls to facilitate drainage and reclamationof the basin (Leggio and Serva, 1991). There is a magnetic suscep-tibility spike at ~300 BCE as well as an inflection point in many ofthe geochemical curves, including carbonate, TI and S, which maybe associated with the channel cutting. The sediment remains darkgray to black with anoxic sulfides similar to the Pre-Roman coreinterval, and no discernible sedimentological change accompaniesthe magnetic susceptibility spike. However, if channel cuttingserved to lower Lago Lungo and temporarily isolate it from thelarger lake system, then the subtle increases in the S signal seenabove the magnetic susceptibility spike may reflect a more isolatedstagnant lake with slightly more sulfidic mineralization. The steadydecline in Alnus pollen beginning ~200 BCE (Fig. 14) supports aninterpretation of a lowered water table; however, large areas of thevalley must have remained wet given the continued persistence ofAlnus. The decline in Alnuswas permanent, indicating that after thischange the basin never again reached the same extent of floodedforest. Pliny the Elder (Naturalis historia 3, 109) described the Rietibasin as covered by dense forest and beyond the change in Alnus,there is no evidence for forest degradation (Fig. 14).
Alnus requires standing water, and a reduction in Alnus suggestsa reduction in wetland area in the valley. This interpretation sup-ports the argument that the Romans first drained the Rieti Basin inthe first quarter of the 3rd century BCE, as recorded by historians(Sisani, 2009). This reclamation work appears to have been suffi-ciently successful to have lowered thewater table enough to reducethe flooded forests. The Roman water works do not appear to havechanged land use practices. Archeological surveys indicate thatlocal settlements were consolidated (Coccia et al., 1995) but in the1st century BCE Varro emphasized the importance of sheeppasturing (Varr. 2.2.9) and the geographer Strabo described theRieti valley as a place of domestic livestock, mules particularly(Strab. 5.3.1). The increase in disturbance taxa during this periodsupports an interpretation of increased pasturage.
4.5.3. Imperial Roman through Late Antique: intensification of landuse (1e600 CE)
Climatically, the period from 1 to 200 CE is considered part ofthe Roman Optimum, with exceptional climate stability andfavorable conditions that coincide with the rise of Imperial Rome

Fig. 14. Summary diagram with selected data. Arboreal pollen includes all tree taxa presented in Fig. 11 except Alnus. Disturbance taxa include all herbs plus trilete ferns shown inFig. 12. Diatoms were identified from smear slide analysis. Stratigraphic intervals follow Fig. 10.
S.A. Mensing et al. / Quaternary Science Reviews 116 (2015) 72e9488
(McCormick et al., 2012). Reconstructed temperatures during thisperiod were mild (Fig. 14), similar to the first half of the 20thcentury (Christiansen and Ljungqvist, 2012; northern hemisphereextratropical 2000 temperature reconstruction e ftp://ftp.ncdc.noaa.gov/pub/data/paleo/contributions_by_author/christiansen2012/christiansen2012.txt URL and data accessed).What is particularly striking is that while the population of Romeexpanded tomore than onemillion (Lo Cascio andMalanima, 2005)there is no evidence for intensive exploitation of the Rieti Basinthrough land clearance or deforestation. Forests declined duringthe Imperial period in relation to the Republican period (66% vs.81% total AP respectively; Table 3, Fig. 14), though the extent ofdegradation appears limited. The impact on the forest showsalternating phases of more pressure (1stand 4th century) or less 3rdcentury (see also Russo Ermolli et al., 2014) consistent with thedemographic and socio-economic trends of Rome (Leggio, 2000;Costambeys, 2009).
Around 1 CE there is an abrupt increase in disturbance species(e.g. Rumex, Brassicaceae, Cichorioideae, Apiaceae, and triletespores) although a diverse flooded forest assemblage persisted.Pollen of cereals are present, but not abundant (Fig. 12) and Spor-ormiella, an indicator of domesticated livestock, is consistentlypresent. Archeological evidence of settlement is restricted to thealluvial fans and low hill-slopes above the valley floor, concentratedbetween 380 and 480 m with no evidence of large settlementsabove 600 m (Coccia et al., 1995). The main nucleated settlementwas Reate (Cifani, 2003) and the economy was probably orientedtowards pastoralism and trade with the nearby Apennine
communities. We infer that the basin was partially cleared forpasture but remained marshy and that livestock grazing was moreimportant than agriculture, although even pasturage may not havebeen intensive.
A number of other pollen reconstructions from the Italianpeninsula have also found only limited evidence of deforestationduring the Roman Imperial period, including sites near Naples(Russo Ermolli and di Pasquale, 2002), Colli Euganei west of Venice(Kaltenrieder et al., 2010), Calabria (Joannin et al., 2012), Abruzzo(Branch andMarini, 2014) and near Ostia, the ancient port for Rome(Di Rita et al., 2010; Sadori et al., 2011). Our findings contrast witharguments for extensive forest clearing and burning in the vicinityof Rome (e.g. McNeil, 1992; Hughes, 2011) and support the argu-ment that deforestation was localized and degradation limited(Grove and Rackham, 2001).
The Roman Empire supported a complex trade network and onepossible reason for the lack of exploitation of the Rieti Basin mayhave been the ‘globalization’ of production of Imperial Rome. Rietiwas interconnected with Rome and likely benefited from externalresources, potentially reducing pressure on local resources(Champion, 1995). Local sites, such as Rieti, would not have beensufficient to support the large urban population of Rome and mayhave been spared from environmental degradation while distantregions were exploited. Egypt appears to have enjoyed exception-ally favorable conditions between 1 and 200 CE (McCormick et al.,2012) and food production and transport may have been moreefficient from such distant locations as opposed to local sites withlimited agricultural capacity and barriers to transport. Rieti was on
S.A. Mensing et al. / Quaternary Science Reviews 116 (2015) 72e94 89
the Via Salaria, one of the most important trans-Apennine roadsbetween Rome and the Adriatic Sea (Coccia et al., 1992), but theMarmore Falls prevent easy access by water to the Tiber Rivermaking it difficult to ship bulky resources (e.g. wheat, charcoal) toRome. Another possibility is that, in order to prevent deforestationand soil erosion and to mitigate Tiber flooding in the area of LacusVelinus, the forests were provided some level of protection as sa-cred woods, following the Sabini cult of Vacuna, identified as Vit-toria or Diana by the Romans (Coccia et al., 1992; Alvino and Leggio,2006).
Between 400 and 600 CE, during the Late Antique period,sometimes referred to as the Migration Period, we see a furtherdegradation of the forest with a decline in Ostrya and increase ingrassland (Poaceae), indicating more intensive coppicing of forestsand possibly an intensification of local resource extraction. The LateAntique or Migration Period (400e600 CE), a time with cooler thanaverage temperatures and general disruption following the RomanEmpire (Büntgen et al., 2011; Christiansen and Ljungqvist, 2012), issometimes identified as a period of climatic instability which mayhave contributed to cultural upheaval (McCormick et al., 2012). InRieti, there are few indications of upheaval, however trade net-works appear to have been disrupted requiring greater reliance onlocal products. With the fall of Rome, the Ostrogoths ruled Rietibetween 400 and 570 CE and maintained the Roman system ofgovernance (Leggio, 1989). Archaeological data support the pres-ence of a thriving community (Coccia et al., 1995) though limitedceramics from this period indicate a potential breakdown in thetrade system (Coccia et al., 1992). A decline in Ostrya and increase indisturbance taxa suggest possibly more intensive coppicing of for-ests and an intensification of local resource extraction, with lessreliance on traded goods.
4.5.4. Early medieval: intensification of forest disturbance andsedimentation (600e900 CE)
This phase represents a transition period with a complex seriesof changes in the vegetation, sedimentary, magnetic andgeochemical proxies. Between 600 and 735 CE temperatures in thenorthern hemisphere remained cooler than average (Christiansenand Ljungqvist, 2012) though in central Europe, climate becamemilder, with warming temperatures and an increase in precipita-tion (Büntgen et al., 2011). At our site, loss of forest biodiversitybegan ~600 CE, particularly the softer hardwoods (Fagus, Tilia,Ulmus, Acer, and F. excelsior) (Zone 2B, Fig. 11) and there was anincrease in disturbance taxa (Fig. 12) and erosion (Glomus, Fig. 13).High percentages of Alnus indicate that the valley floor remainedmarshy, suggesting that human impacts were concentrated on thehill slopes.
A cool to mild climate should not have resulted in loss of forestbiodiversity and we suggest that this environmental shift resultedfrom a change in the governing authority and associated changes inland use. The Lombards gained control of Rieti around 590 CE(Naspi, 2010). There are few written documents for this period, butRieti has been described as changing from a city of stone to a city ofwood (Leggio, 2000) and between ~600 and 800 CE, the softerdesirable hardwoods appear to have been selectively removedinitiating the decline in forest biodiversity (Fig. 11). In addition, theFarfa Monastery of the Benedictine order, established in the end ofthe 6th century in the Sabini Mountains (Fig. 1), became increas-ingly important in the 8th century. The monks were responsible formanaging large areas of the landscape, including the Rieti Basin(Leggio,1994) and forest cutting was widespread (Leggio and Serva,1991).
From ~735 CE (900 cm depth) until ~870 CE (800 cm depth) theforest recovers somewhat, with an increase in Quercus and Ostrya,although there is no increase in the soft hardwoods. Disturbance
indicators decrease, Ti decreases, carbonate and Ca increase, andMS is high and variable. Written sources describe an increase inflooded area, expansion of Lago Lungo (lacus Totoni) and Lago diRipasottile (lago Maggiore) and the formation of many lamae (littlelakes) (Leggio, 1994, 1998). This would appear to be a climaticimpact, rather than a human induced change, though dominance ofQuercus and Ostrya in the overstory suggests an actively coppicedforest.
4.5.5. Medieval through Late Medieval: peak deforestation andsedimentation (900e1390 CE)
The most extensive degradation of the environment occurredduring the Medieval Period (~870e1390 CE) when forest cover wasgreatly reduced and herbs and ferns increased (Fig. 14). Tempera-tures in the northern hemisphere beganwarming after 900 CEwitha well-defined peak between 950 and 1050 CE (Fig. 14) and amaximum temperature anomaly of 0.6 �C (Christiansen andLjungqvist, 2012). Climate reconstructions from the centraleastern Alps (Büntgen et al., 2011) and central Italy (Guiot andCorona, 2010) show elevated temperature from 700 to 1250 CEwith a thermal maximum of 0.3 �C between 1053 and 1171 CE(Trachsel et al., 2012). A precipitation reconstruction (PalmerDrought Severity Index e PDSI) using Cedrus atlantica (Endl.Carri�ere) from Morocco (Esper et al., 2007; Trouet et al., 2009)shows that the period from 1050 to 1400 CE was anomalously dryacross the western Mediterranean (Fig. 14). The initiation of forestcutting throughout the Rieti Basin coincides with the period ofwarmest temperatures, and climate change appears to have been astrong catalyst leading to environmental degradation; howeversocioeconomic changes are also important during this period.
Sediment accumulation rates reach their highest levels by 900CE. The high percentages of indeterminate pollen (Fig. 12) as well asCichorioideae, a taxon commonly found on disturbed sites withpollen particularly resistant to degradation (Bottema, 1975), sup-port an interpretation of high erosion and increased bare soil.Cichorioideae have been demonstrated to be good indicators ofopen landscapes dominated by pastures and cultivated fields(Florenzano et al., 2015). Some of the indeterminate pollen arelikely degraded tree taxa, could suggest that the level of defores-tation may not have been as high as the pollen diagram indicates;however there is no reason to believe that the percentage ofindeterminate pollen are skewed towards tree types since manyherbaceous taxa are equally subject to degradation. Fern spores(trilete) are very high between 925 and 1075 CE. Ferns requiremineral soil for regeneration, further supporting an interpretationthat large areas with thin soils must have been present and loss oftree cover must have been widespread. The elemental proxy forerosion, the detrital element Ti, remains high throughout the MP,supporting the claim that deforestation and agricultural land usepeaked during this time. Sediments throughout this phase arevaricolored silty and clayey bands (Fig. 3) indicative of episodicsedimentation and potentially greater fluvial influence. The veryhigh sediment accumulation rates begin to decline after 1100 CE.
Written and archeological evidence support the hypothesis for alarge increase in population, leading to saturation of the lowerelevation sites for agriculture, and a push to exploit higher eleva-tions. During the Medieval period, settlements were constructed atelevations above 1000m (Coccia et al., 1992). Terraced walls relatedto farming were found between 700 and 1000 m (Coccia et al.,1995) and active deforestation and a series of ‘hospitals’ for tend-ing to farm workers have been documented at 1400 m (Naspi,2010). It also seems reasonable to conclude that warmer temper-atures allowed farming and grazing to be successful at higher ele-vations. As population grew and settlement expanded upslope,farmers likely pushed the limits of what local resources were
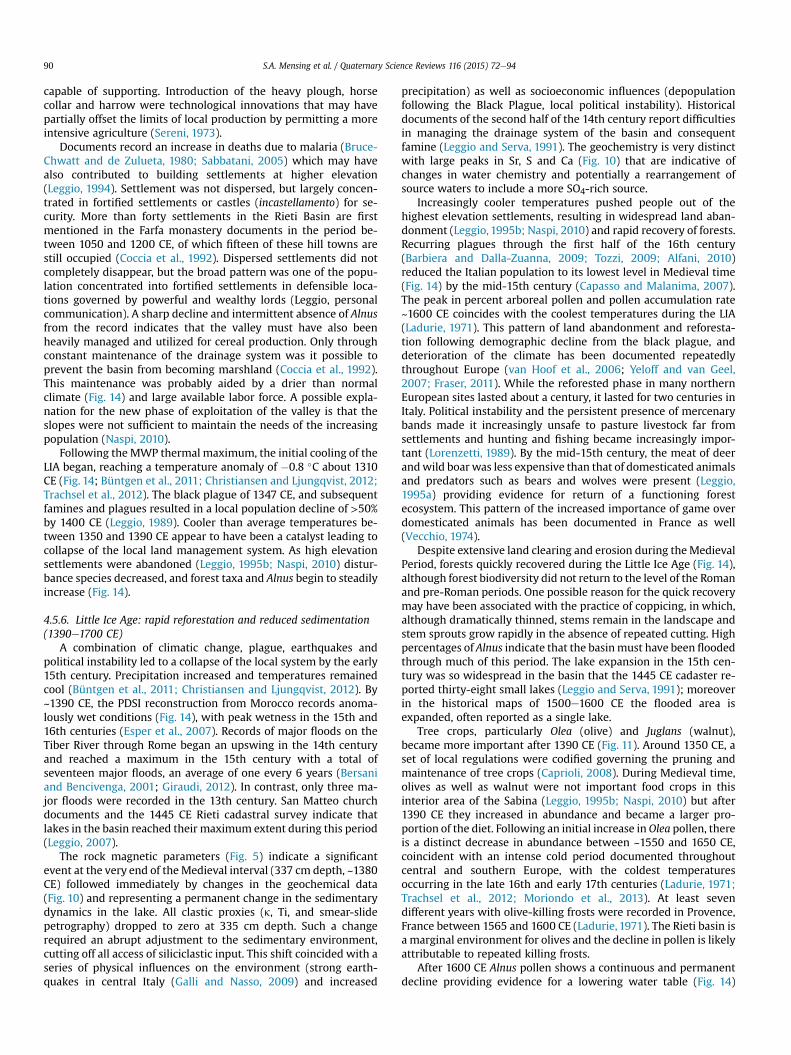
S.A. Mensing et al. / Quaternary Science Reviews 116 (2015) 72e9490
capable of supporting. Introduction of the heavy plough, horsecollar and harrow were technological innovations that may havepartially offset the limits of local production by permitting a moreintensive agriculture (Sereni, 1973).
Documents record an increase in deaths due to malaria (Bruce-Chwatt and de Zulueta, 1980; Sabbatani, 2005) which may havealso contributed to building settlements at higher elevation(Leggio, 1994). Settlement was not dispersed, but largely concen-trated in fortified settlements or castles (incastellamento) for se-curity. More than forty settlements in the Rieti Basin are firstmentioned in the Farfa monastery documents in the period be-tween 1050 and 1200 CE, of which fifteen of these hill towns arestill occupied (Coccia et al., 1992). Dispersed settlements did notcompletely disappear, but the broad pattern was one of the popu-lation concentrated into fortified settlements in defensible loca-tions governed by powerful and wealthy lords (Leggio, personalcommunication). A sharp decline and intermittent absence of Alnusfrom the record indicates that the valley must have also beenheavily managed and utilized for cereal production. Only throughconstant maintenance of the drainage system was it possible toprevent the basin from becoming marshland (Coccia et al., 1992).This maintenance was probably aided by a drier than normalclimate (Fig. 14) and large available labor force. A possible expla-nation for the new phase of exploitation of the valley is that theslopes were not sufficient to maintain the needs of the increasingpopulation (Naspi, 2010).
Following the MWP thermal maximum, the initial cooling of theLIA began, reaching a temperature anomaly of �0.8 �C about 1310CE (Fig. 14; Büntgen et al., 2011; Christiansen and Ljungqvist, 2012;Trachsel et al., 2012). The black plague of 1347 CE, and subsequentfamines and plagues resulted in a local population decline of >50%by 1400 CE (Leggio, 1989). Cooler than average temperatures be-tween 1350 and 1390 CE appear to have been a catalyst leading tocollapse of the local land management system. As high elevationsettlements were abandoned (Leggio, 1995b; Naspi, 2010) distur-bance species decreased, and forest taxa and Alnus begin to steadilyincrease (Fig. 14).
4.5.6. Little Ice Age: rapid reforestation and reduced sedimentation(1390e1700 CE)
A combination of climatic change, plague, earthquakes andpolitical instability led to a collapse of the local system by the early15th century. Precipitation increased and temperatures remainedcool (Büntgen et al., 2011; Christiansen and Ljungqvist, 2012). By~1390 CE, the PDSI reconstruction from Morocco records anoma-lously wet conditions (Fig. 14), with peak wetness in the 15th and16th centuries (Esper et al., 2007). Records of major floods on theTiber River through Rome began an upswing in the 14th centuryand reached a maximum in the 15th century with a total ofseventeen major floods, an average of one every 6 years (Bersaniand Bencivenga, 2001; Giraudi, 2012). In contrast, only three ma-jor floods were recorded in the 13th century. San Matteo churchdocuments and the 1445 CE Rieti cadastral survey indicate thatlakes in the basin reached their maximum extent during this period(Leggio, 2007).
The rock magnetic parameters (Fig. 5) indicate a significantevent at the very end of theMedieval interval (337 cm depth, ~1380CE) followed immediately by changes in the geochemical data(Fig. 10) and representing a permanent change in the sedimentarydynamics in the lake. All clastic proxies (k, Ti, and smear-slidepetrography) dropped to zero at 335 cm depth. Such a changerequired an abrupt adjustment to the sedimentary environment,cutting off all access of siliciclastic input. This shift coincided with aseries of physical influences on the environment (strong earth-quakes in central Italy (Galli and Nasso, 2009) and increased
precipitation) as well as socioeconomic influences (depopulationfollowing the Black Plague, local political instability). Historicaldocuments of the second half of the 14th century report difficultiesin managing the drainage system of the basin and consequentfamine (Leggio and Serva, 1991). The geochemistry is very distinctwith large peaks in Sr, S and Ca (Fig. 10) that are indicative ofchanges in water chemistry and potentially a rearrangement ofsource waters to include a more SO4-rich source.
Increasingly cooler temperatures pushed people out of thehighest elevation settlements, resulting in widespread land aban-donment (Leggio, 1995b; Naspi, 2010) and rapid recovery of forests.Recurring plagues through the first half of the 16th century(Barbiera and Dalla-Zuanna, 2009; Tozzi, 2009; Alfani, 2010)reduced the Italian population to its lowest level in Medieval time(Fig. 14) by the mid-15th century (Capasso and Malanima, 2007).The peak in percent arboreal pollen and pollen accumulation rate~1600 CE coincides with the coolest temperatures during the LIA(Ladurie, 1971). This pattern of land abandonment and reforesta-tion following demographic decline from the black plague, anddeterioration of the climate has been documented repeatedlythroughout Europe (van Hoof et al., 2006; Yeloff and van Geel,2007; Fraser, 2011). While the reforested phase in many northernEuropean sites lasted about a century, it lasted for two centuries inItaly. Political instability and the persistent presence of mercenarybands made it increasingly unsafe to pasture livestock far fromsettlements and hunting and fishing became increasingly impor-tant (Lorenzetti, 1989). By the mid-15th century, the meat of deerandwild boar was less expensive than that of domesticated animalsand predators such as bears and wolves were present (Leggio,1995a) providing evidence for return of a functioning forestecosystem. This pattern of the increased importance of game overdomesticated animals has been documented in France as well(Vecchio, 1974).
Despite extensive land clearing and erosion during theMedievalPeriod, forests quickly recovered during the Little Ice Age (Fig. 14),although forest biodiversity did not return to the level of the Romanand pre-Roman periods. One possible reason for the quick recoverymay have been associated with the practice of coppicing, in which,although dramatically thinned, stems remain in the landscape andstem sprouts grow rapidly in the absence of repeated cutting. Highpercentages of Alnus indicate that the basinmust have been floodedthrough much of this period. The lake expansion in the 15th cen-tury was so widespread in the basin that the 1445 CE cadaster re-ported thirty-eight small lakes (Leggio and Serva, 1991); moreoverin the historical maps of 1500e1600 CE the flooded area isexpanded, often reported as a single lake.
Tree crops, particularly Olea (olive) and Juglans (walnut),became more important after 1390 CE (Fig. 11). Around 1350 CE, aset of local regulations were codified governing the pruning andmaintenance of tree crops (Caprioli, 2008). During Medieval time,olives as well as walnut were not important food crops in thisinterior area of the Sabina (Leggio, 1995b; Naspi, 2010) but after1390 CE they increased in abundance and became a larger pro-portion of the diet. Following an initial increase inOlea pollen, thereis a distinct decrease in abundance between ~1550 and 1650 CE,coincident with an intense cold period documented throughoutcentral and southern Europe, with the coldest temperaturesoccurring in the late 16th and early 17th centuries (Ladurie, 1971;Trachsel et al., 2012; Moriondo et al., 2013). At least sevendifferent years with olive-killing frosts were recorded in Provence,France between 1565 and 1600 CE (Ladurie, 1971). The Rieti basin isa marginal environment for olives and the decline in pollen is likelyattributable to repeated killing frosts.
After 1600 CE Alnus pollen shows a continuous and permanentdecline providing evidence for a lowering water table (Fig. 14)
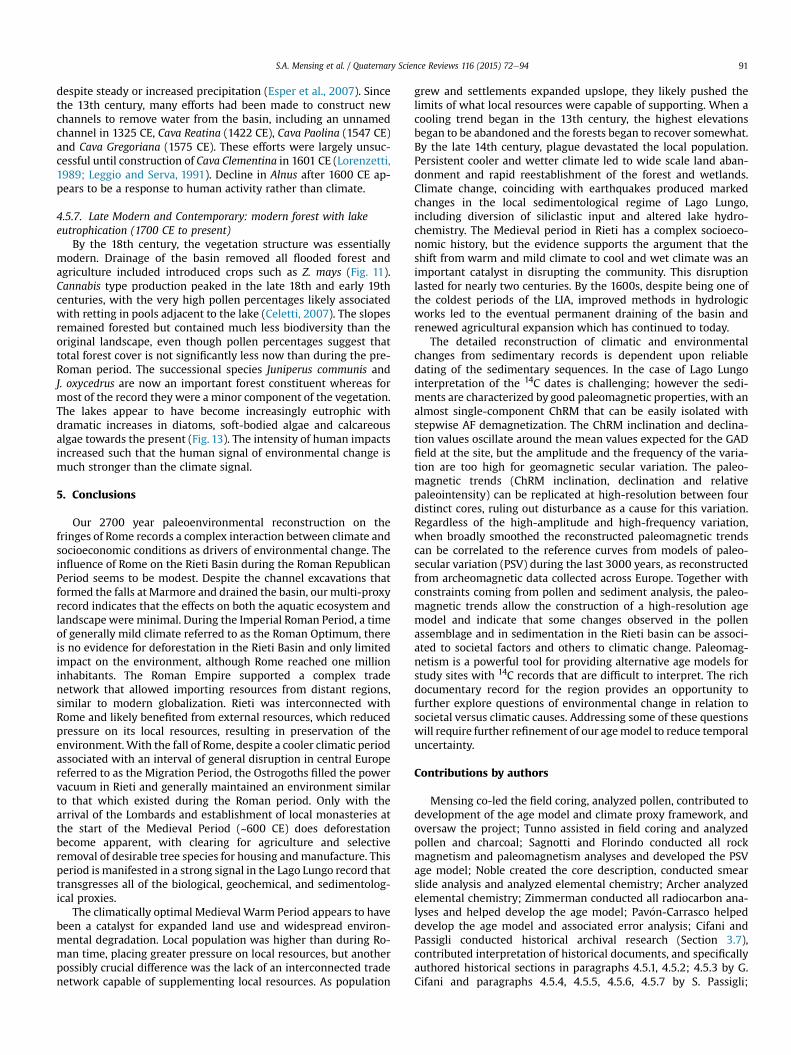
S.A. Mensing et al. / Quaternary Science Reviews 116 (2015) 72e94 91
despite steady or increased precipitation (Esper et al., 2007). Sincethe 13th century, many efforts had been made to construct newchannels to remove water from the basin, including an unnamedchannel in 1325 CE, Cava Reatina (1422 CE), Cava Paolina (1547 CE)and Cava Gregoriana (1575 CE). These efforts were largely unsuc-cessful until construction of Cava Clementina in 1601 CE (Lorenzetti,1989; Leggio and Serva, 1991). Decline in Alnus after 1600 CE ap-pears to be a response to human activity rather than climate.
4.5.7. Late Modern and Contemporary: modern forest with lakeeutrophication (1700 CE to present)
By the 18th century, the vegetation structure was essentiallymodern. Drainage of the basin removed all flooded forest andagriculture included introduced crops such as Z. mays (Fig. 11).Cannabis type production peaked in the late 18th and early 19thcenturies, with the very high pollen percentages likely associatedwith retting in pools adjacent to the lake (Celetti, 2007). The slopesremained forested but contained much less biodiversity than theoriginal landscape, even though pollen percentages suggest thattotal forest cover is not significantly less now than during the pre-Roman period. The successional species Juniperus communis andJ. oxycedrus are now an important forest constituent whereas formost of the record they were a minor component of the vegetation.The lakes appear to have become increasingly eutrophic withdramatic increases in diatoms, soft-bodied algae and calcareousalgae towards the present (Fig. 13). The intensity of human impactsincreased such that the human signal of environmental change ismuch stronger than the climate signal.
5. Conclusions
Our 2700 year paleoenvironmental reconstruction on thefringes of Rome records a complex interaction between climate andsocioeconomic conditions as drivers of environmental change. Theinfluence of Rome on the Rieti Basin during the Roman RepublicanPeriod seems to be modest. Despite the channel excavations thatformed the falls at Marmore and drained the basin, our multi-proxyrecord indicates that the effects on both the aquatic ecosystem andlandscape were minimal. During the Imperial Roman Period, a timeof generally mild climate referred to as the Roman Optimum, thereis no evidence for deforestation in the Rieti Basin and only limitedimpact on the environment, although Rome reached one millioninhabitants. The Roman Empire supported a complex tradenetwork that allowed importing resources from distant regions,similar to modern globalization. Rieti was interconnected withRome and likely benefited from external resources, which reducedpressure on its local resources, resulting in preservation of theenvironment. With the fall of Rome, despite a cooler climatic periodassociated with an interval of general disruption in central Europereferred to as the Migration Period, the Ostrogoths filled the powervacuum in Rieti and generally maintained an environment similarto that which existed during the Roman period. Only with thearrival of the Lombards and establishment of local monasteries atthe start of the Medieval Period (~600 CE) does deforestationbecome apparent, with clearing for agriculture and selectiveremoval of desirable tree species for housing andmanufacture. Thisperiod is manifested in a strong signal in the Lago Lungo record thattransgresses all of the biological, geochemical, and sedimentolog-ical proxies.
The climatically optimal Medieval Warm Period appears to havebeen a catalyst for expanded land use and widespread environ-mental degradation. Local population was higher than during Ro-man time, placing greater pressure on local resources, but anotherpossibly crucial difference was the lack of an interconnected tradenetwork capable of supplementing local resources. As population
grew and settlements expanded upslope, they likely pushed thelimits of what local resources were capable of supporting. When acooling trend began in the 13th century, the highest elevationsbegan to be abandoned and the forests began to recover somewhat.By the late 14th century, plague devastated the local population.Persistent cooler and wetter climate led to wide scale land aban-donment and rapid reestablishment of the forest and wetlands.Climate change, coinciding with earthquakes produced markedchanges in the local sedimentological regime of Lago Lungo,including diversion of siliclastic input and altered lake hydro-chemistry. The Medieval period in Rieti has a complex socioeco-nomic history, but the evidence supports the argument that theshift from warm and mild climate to cool and wet climate was animportant catalyst in disrupting the community. This disruptionlasted for nearly two centuries. By the 1600s, despite being one ofthe coldest periods of the LIA, improved methods in hydrologicworks led to the eventual permanent draining of the basin andrenewed agricultural expansion which has continued to today.
The detailed reconstruction of climatic and environmentalchanges from sedimentary records is dependent upon reliabledating of the sedimentary sequences. In the case of Lago Lungointerpretation of the 14C dates is challenging; however the sedi-ments are characterized by good paleomagnetic properties, with analmost single-component ChRM that can be easily isolated withstepwise AF demagnetization. The ChRM inclination and declina-tion values oscillate around the mean values expected for the GADfield at the site, but the amplitude and the frequency of the varia-tion are too high for geomagnetic secular variation. The paleo-magnetic trends (ChRM inclination, declination and relativepaleointensity) can be replicated at high-resolution between fourdistinct cores, ruling out disturbance as a cause for this variation.Regardless of the high-amplitude and high-frequency variation,when broadly smoothed the reconstructed paleomagnetic trendscan be correlated to the reference curves from models of paleo-secular variation (PSV) during the last 3000 years, as reconstructedfrom archeomagnetic data collected across Europe. Together withconstraints coming from pollen and sediment analysis, the paleo-magnetic trends allow the construction of a high-resolution agemodel and indicate that some changes observed in the pollenassemblage and in sedimentation in the Rieti basin can be associ-ated to societal factors and others to climatic change. Paleomag-netism is a powerful tool for providing alternative age models forstudy sites with 14C records that are difficult to interpret. The richdocumentary record for the region provides an opportunity tofurther explore questions of environmental change in relation tosocietal versus climatic causes. Addressing some of these questionswill require further refinement of our agemodel to reduce temporaluncertainty.
Contributions by authors
Mensing co-led the field coring, analyzed pollen, contributed todevelopment of the age model and climate proxy framework, andoversaw the project; Tunno assisted in field coring and analyzedpollen and charcoal; Sagnotti and Florindo conducted all rockmagnetism and paleomagnetism analyses and developed the PSVage model; Noble created the core description, conducted smearslide analysis and analyzed elemental chemistry; Archer analyzedelemental chemistry; Zimmerman conducted all radiocarbon ana-lyses and helped develop the age model; Pav�on-Carrasco helpeddevelop the age model and associated error analysis; Cifani andPassigli conducted historical archival research (Section 3.7),contributed interpretation of historical documents, and specificallyauthored historical sections in paragraphs 4.5.1, 4.5.2; 4.5.3 by G.Cifani and paragraphs 4.5.4, 4.5.5, 4.5.6, 4.5.7 by S. Passigli;
S.A. Mensing et al. / Quaternary Science Reviews 116 (2015) 72e9492
Piovesan coordinated all Italian research components, co-led thefield coring, interpreted pollen results in relation to local forestecology, contributed to development of the age model and climateproxy framework and contributed to historical research. All co-authors contributed to writing the manuscript.
Acknowledgements
We are grateful to the many people who helped make this studypossible, Microtephra analysis was performed by Paola Del Carlo,Antonella Bertagnini, Alessio di Roberto of INGV, Pisa, Italy. Coreswere processed at LACORE, Minneapolis with assistance fromAnders Noren, Christina Brady, Amy Mybro and Jessica Heck. Fig. 1was created by Emanuele Ziaco. Funding was provided by the Na-tional Science Foundation (GSS-1228126) to Mensing and Noble,international travel awards and sabbatical leave from the Universityof Nevada, Reno to Mensing, the Sabina Universitas and Province ofRieti. We are grateful to Luigi Sandoletti for technical support,Giulia Sandoletti for laboratory assistance, Emanuele Presutti Saba,Emanuele Ziaco, and Gianluca Bonavigo for field and coring assis-tance, and DAFNE Universit�a degli Studi della Tuscia for fieldtransportation. Paolo Bellezza, Maurizio Sterpi at the Riserva Nat-urale dei Laghi Lungo e Ripasottile provided housing at the field siteand boat access to Lago Lungo. Stefano Pizetti helped arrangehousing in Viterbo for U.S. participants. Comments from an anon-ymous reviewer significantly improved the manuscript. This isLLNL-JRNL-665781.
References
Aimers, J., 2011. Drought and the Maya; the story of artefacts. Nature 479, 4e5.Alfani, G., 2010. Pestilenze e ‘crisi di sistema’ in Italia tra XVI e XVII secolo. Per-
turbazioni di breve periodo o cause di declino economico? In: Cavaciocchi, S.(Ed.), Le interazioni fra economia e ambiente biologico nell'Europa preindus-triale. Florence University Press, Florence.
Alvino, G., Leggio, T., 2006. Acque e culti salutari in Sabina, in Usus veneratioquefontium 2006.
Barbiera, I., Dalla-Zuanna, G., 2009. Population dynamics in Italy in the MiddleAges: new insights from Archaeological findings. Popul. Dev. Rev. 35, 367e389.
Berglund, B.E., 2003. Human impact and climate changesdsynchronous events anda causal link? Quat. Int. 105, 7e12.
Bersani, P., Bencivenga, M., 2001. Le piene del Tevere a Roma dal V secolo a.C.all'anno 2000. Presidenza del Consiglio dei Ministri, Roma, p. 8.
Beug, H.J., 2004. In: Pfiel (Ed.), Leitfaden der Pollenbestimmung fur Mitteleuropaund angrenzende Geiete, p. 542. Munchen.
Blackmore, S., Steinmann, J.A.J., Hoen, P.P., Punt, W., 2003. The Northwest EuropeanPollen Flora, 65. Betulaceae and Corylaceae. Rev. Palaeob. Palynol. 123, 71e98.
Bottema, S., 1975. The interpretation of pollen spectra from prehistoric settlements(with special attention to Liguliflorae). Palaeohistoria 57, 17e35.
Branch, N.P., Marini, N.A., 2014. Mid-Late Holocene environmental change andhuman activities in the northern Apennines, Italy. Quat. Int. 353, 34e51.
Brown, A.G., Hatton, J., Selby, K.A., Leng, M.J., Christie, N., 2013. Multiproxy study ofHolocene environmental change and human activity in the Central ApennineMountains, Italy. J. Quat. Sci. 28 (1), 71e82.
Bruce-Chwatt, L.J., de Zulueta, J., 1980. The Rise and Fall of Malaria in Europe. OxfordUniversity Press, Oxford.
Büntgen, U., Teleg, W., Nicolussi, K., McCormick, M., Frank, D., Trouet, V., Kaplan, J.O.,Herzing, F., Heussner, K.-U., Wanner, H., Luterbacher, J., Esper, J., 2011. 2500years of European climate variability and human susceptibility. Science 311,578e582.
Caciorgna, M.T., 1998. Popolamento e agricoltura: aspetti della politica territorialedel comune di Rieti nel Duecento. In: Grillotti di Giacomo, M.G., Moretti, L.(Eds.), I valori dell’agricoltura nel tempo e nello spazio, vol. I. Brigati, pp. 82e97.
Caciorgna, M.T., 2000. Confini e giurisdizioni tra Stato della Chiesa e Regno. In:Hubert, E. (Ed.), Une r�egion frontali�ere au Moyen Age. Les Vall�ees du Turano etdu Salto entre Sabine et Abruzzes, Paris, pp. 307e326.
Calderini, G., Calderoni, G., Cavinato, G.P., Gliozzi, E., Paccara, P., 1998. The upperQuaternary sedimentary sequence at Rieti Basin (central Italy): a record ofsedimentation response to climatic changes. Palaeogeogr. Palaeoclimatol.Palaeoecol. 140, 97e111.
Calderoni, G., Carrara, C., Ferreli, L., Follieri, M., Gliozzi, E., Magri, D., Narcisi, B.,Parotto, M., Sadori, L., Serva, L., 1994. Palaeoenvironmental, palaeoclimatic andchronological interpretations of a late Quaternary sediment core from Piana diRieti (central Apennines, Italy). Giorn. Geol. 3 (56/2), 43e72.
Camerieri, T.M., 2011. Transumanza e agro centuriato in alta Sabina, interferenze esoluzioni gromatiche. Lazio Sabina 7, 111e127.
Capasso, S., Malanima, P., 2007. Economy and population in Italy 1300e1913. Popol.Stor. 2, 15e40.
Caprioli, M., 2008. Lo statuto della citt�a di Rieti: dal secolo XIV al secolo XVI. Istitutostorico italiano per il Medio Evo.
Casella, L., Agrillo, E., Spada, F., 2009. Descrizione del patrimonio botanico e pro-poste di gestione della riserva naturale regionale Laghi Lungo e Ripasottile edella ZPS. In: La riserva naturale dei Laghi Lungo e Ripasottile, conoscenza epianificazione, Rieti.
Cavinato, G., De Celles, P., 1999. Extensional basins in the tectonically bimodalcentral Apennines fold-thrus belt, Italy: response to corner flow above a sub-ducting slab in retrograde motion. Geology 27 (10), 955e958.
Celetti, D., 2007. La canapa nella Repubblica veneta. In: Produzione nazionale eimportazione in et�a moderna. Istituto veneto di Scienze, Lettere ed Arti,Venezia.
Champion, T., 1995. Centre and Periphery: Comparative Studies in Archaeology.Routledge, 264 pp.
Chester, P.I., Raine, J.I., 2001. Pollen and spore keys for Quaternary deposits in thenorthern Pindos Mountains, Greece. Grana 40 (6), 299e387.
Christiansen, B., Ljungqvist, F., 2012. The extra-tropical Northern Hemispheretemperature in the last two millenia: reconstructions of low-frequency vari-ability. Clim. Past 8, 765e786.
Cifani, G., 2003. Storia di una frontiera. Dinamiche territoriali e gruppi etnici nellamedia valle tiberina dalla prima et�a del ferro alla conquista romana. IstitutoPoligrafico e Zecca dello Stato, Roma.
Coccia, S., Mattingly, D.J., Beavitt, P., Elton, H., Foss, P., George, I., Hunt, C.O.,Leggio, T., Patterson, H., Roberts, P., Brehm, T., Sudell, T., Sherratt, M., Morton, K.,1992. Settlement History, Environment and Human Exploitation of an Inter-montane Basin in the Central Apennines: The Rieti Survey 1988e1991, Part I. In:Papers of the British School at Rome, vol. 60, pp. 213e289.
Coccia, S., Mattingly, D.J., Brehm, B., Elton, H., Foss, P., George, I., Leggio, T.,Patterson, H., Roberts, P., Sudell, T., 1995. Settlement History, Environment andHuman Exploitation of an Intermontane Basin in the Central Apennines: TheRieti Survey 1988e1991, Part II. Land-use patterns and Gazetteer. In: Papers ofthe British School at Rome, vol. 63, pp. 105e158.
Coombes, P.M.V., Chiverrell, R.C., Barber, K., 2009. A high-resolution pollen andgeochemical analysis of late Holocene human impact and vegetation history insouthern Cumbria, England. J. Quat. Sci. 24 (3), 224e236.
Cosentino, D., Cipollari, P., Marsili, P., Scrocca, D., 2010. Geology of the centralApennines: a regional reviewMarco Beltrando, Angelo Peccerillo, MassimoMattei, Sandro Conticelli, and Carlo Doglioni, the Geology of Italy: Tectonics andLife along Plate Margins. J. Virt. Explor. Electron. Ed. ISSN: 1441-8142 vol. 36.http://dx.doi.org/10.3809/jvirtex.2010.00223 paper 12.
Costambeys, M., 2009. Settlement, taxation and the condition of the peasantry inPost-Roman Central Italy. J. Agrar. Chang. 9 (1), 92e119.
Covino, R., 1995. L'invenzione di una regione. In: L'Umbria dall'Ottocento a oggi.Quattroemme Editore, Perugia, p. 142.
Croudace, I.W., Rindby, A., Rothwell, R.G., 2006. ITRAX; description and evaluationof a new multi-function X-ray core scanner. Geol. Soc. Spec. Publ. 267, 51e63.
Cugny, C., Mazier, F., Galop, D., 2010. Modern and fossil non-pollen palynomorphsfrom the Basque mounatains (western Pyrenees, France): the use of coproph-ilous fungi to reconstruct pastoral activity. Veg. Hist. Archaeobot. 19, 391e408.
Cutini, M., Cancellieri, L., Cioffi, M.T., Licursi, C., 2010. Phytosociology and phyto-geography of fragmented Alnus glutinosa forests in a Tyrrhenian district (CentralItaly). Ecol. Mediterr. 36 (2), 56.
Dean Jr., W.E., 1974. Determination of carbonate and organic matter in calcareoussediments and sedimentary rocks by loss on ignition: comparison with othermethods. J. Sed. Petrol. 44, 242e248.
De Felice, R., 1965. In: Aspetti e momenti della vita economica di Roma e del Lazionei secoli XVIII e XIX. di storia e letteratura, vol. 13.
Dearing, J.A., Jones, R.T., Shen, J., Yang, X., Boyle, J.F., Foster, G.C., Crook, D.S.,Elvin, M.J.D., 2008. Using multiple archives to understand past and presentclimate-human-environmental interaction: the lake Erhai catchment, YunnanProvince, China. J. Paleolimnol. 40, 3e31.
De Santis, A., Coarelli, F., 2009. In: Quasar (Ed.), Reate e l'Ager Reatinus: Vespasianoe la Sabina: dalle origini all'impero, p. 192. Roma.
Diamond, J., 2005. Collapse: How Societies Choose to Fail or Succeed. Viking, Lon-don, 575 pp.
Di Rita, F., Melis, R.T., 2013. The cultural landscape near the ancient city of Tharros(central West Sardinia): vegetation changes and human impact. J. Archaeol. Sci.40 (12), 4271e4282.
Di Rita, F., Celant, A., Magri, D., 2010. Holocene environmental instability in thewetland north of the Tiber delta (Rome, Italy): sea-lake-man interactions.J. Paleolimnol. 44 (1), 51e67.
Di Rita, F., Magri, D., 2009. Holocene drought, deforestation, and evergreen vege-tation development in the central Mediterranean: a 5500 year record from LagoAlimini Piccolo, Apulia, southeast Italy. Holocene 19, 295e306.
Dupr�e, T.E., 1939. Il lago Velino. In: Saggio storico-geografico, Consorzio di bonificadella Piana reatina nel decennale della legge Mussolini, Rieti.
Esper, J., Frank, D., Büntgen, U., Verstege, A., Luterbacher, J., Xoplaki, E., 2007. Long-term drought severity variations in Morocco. Geophys. Res. Lett. 34, L17702.http://dx.doi.org/10.1029/2007GL030844.
Faegri, K., Iversen, J., 1985. Textbook of Pollen Analysis, fourth ed. Hafner Press, NewYork.
S.A. Mensing et al. / Quaternary Science Reviews 116 (2015) 72e94 93
Ferreli, L., Brunamonte, F., Filippi, G., Margheriti, L., Michetti, A.M., 1992. StudiGeologici Camerti, vol. Speciale 1, pp. 127e135.
Ferreli, L., Parotto, M., Serva, L., 1990. Evoluzione del reticolo idrographico nellaPiana di Rieti degli ultimi 4000 anno. Mem. Soc. Geol. Ital. 45, 90e910.
Florenzano, A., Marignani, M., Rosati, L., Fascetti, S., Mercuri, A., 2015. Are Cichorieaean indicator of open pastures and pastoralism in current and past vegetationstudies? Plant Biosyst. 149, 154e165.
Fraser, E.D.G., 2011. Can economic, land use and climatic stresses lead to famine,disease, warfare and death? Using Europe's calamitous 14th century as aparable for the modern age. Ecol. Econ. 70, 1269e1279. http://dx.doi.org/10.1016/j.ecolecon.2010.02.010.
Gallet, Y., Genevey, A., Le Go, M., 2002. Three millennia of directional variations ofthe Earth's magnetic field in western Europe as revealed by archaeological ar-tefacts. Phys. Earth Planet. Int. 131, 81e89. http://dx.doi.org/10.1016/S0031-9201(02)00030-4.
Galli, A., 1840. Cenni economico-statistici sullo stato pontificio con appendice.Discorso sull'agro romano e sui mezzi di migliorarlo. Tipografia Camerale,Roma.
Galli, P., Naso, J., 2009. Unmasking the 1349 earthquake source (southern Italy):paleoseismological and archaeoseismological indications for the Aquae Iuliaefault. J. Struct. Geol. 31, 128e149.
Giaccio, B., Messina, P., Sposato, A., Volaggio, M., Zanchetta, G., Galadini, F., Gori, S.,Santacroce, R., 2009. Tephra layers from Holocene lake sediment of the Sul-mona Basin, central Italy: implications for volcanic activity in Peninsular Italyand tephrostratigraphy in the central Mediterranean area. Quat. Sci. Rev. 28,2710e2733.
Giraudi, C., 2005. Late-Holocene alluvial events in the Central Apennines, Italy.Holocene 15 (5), 768e773.
Giraudi, C. The Holocene record of environmental changes in the ‘Stagno di Mac-carese’ marsh (Tiber river delta, central Italy). Holocene 22 (12), 2012,1461e1471.
Giraudi, C., Magny, M., Zanchetta, G., Drysdale, R.N., 2011. The Holocene climaticevolution of Mediterranean Italy: a review of the continental geological data.Holocene 21 (1), 105e115.
Grove, A.T., Rackham, O., 2001. The Nature of Mediterranean Europe: an EcologicalHistory. Yale University Press, New Haven.
Guiot, J., Corona, C., 2010. Growing season temperatures in Europe and climateforcings over the past 1400 years. PLoS one 5 (4), e9972.
Haberzettl, T., Kück, B., Wulf, S., Anselmetti, F., Ariztegui, D., Corbella, H., Fey, M.,Janssen, S., Lücke, A., Mayr, C., Ohlendorf, C., Sch€abitz, F., Schleser, G., Wille, M.,Zolitschka, B., 2008. Hydrological variability in southeastern Patagonia andexplosive volcanic activity in the southern Andean Cordillera during OxygenIsotope Stage 3 and the Holocene inferred from lake sediments of LagunaPotrok Aike, Argentina. Palaeogeogr. Palaeoclimatol. Palaeoecol 259, 213e229.
Haenssler, E., Nadeau, M., V€ott, A., Unkel, I., 2013. Natural and human inducedenvironmental changes preserved in a Holocene sediment sequence from theEtoliko Lagoon, Greece: new evidence from geochemical proxies. Quat. Int.308e309, 89e104.
Harris, W.V., 2013. Defining and detecting Mediterranean deforestation, 800BCE to700CE. In: Harris (Ed.), The Ancient Mediterranean Environment between Sci-ence and History, pp. 173e194. Brill Collections: Classical Studies E-Books On-line, Collection 2013.
Hatt�e, C., Morvan, J., Noury, C., Paterne, M., 2001. Is classical acidealkalieacidtreatment responsible for contamination? An alternative proposition. Radio-carbon 43, 177e182.
Heiri, O., Lotter, A., Lemcke, G., 2001. Loss on ignition as a method for estimatingorganic and carbonate content in sediments: reproducibility and comparabilityof results. J. Paleolimnol. 25, 101e110.
Hughes, J.D., 2011. Ancient deforestation revisited. J. Hist.Biol. 44 (1), 43e57.Hurrell, J.W., 1995. Decadal trends in the North Atlantic Oscillation: regional tem-
peratures and precipitation. Science 269 (5224), 676e679.Joannin, S., Brugiapaglia, E., Beaulieu, J.L.D., Bernardo, L., Magny, M., Peyron, O.,
Vanni�ere, B., 2012. Pollen-based reconstruction of Holocene vegetation andclimate in Southern Italy: the case of Lago di Trifoglietti. Clim. Past Discuss. 8(3), 2223e2279.
Joannin, S., Magny, M., Peyron, O., Vanni�ere, B., Galop, D., 2014. Climate and land-use change during the late Holocene at Lake Ledro (southern Alps, Italy). Ho-locene 24 (5), 591e602.
Kaltenrieder, P., Procacci, G., Vanni�ere, B., Tinner, W., 2010. Vegetation and firehistory of the Euganean Hills (Colli Euganei) as recorded by Lateglacial andHolocene sedimentary series from Lago della Costa (northeastern Italy). Holo-cene 20 (5), 679e695.
Kaplan, J.O., Krumhardt, K.M., Zimmermann, N., 2009. The prehistoric and prein-dustrial deforestation of Europe. Quat. Sci. Rev. 28, 3016e3034.
Kirschvink, J.L., 1980. The least-squares line and plane and the analysis of paleo-magnetic data. Geophys. J. R. Astron. Soc. 62, 699e718.
K€ohler, E., Lange, E., 1979. A contribution to distinguish cereal from wild grasspollen grains by LM and SEM. Grana 18, 133e140.
Korte, M., Constable, C., Donadini, F., Holme, R., 2011. Reconstructing the Holocenegeomagnetic field. Earth Planet. Sci. Lett. 312 (3), 497e505.
Kylander, M.E., Ampel, L., Wohlfarth, B., Veres, D., 2011. High-resolutionX-ray fluorescence core scanning analysis of Les Echets (France)sedimentary sequence: new insights from chemical proxies. J. Quat.Sci. 26 (1), 109e117.
Ladurie, E. LeRoy, 1971. Times of Feast, Times of Famine: a History of Climate sincethe Year 1000 (Barbara Bray, Trans.). Doubleday and Company, Inc., New York,426 pp.
Lavrieux, M., Jacob, J., Disnar, J.R., Br�eheret, J.G., Le Milbeau, C., Miras, Y., Andrieu-Ponel, V., 2013. Sedimentary cannabinol tracks the history of hemp retting.Geology 41 (7), 751e754.
Leggio, T., 1989b. Le fortificazione di Rieti dall’ altomedievo al Rinascimento (sec.VIeXVI). In: Quaderni di storia urbana et territoriali, vol. 4, pp. 18e27. Rieti.
Leggio, T., 1994. Momenti della riforma cistercense nella Sabina e nel Reatino tra XIIe XIII secolo. Riv. Stor. Lazio 2, 17e61.
Leggio, T., 1995a. Trasformazioni del paesaggio dei monti Sabini dall'et�a romana almedioevo. In: Leggio, T., Marini, M. (Eds.), Il paesaggio della conca reatina.Problemi ed esperienze di una ricerca multidisciplinare, pp. 51e70. Rieti.
Leggio, T., 1995b. L'olivo e la Sabina tra et�a romana e medioevo. In: L'olivo inSabina e nel Lazio. Storia e prospettive di una presenza colturale, Roma,pp. 13e77.
Leggio, T., 1998. Un difficile rapporto tra uomo e ambiente: il paesaggio dellaconca reatina tra boschi ed acque. In: Grillotti di Giacomo, M.G., Moretti, L.(Eds.), I valori dell'agricoltura nel tempo e nello spazio, vol. I. Brigati,pp. 99e115.
Leggio, T., 2000. Il territorio della Provincia di Rieti tra la tarda antichit�a e lo scorciodel Medioevo. Riv. Stor. Lazio Quad. VIII (3), 27e43.
Leggio, T., 2007. Pesca ed acque nel medioevo reatino. Riserva Naturale dei LaghiLungo e Ripasottile, Rieti, p. 67.
Leggio, T., Serva, L., 1991. La bonifica della Piana di Rieti dall'et�a romana al Medi-oevo: influenze sui mutamenti del paesaggio. Not. dell'Enea 25e26, 61e70.
Leone, A., 2004. In: Angeli, Franco (Ed.), Ambiente e territorio agroforestale: lineeguida per la pianificazione sostenibile e gli studi di impatto ambientale, vol.95.
Lo Cascio, E., Malanima, P., 2005. Cycles and stability. Italian population beforethe demographic transition (225 B.C.-A.D. 1900). Riv. Storia Econ. XXI (3),5e40.
L�opez-Moreno, J., Vicente-Serrano, S., M�oran-Tejeda, E., Lorenzo-Lacruz, J.,Kenawy, A., Beniston, M., 2011. Effects of the North Atlantic Oscillation (NAO) oncombined temperature and precipitation winter modes in the Mediterraneanmountains: observed relationships and projections for the 21st century. Glob.Planet. Change 77, 62e76.
Lorenzetti, R., 1989. Studi e materiali per una Storia Sociale e Economica dellaSabina. Ricerca dell'Istituto Eugenio Cirese promossa dalla Regione LazioAssessorato alla Cultura, Rieti.
Lorenzetti, R., 1990. Lacus Velinus. Per la salubrit�a dell'aere et per l'abundantia. In:La bonifica dell'agro reatino dall'antico Lacus Velinus alla riorganizzazione delterritorio, Milano.
Lorenzetti, R., 1994. La Sabina. Il territorio di carta, Roma.Lorenzetti, R., 2009. La terra e le acque. Trasformazioni e persistenze del paesaggio
della Valle Reatina, Rieti.Magri, D., 2007. Advances in Italian palynological studies: late Pleistocene and
Holocene records. J. Geol. Soc. Swed. 129 (4), 337e344.McCormick, M., Buntgen, U., Cane, M., Cook, E., Harper, K., Huybers, P., Litt, T.,
Manning, S., Mayewski, A., More, A., Nicolussi, K., Tegel, W., 2012. Climatechange during and after the Roman Empire: reconstructing the past from sci-entific and historical evidence. J. Interdiscip. Hist. 43 (2), 169e220.
McNeil, J.R., 1992. Mountains of the Mediterranean World: an Environmental His-tory. Cambridge University Press, Cambridge.
Mercuri, A.M., Accorsi, C.A., Mazzanti, M.B., 2002. The long history of Cannabis andits cultivation by the Romans in central Italy, shown by pollen records fromLago Albano and Lago di Nemi. Veg. Hist. Archaeobot. 11 (4), 263e276.
Messedaglia, L., 1927. Il mais e la vita rurale italiana: saggio di storia agraria. Fed-erazione italiana dei consorzi agrari.
Moriondo, M., Trombi, G., Ferrise, R., et al., 2013. Olive trees as bio-indicators ofclimate evolution in the Mediterranean Basin. Glob. Ecol. Biogeogr. 22 (7),818e833.
Munoz, S., Gajewski, K., Peros, M.C., 2010. Synchronous environmental and culturalchange in prehistory of the northeastern United States. PNAS 107 (51),22008e22013.
Nalepka, D., Walanus, A., 2003. Data processing in pollen analysis. Acta Palaeobot.43, 125e134.
Naspi, N., 2010. Il capitolo della Cattedrale nella vita economica e sociale dellacivitas reatina (PhD thesis). Universit�a degli Studi di Sassari.
Newnham, R.M., Vanderfoes, M.J., Garnett, M.H., Lowe, D.J., Prior, C., Almond, P.C.,2007. Test of AMS 14C dating of pollen concentrates using tephrochronology.J. Quat. Sci. 22 (1), 37e51. http://dx.doi.org/10.1002/jqs.1016.
Nigrisoli, G., 1857. Rivista dei più importanti prodotti naturali e manifatturieri delloStato Pontificio. Tipografia Governativa Taddei, Ferrara.
O'Sullivan, P., 2008. The ‘collapse’ of civilizations: what paleoenvironmentalreconstruction cannot tell us, but anthropology can. Holocene 18 (1),45e55.
Parotto, M., Praturlon, A., 1975. In: Ogniben, L., Parotto, M., Praturlon, A. (Eds.),Geological Summary of Central Apennines, Structural Model of Italy. Quad. Ric.Sci. 90, 257e306.
Pav�on-Carrasco, F.J., Osete, M.L., Torta, J.M., Gaya-Piqu�e, L.R., 2009. A regionalarcheomagnetic model for Europe for the last 3000 years, SCHA.DIF.3K: appli-cations to archeomagnetic dating. Geochem. Geophys. Geosyst 10, Q03013.http://dx.doi.org/10.1029/2008GC002244.

S.A. Mensing et al. / Quaternary Science Reviews 116 (2015) 72e9494
Piovesan, G., Schirone, B., 2000. Winter North Atlantic oscillation effects on the treerings of the Italian beech (Fagus sylvatica L.). Int. J. Bio-Meteorol. 44 (3),121e127.
Piovesan, G., Biondi, F., Bernabei, M., Di Filippo, A., Schirone, B., 2005. Spatial andaltitudinal bioclimatic zones of the Italian peninsula identified from a beech(Fagus sylvatica L.) tree-ring network. Acta Oecol. 27 (3), 197e210.
Punt, W., Malotaux, M., 1984. The Northwest European Pollen Flora, 31. Cannaba-ceae, Moraceae and Urticaceae. Rev. Palaeobot. Palynol. 42, 23e44.
Punt, W., Johanna, A.A.B., Hoen, P.P., 1991. The Northwest European Pollen Flora, 45Oleaceae. Rev. Palaeobot. Palynol. 69, 23e47.
R Core Team, 2012. R: a Language and Environment for Statistical Computing. RFoundation for Statistical Computing, Vienna, Austria, ISBN 3-900051-07-0.http://www.R-project.org/.
Reimer, P., Bard, E., Bayliss, A., Beck, J.W., Blackwell, P.G., Bronk Ramsey, C.,Buck, C.E., Cheng, H., Edwards, R.L., Friedrich, M., Grootes, P.M., Guilderson, T.P.,Haflidason, H., Hajdas, I., Hatt, C., Heaton, T.J., Hogg, A.G., Hughen, K.A.,Kaiser, K.F., Kromer, B., Manning, S.W., Niu, M., Reimer, R.W., Richards, D.A.,Scott, E.M., Southon, J.R., Turney, C.S.M., van der Plicht, J., 2013. IntCal13 andMARINE13 radiocarbon age calibration curves 0e50000 years calBP. Radio-carbon 55 (4), 1869e1887.
Riccardi, R., 2006. Studi geografici sui laghi L:ungo, Ripasottile e Ventina. In: Qua-derni della Riserva Naturale dei laghi Lungo e Ripasottile, vol. 1, p. 47.
Roberts, A.P., 2006. High-resolution magnetic analysis of sediment cores: strengths,limitations and strategies for maximizing the value of long-core magnetic data.Phys. Earth Planet. Int. 156, 162e178.
Roberts, N., Stevenson, A.D., Davis, B., Cheddadi, R., Brewer, S., Rosen, A., 2004.Holocene climate, environment and cultural change in the circum-Mediterranean region. In: Battarbee, R.W., Gasse, F., Stickley, C.E. (Eds.),Past Climate Variability through Europe and Africa. Klewer Academic Pub-lishers, Dordrecht, pp. 343e362 (Developments in PaleoenvironmentalResearch).
Rull, V., Vegas-Vilarrúbia, T., 2014. Preliminary report on a mid-19th centuryCannabis pollen peak in NE Spain: historical context and potential chronologicalsignificance. Holocene, 0959683614540964.
Russo Ermolli, E., di Pasquale, G., 2002. Vegetation dynamics of south-western Italyin the last 28 kyr inferred from pollen analysis of a Tyrrhenian Sea core. Veg.Hist. Archaeobot. 11 (3), 211e220.
Russo Ermolli, E., Romano, P., Ruello, M.R., Barone Lumaga, M.R., 2014. The naturaland cultural landscape of Naples (southern Italy) during the Graeco-Roman andLate Antique periods. J. Archaeol. Sci. 42, 399e411.
Russo Ermolli, E., Di Donato, V., Martín-Fern�andez, J.A., Orain, R., Lebreton, V.,Piovesan, G., 2014. Vegetation patterns in the Southern Apennines (Italy) duringMIS 13: deciphering pollen variability along a NW-SE transect. Rev. Palaeobot.Palynol. http://dx.doi.org/10.1016/j.revpalbo.2014.11.004 (in press).
Sabbatani, S., 2005. Tentativi di lotta al paludismo e alla malaria nel Medio Evo.Ruolo dei Monaci Benedettini e Cistercensi nella nascita della MedicinaMonastica e nelle bonifiche ambientali nel Medio Evo. Le infezioni Med. 3,196e207.
Sadori, L., Guardini, M., 2007. Charcoal analysis, a method to study vegetation andclimate of the Holocene: the case of Lago di Pergusa (Sicily, Italy. Geobios 40,173e180.
Sadori, L., Jahns, S., Peyron, O., 2011. Mid-Holocene vegetation history of the centralMediterranean. Holocene 21 (1), 117e129.
Sadori, L., Ortu, E., Peyron, O., Zanchetta, G., Vanni�ere, B., Desmet, M., Magny, M.,2013. The last 7 millennia of vegetation and climate changes at Lago di Pergusa(central Sicily, Italy). Clim. Past 9 (4), 1969e1984.
Sagnotti, L., 2013. Demagnetization analysis in Excel (DAIE) e an open sourceworkbook in Excel for viewing and analyzing demagnetization data frompaleomagnetic discrete samples and u-channels. Ann. Geophys. 56 (1), D0114.http://dx.doi.org/10.4401/ag-6282.
Sagnotti, L., Rochette, P., Jackson, M., Vadeboin, F., Dinar�es-Turell, J., Winkler, A.,2003. Inter-laboratory calibration of low-field magnetic and anhysteretic
susceptibility measurements. Phys. Earth Planet. Inter. 138 http://dx.doi.org/10.1016/S0031-9201(03)00063-3.
Sereni, E., 1973. Agricoltura e mondo rurale. In: Einaudi, Torino (Ed.), Storia d'Italia,I, I caratteri originali, pp. 133e252.
Sisani, S. (Ed.), 2009. Nursia e l'ager Nursinus. Un distretto sabino dalla praefecturaal municipium (catalogue of the exhibition, Norcia 2009). Quasar, Roma.
Sk€old, E., Lagerås, P., Berglund, B.E., 2010. Temporal cultural landscape dynamics ina marginal upland area: agricultural expansions and contractions inferred frompalynological evidence at Yttra Berg, southern Sweden. Veg. Hist. Archaeobot.19, 121e136.
Soligo, M., Tuccimei, P., Barberi, R., Delitala, M.C., Miccadei, E., Taddeucci, A., 2002.U/Th dating of freshwater travertine from Middle Velino Valley (Central Italy):paleoclimatic and geological implications. Palaeogeogr. Palaeoclimatol. Paleo-ecol. 184, 147e161.
Spadoni, M., Brilli, M., Giustini, F., Petitta, M., 2010. Using GIS for modelling theimpact of current climate trend on the recharge area of the S. Susanna spring(sentral Apennines, Italy). Hydrol. Process 24, 50e64.
Stockmarr, J., 1971. Tablets with spores used in absolute pollen analysis. PollenSpores 13, 615e621.
Sulpizio, R., Zanchetta, G., Caron, B., Dellino, P., Mele, D., Giaccio, B., Insinga, D.,Paterne, M., Siani, G., Costa, A., Macedonio, G., Santacroce, R., 2014. Volcanic ashhazard in the central Mediterranean assessed from geological data. Bull. Vol-canol. 76, 866e874.
Tennant, R.K., Jones, R.T., Brock, F., Cook, C., Turney, C.M., Love, J., Lee, R., 2013.A new flow cytometry method enabling rapid purification of fossil pollen fromterrestrial sediments for AMS radiocarbon dating. J. Quat. Sci. http://dx.doi.org/10.1002/jqs.2606.
Tinner, W., van Leeuwen, J., Colombaroli, D., Vescovi, E., van der Knaap, W.,Henne, P., Pasta, S., D'Angelo, S., Mantia, T., 2009. Holocene environmental andclimatic changes at Gorgo Basso, a coastal lake in southern Sicily, Italy. Quat. Sci.Rev. 28, 1498e1510.
Tozzi, I., 2009. I riti funebri ed il pietoso ufficio della sepoltura a Rieti durante l'et�amoderna. Storia del mondo 59.
Trachsel, M., Kamenik, C., Grosjean, M., McCarroll, D., Moberg, A., Br�azdil, R.,Riemann, D., 2012. Multi-archive summer temperature reconstruction for theEuropean Alps, AD 1053e1996. Quat. Sci. Rev. 46, 66e79.
Trouet, V., Esper, J., Graham, N.E., Baker, A., Scourse, J.D., Frank, D.C., 2009. Persistentpositive North Atlantic oscillation Mode dominated the medieval climateanomaly. Science 324, 78.
Van Benthem, F., Clarke, G.C.S., Punt, W., 1984. The Northwest European PollenFlora, 33. Fagaceae. Rev. Palaeobot. Palynol. 42, 87e110.
van Geel, B., Aptroot, A., 2006. Fossil ascomycetes in Quaternary deposits. NovaHedwig. 82, 313e329.
van Geel, B., Gelorini, V., Lyaruu, A., Aptroot, A., Rucina, S., Marchant, R., SinningheDamst�e, J.S., Verschuren, D., 2011. Diversity and ecology of tropical Africanfungal spores from a 25,000-year palaeoenviromental record in southeasternKenya. Rev. Palaeobot. Palynol. 164, 174e190.
van Hoof, T.B., Bunnik, F.P.M., Waucomont, J.G.M., Kürschner, W.M., Visscher, H.,2006. Forest re-growth on medieval farmland after the Black Death pandemicd implications for atmospheric CO2 levels. Palaeogeogr. Palaeoclimatol.Palaeoecol. 237, 396e411.
Vecchio, B., 1974. In: Einaudi (Ed.), Il bosco negli scrittori italiani del Settecento edell'et�a napoleonica. Torino.
Vogel, J.S., Southon, J.R., Nelson, D.E., Brown, T.A., 1984. Performance of catalyticallycondensed carbon for use in accelerator mass spectrometry. Nucl. Instrum.Methods B5, 289e293.
Yeloff, D., van Geel, B., 2007. Abandonment of farmland and vegetation successionfollowing the Eurasian plague pandemic of AD 1347-52. J. Biogeogr. 34,575e582.
Zuccagni-Orlandini, A., 1843. Corografia fisica, storica e statistica dell'Italia e dellesue isole: corredata di un Atalante di mappe geograf e topografiche, e di altretavole illustrative, vol. 10. Firenze [2] Supplemento. Editori.


![TABBY ARCHITECTURE: ORIGINS AND CULMINATION Colin …...Basilio Pavon Maldonado (1978) has drawn attention to a particularly pertinent passage in the Muqaddimah [2] of ibn Khaldun](https://img.pdfslide.us/doc/110x75/61324de0dfd10f4dd73a5ce7/tabby-architecture-origins-and-culmination-colin-basilio-pavon-maldonado-1978.jpg)