Embed Size (px)
Citation preview
Cattlemen's Update 2010
(Cattlemen's Update is a decades-old annual educational program offered by the University of Nevada Reno for beef cattle producers. Program topics speak to current beef cattle production management issues in the Great Basin region affecting profitability and product quality. Subject matter selection is based on a needs assessment of Nevada beef cattle producers and on concerns and trends expressed by the leaders of the beef cattle industry in the United States.) Welcome to the 2010 edition of the Cattlemen's Update Proceedings. This year finds us in times with cattle prices that could be better and a poor economy that is changing beef demands; among many other things. The cattle business is changing forever. With things like BSE and other food safety issues, National Livestock Identification, marker assisted DNA selection, alliances, other marketing schemes, international import and export markets, soaring energy costs coupled with global warming and the push for renewable energy, and the continuing advances of technology; the business is different and will be different forever. The industry is becoming more complicated, and our competition now comes from not only down the road, but also around the world. The cattle business is no longer just weaning a calf and selling in the fall, but a business of providing a specific product that performs in a certain way to create something to sell to the population that they want. It is through forums like this, as well as the new forms of education (the Internet, email, etc.) that provides the ability to stay on top and survive to make a profit in the business. Livestock producers with a computer and e-mail can participate at anytime in an educational forum by using Extension Coffee Shop (a subscribed e-mail list). Coffee Shop is designed to help solve problems and face issues in the livestock industry. Call Ron Torell (775-738-1 721), Dr. David Thain (775-784-1 377), or Dr. Ben Bruce (775-784-1624) to participate if you are not a member or have any other questions.
Dean and Director’s Office University of Nevada, Reno/404 Reno, Nevada, 89557 (775) 784-7070 Fax: (775) 784-7079 www.unce.unr.edu
A Partnership of Nevada Counties, University of Nevada and U.S.D.A.
Welcome to the Cattlemen’s Update! We’re pleased that you could join us for the 2010 Cattlemen’s Update. University of Nevada Cooperative Extension (UNCE) is proud to present this annual educational workshop where beef production experts bring you the latest information to make your operation more productive. With the economic challenges that our country faces today, this year’s theme of Management Strategies That Pay is particularly timely. We hope that you will gain valuable knowledge that can be implemented for measurable results. Cattlemen’s Update targets issues based on needs assessments of Nevada beef producers and on concerns and trends expressed by the leaders of the beef cattle industry nationwide. Our goal is to make all of our programs timely and relevant to your needs and help you implement actions that will make a difference. To that end, we will be embarking on a project in 2010 to assess the impact of our beef education programs. Ron Torell will be leading this effort that will cover a number of programs, including Cattlemen’s Update, BQA and Coffee Shop. In the months to come, you’ll receive information on how you can complete an online survey or if you prefer, receive a printed copy to complete. What is important is that we hear from you. We need to know if our programs are making a difference and how we can continue to serve you in the future. Thanks for your continued support of University of Nevada Cooperative Extension programs and for continuing to strive to make Nevada beef production a high quality industry. Sincerely,
Karen Hinton Dean and Director
SPONSORS University of Nevada Cooperative Extension; University of Nevada College of Agriculture; Biotechnology and Natural Resources; Nevada Department of Agriculture; USDA-RMA Risk management Agency; Fort Dodge Animal Health; Nevada Department of Agriculture; Nevada Cattlemen's Association; Intermountain Farmer’s Association; Walco International; Humboldt & Churchill County CattleWomen; American AgCredit; Neff Mill; Pfizer Animal Health; Intermountain Beef Producers; Churchill County Park and Recreation Department; John Keithly (Pinenut Livestock Supply); Charlie Rose (Rose Feeds); Lucy Rechel (Snyder Livestock Bulls); Wellington Community Hall; Lahontan Valley Vet Clinic; Ivesco Animal Health; Norvartis Animal Health; Anipro; Tri-Merit™ GAM; and local Ely Sponsors: Gilbert Griffin (Carter Agri-Systems); Hal Bybee (Intermountain Farmers); John Giannoli (First National Bank of Ely); Lance Gale (Gale Oil & Tire/LG Supplements); Tom Sanders, Jr., DVM (White Pine Veterinary Clinic); J. J. Goicochea, DVM (Eureka Vet Services); Brian Revard (Pfizer, Inc.); Michael Coe, DVM, PhD (GAM-Tri-Merit); Steve Smith (Stockman’s Supply); and Brad Lani & Mr. G’s Villa. .
PROGRAM SPEAKERS
Karen Hinton, Dean/Director University of Nevada Cooperative Extension “Welcome & Impact Assessment of UNCE Agriculture Programs”
Dr. Tom Geary, USDA-ARS Research Animal Scientist “Nutritional & Reproductive Strategies of Beef Cows That Pay and Are BQA Friendly”
Dr. David Thain, UNCE Veterinarian
“Animal Health Strategies of Beef That Pay and Are BQA Friendly” Ron Torell, UNCE Area Livestock Specialist
“Management Strategies of Beef Cows That Pay and Are BQA Friendly” Dr. Ben Bruce, UNCE Livestock Specialist
“Range Management Strategies That Pay and Are BQA Friendly” Ron Cerri, Nevada Cattlemen’s Beef Association President
“Current Issues Affecting the Industry”
Local Veterinarian “Issues of Local Concern”
Index to Articles
Cattlemen’s Update: Bringing Information to you for 40 Years-----------------------------------1
Ron Torell Premises Registration and Form-------------------------------------------------------------------------3
Holly Pecetti Range Management Strategies That Pay and Are BQA Friendly-------------------------------5
Dr. L. Ben Bruce Where is Agriculture Education in Washoe County Elementary School Curriculum? -----7
M. S. Burrows and D. W. Holcombe Matching Hay Quality to Cow Needs------------------------------------------------------------------14
Ron Torell and Jason C. Davison Mineral Supplementation: A Necessary Input Cost------------------------------------------------18
Ron Torell Minimizing Weaning Stress on Calves----------------------------------------------------------------21
Clay P. Mathis and Boone Carter Pricing Protein and Energy Supplements Corrected for Moisture Content------------------23
Ron Torell, Shelby J. Filley, and David W. Bohnert Pricing Hay (What is it worth?)--------------------------------------------------------------------------27
Steve Foster, Gary McCuin, and Ron Torell BIOCLIP® - an Alternative Wool Harvesting System for Nevada and Western States Sheep Ranches---------------------------------------------------------------------------------------------29
Tumen Wuliji and Aladaer Qi Rafter 7 Ranch Merino Breeding Program Improves Wool Quality in Nevada Sheep Flocks---------------------------------------------------------------------------------------------------------31
T Wuliji, H Glimp, and T Filbin
Cattlemen’s Update: Bringing Information to you for 40 Years
By Ron Torell University of Nevada Cooperative Extension Livestock Specialist Winter is the season for meetings. Some admittedly are time wasters, but
structured correctly, meetings can be valuable sources of information. One such valuable program over the years has been the Cattlemen’s Update, a forum for helping Western producers be more efficient and profitable. The year 2006 marks approximately 40 years that University of Nevada Cooperative Extension has brought “Cattlemen’s Update” to Nevada ranching communities.
This year 385 attended the presentations, which was held in six Nevada communities and down linked by compressed video to four additional Nevada communities.
Cattlemen’s Update, originally called “Livestock Educational Series,” originated in the mid 1960’s, the brainchild of University of Nevada Cooperative Extension (UNCE) faculty A.Z. Joy, Darwin Bradfield, Kirk Day, Jack Pursel, Norman Nichols, Jim Jensen, Bill Behrens and Dr. Earl Drake. “Instead of producers coming to us we took the information to them, a traveling road show if you will,” says Joy, retired White Pine County Extension Educator.
“The idea was to hold an educational program for Nevada beef producers in each ranching community,” continues Joy. “The program would address livestock production, marketing or other needed topics. We vowed to never hold a time waster and to leave politics out of it! We aimed to have a quality program with top speakers who present information with a take-home message to add to the bottom line of Nevada beef operations,” adds Joy.
“We usually had a local producer or practicing veterinarian and Nevada Department of Agriculture professional on the program,” said Jack Pursel, retired Lyon County Extension Educator. “Generally, we had an invited speaker and UNCE faculty who topped off the agenda. We had great industry support and sponsorship for the program, including the Nevada Cattlemen’s Association. It was a lot of work but well worth it, and we had great producer participation,” Pursel added.
The original goals of Cattlemen’s Update continue to be the goals of today’s program states Ron Torell, UNCE Livestock Specialist and present program coordinator. “I can remember as a young man attending the Livestock Educational Series and thinking what a great source of information. Twenty-five years later I am coordinating the event,” states Torell.
“I can’t say there’s never been a time waster speaker, but I can say we always do our best to make sure accurate, quality information is presented in an interesting format. We continue to give a take-home message that should add to the bottom line of your operation.”
The popular red calendar, reference and record pocketbook, produced by the National Cattlemen’s Beef Association, is included in the $10 registration fee. Some producers attend the updates with the sole purpose of getting their red
page 1
book! Some locations offer a sponsored meal or refreshments. The program has evolved into a social gathering for many, but the real draw remains research-based information with a take-home message.
What started out as a statewide program has evolved into regional workshops. We average 400 participants yearly -- from California, Oregon, Idaho, Nevada and Utah. Three years ago we started offering the program by compressed video in Eureka, Caliente, Tonopah and Owyhee. This is just one more way of taking advantage of communication technology while sticking to the original objectives of Cattlemen’s Update -- bringing information to you.
Program sponsors include University of Nevada Cooperative Extension, University of Nevada College of Agriculture, Biotechnology and Natural Resources; USDA-RMA Commodity Partnership Program, Nevada Department of Agriculture, Nevada Cattlemen's Association, Ron’s Seed & Supply, Intermountain Farmer’s Association, Walco International, Pinenut Livestock Supply, Humboldt & Churchill County Cattle Women, Snyder Livestock, Fort Dodge Animal Health, Lextron Animal Health, American AgCredit, Neff Mill, Pfizer Animal Health and Intermountain Beef Producers. Cattlemen’s Update 2007
The 2007 Cattlemen’s Update program is scheduled for January 8 – 12, 2007 with subject matter centering on handling techniques of livestock. For information about Cattlemen’s Update contact Ron Torell at (775) 738-1721, or [email protected]
### Editor’s Note: Cooperative Extension is the college that extends knowledge
from the University of Nevada to local communities to address important issues. Faculty and staff made more than 815,000 face-to-face contacts with Nevada citizens last year.
The University of Nevada is among the top research universities in the country. Last year, the nearly 700 instructional and research faculty at Nevada garnered more than $120 million in externally sponsored projects. The university has campuses in Reno and Las Vegas, with extensive business development, agricultural, medical, educational and other outreach programs across the state.
###
page 2
page 3
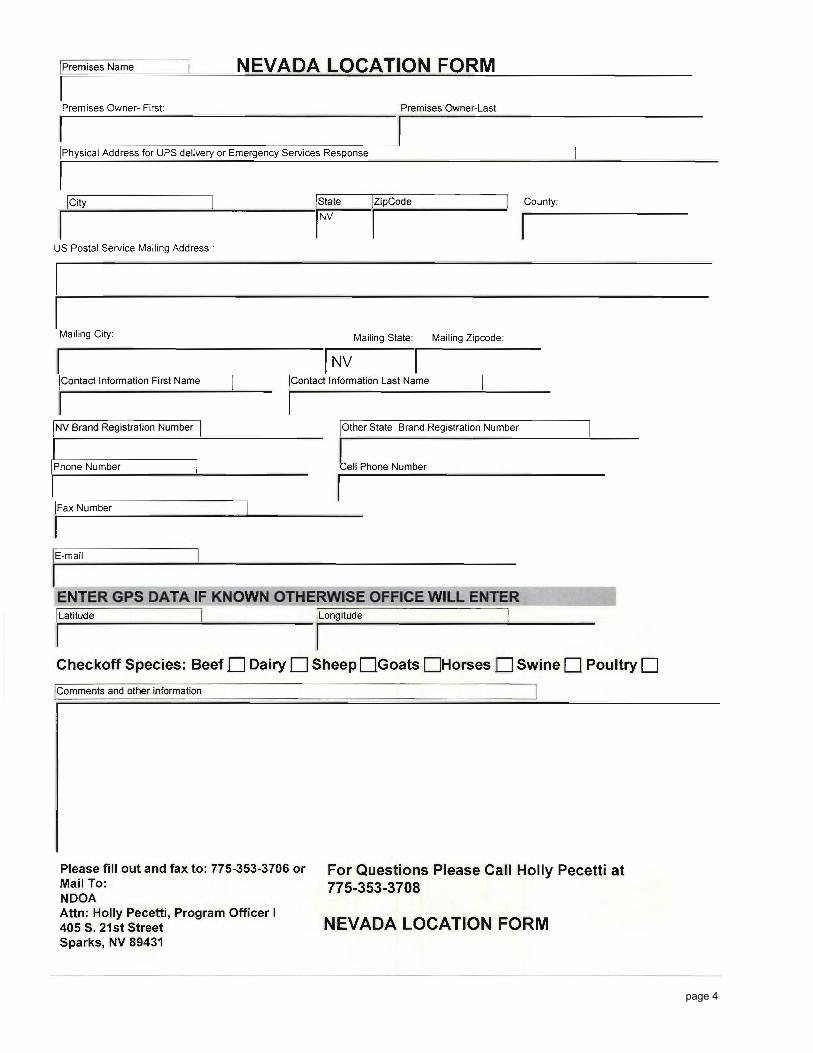
page 4
Range Management Strategies That Pay and Are BQA Friendly Dr. L. Ben Bruce
To be successful in almost anything you do requires setting personal goals some general planning. This is probably the most important thing you can do with risk management and having a BQA safe and profitable program. If goal setting and planning do not come easy to you, there are programs to help you learn these things and they might me a good investment.
The Plants Since we are talking about BQA, risk management, and profitable range programs, one of the first things you should do is to learn about plants, when and what they need, and learn some plant ID. They have nutrient requirements and life cycles just like animals do. This is true for both domestic pastures and rangeland plants. To really work with the resource, you must first understand the resource. There are lots of educational materials available to help you do this. For example, Dr. Barry Perryman has and excellent grass identification book (Dr. Barry Perryman, 775-784-xxx). Nevada is mostly a public lands grazing state, but we do have a lot of domestic pastures. This is one of the most overlooked and poorly treated resources in the Nevada ranching industry. There should be a specific grazing plan for private pastures, as well as a fertilization and renovation plan in place. A private pasture practice that the University has paid a lot of attention to lately is stockpiling of windrowed forage. We have been working with Great Basin Wildrye and stockpiling it in windrows. This keeps the quality up from early summer values all the way through February. Stockpiling in the windrow has greatly increased the value of this forage. This style of stockpiling works with almost any forage or grass. To maintain profitability, we must be able to continue to raise healthy livestock year after year. On of the best ways to do that is with sustainable range practices. These practices maintain the health of the rangeland over long periods of time. While there are many things we can do to maintain the ranges, one of the more influential and important are the riparian areas. Grazing animals naturally migrate to riparian areas and will congregate there. Most of the time riparian areas are the first parts of the range that are over used. If riparian area health is maintained, in almost every case the uplands will be healthy too. The problem is that healthy riparian areas may lead to underutilized upland areas. There are ways to mitigate this, mostly with timing of grazing. By grazing riparian areas when the upland range plants are young and succulent, we can minimize effects on riparian areas and use the uplands to a greater extent.
The Animal Body condition is important in beef cattle, as it is highly correlated to reproductive performance. It is also correlated to the performance of a beef cow on the rangeland. Cows in good body condition are more effective grazers, and tend to select a better diet.
page 5
Cattle in poor body condition are less selective and in extreme cases much more likely to consume poisonous plants that cattle in good body condition would ignore. Grazing beef cattle need a good mineral program. Nevada has problems with a number of minerals and a supplementation program is needed. Many health problems with grazing livestock can be avoided with good body condition, an appropriate mineral supplementation program, and a good herd health program. These all work together, and none work very well individually. It is difficult to have a solid health program without a good nutrition program. Where it is possible, protein supplementation can make even fairly poor quality forages perform well. With protein supplementation, make sure it is protein that they need and not energy. If they do need protein, their consumption of forage will increase, utilizing a resource that is not at its best quality better. Protein does not have to be supplemented everyday, it can be every other day or every third day, but the amount must be same as if it were being supplemented everyday. Nevada rangelands undergo periodic drought and a drought management program should be in place. These plans may include reserved pastures, heavy cull sales, feeding and early weaning. Early weaning is one that works well for rangelands as it reduces intake pressure on the cow and consequently less grazing pressure on the plants.
Plants and Animals The most important thing to maintain rangeland health, animal health, and financial health is proper stocking rates. There are many other rangeland practices that can benefit the range and grazing livestock, but proper stocking rate is the most important. There is no grazing system, rotation plan, or any other practices that can mitigate an improper stocking rate. For most semi-arid rangelands, that stocking rate is light to moderate. Timing animal production phase with the resource is another important strategy that works in the livestock, rangeland and economic favor. While not practical for everyone for a number of reasons, effort should be made to match the cow to the range. There are other practices that can aid profitability and quality assurance issues with livestock and the range. They include grazing strategies (or systems). There are a number of them out there. While not as important as stocking rate, in some circumstances they can greatly help. One system that is not common today, but still works, is herding. Herding helps with distribution, but can also be done with salt or supplement placing or by controlling water access. Nest to stocking rate, proper distribution is the most important to cattle and rangeland health.
Summary No one person can implement all of these ideas, but there may be some that can be done. To have a quality assurance program that works for both cattle and the resource is necessary to stay in business for the long term.
page 6
Where is Agriculture Education in Washoe County Elementary School Curriculum?
M. S. Burrows and D. W. Holcombe
Abstract
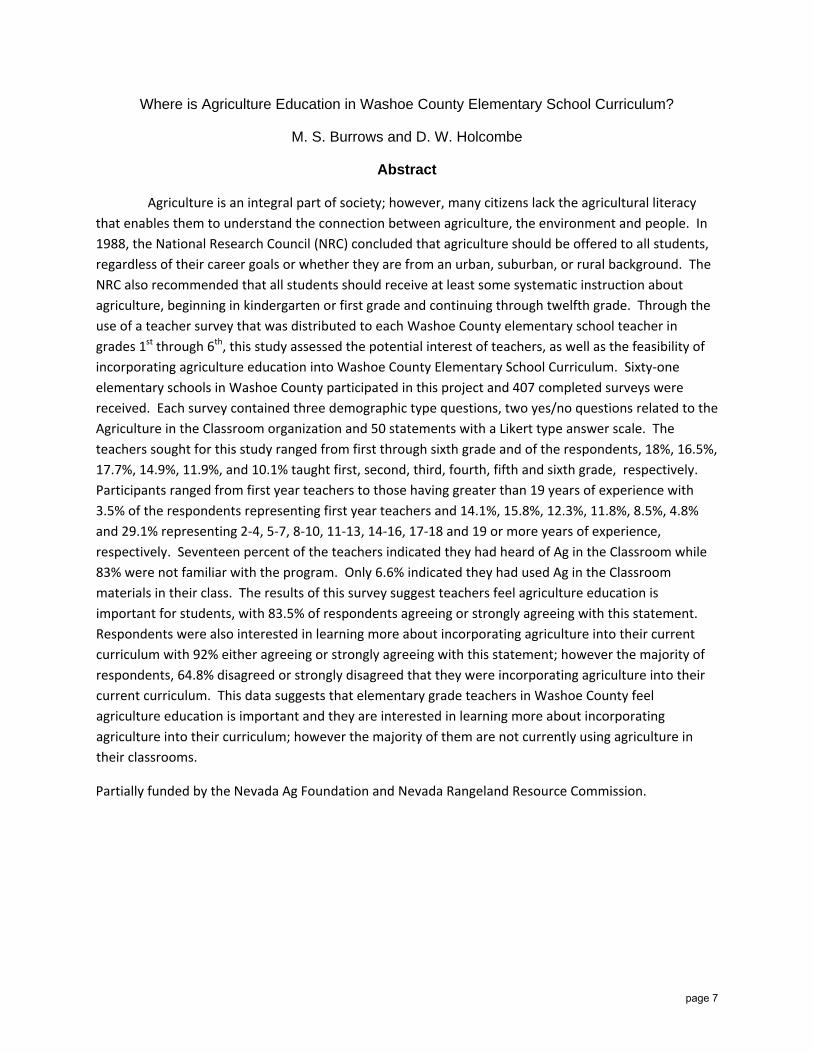
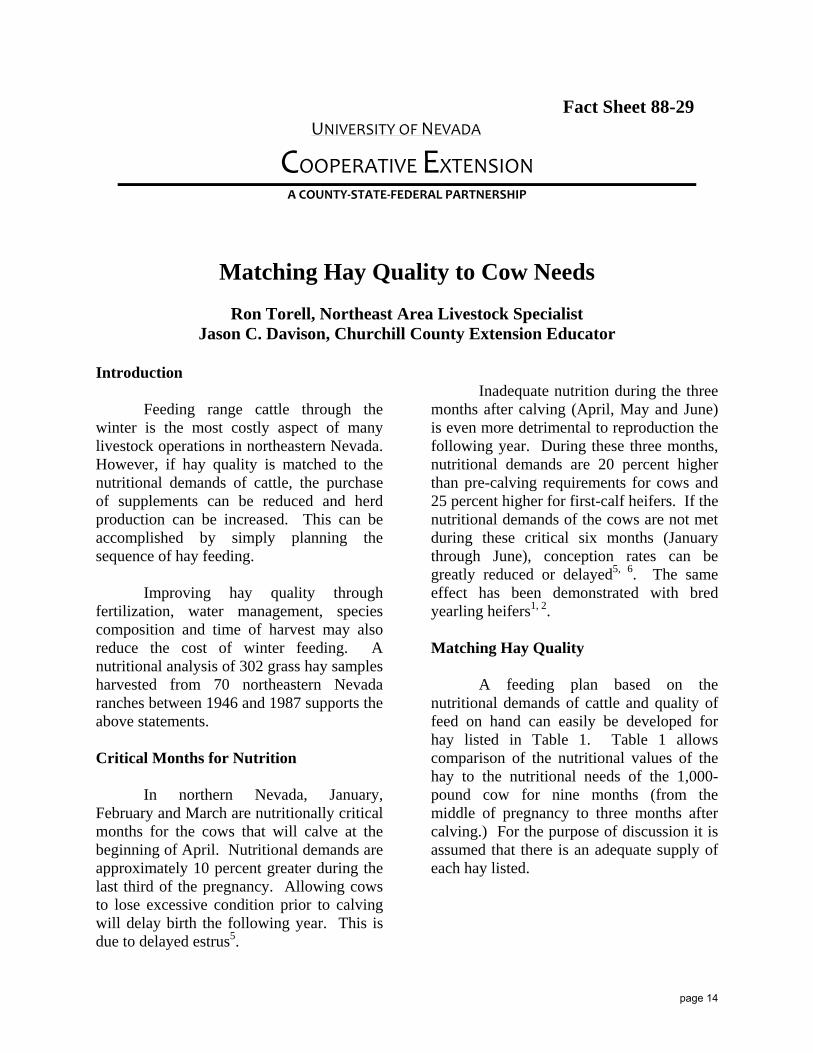
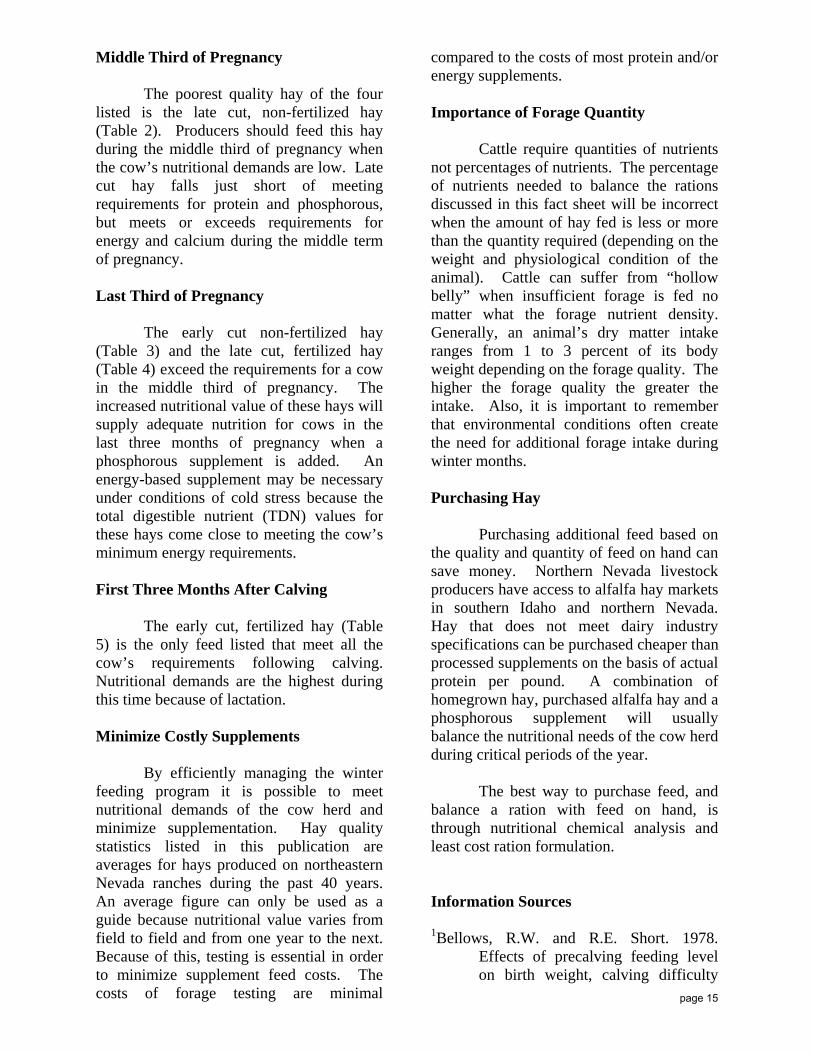
Agriculture is an integral part of society; however, many citizens lack the agricultural literacy that enables them to understand the connection between agriculture, the environment and people. In 1988, the National Research Council (NRC) concluded that agriculture should be offered to all students, regardless of their career goals or whether they are from an urban, suburban, or rural background. The NRC also recommended that all students should receive at least some systematic instruction about agriculture, beginning in kindergarten or first grade and continuing through twelfth grade. Through the use of a teacher survey that was distributed to each Washoe County elementary school teacher in grades 1st through 6th, this study assessed the potential interest of teachers, as well as the feasibility of incorporating agriculture education into Washoe County Elementary School Curriculum. Sixty‐one elementary schools in Washoe County participated in this project and 407 completed surveys were received. Each survey contained three demographic type questions, two yes/no questions related to the Agriculture in the Classroom organization and 50 statements with a Likert type answer scale. The teachers sought for this study ranged from first through sixth grade and of the respondents, 18%, 16.5%, 17.7%, 14.9%, 11.9%, and 10.1% taught first, second, third, fourth, fifth and sixth grade, respectively. Participants ranged from first year teachers to those having greater than 19 years of experience with 3.5% of the respondents representing first year teachers and 14.1%, 15.8%, 12.3%, 11.8%, 8.5%, 4.8% and 29.1% representing 2‐4, 5‐7, 8‐10, 11‐13, 14‐16, 17‐18 and 19 or more years of experience, respectively. Seventeen percent of the teachers indicated they had heard of Ag in the Classroom while 83% were not familiar with the program. Only 6.6% indicated they had used Ag in the Classroom materials in their class. The results of this survey suggest teachers feel agriculture education is important for students, with 83.5% of respondents agreeing or strongly agreeing with this statement. Respondents were also interested in learning more about incorporating agriculture into their current curriculum with 92% either agreeing or strongly agreeing with this statement; however the majority of respondents, 64.8% disagreed or strongly disagreed that they were incorporating agriculture into their current curriculum. This data suggests that elementary grade teachers in Washoe County feel agriculture education is important and they are interested in learning more about incorporating agriculture into their curriculum; however the majority of them are not currently using agriculture in their classrooms.
Partially funded by the Nevada Ag Foundation and Nevada Rangeland Resource Commission.
page 7
Introduction
All citizens need to have an understanding of where their food comes from, particularly, with the current increase in concerns about food safety and country of origin. Agriculture has been an integral part of America’s development and expansion; however the vast numbers of individuals needed in production agriculture has considerably decreased. The reduced need for individuals related directly to production agriculture has created a society where more than 97% of all employed people do not produce their own food (Nipp, 1988). This often creates a disconnect between citizens and the food on their table. Incorporating education about agriculture into classroom lessons provides diversity and variety in the learning process as well as helps students make the necessary connections between agriculture, the environment and the human population. Ag in the Classroom is a program that is coordinated by the USDA and is carried out in each of the 50 states. Each state operates its own program based on the state’s individual needs. Their goal is to “help students gain a greater awareness of the role of agriculture in the economy and society, so that they may become citizens who support wise agricultural policies” (www.agclassroom.org). The degree of teacher participation in Ag in the Classroom varies from state to state, however in Nevada; few teachers are taking advantage of this valuable resource. Nevada Ag in the Classroom has agriculture related curriculum available to teachers that can be incorporated into classrooms while maintaining and meeting the required state and county educational standards. Although materials are readily available, many educators are either reluctant to include agriculture in their curriculum or are unaware of the possibility to fulfill state educational standards.
It is important to understand why teachers are not taking advantage of this useful, often free, resource, determine why Ag in the Classroom curriculum is not being utilized by teachers, and what we can do to increase the use of the material.
The objectives of this project were to determine if elementary teachers in Washoe County are aware of the Ag in the Classroom program. Additionally, we sought to establish whether these teachers are currently using agriculture in their classroom curriculum and if not, how willing they would be to incorporate it into their curriculum.
Materials and Methods
This project consisted of a pilot study wherein a short teacher survey was given to teachers who attended the Washoe County Ag in the Classroom Farm City Festival, with their classes in March of 2008. Data and information obtained from the pilot survey was used to develop a larger, more in depth survey. In May, 2008 this survey began being distributed to all elementary schools in Washoe County, consisting of approximately 1400 teachers. Each survey contained three demographic type questions, two yes/no questions related to the Agriculture in the Classroom organization and 50 statements with a Likert type answer scale. The Likert scale was a scale of one to four with one being strongly disagrees, two representing disagree, three
page 8
being agreed and four indicating strongly agree. Included with each survey were two lesson plans that come from the Food Land & People Curriculum which is provided to all teachers who attend an Ag in the Classroom teacher Workshop. Also included was an Ag Mag, an agriculture magazine for kids. Along with questions regarding current educational curriculum, teachers were asked to evaluate the enclosed agriculture related lessons.
Principals were contacted either by phone or by email to set up a time to meet with teachers at a staff meeting, so that the surveys could be delivered, along with a brief explanation of the study. Participants were given two weeks to complete the survey after which the surveys were collected and the data compiled. Upon collection of the surveys an agriculture commodity map was delivered for every teacher, regardless of their participation.
Data obtained from the surveys were entered into a statistical program file for analysis. Initially it was determined that there was no significant relationship between the schools that participated and those that did not, so our sample was treated as random and representative of the population of elementary teachers in Washoe County. The data was also analyzed to determine if school characteristics including size, number of years teaching experience, grade taught, whether or not respondents had heard of Ag in the Classroom and whether or not respondents had used Ag in the Classroom materials in their classroom had any influence on participants’ responses on the survey.
Results
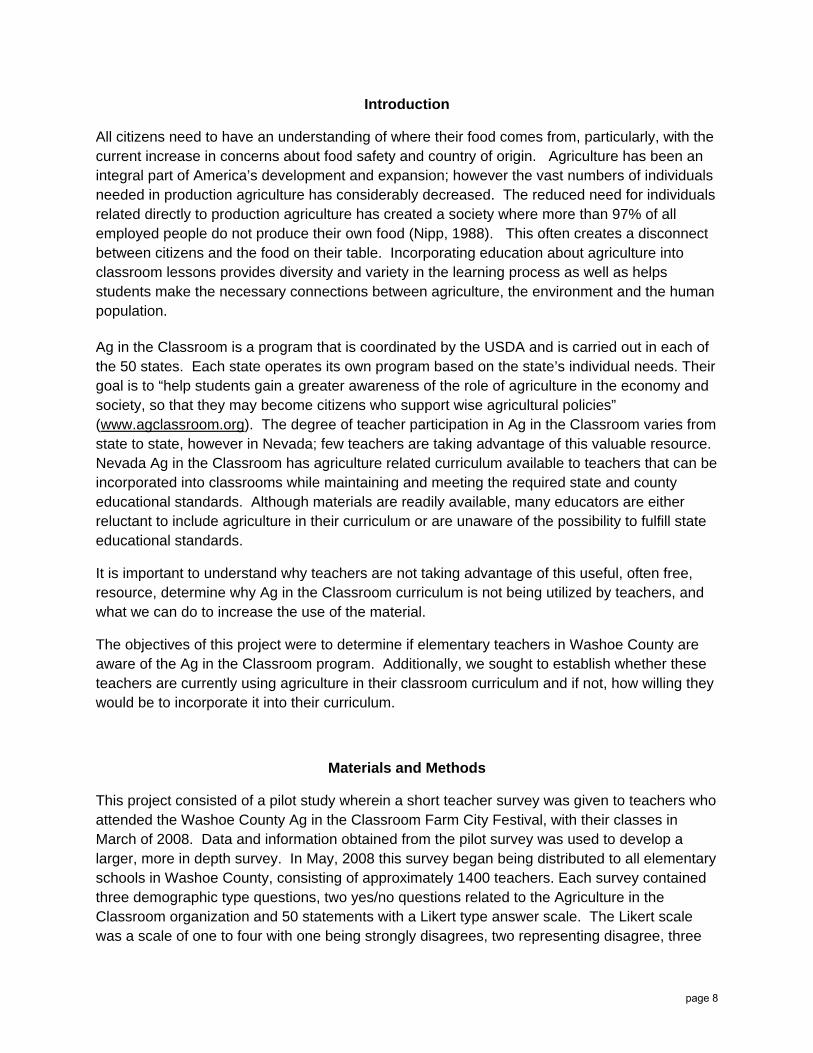
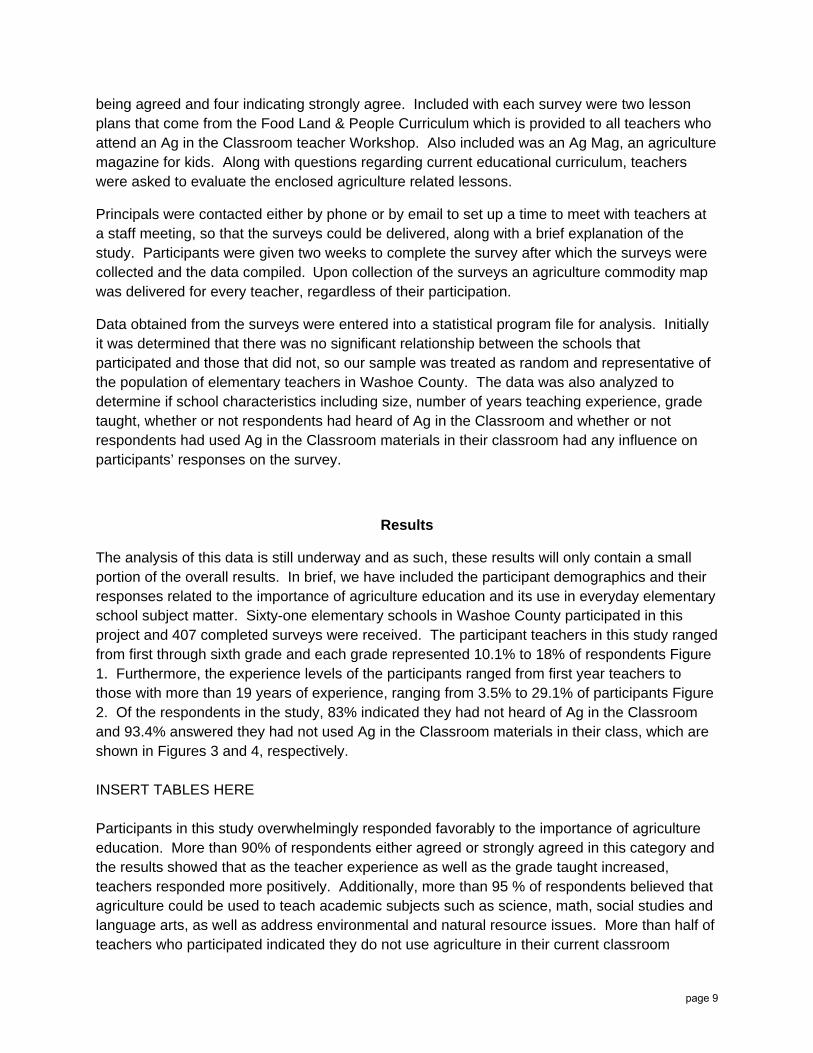
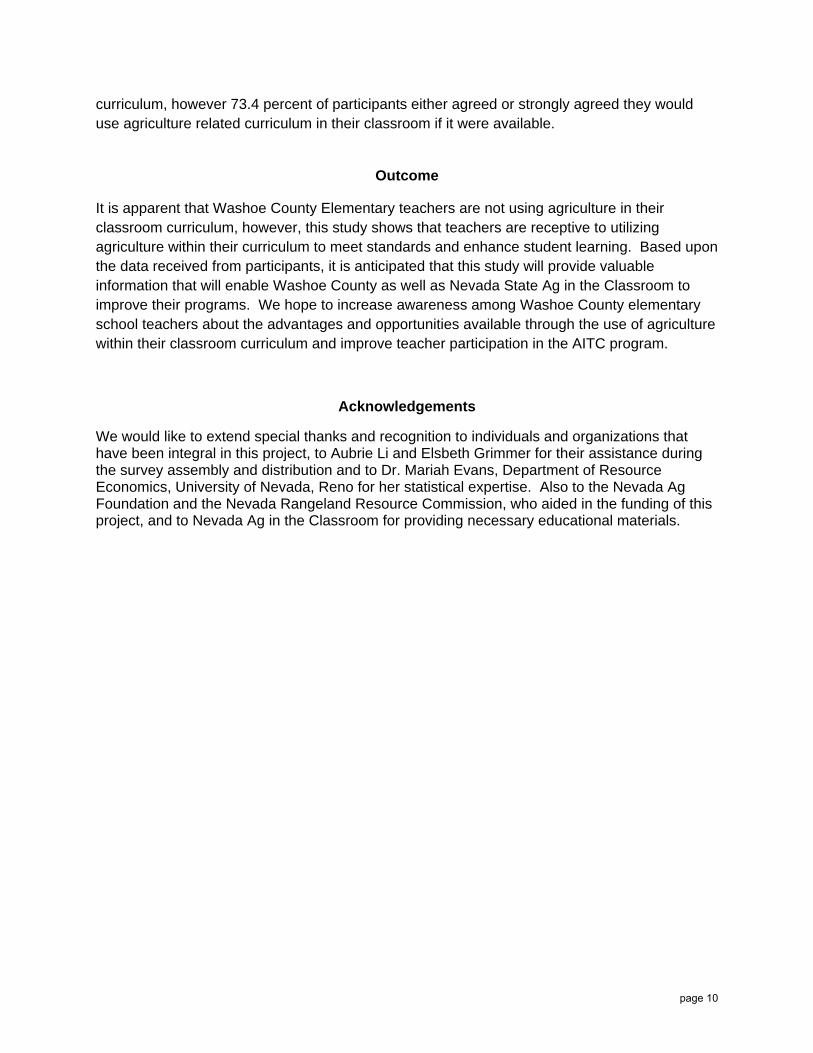
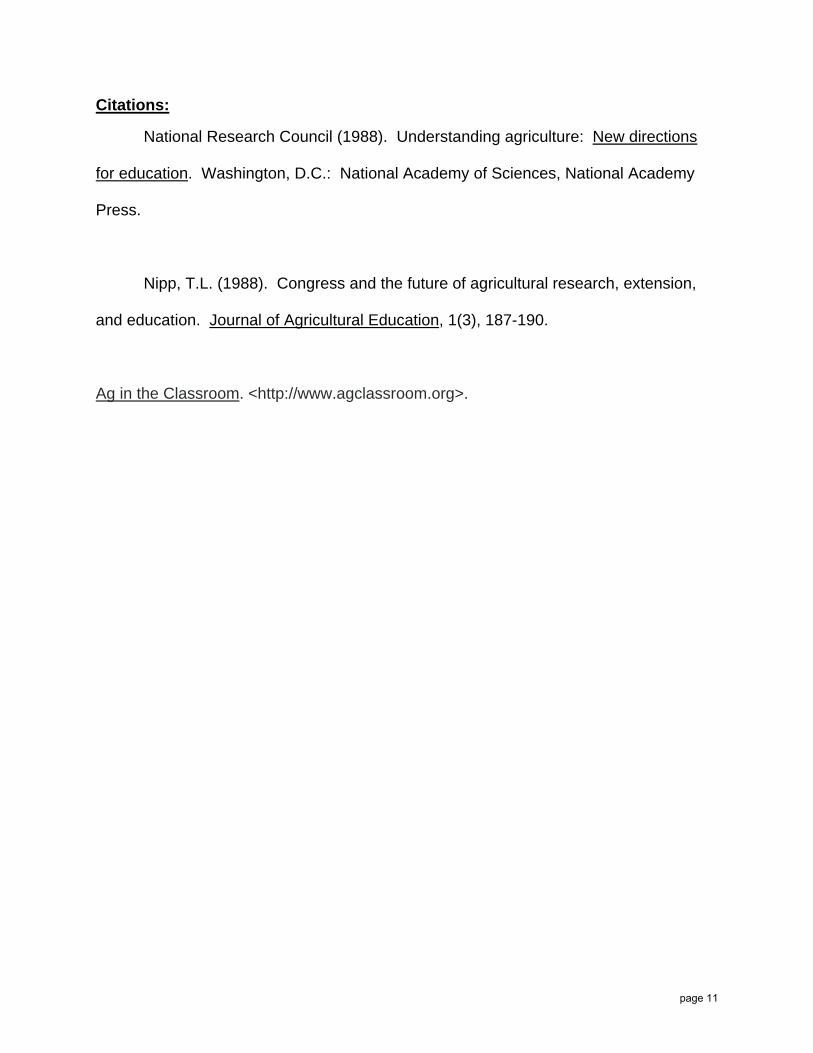
The analysis of this data is still underway and as such, these results will only contain a small portion of the overall results. In brief, we have included the participant demographics and their responses related to the importance of agriculture education and its use in everyday elementary school subject matter. Sixty-one elementary schools in Washoe County participated in this project and 407 completed surveys were received. The participant teachers in this study ranged from first through sixth grade and each grade represented 10.1% to 18% of respondents Figure 1. Furthermore, the experience levels of the participants ranged from first year teachers to those with more than 19 years of experience, ranging from 3.5% to 29.1% of participants Figure 2. Of the respondents in the study, 83% indicated they had not heard of Ag in the Classroom and 93.4% answered they had not used Ag in the Classroom materials in their class, which are shown in Figures 3 and 4, respectively. INSERT TABLES HERE Participants in this study overwhelmingly responded favorably to the importance of agriculture education. More than 90% of respondents either agreed or strongly agreed in this category and the results showed that as the teacher experience as well as the grade taught increased, teachers responded more positively. Additionally, more than 95 % of respondents believed that agriculture could be used to teach academic subjects such as science, math, social studies and language arts, as well as address environmental and natural resource issues. More than half of teachers who participated indicated they do not use agriculture in their current classroom
page 9
curriculum, however 73.4 percent of participants either agreed or strongly agreed they would use agriculture related curriculum in their classroom if it were available.
Outcome
It is apparent that Washoe County Elementary teachers are not using agriculture in their classroom curriculum, however, this study shows that teachers are receptive to utilizing agriculture within their curriculum to meet standards and enhance student learning. Based upon the data received from participants, it is anticipated that this study will provide valuable information that will enable Washoe County as well as Nevada State Ag in the Classroom to improve their programs. We hope to increase awareness among Washoe County elementary school teachers about the advantages and opportunities available through the use of agriculture within their classroom curriculum and improve teacher participation in the AITC program.
Acknowledgements
We would like to extend special thanks and recognition to individuals and organizations that have been integral in this project, to Aubrie Li and Elsbeth Grimmer for their assistance during the survey assembly and distribution and to Dr. Mariah Evans, Department of Resource Economics, University of Nevada, Reno for her statistical expertise. Also to the Nevada Ag Foundation and the Nevada Rangeland Resource Commission, who aided in the funding of this project, and to Nevada Ag in the Classroom for providing necessary educational materials.
page 10
Citations:
National Research Council (1988). Understanding agriculture: New directions
for education. Washington, D.C.: National Academy of Sciences, National Academy
Press.
Nipp, T.L. (1988). Congress and the future of agricultural research, extension,
and education. Journal of Agricultural Education, 1(3), 187-190.
Ag in the Classroom. <http://www.agclassroom.org>.
page 11
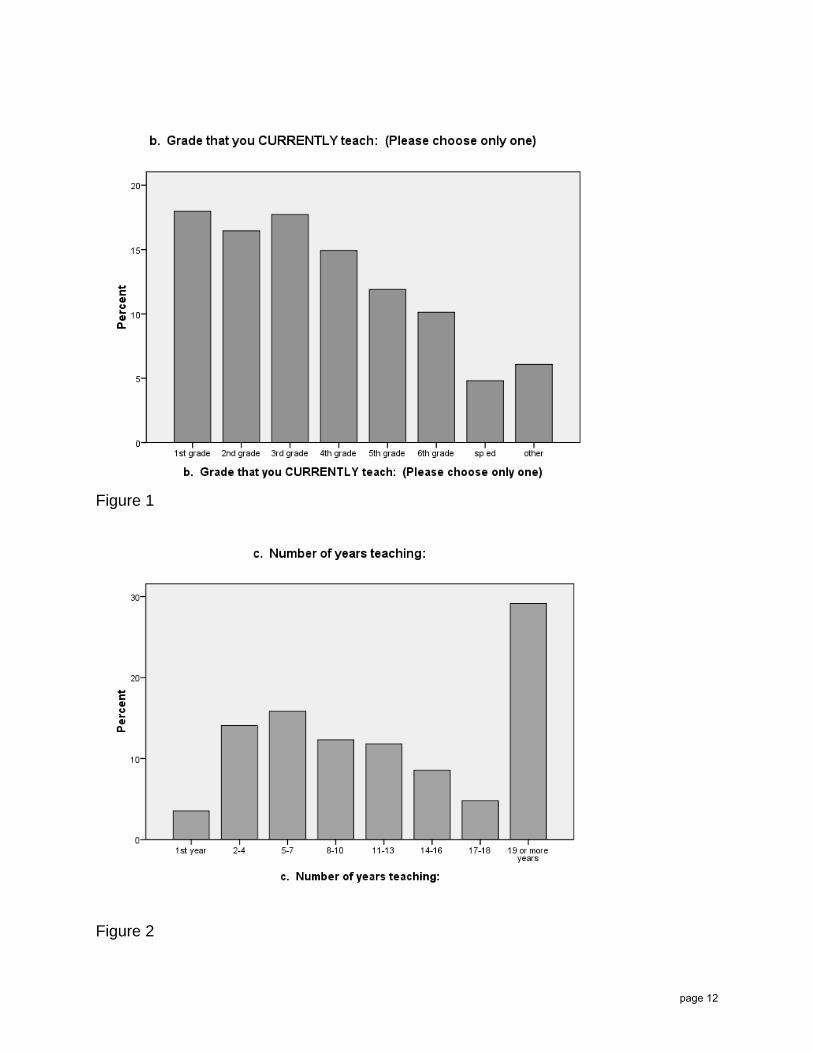
Figure 1
Figure 2
page 12
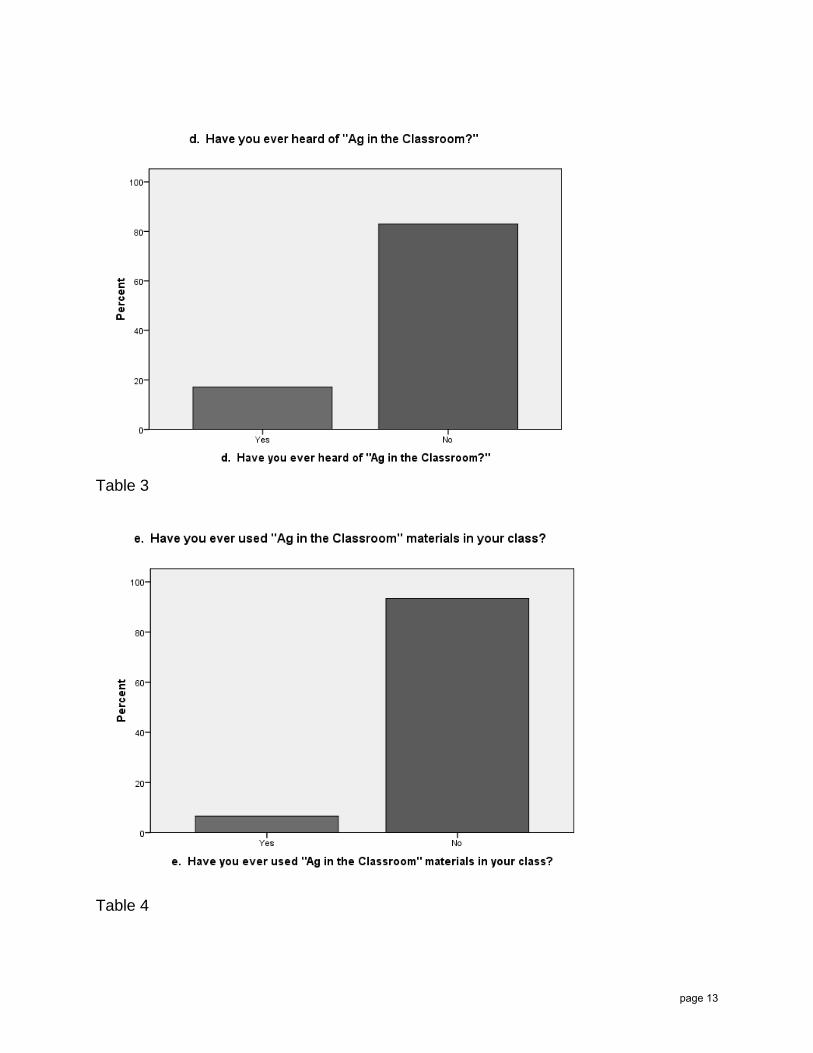
Table 3
Table 4
page 13
Fact Sheet 88-29 UNIVERSITY OF NEVADA
COOPERATIVE EXTENSION A COUNTY‐STATE‐FEDERAL PARTNERSHIP
Matching Hay Quality to Cow Needs
Ron Torell, Northeast Area Livestock Specialist Jason C. Davison, Churchill County Extension Educator
Introduction Feeding range cattle through the winter is the most costly aspect of many livestock operations in northeastern Nevada. However, if hay quality is matched to the nutritional demands of cattle, the purchase of supplements can be reduced and herd production can be increased. This can be accomplished by simply planning the sequence of hay feeding. Improving hay quality through fertilization, water management, species composition and time of harvest may also reduce the cost of winter feeding. A nutritional analysis of 302 grass hay samples harvested from 70 northeastern Nevada ranches between 1946 and 1987 supports the above statements. Critical Months for Nutrition In northern Nevada, January, February and March are nutritionally critical months for the cows that will calve at the beginning of April. Nutritional demands are approximately 10 percent greater during the last third of the pregnancy. Allowing cows to lose excessive condition prior to calving will delay birth the following year. This is due to delayed estrus5.
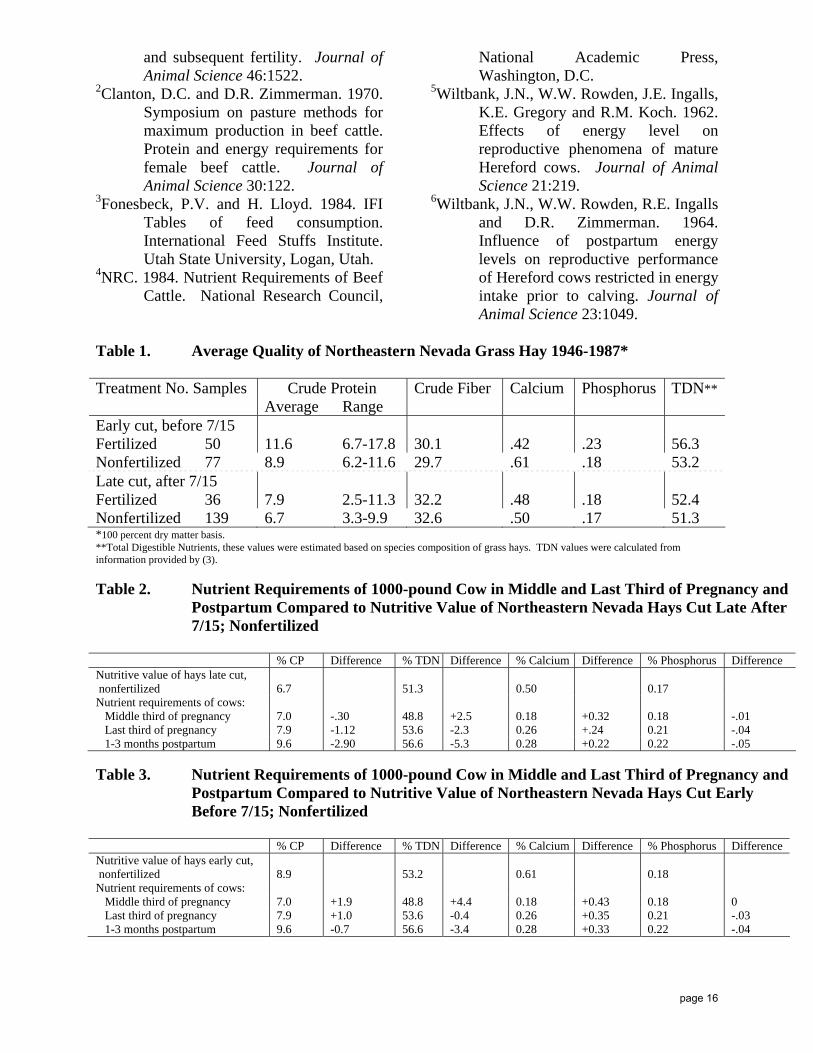
Inadequate nutrition during the three months after calving (April, May and June) is even more detrimental to reproduction the following year. During these three months, nutritional demands are 20 percent higher than pre-calving requirements for cows and 25 percent higher for first-calf heifers. If the nutritional demands of the cows are not met during these critical six months (January through June), conception rates can be greatly reduced or delayed5, 6. The same effect has been demonstrated with bred yearling heifers1, 2. Matching Hay Quality A feeding plan based on the nutritional demands of cattle and quality of feed on hand can easily be developed for hay listed in Table 1. Table 1 allows comparison of the nutritional values of the hay to the nutritional needs of the 1,000-pound cow for nine months (from the middle of pregnancy to three months after calving.) For the purpose of discussion it is assumed that there is an adequate supply of each hay listed.
page 14
Middle Third of Pregnancy The poorest quality hay of the four listed is the late cut, non-fertilized hay (Table 2). Producers should feed this hay during the middle third of pregnancy when the cow’s nutritional demands are low. Late cut hay falls just short of meeting requirements for protein and phosphorous, but meets or exceeds requirements for energy and calcium during the middle term of pregnancy. Last Third of Pregnancy The early cut non-fertilized hay (Table 3) and the late cut, fertilized hay (Table 4) exceed the requirements for a cow in the middle third of pregnancy. The increased nutritional value of these hays will supply adequate nutrition for cows in the last three months of pregnancy when a phosphorous supplement is added. An energy-based supplement may be necessary under conditions of cold stress because the total digestible nutrient (TDN) values for these hays come close to meeting the cow’s minimum energy requirements. First Three Months After Calving The early cut, fertilized hay (Table 5) is the only feed listed that meet all the cow’s requirements following calving. Nutritional demands are the highest during this time because of lactation. Minimize Costly Supplements By efficiently managing the winter feeding program it is possible to meet nutritional demands of the cow herd and minimize supplementation. Hay quality statistics listed in this publication are averages for hays produced on northeastern Nevada ranches during the past 40 years. An average figure can only be used as a guide because nutritional value varies from field to field and from one year to the next. Because of this, testing is essential in order to minimize supplement feed costs. The costs of forage testing are minimal
compared to the costs of most protein and/or energy supplements. Importance of Forage Quantity Cattle require quantities of nutrients not percentages of nutrients. The percentage of nutrients needed to balance the rations discussed in this fact sheet will be incorrect when the amount of hay fed is less or more than the quantity required (depending on the weight and physiological condition of the animal). Cattle can suffer from “hollow belly” when insufficient forage is fed no matter what the forage nutrient density. Generally, an animal’s dry matter intake ranges from 1 to 3 percent of its body weight depending on the forage quality. The higher the forage quality the greater the intake. Also, it is important to remember that environmental conditions often create the need for additional forage intake during winter months. Purchasing Hay Purchasing additional feed based on the quality and quantity of feed on hand can save money. Northern Nevada livestock producers have access to alfalfa hay markets in southern Idaho and northern Nevada. Hay that does not meet dairy industry specifications can be purchased cheaper than processed supplements on the basis of actual protein per pound. A combination of homegrown hay, purchased alfalfa hay and a phosphorous supplement will usually balance the nutritional needs of the cow herd during critical periods of the year. The best way to purchase feed, and balance a ration with feed on hand, is through nutritional chemical analysis and least cost ration formulation. Information Sources 1Bellows, R.W. and R.E. Short. 1978.
Effects of precalving feeding level on birth weight, calving difficulty
page 15
and subsequent fertility. Journal of Animal Science 46:1522.
2Clanton, D.C. and D.R. Zimmerman. 1970. Symposium on pasture methods for maximum production in beef cattle. Protein and energy requirements for female beef cattle. Journal of Animal Science 30:122.
3Fonesbeck, P.V. and H. Lloyd. 1984. IFI Tables of feed consumption. International Feed Stuffs Institute. Utah State University, Logan, Utah.
4NRC. 1984. Nutrient Requirements of Beef Cattle. National Research Council,
National Academic Press, Washington, D.C.
5Wiltbank, J.N., W.W. Rowden, J.E. Ingalls, K.E. Gregory and R.M. Koch. 1962. Effects of energy level on reproductive phenomena of mature Hereford cows. Journal of Animal Science 21:219.
6Wiltbank, J.N., W.W. Rowden, R.E. Ingalls and D.R. Zimmerman. 1964. Influence of postpartum energy levels on reproductive performance of Hereford cows restricted in energy intake prior to calving. Journal of Animal Science 23:1049.
Table 1. Average Quality of Northeastern Nevada Grass Hay 1946-1987*
Crude Protein Treatment No. Samples Average Range
Crude Fiber Calcium Phosphorus TDN**
Early cut, before 7/15 Fertilized 50 11.6 6.7-17.8 30.1 .42 .23 56.3 Nonfertilized 77 8.9 6.2-11.6 29.7 .61 .18 53.2 Late cut, after 7/15 Fertilized 36 7.9 2.5-11.3 32.2 .48 .18 52.4 Nonfertilized 139 6.7 3.3-9.9 32.6 .50 .17 51.3 *100 percent dry matter basis. **Total Digestible Nutrients, these values were estimated based on species composition of grass hays. TDN values were calculated from information provided by (3). Table 2. Nutrient Requirements of 1000-pound Cow in Middle and Last Third of Pregnancy and
Postpartum Compared to Nutritive Value of Northeastern Nevada Hays Cut Late After 7/15; Nonfertilized
% CP Difference % TDN Difference % Calcium Difference % Phosphorus Difference Nutritive value of hays late cut, nonfertilized
6.7
51.3
0.50
0.17
Nutrient requirements of cows: Middle third of pregnancy 7.0 -.30 48.8 +2.5 0.18 +0.32 0.18 -.01 Last third of pregnancy 7.9 -1.12 53.6 -2.3 0.26 +.24 0.21 -.04 1-3 months postpartum 9.6 -2.90 56.6 -5.3 0.28 +0.22 0.22 -.05 Table 3. Nutrient Requirements of 1000-pound Cow in Middle and Last Third of Pregnancy and
Postpartum Compared to Nutritive Value of Northeastern Nevada Hays Cut Early Before 7/15; Nonfertilized
% CP Difference % TDN Difference % Calcium Difference % Phosphorus Difference Nutritive value of hays early cut, nonfertilized
8.9
53.2
0.61
0.18
Nutrient requirements of cows: Middle third of pregnancy 7.0 +1.9 48.8 +4.4 0.18 +0.43 0.18 0 Last third of pregnancy 7.9 +1.0 53.6 -0.4 0.26 +0.35 0.21 -.03 1-3 months postpartum 9.6 -0.7 56.6 -3.4 0.28 +0.33 0.22 -.04
page 16
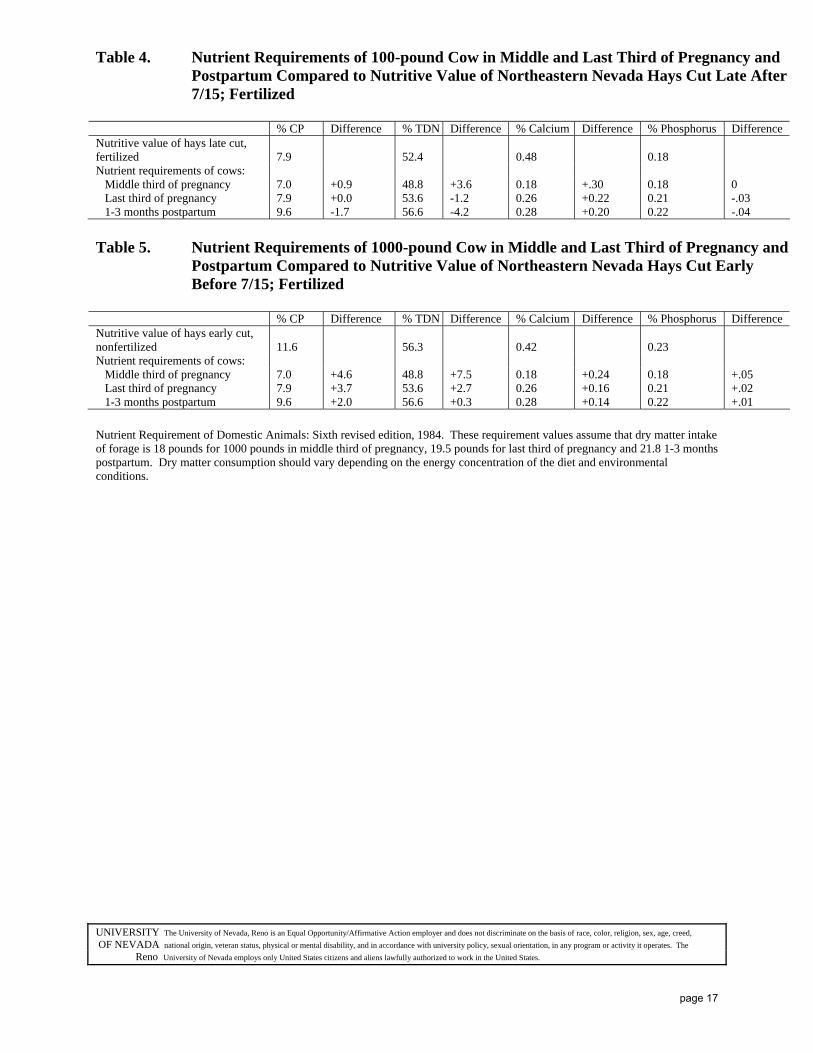
Table 4. Nutrient Requirements of 100-pound Cow in Middle and Last Third of Pregnancy and Postpartum Compared to Nutritive Value of Northeastern Nevada Hays Cut Late After 7/15; Fertilized
% CP Difference % TDN Difference % Calcium Difference % Phosphorus Difference Nutritive value of hays late cut, fertilized
7.9
52.4
0.48
0.18
Nutrient requirements of cows: Middle third of pregnancy 7.0 +0.9 48.8 +3.6 0.18 +.30 0.18 0 Last third of pregnancy 7.9 +0.0 53.6 -1.2 0.26 +0.22 0.21 -.03 1-3 months postpartum 9.6 -1.7 56.6 -4.2 0.28 +0.20 0.22 -.04 Table 5. Nutrient Requirements of 1000-pound Cow in Middle and Last Third of Pregnancy and
Postpartum Compared to Nutritive Value of Northeastern Nevada Hays Cut Early Before 7/15; Fertilized
% CP Difference % TDN Difference % Calcium Difference % Phosphorus Difference Nutritive value of hays early cut, nonfertilized
11.6
56.3
0.42
0.23
Nutrient requirements of cows: Middle third of pregnancy 7.0 +4.6 48.8 +7.5 0.18 +0.24 0.18 +.05 Last third of pregnancy 7.9 +3.7 53.6 +2.7 0.26 +0.16 0.21 +.02 1-3 months postpartum 9.6 +2.0 56.6 +0.3 0.28 +0.14 0.22 +.01 Nutrient Requirement of Domestic Animals: Sixth revised edition, 1984. These requirement values assume that dry matter intake of forage is 18 pounds for 1000 pounds in middle third of pregnancy, 19.5 pounds for last third of pregnancy and 21.8 1-3 months postpartum. Dry matter consumption should vary depending on the energy concentration of the diet and environmental conditions. UNIVERSITY The University of Nevada, Reno is an Equal Opportunity/Affirmative Action employer and does not discriminate on the basis of race, color, religion, sex, age, creed, OF NEVADA national origin, veteran status, physical or mental disability, and in accordance with university policy, sexual orientation, in any program or activity it operates. The Reno University of Nevada employs only United States citizens and aliens lawfully authorized to work in the United States.
page 17
Mineral Supplementation: A Necessary Input Cost Ron Torell, University of Nevada Cooperative Extension Livestock Specialist
The primary production question over my desk this fall deals with areas where input costs can be cut without economically sacrificing production. Many cattlepersons are considering cutting out the complete mineral package from their beef cow management program. Complete mineral packages that were priced at $600 per ton just one year ago are now fetching twice that. What once cost $20 per pair to annually supplement is now costing $40. “Grandpa got by feeding just plain white salt so why shouldn’t we go back to that? We have to cut somewhere.”
Herd health and vaccination programs are always at the top of the management list and generally receive most of the attention. But mineral nutrition has an important role in herd health as well. Heifers and cows need special attention through the fall and winter to ensure a healthy calf crop and better breed back next spring. Calves need minerals so their immune system will mount a response to expensive vaccines. Additionally, calves need minerals to help over come the stresses of weaning and shipping. Montana Extension beef specialist John Paterson offers the following advice relative to mineral supplementation.
Minerals for Calves�. Proper calf-hood vaccinations and mineral nutrition at the
ranch go hand in hand. Paterson often cites a Colorado study that showed among calves that were preconditioned, about one-third were still getting sick at the feedlot. Paterson attributes that to poor mineral supplementation. Specifically he states, “The reason we often see sickness in feedlots is probably due to lack of mineral management starting in the cowherd. Trace minerals can have a significant carryover effect on feedlot performance and health of calves.”
Thus, he says mineral supplementation is an important focus at the cow/calf level to
enhance fertility, fetal development and the calf’s future disease resistance. Paterson adds, “A nutrition program is important from conception through the feed yard so the animal’s genetics can be fully expressed. For trace minerals, copper, zinc and phosphorus are the big three. During drought Vitamins A, D, and E may also need to be supplemented.”
Because some of these minerals can have secondary interactions that limit nutrient uptake or interact with soil micronutrients that cause toxicity. Paterson advises working with a nutritionist to develop a balanced nutrition program that optimizes production.
He adds, “Trace minerals by themselves won’t cure all morbidity problems. Producers still need to consider vaccination programs, genetics, and environmental factors as well. Additionally, parasites can be a factor that suppress appetite and the immune system, so be certain parasite control is part of the health program at the ranch.”
Cows’ Needs�. For cows and heifers, minerals play a key role in enhancing fertility. Although beef cows only require 3 to 4 ounces of trace minerals in their daily diet, that little bit of supplement helps ensure proper nutrition so that cows will rebreed and produce a healthy calf every 365 days.
Paterson states, “The availability of free choice minerals is especially critical in the
page 18
three months leading up to calving and then immediately after calving, when the cow has increased energy and protein requirements.
For instance, a spring calving cow’s phosphorus and calcium requirements are high during the winter due to fetal development. Zinc and copper have also been shown to be an important part of the cow’s diet just prior to and after calving. Thus, trace minerals are especially important during the last 90 days before calving and then through the breeding season. Providing trace minerals prior to weaning can also help produce a better immune response and weaning weights among calves.”
Paterson suggests that to provide minerals cost-effectively and to the best benefit of the cow-calf pair, mineral supplements need to be utilized in a well-balanced program that matches the forage base, which varies in nutritional content during the growing season. Thus, an occasional forage analysis should be conducted on your ranch for the major minerals, calcium, phosphorus and magnesium, and the trace minerals, copper, zinc, sulfur and manganese. Getting a water quality analysis is also a good idea.
Phosphorus, the primary reason mineral supplementation has recently increased in cost, will likely be the primary mineral needed because it’s content in forages varies greatly during the year. For example, a higher phosphorus mineral is needed in the winter because phosphorus is generally lower in dried winter forages. Paterson also suggests including a vitamin supplement because forages are often deficient in Vitamins A and E.
There is much research available supporting Patterson’s view on mineral supplementation. Additionally, in my travels as Nevada livestock specialist, I have seen a huge difference in production and economic survivability when comparing those operations that have a sound mineral program and those who do not. It is for these reasons that I advocate, as the title of this article states, mineral supplementation is a necessary input.
An interesting question was posed in the opening paragraph of this article, “Grandpa got by feeding just plain white salt so why shouldn’t we go back to that? We have to cut somewhere.” In answer to that question I offer the following. We live and manage our cattle in a different time than when our grandfathers ranched. We have a different cow genetically than what our grandfathers raised. Through research we have a better understanding of the ruminant animal and how nutrition, reproduction, genetics and minerals interact. During our grandfathers time a 70 to 80 percent calf crop with weaning weights of 350 pounds were normal. Can you live with those production levels in today’s economic environment?
As a side bar to this article Dr. Ben Bruce, University of Nevada Cooperative Extension beef specialist discusses the interactions of minerals, methods of feeding minerals to minimize waste and how mineral supplementation can be optimized through feeding by-product feeds.
Portions of this article reprinted with permission from Prime Cuts, August 2008.
Side Bar: Mineral Interaction by Dr. Ben Bruce University of Nevada Cooperative Extension Livestock Specialist. There is nothing more vexing than trying to figure out a mineral problem. If you look at the diagram below you will see a chart showing the interactions between minerals. There
page 19
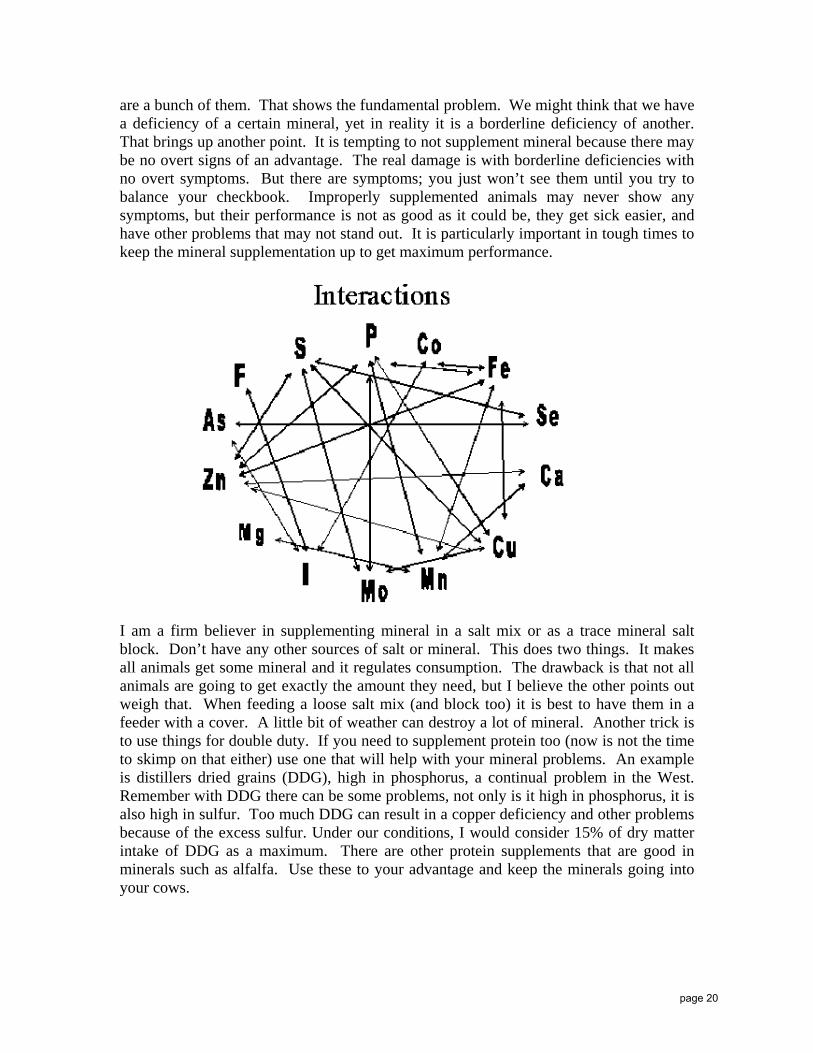
are a bunch of them. That shows the fundamental problem. We might think that we have a deficiency of a certain mineral, yet in reality it is a borderline deficiency of another. That brings up another point. It is tempting to not supplement mineral because there may be no overt signs of an advantage. The real damage is with borderline deficiencies with no overt symptoms. But there are symptoms; you just won’t see them until you try to balance your checkbook. Improperly supplemented animals may never show any symptoms, but their performance is not as good as it could be, they get sick easier, and have other problems that may not stand out. It is particularly important in tough times to keep the mineral supplementation up to get maximum performance.
I am a firm believer in supplementing mineral in a salt mix or as a trace mineral salt block. Don’t have any other sources of salt or mineral. This does two things. It makes all animals get some mineral and it regulates consumption. The drawback is that not all animals are going to get exactly the amount they need, but I believe the other points out weigh that. When feeding a loose salt mix (and block too) it is best to have them in a feeder with a cover. A little bit of weather can destroy a lot of mineral. Another trick is to use things for double duty. If you need to supplement protein too (now is not the time to skimp on that either) use one that will help with your mineral problems. An example is distillers dried grains (DDG), high in phosphorus, a continual problem in the West. Remember with DDG there can be some problems, not only is it high in phosphorus, it is also high in sulfur. Too much DDG can result in a copper deficiency and other problems because of the excess sulfur. Under our conditions, I would consider 15% of dry matter intake of DDG as a maximum. There are other protein supplements that are good in minerals such as alfalfa. Use these to your advantage and keep the minerals going into your cows.
page 20
To find more resources for your business, home, or family, visit the College of Agriculture and Home Economics on the World Wide Web at www.cahe.nmsu.edu
Minimizing Weaning Stress on CalvesGuide B-221
Clay P. Mathis and Boone Carter1
Cooperative Extension Service • College of Agriculture and Home Economics
This publication is scheduled to be updated and reissued 6/13.
1 Extension Livestock Specialist and Extension Associate, respectively, Department of Extension Animal Sciences and Natural Resources, New Mexico State University, Las Cruces.
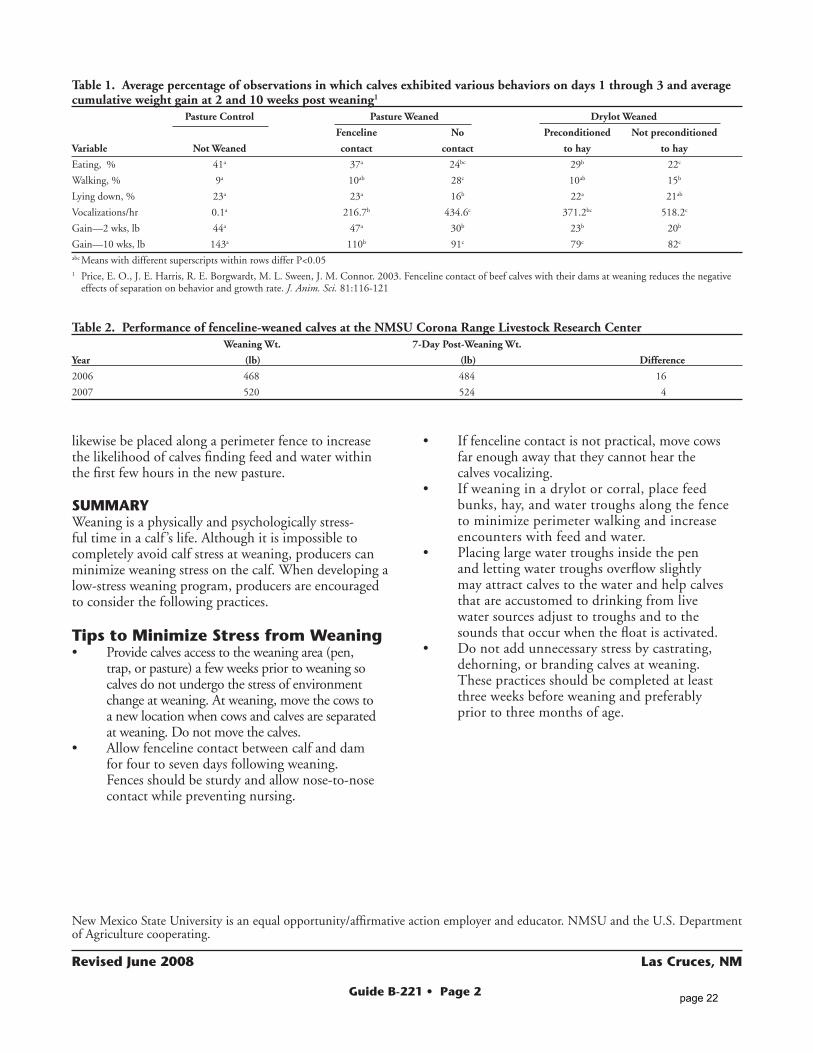
low-stress weaning approach successfully. In 2006 and 2007, beef calves at the NMSU Corona Range Livestock Research Center were fenceline weaned for seven days. Other than the challenges associated with keeping cows and calves separated by marginal fencing, the NMSU fenceline weaning experience was positive. During both years, calves gained weight during the seven-day fenceline weaning period (Table 2), and outward signs of stress were minimal.
Allowing fenceline contact between calves and their dams for four to seven days after weaning can lessen stress and minimize post-weaning performance decline. However, it may not always be possible to fenceline wean calves. In situations where fenceline weaning is impossible or impractical, cost-effectively minimizing stress is still important.
EnvironMEntal tranSitionWhether fenceline weaned or weaned by traditional methods, most calves are eventually transitioned from pasture forage to the textures, consistencies, and flavors of grain-based rations, and are adapted to feeding from a bunk and drinking from troughs. At the same time, calves must habituate to sounds and sights of tractors, feeders, and humans. In addition to the nutritional chal-lenges of dietary change, the new environment can cause a great deal of stress to calves.
The two key elements of environmental transition are acclimatizing calves to a new water source and training them to eat from a feed bunk. When introduced to a new environment, newly weaned calves tend to spend a significant proportion of their time walking the pe-rimeter of the pen or pasture, exploring its limits and searching for their dams. When calves are weaned into a small trap or drylot, managers can capitalize on this tendency by placing feed and water troughs along the fence to decrease unnecessary energy use by perimeter walking. If calves are weaned into a large pasture, it is recommended that, where it is practical, water and feed
Weaning is one of the most stressful events in a calf ’s life. Two primary stressors affect calves at weaning: social separation from their mothers and moving to a new environment where they must develop new feeding and watering skills and habituate to new surroundings. Management practices that minimize stress by making this transition less abrupt can improve calf health and weight gain. Facilities, labor, and feed resources should be considered when deciding which weaning protocol is most likely to minimize stress on calves while still pre-paring them for the next stage of production.
SoCial tranSitionPrior to weaning, calves rely on their mothers as a source of food and social direction. At weaning calves must transition into a new social structure within a group of their peers. That transition can be a major source of stress.
California researchers conducted a three-year study that compared behavior and post-weaning performance of calves that were 1) not weaned, 2) fenceline weaned, 3) abruptly weaned on pasture, 4) abruptly weaned in a drylot without being preconditioned to hay, or 5) abruptly weaned in a drylot after being preconditioned to hay. Calves in the fenceline-weaned treatment were allowed nose-to-nose contact with their dams for seven days, but were prevented from nursing by a separating fence. Re-sults of the study indicated that, aside from vocalization, fenceline-weaned calves exhibited similar behavior to non-weaned control calves, and the fenceline-weaned calves spent more time eating than did calves weaned according to other methods (Table 1). Seven days after weaning, all calves in the study were managed together. Fenceline-weaned calves gained at least 50% more weight during the first two weeks after weaning than calves weaned according to the other methods, and retained the weight advantage through at least 10 weeks post-weaning.
In the Southwest, fenceline weaning is not practical on all ranches. However, some ranches have employed this
page 21
Guide B-221 • Page 2
likewise be placed along a perimeter fence to increase the likelihood of calves finding feed and water within the first few hours in the new pasture.
SuMMaryWeaning is a physically and psychologically stress-ful time in a calf ’s life. Although it is impossible to completely avoid calf stress at weaning, producers can minimize weaning stress on the calf. When developing a low-stress weaning program, producers are encouraged to consider the following practices.
tips to Minimize Stress from Weaning• Provide calves access to the weaning area (pen,
trap, or pasture) a few weeks prior to weaning so calves do not undergo the stress of environment change at weaning. At weaning, move the cows to a new location when cows and calves are separated at weaning. Do not move the calves.
• Allow fenceline contact between calf and dam for four to seven days following weaning. Fences should be sturdy and allow nose-to-nose contact while preventing nursing.
New Mexico State University is an equal opportunity/affirmative action employer and educator. NMSU and the U.S. Department of Agriculture cooperating.
revised June 2008 las Cruces, nM
• If fenceline contact is not practical, move cows far enough away that they cannot hear the calves vocalizing.
• If weaning in a drylot or corral, place feed bunks, hay, and water troughs along the fence to minimize perimeter walking and increase encounters with feed and water.
• Placing large water troughs inside the pen and letting water troughs overflow slightly may attract calves to the water and help calves that are accustomed to drinking from live water sources adjust to troughs and to the sounds that occur when the float is activated.
• Do not add unnecessary stress by castrating, dehorning, or branding calves at weaning. These practices should be completed at least three weeks before weaning and preferably prior to three months of age.
Table 1. Average percentage of observations in which calves exhibited various behaviors on days 1 through 3 and average cumulative weight gain at 2 and 10 weeks post weaning1 Pasture Control Pasture Weaned Drylot Weaned
Fenceline No Preconditioned Not preconditioned
Variable Not Weaned contact contact to hay to hay
Eating, % 41a 37a 24bc 29b 22c
Walking, % 9a 10ab 28c 10ab 15b
Lying down, % 23a 23a 16b 22a 21ab
Vocalizations/hr 0.1a 216.7b 434.6c 371.2bc 518.2c
Gain—2 wks, lb 44a 47a 30b 23b 20b
Gain—10 wks, lb 143a 110b 91c 79c 82c
abc Means with different superscripts within rows differ P<0.051 Price, E. O., J. E. Harris, R. E. Borgwardt, M. L. Sween, J. M. Connor. 2003. Fenceline contact of beef calves with their dams at weaning reduces the negative
effects of separation on behavior and growth rate. J. Anim. Sci. 81:116-121
Table 2. Performance of fenceline-weaned calves at the NMSU Corona Range Livestock Research Center Weaning Wt. 7-Day Post-Weaning Wt.
Year (lb) (lb) Difference
2006 468 484 16
2007 520 524 4
page 22
Western Beef Resource Committee
Cattle Producer’s LibraryNutrition Section CL309
309-1
“You can’t starve the profit out of a cow!” Manyroughage feeds fall short of meeting the nutrient re-quirements of a mature cow or replacement heifer intheir last trimester of pregnancy and 3 to 4 monthspostpartum. Protein and/or energy supplementation isessential during this period to help ensure conception ofthe cow or heifer while producing heavy calves atweaning. Comparing products on a cost per pound ofnutrient basis can simplify choosing an economicalprotein or energy supplement.
Additionally, feeds frequently differ in water (mois-ture) content. Because moisture content directly affectsnutrient concentration and dollar value per ton, a pro-ducer must correct for moisture in order to properlycompare feeds when buying and selling. This fact sheetexplains how to go “supplement shopping” with a least-cost ration formulation in mind.
Moisture and Dry Matter Content“Percentage of moisture” is a term used to express the
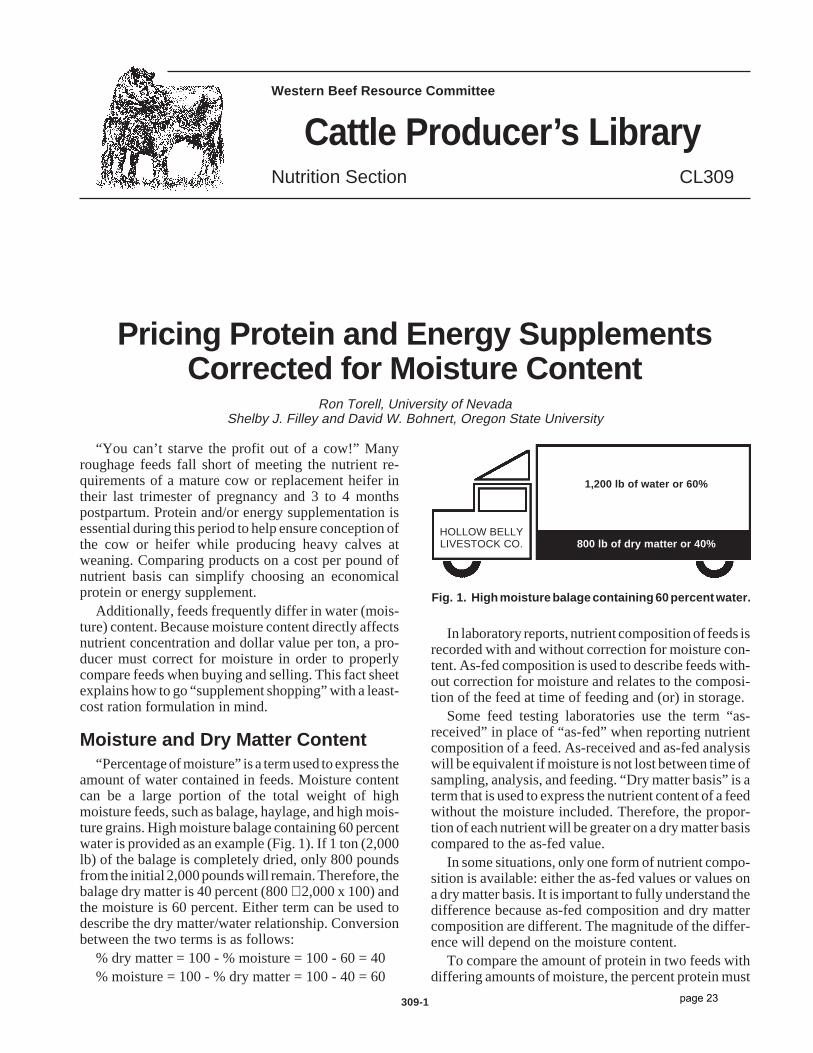
amount of water contained in feeds. Moisture contentcan be a large portion of the total weight of highmoisture feeds, such as balage, haylage, and high mois-ture grains. High moisture balage containing 60 percentwater is provided as an example (Fig. 1). If 1 ton (2,000lb) of the balage is completely dried, only 800 poundsfrom the initial 2,000 pounds will remain. Therefore, thebalage dry matter is 40 percent (800 ÷ 2,000 x 100) andthe moisture is 60 percent. Either term can be used todescribe the dry matter/water relationship. Conversionbetween the two terms is as follows:
% dry matter = 100 - % moisture = 100 - 60 = 40% moisture = 100 - % dry matter = 100 - 40 = 60
In laboratory reports, nutrient composition of feeds isrecorded with and without correction for moisture con-tent. As-fed composition is used to describe feeds with-out correction for moisture and relates to the composi-tion of the feed at time of feeding and (or) in storage.
Some feed testing laboratories use the term “as-received” in place of “as-fed” when reporting nutrientcomposition of a feed. As-received and as-fed analysiswill be equivalent if moisture is not lost between time ofsampling, analysis, and feeding. “Dry matter basis” is aterm that is used to express the nutrient content of a feedwithout the moisture included. Therefore, the propor-tion of each nutrient will be greater on a dry matter basiscompared to the as-fed value.
In some situations, only one form of nutrient compo-sition is available: either the as-fed values or values ona dry matter basis. It is important to fully understand thedifference because as-fed composition and dry mattercomposition are different. The magnitude of the differ-ence will depend on the moisture content.
To compare the amount of protein in two feeds withdiffering amounts of moisture, the percent protein must
Pricing Protein and Energy SupplementsCorrected for Moisture Content
Ron Torell, University of NevadaShelby J. Filley and David W. Bohnert, Oregon State University
Fig. 1. High moisture balage containing 60 percent water.
1,200 lb of water or 60%
HOLLOW BELLYLIVESTOCK CO. 800 lb of dry matter or 40%
page 23
309-2
be expressed on a dry matter basis. For example, on anas-fed basis Alfalfa Hay A is 87 percent dry matter and17 percent crude protein and Alfalfa Hay B is 92 percentdry matter and 17 percent crude protein. The equationson the next page are used to convert protein on an as-fedbasis to a dry matter basis so the two hays can becompared directly.
Hay A: 17 x 100 = 19.54% protein on a87 DM basis
Hay B: 17 x 100 = 18.48% protein on a92 DM basis
Pricing MethodSupplements should not be compared by cost per ton
of the total feed, as this can be misleading. Rather,supplements should be compared on cost per pound ofactual nutrients needed. When nutrient shopping, youare normally interested in protein and/or energy. Min-eral requirements can be met with less expense using afree choice salt/mineral program and water require-ments can be met cheapest by a visit to the water trough.Also, producers may be paying high prices for ingredi-ents used as fillers. When comparing supplements forspecific nutrients, the following guidelines assist indetermining the best buy:
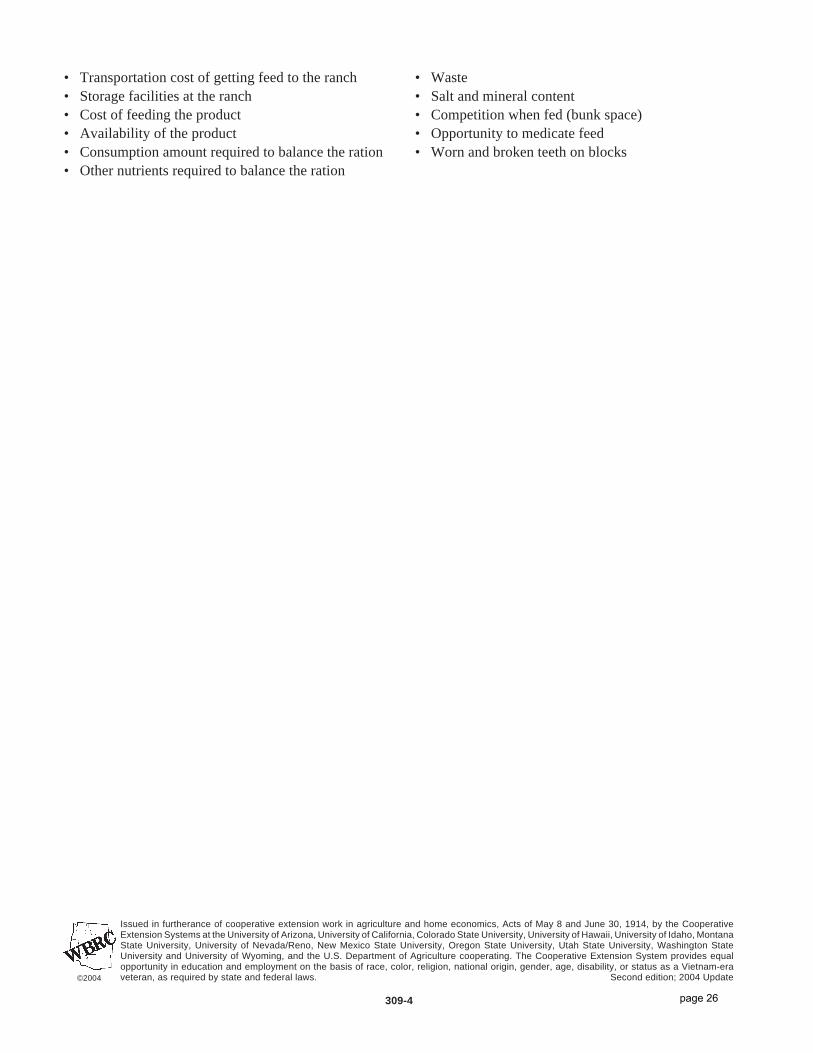
Step 1.Determine the total pounds of dry mater of thefeeds to be compared. Do this by multiplying2,000 pounds by the percentage of dry matercontained in the feed as determined by labora-tory analysis. As an example let’s use Alfalfa Ain the earlier example. The hay is 87 percent drymatter. Multiply 2,000 pounds of as-fed hay by87 percent (0.87) dry mater content, which re-sults in 1,740 pounds of actual dry matter (Fig. 2).
Step 2.Determine the total pounds of a nutrient in those1,740 pounds of dry matter. Do this by multiply-ing 1,740 pounds by the percent of the nutrient(on a DM basis) contained in that feed. For thisexample, Alfalfa A is 19.55 percent crude pro-tein on a dry matter basis. Multiply 1,740 poundsof dry matter x .1955 (19.55% crude protein) =340 pounds of crude protein. This leaves 1,660pounds of water, other nutrients, and filler con-tained in 1 one ton of as-fed feed (2,000 pounds
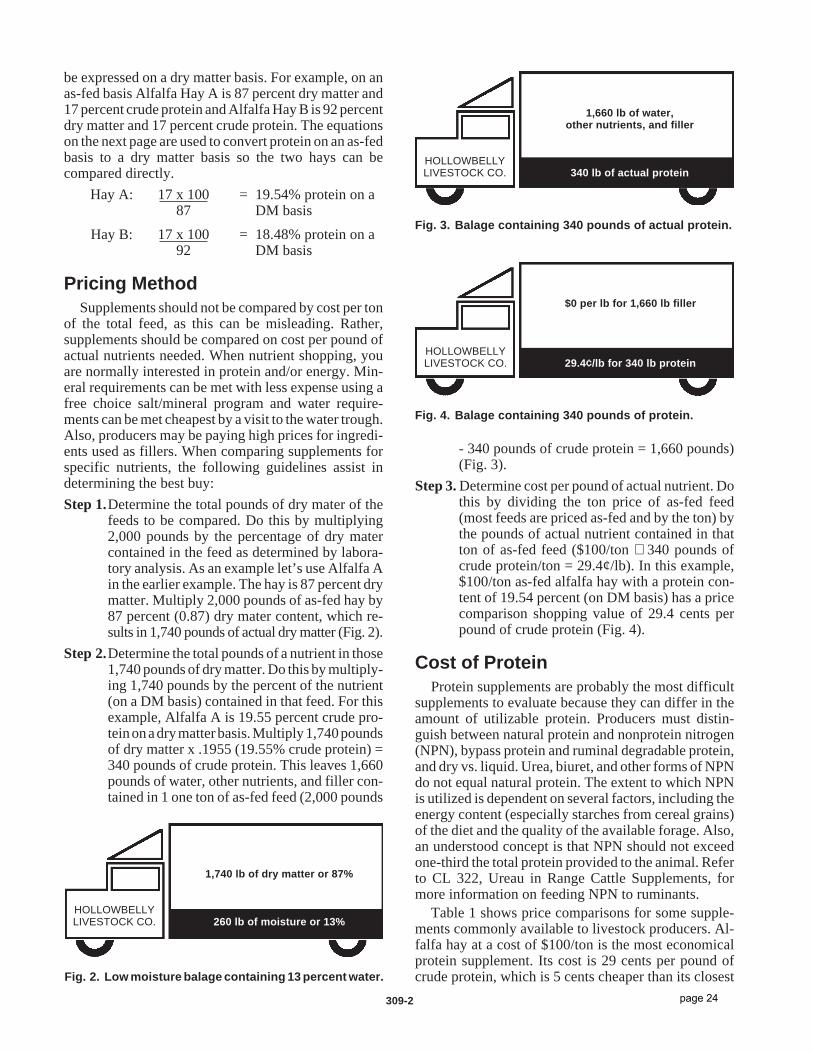
- 340 pounds of crude protein = 1,660 pounds)(Fig. 3).
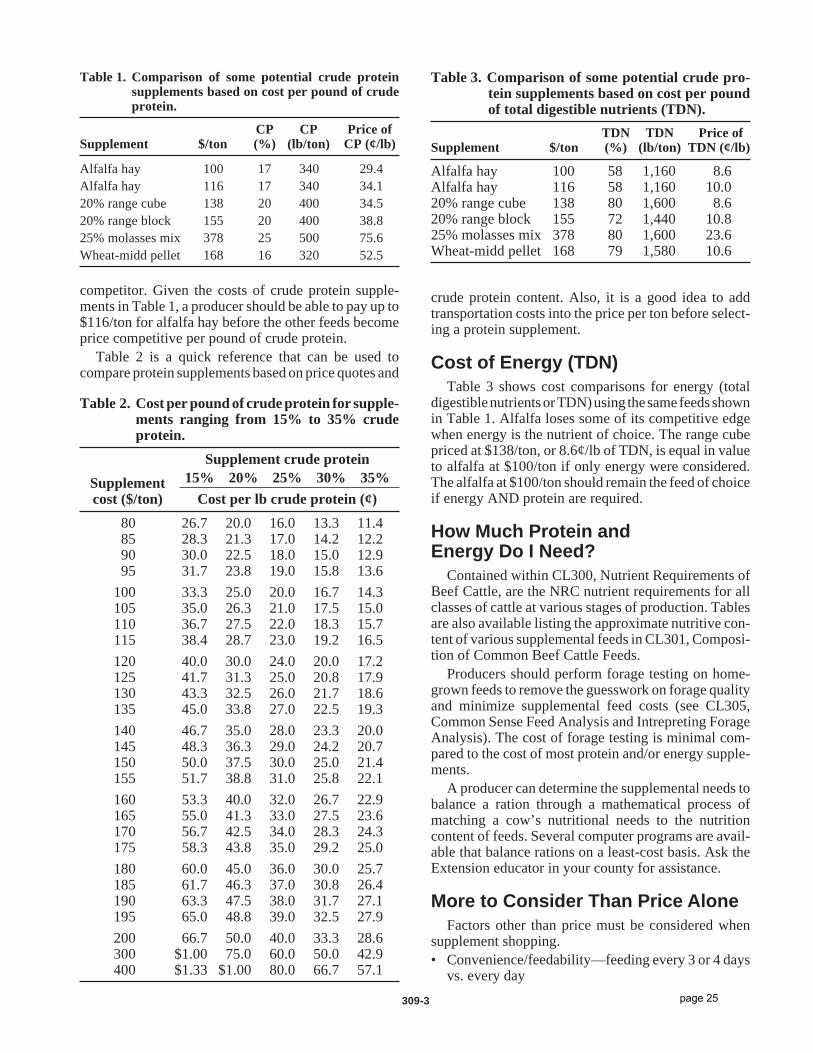
Step 3. Determine cost per pound of actual nutrient. Dothis by dividing the ton price of as-fed feed(most feeds are priced as-fed and by the ton) bythe pounds of actual nutrient contained in thatton of as-fed feed ($100/ton ÷ 340 pounds ofcrude protein/ton = 29.4¢/lb). In this example,$100/ton as-fed alfalfa hay with a protein con-tent of 19.54 percent (on DM basis) has a pricecomparison shopping value of 29.4 cents perpound of crude protein (Fig. 4).
Cost of ProteinProtein supplements are probably the most difficult
supplements to evaluate because they can differ in theamount of utilizable protein. Producers must distin-guish between natural protein and nonprotein nitrogen(NPN), bypass protein and ruminal degradable protein,and dry vs. liquid. Urea, biuret, and other forms of NPNdo not equal natural protein. The extent to which NPNis utilized is dependent on several factors, including theenergy content (especially starches from cereal grains)of the diet and the quality of the available forage. Also,an understood concept is that NPN should not exceedone-third the total protein provided to the animal. Referto CL 322, Ureau in Range Cattle Supplements, formore information on feeding NPN to ruminants.
Table 1 shows price comparisons for some supple-ments commonly available to livestock producers. Al-falfa hay at a cost of $100/ton is the most economicalprotein supplement. Its cost is 29 cents per pound ofcrude protein, which is 5 cents cheaper than its closestFig. 2. Low moisture balage containing 13 percent water.
1,740 lb of dry matter or 87%
HOLLOWBELLYLIVESTOCK CO. 260 lb of moisture or 13%
Fig. 3. Balage containing 340 pounds of actual protein.
1,660 lb of water,other nutrients, and filler
HOLLOWBELLYLIVESTOCK CO. 340 lb of actual protein
Fig. 4. Balage containing 340 pounds of protein.
$0 per lb for 1,660 lb filler
HOLLOWBELLYLIVESTOCK CO. 29.4¢/lb for 340 lb protein
page 24
competitor. Given the costs of crude protein supple-ments in Table 1, a producer should be able to pay up to$116/ton for alfalfa hay before the other feeds becomeprice competitive per pound of crude protein.
Table 2 is a quick reference that can be used tocompare protein supplements based on price quotes and
Table 1. Comparison of some potential crude proteinsupplements based on cost per pound of crudeprotein.
CP CP Price ofSupplement $/ton (%) (lb/ton) CP (¢/lb)
Alfalfa hay 100 17 340 29.4Alfalfa hay 116 17 340 34.120% range cube 138 20 400 34.520% range block 155 20 400 38.825% molasses mix 378 25 500 75.6Wheat-midd pellet 168 16 320 52.5
Table 2. Cost per pound of crude protein for supple-ments ranging from 15% to 35% crudeprotein.
Supplement crude protein
Supplement 15% 20% 25% 30% 35%
cost ($/ton) Cost per lb crude protein (¢)
80 26.7 20.0 16.0 13.3 11.485 28.3 21.3 17.0 14.2 12.290 30.0 22.5 18.0 15.0 12.995 31.7 23.8 19.0 15.8 13.6
100 33.3 25.0 20.0 16.7 14.3105 35.0 26.3 21.0 17.5 15.0110 36.7 27.5 22.0 18.3 15.7115 38.4 28.7 23.0 19.2 16.5
120 40.0 30.0 24.0 20.0 17.2125 41.7 31.3 25.0 20.8 17.9130 43.3 32.5 26.0 21.7 18.6135 45.0 33.8 27.0 22.5 19.3
140 46.7 35.0 28.0 23.3 20.0145 48.3 36.3 29.0 24.2 20.7150 50.0 37.5 30.0 25.0 21.4155 51.7 38.8 31.0 25.8 22.1
160 53.3 40.0 32.0 26.7 22.9165 55.0 41.3 33.0 27.5 23.6170 56.7 42.5 34.0 28.3 24.3175 58.3 43.8 35.0 29.2 25.0
180 60.0 45.0 36.0 30.0 25.7185 61.7 46.3 37.0 30.8 26.4190 63.3 47.5 38.0 31.7 27.1195 65.0 48.8 39.0 32.5 27.9
200 66.7 50.0 40.0 33.3 28.6300 $1.00 75.0 60.0 50.0 42.9400 $1.33 $1.00 80.0 66.7 57.1
Table 3. Comparison of some potential crude pro-tein supplements based on cost per poundof total digestible nutrients (TDN).
TDN TDN Price ofSupplement $/ton (%) (lb/ton) TDN (¢/lb)
Alfalfa hay 100 58 1,160 8.6Alfalfa hay 116 58 1,160 10.020% range cube 138 80 1,600 8.620% range block 155 72 1,440 10.825% molasses mix 378 80 1,600 23.6Wheat-midd pellet 168 79 1,580 10.6
crude protein content. Also, it is a good idea to addtransportation costs into the price per ton before select-ing a protein supplement.
Cost of Energy (TDN)Table 3 shows cost comparisons for energy (total
digestible nutrients or TDN) using the same feeds shownin Table 1. Alfalfa loses some of its competitive edgewhen energy is the nutrient of choice. The range cubepriced at $138/ton, or 8.6¢/lb of TDN, is equal in valueto alfalfa at $100/ton if only energy were considered.The alfalfa at $100/ton should remain the feed of choiceif energy AND protein are required.
How Much Protein andEnergy Do I Need?
Contained within CL300, Nutrient Requirements ofBeef Cattle, are the NRC nutrient requirements for allclasses of cattle at various stages of production. Tablesare also available listing the approximate nutritive con-tent of various supplemental feeds in CL301, Composi-tion of Common Beef Cattle Feeds.
Producers should perform forage testing on home-grown feeds to remove the guesswork on forage qualityand minimize supplemental feed costs (see CL305,Common Sense Feed Analysis and Intrepreting ForageAnalysis). The cost of forage testing is minimal com-pared to the cost of most protein and/or energy supple-ments.
A producer can determine the supplemental needs tobalance a ration through a mathematical process ofmatching a cow’s nutritional needs to the nutritioncontent of feeds. Several computer programs are avail-able that balance rations on a least-cost basis. Ask theExtension educator in your county for assistance.
More to Consider Than Price AloneFactors other than price must be considered when
supplement shopping.• Convenience/feedability—feeding every 3 or 4 days
vs. every day
309-3 page 25
309-4
Issued in furtherance of cooperative extension work in agriculture and home economics, Acts of May 8 and June 30, 1914, by the CooperativeExtension Systems at the University of Arizona, University of California, Colorado State University, University of Hawaii, University of Idaho, MontanaState University, University of Nevada/Reno, New Mexico State University, Oregon State University, Utah State University, Washington StateUniversity and University of Wyoming, and the U.S. Department of Agriculture cooperating. The Cooperative Extension System provides equalopportunity in education and employment on the basis of race, color, religion, national origin, gender, age, disability, or status as a Vietnam-eraveteran, as required by state and federal laws. Second edition; 2004 Update©2004
• Transportation cost of getting feed to the ranch• Storage facilities at the ranch• Cost of feeding the product• Availability of the product• Consumption amount required to balance the ration• Other nutrients required to balance the ration
• Waste• Salt and mineral content• Competition when fed (bunk space)• Opportunity to medicate feed• Worn and broken teeth on blocks
page 26
Pricing Hay (What is it worth?)
Steve Foster, University of Nevada Cooperative Extension Educator, Pershing County Gary McCuin, University of Nevada Cooperative Extension Educator, Eureka County
Ron Torell, University of Nevada Cooperative Extension Livestock Specialist Whether you are selling, purchasing or feeding hay it is important to know what you are
dealing with. The best and most appropriate way to accomplish this is to compare price per pound of nutrient, not price per ton of feed. This is when an accurate forage/hay sample and analysis will earn/save you valuable dollars.
Feeds should not be compared by cost per ton, as this is very misleading. When nutrient
shopping, you are normally interested in protein and/or energy. So when you are comparing feeds for specific nutrients, the following guidelines assist in determining the best buy. Don’t get caught paying high prices for ingredients used as fillers.
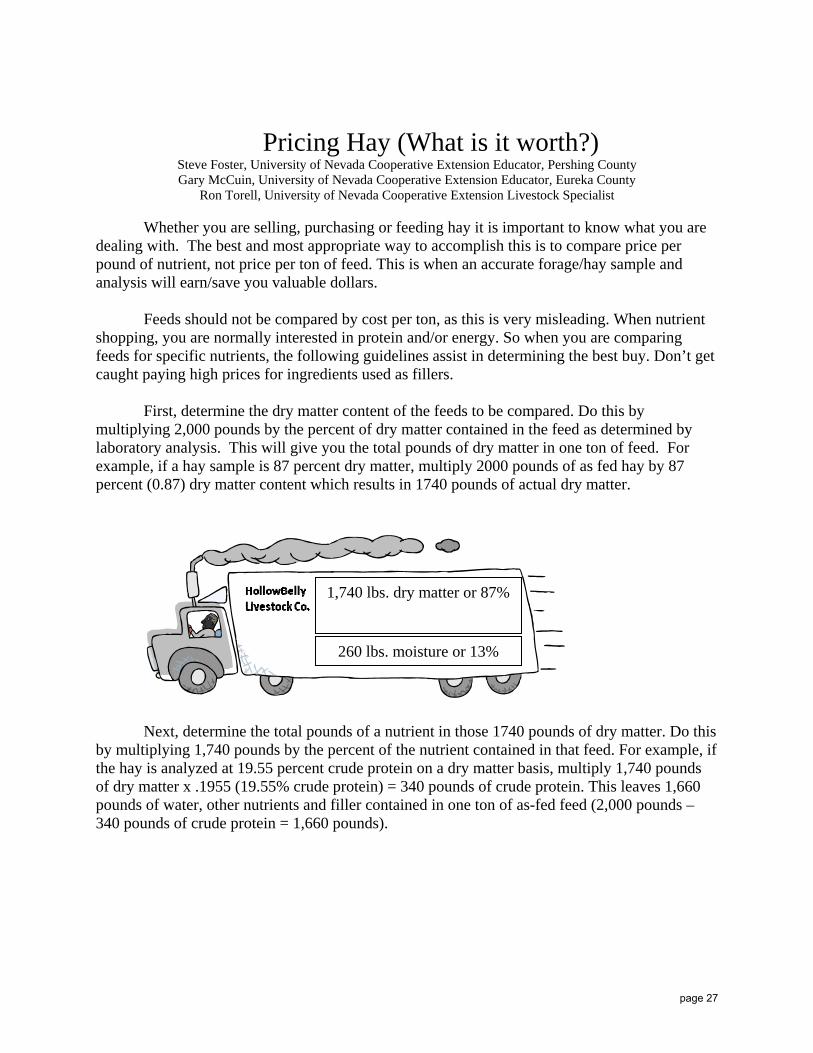
First, determine the dry matter content of the feeds to be compared. Do this by multiplying 2,000 pounds by the percent of dry matter contained in the feed as determined by laboratory analysis. This will give you the total pounds of dry matter in one ton of feed. For example, if a hay sample is 87 percent dry matter, multiply 2000 pounds of as fed hay by 87 percent (0.87) dry matter content which results in 1740 pounds of actual dry matter.
1,740 lbs. dry matter or 87%
260 lbs. moisture or 13%
Next, determine the total pounds of a nutrient in those 1740 pounds of dry matter. Do this
by multiplying 1,740 pounds by the percent of the nutrient contained in that feed. For example, if the hay is analyzed at 19.55 percent crude protein on a dry matter basis, multiply 1,740 pounds of dry matter x .1955 (19.55% crude protein) = 340 pounds of crude protein. This leaves 1,660 pounds of water, other nutrients and filler contained in one ton of as-fed feed (2,000 pounds – 340 pounds of crude protein = 1,660 pounds).
page 27
1,660 lbs. of water, other nutrients and filler
340 lbs. of actual protein
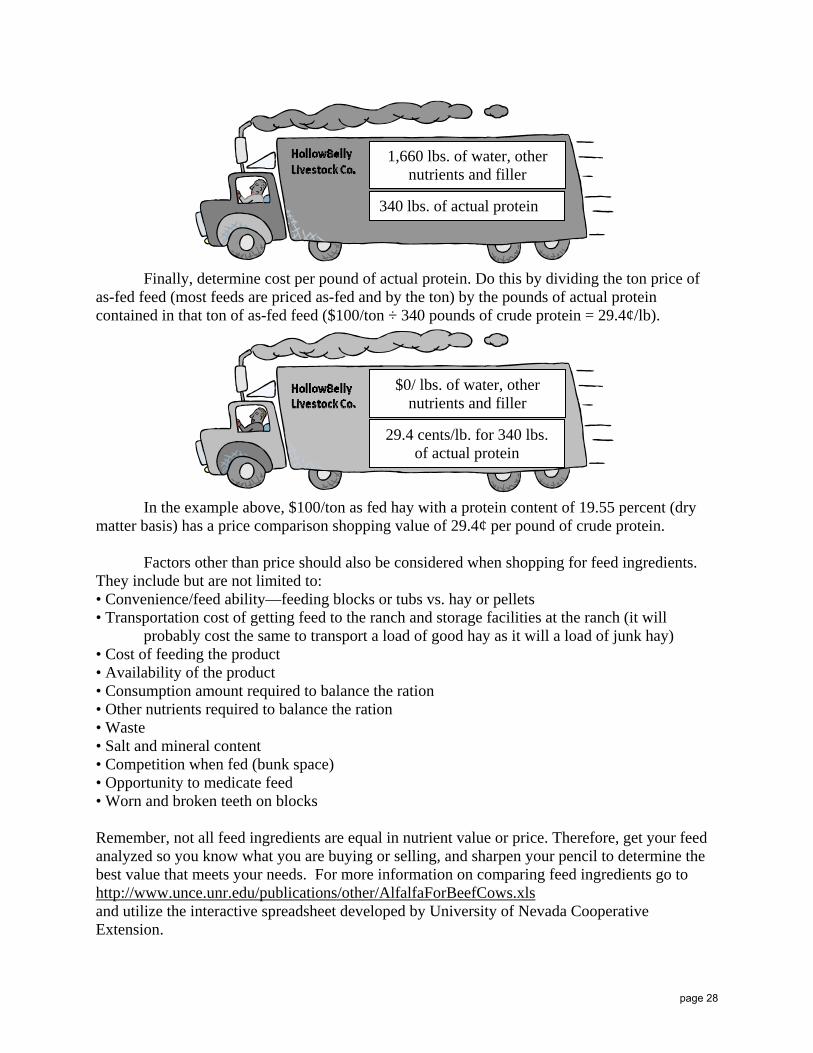
Finally, determine cost per pound of actual protein. Do this by dividing the ton price of
as-fed feed (most feeds are priced as-fed and by the ton) by the pounds of actual protein contained in that ton of as-fed feed ($100/ton ÷ 340 pounds of crude protein = 29.4¢/lb).
$0/ lbs. of water, other nutrients and filler
29.4 cents/lb. for 340 lbs. of actual protein
In the example above, $100/ton as fed hay with a protein content of 19.55 percent (dry
matter basis) has a price comparison shopping value of 29.4¢ per pound of crude protein.
Factors other than price should also be considered when shopping for feed ingredients. They include but are not limited to: • Convenience/feed ability—feeding blocks or tubs vs. hay or pellets • Transportation cost of getting feed to the ranch and storage facilities at the ranch (it will
probably cost the same to transport a load of good hay as it will a load of junk hay) • Cost of feeding the product • Availability of the product • Consumption amount required to balance the ration • Other nutrients required to balance the ration • Waste • Salt and mineral content • Competition when fed (bunk space) • Opportunity to medicate feed • Worn and broken teeth on blocks Remember, not all feed ingredients are equal in nutrient value or price. Therefore, get your feed analyzed so you know what you are buying or selling, and sharpen your pencil to determine the best value that meets your needs. For more information on comparing feed ingredients go to http://www.unce.unr.edu/publications/other/AlfalfaForBeefCows.xls and utilize the interactive spreadsheet developed by University of Nevada Cooperative Extension.
page 28
BIOCLIP® - an Alternative Wool Harvesting System for Nevada and Western States Sheep Ranches
Tumen Wuliji and Aladaer Qi
Animal Biotechnology, University of Nevada, Reno, 89557
Introduction Wool is a dominant product of sheep enterprises in Nevada and other western states. Most of 7 million sheep inventory in the US, are Merino derived wool producing flocks, and are required to be shorn mechanically, which costs $4-5 per ewe and $8-15 per ram constituting a substantial expense to wool growers. Shearing is a labor intensive process, and accident and injury prone occupation that requires personal skill and experience. In those states, shearing is usually short and seasonal work. Therefore, a biological wool harvesting procedure, such as BioClip® Wool Harvesting System (WHS), may offer a more humane, less stressful, less contaminating, and more environmentally friendly wool harvesting solution. There are several biological fleece harvesting reagents and procedures have been tested in wool sheep and cashmere goats. BioClip® is one of the most promising biological WHS developed in Australia, which is an integrated process for the harvesting of wool from Merino and its derived breeds. BioClip® is based on a short-chain protein called Epidermal Growth Factor (EGF) which when injected into sheep causes a temporary break in the wool fiber synthesis and causes the fleece to shed. The dose and formulation of BioClip® injection was designed to retain the minimum effective level of EGF in sheep for 16 hours. However, the EGF will be metabolized and totally cleared from sheep body system within 30 hours. The BioClip® WHS comprises the wool shedding protein, fleece retention net, and sheep handling equipment. Experiment and Results The objective of this project is to evaluate BioClip® WHS application to range wool sheep. We assessed BioClip® for fleece harvesting effectiveness, wool re-growth and fleece qualities of Merino or Merino crossbred sheep on Nevada Agriculture Experiment Station, Reno, during spring shearing. The experimental application of biological fleece shedding agent BioClip® on sheep was approved by the UNR Institutional Animal Care and Use Committee (IACUC #000355). Twenty-two 10 month old ewes (Merino=11, Merino x Rambouillet crossbred=11) at an average body weight of 39 kg were randomly selected for BioClip® shearing. Animals were transferred from pasture and fed ad lib on alfalfa hay for 7 days prior to the procedure. Ewes were weighed and stratified by body weight and breed/strain, and divided into a control (mechanical shearing, n=10) and BioClip® treatment group (n=12). Control animals were injected placebo (2.5 ml physiological saline) and shorn mechanically on 7th day; while treatment animals were each given 2.5 ml BioClip® injectable formula (7.5 mg/ml EGF) subcutaneously on the inguinal bare skin area (inside thigh), and subsequently put fleece retention net on sheep using a specially designed netting cradle (Figures 1a, 1b). Animals were fed alfalfa hay moderately for 4 weeks under a semi-sheltered pen until fleece removal at 28th day. Bioclipped fleeces were removed completely from sheep in fleece retention nets (Figure 1c) 4 weeks after injection of BioClip® reagent. At the removal of fleeces, treated sheep have had an average new coat cover of 8 mm wool fibers (Figure 1c). There is no requirement of any forceful plucking off wool from the extremity of body, such as head and legs. Bioclip® procedures have significantly improved retaining the fleece staple length uniformity, fleece purity, and also shown other distinctive advantageous over mechanically shorn wool, such as no skin pieces, no second cut wool, no medullated fibers and shearing floor contamination (Figure 1d). There is no adverse effect observed on animals, however, BioClip® is not recommended to apply on diseased, pregnant, or lactating animals. The postharvest monitoring on animal weight gain, wool growth rate and fiber length showed no difference
page 29
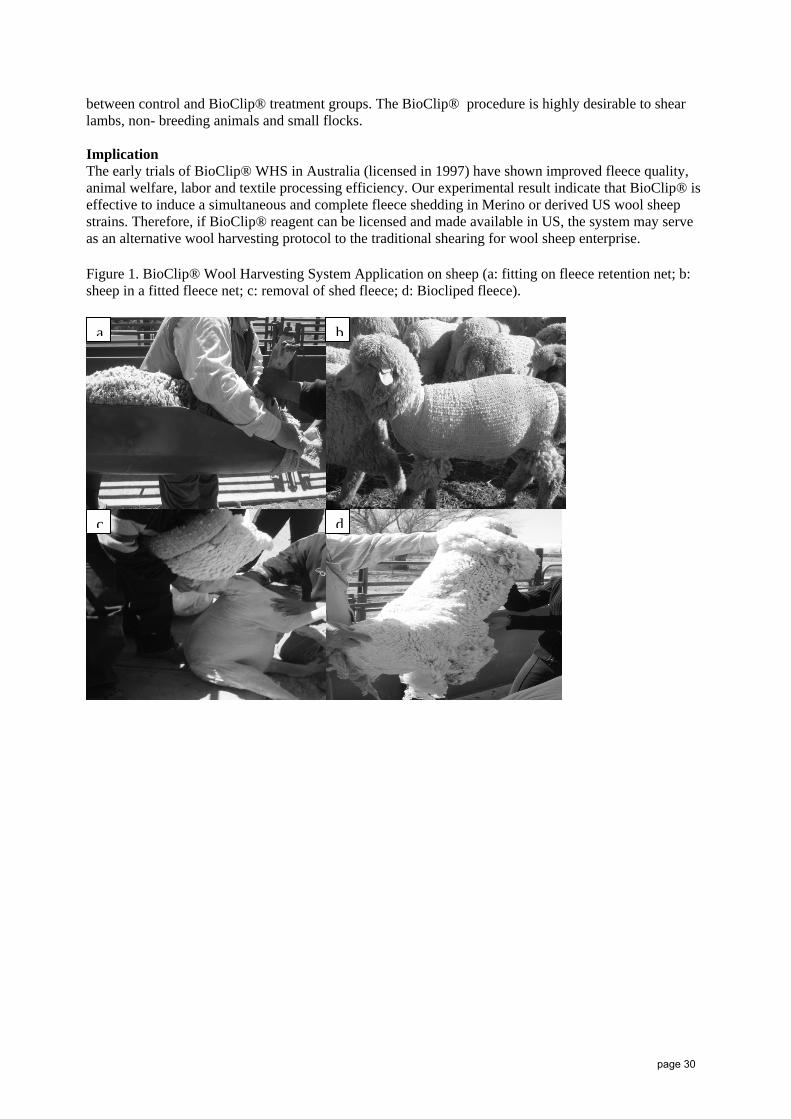
between control and BioClip® treatment groups. The BioClip® procedure is highly desirable to shear lambs, non- breeding animals and small flocks. Implication The early trials of BioClip® WHS in Australia (licensed in 1997) have shown improved fleece quality, animal welfare, labor and textile processing efficiency. Our experimental result indicate that BioClip® is effective to induce a simultaneous and complete fleece shedding in Merino or derived US wool sheep strains. Therefore, if BioClip® reagent can be licensed and made available in US, the system may serve as an alternative wool harvesting protocol to the traditional shearing for wool sheep enterprise.
Figure 1. BioClip® Wool Harvesting System Application on sheep (a: fitting on fleece retention net; b: sheep in a fitted fleece net; c: removal of shed fleece; d: Biocliped fleece).
a b
c d
page 30
Rafter 7 Ranch Merino Breeding Program Improves Wool Quality in Nevada Sheep Flocks
T Wuliji1, H Glimp1, T Filbin2
1University of Nevada, Reno, Nevada 89557; 2Rafter 7 Ranch, Yerington, Nevada 89447; [email protected]
ABSTRACT
A Merino breeding resource flock was established at Rafter 7 Ranch, Yerington, Nevada. Initially, 500 Rambouillet ewes were purchased from two established breeders in 1990. These ewes were bred naturally or by AI to imported Merino rams from Australia and to crossbred rams selected within the flock. The flocks were expanded to 1300 ewes and bred in 30 single-sire mating groups since the 2006 breeding season. Flock management is in two breeding lines, one as a registered Rafter 7 Pure Merino flock (n = 650) and the other (Merino x Rambouillet) as Rafter 7 Line (n = 650). Compared to the original base ewe flock, Merino and Merino crossbred ewes produced higher clean wool yields, longer staple lengths, and higher grease fleece weights. The body weight and greasy fleece weight showed a significant (P<0.05) difference between two flocks whereas no differences were observed for wool fiber diameter, length and comfort factor in most recent analysis. However, fiber diameter variation was significantly different (P<0.05) between the two flocks for age groups and birth years. Approximately 1200 breeding rams and 550 replacement ewes were distributed to commercial range flocks in Nevada and the western states. The dissemination of introduced Merino genetics in the western range sheep flocks is expected to enhance wool quality and wool profits in the region.
INTRODUCTION Over the last two decades, the wool clip has become progressively finer while textile technology has improved for processing superfine wool types. Consequently, the raw wool premium prices set for fine and superfine wool categories have increased significantly over the other type of wools. In 1990, the University of Nevada-Reno and Rafter 7 Ranch established a Merino breeding program at the Rafter 7 Ranch near Yerington to introduce superior fine-wool Merino genetics from Australia to provide genetically improved and adapted breeding rams and ewes for the US western range regions. Animal performance and wool characteristics were analyzed and presented for two selection flocks, namely, Rafter 7 Merino and Rafter 7 Line. MATERIALS AND METHODS Range and Pasture A flock of 1,300 breeding ewes and 35 stud rams are maintained at the Rafter 7 Ranch, a University of Nevada-Reno (UNR) cooperative sheep station owned by the Edwin L. Wiegand Trust. The ranch includes 3,400 acres of private land and grazing permits 85,000 acres of Bureau of Land Management Lands, and 4,500 acres of USDA forest land. The flat pasture elevation is at 3,500 to 4,500 ft, and high desert range elevation is up to 9,000 ft. The annual precipitation within the area of perimeter is less than 8 inches, mostly as winter snowfall with unpredictable frosts and wind patterns. Desert shrubs include black greasewood, basin big sagebrush, black sagebrush, bud-sage, white sage, and ephedra. Grass species include Indian ricegrass, bottlebrush squirreltail, and cheatgrass. The established pastures were primarily tall fescue, over-seeded with Ladino clover. Improved irrigated pastures include a mix of tetraploid perennial ryegrass, improved fescue cultivars, a grazing variety of alfalfa and Ladino clover.
1page 31
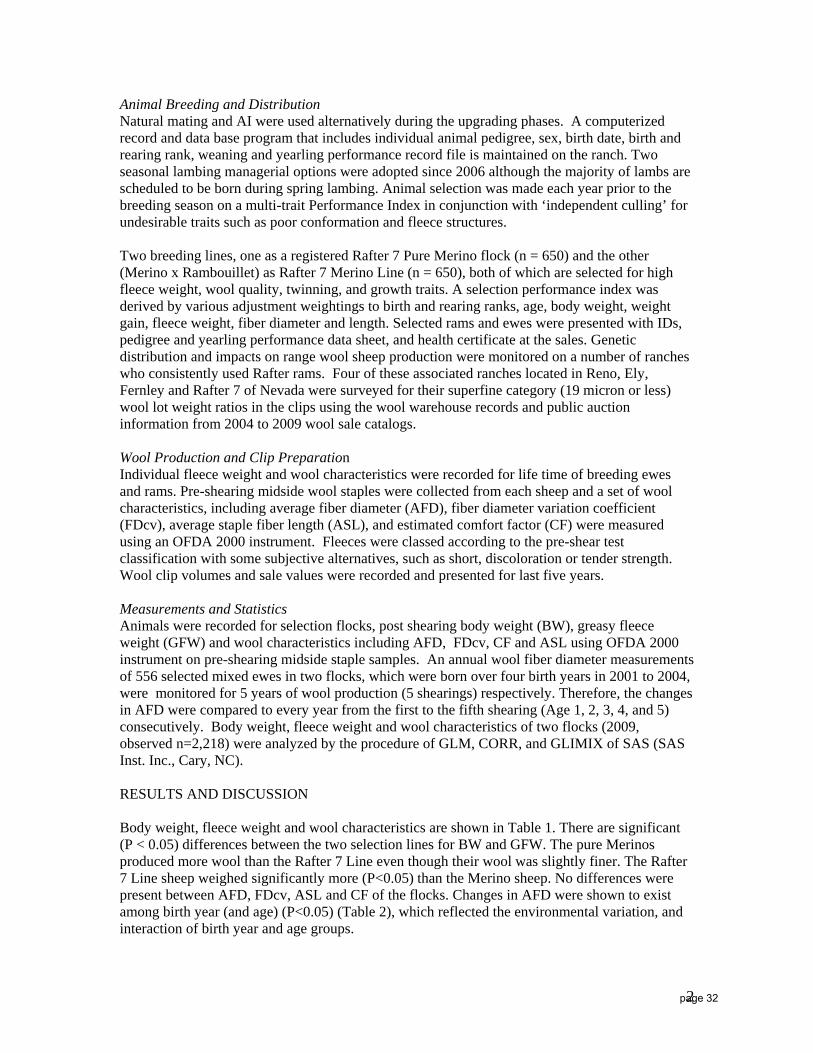
Animal Breeding and Distribution Natural mating and AI were used alternatively during the upgrading phases. A computerized record and data base program that includes individual animal pedigree, sex, birth date, birth and rearing rank, weaning and yearling performance record file is maintained on the ranch. Two seasonal lambing managerial options were adopted since 2006 although the majority of lambs are scheduled to be born during spring lambing. Animal selection was made each year prior to the breeding season on a multi-trait Performance Index in conjunction with ‘independent culling’ for undesirable traits such as poor conformation and fleece structures. Two breeding lines, one as a registered Rafter 7 Pure Merino flock (n = 650) and the other (Merino x Rambouillet) as Rafter 7 Merino Line (n = 650), both of which are selected for high fleece weight, wool quality, twinning, and growth traits. A selection performance index was derived by various adjustment weightings to birth and rearing ranks, age, body weight, weight gain, fleece weight, fiber diameter and length. Selected rams and ewes were presented with IDs, pedigree and yearling performance data sheet, and health certificate at the sales. Genetic distribution and impacts on range wool sheep production were monitored on a number of ranches who consistently used Rafter rams. Four of these associated ranches located in Reno, Ely, Fernley and Rafter 7 of Nevada were surveyed for their superfine category (19 micron or less) wool lot weight ratios in the clips using the wool warehouse records and public auction information from 2004 to 2009 wool sale catalogs. Wool Production and Clip Preparation Individual fleece weight and wool characteristics were recorded for life time of breeding ewes and rams. Pre-shearing midside wool staples were collected from each sheep and a set of wool characteristics, including average fiber diameter (AFD), fiber diameter variation coefficient (FDcv), average staple fiber length (ASL), and estimated comfort factor (CF) were measured using an OFDA 2000 instrument. Fleeces were classed according to the pre-shear test classification with some subjective alternatives, such as short, discoloration or tender strength. Wool clip volumes and sale values were recorded and presented for last five years. Measurements and Statistics Animals were recorded for selection flocks, post shearing body weight (BW), greasy fleece weight (GFW) and wool characteristics including AFD, FDcv, CF and ASL using OFDA 2000 instrument on pre-shearing midside staple samples. An annual wool fiber diameter measurements of 556 selected mixed ewes in two flocks, which were born over four birth years in 2001 to 2004, were monitored for 5 years of wool production (5 shearings) respectively. Therefore, the changes in AFD were compared to every year from the first to the fifth shearing (Age 1, 2, 3, 4, and 5) consecutively. Body weight, fleece weight and wool characteristics of two flocks (2009, observed n=2,218) were analyzed by the procedure of GLM, CORR, and GLIMIX of SAS (SAS Inst. Inc., Cary, NC). RESULTS AND DISCUSSION Body weight, fleece weight and wool characteristics are shown in Table 1. There are significant (P < 0.05) differences between the two selection lines for BW and GFW. The pure Merinos produced more wool than the Rafter 7 Line even though their wool was slightly finer. The Rafter 7 Line sheep weighed significantly more (P<0.05) than the Merino sheep. No differences were present between AFD, FDcv, ASL and CF of the flocks. Changes in AFD were shown to exist among birth year (and age) (P<0.05) (Table 2), which reflected the environmental variation, and interaction of birth year and age groups.
2page 32
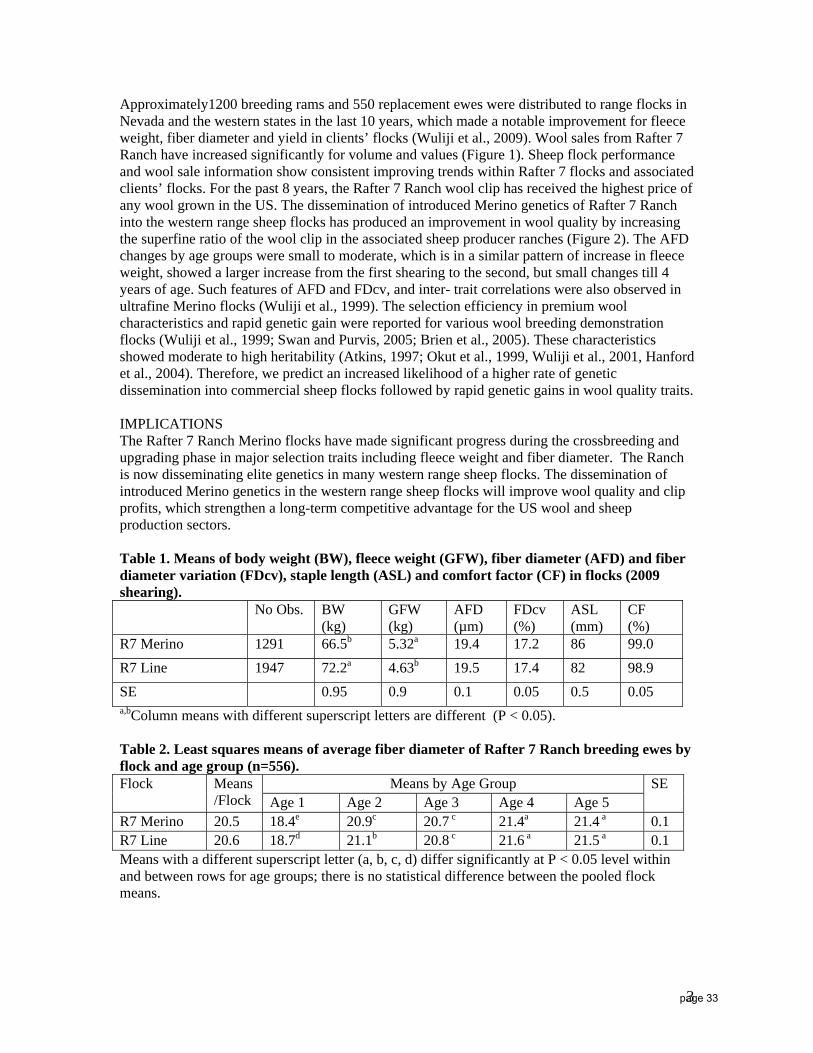
Approximately1200 breeding rams and 550 replacement ewes were distributed to range flocks in Nevada and the western states in the last 10 years, which made a notable improvement for fleece weight, fiber diameter and yield in clients’ flocks (Wuliji et al., 2009). Wool sales from Rafter 7 Ranch have increased significantly for volume and values (Figure 1). Sheep flock performance and wool sale information show consistent improving trends within Rafter 7 flocks and associated clients’ flocks. For the past 8 years, the Rafter 7 Ranch wool clip has received the highest price of any wool grown in the US. The dissemination of introduced Merino genetics of Rafter 7 Ranch into the western range sheep flocks has produced an improvement in wool quality by increasing the superfine ratio of the wool clip in the associated sheep producer ranches (Figure 2). The AFD changes by age groups were small to moderate, which is in a similar pattern of increase in fleece weight, showed a larger increase from the first shearing to the second, but small changes till 4 years of age. Such features of AFD and FDcv, and inter- trait correlations were also observed in ultrafine Merino flocks (Wuliji et al., 1999). The selection efficiency in premium wool characteristics and rapid genetic gain were reported for various wool breeding demonstration flocks (Wuliji et al., 1999; Swan and Purvis, 2005; Brien et al., 2005). These characteristics showed moderate to high heritability (Atkins, 1997; Okut et al., 1999, Wuliji et al., 2001, Hanford et al., 2004). Therefore, we predict an increased likelihood of a higher rate of genetic dissemination into commercial sheep flocks followed by rapid genetic gains in wool quality traits. IMPLICATIONS The Rafter 7 Ranch Merino flocks have made significant progress during the crossbreeding and upgrading phase in major selection traits including fleece weight and fiber diameter. The Ranch is now disseminating elite genetics in many western range sheep flocks. The dissemination of introduced Merino genetics in the western range sheep flocks will improve wool quality and clip profits, which strengthen a long-term competitive advantage for the US wool and sheep production sectors. Table 1. Means of body weight (BW), fleece weight (GFW), fiber diameter (AFD) and fiber diameter variation (FDcv), staple length (ASL) and comfort factor (CF) in flocks (2009 shearing). No Obs. BW
(kg) GFW (kg)
AFD (µm)
FDcv (%)
ASL (mm)
CF (%)
R7 Merino 1291 66.5b 5.32a 19.4 17.2 86 99.0 R7 Line 1947 72.2a 4.63b 19.5 17.4 82 98.9 SE 0.95 0.9 0.1 0.05 0.5 0.05
a,bColumn means with different superscript letters are different (P < 0.05). Table 2. Least squares means of average fiber diameter of Rafter 7 Ranch breeding ewes by flock and age group (n=556).
Means by Age Group Flock Means /Flock Age 1 Age 2 Age 3 Age 4 Age 5
SE
R7 Merino 20.5 18.4e 20.9c 20.7 c 21.4a 21.4 a 0.1 R7 Line 20.6 18.7d 21.1b 20.8 c 21.6 a 21.5 a 0.1 Means with a different superscript letter (a, b, c, d) differ significantly at P < 0.05 level within and between rows for age groups; there is no statistical difference between the pooled flock means.
3page 33
Figure 1. The Rafter 7 Ranch Wool Clip Volume and Value
010000200003000040000500006000070000
2004 2005 2006 2007 2008 2009
Year of Production
Cle
an W
ool W
eigh
t (kg
) an
d V
alue
($)
WeightValue
Figure 2. The Superfine Ratio (%) of Wool Clip
0
10
20
30
40
50
2004 2005 2006 2007 2008 2009
Year of Production
FernleyElyRenoRafter 7
ACKNOWLEDGEMENTS The Rafter 7 Ranch Sheep Breeding Program was sponsored by The Edwin L Wiegand Trust and the College of Agriculture, Biotechnology and Natural Resources. Wool lot test and sale catalogs were provided by Utah Wool Marketing Association. We would like to express our sincere appreciation to the western US region sheep producers and breeders for their enthusiasm, support and collaboration. A special appreciation is noted for owners of ranches at Ely, Fernley, Reno and Rafter 7, Nevada for their collaboration and wool test data collection. REFERENCES
4page 34
Atkins, K.D. 1997. Genetic Improvement of Wool. In “The Genetics of Sheep”. Edited by
L.Piper and A. Ruvinsky. CAB International, UK. pp. 471-504. Brien, F.D., Jaensch, K.S., Grimson, R.J., Kemper, K.E., Smith, D.H., Hebart, M.L. and Ramsay,
A.M.M. Selection demonstration flocks – what have we learnt? Proceedings of the Association for the Advancement of Animal Breeding and Genetics 16:322-325.
Hansford, K.J., Van Vleck, L.D., Snowder, G.D. 2004. Estimates of genetic parameters and
genetic changes for reproduction, weight, and wool characteristics of rambouillet sheep. Small Ruminant Research 57:175-186.
Okut, H., Bromley, C.M., Van Vleck, L.D., and Snowder, G.D. 1999. Genotypic expression at
different ages: II. Wool traits of sheep. J. Anim. Sci. 77: 2366-2371.
Swan, A.A. and Purvis, I.W. 2005. Genetic progress in the T13 Merino breeding program. Proceedings of the Association for the Advancement of Animal Breeding and Genetics 16:165-168.
Wuliji, T., Dodds, K G, Land, J.T.J., Andrews R.N., and Turner, P.R. (1999). Response to selection for ultrafine Merino sheep in New Zealand environment I: Wool production and wool characteristics of an ultrafine fibre diameter selected and control hoggets. Journal of Livestock Production Science 58: 33-44.
Wuliji, T, Dodds, K G; Land, J.T.J., Andrews R.N and Turner, P.R. (2001). Selection for ultrafine
Merino sheep in New Zealand - Heritability, phenotypic and genetic correlations of live weight, fleece weight and wool characteristics in yearlings. Animal Science 72 (2): 1-10.
Wuliji, T., Glimp, H. and Filbin, T. 2009. Introduction of Merino genetics
to improve Western range sheep flock wool quality and wool clip profits. Proceedings of US Sheep Research Programs. P. 47-49. American Sheep Industry Association Convention, San Diego, CA.
5page 35